Abstract
Physiological need states direct decision-making towards re-establishing homeostasis. Using a two-alternative-forced-choice task for mice that models elements of human decisions, we found that varying hunger and thirst states caused need-inappropriate choices, such as food-seeking when thirsty. These results show limits on interoceptive knowledge of hunger and thirst states to guide decision-making. Instead, need states were identified after food and water consumption by outcome evaluation, which depended on medial prefrontal cortex.
Decision-making guided by self-evaluation of physiological need states (interoception) is important for cognitive control of eating and drinking. However, interoception of body states is unreliable1,2, potentially because hunger and thirst have similar motivational characteristics3. Consequently, individuals may inaccurately assess their need state and consume food when dehydrated, leading healthcare professionals to advise drinking water before eating as an appetite-reduction approach4. Yet, there is little evidence for hunger or thirst need-state-uncertainty in animal models5,6. A drawback of prior studies is that these decisions use an unrealistic contrast between water and dehydrated laboratory food. Thirst suppresses food consumption7, and foods with low water content as well as their associated food-cues become aversive in thirst8,9, eliciting avoidance and thereby simplify decision-making. However, humans and other animals primarily consume food with high water content2. The decision-making processes between water and hydrated food are mostly unexamined, despite being more relevant to natural choices.
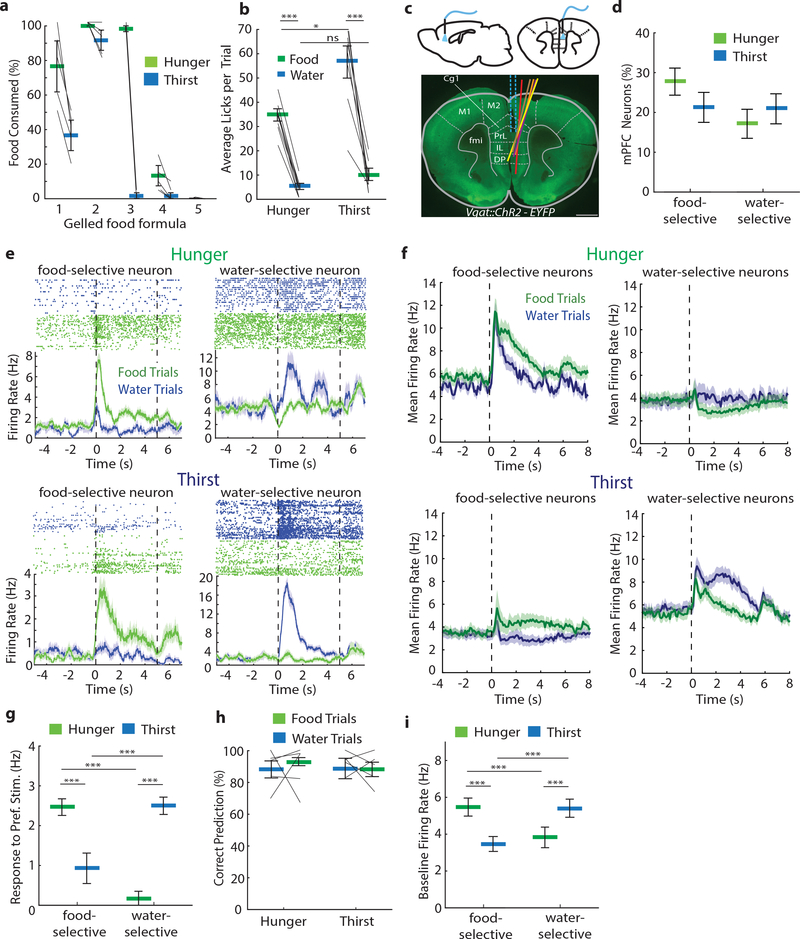
To eliminate aversive signaling of dry food in thirst, we developed a gelled hydrated food formulation with substantial water content (49%) that was minimally consumed in thirst (Fig. 1a). In a fixed ratio-10 lick-triggered choice experiment, mice showed strong preference for water or hydrated food in thirst or hunger states, respectively, and consumed less of the need-state-inappropriate outcome (Fig. 1b). This shows a robust contrast between hydrated food-preference and water-preference during hunger and thirst states without introducing the aversiveness of dry food in thirst states.
Figure 1: Robust discrimination between hydrated food and water.
a, Ad libitum consumption of different gelled food formulations in hunger and thirst (n=5). Best contrast: Formulation-3. b, Lick-triggered (FR-10 licks) food and water delivery preference test showing average licks/trial in hunger (n = 9) and thirst (n = 9) during constant need states. c, Coronal section of mPFC from Vgat::ChR2-EYFP mouse showing placement of Neuropixel probes (colors indicate different animals, n = 5 mice). M2: secondary motor cortex, Cg1: cingulate cortex area 1, PrL: prelimbic cortex, IL: infralimbic cortex. Scale bar, 1 mm. d, Proportion of food-selective and water-selective mPFC neurons in hunger and thirst. Error bars: SEM from Bernoulli distribution. e, Example mPFC neurons that prefer food or water in hunger (upper panels) and thirst (lower panels). Top, neuronal response spike-rasters for water (blue) and food (green) trials. Bottom, trial-averaged spike rate for food and water trials. Dashed lines: consumption period starting at first lick (5 s). Only trials with >1 lick included. f, Population mean firing rates of neurons that prefer food (left) or water (right) in hunger (top) or thirst (bottom). Responses aligned to spout extension (dashed line). g, Mean firing rate increase (relative to pre-consumption baseline) during consumption window for the preferred outcome for food- and water-selective neurons in hunger and thirst. h, Decoding accuracy of mPFC neural responses to food and water in hunger and thirst. i, Baseline firing rate for food- and water-selective neurons in hunger and thirst. Thick lines represent mean. Error bars represent SEM. *P<0.05; **P<0.01; ***P<0.001; ns, P>0.05. Detailed information about the exact test statistics, sidedness, and values are provided in Supplementary Table 1.
The medial prefrontal cortex (mPFC) participates in multiple aspects of goal-directed decision-making, and neuroimaging in humans10,11 indicates its involvement in hunger and thirst. However, mPFC surgical lesions12 and electrical activity perturbations have little influence on eating or drinking13,14. We examined involvement of mPFC in hunger- and thirst-related consumption behaviors of hydrated food and water by electrophysiological recording of extracellular activity with Neuropixels probes of 1852 units (962 in hunger, 890 in thirst) in head-fixed Vgat::ChR2-EYFP transgenic mice, which also included the overlying M2 cortical region (Fig. 1c, Extended Data Fig. 1a). A similar proportion of mPFC neurons responded to hydrated food and water (Fig. 1d and Extended Data Fig. 1b). In both states, neurons were found with strongly selective responses for hydrated food or water (Fig. 1e). Need-appropriate outcome responses were typically greater than responses to need-inappropriate outcomes (Fig. 1f,g, Extended Data Fig. 1c,d). Response magnitudes from mPFC were not dependent on the number of licks (Extended Data Fig. 1e,f). Using a linear decoder, the identity of ingested outcomes (hydrated food or water) could be distinguished with high accuracy by the firing rates of the mPFC neuronal ensemble during consumption (Fig. 1h, Extended Data Fig. 1g)). We also noted that baseline firing rates were significantly higher in neurons selective for the need-appropriate outcome (Fig. 1f,i). Taken together, this shows that mPFC neurons distinguish hydrated food and water with similar effectiveness in hunger and thirst, and that responses were strongest for the need-appropriate outcome.
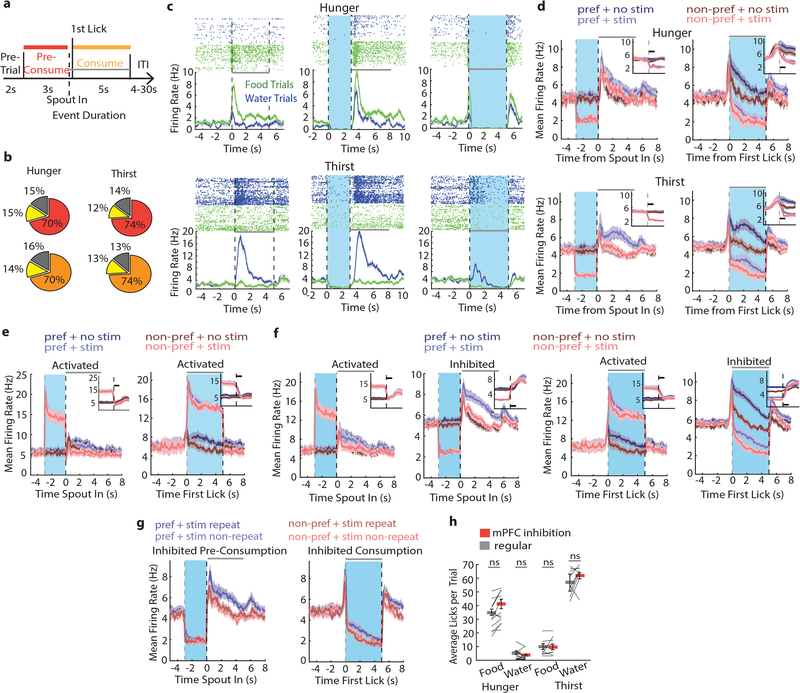
In the same experimental sessions, we unilaterally inactivated mPFC by photostimulating Vgat-expressing inhibitory interneurons with an optical fiber above the prelimbic cortex (PrL) (Fig. 1c). Photostimulation was applied during two distinct time periods (pre-consumption and consumption period, Extended Data Fig. 2a), which resulted in reliable and time-locked inhibition of most neurons in hunger and thirst (Extended Data Fig. 2b–f). mPFC activity returned to the level of control trials after light stimulation ceased (Extended Data Fig. 2d–f), and there was no cumulative effect on firing rate or neural responses after successive stimulation trials (Extended Data Figure 2g). Despite the pronounced consumption-driven effect on neural activity, mPFC inhibition did not affect the lick rate for hydrated food or water in either hunger or thirst (Extended Data Fig. 2h), indicating a lack of mPFC involvement in the performance of these consummatory behaviors.
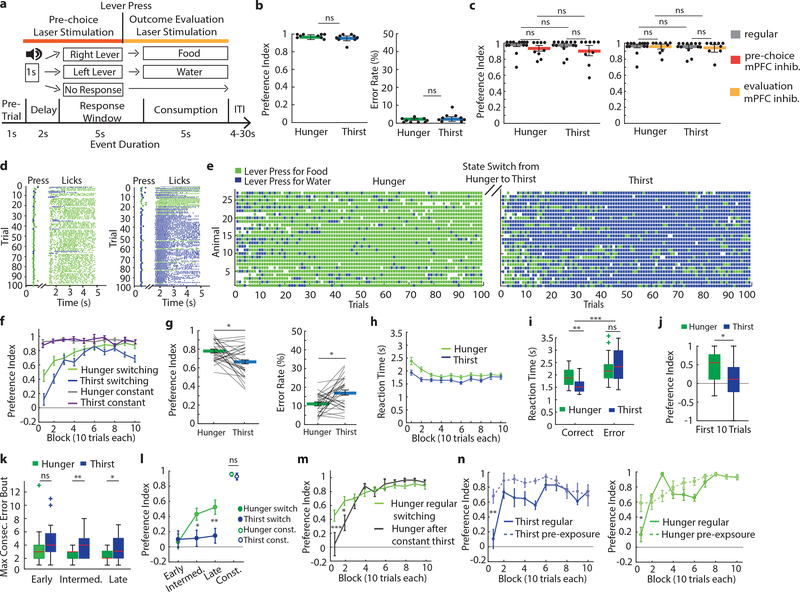
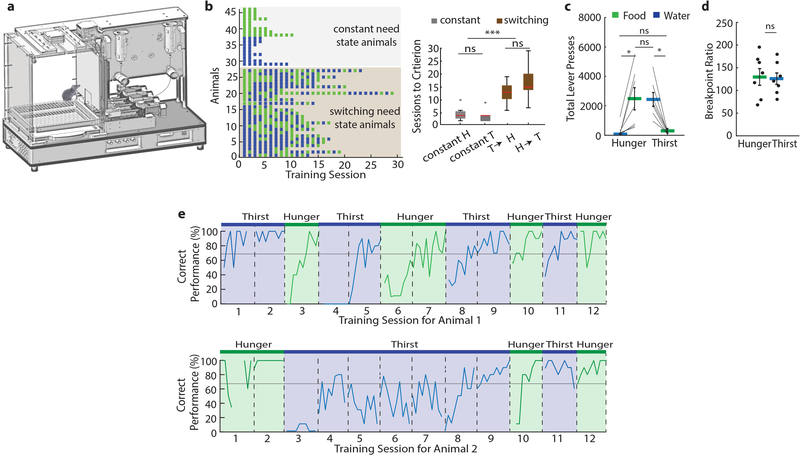
To investigate decision-making, we developed a two alternative forced choice (2-AFC) instrumental task for obtaining hydrated food and water under hunger or thirst (Fig. 2a, Extended Data 3a). When need state was held constant, mice learned at a comparable rate to correctly press the corresponding lever for hydrated food or water in hunger or thirst, respectively (Extended Data Fig. 3b). We calculated a preference index (see Methods) for the food or water outcome that was appropriate to the need state, which was similarly high in hunger and thirst, respectively (Fig. 2b). Breakpoint tests demonstrated that the value of hydrated food during hunger was similar to the value of water during thirst (Extended Data Fig. 3c,d). In addition, need-inappropriate-choices led to consumption with similar frequency in hunger and thirst (incorrect choice thirst: 27% consumption, incorrect choice hunger: 26% consumption), confirming that the incorrect choices are not aversive but have similarly lowered value in the less appropriate need states.
Figure 2: Decision-making about hunger or thirst.
a, Schematic of behavioral task and timing for optogenetic silencing. b, Preference index (left) and error rates (right) of lever press choices in constant need states (n=9 mice in each). c, Preference index during mPFC silencing in constant need state (regular n=13, stimulation during pre-choice and outcome evaluation n=9, for both hunger and thirst). d, Behavioral performance for one animal in hunger (left) and thirst (right), including lick raster. e, Decision-making performance of need state switching animals (n=27) in hunger and thirst. f, Learning curves in switching (n=27) or constant (n=18) need state conditions. g, Preference index (left) and error rate (right) for need state switching animals. h,i, Reaction time in hunger and thirst (h) and for correct or incorrect responses (i) (n=27). j, Preference index during the first 10 trials in hunger and thirst (n=27). Box: Interquartile range (IQR), red horizontal lines: median, whiskers: closest data points>1.5*IQR. k, Maximum consecutive error bouts in hunger (green) and thirst (blue) in first 10 trials for early (n=27), intermediate (n=27) or late sessions (n=22). l, Development of the food bias (first 10 trials) during early (n=27), intermediate (n=27) or late sessions (n=22) in comparison with the preference index for constant animals (n=18). m, Initial food bias (first 10 trials) during regular switching (green, n=27) and after mice were held in constant thirst and switched back to hunger (black, n=7) (see Methods). n, Preference index of regular sessions and sessions with pre-exposure to water and food in thirst (left, n=7) or hunger (right, n=6). Thick lines represent mean. Error bars represent SEM. ***P<0.001; ns, P>0.05. Detailed information about the exact test statistics, sidedness, and values are provided in Supplementary Table 1.
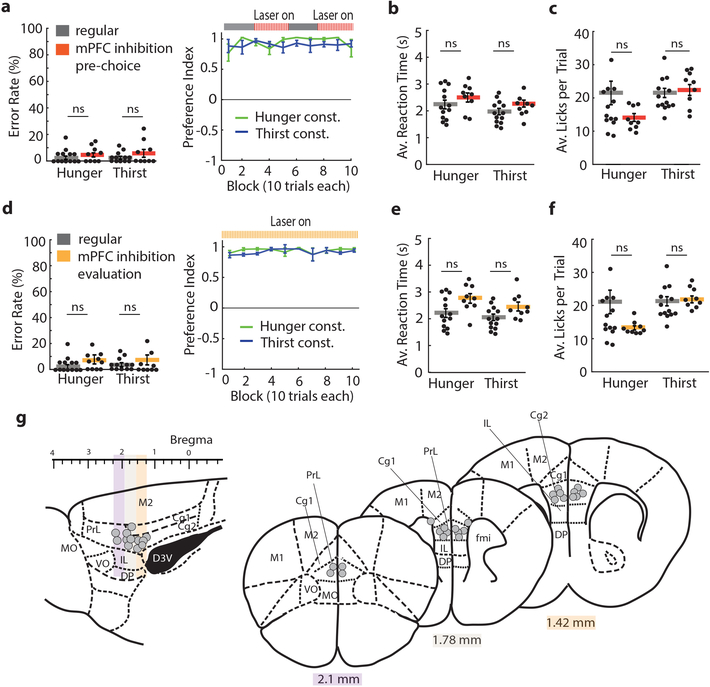
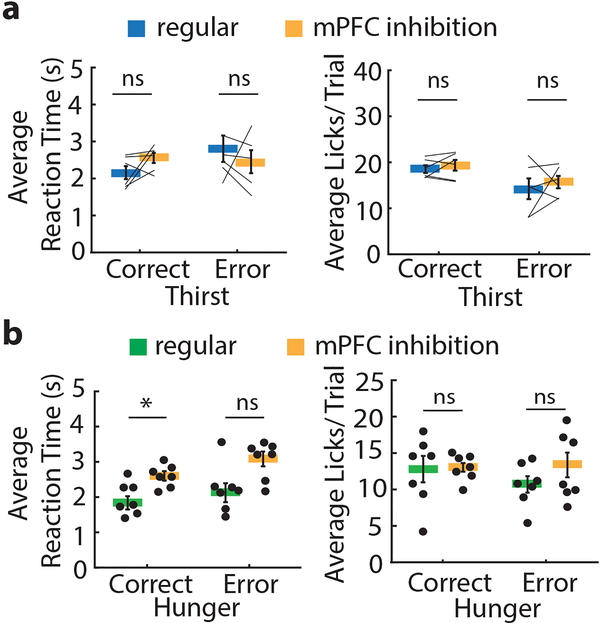
To dissociate processes that occur at different phases of the decision, we optogenetically inhibited mPFC during the pre-choice or the outcome evaluation periods (Fig. 2a). Silencing mPFC in either trial period did not affect preference index, error rates, average reaction times, or average licks per trial in either hunger or thirst (Fig. 2c, Extended Data Fig. 4). Thus, mPFC is not required for making correct instrumental or consummatory choices for mice held in a constant need state.
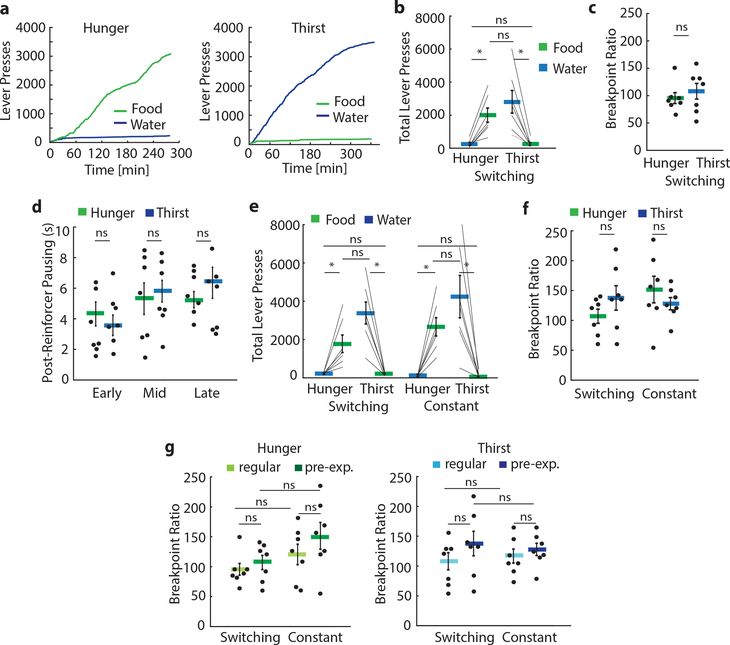
We next investigated the behavior of mice in the 2-AFC task as they were alternating between hunger and thirst states every 3–4 days, such that mice must evaluate their current need state and update the expected outcome value of their choices. Mice required significantly more sessions to learn to switch their instrumental response to be appropriate to their need state compared to non-switching (i.e. constant) need state conditions (Extended Data Fig. 3b,e,h). Breakpoints for mice switching need states were not significantly different in hunger and thirst for hydrated food and water, respectively (Extended Data Fig. 5a–c).
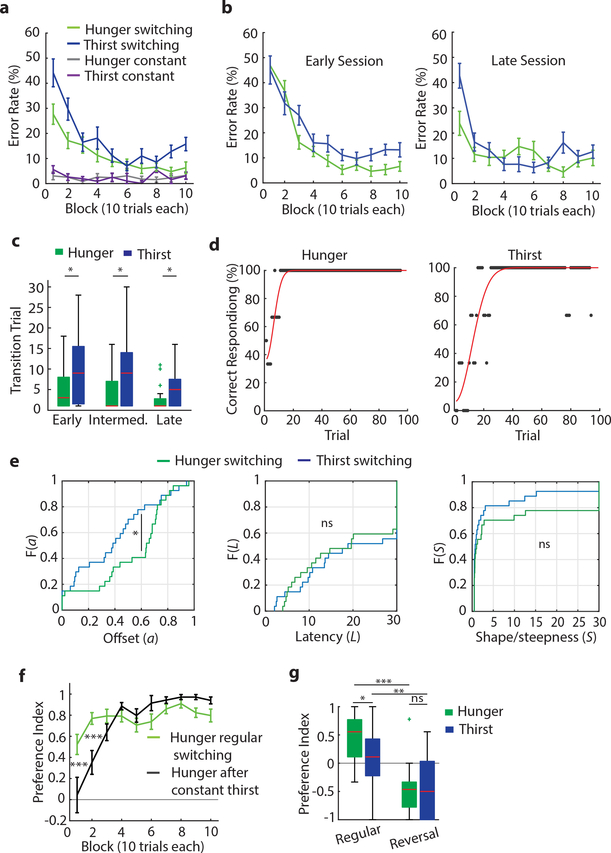
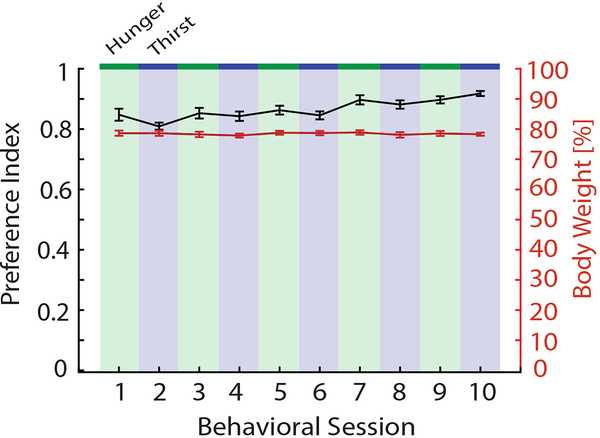
Mice alternating between need states exhibited within-session learning in both hunger and thirst for the correct lever response, such that they had to sample each outcome to correctly guide decision-making (Fig. 2d–f, Extended Data Fig. 6a), even after extensive training (Extended Data Fig. 6b). In contrast, mice in constant hunger or thirst showed high performance throughout each session (Fig. 2f, Extended Data Fig. 6a). For mice switching their need states, cumulative performance was significantly better in hunger compared to thirst (Fig. 2g). This was not due to body weight fluctuations (Extended Data Fig. 7) or greater motivation in hunger (Extended Data Fig. 5d) because lever-press reaction times for water were faster in thirst (Fig. 2h) consistent with prior reports6,9, and erroneous responses were significantly slower than correct responses (Fig. 2i). Instead, mice developed a significant food-seeking bias (Fig. 2j) that facilitated correct responding in hunger. This bias was associated with persistence towards food-lever presses at the beginning of thirst sessions (Fig. 2f), which delayed evaluation of water rewards (Extended Data Fig. 6c). In both hunger and thirst, the initial food bias was accompanied by within-session learning of the reward outcomes that were appropriate for the animal’s need state (Extended Data Fig. 6d,e). The food-seeking choice-bias developed after increasing experience with the task across multiple sessions (Fig. 2l, Extended Data Fig. 6b). Because consummatory preference did not show food-seeking bias (Fig. 1a,b) nor did early instrumental state-switching sessions (Fig. 2k,l and Extended Data Fig 6b,c) or mice in constant thirst (Fig. 2f), we suspected that this was due to long-term reinforcement by food, possibly reflecting the post-ingestive reinforcing properties of nutrients regardless of need state15. Consistent with this, we could eliminate the food-seeking bias, even in highly experienced mice, by maintaining animals in thirst for several sessions followed by a switch to hunger (Fig. 2m, Extended Data Fig. 6f). This indicates that the bias towards food-seeking emerges as a dominant choice over multiple sessions in mice frequently switching between hunger and thirst but that this can be controlled by altering behavioral experience to emphasize non-food-seeking actions.
Mice also exhibited prominent within-session learning to achieve correct responding for their need in both hunger and thirst, even after extensive experience with the task (Fig. 2f, Extended Data Fig. 6b). Fitting the lever press choices to a Weibull distribution (Extended Data Fig. 6d) showed a significant difference in the offset (Extended Data Fig. 6e), reflective of the initial food-seeking bias. The learning rate parameters for correct responses across sessions were not significantly different in hunger or thirst (Extended Data Fig. 6e), indicating an analogous process guiding the improvement of decision-making in hunger and thirst throughout the session. Reversal of lever contingencies led to responding in the first block of trials on the lever previously associated with the need state before reversal (Extended Data Fig. 6g), demonstrating that mice were not using a strategy of simply re-learning the appropriate lever-outcome association in each state-switching session. Therefore, we investigated the possibility that the learning curve at the start of state-switching sessions reflects uncertainty about the need-dependent value of each outcome. Consistent with this, we found that when mice were permitted limited consumption of water and hydrated food in their home cage immediately before transfer to the behavioral apparatus, they significantly improved performance during the initial decision-making trial blocks (Fig. 2n) but overall motivation was unaffected (Extended Data Fig. 5e–g). Thus, once mice determine outcome values by consuming water and food, even independently of the instrumental task, they subsequently direct their choice to the lever associated with the outcome that re-establishes homeostasis. These experiments indicate that in variable need state conditions, mice initially behave as if they cannot use their need state to guide instrumental choice. Seeking hydrated food becomes a dominant behavioral strategy, but both water-seeking and food-seeking utilize an outcome evaluation process that requires within-session learning.
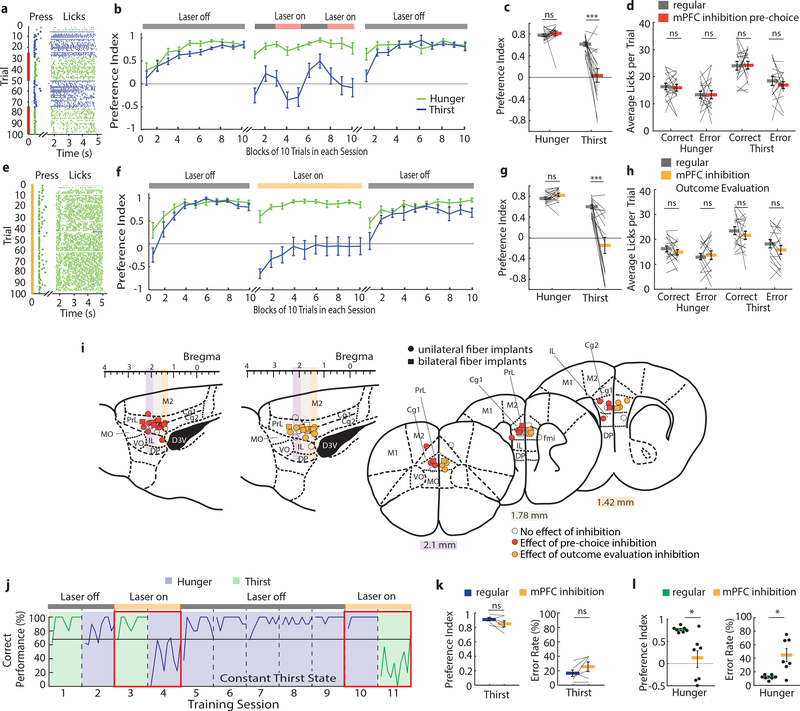
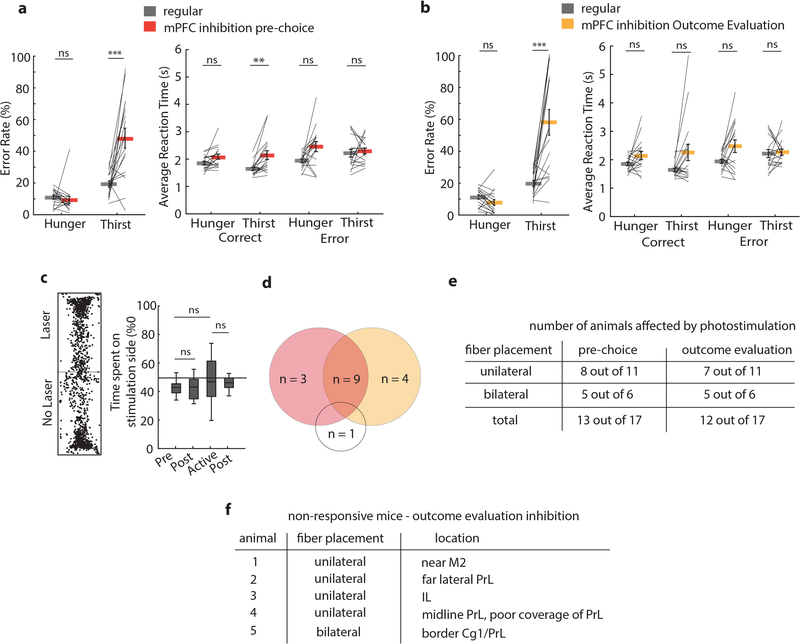
Next, we investigated the role of the mPFC in decision-making under conditions of variable need. Silencing mPFC in the pre-choice period of the trial greatly reduced performance in thirst (Fig. 3a–c). Strikingly, most mice incorrectly pressed for food and consumed food rewards in thirst (Fig. 3c, Extended Data Fig. 8a, Supplementary Movie 1), which typically, but not always, returned to correct responding in trial blocks lacking mPFC inactivation. Inactivating the same cortical area in the same mice during hunger did not affect decision-making (Fig. 3b,c, Supplementary Fig. 1a). Some reaction times were slower during pre-choice stimulation trials (Extended Data Fig. 8a), but lick rates following the choice were unaffected (Fig. 3d). Thus, mPFC guides correct responding for thirsty but not hungry mice under conditions of variable need states.
Figure 3. mPFC is required for evaluating action-outcome relationships to inform decision-making when need states are uncertain.
a, Example session performance in thirst with pre-choice mPFC inhibition. b, Mean performance in hunger and thirst for all animals during three separate sessions: before, during and after pre-choice mPFC inhibition animals (n = 17). c, Preference index comparison between pre-choice mPFC inhibition (red) and regular responses (grey) in hunger and thirst in the same trials (trial 25–50 and 75–100). d, Effect of mPFC inhibition during pre-choice period on licks per trial. e, Example session in thirst with mPFC silencing during outcome evaluation period. f, Mean performance in hunger and thirst during three separate sessions: before, during and after outcome evaluation mPFC inhibition (n = 17, Supplementary Fig. 1 for individual subject data). g, Preference index comparison between outcome evaluation mPFC inhibition (orange) and regular responses (grey) in hunger and thirst during the whole session (all 100 trials). h, Effect of mPFC inhibition during outcome evaluation period on licks per trial. i, Anatomical location of optical fiber placement. Colored sites are locations that elicited a deviation from the mean of regular performance by at least 2 standard deviations with inhibition during the pre-choice period (red) and outcome evaluation period (orange). Cg1: cingulate cortex area 1, Cg2: cingulate cortex area 2, DP: dorsal peduncular cortex, D3V: dorsal 3rd ventricle, fmi: forceps minor of the corpus callosum, IL: infralimbic cortex, M1: primary motor cortex, M2: secondary motor cortex, MO: medial orbital cortex, PrL: prelimbic cortex, VO: ventral orbital cortex. j, Example lever press performance for one animal during need state switching with mPFC silencing during outcome evaluation in hunger and thirst before and after constant thirst state. k, Preference index in thirst during regular need state switching (blue) and with mPFC silencing during outcome evaluation after holding thirst state constant for several sessions (orange) (n = 6). l, Preference index in hunger after being in constant thirst for several sessions without (green) and with mPFC silencing during outcome evaluation (orange) (n = 7). Thick lines represent mean. Error bars represent SEM. *P<0.05; **P<0.01; ***P<0.001; ns, P>0.05. Detailed information about the exact test statistics, sidedness, and values are provided in Supplementary Table 1.
Because mice that are repeatedly switching between hunger and thirst show an initial period of learning at the beginning of each session, we also investigated the effect of inactivating mPFC only during the outcome evaluation period. Neither unilateral nor bilateral silencing of mPFC after the decision altered choices in hungry mice, but thirsty mice were profoundly affected, with many mice completely reversing their choice to food-seeking throughout the entire session (Fig. 3e–g, Extended Data Fig. 8b, Supplementary Fig. 1b). This was not due to the valence of mPFC photoinactivation, which did not influence place preference (Extended Data Fig. 8c). Also, licking and consumption behavior during mPFC inhibition was unaffected (Fig. 3h). Subsequent sessions in thirst without mPFC modulation showed normal water-seeking performance (Fig. 3b,f and Supplementary Fig. 1a,b). Sensitivity to mPFC silencing in the reward phase with thirsty mice was localized to optical fiber placement within the PrL and adjacent rostral anterior cingulate cortex (rACC), with most non-responders on the periphery or outside of this region or subjected to optogenetic silencing using only one optical fiber (Fig. 3i, Extended Data Fig. 8d–f). Thus, mPFC is critical for the evaluation of behavioral choices in mice under conditions of homeostatic variability.
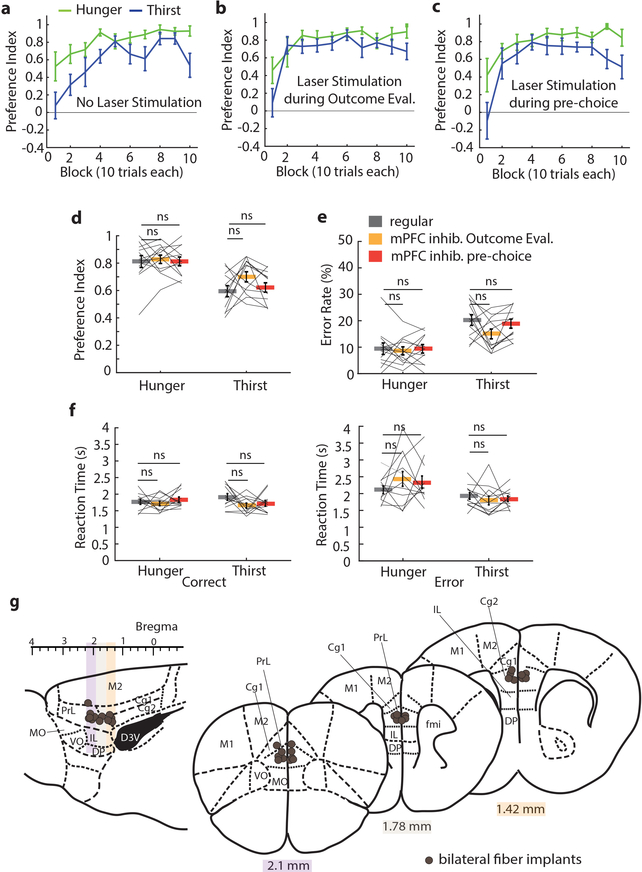
Control animals lacking channelrhodopsin did not show significant effects of the laser stimulation during the outcome evaluation or pre-choice period on the preference index or reaction times (Extended Data Fig. 9). Most mice that were affected by mPFC silencing showed sensitivity during both the choice and the reward phase of the behavior (Extended Data Fig. 8), however this was not the case for all animals. This indicates that different but overlapping neuronal networks are engaged by different phases of the decision-making process in mPFC, where inhibition during pre-choice was effective at a larger range of optical fiber targeting positions (Fig 3i, Extended Data Fig. 8d–f).
The reliance on mPFC during thirst but not hunger suggested either a specialized role of this brain region in thirst or it could reflect selective involvement of mPFC in the outcome evaluation decision-making strategy that was especially prominent during thirst. The former possibility seemed less likely because we observed in our mPFC electrophysiological recordings that selective responses to both hydrated food and water were well-represented during hunger and thirst (Fig. 1e–h). Instead, we suspected that the dominant behavioral strategy, usually food-seeking, was independent of mPFC and was implemented as the default response when mPFC was inhibited. We tested this hypothesis by transitioning mice trained under need state variability to a constant thirst state for several sessions (Fig. 3j). Mice that were previously sensitive to mPFC silencing and switched their behavior to food-seeking in thirst, now showed no reduction of water-seeking behavior during mPFC inactivation (Fig. 3k, Extended Data Fig. 10). Under these conditions, mice adopted a new dominant behavioral response of water-seeking, which was now independent of mPFC function. We predicted that if mPFC function is related to need state-dependent outcome evaluation under variable homeostatic conditions, then food-seeking in hunger would now be mPFC dependent because it was no longer the dominant behavioral response. Indeed, after consecutive thirst sessions, when mice were switched to hunger, their decision-making became sensitive to mPFC inactivation and exhibited pronounced water-seeking in hunger (Fig. 3l).
Here, we found that frequent switching between hunger and thirst leads to low initial decision-making performance, even with extensive task experience. Although prior reports showed that rodents can respond correctly after a single need state switch from hunger to thirst16,17, our results indicate limitations on consumption-independent knowledge of need state-dependent outcome values when homeostatic states change frequently. An inability to predict relative outcome values for food and water when need states are variable may be analogous to reduced cognitive awareness of the identity of hunger and thirst states. Nevertheless, mice quickly achieved high performance within a session if they were pre-exposed to reward consumption, demonstrating that frequent need state switching leads to reliance on outcome evaluation to guide decision-making. Our experiments provide experimental support in mice for the notion of need state uncertainty in hunger and thirst under conditions of variable homeostatic state and hydrated food.
In mice alternating between hunger and thirst states, we found that a food source with ethologically relevant water content led to a choice-bias that was directed towards food-seeking at the start of a session. Food-seeking bias was not observed in mice during constant thirst and was progressively learned in need-state-switching mice, indicating that this was not primarily due to the partial energy deficit associated with dehydration, but it is consistent with the inherent reinforcing properties of caloric food15. In conjunction with the absence of aversiveness of hydrated food in thirst, this promoted progressive development of a default, habitual strategy of choosing hydrated food at the beginning of the instrumental sessions. A similar process may also contribute to food-seeking biases in humans that can lead to obesity. The clinical suggestion to drink water before meals4 allows need-state-dependent outcome evaluation and also effectively promotes a water-seeking habit. Based on our results modeling this treatment in mice (Fig. 2m), regular water drinking may reduce food-biased choices in thirst, which could potentially aid weight-loss management.
We also identified a role for the mPFC in decision-making about ethologically realistic hydrated food and water outcomes under variable hunger and thirst states. In the mPFC, water and hydrated food consumption were differentially represented, but the mPFC was not necessary for state-dependent consumption preference. In addition, mPFC silencing did not affect dominant response strategies associated with constant physiological need or a habitually favored outcome. This is consistent with a greater role for the prelimbic subregion of mPFC in goal-directed behavior relative to dominant or habitual behavioral responses18–20. Instead, mPFC was required for evaluating action-outcome relationships18 to inform decision-making when need states were uncertain. Our results are consistent with a role for mPFC outcome-encoding neurons in instrumental incentive learning18 (Fig. 3f), as well as its involvement in guiding action selection19 (Fig. 3b). In light of neuroimaging observations that mPFC is associated with human hunger and thirst10,11, our findings provide a causal link for mPFC in evaluating physiological state. Thus, behavioral strategies and potentially other treatments that enhance mPFC outcome evaluation for food and water may be beneficial for addressing obesity and other eating disorders.
Methods
Mice.
Adult male and female (over two month old) Vgat::ChR2-EYFP transgenic mice21,22 (Jackson laboratory, backcrossed 9 generations onto C57BL/6 background, n = 37, 50% female, 50% male) were included in all behavioral and photostimulation experiments. Male and female (over two months old) C57BL/6J mice (Jackson Laboratory, n = 26, 50% female, 50% male) were used for behavioral experiments. Two animals were excluded from the study and not used for any behavioral experiments or included in the reported sample sizes, because these animals were unable to learn the switching need state lever pressing task with the pre-set criterion of 68% correct responses in both need-states in at least 3 successive sessions. Animals were randomly assigned to experimental groups. For within-subject comparisons during electrophysiological recordings and photostimulation for VGAT neurons, the order of experimental conditions was randomized. Investigators were not blinded to allocation during experiments and data analysis because altering need states and performing photostimulation required experimenter involvement and consideration. Mice were individually housed in a temperature- and humidity-controlled room and maintained on a 12-h light/dark cycle. No statistical methods were used to predetermine sample sizes. The sample sizes were similar to those reported in previous publications18,23. All animals were handled according to US National Institutes of Health guidelines for animal research and experimental protocols were approved by the Institutional Animal Care and Use Committee at Janelia Research Campus.
Gelled hydrated food.
Gel food mixtures were made of water, thickener, and standard dry powdered food mix from TestDiet (PMI Micro-stabilized rodent liquid diet LD101, www.testdiet.com), a nutritionally balanced, easy to prepare powder that contains 17.7% protein, 16.9% fat, and 65.4% carbohydrates, and minerals. The five gelled hydrated food mixes we tested in the free consumption test in hungry and thirsty mice (Fig. 1a) contained water (49%), food (50%), and up to 1% of the following thickening agents: Formula 1, gelatin; Formula 2, Thicken Up (a baby food thickener with xanthan gum from Nestle Health Science); Formula 3, Carrageenan; Formula 4, Xanthan Gum; Formula 5, Cornstarch. We used Formula 3, because mice showed low consumption of this mixture in thirst but consumed all of it when hungry. To create this gelled food mix, dry powdered food (10 g) was mixed with distilled water (10 ml) and the food thickening agent, Kappa Carrageenan (0.15 g). All three ingredients were thoroughly mixed and centrifuged for 8 minutes at 1200 rpm at 4°C to eliminate air content, reduce compressibility and ensure precise and consistent partitioning of the gel food using the solenoid valve and pneumatic system.
Food and Water restriction.
Mice were kept on food or water restriction with daily health monitoring and body weight assessments. Restriction was eased if mice fell below 70% of their initial ad libitum fed body weight or failed qualitative health assessment. For water restriction, mice received approximately 1 mL water daily, with ad libitum access to rodent chow (PicoLab Rodent Diet 20 5053, www.labdiet.com, water content 10%) in the home cage. For food restriction, mice received 2–3 g of food pellets in their home cage, with ad libitum access to water. In constant need state conditions, mice were held in either hunger or thirst, unless otherwise noted, and experiments took place every 3–4 days. For need state switching conditions, animals were switched from food restriction to water restriction immediately following the experiment and, after behavioral testing in the thirst state, mice were subsequently switched from water restriction to food restriction. For these cycles of hunger/thirst switching, we allowed 3–4 days between switching need state experimental sessions to ensure that animals were sufficiently restricted in each state.
Behavioral apparatus.
To accurately deliver the gelled food rewards via lick spouts despite its compressible properties, we built a novel behavioral apparatus that uses a pneumatic actuator for reward delivery, capacitive lick detection on both reward delivery spouts, and field programmable gate array (FPGA) circuitry for monitoring and control (Extended Data Fig. 3a). We engineered a system with four motorized slides that could be extended into or retracted out of the behavioral cage. Two of the slides held levers with limit switches that could be pressed by the animal, while the other two slides held tubes that could dispense food or water reward. Lick detection on the tubes was performed by capacitive sensing. Food and water were dispensed using solenoid pinch valves (NResearch Corporation). Water was gravity fed from a syringe reservoir while the gelled food mixture was dispensed from a syringe whose plunger was driven by air pressure. Food and water dispense volume requirements were 6 ± 1.5 μl. Slide motor control, sensor data collection, pulse sequence for laser, video display and dispense control were all controlled with a custom FPGA control board. The FPGA control board also logged imaging and sensor data. Behavioral video images from two separate cameras were logged at a frame rate of 196 Hz. Each image frame was then processed on the FPGA and the frames embedded with the collected sensor data were stitched together. The final image is then sent to a connected control PC over a 5Gbps Cameralink port. The control PC runs software written in C/C++ with a user configurable state machine for cage control. The experiment parameters are set using the control software GUI on the PC and sent via UART to the FPGA. The PC then extracts the sensor data from the images and stores the data separately on the hard disk.
Free-consumption choice task with lick-triggered food or water delivery.
For the free consumption choice task, as well as for all behavioral experiments reported here, we chose a reward size of 6 μl water and 6 μl gelled food so animals would reliably perform over 100 trials per session and not be satiated within that time frame. To test the preference for choosing water or food, we used a lick-triggered consumption task, where mice had access to the water and food spouts for 15 s each trial and every 10th lick at either spout resulted in the delivery of a food or water reward. After 15 s both spouts were retracted, followed by an inter-trial interval (4–30 s). Each session consisted of 50 trials. The average amount of reward delivered in the 15-s time period was similar in hunger and thirst, suggesting that the intensity of the need state and the value of the rewards were comparable.
Behavioral task.
Mice were handled and acclimatized to the behavioral cage for at least one day and were then either trained in the 2-alternative forced choice task (2-AFC) or tested in the free consumption choice task before being trained in the 2-AFC task. In each trial of the 2-AFC task, the presentation of a tone (1 s, 12 kHz) indicated trial onset. After a delay (1 s), both levers were extended and available (5 s response window). Pressing the one lever delivered the food reward (6 μl), whereas pressing the other lever delivered water (6 μl). The lever-reward contingencies were randomized across animals, meaning that for half of the animals the right lever was associated with food and the left with water, whereas for the other half the right lever was associated with water and the left with food. There was no difference in performance or reaction time between the two different lever-reward contingencies. After a lever press was detected, both levers retracted, and the reward spout associated with the pressed lever was extended. Animals had access to the reward spout (5 s consumption window) before it was retracted followed by a variable inter-trial interval (4 – 30 s). If no press occurred during the response window, levers were retracted, the inter-trial interval began, and the behavioral response was counted as a miss. Animals completed 100 trials in each session. A session was considered successful, if the animal pressed at least 68% for water in thirst or food in hunger. Data collection was not performed blind to the conditions of the experiment, but analysis procedures were automated.
Behavioral training.
If mice pressed more than 68 presses for the need-appropriate outcome, the session was considered successful. Switching mice were switched to the other need state, whereas constant need state mice stayed in one need state and both were trained or tested every 3–4 days (to match for amount of time between training sessions between switching and constant animals). All constant need state mice had at least 4 successful sessions before mPFC optogenetic silencing experiments. If mice successfully pressed for the appropriate outcome, the need state was switched again. This continued until mice responded with more than 68 presses for the correct outcome in 3 consecutive switching sessions. If the performance did not reach that criterion, an additional session in the same need state took place until that criterion was reached and the animal was again tested with switching states until 3 consecutive sessions reached that threshold. The range of training time for animals alternating their need states was 3–9 weeks. After completion of the initial training, all experimental sessions took place, typically a duration of 16–20 additional weeks. Early training phase includes behavioral performance immediately after animals reached successful criterion for learning to switch, intermediate training was 6–10 sessions later, while late training was 8–10 additional sessions after intermediate training. If the animals’ performance was affected by optogenetic mPFC silencing or any other manipulation and thus did not reach 68% correct, a regular session in that state was performed the next day before the need switch to ensure retention of the task.
Comparison between switching animals and animals switched after constant thirst.
For the comparison in Fig. 2m, the average number of training sessions for need state switching animals (average: 29 days, range: 21–38) was not significantly different from switching animals that were held constant in thirst for additional sessions before switching back to hunger (average: 34 days, range: 27–41) (Wilcoxon rank sum test, P=0.06). We also compared a subgroup of the switching animals that was more closely matched for training time (average: 42 days, range: 36–47) to ensure that the performance difference during the first two blocks of the session was not due to differences in the amount of training experience (Extended Data Fig. 6f).
Body weight and performance data.
To evaluate whether potential changes in body weight associated with switching animals between need states influenced choice behavior, we tracked the body weight of animals (n = 17) as the percentage of the starting ad libitum weight over time as animals performed the behavioral task while being repeatedly switched between food and water restriction. The preference index for these animals increased with experience, but subject body weights on behavioral training days were consistent and did not fluctuate substantially (Extended Data Fig. 7).
Pre-Exposure task.
For the pre-exposure task, we provided mice with a small amount of both water and food into the home cage immediately before the onset of the lever pressing session. The amount provided equaled what animals could earn during the first 10 trials pressing the food or water lever: 60 ul water and food. All animals consumed most food and water provided in the home cage, irrespective of their need state (hunger vs. thirst).
Reversal task.
For mice that were switching between need states, both levers gave the opposite outcome that was originally associated with that lever (i.e., the former food lever now delivered the water spout and the former water lever delivered the food spout).
Breakpoint experiments.
Male and female C57BL/6J mice (constant need state, Jackson Laboratory, n = 7) and Vgat::ChR2-EYFP transgenic mice (switching need states, Jackson laboratory, n = 7) were used for the progressive ratio lever-pressing task All animals performed the breakpoint experiment first without and then with pre-exposure to food and water in their home cage. Mice first learned the regular behavioral task as described above and all reached sufficient performance criteria. Then, they were trained to lever-press on a (fixed ratio) FR3 reinforcement schedule (5 min window). All mice reached the criterion of at least 225 presses for the correct reward within 100 trials and were subsequently trained on FR7 schedule (one session for constant, one of each session type for switching in randomized order). Then, animals were tested on a progressive ratio schedule where the required number of presses for each subsequent reward increases by 3 (PR3, 5 min window). The breakpoint was defined as the last press ratio completed before 5 min passed without an additional lever press. Animals in the switching need state group performed the PR3 experiment in each need state.
Lick task for electrophysiological recordings.
Mice learned to lick from the spout when it was extended over 1–2 sessions (1 h). The timing of the lick task was similar to that in the freely moving behavioral task. Each trial started with a 1-s delay, followed by a 3-s pre-consumption period. After this period, one of two lick spouts (water or food) was extended in random order. Mice had a 2-s time window to initiate the first lick, at which point the consumption period (5 s) started. After spout retraction, the inter-trial-interval was variable (4–30 s).
Fiber implantation and optical stimulation.
Fiber implantation was performed under anesthesia (1.5% isoflurane). The skull was exposed and customized fiber optic probes (200 μm diameter core, multimode, NA 0.48, ThorLabs) were implanted above the mPFC either unilateral (coordinates from bregma: −1.8 mm to −2.0 mm A/P; −0.2 mm to −0.5 mm M/L; −1.3 mm to −1.6 mm; 3–5° angle) or bilateral (coordinates from bregma: −1.8 mm to −2.0 mm A/P; ±0.5 mm to ±0.8 mm; D/V –1.5 mm to −1.9 mm; 5–12° angle). Animals had at least 10 days to recover from surgery before food and water restriction and training began.
Experiments involving optogenetic activation of cortical interneurons in Vgat::ChR2-EYFP mice21,22 expressing channelrhodopsin-2 in GABAergic interneurons were performed using λ = 473 nm blue light at 6–8 mW laser power at the tip of the fiber with 10 ms pulses of light at 20 Hz frequency. The same parameters and conditions were used for C57BL/6J control mice. Light was delivered in two different time periods: (1) the pre-choice period starting at the onset of the cue until a lever was pressed, or (2) the outcome evaluation period, which started after the lever was pressed until the reward spouts were retracted. For the pre-choice period, stimulation took place from trial 25–50 and trial 75–100, while trial 1–24 and 51–74 were laser off conditions. For the outcome evaluation period, all trials (1–100) were laser-on trials to prevent undisturbed outcome evaluation during the session and, thus, prevent within session learning about the value of the outcome.
Optical stimulation during electrophysiological recordings.
For optical stimulation during the head-fixed lick task, the same laser power settings were used as above. Six different trial types were used in hunger and thirst: food or water spout trials with no optical stimulation, food or water spout trials with optical stimulation occurring during the pre-consumption phase (similar to the pre-choice phase in the freely moving behavioral task), food or water spout trials with optical stimulation during the consumption phase. All conditions were randomized.
Extracellular electrophysiological recordings.
For extracellular electrophysiological recordings, unilateral fiber implantation was performed as described above and an additional head bar was attached above skull-position lambda for head fixation during recordings. On the day of the recording, a small craniotomy (0.5 mm diameter) was made over the left mPFC adjacent to the fiber location (coordinates from bregma: −1.8 mm to −2.0 mm A/P; −0.5 mm). Extracellular spikes were recorded using Neuropixels probes.
Neuronal recordings and spike sorting.
Recordings were made using Neuropixels Phase3A Option3 electrode arrays 24, inserted 3 mm (300 recording sites) into the left mPFC. Electrodes had a wire soldered onto the reference pad which was shorted to ground. During recording, these reference wires were connected to an Ag/AgCl wire positioned on the skull. The craniotomy as well as the reference wires were covered with cortex buffer (NaCl 125mM, KCl 5mM, Glucose 10mM, HEPES 10mM, CaCl2 2mM, MgSO4 2mM, pH 7.4) throughout recordings. Prior to each insertion, the tip of the electrode was first coated with CM-Dil (CM-Dil, Thermo Fisher), a red fixable lipophilic dye, for later electrode track localization in post mortem histology. Probes were advanced through the dura, then lowered to the final position at 5 μm/s by a micromanipulator (uMP-4, Sensapex Inc), and were allowed to settle for approximately 10 min before recording. Recordings were made with open-source software SpikeGLX (http://billkarsh.github.io/SpikeGLX/) in external reference mode. Signals in the action potential band were sampled at 30 kHz with gain of 500 (2.34 μV/bit at 10-bit resolution). The timestamps (TTL pulses) of trial start/end, photo stimulation, and water/food delivery were recorded by the Neuropixels Sync channel, allowing events synchronization with spike timing. All recordings were completed within 2-h (200–240 trials). Between recording days, the craniotomy was protected with Kwik-Cast Sealant (World Precision Instruments). Data from the Neuropixels action potential band were first band-pass filtered (300–9000 kHz) and applied global demuxed CAR using CatGT (https://billkarsh.github.io/SpikeGLX/help/dmx_vs_gbl/dmx_vs_gbl/). Spikes were sorted offline using a modified version of Kilosort225 (https://github.com/MouseLand/Kilosort/releases/tag/v2.5), a high-throughput spike sorting method based on a template matching algorithm that tracks neurons as they drift over the course of the experiment. Briefly, spikes were detected in a first step based on the similarity of their spatiotemporal waveforms to a set of common templates. The amplitude distribution of spikes over channels was used to determine how much the probe shifted relative to the brain on each 2-s batch. We used interpolation to determine the vertical shift down to a 0.5 μm resolution. We used these shifts to align the data batches by shifting each batch so it matches the position of the reference. The data shifting was performed using a kriging interpolation method. After registration, the template detection and extraction steps of Kilosort2 were run, with the drift tracking option disabled, and the batch order randomized. The details of the algorithm will be described in more detail in a future publication. The results were checked in Phy26 but were not curated manually. Instead, we used a combination of three quality metrics to find units of sufficiently high quality to be used in the analyses.
Each output cluster from Kilosort2 had to meet the following three criteria. First, we used the standard “good” metric from the original Kilosort2 which classifies units based on the fraction of refractory period violations relative to the base rate for that unit. Second, we used the spatial footprint of the waveform to exclude noise and artifacts which tend to have a large spatial footprint. To define spatial footprint, we used the weighted distance of each channel in the waveform from the peak channel of the waveform. The weights were defined as the maximum absolute amplitudes of the waveform on each channel, and channels with weights less than a tenth of the peak amplitude were excluded. Units with spatial footprints larger than 100 μm were excluded from analysis. The third criterion we used was based on the reliability of the units and computed based on a second spike sorting run of the same data. Each unit in the original sort was matched to a unit in the new sort, by maximizing the metric 1 - FP - M, where FP is the false positive ratio and M is the miss ratio25. Units were kept if their matching score was above 0.75.
Neurons were assigned to brain areas based on the location of their peak channel on the electrode array.
Histology, immunohistochemistry and microscopy.
Animals were anaesthetized with isoflurane and transcardially perfused with PBS followed by 4% paraformaldehyde in PBS. Brain sections (50 μm) were imaged to determine fiber placement on an upright epi-fluorescent microscope with 10× or 20× objectives.
Conditioned place preference.
Conditioned place preference was performed as previously described5A sound-isolated, two chamber apparatus with visual and textual distinct sides was used and an overhead video camera recorded the position of the animal. After acclimatization, hungry or thirsty animals were placed in the apparatus for 30 min and their initial preference was recorded. The less preferred side was then paired with photostimulation for 30 min with 10 ms pulses at 20 Hz for 1 s, repeated every 4 s in a passive conditioning task for 5 consecutive days. On the same 5 days but at different times of the day and at least 5 hours apart, animals were tethered and placed on the preferred side for 30 min but without receiving photostimulation to match the time spent on each side of the chamber. After that preference was tested again. We also performed a closed-loop place preference in the same animals, in which they had access to both sides of the chamber and photostimulation was applied when the mouse entered the less preferred side (which was previously paired with the passive conditioning stimulation). Photostimulation ceased as soon as the mouse crossed to the other side. The next day free access preference was tested again.
Data analysis.
Binning and alignment.
All analyses started by aligning and binning the spiking data to form arrays of size #trials by #timepoints by #neurons. In most cases, we aligned to the time at which the spout moved within reach of the animal (“spout in”). For trials with closed-loop optogenetic inhibition triggered by the first lick, we instead aligned to the first lick. Trials were excluded from all analyses if the animals did not lick within the first 2-s after “spout in”, with the exception of the neuron selection step and the decoders, which considered all trials (see below). The spiking data was binned at 100 ms for all traces shown on all plots.
Neuron selection.
To find selective neurons which distinguished between food and water, we considered the average firing rate in each trial over the five second consumption window, when the reward spout was within reach. For each neuron, we performed single-tailed Wilcoxon rank sum tests to compare water and food trials and picked all neurons that passed a p < 0.05 significance test for their preferred stimulus. We used all trials for this step, including no lick trials, to avoid imbalances in the number of trials in some sessions, which would result in artificially lower numbers of selective neurons. We also classified neurons as task-related if either: 1) they were selective for food vs water; or 2) their responses across all trial types were significantly different during the consumption period compared to the three second window preceding it. Task-related neurons were reported in the main text but not used for any further analyses.
Baseline and response comparisons.
For each selective neuron we calculated its baseline from the mean firing rate in the three second window preceding the “spout in” event, and we calculated the response to its preferred reward from the five second consumption period, after subtracting the baseline firing rate. We compared these baselines and responses across pooled neuron populations using a two-tailed Wilcoxon rank sum test. The pooling combined into four population neurons selective for food in hunger, food in thirst, water in hunger, water in thirst.
Decoders.
For each recording session, we fit neural population decoders to classify trials according to the type of outcome (food or water). The decoders were linear and trained using ridge regression, where a target output of 1 represented food and −1 represented water. The input to the decoders on each trial was the vector of average firing rates during the 5-s consumption period. The decoders were trained using leave-one-out-cross validation, meaning that a separate decoder was trained for every set of N-1 trials, and used to predict the reward type on the N-th “left out” trial, where the N-th trial was in turn every trial in the session. The classifier test performance was reported separately for water and food trials and included only trials with at least one lick during the 2 seconds following “spout in”. However, for training the decoders, we considered all trials irrespective of the number of licks.
Optogenetic inhibition and controls.
Optogenetic inhibition was performed either in the pre-consumption period (the three seconds preceding “spout in”) or during the consumption period, triggered on the first lick. The two types of trials were considered separately for all analyses and controls. Neurons were considered activated/inhibited if they responded substantially more/less during the optogenetic inhibition period, compared to the equivalent period during trials with no inhibition. A one-sided Wilcoxon rank sum test was used to determine activated/inhibited units. For the plots, we combined food and water selective neurons and grouped their traces for different conditions according to preferred/non-preferred stimuli. In addition, in some of the plots we combined neurons across hunger and thirst states. To control for the number of licks, we divided all trials within the same condition into equal subsets of low and high number of licks. To control for cumulative effects of inhibition, we similarly divided trials into subsets based on whether they were preceded by a laser trial or not.
Preference index.
The preference index (PI) was calculated subtracting incorrect presses from correct presses and dividing by the number of total presses.
For the learning curve, we calculated the PI for a block of ten trials throughout the session for a total of 10 blocks (100 trials).
Transition trial and maximum error bouts.
The transition trial was calculated with a sliding window analysis (window size of 10 trials, step size 1 trial), until the animal reached 80% correct responses (8 correct presses out of 10 total presses). To derive the maximum length of error trials, we calculated the number of consecutive errors and chose the longest bout in each condition.
Reaction time analysis.
We excluded all missed trials (trials where the animal did not press either lever) from the analysis and calculated the mean reaction time for all presses for the water and food lever in hunger and thirst. Trials in which animals reached outside the cage to press the lever (i.e. before the lever was fully extended into the behavioral cage) were included in the analysis.
Lick Analysis.
For the free ad libitum consumption choice task, both spouts were extended and animals could lick both spouts. Total number of licks on each spout was recorded and averaged for each animal in hunger and thirst. If no licks occurred during any given trial it was counted as value 0 and included in the analysis. For the instrumental lever pressing task, average licks per trial were calculated for each animal for all trials where the food or water lever were pressed and the food or water spout was extended for consumption of the reward. Trials where animals did not lick from the spout were assigned with the value 0 and included in the calculation.
Analysis of trials with laser stimulation.
For the pre-choice stimulation, we compared trials 25–50 and 75–100 of the stimulation session with the same trials (25–50 and 75–100) of the previous non-stimulation session in the same need state. For the outcome evaluation period comparison, all 100 trials of the stimulation session were compared to all 100 trials of the prior non-stimulation session.
Analysis of conditioned place preference.
Based on the initial preference test, we calculated the percentage of time spent on each side and assigned each animal either the left or right side of the chamber, depending on which side was less preferred, where the animal would receive photostimulation. We then calculated the percentage of time spent on that side before any photostimulation (pre), after 5 consecutive days of passive conditioning (1st post), during closed-loop stimulation (active) and the day after (2nd post).
Analysis of mPFC silencing in animals switched from constant thirst to hunger.
In Fig. 3k we compared mice (n=6) in thirst that were first switching between need states but then held constant in thirst for at least 5 training sessions over 10 consecutive days. The data of the same animals are compared without (regular) and with mPFC inhibition during the outcome evaluation period during the end of the constant thirst training before those animals were switched to hunger. In Fig. 3l, we compared the performance of animals that were originally switching between need states, then held constant in thirst (for at least 5 training sessions and 10 consecutive days) and were then switched back to hunger. One group of animals (n=7) was tested in hunger without photostimulation (regular), while a different group of animals (n=7) was tested in hunger with photostimulation during the outcome evaluation period.
Curve Fitting.
To analyze and compare the intra-session learning curve of animals, we first excluded all trials lacking a choice from the data set and calculated the mean in a moving window of 3 trials to aid in fitting the Weibull function. We used a modified Weibull function27 to include an offset term (a) to fit the learning curves across trials (t) of each individual animal with the following function
with parameters corresponding to offset (a), onset latency (L), and shape/steepness of function (S) fitted at trial t. We calculated the cumulative density function of those three fitted parameters and used the Kolmogorov-Smirnov test to detect difference between hunger and thirst. Curve fitting to the Weibull function was performed using the nlinfit function in Matlab.
Statistics.
Data are reported as means ± s.e.m., unless otherwise stated. Pairwise comparisons were calculated by unpaired or paired nonparametric rank tests like Mann-Whitney U-test and Wilcoxon signed rank test, respectively, while learning curves were analyzed using ANOVA (see Supplementary Table 1). Data distribution was assumed to be normal for ANOVA but this was not formally tested. All statistical tests were two-sided unless otherwise stated and were corrected for multiple comparisons as noted in Supplementary Table 1. Analyses were performed using SigmaPlot or Matlab (Mathworks).
Extended Data
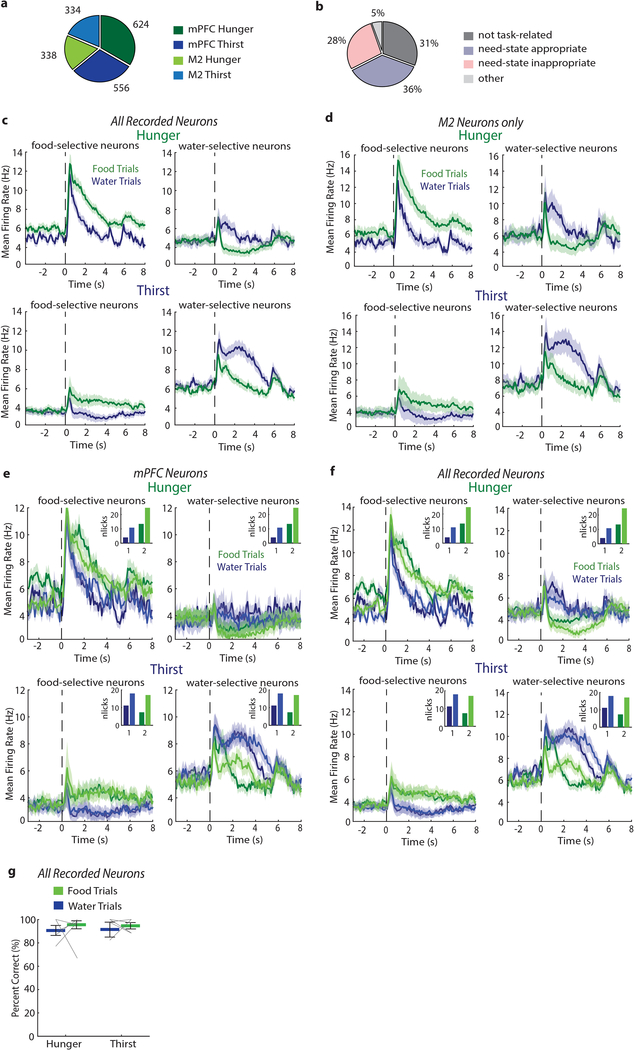
Extended Data Fig. 1. Recordings of consummatory responses to hydrated food and water.
a, Number of mPFC and M2 neurons recorded in hunger and thirst. b, Proportion of response types from all recorded mPFC neurons (1180). Need-state-appropriate and need-state-inappropriate selective neurons comprise 64% of recorded mPFC neurons. Other: neurons that respond to hydrated food and water but are not selective. c-d, Population mean firing rates of all recorded neurons (c) and only M2 neurons (d) that prefer hydrated food (left) or water (right) in hunger (upper row) or thirst (lower row). Responses are aligned to spout extension (dashed line). e-f, Mean firing rate of mPFC neurons (e) and all recorded neurons (f) for food-selective (left) and water-selective (right) neurons during hunger (top) and thirst (bottom) in trials with lower and higher lick rates (darker and lighter colors, respectively). Trials were sorted by number of licks and split into two equal portions (see Methods). Mean of licks in each subgroup of trials is shown in the insets. The mean firing rate for each trial-subgroup in hunger and thirst is shown for food- and water-preferring neurons. The response magnitudes and the response differences between food- and water-preferring neurons are similar in subgroups of trials with lower or higher numbers of licks, consistent with prior reports23 [ref: Takenouchi, K. et al. Emotional and behavioral correlates of the anterior cingulate cortex during associative learning in rats. Neuroscience 93, 1271–1287 (1999)]. g, Decoding accuracy of neural responses to food and water in hunger and thirst using all recorded neurons. Thick lines represent mean. Error bars represent SEM.
Extended Data Fig. 2. Characterization of prefrontal cortex silencing by optogenetic activation of inhibitory interneurons.
a, Experimental timeline of consumption and optogenetic silencing during pre-consumption period (red) or consumption period (orange). Grey bar indicates consumption window. ITI: inter-trial interval. b, Proportion of mPFC neurons activated (yellow), unmodulated (grey), or inhibited (yellow or red) by optogenetic stimulation of VGAT neurons during pre-consumption (red, upper panel) or consumption period (orange, lower panel) in hunger (left panel) or thirst (right panel) c, Firing rate of example mPFC neurons in hunger (upper panel) and thirst (lower panel) without VGAT neuron photostimulation (photoinhibition) (left, aligned to spout in), photoinhibition during pre-consumption period (middle, aligned to laser onset) and consumption period (right, aligned to laser onset). Grey bar indicates consumption period. d, Population responses in inhibited mPFC neurons to photoinhibition during the pre-consumption period (left, aligned to spout in) or consumption period (right, aligned to first lick) in hunger (upper panel) and thirst (lower panel). Responses are shown for preferred and non-preferred outcome with and without stimulation. Insets expand initial VGAT neuron photostimulation period, scale bar: 0.2 s. e, Mean firing rate for mPFC neurons activated by optogenetic VGAT neuron stimulation during pre-consumption period (left, aligned to spout in) and consumption period (right, aligned to first lick). Insets expand the end of the VGAT neuron photostimulation period aligned to stimulation offset (dashed line), scale bar: 0.2 s. f, Mean firing rate for all recorded neurons with VGAT neuron photostimulation during pre-consumption period (upper panel, aligned to spout in) and consumption period (lower panel, aligned to first lick) for activated and inhibited neurons. Insets expand the end of the VGAT neuron photostimulation period aligned to stimulation offset (dashed line), scale bar: 0.2 s. Grey bar indicates consumption period. g, For successive optogenetic inhibition trials, no effect of cumulative optogenetic inhibition on firing rate for inhibited neurons during pre-consumption (left) and consumption (right) period for laser trials (see Methods). h, In freely moving mice, lick-triggered consumption of food and water without (grey) or paired with lick-triggered mPFC silencing (red) in hunger (n=12) and thirst (n=9). Thick lines represent mean. Error bars represent SEM. ns, P>0.05. Detailed information about the exact test statistics, sidedness, and values are provided in Supplementary Table 1.
Extended Data Fig. 3. Behavioral apparatus and training.
a, Diagram of behavioral apparatus. b, (Left) Individual sessions (green: hunger, blue: thirst) required to reach training criteria for lever presses in constant need state (grey shading) and alternating need state (brown shading). (Right) Mean training sessions in constant need state (grey, n=9 mice in hunger, n=9 mice in thirst) and after need state was switched (brown, n=27 mice). Box: IQR, red horizontal lines: median, whiskers: closest data points>1.5*IQR. c, Total lever presses for water (blue) and food (green) in constant need state (n = 7). d, Breakpoint ratio in hunger (green) and thirst (blue) for constant need state animals. e, Examples of training performance of need state switching animals with low (top) or high (bottom) food bias in initial training. Testing after each need state switch was separated by 3–4 days. Sessions in the same need state were either consecutive or every other day. Thick lines represent mean. Error bars represent SEM. ***P<0.001; ns, P>0.05. Detailed information about the exact test statistics, sidedness, and values are provided in Supplementary Table 1.
Extended Data Fig. 4. mPFC is not required for constant need state decision-making.
a-c, Effect of mPFC silencing during pre-choice phase in constant need state animals on error rate and preference index (a), reaction time of correct presses (b) and lick count (c) in hunger and thirst with (red) or without (grey) mPFC silencing. d-f, Effect of mPFC silencing during the outcome evaluation period in constant need state animals on error rate and preference index (d), reaction time of correct presses (e) and lick count (f) in hunger and thirst with (orange) or without (grey) mPFC silencing (regular n = 13 mice, stimulation n = 9 mice each during hunger and thirst). g, Anatomical location of optical fiber placement for constant need state animals. Gray circles indicate tip of optical fiber. Cg1: cingulate cortex area 1, Cg2: cingulate cortex area 2, DP: dorsal peduncular cortex, D3V: dorsal 3rd ventricle, fmi: forceps minor of the corpus callosum, IL: infralimbic cortex, M1: primary motor cortex, M2: secondary motor cortex, MO: medial orbital cortex, PrL: prelimbic cortex, VO: ventral orbital cortex. Thick lines represent mean. Error bars represent SEM. ns, P>0.05. Detailed information about the exact test statistics, sidedness, and values are provided in Supplementary Table 1.
Extended Data Fig. 5. Breakpoint analysis for food and water reward in hunger and thirst.
a, Cumulative presses for food (green) and water (blue) for one example animal throughout one breakpoint session in hunger (left) and thirst (right) b, Total lever presses for water (blue) and food (green) in a group of mice switching between hunger and thirst (n = 7). c, Breakpoint ratio in hunger (green) and thirst (blue) for switching need state animals. d, Post-reinforcer pausing in seconds as a measure of motivation during the early, middle (mid), or late part of the breakpoint session for switching animals. e, Total lever presses for water (blue) and food (green) in switching and constant need state conditions with pre-exposure to food and water in home cage. f, Breakpoint ratio in hunger (green) and thirst (blue) for switching and constant need state animals with pre-exposure to food and water in home cage (n = 7 mice for each group in hunger and thirst). g, Breakpoint ratio for switching and constant animals in regular or pre-exposure conditions separately for hunger (left) and thirst (right). Thick lines represent mean. Error bars represent SEM. *P<0.05; ns, P>0.05. Detailed information about the exact test statistics, sidedness, and values are provided in Supplementary Table 1.
Extended Data Fig. 6. Food bias and learning rates for decision-making in thirst and hunger.
a, Error rates for decisions in hunger and thirst with need state switching (n = 27) for mice with intermediate experience on the task under need state-switching conditions as well as for mice during constant need state (n = 18). b, Error rates during early decision-making sessions under need state-switching conditions just after the task had been learned (left) and after extensive experience with task in late sessions (right) (early n = 27 mice, late n = 22 mice). c, Transition trial in hunger and thirst when correct performance exceeded 80% correct during early, intermediate, and late sessions shows lag in correct performance in thirst due to initial food-seeking bias. Boxplot’s central mark indicates the median, bottom and top edges of the box indicate the 25th and 75th percentiles, respectively. The whiskers extend to the most extreme data points not considered outliers, and the outliers are plotted individually using the ‘+’ symbol. d, Example of Weibull fit27 to correct responses for one session in hunger (left) and thirst (right). e, Cumulative density function for the three Weibull fit parameters (n = 27 mice). (Left) offset a (*P<0.05), (middle) onset Latency L, (right) shape/steepness of function S. f, Comparison of initial food bias during regular switching (green, n=22) and after mice were held in constant thirst and switched back to hunger (black, n=7) matched for equal number of training sessions (see Methods for more details). g, To test if mice determine which lever gives the greatest reward for their current need in each session, we reversed the lever contingencies (‘lever reversal’, n = 14). In both hunger and thirst, the initial performance (first block of 10 trials) was opposite for the reversed contingencies with mice pressing the lever previously associated with the need-appropriate outcome. Boxplot’s central mark indicates the median, bottom and top edges of the box indicate the 25th and 75th percentiles, respectively. The whiskers extend to the most extreme data points not considered outliers, and the outliers are plotted individually using the ‘+’ symbol. Error bars represent SEM. *P<0.05; **P<0.01; ***P<0.001; ns, P>0.05. Detailed information about the exact test statistics, sidedness, and values are provided in Supplementary Table 1.
Extended Data Fig. 7. Body weight and decision-performance.
Mean (n = 17 mice) preference index (black) and body weight (red) over multiple behavioral sessions switching animals between food restriction (hunger, green shading) and water restriction (thirst, blue shading). Error bars represent SEM.
Extended Data Fig. 8. mPFC silencing during pre-choice and outcome evaluation.
a, Error rates (left) and reaction times (right) in the pre-choice stimulation period (n = 17 mice). b, Error rates (left) and reaction times (right) in the outcome evaluation period (n = 17 mice). c, Conditioned place preference test (n=12). Black horizontal lines: median, box: interquartile (25th-75th percentile) range (IQR), whiskers: closest data points>1.5*IQR. d, Venn Diagram showing animals affected by mPFC silencing during the pre-choice (n = 13 mice) and outcome evaluation period (n = 12 mice), with one animal being unaffected in both periods. Mice affected by optogenetic stimulation (responders) showed an effect on performance greater than 2 standard deviations above or below the mean error rate of 3 independent non-stimulation sessions. The same mice were used in both hunger and thirst conditions and thus differences in sensitivity to mPFC silencing in hunger and thirst are measured across the same animals. e, Number of animals showing an effect in pre-choice and outcome evaluation stimulation depending on unilateral vs. bilateral fiber implant. f, Anatomical location of non-responding animals during outcome evaluation stimulation. Thick lines represent mean. Error bars represent SEM. *P<0.05; **P<0.01; ***P<0.001; ns, P>0.05. Detailed information about the exact test statistics, sidedness, and values are provided in Supplementary Table 1.
Extended Data Fig. 9. Laser stimulation control experiments using C57BL/6J mice with bilateral fiber placement.
a, Within-session learning curve in hunger (green) and thirst (blue) during need state switching with no laser stimulation (n=16). b, Within-session learning curve in hunger (green) and thirst (blue) during laser stimulation on all trials during the outcome evaluation phase. c, Within-session learning curve in hunger (green) and thirst (blue) during laser stimulation during trials 25–50 and 75–100 during the pre-choice phase. d, Preference Index in hunger and thirst in session with no laser stimulation (grey), with laser stimulation during the outcome evaluation phase (orange), and with laser stimulation during pre-choice phase (red). e, Error rate in hunger and thirst in session with no laser stimulation (grey), with laser stimulation during the outcome evaluation phase (orange), and with laser stimulation during pre-choice phase (red). f, Comparison of reaction times in all three conditions in hunger and thirst for correct trials (left) and error trials (right). g, Bilateral fiber placement of C57BL/6J mice (n = 16). Thick lines represent mean. Error bars represent SEM. *P<0.05; **P<0.01; ***P<0.001; ns, P>0.05. Detailed information about the exact test statistics, sidedness, and values are provided in Supplementary Table 1.
Extended Data Fig. 10. mPFC controls evaluative decision-making in both hunger and thirst.
a, Reaction time and licks per trial in thirst during regular need state switching (blue) and with mPFC silencing during outcome evaluation after holding thirst state constant for several sessions (orange) (n = 6 mice). b, Reaction time and licks per trial in hunger after being in constant thirst for several sessions without (green) and with mPFC silencing during outcome evaluation (orange) (n = 7 mice). Thick lines represent mean. Error bars represent SEM. *P<0.05; **P<0.01; ***P<0.001; ns, P>0.05. Detailed information about the exact test statistics, sidedness, and values are provided in Supplementary Table 1.
Supplementary Material
Acknowledgements.
This research was funded by the Howard Hughes Medical Institute. We thank K. Svoboda’s lab for assistance with Neuropixels recordings, S. Michaels, A. Hu for histology; M. Rose, M. McManus, R. Gattoni, S. Erwin, C. Morrow, A. Zeladonis, C. Lopez for mouse breeding and procedures; S. Lindo, R. Gattoni, A. Kozlosky for training control animals, A. Hantman, J. Dudman, U. Heberlein, A. Hermundstad, R. Egnor for comments on the manuscript.
Footnotes
Competing interests. The authors declare no competing interests.
Code availability. The code used to collect and analyze the data in this study are available upon request.
Data availability.
The data that support the findings of this study are available from the corresponding author upon reasonable request.
References
- 1.Stevenson RJ, Mahmut M & Rooney K Individual differences in the interoceptive states of hunger, fullness and thirst. Appetite 95, 44–57 (2015). [DOI] [PubMed] [Google Scholar]
- 2.Mattes RD Hunger and Thirst: Issues in measurement and prediction of eating and drinking. Physiol. Behav. 100, 22–32 (2010). [DOI] [PMC free article] [PubMed] [Google Scholar]
- 3.Betley JN et al. Neurons for hunger and thirst transmit a negative-valence teaching signal. Nature 521, 180–185, doi: 10.1038/nature14416 (2015). [DOI] [PMC free article] [PubMed] [Google Scholar]
- 4.Dennis EA et al. Water consumption increases weight loss during a hypocaloric diet intervention in middle-aged and older adults. Obesity 18, 300–307 (2010). [DOI] [PMC free article] [PubMed] [Google Scholar]
- 5.Kennedy PJ & Shapiro ML Retrieving memories via internal context requires the hippocampus. J. Neurosci. 24, 6979–6985, doi: 10.1523/jneurosci.1388-04.2004 (2004). [DOI] [PMC free article] [PubMed] [Google Scholar]
- 6.Hull CL Differential habituation to internal stimuli in the albino rat. J. Comp. Psychol. 16, 255–273, doi: 10.1037/h0071710 (1933). [DOI] [Google Scholar]
- 7.Watts AG Dehydration-associated anorexia: development and rapid reversal. Physiol. Behav. 65, 871–878 (1999). [DOI] [PubMed] [Google Scholar]
- 8.Ramachandran R & Pearce JM Pavlovian analysis of interactions between hunger and thirst. J. Exp. Psychol. Anim. Behav. Process. 13, 182–192 (1987). [PubMed] [Google Scholar]
- 9.Kendler HH & Levine S Studies of the effect of change of drive. From hunger to thirst drive in a t-maze Journal of experimental psychology 41, 429–436 (1951). [DOI] [PubMed] [Google Scholar]
- 10.Tataranni PA et al. Neuroanatomical correlates of hunger and satiation in humans using positron emission tomography. Proc Natl Acad Sci 96, 4569–4574 (1999). [DOI] [PMC free article] [PubMed] [Google Scholar]
- 11.de Araujo IE, Kringelbach ML, Rolls ET & McGlone F Human cortical responses to water in the mouth, and the effects of thirst. J Neurophysiol 90, 1865–1876, doi: 10.1152/jn.00297.2003 (2003). [DOI] [PubMed] [Google Scholar]
- 12.Andersson B & Larsson S Water and food intake and the inhibitory effect of amphetamine on drinking and eating before and after “prefrontal lobotomy” in dogs. Acta Physiol. Scand. 38, 22–30 (1956). [DOI] [PubMed] [Google Scholar]
- 13.Land BB et al. Medial prefrontal D1 dopamine neurons control food intake. Nat Neuroscience 17, 248–253 (2014). [DOI] [PMC free article] [PubMed] [Google Scholar]
- 14.Nakayama H, Ibanez-tallon I & Heintz N Cell-type specific contribution of medial prefrontal neurons to flexible behaviors. J. Neurosci. 38, 4490–4505 (2018). [DOI] [PMC free article] [PubMed] [Google Scholar]
- 15.Yiin YM, Ackroff K & Sclafani A Flavor preferences conditioned by intragastric nutrient infusions in food restricted and free-feeding rats. Physiol. Behav. 84, 217–231, doi: 10.1016/j.physbeh.2004.11.008 (2005). [DOI] [PubMed] [Google Scholar]
- 16.Balleine BW in Neurobiology of Sensation and Reward (ed Gottfried JA) (CRC Press/Taylor & Francis, 2011). [PubMed] [Google Scholar]
- 17.Balleine B Instrumental performance following a shift in primary motivation depends on incentive learning. J. Exp. Psychol. Anim. Behav. Process. 18, 236–250 (1992). [PubMed] [Google Scholar]
- 18.Corbit LH & Balleine BW The role of prelimbic cortex in instrumental conditioning. Behav. Brain Res. 146, 145–157, doi: 10.1016/j.bbr.2003.09.023 (2003). [DOI] [PubMed] [Google Scholar]
- 19.Shipman ML, Trask S, Bouton ME & Green JT Inactivation of prelimbic and infralimbic cortex respectively affects minimally-trained and extensively-trained goal-directed actions. Neurobiol. Learn. Mem. 155, 164–172, doi: 10.1016/j.nlm.2018.07.010 (2018). [DOI] [PMC free article] [PubMed] [Google Scholar]
- 20.Killcross S & Coutureau E Coordination of actions and habits in the medial prefrontal cortex of rats. Cereb Cortex 13, 400–408 (2003). [DOI] [PubMed] [Google Scholar]
References
- 21.Zhao S et al. Cell type-specific channelrhodopsin-2 transgenic mice for optogenetic dissection of neural circuitry function. Nat Methods 8, 745–752 (2011). [DOI] [PMC free article] [PubMed] [Google Scholar]
- 22.Guo Zengcai V. et al. Flow of Cortical Activity Underlying a Tactile Decision in Mice. Neuron 81, 179–194, doi: 10.1016/j.neuron.2013.10.020 (2014). [DOI] [PMC free article] [PubMed] [Google Scholar]
- 23.Horst NK & Laubach M Reward-related activity in the medial prefrontal cortex is driven by consumption. Front Neurosci 7, 56, doi: 10.3389/fnins.2013.00056 (2013). [DOI] [PMC free article] [PubMed] [Google Scholar]
- 24.Jun JJ et al. Fully integrated silicon probes for high-density recording of neural activity. Nature 551, 232–236, doi: 10.1038/nature24636 (2017). [DOI] [PMC free article] [PubMed] [Google Scholar]
- 25.Pachitariu M, Steinmetz NA, Kadir SN, Carandini M & Harris KD in Advances in Neural Information Processing Systems 29: Annual Conference on Neural Information Processing Systems 4448–4456 (Barcelona, Spain, 2016). [Google Scholar]
- 26.Rossant C et al. Spike sorting for large, dense electrode arrays. Nat. Neurosci. 19, 634–641, doi: 10.1038/nn.4268 (2016). [DOI] [PMC free article] [PubMed] [Google Scholar]
- 27.Gallistel CR, Fairhurst S & Balsam P The learning curve: implications of a quantitative analysis. Proc Natl Acad Sci 101, 13124–13131 (2004). [DOI] [PMC free article] [PubMed] [Google Scholar]
Associated Data
This section collects any data citations, data availability statements, or supplementary materials included in this article.
Supplementary Materials
Data Availability Statement
The data that support the findings of this study are available from the corresponding author upon reasonable request.


