

Abstract
Background
Overweight, obesity, and diabetes are rising rapidly in low- and middle-income countries (LMICs) but there is scant empirical evidence about the relationship between body mass index (BMI) and diabetes in these settings.
Methods
We pooled individual-level data from nationally representative surveys across 57 LMICs, totaling 685,616 individuals aged ≥25 years. BMI categories were defined as: normal (18.5 – 22.9 kg/m2), upper-normal (23.0–24.9 kg/m2), overweight (25.0– 29.9 kg/m2), or obesity (≥30.0 kg/m2). We estimated the association between BMI and diabetes risk using multivariable Poisson regression and receiver operating curve (ROC) analyses, stratified by sex and geographic region.
Results
The overall prevalence of overweight was 27.2% (95% CI: 26.6, 27.8), of obesity 21.0% (19.6, 22.5), and of diabetes 9.3% (8.4, 10.2). In the pooled analysis, an increased risk of diabetes was observed at a BMI of 23 kg/m2 or above, with a risk increase of 43% for males and 41% for females compared to a normal BMI. Diabetes risk also rose steeply in individuals 35–44 years old and men aged 25–34 years in Sub-Saharan Africa. In stratified analyses, there was regional variability in this relationship. Optimal BMI thresholds for diabetes screening ranged from 23.8 kg/m2 among males in East/Southeast Asia to 28.3 kg/m2 among females in the Middle East and North Africa and Latin America and the Caribbean.
Conclusions
The association between BMI and diabetes risk in LMICs is subject to substantial regional variability. Diabetes risk is greater at lower BMI thresholds and younger ages than reflected in currently used cut-offs.
INTRODUCTION
The global prevalence of overweight and obesity has doubled over the past four decades, with 1.9 billion (39%) adults living with overweight and an additional 650 million (13%) with obesity.1 While recent studies suggest that the rate of increase in overweight and obesity in high-income countries may be slowing,2,3 there is growing evidence that this epidemic has accelerated in low- and middle-income countries (LMICs), where 2 out of 3 people with obesity now reside.4–6 The unprecedented increase in overweight and obesity in LMICs has paralleled the alarming rise in diabetes mellitus and other cardiovascular risk factors in these regions of the world, such that 79% of the estimated 463 million people with diabetes reside in LMICs.7 Yet, there is limited data on how overweight and obesity, measured through standard metrics, relate to diabetes risk across LMICs and whether the variation seen in country-level studies is observed at larger geographic scales.
Although the association between high body mass index (BMI) and metabolic risk is well established,8,9 the understanding of BMI and its relationship to key clinical outcomes has been shaped by a vast literature that to date has almost exclusively been conducted in high-income countries.8,10,11 The exception has been a growing literature from Asian and South Asian countries,12–14 which directly informed clinical guidelines recommending lowering of BMI thresholds that define overweight to better characterize metabolic risk in these populations.14 Single-country studies in LMICs have also suggested important variability in the association between BMI and diabetes risk when using standard thresholds,15,16 but differences in this association across LMICs, which are highly heterogeneous, remain largely unexplored.
In this study, we aim to characterize the association between BMI and diabetes risk in LMICs at the country level and stratified by geographic region and sex. To do this, we leverage the largest compiled and harmonized dataset to date of individual-level survey data with biologically measured diabetes status to characterize the risk of diabetes across the full range of BMI in 57 LMICs.
METHODS
Data sources
We performed a pooled analysis of individual-level data from 58 nationally representative population-based surveys across 57 LMICs. The requirements for inclusion of a national survey as well as the search methods have been previously described.17,18 Further details specific to this analysis are provided in Appendix 1. Briefly, the requirements for inclusion of a country survey in this study were as follows: the survey (1) was conducted during or after 2008, (2) had data available at the individual level, (3) was conducted in a low-income, lower-middle-income or upper-middle-income country according to the World Bank Income Group (WBIG) in the year that the survey was conducted,19 (4) was nationally representative, (5) had a response rate ≥50%, (6) contained a diabetes biomarker (either a blood glucose measurement or hemoglobin A1c [HbA1c]), and (7) contained anthropometric data on height and weight.
Search methodology
We first identified all countries in which a World Health Organization (WHO) Stepwise Approach to Surveillance (STEPS) survey had been conducted during a year in which the country fell into an eligible World Bank income category. The STEPS survey is a standardized instrument for collecting and disseminating data about non-communicable disease (NCD) risk factors in adults living in WHO member countries.20 Prior to the STEPS surveys being made available in the WHO STEPS survey Central Data Catalog in 2019,21 we systematically requested each eligible STEPS data set from a list of these surveys that the WHO maintains on their website.21 In 2019, additional eligible surveys were downloaded from the Central Data Catalog (final screening date February 26th, 2021). The details of the STEPS survey search are provided in Appendix 1. Ultimately, we included 49 eligible STEPS surveys. For LMICs that did not have a STEPS survey that met our inclusion criteria, lacked valid contact information, or declined our request for data (86 countries total), we performed a systematic Google search and an additional search on the Demographic and Health Survey (DHS) website. We ultimately identified 19 eligible non-STEPS surveys and included data from nine non-STEPS surveys that met the above inclusion criteria (Appendix 2). Of note, surveys were conducted separately for Zanzibar and Tanzania but are considered to be from one country (United Republic of Tanzania). Countries were categorized into six geographic regions, according to the NCD Risk Factor Collaboration geographic classification,22 namely: East/Southeast Asia, Europe and Central Asia, Latin America and the Caribbean, Middle East and North Africa, Oceania, and Sub-Saharan Africa (full definitions provided in Appendix 4). Country-specific sampling methods for these surveys are provided in Appendix 5.
Study population
Our study population included participants aged 25 years and older. We chose this age threshold given that 25 years was the minimum age for inclusion for many of the surveys used in this analysis. Survey-specific age ranges are included in Appendix 5. Our analysis was restricted to the 685,616 individuals with complete data on the outcome (diabetes), exposure (BMI), and covariates (sex and age). A participant flow diagram is shown in Appendix 3. Overall, 12.6% of participants were missing a glucose measurement, an additional 0.8% were missing BMI, and another 0.1% were missing age or sex (total missingness of 13.5%). We provide a table in Appendix 12 that shows there were no differences in sociodemographic characteristics or BMI distribution among those with and without a glucose measurement. While we conducted a complete-case analysis, we also provide a sensitivity analysis in which we impute BMI, sex, and age. We find that multiple imputation of these covariates does not alter the main results (Appendix 20).
Diabetes biomarkers
A diabetes biomarker was available for all the surveys included in this study. The diabetes biomarker used in 47 of the 58 included surveys was a point-of-care fasting capillary glucose (Appendix 6). Plasma equivalents were provided by all but eight of these surveys. For these eight, we multiplied capillary glucose values by 1.11 so that all values were reported in plasma equivalents. This adjustment was based on published guidelines and evidence that has shown that capillary glucose often underestimates plasma glucose levels.23 No differences were observed in sensitivity analyses that assumed that all point-of-care glucose measuring devices had a built-in plasma equivalent (Appendices 29 and 39). For the 12 surveys that did not provide details regarding which glucose measuring device was used, we assumed point-of-care fasting capillary glucose since this was the most frequently used device across surveys (no plasma equivalent was computed given lack of information). For four of the 58 study surveys (Bangladesh, Costa Rica, Iraq, and Lebanon) a laboratory-based measurement of fasting plasma glucose was the only diabetes biomarker used. For four surveys, only HbA1c was available (Fiji, Indonesia, Mexico, and South Africa), and five surveys used both HbA1c and fasting plasma glucose (China, Guyana, Iran, Romania, and Seychelles). Where fasting status of participants was unreported, fasting was assumed because all but one survey protocol (India National Family and Health Survey) requested fasting status. No differences were observed in sensitivity analyses in which we assumed that participants missing fasting status were not fasting. All surveys except India required a minimum of 8 hours of fasting, which was defined as nothing to eat or drink, other than water. Details on fasting instructions for each survey are provided in Appendix 7.
Definitions of diabetes and body mass index
The presence of diabetes was determined based on the current WHO diagnostic thresholds as any of the following: a fasting plasma glucose of 7.0 mmol/L (126 mg/dL) or higher; a random plasma glucose of 11.1 mmol/L (200 mg/dL) or higher; or an HbA1c of 6.5% or higher.24 For individuals in surveys that had both fasting plasma glucose and HbA1c available (China, Guyana, Iran, Romania, and Seychelles), the presence of diabetes was determined by HbA1c levels. No differences were observed in a sensitivity analysis that defined diabetes as a fasting blood glucose of 7.0 mmol/L or higher in the presence of an HbA1c <6.5% (Appendices 31 and 41). Respondents who self-reported use of diabetes medication were classified as having diabetes irrespective of biomarker values. Individuals who self-reported a diagnosis of diabetes but were not on diabetes medications and did not meet the biomarker diagnostic criteria were not classified as having diabetes. No differences were observed when restricting the study sample to individuals with diabetes not on pharmacologic treatment (Appendices 30 and 40). For the STEPS and DHS surveys, which make up most of the surveys in our study, height was measured once in a standing position using a portable height measuring board such as from SECA or Shorr Productions.25,26 Weight was measured using a portable weighting scale, such as a SECA scale or the Tanita HS301 Solar Scale.25,26 We defined BMI as weight (measured in kg) divided by height (measured in meters) squared, and classified BMI into the following clinical categories proposed by the WHO: underweight (<18.5 kg/m2), normal (18.5 – 22.9 kg/m2), upper normal (23.0–24.9 kg/m2), overweight (25.0– 29.9 kg/m2), and obesity (≥30.0 kg/m2).27 Given that the WHO BMI threshold recommendation for defining overweight among Asian populations is ≥23 kg/m2 14 and since there is no standard nomenclature for the >23.0 kg/m2-24.9kg/m2 range, we termed this category “upper normal” in order to understand the relationship between BMI and diabetes risk across the full range of BMI in all geographic regions. More granular obesity categories were considered in a supplementary analysis (Appendix 38).
Covariates
We included age (continuous) as a covariate and stratified all analyses by sex. In supplementary analyses, we also considered educational attainment (57/58surveys; N=681,932) and household wealth quintiles (49/58 surveys; N=629,066) as covariates for the respective subsamples of countries with data on these variables. Further details on the construction and harmonization of household wealth quintiles are provided in Appendix 8.
Statistical analysis
Our analysis proceeded in four steps. First, we calculated generalized additive models (GAMs) of BMI as a continuous variable and the proportion of people with diabetes, stratified by sex and world region. We also stratified the GAMs by ten-year age groups in order to account for different age structures of the observed world regions (Appendix 17). GAMs allow for a nonlinear association between exposure and outcome and generate smoothened plots. Second, we conducted multivariable Poisson regression analyses to examine the relationship between BMI as a continuous variable and diabetes, adjusted for age and stratified by sex. Univariate and logistic regression models were also estimated and presented in the Appendix. Third, we used the same modeling approach as above but included BMI as a categorical variable in order to allow for a more granular assessment of the adjusted relationship between BMI and diabetes. We conducted all regression analyses in the pooled sample overall, and separately, stratified by geographic region, and by country. All regression analyses included country fixed effects to account for unmeasured differences between countries, including data source (STEPS vs. non-STEPS survey). Our data were modelled with a robust error structure, and standard errors adjusted for clustering at the primary sampling unit and country level. As a fourth and final step, we created receiver operating characteristics (ROC) curves for BMI as a classifier for diabetes status by sex and world region. This allowed us to compare the performance of BMI as a predictor of diabetes risk across regions, and to determine ‘optimal’ binary cut-offs for diabetes risk. Optimal cut-offs were defined as the BMI level which maximizes the Youden Index (which equals the sum of sensitivity and specificity minus 1). We show sensitivity and specificity at optimal and additional binary BMI cut-offs (23, 25, and 30 kg/m2). In all regression and ROC analyses, we scaled sample weights such that countries were weighted equally. The rationale behind this was to prevent surveys with a large sample size (particularly the India National Family and Health survey) from ‘overshadowing’ results for all world regions and the pooled sample. As such, the India survey contributes equally to the analysis despite its large sample size. Descriptive statistics were calculated using sampling weights that we re-scaled inversely to sample size. Supplementary analyses were conducted using continuous biomarkers (blood glucose or HbA1c) as the outcome of interest (Appendix).
Sensitivity analyses
We subjected our results to several robustness checks. First, given the large effect of age on diabetes status, we added quadratic and cubic terms in age to our main model to account for possible nonlinearities in the relationship of age and diabetes (Appendices 25 and 36). Second, as socioeconomic status might influence diabetes risk independent of BMI,17 we added educational attainment and wealth quintiles to our main model (Appendix). Third, as an alternative to weighing countries equally, we ran our analysis weighing countries proportional to their respective population size (Appendices 27 and 37). Lastly, we modified the specifications of our outcome variable by classifying individuals with self-reported diabetes diagnosis but normal biomarker values (0.6% of the sample) as having diabetes (Appendices 24 and 35).
Role of the funding source
The funders of the study had no role in study design, data collection, data analysis, data interpretation, or writing of the manuscript. The corresponding author had full access to the data and had final responsibility for the decision to submit for publication.
RESULTS
Survey and sample characteristics
The survey characteristics are summarized in Table 1. The final study sample included 685,616 individual participants in 57 LMICs. The mean age of the overall sample was 42.6 years (SD 12.7); 52.8% were female (weighted sample). The average response rate across surveys was 86.2%. Characteristics of the sample population (overall) and country-level demographic characteristics of all the surveys in the study sample are included in Appendices 9 and 11. The rural composition in the study sample was 53.9% (rural-urban variable only available for 38/58 surveys). Overall, the prevalence of overweight was 27.2% (95% CI: 26.6, 27.8), of obesity 21.0% (95% CI: 19.6, 22.5), and of diabetes 9.3% (95% CI: 8.4, 10.2). Compared to individuals without diabetes, a higher proportion of individuals with diabetes had overweight (31.6% vs 26.8%, p<0.001) and obesity (41.4% vs 19.0%, p<0.001).
Table 1.
Characteristics of population-based surveys conducted in 57 LMICs between 2008 and 2016, by geographic classification
| Country | Survey type | Survey year | Response rate, % | Sample size | Mean age, years (SD) | Age range, years | Female, % | Mean BMI, kg/m2 (SD) | Diabetes prevalence, % |
|---|---|---|---|---|---|---|---|---|---|
| Latin America and the Caribbean | |||||||||
| Chile | Non-STEPS | 2009–10 | 85 | 4,049 | 47.7 (14.8) | 25–100 | 51.8 | 28.0 (5.1) | 9.7 |
| Costa Rica | STEPS | 2010 | 87.8 | 2,234 | 47.1 (15.5) | 25–104 | 50.4 | 27.6 (6.0) | 11.6 |
| Ecuador | STEPS | 2018 | 69.5 | 3,337 | 44.6 (12.4) | 25–69 | 51.7 | 27.9 (4.8) | 9.1 |
| Guyana | STEPS | 2016 | 66.7 | 784 | 42.2 (11.9) | 25–69 | 53.0 | 27.6 (6.8) | 20.1 |
| Mexico | Non-STEPS | 2009–12 | 90 | 7,002 | 54.3 (14.0) | 25–99 | 66.6 | 28.8 (5.5) | 34.4 |
| SVG | STEPS | 2013 | 67.8 | 886 | 42.8 (12.2) | 25–69 | 56.9 | 28.0 (6.3) | 11.2 |
| Europe and Central Asia | |||||||||
| Azerbaijan | STEPS | 2017 | ·· | 2,325 | 43.0 (12.1) | 25–69 | 50.6 | 27.2 (5.1) | 8.3 |
| Belarus | STEPS | 2016 | 87.1 | 4,418 | 45.9 (12.5) | 25–69 | 52.4 | 27.5 (5.3) | 5.2 |
| Georgia | STEPS | 2016 | 75.7 | 2,907 | 46.3 (12.7) | 25–70 | 53.0 | 29.0 (6.3) | 6.4 |
| Kyrgyzstan | STEPS | 2013 | 100 | 2,475 | 40.8 (11.5) | 25–64 | 48.3 | 26.6 (5.3) | 5.4 |
| Moldova | STEPS | 2013 | 83.5 | 3,231 | 43.8 (12.3) | 25–69 | 50.6 | 27.5 (5.5) | 7.0 |
| Mongolia | STEPS | 2013 | 97.4 | 1,855 | 42.6 (9.1) | 25–64 | 51.4 | 27.2 (5.3) | 4.7 |
| Romania | Non-STEPS | 2015–16 | 69.1 | 1,775 | 51.6 (15.7) | 25–80 | 52.5 | 28.7 (5.7) | 11.3 |
| Tajikistan | STEPS | 2016 | 94 | 2,155 | 36.4 (11.6) | 25–70 | 43.2 | 25.9 (4.7) | 1.9 |
| East and Southeast Asia | |||||||||
| Bangladesh | STEPS | 2018 | 84.6 | 6,155 | 41.9 (11.3) | 25–69 | 52.6 | 23.0 (4.3) | 9.6 |
| Bhutan | STEPS | 2014 | 96.9 | 2,400 | 40.1 (11.2) | 25–69 | 41.7 | 24.2 (3.7) | 2.5 |
| Cambodia | STEPS | 2010 | 92 | 5,097 | 40.4 (10.8) | 25–64 | 51.1 | 21.8 (3.3) | 2.4 |
| China | Non-STEPS | 2009 | 88 | 8,001 | 52.5 (13.8) | 25–99 | 53.4 | 23.5 (3.5) | 8.5 |
| India | Non-STEPS | 2015–16 | 96 | 490,532 | 37.0 (7.9) | 25–54 | 46.6 | 22.8 (4.3) | 4.9 |
| Indonesia | Non-STEPS | 2014 | 83 | 5,345 | 44.4 (13.6) | 25–101 | 51.9 | 23.6 (4.4) | 8.1 |
| Laos | STEPS | 2013 | 99.2 | 2,099 | 42.4 (10.8) | 25–65 | 58.4 | 23.1 (4.1) | 5.6 |
| Myanmar | STEPS | 2014 | 90 | 7,725 | 41.8 (11.0) | 25–64 | 49.2 | 22.7 (4.5) | 6.4 |
| Nepal | STEPS | 2019 | 86.4 | 4,488 | 40.7 (12.4) | 25–69 | 53.1 | 23.3 (4.1) | 7.1 |
| Timor Leste | STEPS | 2014 | 96.3 | 1,993 | 44.4 (12.7) | 25–69 | 56.2 | 21.3 (3.9) | 3.0 |
| Vietnam | STEPS | 2015 | 79.8 | 2,763 | 42.8 (12.0) | 25–69 | 50.6 | 22.3 (3.2) | 3.1 |
| Sub-Saharan Africa | |||||||||
| Benin | STEPS | 2015 | 98.6 | 4,032 | 39.0 (11.1) | 25–69 | 53.7 | 23.4 (4.6) | 6.6 |
| Botswana | STEPS | 2014 | 63 | 2,559 | 39.2 (11.7) | 25–69 | 48.7 | 24.2 (5.8) | 3.8 |
| Burkina Faso | STEPS | 2013 | 97.8 | 3,935 | 39.3 (10.9) | 25–64 | 53.1 | 22.4 (4.0) | 2.8 |
| Comoros | STEPS | 2011 | 96.5 | 2,359 | 41.5 (11.4) | 25–64 | 73.9 | 26.0 (5.9) | 4.2 |
| Eritrea | STEPS | 2010 | 97 | 5,518 | 43.5 (12.7) | 25–74 | 80.8 | 20.4 (4.0) | 3.6 |
| Eswatini | STEPS | 2014 | 81.8 | 1,812 | 40.5 (12.1) | 25–70 | 56.0 | 27.3 (6.6) | 6.6 |
| Kenya | STEPS | 2015 | 95 | 3,287 | 39.1 (11.6) | 25–69 | 50.5 | 23.6 (5.1) | 2.4 |
| Lesotho | STEPS | 2012 | 80 | 1,958 | 38.0 (11.0) | 25–64 | 50.1 | 25.8 (7.2) | 2.8 |
| Liberia | STEPS | 2011 | 87.1 | 1,566 | 37.6 (10.0) | 25–64 | 54.0 | 26.9 (7.4) | 13.2 |
| Malawi | STEPS | 2009 | 95.5 | 2,903 | 38.6 (11.0) | 25–64 | 50.1 | 23.1 (3.9) | 0.9 |
| Namibia | Non-STEPS | 2013 | 96.9 | 3,250 | 46.8 (8.3) | 25–64 | 60.3 | 24.8 (6.2) | 6.1 |
| Rwanda | STEPS | 2012 | 99 | 5,214 | 38.6 (10.5) | 25–64 | 53.2 | 22.6 (3.5) | 1.6 |
| Sao Tome and Principe | STEPS | 2009 | 95 | 1,990 | 39.8 (11.3) | 25–64 | 52.4 | 24.7 (5.6) | 2.9 |
| Seychelles | STEPS | 2013 | 73 | 1,239 | 42.6 (10.5) | 25–64 | 49.9 | 27.8 (6.0) | 19.1 |
| South Africa | Non-STEPS | 2012 | 92.6 | 3,201 | 43.8 (14.2) | 25–97 | 52.9 | 27.7 (7.2) | 13.2 |
| Sudan | STEPS | 2015 | 88 | 5,273 | 40.0 (11.5) | 25–70 | 46.1 | 23.7 (5.3) | 8.4 |
| Tanzania | STEPS | 2012 | 94.7 | 4,696 | 38.9 (10.8) | 25–65 | 50.4 | 22.9 (4.7) | 2.8 |
| Togo | STEPS | 2010 | 91 | 2,567 | 38.9 (11.0) | 25–64 | 51.6 | 23.5 (4.6) | 3.3 |
| Uganda | STEPS | 2014 | 99 | 2,562 | 40.2 (11.4) | 25–69 | 56.9 | 22.9 (4.5) | 1.7 |
| Zambia | STEPS | 2017 | 74 | 2,534 | 39.2 (11.1) | 25–69 | 50.1 | 23.6 (5.0) | 8.3 |
| Zanzibar | STEPS | 2011 | 97.6 | 2,252 | 38.8 (10.1) | 25–64 | 51.1 | 24.3 (5.4) | 3.5 |
| Middle East and North Africa | |||||||||
| Algeria | STEPS | 2016 | ·· | 5,140 | 41.9 (11.6) | 25–69 | 48.7 | 27.1 (5.4) | 11.5 |
| Iran | STEPS | 2016 | 99 | 18,885 | 47.6 (14.7) | 25–100 | 54.1 | 27.1 (5.0) | 11.3 |
| Iraq | STEPS | 2015 | 93 | 3,166 | 42.6 (14.1) | 25–102 | 48.2 | 29.5 (6.4) | 18.9 |
| Lebanon | STEPS | 2017 | 65.9 | 1,032 | 43.3 (11.4) | 25–69 | 51.9 | 28.0 (5.4) | 12.7 |
| Morocco | STEPS | 2017 | 89 | 4,180 | 46.1 (14.9) | 25–100 | 50.8 | 26.6 (5.3) | 13.7 |
| Oceania | |||||||||
| Fiji | Non-STEPS | 2009 | 80 | 1,324 | 55.5 (10.5) | 25–90 | 57.2 | 29.0 (5.9) | 42.8 |
| Kiribati | STEPS | 2015 | 55 | 956 | 43.1 (11.6) | 25–69 | 57.5 | 30.7 (6.3) | 20.9 |
| Marshall Islands | STEPS | 2017 | 92.3 | 2,269 | 42.5 (12.1) | 25–86 | 52.5 | 30.5 (6.8) | 31.2 |
| Samoa | STEPS | 2013 | 64 | 1,187 | 41.2 (10.9) | 25–64 | 49.9 | 33.4 (7.4) | 24.6 |
| Solomon Islands | STEPS | 2015 | 58.4 | 1,467 | 41.5 (11.2) | 25–71 | 51.8 | 27.3 (5.4) | 5.4 |
| Timor Leste | STEPS | 2014 | 96.3 | 1,993 | 44.4 (12.7) | 25–69 | 56.2 | 21.3 (3.9) | 3.0 |
| Tuvalu | STEPS | 2015 | 76 | 832 | 43.6 (12.4) | 25–69 | 45.9 | 33.4 (6.7) | 11.9 |
| World (all data) | ·· | 2009–2019 | 76.9 | 685,616 | 42.6 (12.6) | 25–104 | 52.8 | 25.8 (6.1) | 9.3 |
Notes: Survey year and response rate shown for the complete study population of each survey. Other characteristics calculated among individuals that met our inclusion criteria. Mean age, % female, % per education category (no formal schooling; completed primary school; secondary school or above), mean BMI, and diabetes prevalence calculated using re-scaled sampling weights. Abbreviations: SVG: Saint Vincent and the Grenadines. Details on non-STEPS surveys included in the study are provided in Appendix 2.
Generalized additive models of BMI and diabetes by sex and geographic region
Figure 1 illustrates the GAMs of the association between BMI and diabetes, stratified by sex, and geographic region. The proportion of people with diabetes at any given BMI was generally greater for men than women, particularly at higher BMI levels. The proportion of people with diabetes was generally highest at any given BMI in Latin America and the Caribbean and Oceania for both men and women. When stratified by ten-year age categories, the proportion of people with diabetes was generally greater with each increasing age category and greatest for the age 54 and over category among both sexes (Appendix 17). However, the proportion of people with diabetes with BMI levels of 30 and greater rose steeply in the 25–34 age group for men in Sub-Saharan Africa and across almost all regions in the 35 year and older groups.
Figure 1.
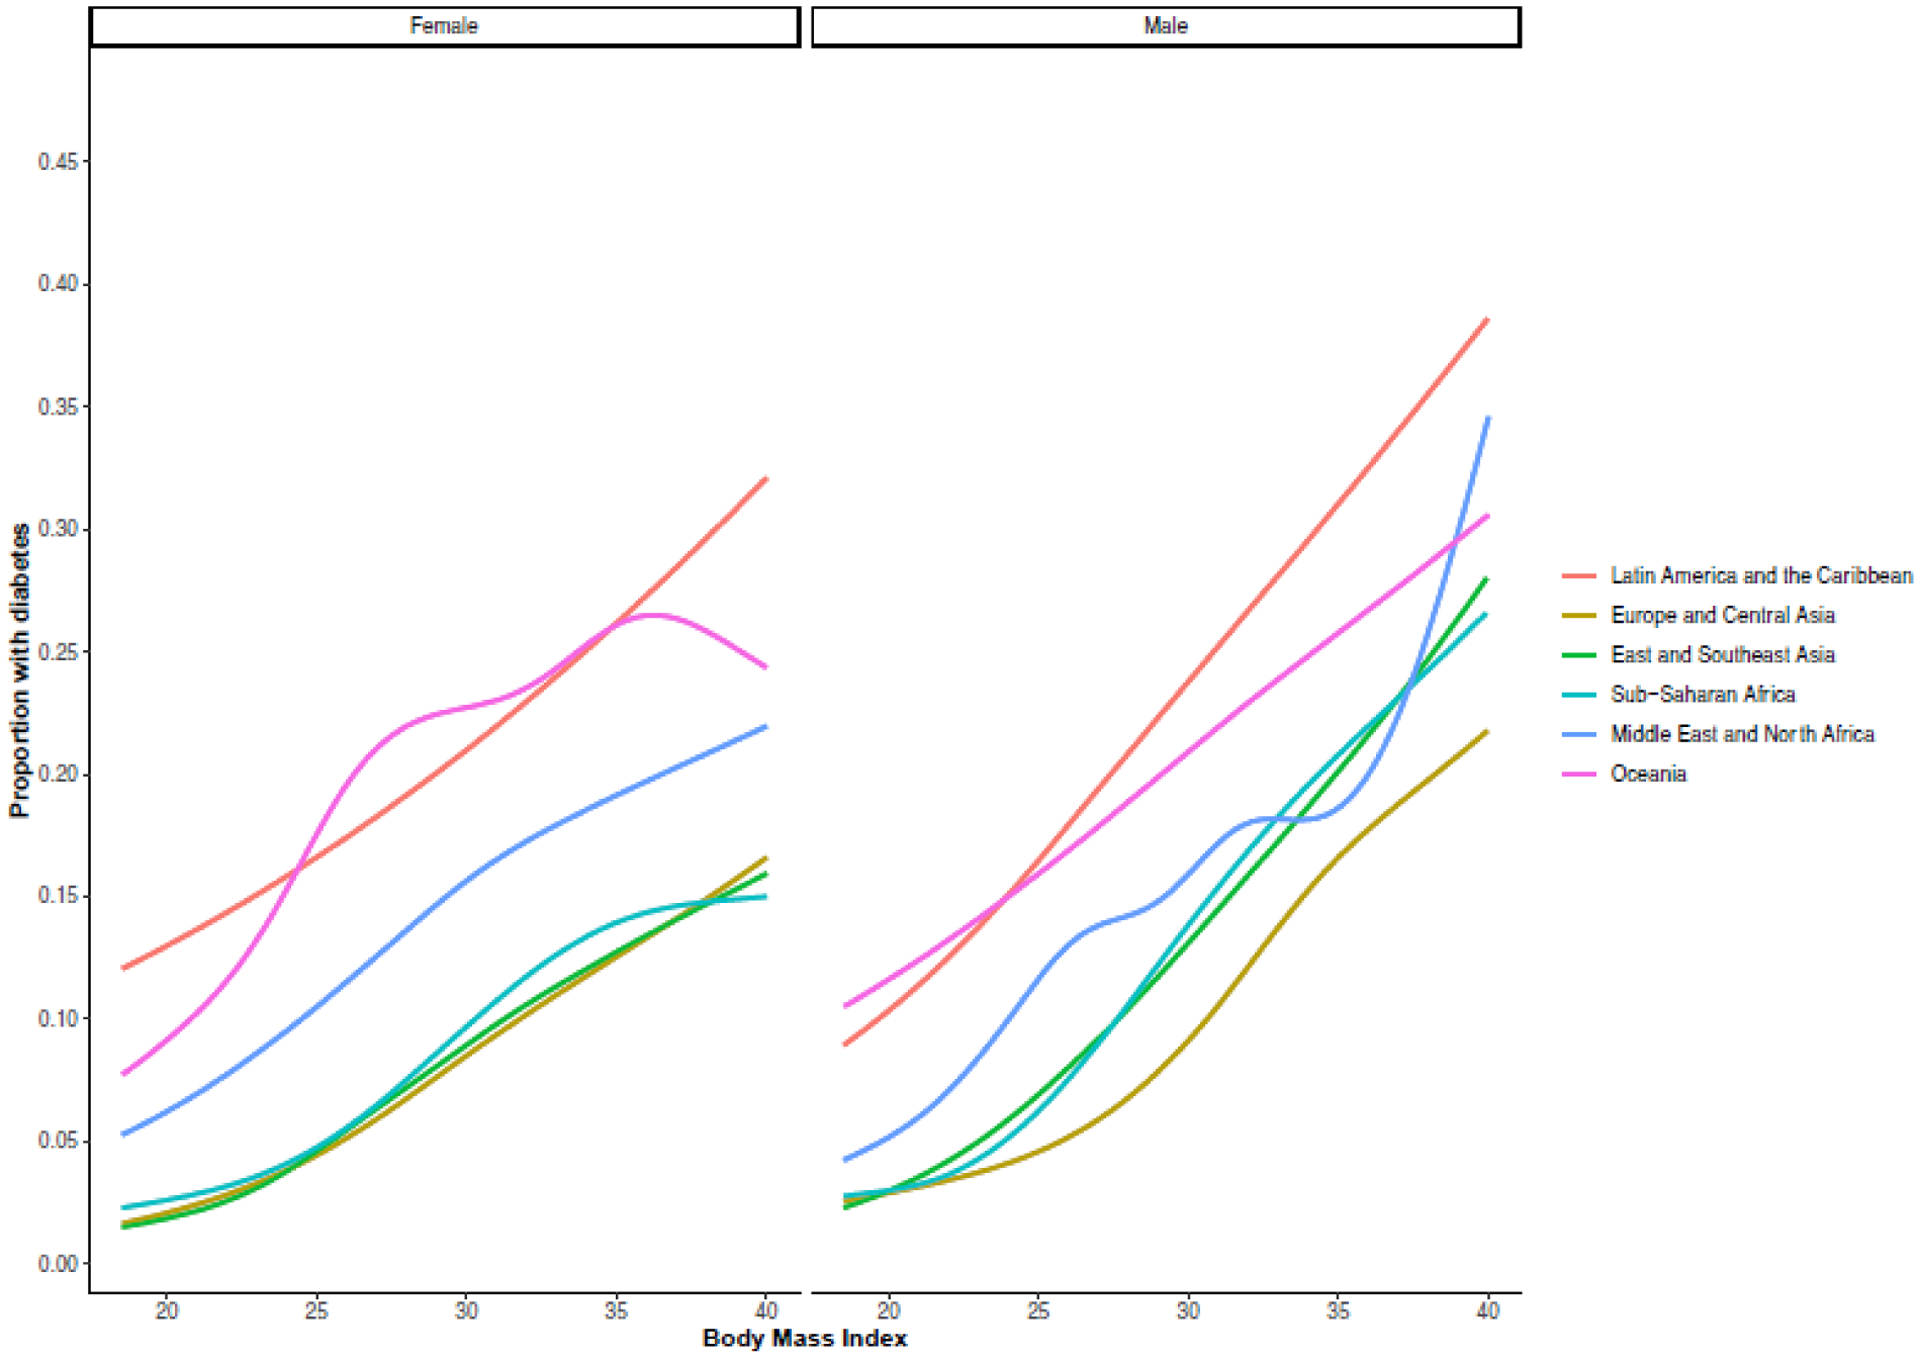
Geographic region-sex stratified generalized additive models of body mass index and diabetes in 57 low- and middle-income countries
Notes: Figure shows generalized additive models of body mass index and proportion with diabetes for women (left panel) and men (right panel). All analyses were stratified by world regions. Grey areas represent 95% confidence intervals.
Multivariable regression models of categorical BMI and diabetes risk by sex, geographic region, and country
In the pooled sample across all 58 surveys, the risk of diabetes was higher for men than for women (RR 1.05 [1.04–1.06] vs. 1.04 [95% CI: 1.03–1.04]) (Appendix 18). When stratified by BMI category and geographic region, the highest risk of diabetes among individuals in the upper normal BMI category compared with normal BMI was seen in the East/Southeast Asia (1.90 [1.62–2.23] for males, 1.53 [1.33–1.76] for females) and in the Middle East and North Africa regions (1.77 [1.43–2.20] for males; 1.44 [1.10–1.88] for females) (Figure 2). The highest risk of diabetes among individuals in the overweight BMI category compared with normal BMI was seen in East/Southeast Asia (2.84 [2.44–3.30] for males; 2.18 [1.94–2.45] for females). The highest risk of diabetes among individuals with obesity was seen in East/Southeast Asia (3.93 [3.18–4.86] for males; 3.18 [2.77–3.64] for females) and in Sub-Saharan Africa (3.46 [2.98–4.02] for males; 2.49 [2.17–2.64] for females). When BMI categories were further stratified into a BMI ≥ 35 kg/m2, the highest risk of diabetes was seen in East/Southeast Asia for females and in Sub-Saharan Africa for males (Appendix 38). Sensitivity analyses including age polynomials as well as adjustment for education and wealth did not appreciably change the results (Appendix). In country-level sex-stratified multivariable Poisson regression models with BMI as a continuous variable, the highest risk of diabetes per every kg/m2 gain in BMI was seen in Bhutan (RR 1.16 [95% CI: 1.10–1.24]) for females and in Cambodia for males (RR 1.19 [95% CI: 1.11–1.29]) (Appendix 15).
Figure 2.
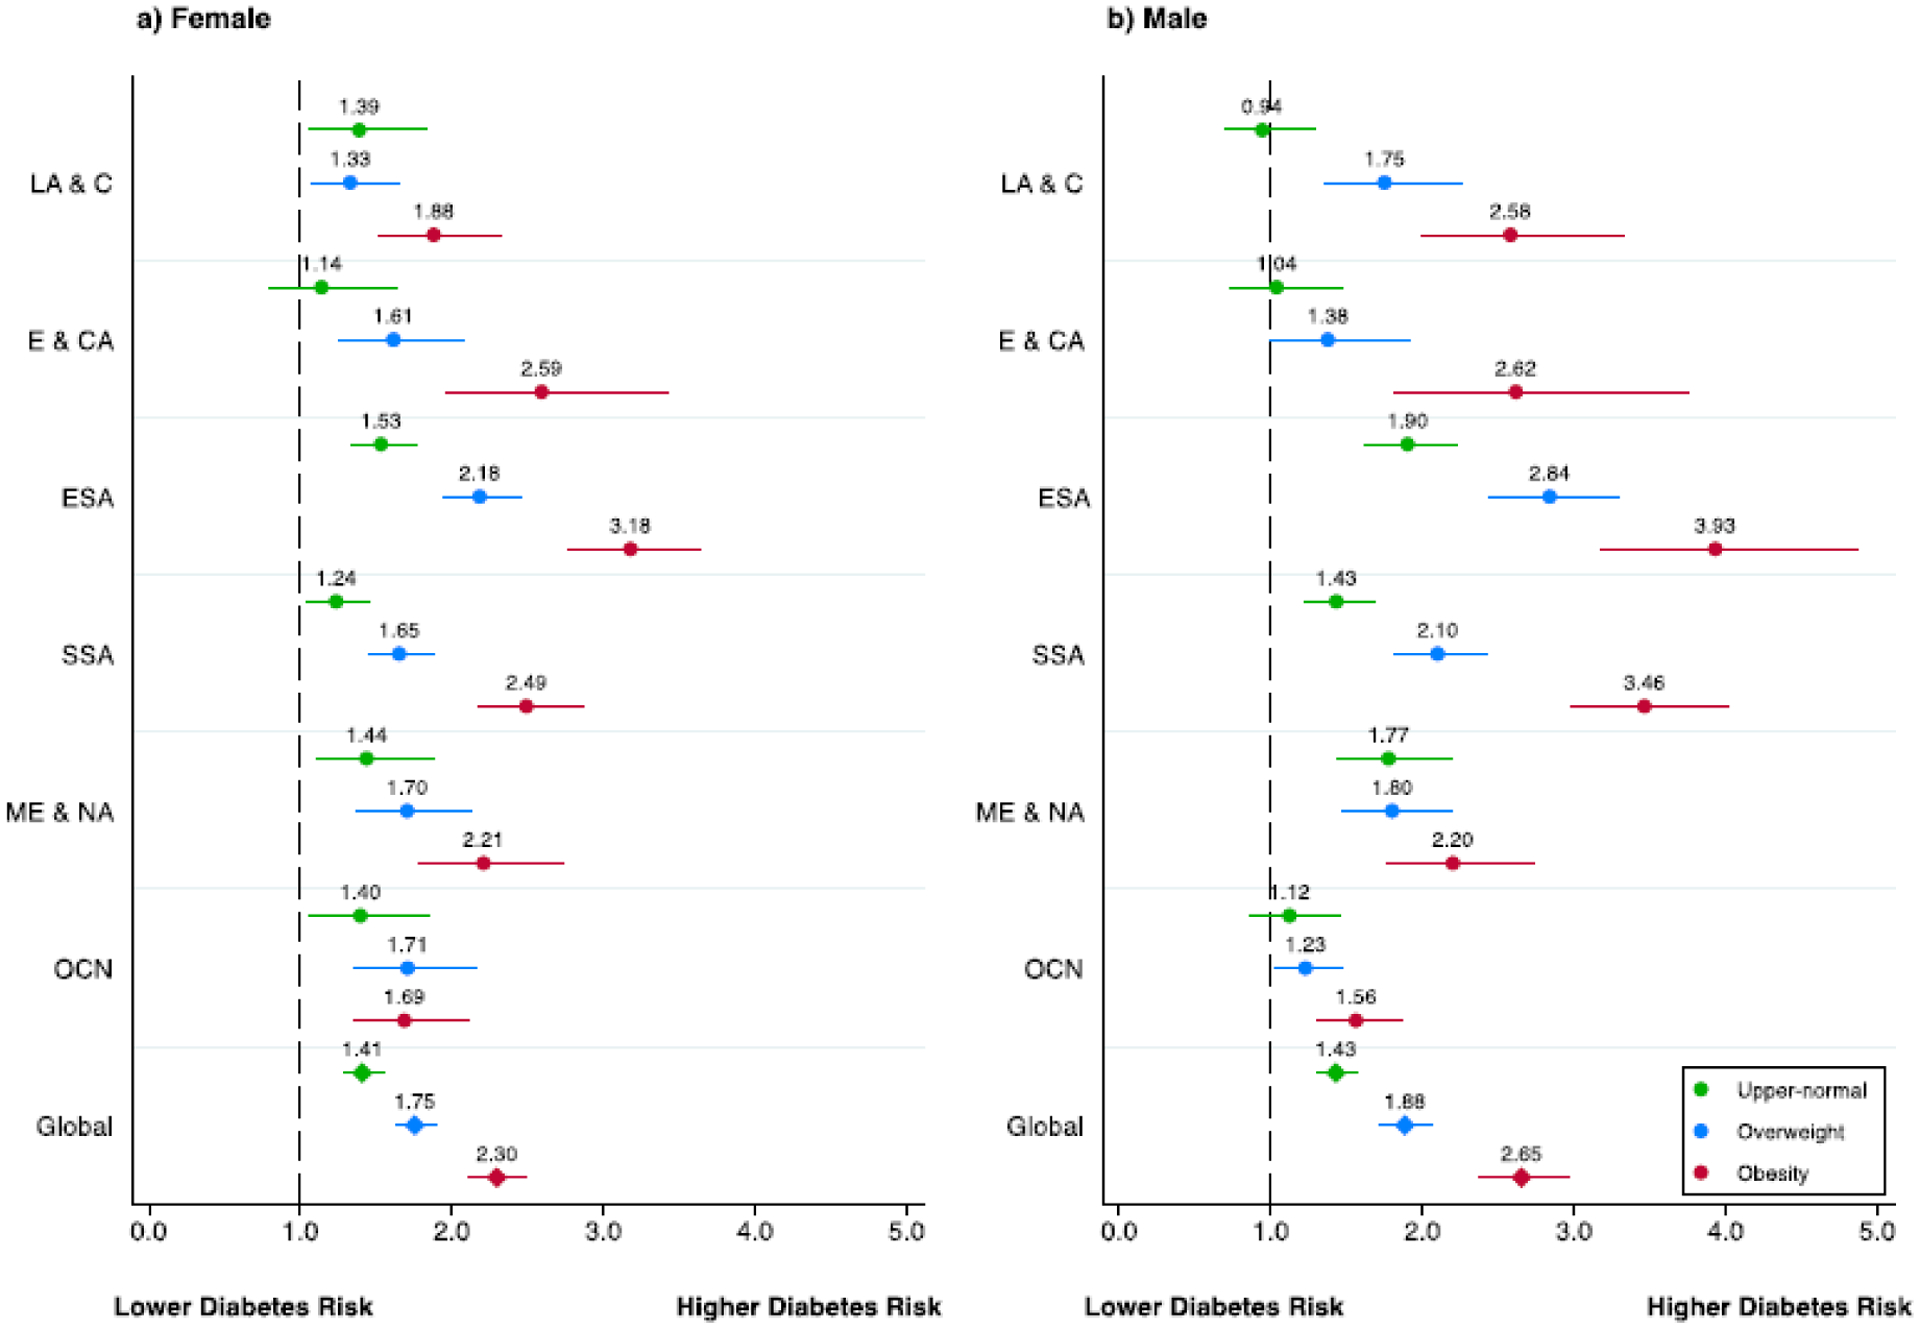
Geographic region-sex stratified risk ratios of body mass index categories and diabetes in 57 low- and middle-income countries
Notes: Figure shows adjusted risk ratios from multivariable Poisson regression models in the pooled sample and by world region, separately for women (left panel) and men (right panel). The outcome was diabetes based on measured biomarkers and the exposure measured body-mass index (BMI) grouped into five categories: underweight (<18.5 kg/m2; not displayed), normal (18.5 to <23 kg/m2; reference category), upper-normal (23 to <25 kg/m2), overweight (25 to <30 kg/m2), and obese (>30 kg/m2). All models controlled for age (years) and included country-level fixed effects. Error bars represent 95% confidence intervals.
ROC curves of BMI as a classifier for diabetes risk
Figure 3 illustrates the ROC curves for BMI and diabetes risk, according to sex and geographic region. East/Southeast Asia, Eastern Europe and Central Asia, and Sub-Saharan Africa had the largest area under the curve. The ROC-derived cut-offs are shown in Table 2, according to sex and geographic region. Optimal cut-offs as estimated by maximizing the Youden index were lowest in East/Southeast Asia for females (23.9 kg/m2) and males (23.8 kg/m2) as well as in the Middle East and North Africa for males (24.2 kg/m2). BMI cut-offs were highest in Latin America and the Caribbean and Middle East and North Africa for females (28.3 kg/m2) and in Europe and Central Asia for men (27.6 kg/m2).
Figure 3.
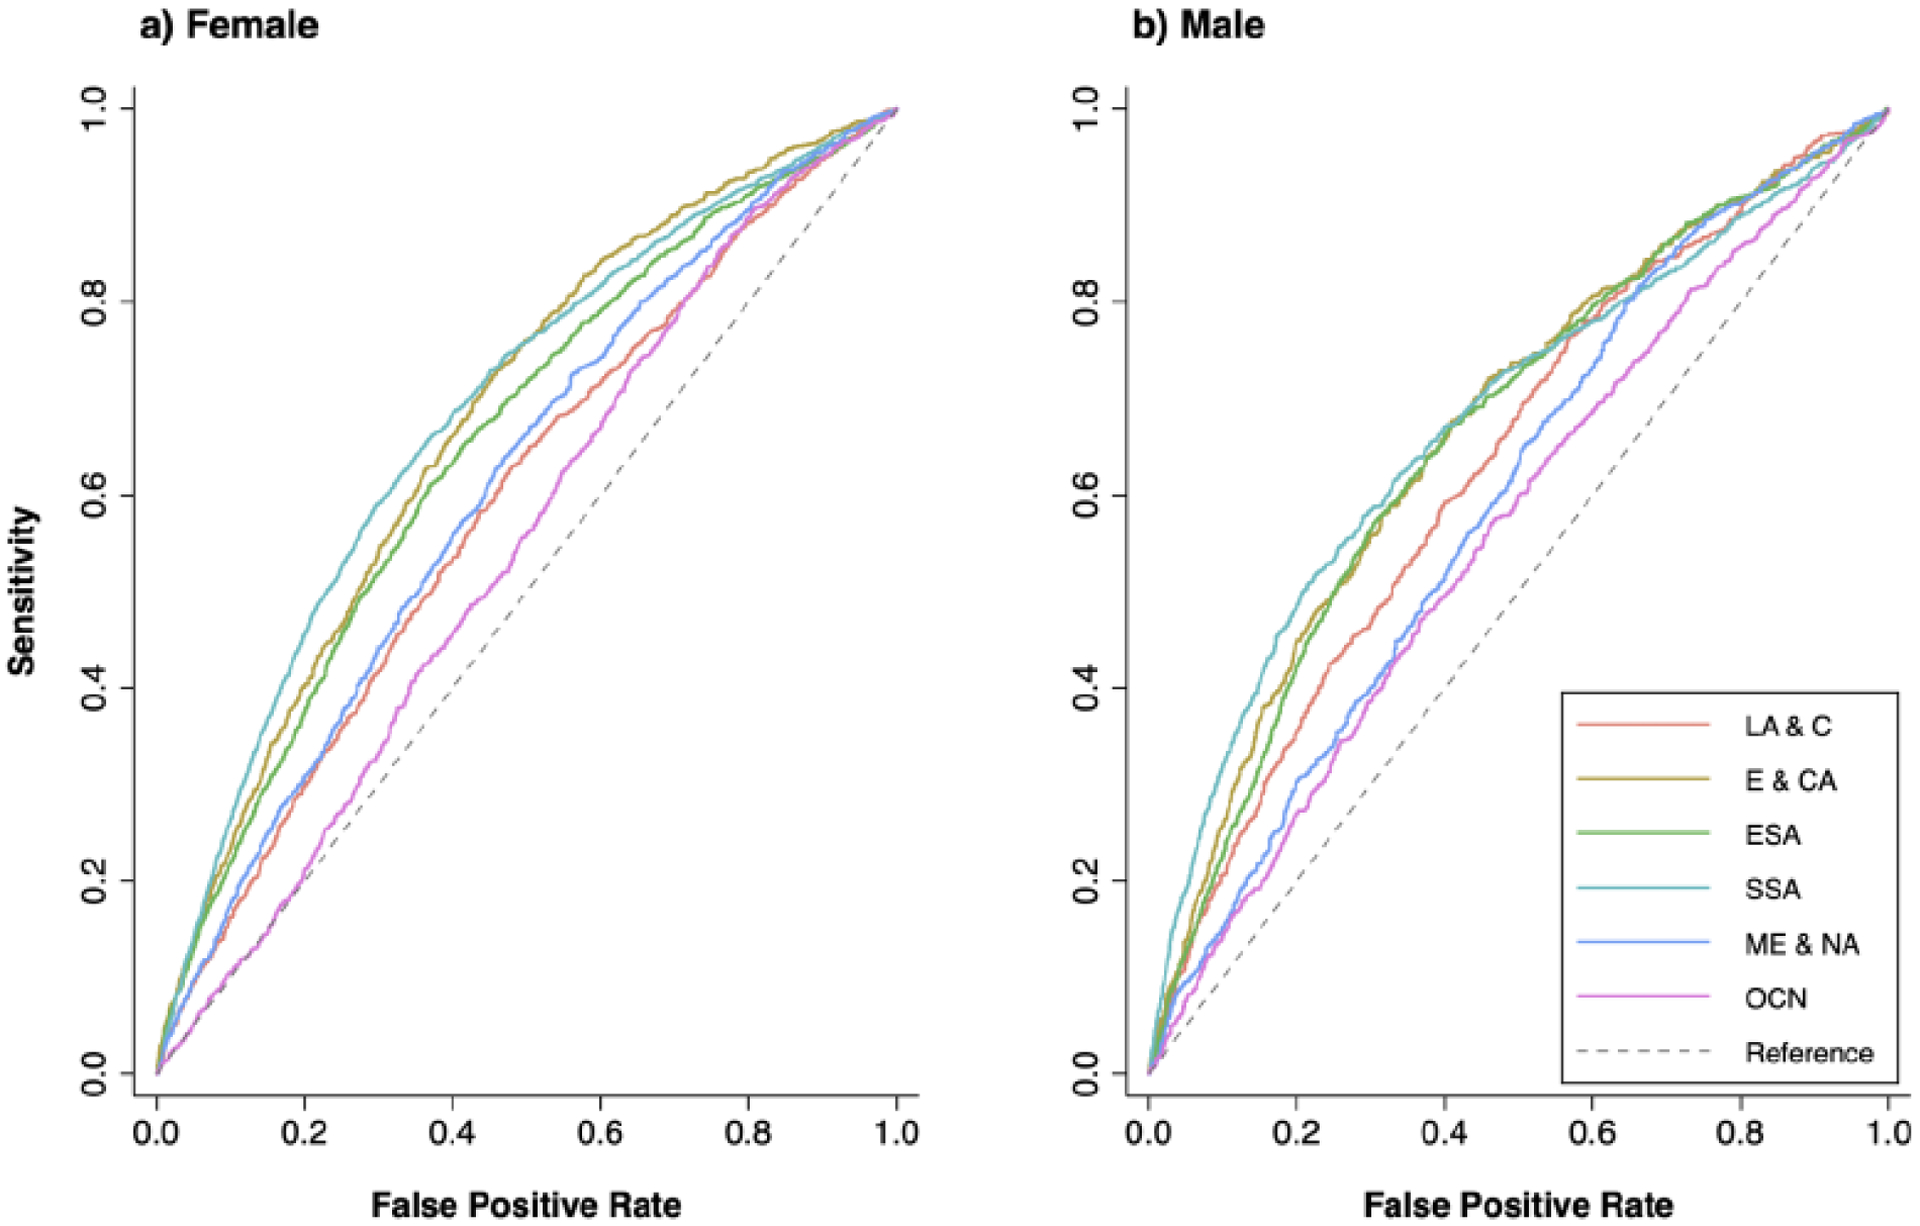
Geographic region-sex stratified ROC curves for body mass index and diabetes in 57 low- and middle-income countries
Notes: Figure shows receiver operating characteristic (ROC) curves of BMI as a classifier for diabetes. Analysis stratified by sex and world region. Each country was weighed equally. Geographic region abbreviations: Latin America and the Caribbean (LA & CA), Europe and Central Asia (E & CA), East/Southeast Asia (ESA), Sub-Saharan Africa (SSA), Middle East and North Africa (ME & NA), and Oceania (OCN).
Table 2.
BMI cut-offs for diabetes risk in 57 LMICs, according to geographic region and sex
| Women | Men | |||||||||
|---|---|---|---|---|---|---|---|---|---|---|
| AUC | BMI cut-off | Sensitivity (%) | Specificity (%) | Youden Index | AUC | BMI cut-off | Sensitivity (%) | Specificity (%) | Youden Index | |
| Latin America and the Caribbean | 0.59 | 0.63 | ||||||||
| Optimal cut-off | 28.3 | 62.8 | 52.1 | 15.0 | 25.3 | 76.3 | 43.2 | 19.5 | ||
| 23.0 | 91.5 | 15.2 | 6.7 | 23.0 | 87.5 | 22.6 | 10.0 | |||
| 25.0 | 80.7 | 28.0 | 8.6 | 25.0 | 78.0 | 40.6 | 18.6 | |||
| 30.0 | 49.4 | 63.6 | 13.1 | 30.0 | 34.0 | 81.2 | 15.2 | |||
| Europe and Central Asia | 0.68 | 0.67 | ||||||||
| Optimal cut-off | 28.0 | 73.0 | 54.0 | 27.0 | 27.6 | 67.7 | 59.1 | 26.7 | ||
| 23.0 | 93.4 | 19.7 | 13.1 | 23.0 | 90.6 | 20.1 | 10.6 | |||
| 25.0 | 87.1 | 33.3 | 20.4 | 25.0 | 81.8 | 36.5 | 18.3 | |||
| 30.0 | 59.3 | 66.0 | 25.2 | 30.0 | 48.7 | 76.4 | 25.1 | |||
| East and Southeast Asia | 0.65 | 0.66 | ||||||||
| Optimal cut-off | 23.9 | 61.0 | 63.0 | 24.1 | 23.8 | 57.1 | 69.6 | 26.6 | ||
| 23.0 | 68.1 | 54.2 | 22.3 | 23.0 | 63.9 | 62.1 | 26.0 | |||
| 25.0 | 50.5 | 71.3 | 21.8 | 25.0 | 42.3 | 79.9 | 22.2 | |||
| 30.0 | 15.8 | 93.8 | 9.6 | 30.0 | 8.5 | 97.0 | 5.5 | |||
| Sub-Saharan Africa | 0.68 | 0.68 | ||||||||
| Optimal cut-off | 27.3 | 58.9 | 70.4 | 29.3 | 25.4 | 50.9 | 78.4 | 29.3 | ||
| 23.0 | 80.1 | 42.7 | 22.8 | 23.0 | 67.2 | 59.4 | 26.6 | |||
| 25.0 | 70.1 | 57.5 | 27.7 | 25.0 | 52.3 | 76.4 | 28.8 | |||
| 30.0 | 43.8 | 81.0 | 24.8 | 30.0 | 22.2 | 94.0 | 16.2 | |||
| Middle East and North Africa | 0.61 | 0.60 | ||||||||
| Optimal cut-off | 28.3 | 63.8 | 53.0 | 16.9 | 24.2 | 81.7 | 33.8 | 15.5 | ||
| 23.0 | 92.4 | 16.6 | 9.0 | 23.0 | 88.7 | 24.1 | 12.9 | |||
| 25.0 | 83.2 | 29.5 | 12.6 | 25.0 | 72.9 | 40.2 | 13.1 | |||
| 30.0 | 50.3 | 64.4 | 14.7 | 30.0 | 30.7 | 79.4 | 10.2 | |||
| Oceania | 0.55 | 0.56 | ||||||||
| Optimal cut-off | 25.2 | 85.5 | 23.8 | 9.3 | 28.1 | 57.1 | 53.7 | 10.8 | ||
| 23.0 | 93.3 | 13.2 | 6.5 | 23.0 | 87.6 | 17.0 | 4.7 | |||
| 25.0 | 86.0 | 22.8 | 8.8 | 25.0 | 76.4 | 31.2 | 7.5 | |||
| 30.0 | 58.0 | 48.2 | 6.3 | 30.0 | 43.6 | 65.7 | 9.3 |
Notes: Table shows area under the receiver operating characteristic curve as displayed in Figure 3. Additionally, it includes diabetes screening characteristics (sensitivity, specificity, Youden index) of several binary body mass index (BMI) cut-offs for each world region, separately by sex. Optimal BMI cut-offs were defined as the respective BMI value which maximizes the Youden index. Each country was weighed equally. Abbreviations: AUC: area under the curve; BMI: body mass index.
DISCUSSION
In this study of 685,616 individuals across 57 LMICs, we found that an increased risk of diabetes was observed at a BMI of 23 kg/m2 or above, with a corresponding diabetes risk increase of 43% for males and 41% for females when compared to a normal BMI (18.5–22.9 kg/m2). ROC analyses showed variability across sex and geographic regions in the BMI cut-offs at which sensitivity and specificity are optimized for diabetes screening, ranging from a BMI cut-off of 23.8 kg/m2 among males in East/Southeast Asia to a BMI of 28.3 kg/m2 among females in the Middle East and North Africa and in Latin America and the Caribbean. Given that diabetes remains a major challenge for LMICs to reduce premature mortality from NCDs (Sustainable Development Goal 3.4),27 our findings offer critical insight to inform context-specific diabetes screening guidelines.
We also found differences in the risk of diabetes across BMI categories in several regions, particularly among men. For instance, men and women in Sub-Saharan Africa and East/Southeast Asia had more than a 100% increase in the risk of diabetes between the overweight and the obesity category. Additionally, while diabetes increased with older age, the proportion of individuals with diabetes rose steeply across all regions in the 35–44 age group and among men aged 25–34 years in Sub-Saharan Africa. This is consistent with accumulating evidence suggesting that the prevalence of metabolic syndrome is rising rapidly among younger adults in LMICs.28 Although current WHO guidelines29 recommend diabetes screening of asymptomatic adults at age >40 years and whom have a BMI of 25 kg/m2 or greater, our findings suggest that diabetes testing at younger ages in certain LMIC contexts may be considered in order to implement targeted and timely efforts aimed at reducing long-term complications associated with diabetes.
Prior research has shown that the largest loss in the diabetes care continuum in LMICs is at the stage of diagnosis.18 However, efforts to increase diagnosis remain a substantial challenge in resource-limited settings due in part to a lack of clear evidence about who to screen and the need to balance efforts to increase screening and diagnosis with investments that are needed to strengthen diabetes care delivery. This analysis provides the first empiric evidence-base regarding the trade-off between sensitivity and specificity when choosing a BMI-based threshold for diabetes screening across a large sample of LMICs. While lower BMI cut-offs for the detection of metabolic risk have been recommended for Asian populations,14 which is consistent with our findings, we found comparable results in other world regions, such as the Middle East and North Africa. Secondly, the finding that the proportion of people with diabetes with a BMI of 30 kg/m2 or greater increased in certain regions in populations under the age of 40 suggests that any development of screening strategies for diabetes may require not only revisiting existing BMI cut-offs but also the inclusion of younger populations. Lastly, we found that BMI performed modestly overall as a single criterion for determining who to screen for diabetes. Given this, other low-cost anthropometric measures such as waist circumference30 might be explored to further optimize assessment of metabolic risk in these settings.31
Our study has several limitations. First, defining ‘optimal’ binary BMI cut-offs allows comparisons between world regions of the general suitability of BMI as a single predictor of diabetes status (e.g. in the context of diabetes screening). However, while BMI levels that maximize the Youden Index equally weigh in sensitivity and specificity, policymakers searching for optimal BMI levels for diabetes screening might attribute higher priority to either sensitivity or specificity and need to take further context-specific factors into account. Second, the definition of biochemical diabetes was limited to a single glucose measurement in some countries and was based on capillary measurement in the majority of surveys. These measures can either over- or underestimate the true prevalence of diabetes.32 Although we applied the International Federation of Clinical Chemistry’s (IFFC) recommendation on the conversion of capillary glucose to plasma equivalents,23 this conversion does not eliminate the possibility of inaccuracy due to the underlying hematocrit abnormalities, which may be particularly relevant in contexts where anemia or other hematologic disorders are highly prevalent. Third, the definition of diabetes was heterogenous given the lack of standardized biochemical measurement of diabetes across all surveys. Fourth, although we provide BMI cut-offs for diabetes risk, it is important to note that the BMI at the time of the survey among people with diabetes may have been influenced by weight gain or loss associated with diabetes itself or with medications to treat diabetes. However, studies in other contexts suggest that weight change over the first two years following a type 2 diabetes diagnosis is relatively modest.33 Moreover, given that less than 3.3% of people in this study were on pharmacologic treatment, weight fluctuations attributable to diabetes medications seem to be a less important cause for concern in this study population. This is further supported by a sensitivity analysis that limited the outcome of interest to those with untreated diabetes (Appendices 30 and 40). Fifth, guidelines about optimal body weight should be informed by risk of metabolic diseases but also by cardiovascular and other obesity-associated conditions as well as mortality, which were not included in this analysis. Finally, given the observational and cross-sectional design of our study, we report correlation and not causation, though there is very strong biological evidence for the relationship of interest here.
The alarming rise in overweight, obesity, and diabetes in LMICs is a looming health crisis that requires urgent population-level strategies to reverse current and projected trends. In this study of 57 LMICs, we show substantial regional variability in the relationship between BMI and diabetes risk and provide suggested sex- and region- stratified cut-offs for BMI when used as a sole anthropometric measurement to determine who to screen for diabetes. Our findings underscore the critical importance of context-dependent studies in LMICs to inform clinical practice and patient-centered decision making.
Supplementary Material
RESEARCH IN CONTEXT.
Evidence before this study
We searched PubMed using the MeSH advanced search engine with no date restrictions using the terms “body mass index” OR “anthropometric” AND “diabetes” AND “low- and middle-income countries” NOT “comment” NOT “case reports.” Two pooled studies were found on the association between body mass index (BMI) and diabetes: one study pooled nationally representative surveys from six LMICs and evaluated the association between BMI categories and non-communicable disease multimorbidity (nine chronic conditions, including diabetes). The second study pooled data on 900,000 individuals recruited from 18 cohorts across 7 Asian countries and did not include nationally representative data. Several large studies have been published across LMICs on the prevalence and projected trends of overweight, obesity, and diabetes, but none of these studies have evaluated the association between BMI and diabetes risk in these settings and how it varies by geographic region and sex.
Added value of this study
This study leverages the largest harmonized dataset to date of nationally representative, individual-level data on body mass index and a biological measure of diabetes across 57 LMICs (n=685,616 adults), encompassing six world regions. We conducted robust sex- and-geographic region stratified analyses to assess the relationship between BMI (as a continuous and categorical exposure) and diabetes (defined biologically by a fasting plasma glucose of 7.0 mmol/L (126 mg/dL) or higher; a random plasma glucose of 11.1 mmol/L (200 mg/dL) or higher; or an HbA1c of 6.5% or higher) or by self-reported use of diabetes medications. We also present receiver operating curve (ROC) analyses of optimal BMI cut-offs when assessing diabetes risk. The results show substantial variability in the association between BMI and diabetes risk by region and sex and add to our current understanding of the association between BMI and diabetes risk in countries previously poorly represented in the literature.
Implications of all the available evidence
Given the rapidly growing burden of overweight, obesity, and diabetes in LMICs, urgent population-level strategies are needed to reverse current and projected trends. Moreover, our findings highlight that the BMI thresholds at which clinicians and policymakers consider elevated metabolic risk and interventions may vary across LMICs. Finally, in certain regions, screening may also need to include younger adults than currently recommended in most guidelines.
Acknowledgements
We would like to thank Lindsay Jaacks, Clare Flanagan, Sarah Frank, Esther Lim for their contributions to data cleaning and management. We would also like to thank each of the country-level survey teams that made this analysis possible, including the STEPS Survey teams from Benin, Bhutan, Burkina Faso, Comoros, Costa Rica, Georgia, Guyana, Kenya, Liberia, Mongolia, Nepal, St. Vincent & The Grenadines, Swaziland, Tanzania, Timor-Leste, Togo, Uganda and Zanzibar as well as the teams from the 2009-2010 Chile National Health Survey (NHS), the 2009 China Health and Nutrition Survey (CHNS), the 2009 Fiji Eye Health Survey (EHS), the 2015-2016 Indian NFHS, the 2014-2015 Indonesian Family Life Survey (IFLS), the 2013 Namibia DHS, the 2015-2016 Study for the Evaluation of Prevalence of Hypertension and Cardiovascular Risk in Romania III (SEPHAR), and the 2012 South African National Health and Nutrition Examination Survey (SANHANES).
Funding
Funding to support this analysis was provided by the Harvard T.H. Chan School of Public Health McLennan Fund: Dean’s Challenge Grant Program. Jacqueline Seiglie was supported by Grant Number T32DK007028 from the National Institute of Diabetes and Digestive and Kidney Diseases (NIDDK), Grant Number 5KL2TR002542-03 (Harvard Catalyst), and by the Massachusetts General Hospital Endocrine Division John T. Potts Jr. Pilot Award. Jennifer Manne-Goehler was supported by Grant Number K23DK125162 from the NIDDK. Jan-Walter De Neve was supported by the Alexander von Humboldt Foundation, funded by Germany’s Federal Ministry of Education and Research. This manuscript was also part of research funded under the European Union’s Research and Innovation program Horizon 2020 (project 825823). The STEPS survey in Uganda was co-funded by the Uganda government, the World Health Organization, the World Diabetes Foundation, and the United Nations Development Program. The contents of this research are solely the responsibility of the authors and do not necessarily represent the official views of the NIH. Pascal Geldsetzer was supported by the National Center for Advancing Translational Sciences of the National Institutes of Health under Award Number KL2TR003143. Gibson Kagaruki received partial support from the Afrique-ONE Aspire (funded by Wellcome Trust) and East African Consortium for Clinical Research (funded by EDCTP2) while preparing the manuscript.
Footnotes
Publisher's Disclaimer: This is a PDF file of an unedited manuscript that has been accepted for publication. As a service to our customers we are providing this early version of the manuscript. The manuscript will undergo copyediting, typesetting, and review of the resulting proof before it is published in its final form. Please note that during the production process errors may be discovered which could affect the content, and all legal disclaimers that apply to the journal pertain.
Declaration of interests
DJW reports serving on a data monitoring committee for Novo Nordisk. JBM reports serving as an Academic Associate for Quest Diagnostics. All other authors declare no competing interests.
Data sharing
The deidentified participant-level data used in this study are publicly available by request or download as detailed in Appendix 43. In addition, data dictionaries will be shared by the corresponding author upon request.
REFERENCES
- 1.Obesity and overweight [Internet]. [cited 2020 Jun 11]. Available from: https://www.who.int/news-room/fact-sheets/detail/obesity-and-overweight
- 2.Chooi YC, Ding C, Magkos F. The epidemiology of obesity. Metabolism. 2019. March 1;92:6–10. [DOI] [PubMed] [Google Scholar]
- 3.Di Cesare M, Bentham J, Stevens GA, Zhou B, Danaei G, Lu Y, et al. Trends in adult body-mass index in 200 countries from 1975 to 2014: A pooled analysis of 1698 population-based measurement studies with 19.2 million participants. The Lancet. 2016. April 2;387(10026):1377–96. [DOI] [PMC free article] [PubMed] [Google Scholar]
- 4.Popkin BM, Slining MM. New dynamics in global obesity facing low- and middle-income countries. Vol. 14, Obesity Reviews. NIH Public Access; 2013. p. 11–20. [DOI] [PMC free article] [PubMed] [Google Scholar]
- 5.Trends in obesity and diabetes across Africa from 1980 to 2014: an analysis of pooled population-based studies - PubMed [Internet]. [cited 2020 Jul 29]. Available from: https://pubmed-ncbi-nlm-nih-gov.ezp-prod1.hul.harvard.edu/28582528/ [DOI] [PMC free article] [PubMed]
- 6.Ng M, Fleming T, Robinson M, Thomson B, Graetz N, Margono C, et al. Global, regional, and national prevalence of overweight and obesity in children and adults during 1980–2013: A systematic analysis for the Global Burden of Disease Study 2013. The Lancet. 2014;384(9945):766–81. [DOI] [PMC free article] [PubMed] [Google Scholar]
- 7.International Diabetes Federation Atlas 9th edition and other resources [Internet]. [cited 2019 Dec 18]. Available from: https://www.diabetesatlas.org/en/resources/
- 8.Narayan KMV, Boyle JP, Thompson TJ, Gregg EW, Williamson DF. Effect of BMI on lifetime risk for diabetes in the U.S. Diabetes Care. 2007. May 1;30(6):1562–6. [DOI] [PubMed] [Google Scholar]
- 9.Ganz ML, Wintfeld N, Li Q, Alas V, Langer J, Hammer M. The association of body mass index with the risk of type 2 diabetes: A case-control study nested in an electronic health records system in the United States. Diabetol Metab Syndr. 2014. April 3;6(1):50. [DOI] [PMC free article] [PubMed] [Google Scholar]
- 10.Adams KF, Schatzkin A, Harris TB, Kipnis V, Mouw T, Ballard-Barbash R, et al. Overweight, Obesity, and Mortality in a Large Prospective Cohort of Persons 50 to 71 Years Old. N Engl J Med. 2006. August 24;355(8):763–78. [DOI] [PubMed] [Google Scholar]
- 11.Khan SS, Ning H, Wilkins JT, Allen N, Carnethon M, Berry JD, et al. Association of body mass index with lifetime risk of cardiovascular disease and compression of morbidity. JAMA Cardiol. 2018. April 1;3(4):280–7. [DOI] [PMC free article] [PubMed] [Google Scholar]
- 12.Wildman RP, Gu D, Reynolds K, Duan X, He J. Appropriate body mass index and waist circumference cutoffs for categorization of overweight and central adiposity among Chinese adults. Am J Clin Nutr. 2004. November;80(5):1129–36. [DOI] [PubMed] [Google Scholar]
- 13.Patel SA, Shivashankar R, Ali MK, Anjana RM, Deepa M, Kapoor D, et al. Is the “South Asian Phenotype” Unique to South Asians? Comparing Cardiometabolic Risk Factors in the CARRS and NHANES studies. Glob Heart. 2016. March;11(1):89–96.e3. [DOI] [PMC free article] [PubMed] [Google Scholar]
- 14.WHO Expert Consultation. Appropriate body-mass index for Asian populations and its implications for policy and intervention strategies. Lancet Lond Engl. 2004. January 10;363(9403):157–63. [DOI] [PubMed] [Google Scholar]
- 15.Almajwal AM, Al-Baghli NA, Batterham MJ, Williams PG, Al-Turki KA, Al-Ghamdi AJ. Performance of body mass index in predicting diabetes and hypertension in the Eastern Province of Saudi Arabia. Ann Saudi Med. 2009;29(6):437–45. [DOI] [PMC free article] [PubMed] [Google Scholar]
- 16.Murphy GAV, Asiki G, Nsubuga RN, Young EH, Seeley J, Sandhu MS, et al. The Use of Anthropometric Measures for Cardiometabolic Risk Identification in a Rural African Population. Diabetes Care. 2014. April 1;37(4):e64–5. [DOI] [PubMed] [Google Scholar]
- 17.Seiglie JA, Marcus M-E, Ebert C, Prodromidis N, Geldsetzer P, Theilmann M, et al. Diabetes Prevalence and Its Relationship With Education, Wealth, and BMI in 29 Low- and Middle-Income Countries. Diabetes Care. 2020. April 1;43(4):767–75. [DOI] [PMC free article] [PubMed] [Google Scholar]
- 18.Manne-Goehler J, Geldsetzer P, Agoudavi K, Andall-Brereton G, Aryal KK, Bicaba BW, et al. Health system performance for people with diabetes in 28 low- and middle-income countries: A cross-sectional study of nationally representative surveys. PLOS Med. 2019. March 1;16(3):e1002751. [DOI] [PMC free article] [PubMed] [Google Scholar]
- 19.World Bank Country and Lending Groups – World Bank Data Help Desk [Internet]. [cited 2019 Aug 29]. Available from: https://datahelpdesk.worldbank.org/knowledgebase/articles/906519-world-bank-country-and-lending-groups - Google Search [Internet]. [cited 2020 Jul 29]. Available from: https://www.google.com/search?q=World+Bank+Country+and+Lending+Groups+-+World+Bank+Data+Help+Desk+%5BInternet%5D.+%5Bcited+2019+Aug+29%5D.+Available+from%3A+https%3A%2F%2Fdatahelpdesk.worldbank.org%2Fknowledgebase%2Farticles%2F906519-world-bank-country-an
- 20.Riley L, Guthold R, Cowan M, Savin S, Bhatti L, Armstrong T, et al. The world health organization STEPwise approach to noncommunicable disease risk-factor surveillance: Methods, challenges, and opportunities. Am J Public Health. 2016. January 1;106(1):74–8. [DOI] [PMC free article] [PubMed] [Google Scholar]
- 21.STEPS [Internet]. [cited 2020 Oct 12]. Available from: https://extranet.who.int/ncdsmicrodata/index.php/catalog/STEPS/about
- 22.NCD Risk Factor Collaboration (NCD-RisC). Worldwide trends in diabetes since 1980: a pooled analysis of 751 population-based studies with 4.4 million participants. Lancet Lond Engl. 2016. 09;387(10027):1513–30. [DOI] [PMC free article] [PubMed] [Google Scholar]
- 23.D’Orazio P, Burnett RW, Fogh-Andersen N, Jacobs E, Kuwa K, Külpmann WR, et al. Approved IFCC Recommendation on Reporting Results for Blood Glucose (Abbreviated). Clin Chem. 2005. September 1;51(9):1573–6. [DOI] [PubMed] [Google Scholar]
- 24.Classification of diabetes mellitus [Internet]. [cited 2020 Oct 28]. Available from: https://www.who.int/publications-detail-redirect/classification-of-diabetes-mellitus
- 25.STEPS_Manual.pdf [Internet]. [cited 2020 Oct 28]. Available from: https://www.who.int/ncds/surveillance/steps/STEPS_Manual.pdf
- 26.Best Practices for Quality Anthropometric Data Collection at The DHS Program (English) [Internet]. [cited 2021 Mar 1]. Available from: https://dhsprogram.com/publications/publication-od77-other-documents.cfm
- 27.WHO | Diet, nutrition and the prevention of chronic diseases Report of the joint WHO/FAO expert consultation [Internet]. WHO. World Health Organization; [cited 2021 Feb 26]. Available from: http://www.who.int/dietphysicalactivity/publications/trs916/download/en/ [Google Scholar]
- 28.Bitew ZW, Alemu A, Ayele EG, Tenaw Z, Alebel A, Worku T. Metabolic syndrome among children and adolescents in low and middle income countries: a systematic review and meta-analysis. Diabetol Metab Syndr. 2020. October 27;12(1):93. [DOI] [PMC free article] [PubMed] [Google Scholar]
- 29.2.2_DIABETES_Type_2_management-WHOPEN.pdf [Internet]. [cited 2020 Nov 13]. Available from: https://www.who.int/ncds/management/2.2_DIABETES_Type_2_management-WHOPEN.pdf?ua=1
- 30.Ashwell M, Gunn P, Gibson S. Waist-to-height ratio is a better screening tool than waist circumference and BMI for adult cardiometabolic risk factors: systematic review and meta-analysis. Obes Rev Off J Int Assoc Study Obes. 2012. March;13(3):275–86. [DOI] [PubMed] [Google Scholar]
- 31.Ross R, Neeland IJ, Yamashita S, Shai I, Seidell J, Magni P, et al. Waist circumference as a vital sign in clinical practice: a Consensus Statement from the IAS and ICCR Working Group on Visceral Obesity. Nat Rev Endocrinol. 2020;16(3):177–89. [DOI] [PMC free article] [PubMed] [Google Scholar]
- 32.Stauffer F, Viswanathan B, Jean M, Kinabo P, Bovet P. Comparison between capillary glucose measured with a Contour glucometer and plasma glucose in a population survey. LaboratoriumsMedizin. 2016;40(2):133–139. [Google Scholar]
- 33.Aucott LS, Philip S, Avenell A, Afolabi E, Sattar N, Wild S. Patterns of weight change after the diagnosis of type 2 diabetes in Scotland and their relationship with glycaemic control, mortality and cardiovascular outcomes: a retrospective cohort study. BMJ Open. 2016. July;6(7):e010836. [DOI] [PMC free article] [PubMed] [Google Scholar]
Associated Data
This section collects any data citations, data availability statements, or supplementary materials included in this article.