

Summary
Metastasis is the leading cause of cancer-related deaths, yet we have limited knowledge of the metastatic microenvironment to effectively target this process. Microenvironmental changes occur at distant sites prior to clinically detectable metastatic disease; however, the key niche regulatory signals during metastatic progression remain poorly characterized. Here, we identify a core immune suppression gene signature in pre-metastatic niche formation that is expressed predominantly by myeloid cells. We target this immune suppression program by utilizing genetically engineered myeloid cells (GEMys) to deliver IL-12 to modulate the metastatic microenvironment. Our data demonstrate that IL12-GEMy treatment reverses immune suppression in the pre-metastatic niche by activating antigen presentation and T cell activation, resulting in reduced metastatic and primary tumor burden, and improved survival of tumor-bearing mice. We demonstrate that IL12-GEMys can functionally modulate the core program of immune suppression in the pre-metastatic niche to successfully rebalance the dysregulated metastatic microenvironment in cancer.
Keywords: Metastasis, Pre-Metastatic Niche, Immune Suppression, Immunotherapy, Genetically Engineered Myeloid Cells
Graphical Abstract
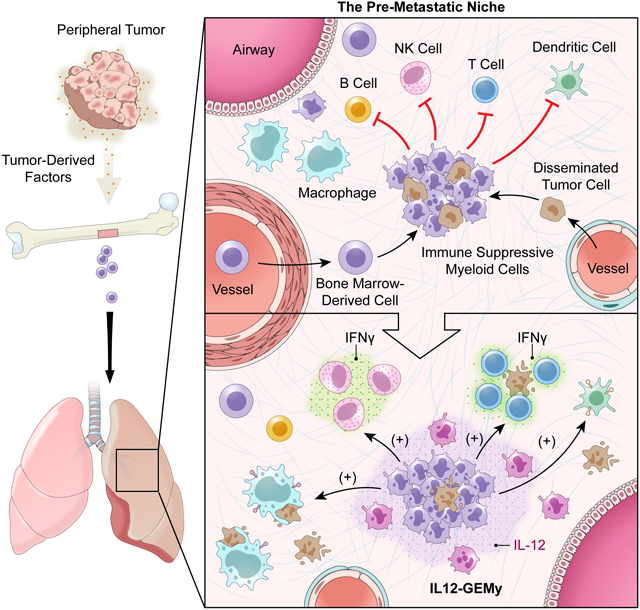
Genetically engineered myeloid cells expressing IL-12 can reverse the immunosuppressive environment associated with pre-metastatic tumors by augmenting T-cell responses and reducing metastatic burden in preclinical models.
Introduction
Metastasis is the leading cause of death in patients with extracranial solid tumors (Wiens and Hattab, 2014, Rove and Crawford, 2009, Svensson et al., 2017, Scully et al., 2012). Despite recent advances in cancer treatment, there is an unmet need to better understand the metastatic process and the development of effective therapies for metastatic disease remains a major challenge. The metastatic microenvironment offers a potential therapeutic target given its vital role in the pathogenesis and regulation of metastasis (Joyce and Pollard, 2009, Psaila and Lyden, 2009, Paget, 1989). During cancer progression, the primary tumor secretes systemic factors that prime distant sites for metastasis (Peinado et al., 2012, Peinado et al., 2017). The specialized microenvironment that is established at distant sites before clinically-detectable metastasis that supports the seeding and outgrowth of disseminated cancer cells is termed the pre-metastatic niche (Paget, 1989, Kaplan et al., 2005, Giles et al., 2016, Murgai et al., 2017, Liu and Cao, 2016, Welch and Hurst, 2019, Liu et al., 2016, Gui et al., 2020, Kaczanowska and Kaplan, 2020). The pre-metastatic niche is a complex and dynamic microenvironment, with tumor-derived factors triggering the activation of non-immune stromal cells, extracellular matrix remodeling and accumulation of bone marrow-derived cells (Kaplan et al., 2005, Murgai et al., 2017, Giles et al., 2016). We have previously shown the expansion of hematopoietic stem and progenitor cells in the bone marrow of tumor-bearing mice, with these cells entering circulation and arriving in pre-metastatic lungs prior to the arrival of tumor cells (Kaplan et al., 2005, Giles et al., 2016). Elevated circulating progenitor cells can also be detected in cancer patients at diagnosis and are predictive of disease relapse (Giles et al., 2016). These circulating progenitor cells enter the pre-metastatic lung where they differentiate into immunosuppressive myeloid cells (Giles et al., 2016). Therefore, we hypothesize that myeloid-mediated immune suppression is a central regulator of metastasis.
To expand on our observations that bone marrow-derived myeloid cells accumulate in pre-metastatic lungs, we set out to explore the function of these cells in the pre-metastatic niche and interrogate changes in the immune compartment in pre-metastatic lungs during the course of tumor progression. Myeloid cells can limit T cell activation and intravasation (Gabrilovich et al., 2012, Davidson et al., 2017), provide cues to induce regulatory T cells (Park et al., 2018, Fujimura et al., 2012), and are a frequent component of many tissue-specific stem cell niches (Naik et al., 2018, Wang et al., 2019a, Rahmani et al., 2018, Sehgal et al., 2018, Ko et al., 2017, Mussar et al., 2017). These myeloid-based immunosuppressive mechanisms are also well characterized in the context of tumorigenesis and in the primary tumor microenvironment (Gabrilovich, 2017, Gabrilovich et al., 2012, Kumar et al., 2016, Qian et al., 2009, Veglia et al., 2019, Albrengues et al., 2018). Therefore, we reasoned that the immune regulation that tightly governs stem cell niche biology might also be relevant to the niche that fosters metastatic progression.
Here, we comprehensively explore the dynamics of immune cells in the earliest metastatic microenvironment of the lung and interrogate the core niche programs by transcriptional profiling of the pre-metastatic lungs of tumor-bearing mice. We utilized multi-dimensional flow cytometry, high resolution tissue RNA sequencing (RNA-seq) and single cell RNA sequencing (scRNA-seq) to define how metastatic progression reshapes the immune landscape within the lung. Our findings reveal that myeloid cell signatures and pathways are among the most significantly enhanced features of the pre-metastatic microenvironment of the lung and that the transcriptional profile of the pre-metastatic niche is enriched in an immune suppression gene signature derived predominantly from myeloid populations. We hypothesize that reprogramming myeloid-mediated immune suppression pathways in the pre-metastatic microenvironment could limit metastatic disease.
In order to determine the impact of disrupting immune suppression in the pre-metastatic niche, we investigated the use of myeloid cells as a platform to deliver antitumor cytokines to pre-metastatic sites. To take advantage of the accumulation of myeloid cells that help create the pre-metastatic niche, we generated Genetically Engineered Myeloid cells (GEMys) to deliver the antitumor cytokine interleukin 12 (IL-12) into the local milieu during metastatic progression. IL-12 is produced by myeloid cells in response to infection and cancer, stimulates T and NK cell priming, effector function, and survival, and induces a strong interferon gamma (IFNγ) response that increases antigen presentation and decreases pro-tumorigenic processes such as angiogenesis and extracellular matrix remodeling (Brunda et al., 1993, Colombo and Trinchieri, 2002, Del Vecchio et al., 2007, Steding et al., 2011, Strauss et al., 2019). Previous efforts to use IL-12 clinically through systemic administration or secretion by T cells have had limitations due to toxicity associated with the presence of high levels of systemic IL-12, highlighting the need to mimic a more physiologic approach for the local delivery of IL-12 (Kerkar et al., 2011, Zhang et al., 2011, Zhang et al., 2015). Other groups have utilized macrophages or dendritic cells to secrete therapeutic factors into tissue sites, however, these terminally-differentiated cells have different functional properties and have not been investigated in metastatic disease (Moyes et al., 2017, Tatsumi et al., 2003, Klichinsky et al., 2020). Based on the unique homing and surveillance properties of myeloid cells that lead to their accumulation in pre-metastatic sites, myeloid cells have the capability to infiltrate even immunologically “cold” tumors where T cells are often excluded or limited to the periphery (Awad et al., 2018). Harnessing the homing and tumoritropic properties of myeloid cells for the local delivery of specific cargo is a promising therapeutic strategy for the treatment of cancer and metastasis.
Transcriptomic analysis of lung tissue following administration of IL-12-secreting GEMys (IL12-GEMys) demonstrates a dramatic reprogramming of the metastatic niche, resulting in downregulation of immunosuppressive pathways, upregulation of antigen presentation machinery and subsequent activation of cytotoxic T cell and NK cell responses. Treatment of mice bearing established tumors with IL12-GEMy therapy significantly reduced metastatic and primary tumor burden, prolonging the survival of mice in an IL-12- and T cell-dependent manner. Our study sheds light on how myeloid cells, one of the most abundantly recruited populations to tumor and metastatic microenvironments, can be harnessed as a platform to locally deliver cargo to rebalance dysregulated microenvironments.
Results
Immune characterization of the pre-metastatic microenvironment identifies a core regulatory transcriptional program of myeloid-mediated immune suppression
We aimed to explore how immune populations change in the lung in response to primary tumor growth at a distant site. We utilized M3-9-M, a syngeneic orthotopic tumor model of rhabdomyosarcoma, that spontaneously metastasizes to the lungs and is highly analogous to human metastatic rhabdomyosarcoma (Meadors et al., 2011), an aggressive pediatric cancer arising from muscle tissue. We examined immune population dynamics in the lungs of tumor-bearing mice by flow cytometry (Fig. 1A–B) at pre- (day 5–20) and early (~day 20–22) metastatic time points (Fig S1A–E). We define the pre-metastatic window as the time points during primary tumor progression prior to evidence of metastasis in the lung by visual inspection, flow cytometry (Fig. S1B), or bioluminescent imaging of labeled tumor (Giles et al., 2016), not excluding the possible presence of disseminated tumor cells or very early micro-metastasis (Murgai et al., 2017, Kaplan et al., 2005). We observed a significant increase in the number of myeloid cell populations, including granulocytes, monocytes, macrophages, and monocytic dendritic cells (DCs) in the lungs of tumor-bearing mice (Fig. 1A). Conversely, we found a dramatic decrease of conventional DCs, which are needed for antigen presentation and priming of an effective adaptive immune response.
Fig. 1: Immune cell populations are dysregulated and upregulate a core immune suppression gene signature in the pre-metastatic lung.
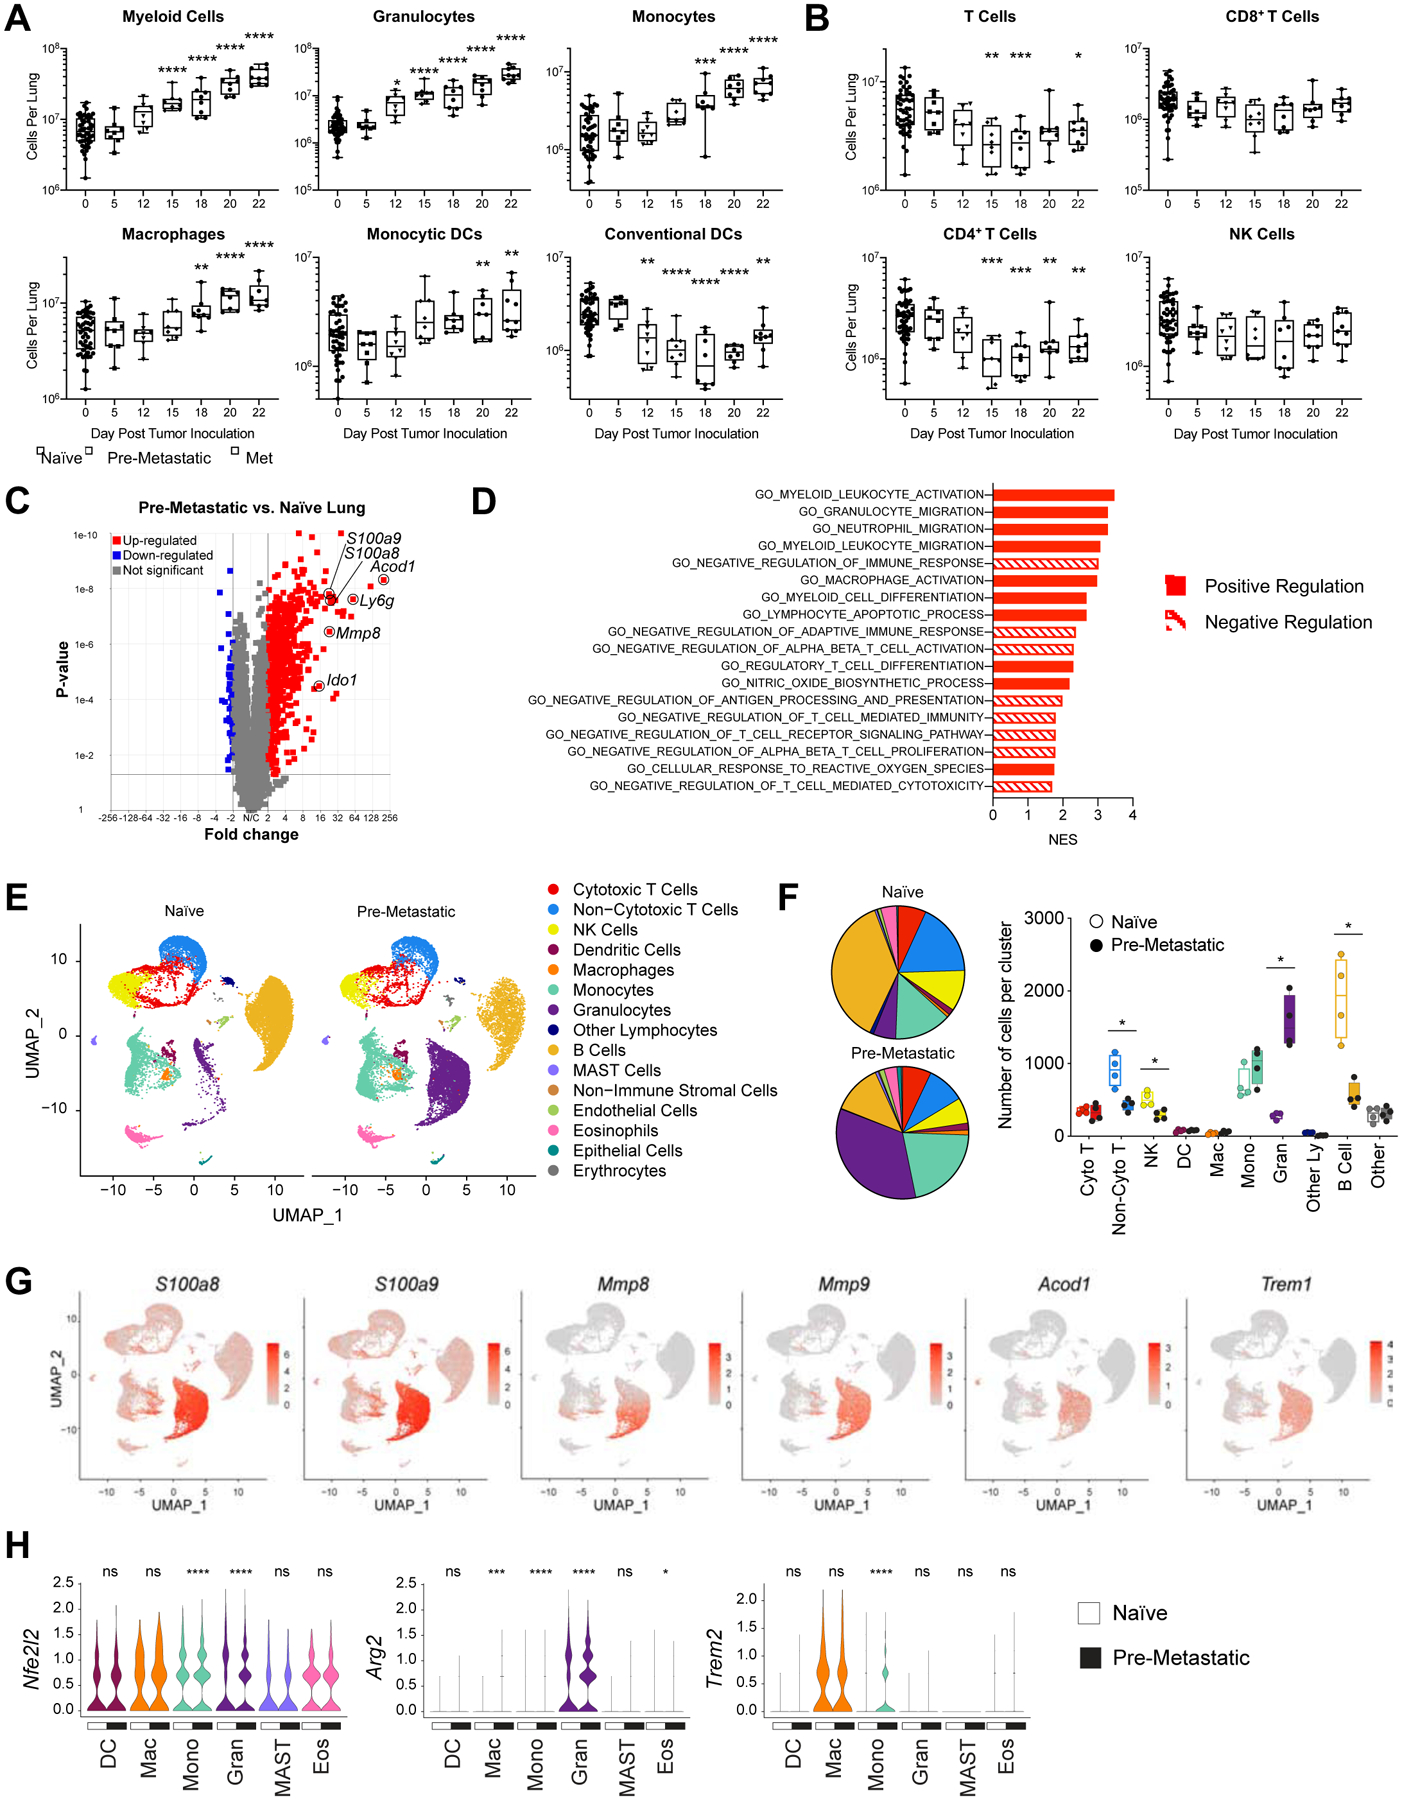
A-B) Lungs from M3-9-M ffluc-eGFP tumor-bearing mice were harvested at various time points (n=8) and processed into single cell suspension. Naïve mice were taken at each time point and are indicated as day zero post tumor inoculation. Flow cytometry analysis of A) myeloid populations (Myeloid = CD11b+, Granulocytes = CD11b+Ly6G+, Monocytes = CD11b+Ly6G−Ly6C+, Macrophages = CD11b+F4/80+, Monocytic Dendritic Cells = CD11b+CD11c+, Conventional Dendritic Cells = CD11b−CD11c+) and B) lymphocyte populations (T Cells = CD3+, CD8+ T cells = CD3+CD8+, CD4+ T Cells = CD3+CD4+, NK Cells = CD3−NK1.1+). All populations are gated on live CD45+ single cells. Data was analyzed by ordinary one-way ANOVA with Dunnett’s multiple comparisons test between the mean of day 0 and each time point. C-D) Lungs were harvested from naïve mice or on day 15 post primary tumor inoculation, flash frozen and RNA was isolated for bulk mRNA sequencing (n=4). Data is presented as C) a volcano plot and D) select gene sets that were significantly enriched (q-value < 0.1) in RNA-seq expression profiles of pre-metastatic compared to naïve lungs. E-H) Lungs were harvested from naïve mice or on day 15 post primary tumor inoculation and processed into single cell suspension for scRNA-seq (n=4). E) UMAP plots of cell clusters. F) Pie charts and plot of cell number per cluster analyzed by the Kolmogorov-Smirnov test. G) Feature plots showing the expression level of select genes from the pre-metastatic gene signature across the cell clusters. H) Expression levels of select genes in myeloid cell clusters. DC = dendritic cells; Mac = macrophages; Mono = monocytes; Gran = granulocytes; MAST = MAST cells; Eos = eosinophils. Statistical differences between groups were analyzed by Wilcoxon test. **** p < 0.0001; *** 0.0001 < p < 0.001; ** 0.001 < p < 0.01; * 0.01 < p < 0.05. In boxplots, the center line represents the median, the box limits denote the 25th to the 75th percentile and the whiskers represent the minimum and maximum value. See also Figures S1–4.
In parallel, we discovered that there is a marked reduction in the number of T cells in pre-metastatic lungs, primarily in the CD4+ T cell compartment, while the number of CD8+ T cells and NK cells were not significantly changed (Fig. 1B). Furthermore, we found that PD1hiCD44int T cells, associated with a dysfunctional phenotype, are most significantly increased in the pre-metastatic lung (Fig. S1E) (Xia et al., 2019). Although T cell numbers are diminished in pre-metastatic lungs, both CD4+ and CD8+ T cells retain their proliferative capacity when isolated from the pre-metastatic microenvironment and activated with CD3/CD28 beads in vitro (Fig. S1F), suggesting that local signals within the pre-metastatic milieu suppress T cell activity rather than an intrinsic defect in T cell expansion. These data demonstrate the presence of a myeloid-rich, T cell-poor microenvironment that is formed in pre-metastatic lungs during cancer progression.
In order to investigate the transcriptional programs that underlie the pre-metastatic niche environment, we performed deep transcriptional analysis of whole lungs from naïve and pre-metastatic mice. We found a dramatic shift in the expression of many genes in the lungs in response to the presence of a distant tumor (Fig. 1C, Fig. S2A–B). Genes associated with adaptive immune cell recruitment and activation (Cxcl9, Tarm1, Ifng, Gzmb) are significantly increased in tumor-bearing mice compared to naïve mice, demonstrating an activated immune response in the lung during the pre-metastatic phase. Most notably, we identified many upregulated genes associated with immune suppression (Acod1, Ly6g, S100a8, S100a9, Mmp8, Mmp9, Ido1, Trem1, Il1b, Arg1). These data provide evidence that the pre-metastatic lung does not lack adaptive immunity, but rather there is a program of active immune suppression that inhibits effective antitumor immunity. To better define this program of immune suppression, we created a pre-metastatic gene signature based on the top fifty genes upregulated and downregulated in pre-metastatic compared to naive lungs (Fig. S2C). We compared this signature to published data sets and found that the genes upregulated in the lung pre-metastatic niche in our rhabdomyosarcoma model are conserved in pre-metastatic sites in other metastatic tumor models (Fig. S2D) (Hiratsuka et al., 2008, Liu et al., 2016, Shao et al., 2018, Yamamoto et al., 2008, Lee et al., 2019).
To investigate the functional implications of this drastic change in gene expression between pre-metastatic and naïve lungs, we performed gene set enrichment analysis (GSEA). We identified the enrichment of gene ontology (GO) gene sets associated with myeloid cell activation, migration, and differentiation in parallel with negative regulation of adaptive and T cell-mediated immune responses (Fig. 1D). Ingenuity pathway analysis (IPA) indicated a significant enrichment in multiple pathways of myeloid-cell mediated immune suppression, including production of nitric oxide (NO) and reactive oxygen species (ROS), p38 MAPK signaling, granulocyte-macrophage colony-stimulating factor (GM-CSF) signaling, the inflammasome pathway and inducible nitric oxide synthase (iNOS) signaling (Fig. S2E) (Gabrilovich, 2017, Yang et al., 2010, Wang et al., 2006, Hong, 2016, Guo et al., 2016, Cao and Xu, 2019, Wang et al., 2019b, Gui et al., 2020). T cell exhaustion-associated pathways are also enriched in the pre-metastatic lungs, and genes associated with a functional T cell response were downregulated in the pre-metastatic setting such as IL12a, Tril and Ccr6 (Fig. S2C), implicating active suppression of adaptive immune responses during metastatic development. Furthermore, liver X receptor (LXR)/retinoid X receptor (RXR) and peroxisome proliferator-activated receptor (PPAR) signaling are significantly downregulated in the lungs of tumor-bearing mice, which are pathways involved in lipid metabolism, suppression of tumor growth, reduction of myeloid-derived suppressor cell abundance and dampening inflammation in the bone marrow niche (Fig. S2E) (Tavazoie et al., 2018, N and Castrillo, 2011, Hong et al., 2012, Croasdell et al., 2015, Casanova-Acebes et al., 2014). Further, we performed functional annotation analysis of the top fifty genes upregulated in pre-metastatic lungs that confirmed the significant enrichment of many myeloid-mediated biological processes that play a role in immune suppression (Fig. S2F). Among these, leukocyte and neutrophil migration and aggregation indicate enhanced expression of genes that promote the intravasation of myeloid cells early in metastatic progression, while NO and ROS biosynthesis and protein nitrosylation demonstrate inhibition of T cell receptor signaling and attenuated T cell activation (Fig S2F) (Gabrilovich, 2017, Nagaraj et al., 2007). Together, our transcriptomics data support a core module of immune suppression within the pre-metastatic niche.
To further elucidate the cellular source of the transcriptional immune suppression program in the lungs of tumor-bearing hosts, we performed scRNA-seq of naïve and pre-metastatic lungs. Cell type identity of each cluster was defined by the expression of lineage markers (Fig. S3A–B). ScRNA-seq revealed a global shift in immune cell populations (Fig. 1E). Consistent with our flow cytometry data, we observed a striking expansion of the number of granulocytes along with a significant decrease in lymphocytes including non-cytotoxic T cells, NK cells, and B cells compared to naïve lung (Fig. 1F). Key immune suppression genes from the pre-metastatic niche gene signature (Fig. S2C) are most highly expressed by myeloid cells, including S100a8, S100a9, Mmp8, Mmp9, Acod1, and Trem1 (Fig. 1G, Fig S3C). In addition, Nfe2l2, Arg2, and Trem2, genes implicated in the immune suppressive function of myeloid cells, are upregulated by many myeloid cell types in the pre-metastatic niche (Fig. 1H) (Beury et al., 2016, Grzywa et al., 2020, Katzenelenbogen et al., 2020).
Furthermore, evolutionarily conserved interferon-inducible transmembrane genes that play a role in suppressing interferon-mediated immunity in stem cell niches, Ifitm1 and Ifitm3, were also significantly upregulated in myeloid populations in the pre-metastatic lungs (Fig. S3D). We found a high degree of similarity between many of the myeloid-associated immune suppression genes that we found in our sequencing data and human bone marrow myeloid populations from the hematopoietic stem cell niche (TREM1, CYBB, S100A8, S100A9, IL1B, IFITM1, IFITM3) (Fig. S4) (Hay et al., 2018), drawing a parallel between the programs limiting immune responses in the pre-metastatic niche and stem cell niche.
These data demonstrate that the pre-metastatic niche is a myeloid-rich, T cell-poor microenvironment expressing a core regulatory program of active myeloid-mediated immune suppression.
Generation of genetically engineered myeloid cells (GEMys) to locally deliver immunomodulatory cargo into the pre-metastatic microenvironment.
We and others have shown that bone marrow-derived myeloid cells are elevated in circulation and highly enriched in the tumor and metastatic microenvironments in both mice and humans (Fig. 1) (Giles et al., 2016, Pollard, 2004, Zhang et al., 2016, Teng et al., 2016). To take advantage of this marked infiltration of myeloid cells into pre-metastatic lungs, we generated Genetically Engineered Myeloid cells, herein referred to as “GEMys,” as an immunotherapy platform to deliver cargo to manipulate the microenvironment of the pre-metastatic niche. As IL-12 has previously been shown to demonstrate potent antitumor activity (Wolf et al., 1991, Brunda et al., 1993, Colombo and Trinchieri, 2002), we designed GEMys to secrete IL-12 (IL12-GEMys) to target the core immune suppression program in the metastatic microenvironment. Given that the myeloid cells accumulating in the pre-metastatic lungs are of bone marrow origin (Giles et al., 2016), we generated GEMys from lineage-depleted bone marrow hematopoietic stem and progenitor cells (HSPCs). Cells were transduced with lentivirus encoding IL-12 and the Thy1.1 reporter, and cultured in the presence of SCF, FLT3L, and IL-6 for four days (Fig. 2A). The IL12-GEMy product is a heterogeneous population, predominantly resembling the macrophage and monocyte profiles within our scRNA-seq clusters (Fig. 2B), with a large component of Ly6G−Ly6C+ monocytes (Fig. S5A). IL-12 production was confirmed by ELISA (Fig. 2C, Fig. S5B).
Fig. 2: IL12-GEMy treatment alters immune populations in pre-metastatic lungs.
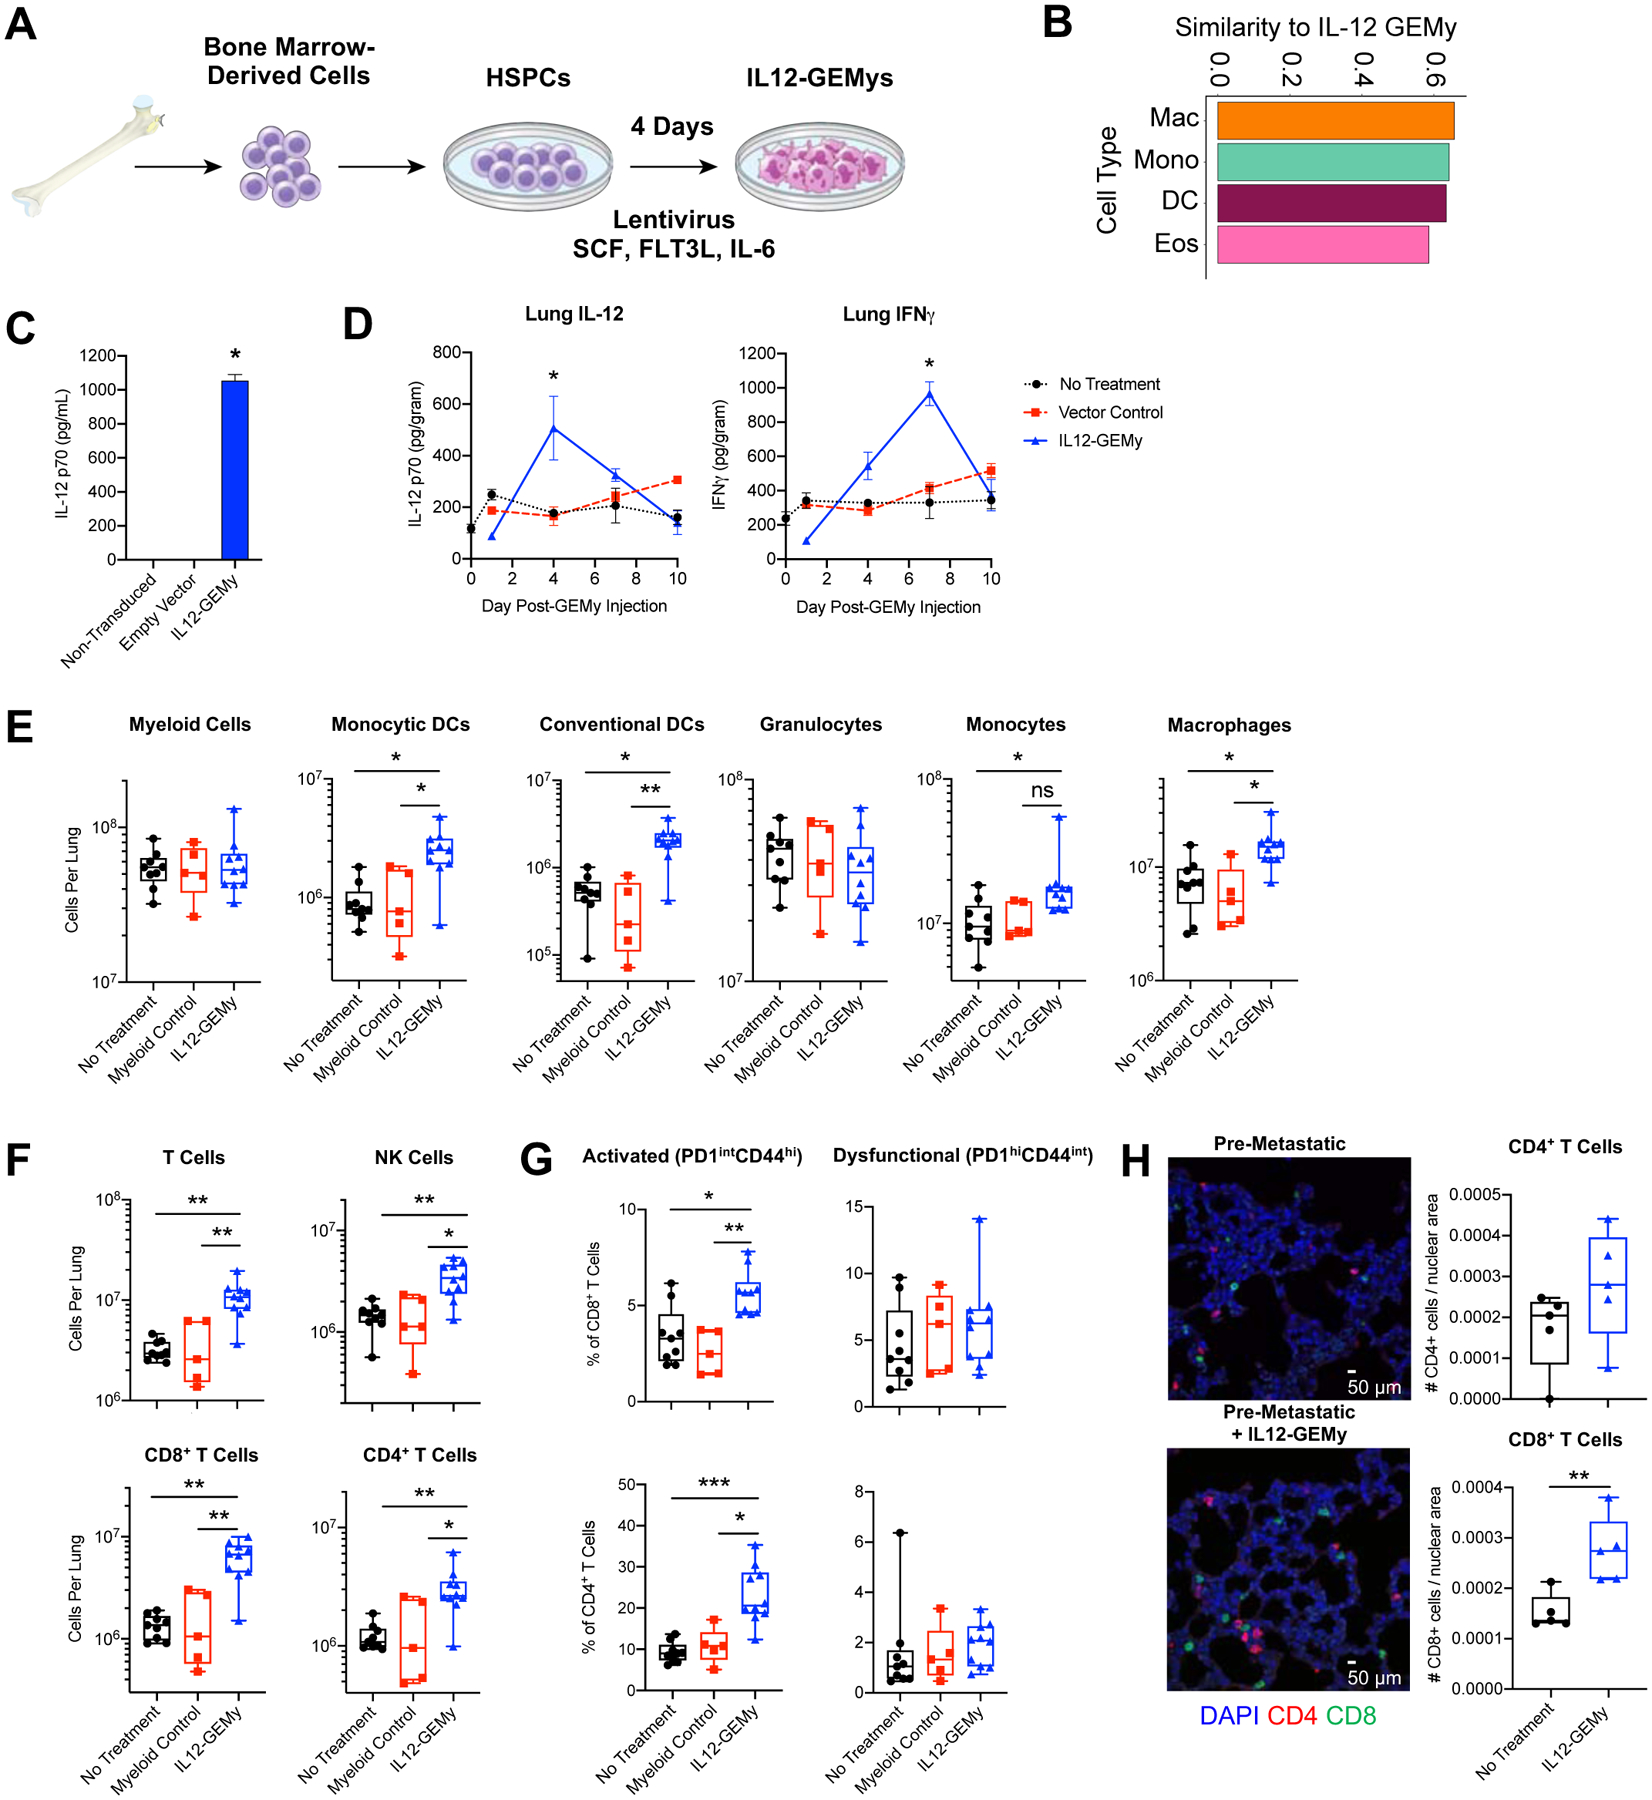
A) Schematic of IL12-GEMy production. B) Cosine similarity of IL12-GEMy bulk RNA-seq data with profiles of each cluster in scRNA-seq data. Similarity is based on the expression of the most variable genes in randomly drawn sub-samples of 90% of cells in each cluster. The similarity score was then computed as the average cosine similarity across 100 sub-samples and the IL12-GEMy product. The similarity score can range between 0 and 1, indicating either complete dissimilarity or similarity, respectively with 0.65 being the highest score in our data. The four most similar populations to IL12-GEMys are shown. C) IL12-GEMys were washed after transduction, plated at 5×10⁵ cells/mL and cultured for 18 hours. Supernatant was collected and analyzed for IL-12 by ELISA. Statistical significance was calculated using the Kruskal-Wallis test. D) 8×10⁶ vector control or IL12-GEMys generated from GFP+Luciferse+ donor mice were injected into M3-9-M tumor-bearing mice 12 days after primary tumor inoculation (n=3–6 mice per group per time point). Lungs were harvested and flash frozen at indicated time points, tissues were homogenized and analyzed by ELISA. Statistical analysis was performed by Kolmogorov-Smirnov test at each time point. E-G) Mice were inoculated with M3-9-M ffluc-mCherry tumor and not treated (n=9) or treated with control non-transduced myeloid cells (n=5) or IL12-GEMys (n=10) on days 12, 19, and 26. Lungs were harvested on day 27 and analyzed by flow cytometry gated on live CD45+ single cells. Flow cytometry data was analyzed by Kruskal-Wallis test with Dunn’s multiple comparisons test. E) Myeloid cell populations in the lungs (Myeloid = CD11b+, Monocytic Dendritic Cells = CD11b+CD11c+, Conventional Dendritic Cells = CD11b−CD11c+, Granulocytes = CD11b+Ly6G+, Monocytes = CD11b+CD43+Ly6C+, Macrophages = CD11b+CD43+Ly6C+F4/80+). F) The number of T and NK cells in the lungs (T Cells = CD3+, CD8+ T cells = CD3+CD8+, CD4+ T Cells = CD3+CD4+, NK Cells = CD3−NK1.1+). G) The proportion of CD8+ and CD4+ T cells expressing PD1 and CD44 in the lungs. H) Immunofluorescence staining of FFPE lung sections collected 15 days after tumor inoculation, 3 days after treatment with 8×10⁶ IL12-GEMys. Quantification was performed on 20x images of n=5 mice per group, 8 images per mouse, and analyzed by Kolmogorov-Smirnov test. Representative 40x images of nuclear (blue), CD4 (red), and CD8 (green) staining is shown. Scale bar represents 50 μm. **** p < 0.0001; *** 0.0001 < p < 0.001; ** 0.001 < p < 0.01; * 0.01 < p < 0.05. In bar and line graphs, data are represented as mean ± SEM. In boxplots, the center line represents the median, the box limits denote the 25th to the 75th percentile and the whiskers represent the minimum and maximum value. See also Figure S5.
Upon intravenous (i.v.) administration of IL12-GEMys into tumor-bearing mice, IL-12 levels peaked in the lungs at four days post treatment, followed by a delayed peak of IFNγ production at one week (Fig. 2D). Similar trends were seen in the serum, spleen, and tumor, with no appreciable differences in IL-12 or IFNγ in the liver over vector control treated mice (Fig. S5C). Notably, the highest IFNγ levels were detected in the lung and in the tumor, at levels two times greater than the amount detected in the serum and spleen (Fig. 2D, Fig. S5C). IL12-GEMys generated from CD45.1+ Pepboy mice transferred into CD45.2+ wild type hosts were detected primarily in the lung, liver and spleen in similar proportions as vector control cells at 24 hours after adoptive transfer, suggesting that the expression of IL-12 does not significantly impact cell homing (Fig. S5D). Both IL12-GEMy and vector control cells were detected at low frequencies in the bone marrow, tumor, lymph nodes and blood. In contrast to the high proportion of Ly6G+ endogenous myeloid cells, IL12-GEMys retain a Ly6G− monocytic phenotype in the lungs, suggesting that their phenotype is not drastically changed upon injection in vivo (Fig. S5E). Together these data demonstrate that IL12-GEMys effectively deliver IL-12 to the pre-metastatic microenvironment. These studies demonstrate the feasibility of generating functional murine GEMys from HSPCs.
IL12-GEMys restore and activate T cell populations in pre-metastatic lungs
To determine the impact of IL12-GEMys on immune populations in the metastatic microenvironment, we profiled lymphoid and myeloid populations in the lungs of mice at primary tumor endpoint that received either no treatment, control myeloid cells, or IL12-GEMys. Although, there was no significant change in the total number of myeloid cells in the lungs of IL12-GEMy treated mice compared to controls, there was a significantly higher number of both monocytic and conventional DCs, which can serve as professional antigen-presenting cells to activate adaptive immunity, along with monocytes and macrophages (Fig. 2E). Dendritic cells increased in the lung as early as one week following IL12-GEMy treatment, while other myeloid populations remained relatively stable (Fig. S5F). There were minimal changes in myeloid populations in the spleen, lymph nodes, and tumor between IL12-GEMy-treated and control mice (Fig. S5G).
The lungs of tumor-bearing mice that received IL12-GEMys had significantly more CD8+ T cells, CD4+ T cells and NK cells compared to mice receiving no treatment or control myeloid cells (Fig. 2F). Additionally, IL12-GEMy treatment significantly increased the relative percentage of activated PD1intCD44hi T cells without impacting the dysfunctional PD1hiCD44int T cell subset (Fig. 2G). The increase of T cells three days after IL12-GEMy treatment was also observed by immunofluorescence imaging of lung tissue, which showed an increased trend in CD4+ cells and significantly higher numbers of CD8+ cells (Fig. 2H). To further delineate the kinetics of T cell recruitment or expansion, lungs were harvested from M3-9-M tumor-bearing mice that were treated with IL12-GEMys and analyzed by flow cytometry at various time points. The number of T cells and NK cells increased as early as three days post-IL12-GEMy transfer (Fig. S5H), while the greatest increase in the proportion of PD-1+ and CD44+ T cells occurred between three to seven days after IL12-GEMy delivery (Fig. S5I), coinciding with IL-12 cargo delivery to the pre-metastatic lung and rise in IFNγ levels (Fig. 2D). There were no appreciable differences in the frequency of CD3+ and NK1.1+ cells in the spleen or tumor, with decreased NK1.1+ cells in the tumor-draining lymph node of IL12-GEMy-treated mice (Fig. S5J), indicating a metastatic niche-specific response to IL12-GEMy treatment in tumor-bearing mice.
IL12-GEMy cell number remained stable in the lung up to a week after transfer, indicating that the IL12-GEMys have limited expansion in vivo (Fig. S5K). The proliferation of T cells expressing high levels of IL-12 was responsible for toxicity observed in previous studies (Obstfeld et al., 2017, Maude et al., 2014).
These data indicate that IL12-GEMy treatment reshapes the metastatic environment by promoting the accumulation of activated T cells, NK cells and DCs in the lung.
IL12-GEMys reverse the core immune suppression program in the pre-metastatic lung
To determine the impact of IL12-GEMy treatment on the pre-metastatic microenvironment, we profiled the transcriptomic landscape of the pre-metastatic lungs three days after treatment with IL12-GEMys. IL12-GEMy treatment promotes a dramatic shift in the transcriptional program of pre-metastatic lungs (Fig. S6A–B). IL12-GEMy treatment induces the expression of genes associated with adaptive immune cell activation, such as Th1 phenotype (Tbx21, Ifng, Stat1), cytotoxicity (Prf1, Ctsw, Klrg1), and T cell receptor signaling (Lck, Lat) (Fig. 3A). Furthermore, there is a dramatic upregulation of genes associated with antigen processing and presentation (Ciita, Batf3, B2m, Tap1, H2-K1, H2-Q4, H2-Aa, H2-Ab1 and H2-Eb1) (Fig. 3A). Strikingly, immunosuppressive genes that are upregulated in pre-metastatic lungs compared to naïve lungs are downregulated with IL12-GEMy treatment (Fig. 3A). This reversal of the core immune suppression program is demonstrated by analyzing the pre-metastatic gene signature generated in Fig. S2C. The top 50 genes down-regulated in the pre-metastatic niche are significantly increased with IL12-GEMy treatment, and the top 50 genes up-regulated in the pre-metastatic niche are significantly reduced with IL12-GEMy treatment (Fig. 3B). This reversal of the core immune suppression program illustrates the plasticity of the pre-metastatic niche phenotype that can be targeted by the introduction of IL12-GEMys to induce profound reprogramming of the niche environment in the lungs of tumor-bearing mice.
Fig. 3: IL12-GEMy treatment reverses the core immune suppression gene program in the lung microenvironment and activates adaptive immunity.
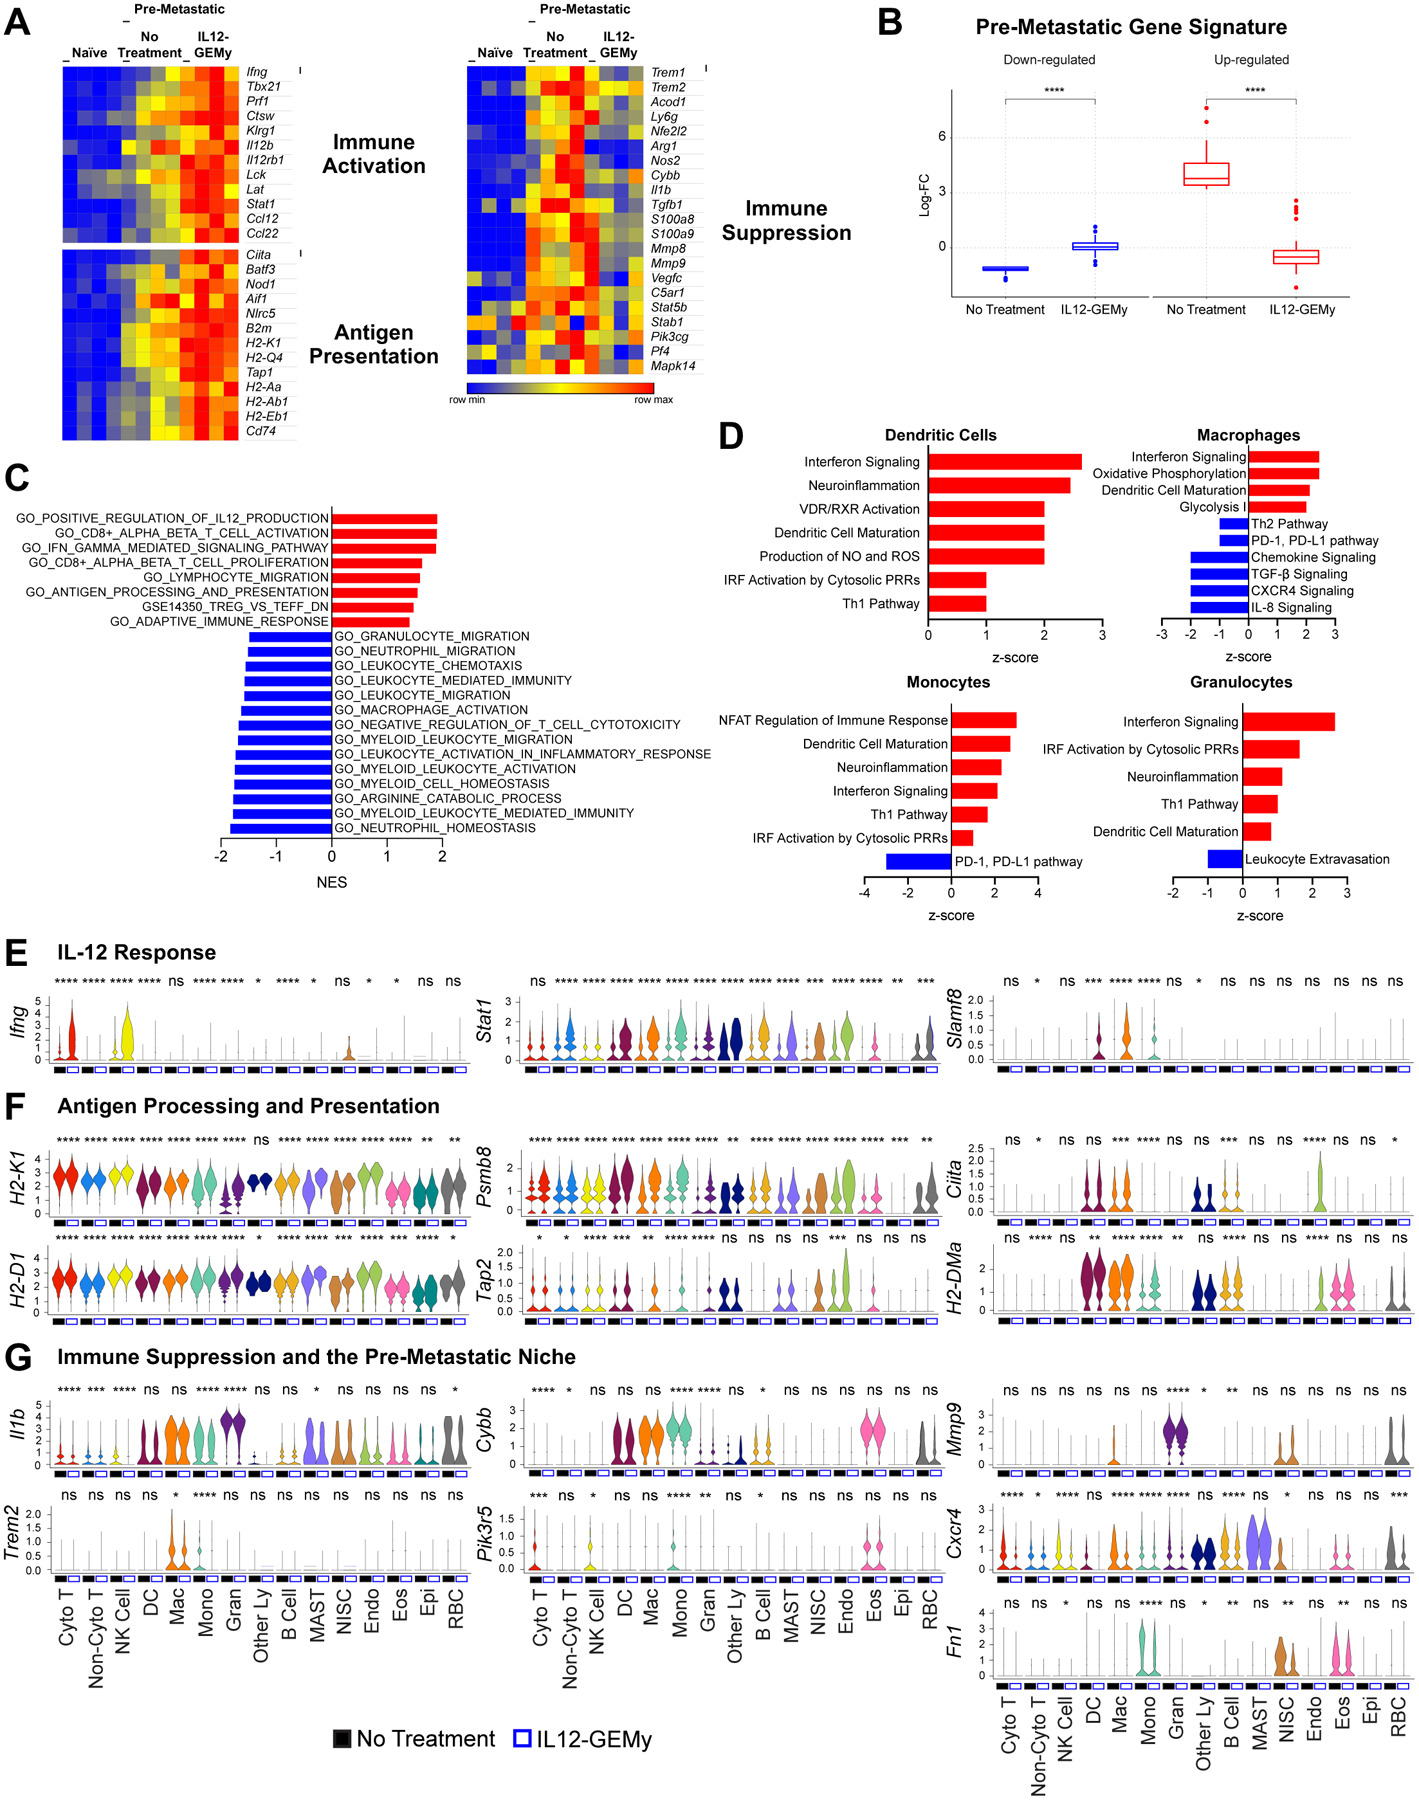
Mice were inoculated with M3-9-M ffluc-mCherry primary tumor and treated with 8×10⁶ IL12-GEMys on day 12. Lungs were flash frozen (A-C) or processed into single cell suspension (D-G) three days post-treatment (n=4 mice per group). A) Expression of selected genes in the lung comparing naïve non-treated tumor-bearing mice and IL12-GEMy-treated tumor-bearing mice. B) Log-fold changes of the top 50 genes up-regulated in pre-metastatic lungs (red) and the top 50 genes down-regulated in pre-metastatic lungs (blue) in the lungs of non-treated and IL12-GEMy-treated tumor-bearing mice. P-values were determined using a one-sided Wilcoxon rank-sum test. C) Gene set enrichment analysis of differential gene expression data from the lungs of IL12-GEMy-treated compared to non-treated mice. Red bars indicate a positive normalized enrichment score (NES) and blue bars indicate a negative normalized enrichment score (NES). D) Ingenuity pathway analysis of the differential gene expression between IL12-GEMy-treated and non-treated pre-metastatic lungs for individual myeloid cell clusters by single cell RNA sequencing. Red bars indicate positive z-scores and blue bars indicate negative z-scores. E-G) Expression levels of key genes associated with E) response to IL-12, F) antigen processing and presentation, and G) immune suppression and the pre-metastatic niche are shown on a per-cluster basis for non-treated and IL12-GEMy-treated tumor-bearing mice. Cyto T = cytotoxic T cells; Non-Cyto T = non-cytotoxic T cells; NK Cells = natural killer cells; DC = dendritic cells; Mac = macrophages; Mono = monocytes; Gran = granulocytes; Other Ly = other lymphocytes; MAST = MAST cells; NISC = non-immune stromal cells; Endo = endothelial cells; Eos = eosinophils; Epi = epithelial cells; RBC = erythrocytes. Statistical differences between groups analyzed by Wilcoxon test. **** p < 0.0001; *** 0.0001 < p < 0.001; ** 0.001 < p < 0.01; * 0.01 < p < 0.05. See also Figure S6A–D.
GSEA analysis confirmed the enrichment of gene sets associated with IL-12 production, CD8+ T cell activation, IFNγ signaling, and antigen processing and presentation, together with the downregulation of gene sets related to myeloid cell homeostasis and migration (Fig. 3C). Pathway analysis revealed the upregulation of T cell pathways related to antitumor activity, such as ICOS signaling (Hutloff et al., 1999, Soldevilla et al., 2019), PPAR signaling (Koeffler, 2003), Th1 activation, NFAT signaling, and interferon signaling (Fig. S6C). In parallel, the transcriptional profile of IL12-GEMy-treated lungs revealed a significant downregulation of pathways involved in niche-associated immune suppression such as TGF-β, IL-1, IL-6 and iNOS signaling, as well as oxidative stress response and the production of NO and ROS (Fig. S6C).
In order to examine the transcriptional effects of IL12-GEMys on specific cell populations, we performed scRNA-seq analysis on pre-metastatic lungs from tumor-bearing not treated and IL12-GEMy-treated mice. Although there was no significant change in the relative numbers of the myeloid cell populations by scRNA-seq, myeloid cells did demonstrate a marked shift of transcriptional reprogramming in response to IL12-GEMy (Fig. S6D). To better understand IL12-GEMy-dependent phenotypic changes in the transcriptional programs of myeloid cells, we performed pathway analysis of myeloid cell clusters in the lungs of IL12-GEMy-treated versus non-treated tumor-bearing mice. We observed marked activation of interferon, Th1 and DC maturation pathways in monocytes, macrophages, and granulocytes (Fig. 3D). In addition, there was also a strong reduction in genes related to leukocyte extravasation within the granulocyte population (Fig. 3D). Notably, there was a strong downregulation of immunosuppressive pathways within myeloid clusters including the PD-1/PD-L1 axis, Th2 signaling, TGF-β and IL-8 signaling (Fig. 3D) (Gajewski et al., 2006). These findings implicate IL12-GEMy cell therapy in reducing a multitude of diverse signaling pathways within the pre-metastatic niche that can contribute to the core immune suppression program.
To further elucidate the contribution of specific cell types to the IL12-GEMy response, we examined the expression of relevant genes on a per cluster basis. One of the main downstream effects of IL-12 signaling is IFNγ production, which is robustly induced after IL12-GEMy administration in cytotoxic T cells and NK cells, as well as significantly upregulated, although at a lower level, in DCs, monocytes, and granulocytes (Fig. 3E). IFNγ signals through Stat1, which is also highly upregulated by many cell types in the pre-metastatic niche in response to IL12-GEMys (Fig. 3E). IFNγ-induced Slamf8, a negative regulator of ROS production and migration in myeloid cells, is robustly upregulated in DCs, macrophages, and monocytes following IL12-GEMy treatment (Fig. 3E)(Wang et al., 2015). IL-12 signaling is also associated with the upregulation of antigen presentation machinery (Kerkar et al., 2011). Many genes associated with both MHC class I (H2-K1, H2-D1, Psmb8, Tap2) and MHC class II (Ciita, H2-DMa) antigen processing and presentation are dramatically upregulated in myeloid cells and many other cell types (Fig. 3F). Furthermore, single cell analysis revealed that the expression of many of the immunosuppressive genes is reduced in specific cell populations, such as Il1b (Mantovani et al., 2018) in monocytes and granulocytes, Cybb (Martner et al., 2019) in monocytes, and Trem2 (Katzenelenbogen et al., 2020) in macrophages and monocytes (Fig. 3G). Additionally, Pik3r5, a recently identified molecular switch that controls immune suppression (Kaneda et al., 2016), is reduced in cytotoxic T cell, NK cell and monocyte populations (Fig. 3G). Other genes that we have previously identified as playing vital roles in the pre-metastatic niche are also differentially regulated. Mmp9 (Hiratsuka et al., 2002) is significantly downregulated in granulocytes and Cxcr4, an important chemokine receptor for HSPC homing (Giles et al., 2016), is reduced in many cell types (Fig. 3G). Additionally, we and others have shown that perivascular cell-derived fibronectin (Fn1) is a key component of the pre-metastatic niche (Murgai et al., 2017, Kaplan et al., 2005, Psaila and Lyden, 2009, Hoye and Erler, 2016). Here, we demonstrate that monocytes and eosinophils also contribute to fibronectin production in addition to non-immune stromal cells, and IL12-GEMy treatment significantly reduces Fn1 production in all three populations (Fig. 3G).
Together, these data provide evidence that IL12-GEMys have the ability to induce a cascade of transcriptional events in multiple cell types to reverse immune suppression in the pre-metastatic lung microenvironment, leading to the activation of adaptive immune responses. Further, our analysis offers key insights into the cell-specific responses to IL-12 signaling in vivo within the pre-metastatic niche environment.
IL12-GEMy treatment limits metastasis and improves survival
We next sought to determine whether reversing the core immune suppression signature in the pre-metastatic microenvironment with IL12-GEMy treatment has a therapeutic impact on metastatic disease progression. We utilized luciferase-expressing rhabdomyosarcoma tumor cells to measure spontaneous metastasis to the lung. Tumor-bearing mice were treated with vector control or IL12-GEMys, lungs were harvested on day 22 and bioluminescent signal was measured ex vivo for quantification of metastatic tumor burden. Mice treated with IL12-GEMys had significantly lower metastatic signal in their lungs than vector control treated mice (Fig. 4A). IL12-GEMy-treated mice survived significantly longer than non-treated and vector control treated mice (p<0.001), and we observed regression of established primary tumors (Fig. 4B). As we did not observe a difference in tumor progression nor survival between vector control and non-treated mice, we used non-treated mice as controls in future experiments.
Fig. 4: IL12-GEMy treatment limits metastasis and extends survival in mice.
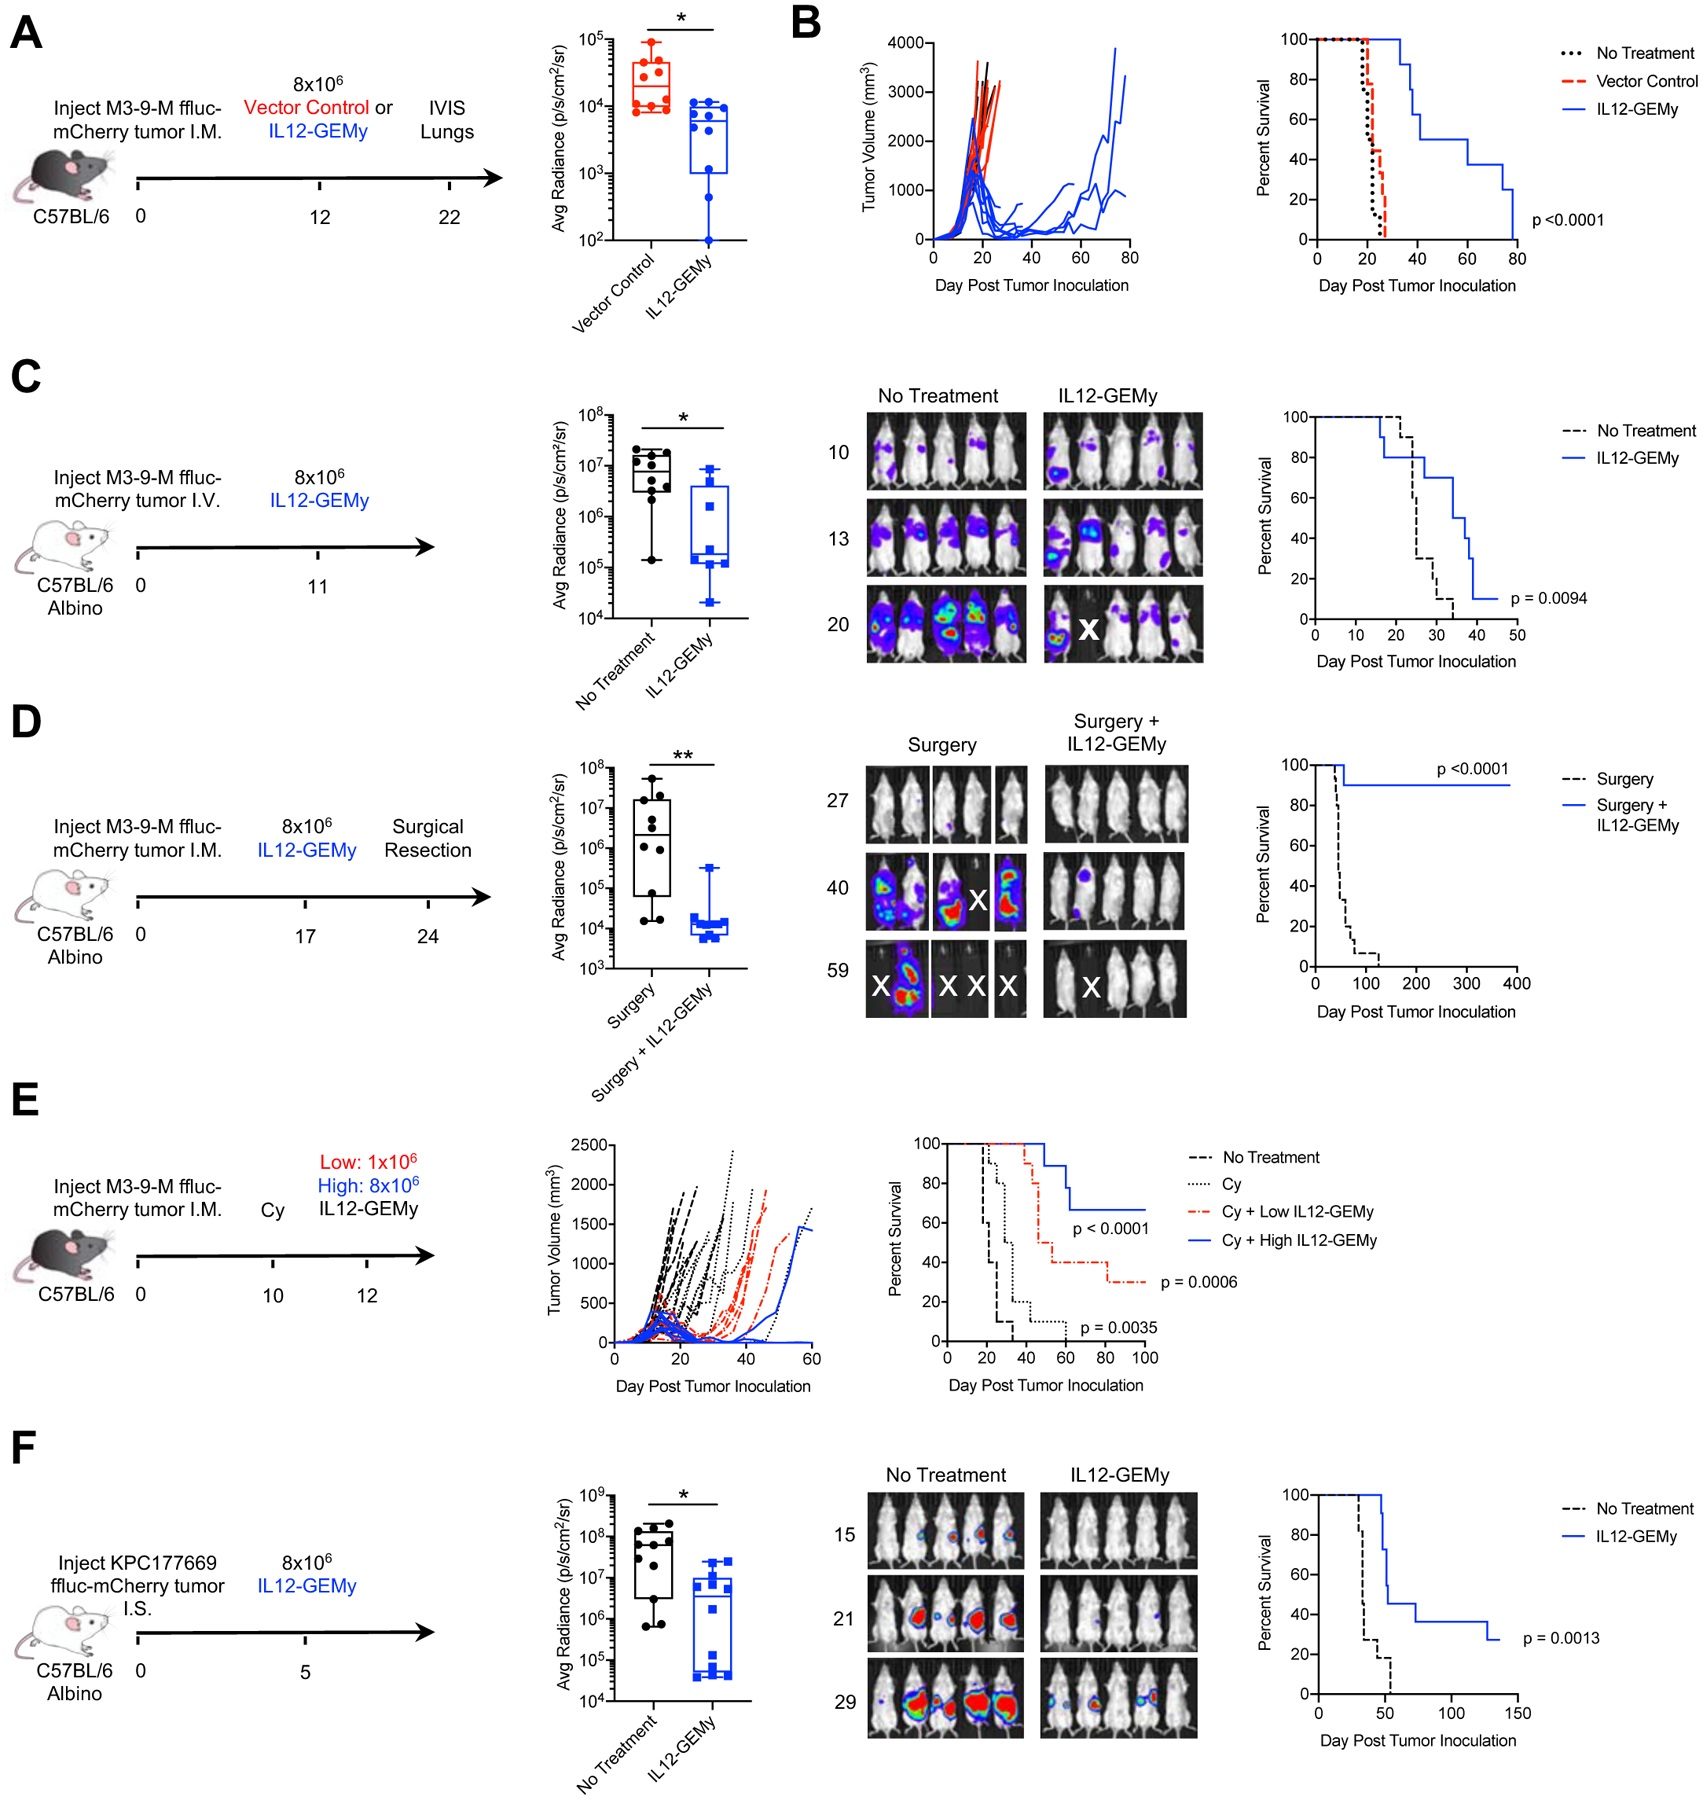
A-B) Mice were injected orthotopically with 5×10⁵ M3-9-M ffluc-mCherry tumor cells and treated with 8×10⁶ vector control or IL12-GEMys on day 12. A) Lungs were harvested on day 22 and bioluminescent metastatic burden in the lungs was measured using an in vivo imaging system (IVIS) (n=10 mice per group) and analyzed by Kolmogorov-Smirnov test. B) Mice were monitored for tumor growth and survival (n=10 mice per group) analyzed by Log-rank (Mantel-Cox) test. C) Mice were injected with 5×10⁴ M3-9-M ffluc-mCherry via tail vein and treated with 8×10⁶ IL12-GEMy i.v. 11 days post tumor injection, then followed for survival and metastatic progression by bioluminescent imaging using IVIS (no treatment n=10, IL12-GEMy n=8). Quantification is shown on day 20 post tumor inoculation and analyzed by Kolmogorov-Smirnov test. Representative IVIS images and average radiance of tumor-bearing mice are shown. Survival curves were analyzed by Log-rank (Mantel-Cox) test. D) Mice were orthotopically injected with 5×10⁵ M3-9-M ffluc-mCherry cells and treated with 8×10⁶ IL12-GEMys on day 17 followed by primary tumor resection by amputation of the tumor-bearing leg on day 24 and monitored for metastatic progression and survival by IVIS (no treatment n=15, IL12-GEMy n=10). Average radiance of mice on day 40 post tumor injection analyzed by Kolmogorov-Smirnov test and representative IVIS images are shown. E) Mice were orthotopically inoculated with 5×10⁵ M3-9-M ffluc-mCherry cells. On day 10, groups of mice were left untreated or given a single dose of 2 mg cyclophosphamide (Cy) i.p. On day 12, groups of mice were left untreated or treated with 1×10⁶ or 8×10⁶ IL12-GEMys i.v. (labeled “Low IL12-GEMy” and “High IL12-GEMy,” respectively) and followed for primary tumor growth and survival (n=10). Statistics measured by Log-rank (Mantel-Cox) test. are shown for Cy compared to no treatment (p=0.0035), Cy + Low IL12-GEMy compared to Cy (p=0.006), and Cy + High IL12-GEMy compared to Cy (p<0.001). F) Mice were injected intrasplenically with 5×10⁵ KPC177669-ffluc2-mCherry cells, spleens were resected, and mice were treated with 8×10⁶ IL12-GEMys on day 5. Mice were monitored for survival and tumor growth by IVIS. average radiance of tumor-bearing mice on day 29 analyzed by Kolmogorov-Smirnov test and representative IVIS images and are shown (no treatment n=11, IL12-GEMy n=12). Survival data were tested for significance by Log-rank (Mantel-Cox) test. **** p < 0.0001; *** 0.0001 < p < 0.001; ** 0.001 < p < 0.01; * 0.01 < p < 0.05. In boxplots, the center line represents the median, the box limits denote the 25th to the 75th percentile and the whiskers represent the minimum and maximum value. See also Figure S6E–G.
To determine whether IL-12 delivery by GEMys is important or whether the presence of IL-12 in the myeloid cell culture results in therapeutic efficacy, we adoptively transferred control myeloid cells, in vitro IL-12 pre-treated myeloid cells, or IL12-GEMys into tumor-bearing mice. IL12-GEMy treatment significantly improved survival compared to non-treated mice (p=0.0006) and had significantly smaller primary tumors at endpoint than mice without treatment or mice receiving non-transduced myeloid or IL-12 pre-treated myeloid cells (Fig. S6E). Lungs from IL12-GEMy-treated mice had significantly less metastatic burden and frequency of metastasis compared to lungs from non-treated mice (Fig. S6F). By contrast, there was no significant difference in survival, primary tumor growth or metastasis in mice that received either control or IL-12 pre-treated myeloid cells compared to mice without treatment (Fig. S6F). Together these results demonstrate that the delivery of IL-12 by GEMys significantly reduces spontaneous metastasis in mice.
To evaluate the impact of IL12-GEMy treatment on metastatic tumors independent of primary tumor growth, mice were injected with tumor cells i.v. to establish lung lesions followed by IL12-GEMy treatment eleven days later and assessed for metastatic progression by bioluminescence imaging (Fig. 4C). Mice treated with IL12-GEMys had decreased metastatic burden and increased survival, indicating that IL12-GEMys limit aggressive metastatic tumor growth.
Clinically, many rhabdomyosarcoma patients undergo surgical resection of their primary tumor; however, 30% of patients later relapse with metastatic disease (Pappo et al., 1999). In order to model neo-adjuvant treatment and metastasis independent of effects on primary tumor but in the presence of pre-metastatic niche formation, tumor-bearing mice were treated with IL12-GEMys followed by amputation of the tumor-bearing leg one week after treatment. A single dose of IL12-GEMy cell therapy prior to tumor resection significantly extended the survival of mice, with no evidence of disease over one year after treatment in 90% of mice, while all mice receiving surgery alone succumbed to relapsed disease (Fig. 4D).
To determine whether the efficacy of IL12-GEMy treatment is dose-dependent, we administered either a single high dose or low dose of IL12-GEMys to mice with established primary tumors (Fig. S6G). Low dose IL12-GEMys resulted in transient tumor regression in 20% of the mice with no significant improvement in survival, while high dose IL12-GEMys resulted in more durable tumor regressions in 100% of mice, significantly enhancing the survival of mice relative to low dose IL12-GEMys (p=0.0003) (Fig. S6G). These data indicate that the therapeutic efficacy of IL12-GEMys is dose-dependent.
Many immunotherapies have demonstrated enhanced efficacy when used in combination with chemotherapy conditioning due to enhanced production of homeostatic chemokines and cytokines that occurs with chemotherapy-induced leukopenia (Turtle et al., 2016, Heczey et al., 2017). Moreover, many T cell-based immunotherapies require chemotherapy pre-conditioning for optimal effect, leading us to ask whether the same might be true for myeloid cell-based therapies. To test if the efficacy of IL12-GEMy therapy is enhanced by cyclophosphamide chemotherapy pre-conditioning, M3-9-M tumor-bearing mice were administered a single dose of 2 mg cyclophosphamide ten days post tumor inoculation followed by IL12-GEMy treatment two days later (Fig. 4E). Cyclophosphamide alone had a modest delay in primary tumor growth and significantly increased survival compared to non-treated mice (p=0.0035) (Fig. 4E). The combination of cyclophosphamide with either low dose or high dose IL12-GEMys demonstrated a marked decrease in tumor progression and significantly improved survival compared to cyclophosphamide alone (Fig. 4E). Furthermore, cyclophosphamide combined with IL12-GEMy treatment was curative in 30% of mice receiving a low dose of IL12-GEMys and reached 66.7% in mice that received a high dose of IL12-GEMys (Fig. 4E). These data indicate that the therapeutic benefit of chemotherapy pre-conditioning may be generalized to many types of cell-based immunotherapies and can greatly improve outcomes for IL12-GEMy therapy.
Given that IL12-GEMys can home to the liver (Fig. S5D) and to extend our findings to an epithelial tumor model, we tested the impact of IL12-GEMy therapy on cancer progression in a highly aggressive pancreatic cancer liver metastasis model. KPC177669 is a Kras−/p53− tumor cell line derived from the KPC mouse model (Lee et al., 2016) that metastasizes specifically to the liver when cells are delivered into splenic circulation. Administration of IL12-GEMys five days post intrasplenic injection of tumor cells delayed primary tumor and metastatic outgrowth and significantly extended the survival of mice with KPC177669 pancreatic tumors (p=0.0013) (Fig. 4F). Together, these data indicate that IL12-GEMy therapy targets the metastatic process in multiple tumor models as well as the pre-metastatic niche of the liver. Our data demonstrate, the therapeutic efficacy of the i.v. administration of a myeloid-based immunotherapy for the treatment of tumor progression and metastasis.
IL12-GEMy therapy activates T cell responses and is dependent on CD8+ T cells
Given the efficacy of IL12-GEMy therapy, we sought to further investigate the mechanism of action of IL12-GEMys in metastatic regulation. As pathways associated with T cell activation were upregulated in the lungs of IL12-GEMy treated mice (Fig. 3A), we more closely examined the mechanism of T cell activation by IL12-GEMys. Based on our findings of a strong Ifng gene signature in the transcriptomic analysis of whole lung (Fig. 3A) and the induction of Ifng in the cytotoxic T cell cluster by single cell analysis (Fig. 3E), we evaluated the ability of IL12-GEMys to induce IFNγ production by T cells. Co-culture of T cells with IL12-GEMys enhanced the ability of both naïve and activated OT-I CD8+ and OT-II CD4+ T cells to produce IFNγ in vitro in response to cognate peptide relative to co-culture with control myeloid cells (Fig. 5A). These data demonstrate the direct impact that IL12-GEMys have on T cell IFNγ-production and support our previous findings that IL12-GEMy function, at least in part, by inducing IFNγ production by T cells in vivo.
Fig. 5: IL12-GEMy treatment induces T and NK cell activation.
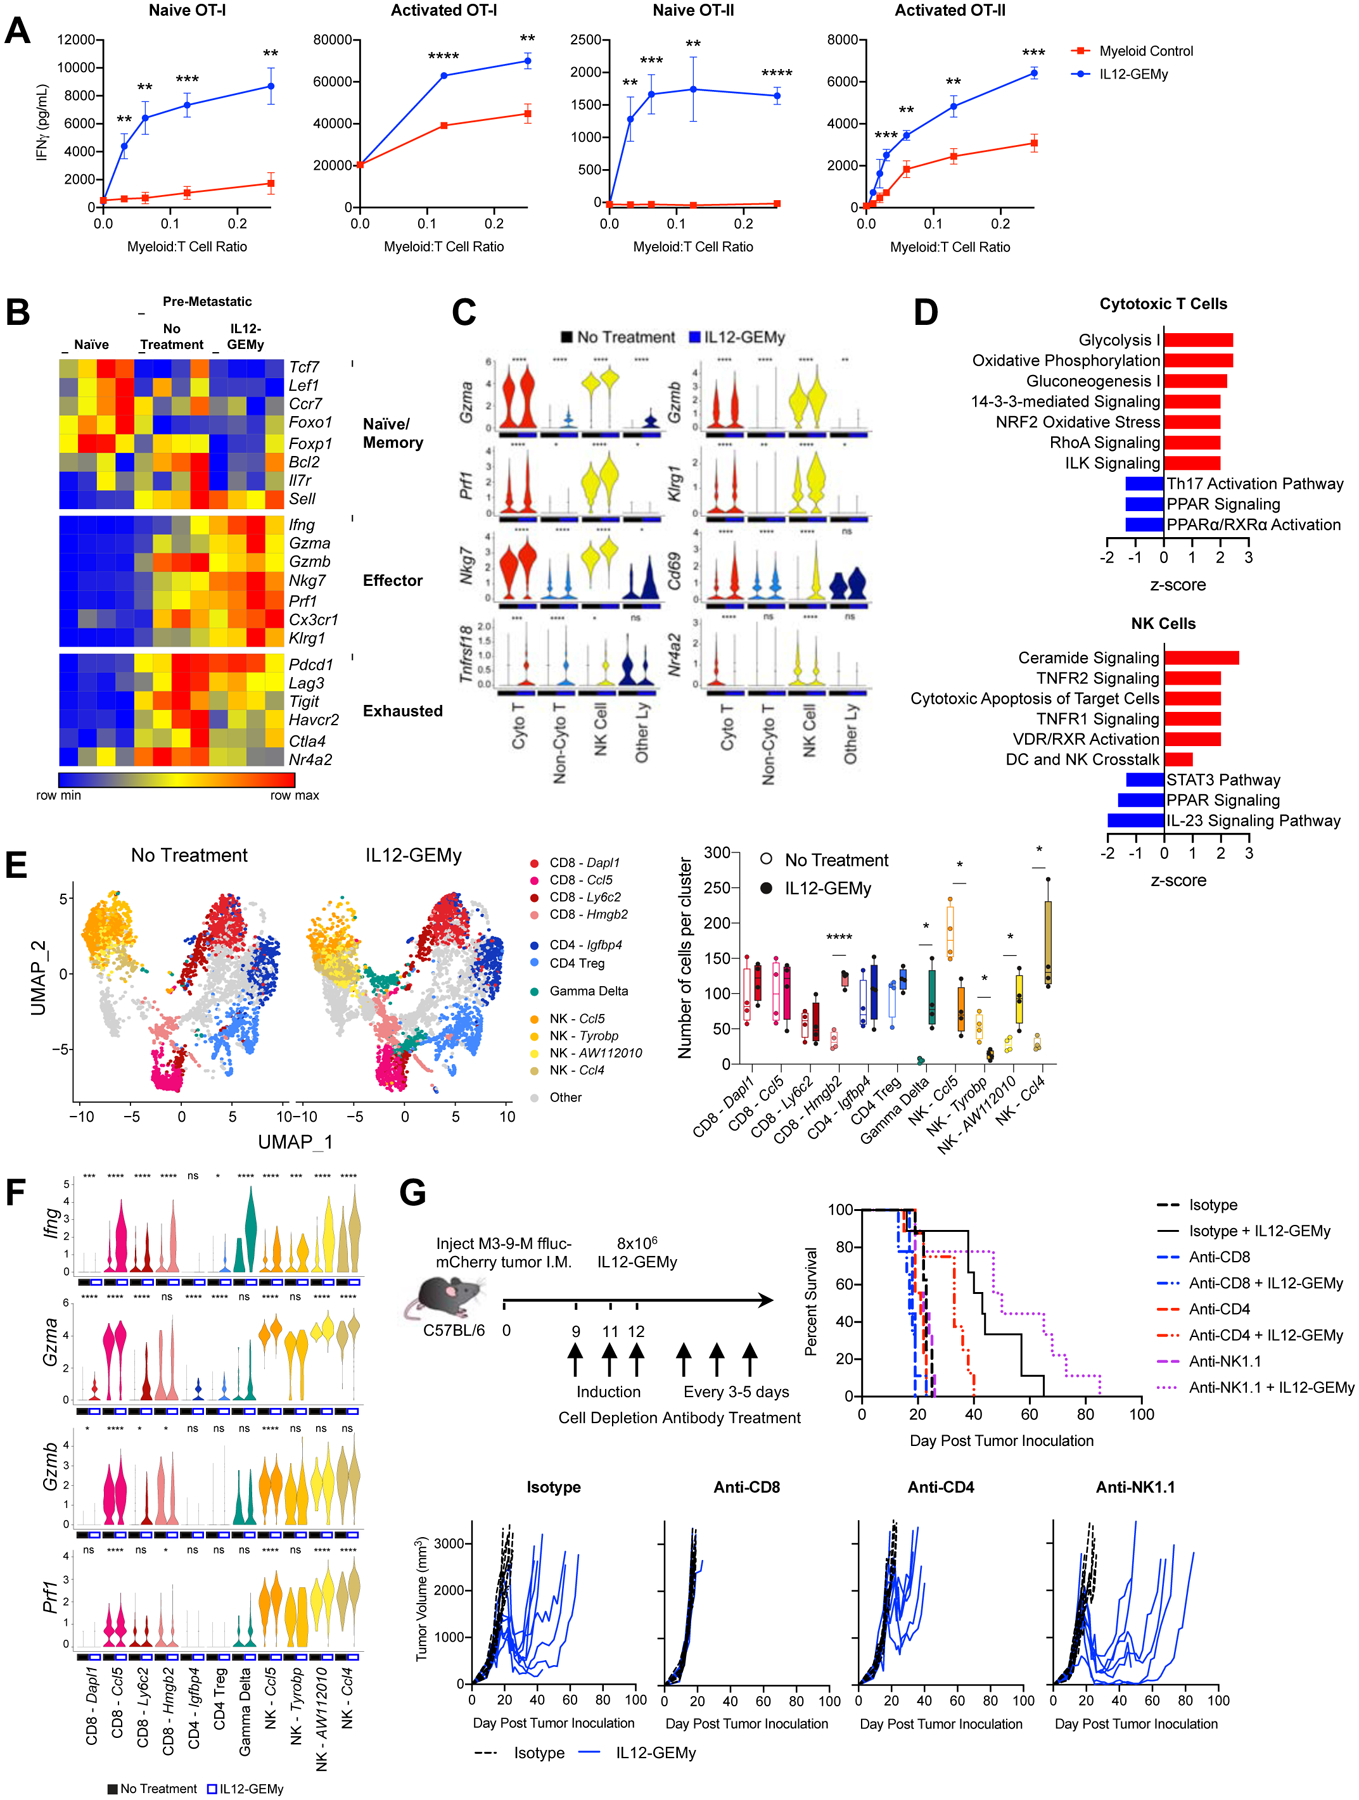
A) Naïve or activated splenocytes from OT-I or OT-II mice were co-cultured with non-transduced control myeloid cells or IL12-GEMys at various ratios and IFNγ was quantified by ELISA at 24 hours. Statistical analysis was performed by unpaired t test at each ratio. B) The expression of key T cell phenotype genes in bulk RNA isolated from the lungs of naïve, tumor-bearing mice, or 8×10⁶ IL12-GEMy treated tumor-bearing mice on day 15 post primary tumor inoculation and 3 days after IL12-GEMy treatment (n=4). C) Violin plots of scRNA-seq data showing gene expression by cluster (n=4). Statistical differences between groups analyzed by Wilcoxon test. Cyto T = cytotoxic T cells; Non-Cyto T = non-cytotoxic T cells; NK Cells = natural killer cells; Other Ly = other lymphocytes. D) Ingenuity pathway analysis of cytotoxic T cell and NK cell clusters from single cell RNA sequencing. Red bars indicate positive z-scores and blue bars indicate negative z-scores. E) Cytotoxic T cell, Non-Cytotoxic T cell, NK cell, and Other Lymphocyte clusters were subsetted from the whole lung scRNA-seq analysis and reclustered to identify more specific cell subsets. UMAP plots and the number of cells per cluster is shown. Statistical analysis between groups was performed by Kolmogorov-Smirnov test of each cluster. F) The expression level of genes associated with effector function and cytotoxicity in the high resolution T and NK cell clusters. Statistical differences between groups analyzed by Wilcoxon test. G) M3-9-M ffluc-mCherry tumor-bearing mice were treated with 200 ug of isotype, anti-CD8, or anti-CD4 antibody or 100 ug of anti-NK1.1 antibody i.p. on days 9, 11, and 12 to induce depletion of cell populations. 8×10⁶ IL12-GEMys were injected intravenously on day 12. Depletion antibody treatment was continued at 200 ug per dose every 3–5 days for the duration of the experiment. Survival and tumor growth of mice treated with IL12-GEMys and antibody depletion regimens are shown (n=9). Survival data were tested for significance by Log-rank (Mantel-Cox) test. **** p < 0.0001; *** 0.0001 < p < 0.001; ** 0.001 < p < 0.01; * 0.01 < p < 0.05. In line graphs, data are represented as mean ± SEM. In boxplots, the center line represents the median, the box limits denote the 25th to the 75th percentile and the whiskers represent the minimum and maximum value. See also Figure S6H and Figure S7A.
Whole lung deep transcriptomic profiling of IL12-GEMy-treated mice demonstrates low expression of genes associated with naïve T cells and elevated expression of genes associated with effector function and cytotoxicity, suggesting that IL12-GEMy cell therapy promotes the activation of cytotoxic T cell responses (Fig. 5B). Furthermore, the expression of genes associated with T cell exhaustion is low, suggesting that T cells are being functionally activated in the lungs of IL12-GEMy-treated mice (Fig. 5B). Single cell analysis demonstrates the upregulation of key cytotoxicity and activation markers in T cells and NK cells including Gzma, Gzmb, Prf1, Klrg1, Nkg7, Cd69, and Tnfrsf18 (Fig. 5C). Furthermore, expression of the T cell exhaustion regulator Nr4a2 is significantly reduced in CD8+ and NK cells (Fig. 5C) (Chen et al., 2019). Pathway analysis of the cytotoxic T cell cluster from scRNA-seq supports these findings, as metabolic activity associated with T cell activation is significantly enriched in these cells (Fig. 5D). Pathways related to NK cell activation, including ceramide signaling and cytotoxic apoptosis of target cells, are upregulated by IL12-GEMy treatment (Fig. 5D). These data implicate cytotoxic T and NK cells as key effectors of IL12-GEMy cell therapy on limiting metastatic progression.
To gain a more detailed understanding of T and NK cell populations in the pre-metastatic niche following IL12-GEMy treatment, we selected the cytotoxic T cell, non-cytotoxic T cell, NK cell, and other lymphocyte clusters from our scRNA-seq analysis and performed higher resolution clustering analysis on these cell subsets (Fig. 5E, Fig. S6H). We observe a significant increase in CD8+ Hmgb2 expressing cells and gamma delta (γδ) T cells (Fig. 5E). Interestingly, we found a decrease in NK cells expressing Ccl5 and Tyrobp with an increase in NK cells expressing AW112020 and Ccl4 (Fig. 5E). Furthermore, we found that the Ccl5 expressing CD8+ T cell and NK cell clusters had the highest upregulation of Ifng and cytotoxic factors Gzma, Gzmb, and Prf1 in response to IL12-GEMy treatment (Fig. 5F). All of the NK cell clusters expressed these effector genes even in absence of treatment, which were further upregulated in the presence of IL-12 (Fig. 5F). Of note, the γδ T cell cluster very significantly upregulated Ifng expression, which has been associated with the antitumor function of γδ T cells (Schilbach et al., 2020) (Fig. 5F). Together, these data provide insights into cell-specific responses to IL-12 in the pre-metastatic niche.
Given the robust activation of genes and pathways associated with T and NK cell function, we next tested which immune cell populations are necessary for the function of IL12-GEMys. We performed in vivo antibody depletion experiments to target CD8+, CD4+, or NK1.1+ cells to evaluate which lymphoid populations are necessary for mediating the efficacy of IL12-GEMy therapy (Fig. 5G). Specific cell depletion was confirmed by flow cytometry of peripheral blood one week after initiation of the depletion antibody regimen (Fig. S7A). IL12-GEMy treatment in the isotype-treated group reduced large established primary tumors and significantly extended survival (p=0.008) of tumor-bearing mice (Fig. 5G). Mice that were depleted of CD8+ cells had no response to IL12-GEMy therapy, indicating that CD8+ cells are essential for the antitumor effect of IL12-GEMys. CD4+ cell targeting had a partial effect on IL12-GEMy efficacy, while depletion of NK1.1+ cells in combination with IL12-GEMy treatment did not have a significant difference in survival compared to the isotype plus IL12-GEMy treatment. These data demonstrate that CD8+ T cells play a critical role in the mechanism of action of IL12-GEMy therapy.
IL12-GEMy treatment enhances adoptive T cell therapy and generates long-lived immunological memory
Given that IL12-GEMy therapy is dependent on CD8+ T cells and promotes the activation of T cells in vitro and in vivo, we investigated the impact of IL12-GEMy therapy on the efficacy of adoptive T cell therapy. An ovalbumin (OVA)-expressing M3-9-M cell line was generated and confirmed to be recognized by CD8+ OT-I T cells (Fig. S7B–C). OT-I T cells, IL12-GEMys, or a combination of the two were transferred into M3-9-M ffluc-mCherry-OVA tumor-bearing mice at sub-therapeutic doses of IL12-GEMys and T cells (Fig. 6A). The transfer of low dose OT-I T cells or IL12-GEMys alone did not impact primary tumor growth or survival. However, the combination of adoptive transfer of IL12-GEMys and OT-I T cells significantly increased the survival of the mice (p<0.0001) and delayed primary tumor growth (Fig. 6A). This enhancement of therapeutic activity was elicited in the absence of any preconditioning regimen, suggesting that the reversal of immune suppression with IL12-GEMy cell therapy was sufficient to enhance the antitumor activity of transferred T cells.
Fig. 6: IL12-GEMy treatment is enhanced by combination with adoptive transfer of tumor-specific CD8+ T cells or chemotherapy pre-conditioning and generates long-lived tumor-specific memory.
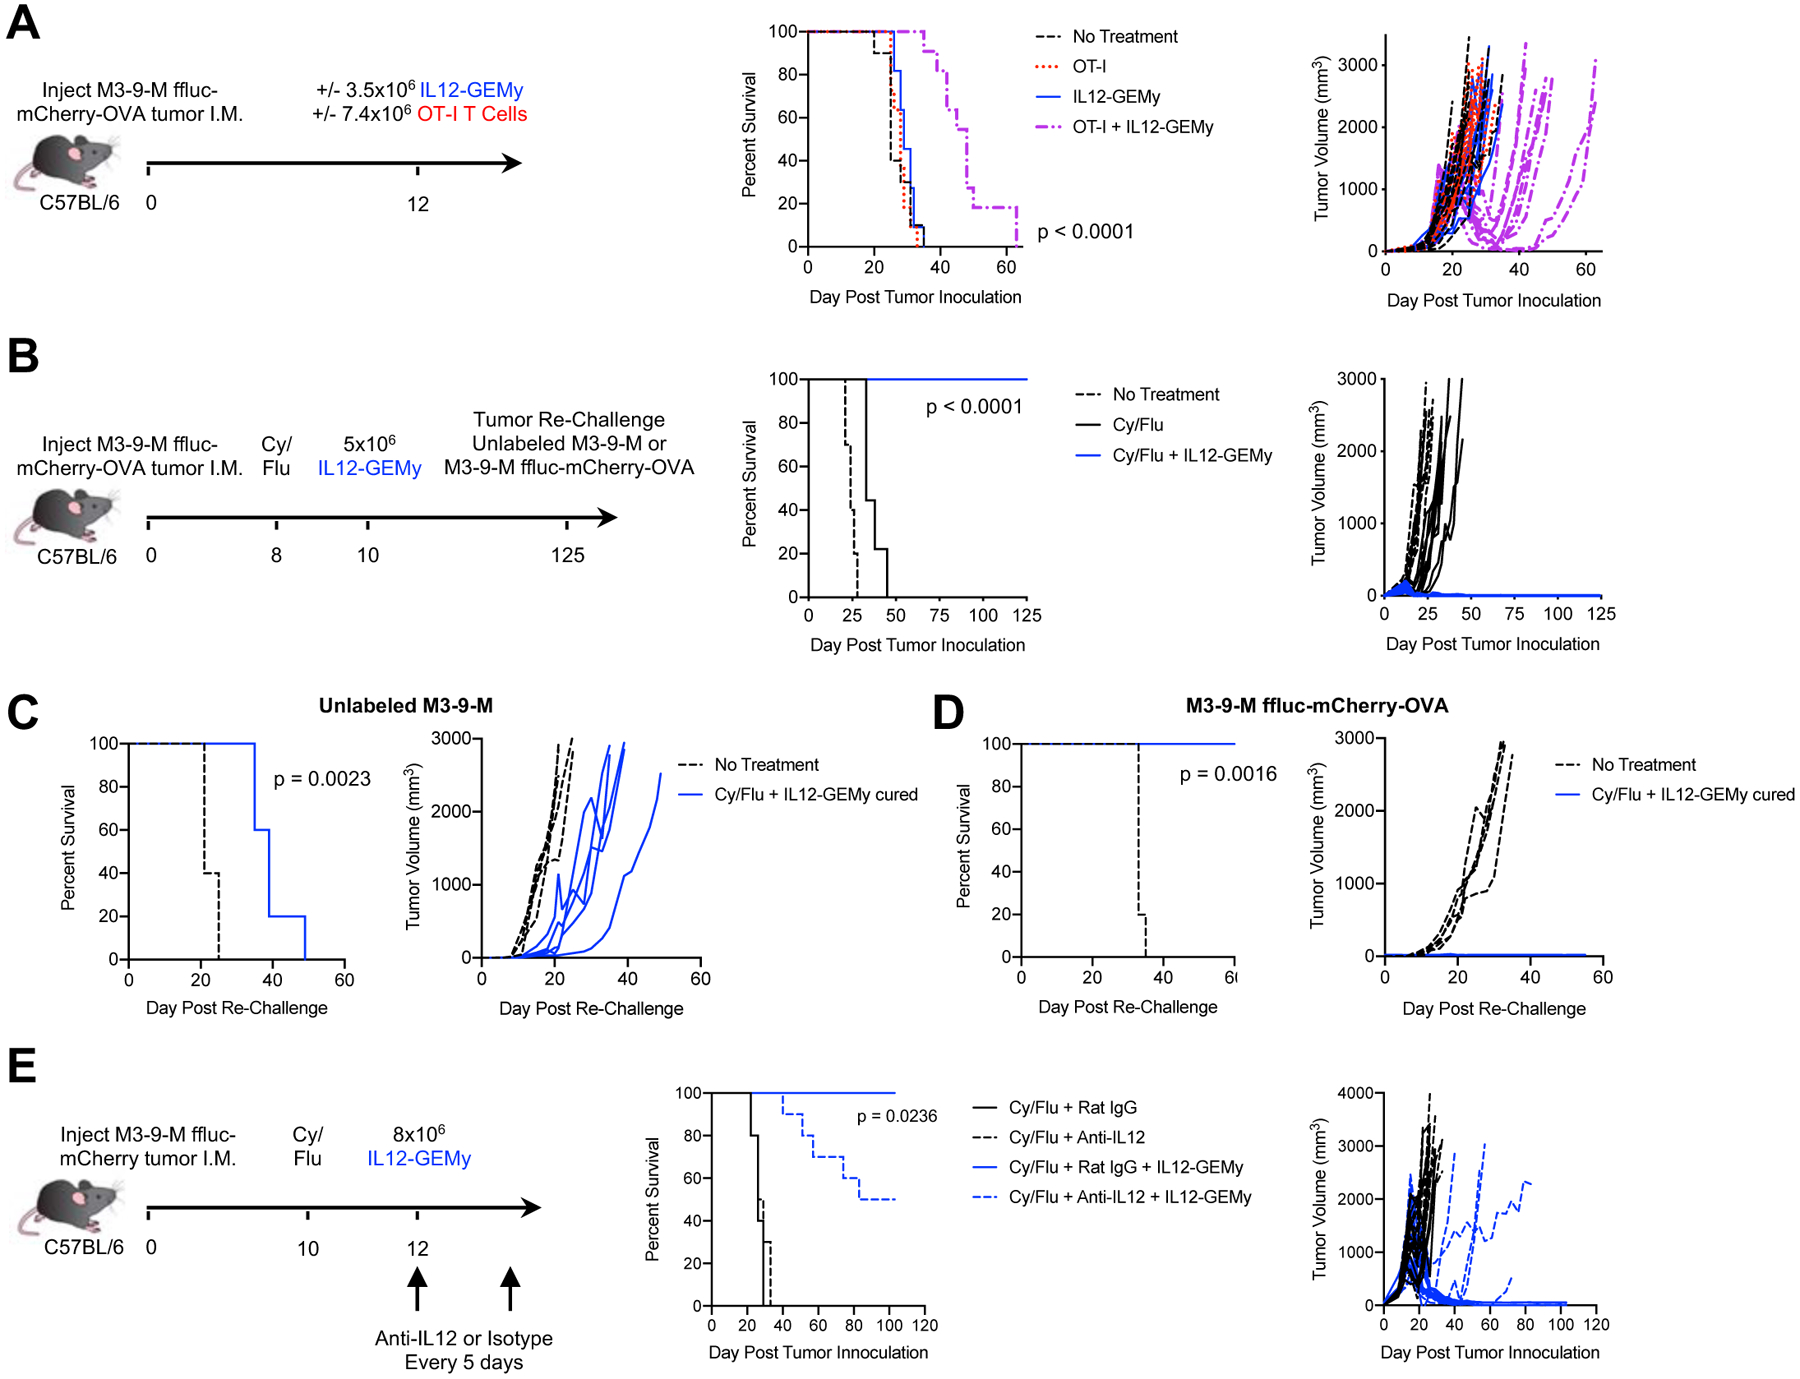
A) Mice were orthotopically injected with M3-9-M ffluc-mCherry-OVA tumors. Mice received either no treatment (n=10), 7.4×10⁶ OT-I T cells (n=11), 3.5×10⁶ IL12-GEMy (n=11), or both (n=11) intravenously on day 12. B) Mice were orthotopically injected with M3-9-M ffluc-mCherry-OVA and treated with 2 mg of cyclophosphamide and 5 mg of fludarabine i.p. on day 8. Mice received 5×10⁶ IL12-GEMys intravenously on day 10. Survival and tumor growth were monitored over time (no treatment n=10, Cy/Flu n=9, Cy/Flu + IL12-GEMy n=10). IL12-GEMy-cured mice were re-challenged with C) unlabeled M3-9-M cells or D) M3-9-M ffluc-mCherry-OVA in the contralateral leg compared to naïve age-matched controls (n=5). E) Mice were orthotopically injected with M3-9-M ffluc-mCherry tumor, treated with 2 mg of cyclophosphamide and 5 mg of fludarabine i.p. on day 10, and 8×10⁶ IL12-GEMys on day 12. Anti-IL12 or Rat IgG isotype antibody was administered starting on day 12 and every 5 days for the duration of the experiment (n=10). Survival data were tested for significance by Log-rank (Mantel-Cox) test. See also Figure S7.
T cell therapies currently used in the clinic are given following a pre-conditioning regimen of cyclophosphamide and fludarabine (Cy/Flu) (Heczey et al., 2017). Patients on trial for CD19 chimeric antigen receptor (CAR)-T cells who receive Cy/Flu pre-conditioning had greater CAR-T expansion, persistence, and higher response rates than patients pre-conditioned with Cy alone (Turtle et al Sci. Transl. Med. 2017). Cy/Flu pre-conditioning has been shown to increase efficacy through the enhanced engraftment and expansion of transferred T cells (Turtle et al Sci. Transl. Med. 2017). The suggested mechanism of action of this pre-conditioning is to deplete endogenous peripheral immune cells to create immunological space and increase the availability of cytokines for the homeostatic expansion of transferred cells (Bracci et al Clin. Cancer Res. 2007, Hirayama et al Blood 2019, Neelapu Blood Commentary 2019). We observed lower levels of circulating T cells following Cy/Flu pre-conditioning while myeloid populations were not impacted (Fig. S7D). Lymphodepletion is a transient phenomenon, with endogenous lymphocyte populations rebounding by homeostatic proliferation (Liu et al J. Immunother. 2011, Sistigu et al Semin. Immunopathol. 2011, Gershan et al J. Immunother. Cancer 2015). Notably, when combined with a single-dose pre-conditioning regimen of Cy/Flu two days preceding cell transfer, IL12-GEMy cell therapy resulted in durable cures (>100 days) of mice with established primary tumors (Fig. 6B). Cy/Flu pre-conditioning significantly increased the presence of transduced IL12-GEMy cells in the lungs but not primary tumors of mice four days after injection (Fig. S7E). The presence of IL12-GEMys in the lung decreases over time, indicating that the cell product does not have long-term persistence in vivo (Fig. S7E). We observe an increased trend in IL-12 levels and a ten-fold increase in IFNγ levels in the lungs and primary tumors of mice treated with Cy/Flu and IL12-GEMys compared to IL12-GEMys without Cy/Flu pre-conditioning (Fig. S7F). This enhanced IFNγ response is associated with a robust expansion of PD-1+Lag3− CD8+ T cells in both the lung and tumor, with the response peaking earlier in the lung at one week after treatment and later in the primary tumor, close to 20 days after IL12-GEMy injection (Fig. S7G). We observe a contraction of this CD8+ T cell response with resolution and cure of the tumors (Fig. S7G). Together, these data demonstrate that a small, transient number of IL12-GEMys in the context of Cy/Flu pre-conditioning has the ability to induce a robust immune response in the pre-metastatic niche of the lung and in the primary tumor, resulting in tumor regression and long-term cure.
IL-12 can act on effector T cells to promote the production of memory T cells that persist in a functional immune response and provide protective immunity (Xiao et al., 2009). In order to interrogate IL12-GEMy function in eliciting a memory response, cured mice were re-challenged with either unlabeled tumor or the original OVA-expressing tumor in the contralateral leg. When re-challenged with unlabeled M3-9-M, lacking the strong OVA antigen, IL12-GEMy-cured mice displayed a statistically significant delay in tumor growth relative to age-matched naïve controls (p=0.0023), evidence that IL12-GEMys elicit endogenous T cell responses that recognize multiple tumor antigens, including non-dominant antigens (Fig. 6C). Mice re-challenged with the original tumor line were immune over 100 days post-IL12-GEMy treatment, consistent with the generation of functional memory T cells (Fig. 6D).
We investigated the role of IL-12 in the maintenance of IL12-GEMy-induced remission. Mice were treated with anti-IL12 or isotype antibody and IL-12 depletion in the serum was confirmed by ELISA (Fig. S7H). 50% of mice receiving anti-IL12 blocking antibody relapsed, suggesting that IL-12 is required for long-term tumor control (Fig. 6E).
Together, these studies demonstrate that IL12-GEMys support the function of tumor-specific CD8+ T cells by enhancing suboptimal T cell therapy, and that IL12-GEMy therapy in combination with Cy/Flu pre-conditioning is capable of generating durable cures with endogenous T cell memory to multiple antigens. This stimulation of adaptive immune responses coupled with the reversal of the immune suppression program has a profound impact on tumor and metastatic progression.
Generation of human IL12-GEMys
To translate our findings into the human setting, we transduced human monocyte SC cells with lentiviral vector encoding human IL-12 with truncated epidermal growth factor receptor (tEGFR) as a reporter for transduction efficiency (Fig. 7A–B). To test the ability of human IL12-GEMys to induce IFNγ production by T cells, human IL12-GEMys were co-cultured with bead-stimulated donor human lymphocytes at varying ratios. Human IL12-GEMys significantly increased the secretion of IFNγ by human lymphocytes compared to vector control transduced SC cells (Fig. 7C). These data demonstrate the expression of functional IL-12 in a human monocyte cell line and their ability to induce IFNγ production by human lymphocytes.
Fig. 7: Generation of human IL12-GEMys.
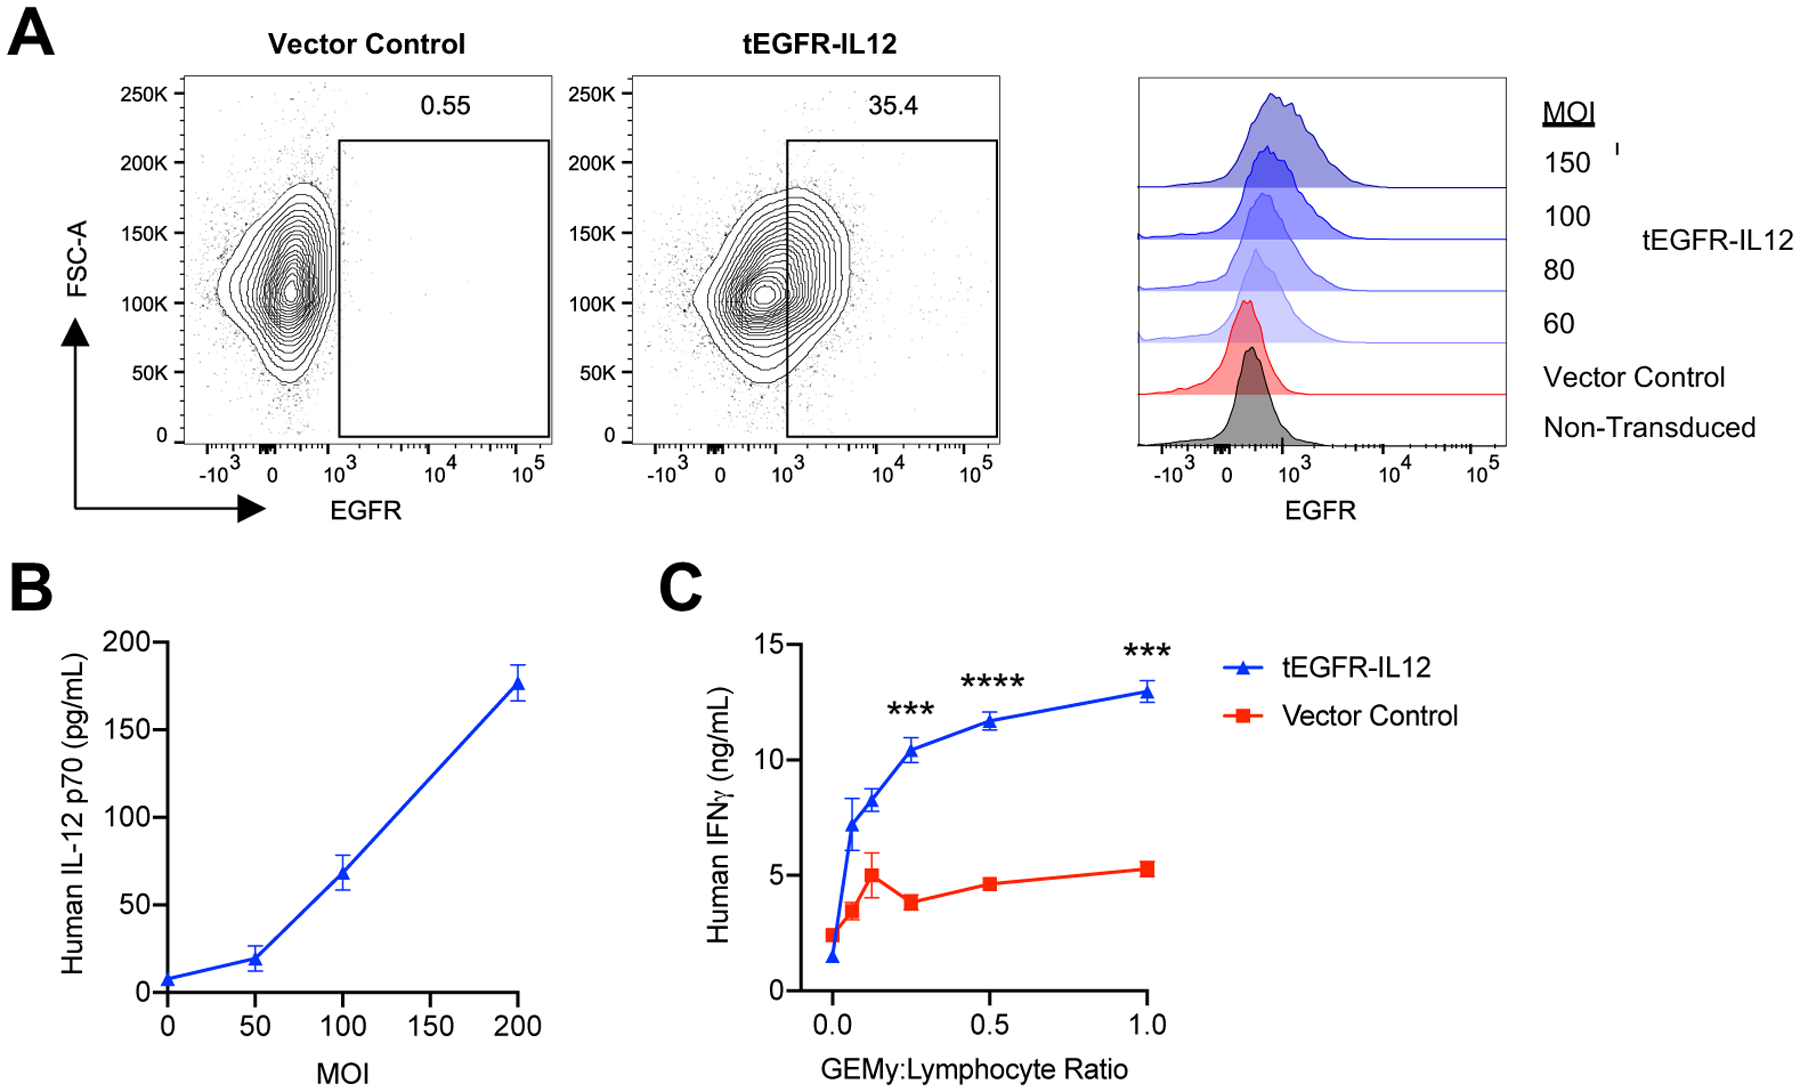
Human monocyte SC cells were transduced with vector control or tEGFR-IL12 lentiviral vector for 24 hours. A) Transduction efficiency was measured by flow cytometry staining of truncated epidermal growth factor receptor (tEGFR) expression with varying multiplicity of infection (MOI) at 24 hours. Representative flow plots of MOI 150 are shown. B) IL12-GEMys were washed after 24 hour transduction and cultured for an additional 3 days. Human IL-12 production was measured by ELISA. C) Vector control or tEGFR-IL12 monocyte SC cells were transduced at an MOI of 150 for 24 hours, washed, and co-cultured with donor lymphocytes stimulated with TransAct beads and 40 units/mL of recombinant human IL-2 at varying GEMy:Lymphocyte ratios. Supernatant was collected at 24 hours and analyzed for IFNγ production by ELISA. Statistical analysis was performed by unpaired t tests for each ratio. **** p < 0.0001; *** 0.0001 < p < 0.001; ** 0.001 < p < 0.01; * 0.01 < p < 0.05. Data are represented as mean ± SEM.
Discussion
We found that there is a marked myeloid-derived core immune suppression transcriptional signature in the pre-metastatic lung. We demonstrate that this pre-metastatic niche signature is a coordinated, multigenic program that induces the upregulation of many genes while few genes are downregulated (Fig. 1C), signifying an active immune suppression process rather than a failure of adaptive immune activation. Further, we identified parallels in myeloid mediated immune suppression genes which are found in the pre-metastatic niche as well as in the human bone marrow stem cell niche (Fig. S4). Although this transcriptional signature is most notably upregulated in myeloid cell populations, it is important to acknowledge that multiple other cell types also contribute to this immunosuppressive program and others features of the pre-metastatic niche (Murgai et al., 2017, Liu and Cao, 2016). These findings are remarkably consistent with transcriptomic profiling of pre/early metastatic microenvironment by other groups with diverse metastatic tumor models (Fig. S2D) (Hiratsuka et al., 2008, Liu et al., 2016, Shao et al., 2018, Yamamoto et al., 2008, Lee et al., 2019). Our study provides a better understanding of how various cell types in the pre-metastatic niche create an immunoregulatory environment.
The application of myeloid cells as a platform to reshape immunosuppressive microenvironments is a previously unappreciated strategy to target cancer progression. There is a large body of literature highlighting the importance of myeloid cell homing to human tumors and metastatic sites (Gabrilovich, 2017, Gabrilovich et al., 2012, Kumar et al., 2016, Qian et al., 2009, Veglia et al., 2019, Albrengues et al., 2018, Guldner et al., 2020). In our pre-clinical models, the introduction of IL12-GEMys reversed the core immune suppression gene program (Fig. 3B) by disrupting the pre-metastatic niche environment to establish effective adaptive immunity (Fig. 5B–D), demonstrating the powerful impact that myeloid cells have in orchestrating immune responses. We highlight that the adoptive transfer of IL12-GEMys drives the plasticity of multiple different cell types towards an antitumor phenotype (Fig. 3E–G), suggesting that reversing these immunosuppressive programs in lieu of depleting specific cell populations is an effective therapeutic strategy. Although myeloid cell depletion is an active area of investigation that holds promise, this approach is not without shortcomings (Awad et al., 2018). The depletion of immunostimulatory myeloid populations enhances tumor growth, myeloablative therapy leaves patients immunocompromised and at risk for life-threatening infections, and myeloid depletion may result in a rebound of immunosuppressive myeloid populations produced by the bone marrow that can accelerate tumor progression (Awad et al., 2018, Bonapace et al., 2014). Furthermore, despite multiple studies implicating any one particular cell population, our data highlight that a single cell type is not responsible for immune suppression; rather, immune suppression is driven by a transcriptional program expressed in many interacting cell populations. Given the diversity of myeloid populations, the individual contribution of specific cell types and differentiation states within the IL12-GEMy product is still not fully characterized, however, we hypothesize that the heterogeneity of the cell product is an advantageous quality as different cell types can possess varying levels of persistence, homing, and functionality that come together for remarkable therapeutic efficacy. We show that, despite the findings that IL12-GEMys have a low transduction efficiency (Fig. S5A), limited persistence (Fig. S7E) and induce transiently elevated IL-12 and IFNγ levels in vivo (Fig. 2D, Fig. S5C), we observe long-lasting tumor control (Fig 4, 6). Our data with IL-12 inhibition suggest that immune surveillance is IL-12 dependent (Fig. 6E). Particularly in the context of Cy/Flu, we observe significantly higher induction of IFNγ responses in the lung and primary tumor by IL12-GEMys (Fig. S7F) that is associated with increased CD8+ T cell responses (Fig. S7G) and complete tumor regression (Fig. 6B). We postulate that durable cures induced by IL12-GEMy treatment may result from the generation of functional memory T cells to anti-tumor targets (Fig. 6B–D) without the need for the long-term persistence of the IL12-GEMys themselves. However, there may be a small population of long-lived cells in the IL12-GEMy product that persists and maintains immune surveillance. These questions are areas of future investigation.
Many current immunotherapeutic strategies are based on mounting T cell responses to specific tumor antigens. The advantage of the myeloid-based approach is the in vivo activation of endogenous T cells and NK cells to mount a more complete immune response paired with the downregulation of immune suppression that often limits the efficacy of T cell-based approaches. Our findings from scRNA-seq of lymphocyte subpopulations demonstrate selective and coordinated cell type specific responses to IL-12 that result in effective anti-tumor immunity and may be exploited for future combination approaches with IL12-GEMys (Fig. 5). Further, the observation that IL12-GEMys can impact cancer progression in the context of both lung and liver metastatic models highlights the potential application to multiple solid tumor malignancies (Fig. 4). With elevated lung IL-12 levels in the lung metastatic sarcoma model (Fig. S5C), we predict that the homing of GEMys is linked to site-specific metastasis. The ability of GEMys to deliver cargo to metastatic sites other than the lung in tumor models that metastasize to other tissues is an area of great therapeutic potential. This technology could provide a platform to capitalize on the intrinsic specificity of myeloid cell homing to the earliest sites of metastases when the lesions might be most susceptible to reversal of immune suppression and activation of T cell immunity. Our studies also suggest that myeloid cells could be successfully combined with T cell-based immunotherapies (Fig. 6A), providing rationale for future combination to enhance CAR-T cell and transgenic T cell receptor approaches for the treatment of solid tumors, which are limited by myeloid-mediated immune suppression (Li et al., 2019, Long et al., 2016, Rodriguez-Garcia et al., 2020). We also demonstrate that Cy/Flu chemotherapy pre-conditioning enhances IL12-GEMy efficacy, resulting in tumor regression and durable cures in our pre-clinical metastatic models (Fig. 6B–D). Further investigations into the mechanism of chemotherapy-mediated improvement of IL12-GEMy therapy are needed.
Together with our preliminary studies in human IL12-GEMys (Fig. 7), our data provide rationale for the clinical application of IL12-GEMys for the treatment of various late-stage malignancies. This body of work opens up exciting avenues for translation, with active investigations into human monocyte persistence, fate decisions of myeloid progenitor cells, and selection of the optimal starting population for the human IL12-GEMy cell product for clinical development. Truncated EGFR is included in the human construct for the monitoring of transduction efficiency, tracking of cells, and for safety to allow cell depletion with cetuximab (anti-EGFR) administration. GEMys can be configured to express variable cargos, receptors, and safety switches, with inducible tissue-specific expression for fine-tuned modulation of the microenvironment. Our vision for this platform in patients with high-risk solid tumors is to have cells collected up front for GEMy production and given to locally activate an immune response and limit the immune evasion responsible for break in tumor dormancy and metastatic outgrowth. This approach has the potential to promote long-lived anti-tumor T cells needed for durable remissions. Our work and others’ support the development of myeloid cell immunotherapy as a disruptive technology in the field of immunotherapy (Klichinsky et al., 2020, Brempelis et al., 2020, Gardell et al., 2020). More broadly, this platform holds promise for harnessing cell-cell communication in both immune and non-immune cell populations to rebalance dysregulated niches in many diseases. Repurposing of targeted agents that demonstrate limited benefit when administered systemically provide a wealth of opportunities for future GEMy cargo. GEMys may deliver factors to target other non-immune mechanisms mediating pre-metastatic niche formation and metastatic progression.
Together, our data provide valuable insight into the cell populations that contribute to a core transcriptional signature of immune suppression in the pre-metastatic niche. Our investigations suggest that the introduction of IL12-GEMys into the local milieu can result in profound transcriptional reprogramming in the pre-metastatic niche environment to subvert immune evasion by disseminated tumor cells. Ultimately, we demonstrate that perturbation of this immunosuppressive microenvironment with the innovative IL12-GEMy immunotherapy platform can have a profound impact on the progression of tumor growth and metastasis. The ability of myeloid cells to locally deliver cytokines or other biological mediators suggests that the applicability of such a platform could extend beyond the immune axis to deliver other key niche modulatory signals with potential application to diseases other than cancer.
Limitations of the Study
This study demonstrates a proof-of-concept for genetically engineering myeloid cells for the treatment of cancer. Additional work will be necessary to translate and evaluate the efficacy of this approach as a human therapy. First, in these studies the mouse bone-marrow-derived GEMy cell product is a heterogenous population of cells. The contributions and persistence of specific cell types has not yet been elucidated. Further, these studies were performed in mouse models that may be more susceptible to immunologic targeting than human tumors and cytokine toxicity may be different in animal models compared to humans. Therefore, the safety switch design in the human studies will be important to limit potential toxicity. Acknowledging these limitations, we can see tantalizing future possibilities based on the findings from this cell therapy platform to reprogram the dysregulated microenvironment.
STAR Methods
Resource Availability
Lead Contact
Further information and requests for resources and reagents should be directed to and will be fulfilled by the Lead Contact, Rosandra Kaplan (rosie.kaplan@nih.gov).
Materials Availability
Reagents generated in this study are available upon request.
Data and Code Availability
Data generated in this study are available in the Gene Expression Omnibus (GEO) database under the accession numbers GSE166763 for bulk RNA-seq and GSE number pending for scRNA-seq data. All the Software packages and methods used in this study are referenced under Method Details.
Experimental Model and Subject Details
Mice
6–10-week-old C57BL/6 and C57BL/6 Albino mice were purchased from Charles River at NCI Frederick. B6.SJL-Ptprca Pepcb/BoyJ (Pepboy), C57BL/6-Tg (TcraTcrb)1100Mjb/J (OT-I), and B6.Cg-Tg (TcraTcrb)425Cbn/J (OT-II) mice were purchased from the Jackson Laboratory. RAG−/− OT-I mice were donated by Terry Fry. Male mice were used for all M3-9-M experiments and female mice were used for KPC177669 experiments. All animal experiments were approved by the NCI Animal Care and Use Committee and were conducted in specific pathogen-free conditions at the NIH Animal facility.
Cell Lines
M3-9-M embryonal rhabdomyosarcoma cells were derived by Crystal Mackall’s group from a tumor in a male from a transgenic mouse overexpressing hepatocyte growth factor and heterozygous for mutated p53 in the Pediatric Oncology Branch at the National Cancer Institute (NCI) (Meadors et al., 2011). KPC177669 pancreatic adenocarcinoma cells were obtained from the NCI Center for Advanced Preclinical Research (CAPR) (Lee et al., 2016). Lenti-X cells were provided by Terry Fry. All cell lines were verified via microarray analysis and routinely tested for mycoplasma. Tumor lines were transduced with pFUGW-Pol2-ffLuc2-eGFP or pFUGW-Pol2-ffLuc2-mCherry and sterile-sorted by fluorescence activated cell sorting (FACS) to establish labeled cell lines. M3-9-M ffluc-mCherry cells were transduced with a retrovirus encoding ovalbumin (pMSCV-OVA) provided by Terry Fry, stained with PE anti-mouse H-2Kb bound to SIINFEKL (BioLegend), and sorted by FACS to establish the M3-9-M ffluc-mCherry-OVA cell line. All tumor cell lines were cultured in complete RPMI: 10% FBS (Atlantic Biologicals), 1% glutamax (Gibco), 1% penicillin-streptomycin (Gibco), 1% non-essential amino acids (Gibco), 1% sodium pyruvate (Gibco), 1 mM HEPES (Gibco), and 50μM 2-mercaptoethanol (Sigma) at 37°C 5% CO2. SC (CRL-9855) human peripheral blood monocyte cells were purchased from ATCC. Cells were cultured in IMDM (Gibco) supplemented with 10% FBS (Atlantic Biologicals), 1% penicillin-streptomycin (Gibco), HT supplement (Gibco), and 50μM 2-mercaptoethanol (Gibco).
Method Details
Tumor Models
For M3-9-M orthotopic tumor experiments, mice were injected in the gastrocnemius muscle with 5×10⁵ M3-9-M cells in 100 μL of HBSS (Gibco). Primary tumors were measured two to three times a week and mice were monitored for survival over time. Tumor volume was calculated as where X, Y, and Z are the radius of each dimension of the mouse leg. For amputation experiments, primary tumors were surgically resected when tumor diameter was approximately 2 cm in the longest direction. For lung colonization experiments, 5×10⁴ M3-9-M ffluc-mCherry cells were injected intravenously (i.v.) via tail vein in 200 μL HBSS. For KPC177669 tumor experiments, mice were injected intrasplenically (Soares et al., 2014, Morikawa et al., 1988). Briefly, mice were anesthetized with isoflurane and an 8–10 mm left subcostal incision was made. The spleen was exteriorized and 5×10⁵ KPC177669-ffluc2-mCherry cells were injected in 100 μL HBSS, followed by an additional 100 μL of HBSS to flush the cells into the portal circulation. After two minutes, splenectomy was performed, and the incision was closed in two layers.
Bioluminescent Tumor Cell Tracking
For metastasis experiments, lesions were detected by whole body in vivo and postmortem ex vivo organ bioluminescence imaging by in vivo imaging system (IVIS). Anesthetized mice received a 100 μL intraperitoneal (i.p.) injection of 30 μg/mL D-luciferin (Gold Biotechnology) and were incubated for five minutes. For ex vivo tissue imaging, tissues were perfused with PBS, harvested, and incubated in 1 μg/ml D-luciferin in PBS for five minutes. Luminescence was detected by IVIS Lumina Series III (Perkin Elmer) for an exposure time of one minute. Display and image analysis were performed using Living Image Software (Perkin Elmer).
Lentivirus Production
Genetic constructs encoding the murine or human p40 and p35 IL-12 subunits fused by a linker sequence (Zhang et al., 2015) and Thy1.1 or truncated epidermal growth factor receptor (tEGFR) as reporter proteins for murine and human constructs, respectively, were synthesized by Genewiz and cloned into the pELNS lentiviral transfer vector under the constitutive EF1α promoter. A construct expressing only Thy1.1 served as a vector control. Lenti-X cells were cultured in high-glucose DMEM supplemented with 10% FBS, 25mM HEPES, 2mM L-glutamine, and 1% penicillin-streptomycin (Gibco) at 37°C 5% CO2. The day preceding lentivirus production, 1.8–2×10⁷ cells were seeded onto 150 mm poly-D-Lysine coated plates (Corning). Cells were transiently transfected with Opti-MEM media (Gibco) containing Lipofectamine 3000 and P3000 (Thermo Fisher Scientific), lentiviral packaging plasmids (pRSV-Rev, pMDLg/pRRE, pMD2.G) and lentiviral vector (Dull et al., 1998). Virus-containing supernatants were harvested at 24 hours and 48 hours, centrifugated to remove cellular debris, and stored at −80°C. Lentivirus was tittered by p24 ELISA (Lonza) to determine lentiviral particles per mL of viral supernatant.
Murine IL12-GEMy Production
Bone marrow was flushed from the femurs and tibia of syngeneic mice with collection media (Mg− Ca− HBSS with 2% FBS and 1mM EDTA) and enriched for hematopoietic stem and progenitor cells using the magnetic bead-based EasySep™ Mouse Hematopoietic Progenitor Cell Isolation Kit (StemCell Technologies) per the manufacturer’s recommended protocol. The isolated cells were cultured in StemSpan SFEM (StemCell Technologies) media supplemented with 50 ng/mL of mouse SCF, IL-6, and FLT3-L (Bio-Techne) and 1% penicillin-streptomycin. Cells were immediately transduced with lentivirus in the presence of 10 μg/mL protamine sulfate (Fresenius Kabi) and cultured at 37°C for four days. Transduction was confirmed by ELISA for IL-12 p70 (R&D Systems) and by flow cytometry analysis for Thy1.1. In cell tracking experiments, B6.SJL-Ptprca Pepcb/BoyJ (Pepboy) mice were used as donors to track the CD45.1 congenic marker.
Tissue Processing
Lungs were perfused with PBS and inflated with digestion medium (HBSS supplemented with 1 mg/mL collagenase I, 20 μg/mL DNAse I and Dispase II). Single-cell suspensions were prepared by finely mincing tissues with a scalpel and incubating the tissue on a shaker at 37°C for 20 minutes in 1 mL of digestion media. Tissue was passed through a 70 μM mesh strainer and washed with collection media twice. Tumors were disassociated using a modified protocol as described (Beury et al., 2016). A fragment of the tumor was placed into a gentleMACs C tube (Miltenyi Biotech) containing 5 mL of digestion media. Tumors were then minced with scissors, processed on the gentleMACS dissociator (Miltenyi Biotech) using the program m_impTumor_02. Tubes were secured in an inverted position and agitated in a 37°C shaker at 100 rpm for 40 minutes. Samples were processed again on the gentleMACS dissociator using program m_impTumor_03, passed through 70 μM cell strainer, and washed with collection media. For spleen, liver, and lymph nodes, tissues were mashed through a 70 μM cell strainer and washed with collection media. For spleen, liver and tumor tissues, red blood cells were lysed with ACK lysis buffer (Life Technologies) for 5 minutes and washed with collection media.
Flow Cytometry
Cells were washed with PBS and stained with either Fixable Viability Dye e506 (eBiosciences) or Live/Dead Aqua (Thermo Fisher Scientific) for 30 minutes at 4°C in the dark. Cells were washed in FACS buffer (PBS supplemented with 1% BSA and 0.05% NaN3), Fc blocking was performed with purified CD16/CD32 antibody (Invitrogen) and a combination of antibodies diluted in either FACS buffer or Brilliant Violet Stain Buffer (BD Biosciences) for 30 minutes at 4°C in the dark. Cells were washed in FACS buffer and analyzed by flow cytometry. If cells were not able to be analyzed on the same day, they were fixed in 4% PFA and analyzed by flow cytometry within three days. Flow cytometry was performed on a BD LSR Fortessa or BD LSRII with the BD High Throughput Sampler (HTS) 96-well plate attachment, when applicable, and analyzed with FlowJo software version 10.5 or greater (Tree Star). In all flow cytometry assays, manual gating was based on fluorescence minus one (FMO) controls.
Cytokine Analysis
Mice were injection with 5×10⁵ unlabeled M3-9-M tumor cells. Vector control and IL12-GEMys were generated from GFP+Luciferse+ donor mice and 8×10⁶ cells were injected into tumor-bearing mice i.v. on day 12 post primary tumor inoculation. Blood was collected by cardiac puncture, allowed to clot at room temperature, and centrifuged at 2,000 rpm for serum isolation.
Lung, spleen, liver, and tumor tissue were harvested and flash frozen at indicated time points. Tissues were weighed then mechanically homogenized in T-PER tissue protein extraction reagent (Thermo Scientific) with HALT protease inhibitor cocktail (Thermo Scientific), centrifuged to pellet cellular debris, and tissue extracts were analyzed by ELISA (R&D Systems).
Chemotherapy Treatment
Cyclophosphamide monohydrate (Sigma Aldrich) was prepared to a final concentration of 20 mg/mL in PBS and passed through a 22 μm filter. Fludarabine phosphate (Actavis Pharma, Inc. or Leucadia Pharmaceuticals) was reconstituted with sterile PBS to a final concentration of 50 mg/mL.100 μL of each was injected per mouse i.p. 48 hours prior to IL12-GEMy transfer.
Antibody Treatment
For cell depletion studies, mice were injected with 100 μL antibodies i.p. An initial depletion with 200 μg of anti-CD8α antibody clone 2.43, anti-CD4 antibody clone GK1.5, or rat IgG2b isotype control clone LTF-2, or 100 μg of anti-NK1.1 (PK136) (BioXCell) was administered on days 9, 11, and 12 post tumor inoculation. Antibody depletion treatment continued with the administration of 200 μg of antibody every 3–5 days for the duration of the experiment. For IL-12 blocking studies, 1 mg per mouse of InVivoMAb anti-mouse IL-12 p75 (R2-9A5) or InVivoMAb rat IgG2b isotype (LTF-2) (BioXCell) was administered i.p. on day 12 post tumor inoculation and every 5 days for the duration of the experiment.
T Cell Co-Culture Experiments
Naïve splenocytes from OT-I or OT-II mice were co-cultured with non-transduced control myeloid cells or IL12-GEMys at various ratios in the presence of 1 μg/mL OVA257–264 (SIINFEKL) or OVA323–339 peptide, respectively (AnaSpec, Inc), in complete RPMI (Gibco). To generate activated T cells, splenocytes were first cultured in the presence of 1 μg/mL peptide (AnaSpec, Inc) and 50 units/mL of recombinant IL-2 (Clinigen) for 4 days prior to co-culture with myeloid cells in the presence of 1 ng/mL cognate peptide. Supernatant from co-cultures was collected after 24 hours and IFNγ was quantified by ELISA (R&D Systems).
T Cell Activation for Adoptive Transfer
Spleens from OT-I, Rag−/− OT-I, or OT-II mice were harvested and processed into single cell suspension as described above. Splenocytes were activated in complete RPMI in the presence of 50 units/mL recombinant IL-2 and 1 μg/mL OT-I cognate peptide OVA257–264 (SIINFEKL) or OT-II cognate peptide OVA323–339 for four days (AnaSpec, Inc). Activated OT-I T cells were transferred into mice i.v. via tail vein.
Immunofluorescence
Lungs were harvested and fixed in 10% formalin for 24 hours. Fixed lungs were embedded in paraffin and 8-μM thick sections were prepared for staining (VitroVivo Biotech). Slides were stained using the Opal 7-Color Manual IHC Kit (PerkinElmer) per the manufacturer’s instructions. Briefly, slides were deparaffinized and rehydrated in a series of xylene and ethanol gradients, microwaved in Rodent Decloaker (Biocare Medical) and then cooled. Slides were washed with water and then TBST (TBS + 0.05% Tween-20) followed by blocking with Bloxall Blocking Solution (Vector Laboratories). Staining with primary and secondary antibodies and OPAL fluorophores were performed per the manufacturer’s instructions. The following antibodies were used: CD4 (Invitrogen, clone 4SM95; 1:100), CD8 (Invitrogen, clone 4SM16; 1:100), ImmPRESS HRP Goat anti-rat IgG (Vector Laboratories; 1:4). All images were collected on a Zeiss 880/Airyscan Microscope at the CCR Microscopy Core Facility using the 20X and 40X objectives. For quantitation, the 20X images were used to manually count the number of CD4 and CD8 cells and calculate nuclear area using color thresholding in ImageJ (NIH).
Bulk RNA Sequencing
Naïve or tumor-bearing mice were treated or not with 8×10⁶ IL12-GEMys on day twelve post tumor inoculation. Mice were euthanized three days after IL12-GEMy transfer and lungs were harvested. For bulk RNA sequencing (RNA-seq), lungs were flash-frozen in liquid nitrogen. Tissue was homogenized in TRIzol (Thermo Fisher) and RNA was isolated by chloroform extraction followed by the RNeasy Mini Kit (Qiagen) according to manufacturer’s recommendations. 3’ library preparation was performed using the Illumina TruSeq Stranded mRNA kit and Hiseq4000 platform (Illumina) at a total of 100 million reads per sample according to standard operating procedure at the CCR Genomics core facility. Alignment, normalization, and primary gene expression analysis were performed as previously described (Murgai et al., 2017) utilizing the computational resources of the NIH HPC Biowulf cluster (http://hpc.nih.gov). Pathway analysis was performed using Ingenuity Pathway Analysis (Qiagen) on gene sets with a greater-than-two-fold change and p-value cut off of 0.05.
Gene Set Enrichment Analysis
In each RNA-seq profile from the lungs of treated and untreated tumor-bearing mice, we ranked genes in descending order based on their log-fold change in expression compared to non-tumor-bearing control mice. We tested the enrichment of selected pathways using the fgsea package (Korotkevich et al., 2019) in R, where 10,000 permutations were used to compute enrichment p-values for each pathway. Pathways with an adjust enrichment p-value less than 0.1 were considered to be significantly enriched.
Pre-Metastatic Niche Gene Signature
We derived two 50-gene pre-metastatic niche gene sets, referred to as Up-regulated and Down-Regulated gene sets, by picking 50 genes that showed the highest log-fold changes in expression between lungs of untreated tumor-bearing and control mice. To validate these gene sets, we analyzed a collection of published bulk RNA-seq and microarray-based gene expression profiles from pre-metastatic niches. Normalized microarray and bulk RNA-seq expression profiles for each dataset were downloaded using the GEOquery package in Bioconductor (Davis and Meltzer, 2007, Gentleman et al., 2004). We log-transformed expression values from raw FPKM values to units of log(1 + FPKM) in RNA-seq datasets and used the author-submitted normalized expression values in microarray-based datasets. In datasets that contained replicates, we computed the average expression, after which we computed log-fold changes of gene expression between PMN and control samples. We then used a one-sided Wilcoxon test to check if genes in the Up-regulated (or Down-Regulated) gene set had a higher (or lower) log-fold change than genes in the rest of the genome.
Single Cell RNA Sequencing
Lungs from naïve or tumor-bearing mice with or without IL12-GEMy treatment (n=4 mice per group) were processed into single-cell suspension and oligodT-based cDNA libraries were barcoded by droplet-partioning using the Chromium Single Cell Controller (10x Genomics) system at the NCI-CCR Single Cell Analysis Facility. Dead cell removal was performed, and samples were incubated with TotalSeq-A hashtag oligos (HTOs) (BioLegend). Two biological replicates were run together per capture lane. Sequencing was performed on the NovaSeq (Illumina) at the NCI-CCR Sequencing Facility. Sequencing read demultiplexing, alignment to mm10 (Ensembl Ref annotation 93), and generation of a unique-molecular-index-collapsed gene expression matrix was performed using cellranger version 3.0.2 (10x Genomics). Additional data processing and analysis was performed using Seurat v3.0.2 (Butler et al., 2018, Stuart et al., 2019) in RStudio running R v3.6.0. In short, each sample set was filtered for cell barcodes with greater than 500 genes detected and less than 20% percent mitochondrial gene expression. Cell barcodes with either no cell hashing antibody detected or multiple were excluded from the analysis. Data from all samples were merged, and normalization and scaling was performed using SCTransform (Christoph Hafemeister). Clustering and UMAP projections were performed on combined data, with collapsing of biologically relevant clusters informed by clustree empirical analysis. Cell type / cluster marker gene detection was performed with FindAllMarkers () in Seurat with Wilcoxon ranked sum test. Differential expression testing across conditions for each cluster performed with MAST (Finak et al., 2015). Single cell plots generated within Seurat using ggplot2 (Hadley, 2016). Analysis notebooks available on request.
Comparison of IL12-GEMy bulk data with scRNA-seq data
We created a comparison gene set to compare the IL12-GEMy product with cells in our scRNA-seq data. We first picked a set of the 3,000 most variable genes, determined by the SCTransform (Christoph Hafemeister) function in Seurat , across all 70,370 cells in our scRNA-seq data. Out of these 3,000 genes, 1,884 were annotated and expressed in the bulk sequencing of the IL12-GEMy product, which formed our comparison gene set. To overcome noise from transcript drop-outs in the scRNA-seq data, we utilized a bootstrapping approach where we picked 90% of cells in each cluster and averaged the SCTransformed expression values of each gene in the comparison gene set. We repeated this process 100 times to generate 100 groups of cells for each cluster. We computed the cosine similarity between the average gene expression of each bootstrapped group with the IL12-GEMy bulk RNA-seq profile. Since the gene expression values are all non-zero, the cosine similarity ranges between 0 and 1, with a higher score indicating greater similarity between gene expression profiles. We then averaged the cosine similarity scores across all bootstrap groups to obtain a single similarity score between the IL12-GEMy product and each scRNA-seq cluster.
Human IL12-GEMy Product
SC (CRL-9855) human peripheral blood monocyte cells were transduced with vector control or tEGFR-IL12 lentivirus for 24 hours at varying multiplicities of infection (MOI). MOI was calculated from p24 titer as lentiviral particles (LP) per cell. Transduction efficiency was measured by flow cytometry staining of human cetuximab biosimilar EGFR antibody (R&D Systems). IL-12 production was measured in the supernatant by ELISA (R&D Systems).
Human IL12-GEMy Co-Culture with Lymphocytes
Primary human elutriated lymphocytes were acquired from the NIH Department of Transfusion Medicine. Vector control or tEGFR-IL12 SC cells were transduced at a MOI of 150 for 24 hours. Lymphocytes were incubated overnight in StemSpan SFEM II media supplemented with gentamicin and 10 units/mL of recombinant human IL-2. T cells were activated with 12.5 μL/mL T Cell TransAct beads (Miltenyi Biotec) and 40 units/mL of recombinant human IL-2 and co-cultured at varying GEMy:T Cell ratios. Supernatant was collected at 24 hours and analyzed for IFNγ production by ELISA (R&D Systems).
Statistical Analysis
All statistical analysis was performed in Prism version 7.03 or greater (GraphPad Software). Graphs represent mean values ± standard error. P values were calculated for bar graphs using Kolmogorov-Smirnov test, unpaired two-tailed Student’s t test, one-way ANOVA, or Kruskal-Wallis test, and log-rank statistics for survival analyses, as indicated in figure legends. In boxplots, the center line represents the median, the box limits denote the 25th to the 75th percentile and the whiskers represent the minimum and maximum value. For scRNA-seq data, statistical differences between groups analyzed by Wilcoxon test. p<0.05 was considered statistically significant. * p≤0.05, ** p≤0.01, *** p≤0.001, **** p≤0.0001.
Supplementary Material
Fig. S1. Flow cytometry characterization of immune populations in pre-metastatic lungs, Related to Figure 1A–B
A) Tumor volume measurements of mice that were injected with M3-9-M ffluc-eGFP rhabdomyosarcoma primary tumor orthotopically in the gastrocnemius muscle of the leg. B) M3-9-M ffluc-eGFP tumor cells detected in the lungs of mice by flow cytometry, gated on live, single, CD45− cells. The dashed line represents the threshold of metastatic lesions that were visible to the naked eye. The gating strategy for C) myeloid and D) lymphocyte flow cytometry staining panels are shown. Arrows indicate the parent population that the subsequent plot is gated on. Gates were drawn manually based on fluorescence minus one (FMO) controls. E) The expression of T cell activation markers PD1 and CD44 over time after IL12-GEMy treatment. In boxplots, the center line represents the median, the box limits denote the 25th to the 75th percentile and the whiskers represent the minimum and maximum value. All populations are gated on live CD45+CD3+ single cells. Data was analyzed by ordinary one-way ANOVA with Dunnett’s multiple comparisons test between the mean of day 0 and each time point. F) T cells were isolated from naïve or M3-9-M tumor-bearing mice on day 18 post tumor inoculation by magnetic bead negative selection. Cells were pulsed with CellTrace Violet and activated with Mouse T-Activator CD3/CD28 beads at a 1:1 ratio in the presence of 10 ng/mL of IL-7 for 3 days. Cell proliferation was analyzed by flow cytometry gating on CD4+ or CD8+ T cells.
Fig. S2. Transcriptional programs are drastically altered in pre-metastatic lungs, Related to Figure 1C–D
A) Hierarchical clustering by one minus Pearson correlation of the top 500 differentially-expressed genes from bulk RNA sequencing of lungs from pre-metastatic versus naïve mice. B) Principle component analysis (PCA) was performed using Partek Flow. C) The top 50 genes with the highest fold change increase and decrease in the lungs of tumor-bearing versus naïve mice. Only genes with a p-value < 0.05 are shown. D) Log-fold changes of the top 50 genes up-regulated in pre-metastatic lungs (red) and the top 50 genes down-regulated in pre-metastatic lungs (blue) in published datasets. P-values were determined using a one-sided Wilcoxon rank-sum test. E) Select pathways from Ingenuity pathway analysis (IPA) of differentially expressed genes between pre-metastatic and naïve lungs. Red bars indicate positive z-scores; blue bars indicate negative z-scores. F) Database for Annotation, Visualization and Integrated Discovery (DAVID) Gene Ontology (GO) analysis of the top 50 genes upregulated in pre-metastatic compared to naïve lungs. Relevant, significantly changed GO terms associated with pre-metastatic lungs are shown. Arrows indicate >100-fold enrichment.
Fig. S4. Immune suppression genes found in the pre-metastatic lung are also present in the hematopoietic stem cell niche of the bone marrow in humans, Related to Figure 1
A) Data from normal human bone marrow was queried using the Human Cell Atlas bone marrow single-cell interactive web portal80 B) Gene expression data of select transcripts per cluster in pre-metastatic lungs.
Fig. S5. IL12-GEMy phenotype, cytokine production and impact on immune cell populations in vivo, Related to Figure 2
A) Cells transduced with Thy1.1 vector control or Thy1.1-IL12 were harvested after 4 days in culture and analyzed by flow cytometry. Representative images are shown. Transduction efficiency was consistent between experiments. B) Cells were transduced with various dilutions of IL-12-encoding lentivirus for 4 days and assessed for IL-12 secretion by ELISA. C-D) 8×10⁶ IL12-GEMy or vector control cells were adoptively transferred into mice on day 12 post tumor inoculation. C) Tissues were harvested, flash frozen, homogenized in tissue protein extraction reagent with HALT protease inhibitor (Thermo Fisher Scientific), and evaluated by ELISA (R&D Systems). D) CD45.1+ transferred cells as a percentage of live cells 24 hours after transfer of 8×10⁶ cells. E) The phenotype of endogenous myeloid cells and transferred IL12-GEMys in the lungs of tumor-bearing mice by flow cytometry 24 hours after transfer of 8×10⁶ cells. F) 1.85×10⁶ IL12-GEMys were transferred into M3-9-M ffluc-mCherry tumor-bearing mice on day 11 post tumor inoculation. Lungs were harvested one, three, and seven days post-treatment. Myeloid populations analyzed by flow cytometry gated on live CD45+ single cells (Myeloid = CD11b+CD11c−, Granulocytes = CD11b+Ly6G+, Monocytic Dendritic Cells = CD11b+CD11c+, Conventional Dendritic Cells = CD11b−CD11c+, Macrophages = CD11b+CD43+Ly6C+F4/80+). G) Mice were inoculated with M3-9-M ffluc-mCherry tumor and not treated (n=9) or treated with non-transduced myeloid cells (n=5) or IL12-GEMys (n=10) on days 12, 19, and 26 (4.1×10⁶, 2.8×10⁵, and 5×10⁶ IL12-GEMy cells at each time point, respectively). Tissues were harvested on day 27 and analyzed by flow cytometry gated on live CD45+ single cells. Myeloid cell populations in the spleen, non-draining inguinal lymph node, and tumor (Myeloid = CD11b+CD11c−, Granulocytes = CD11b+Ly6G+, Monocytic Dendritic Cells = CD11b+CD11c+, Conventional Dendritic Cells = CD11b−CD11c+, Non-Classical Monocytes = CD11b+CD43+Ly6C−, Classical Monocytes = CD11b+CD43+Ly6C+, Macrophages = CD11b+CD43+Ly6C+F4/80+). Data was analyzed by multiple Kolmogorov-Smirnov tests. H) Experiment as described in F. Lymphoid populations (T Cells = CD3+, CD8+ T cells = CD3+CD8+, CD4+ T Cells = CD3+CD4+, NK Cells = CD3−NK1.1+) and I) lymphocyte activation markers PD-1 and CD44 in the lung are shown. J) Experiment as described in in G. T and NK cells in the spleen, non-draining inguinal lymph node and tumor (T Cells = CD3+, NK Cells = CD3−NK1.1+). Flow cytometry data was analyzed by multiple Kolmogorov-Smirnov tests. K) Experiment as described in F. CD45.1+ transferred cells were analyzed by flow cytometry. **** p < 0.0001; *** 0.0001 < p < 0.001; ** 0.001 < p < 0.01; * 0.01 < p < 0.05. In line graphs, data are represented as mean ± SEM. In boxplots, the center line represents the median, the box limits denote the 25th to the 75th percentile and the whiskers represent the minimum and maximum value.
Fig. S7. Validation of IL12-GEMy treatment models, Related to Figures 6
A) M3-9-M ffluc-mCherry tumor-bearing mice were treated with three doses of isotype, anti-CD8, anti-CD4 or anti-NK1.1 antibody i.p. on days 9, 11, and 12 post tumor inoculation. 8×10⁶ IL12-GEMys were transferred on day 12. Isotype, anti-CD8, and anti-CD4 were also administered on day 15 in accordance with the treatment schedule. Blood was collected one week after the initiation of the depletion therapy and immune cell populations were analyzed by flow cytometry. Statistical analysis was performed by ordinary one-way ANOVA with Tukey’s multiple comparisons test. B) M3-9-M ffluc-mCherry cells were transduced with the lentiviral vector containing ovalbumin (OVA). SIINFEKL-positive cells were sorted by FACS to establish the M3-9-M ffluc-mCherry-OVA cell line. The expression of the ovalbumin peptide SIINFEKL in the context of H2-Kb on the surface of the transduced cells was measured by flow cytometry. C) Splenocytes from OT-I mice were activated in culture with 1 μg/mL SIINFEKL peptide and 50 units/mL of recombinant IL-2. M3-9-M ffluc-mCherry and M3-9-M ffluc-mCherry-OVA cells were plated and allowed to adhere overnight. OT-I cells were collected on day 5 post-activation and plated onto the tumor cells at the indicated ratios. Supernatant was collected at 24 hours and analyzed by ELISA for IFNγ. After the supernatant was removed, luciferin was added to the cells and luminescence was recorded as a readout for luciferase-expressing tumor cell abundance. Percent tumor killing was calculated as follows: 100 − [(tumor cells + T cells) / (tumor cells alone) × 100]. Statistics were calculated by unpaired t test at each ratio. D) Non-tumor-bearing mice were treated with 2 mg of cyclophosphamide and 5 mg of fludarabine i.p., and immune cell populations in the blood were analyzed by flow cytometry 48 hours after treatment. There were no significant differences by Kolmogorov-Smirnov test. E-G) 8×10⁶ IL12-GEMy or vector control cells were adoptively transferred into mice on day 12 post M3-9-M ffluc2-mCherry tumor inoculation, 2 days following Cy/Flu administration. E) Tissues were harvested at 4, 7, and 17 days after IL12-GEMy injection and processed for flow cytometry (n=4–8 mice per group). Cells are gated on live, single cells. Transduced cells were detected by gating on Thy1.1+CD45.1+ cells. Statistical analysis was performed between the IL12-GEMy and Cy/Flu+IL12-GEMy groups by Kolmogorov-Smirnov test at each time point. F) Tissues were harvested, flash frozen, homogenized and evaluated by ELISA. Statistical analysis was performed between the IL12-GEMy and Cy/Flu+IL12-GEMy groups by Kolmogorov-Smirnov test (n=3–5 mice per group). G) Tissues were harvested at 4, 7, 17, and 38 days following IL12-GEMy treatment and processed for flow cytometry staining. Cells are gated on live, single, CD45.2+, CD3+, CD8+, PD1+, Lag3− cells. Statistical analysis was performed between the IL12-GEMy and Cy/Flu+IL12-GEMy groups by Kolmogorov-Smirnov test. H) Mice were treated with Cy/Flu on day 10 and 8×10⁶ IL12-GEMys on day 12 post tumor inoculation. Anti-mouse IL-12 p75 or rat IgG2b isotype was administered i.p. on day 12 post tumor inoculation and every 5 days for the duration of the experiment. Serum was collected on day 104 post-tumor inoculation, day 92 post treatment with 8×10⁶ IL12-GEMys, 2 days after antibody treatment, and IL-12 was analyzed by ELISA (R&D Systems). Statistics were calculated using the Kolmogorov-Smirnov test. **** p < 0.0001; *** 0.0001 < p < 0.001; ** 0.001 < p < 0.01; * 0.01 < p < 0.05. In bar and line graphs, data are represented as mean ± SEM. In boxplots, the center line represents the median, the box limits denote the 25th to the 75th percentile and the whiskers represent the minimum and maximum value.
Fig. S6. Transcriptional changes in pre-metastatic lungs in response to IL12-GEMy treatment, IL-12 pre-treatment and dosing experiments, Related to Figure 3A–C and Figure 4
A-C) RNA was isolated and sequenced from the lungs of mice that were naïve, tumor-bearing, or tumor-bearing treated with 8×10⁶ IL12-GEMys. A) Principle component analysis (PCA) was performed using Partek Flow on non-treated and IL12-GEMy-treated mice. B) Volcano plot of differential gene expression between IL12-GEMy treated and non-treated mice. C) Select pathways that are significantly up and down regulated in IL12-GEMy-treated mice by Ingenuity pathway analysis (IPA). D) ScRNA-seq was performed on lungs from tumor-bearing mice or tumor-bearing mice treated with 8×10⁶ IL12-GEMys 3 days post IL12-GEMy treatment, 15 days post tumor inoculation. UMAP plots of single cell RNA sequencing analysis of lungs from non-treated and IL12-GEMy-treated mice. E-F) Mice were orthotopically inoculated with 5×10⁵ M3-9-M ffluc-mCherry cells and treated with equal numbers of control myeloid cells, myeloid cells cultured in the presence of 10 ng/mL IL-12, or IL12-GEMys on days 12, 19, and 26 post tumor inoculation (4.1×10⁶, 2.8×10⁵, and 5×10⁶ cells at each time point, respectively). E) Mice were followed for primary tumor growth and survival (n=8). Primary tumor volume was analyzed on day 27 by Kruskal-Wallis test with Dunn’s multiple comparisons test (no treatment: n=12, myeloid: n=9, IL-12 pre-treated: n=9, IL12-GEMy: n=12). F) Lung metastasis was assessed by bioluminescent imaging ex vivo by IVIS on day 27. Pictures of lungs were normalized, visually inspected for bioluminescence, and categorically grouped into high metastasis (presence of bioluminescence) or no/low metastasis (no bioluminescence). Statistical analysis was determined by Fisher’s exact test. G) M3-9-M ffluc-mCherry mice were treated with low dose (1×10⁶) or high dose (8×10⁶) of IL12-GEMys and followed for survival and tumor growth. Survival was analyzed by Log-rank (Mantel-Cox) test. H) Experiment as described in D. Cytotoxic T cell, Non-Cytotoxic T cell, NK cell, and Other Lymphocyte clusters were subsetted from the whole lung scRNA-seq analysis and reclustered to identify more specific cell subsets. **** p < 0.0001; *** 0.0001 < p < 0.001; ** 0.001 < p < 0.01; * 0.01 < p < 0.05. In line graphs, data are represented as mean ± SEM. In boxplots, the center line represents the median, the box limits denote the 25th to the 75th percentile and the whiskers represent the minimum and maximum value.
Fig. S3. Single cell RNA sequencing cluster identification and expression of pre-metastatic signature genes associated with immune suppression, Related to Figure 1E–G
A) UMAP plot of combined samples color-coded to indicate cluster identity annotations. B) Heat map displaying the top 10 genes used to define each cluster. C-D) Violin plots of genes associated with immune suppression. Statistical differences between groups analyzed by Wilcoxon test. **** p < 0.0001; *** 0.0001 < p < 0.001; ** 0.001 < p < 0.01; * 0.01 < p < 0.05.
Highlights.
A myeloid-rich, T cell poor immune suppressive microenvironment promotes metastasis
Genetically engineered myeloid cells (GEMys) deliver IL-12 to metastatic sites
IL12-GEMys reverse immune suppression and activate anti-tumor immunity
Chemotherapy with IL12-GEMy treatment achieves durable cures in pre-clinical models
Acknowledgments
We thank Carol Thiele and Naomi Taylor for reviewing the manuscript. We thank Steven Highfill, Lucas Horn and Claudia Palena for providing reagents and expertise. We thank Katherine McKinnon for expertise in antibody panel design and Sophia Brown for flow cytometry technical support. We thank Arnulfo Mendoza, John Buckley, Yun Chen, and Devorah Gallardo for technical support with animal procedures. We thank Gail McMullen, Mia Alilin, Geneti Gaga, April Huang, and Elena Kuznetsova for assistance with animal studies. We thank Valerie Nguyen for assistance with data collection. We thank Haiyan Lei for support analyzing bulk RNA-seq data. We thank Erina He for illustrations.
Funding:
This work was supported by the US National Institutes of Health grants ZIA BC 011332 and ZIA BC 011334 to Rosandra Kaplan. Sabina Kaczanowska is a NCI Transition to Industry Fellow supported by the Intramural Research Program of the National Institutes of Health, National Cancer Institute, Center for Cancer Research.
Footnotes
Publisher's Disclaimer: This is a PDF file of an unedited manuscript that has been accepted for publication. As a service to our customers we are providing this early version of the manuscript. The manuscript will undergo copyediting, typesetting, and review of the resulting proof before it is published in its final form. Please note that during the production process errors may be discovered which could affect the content, and all legal disclaimers that apply to the journal pertain.
Declaration of Interests
S.K., D.W.B., H.Q. and R.N.K. are inventors on International Patent Application No. PCT/US2020/17515 “Genetically modified hematopoietic stem and progenitor cells (HSPCs) and mesenchymal cells as a platform to reduce or prevent metastasis, treat autoimmune and inflammatory disorders, and rebalance the immune milieu and dysregulated niches.” The remaining authors have no competing interests.
Inclusion and Diversity
One or more of the authors of this paper self-identifies as an underrepresented ethnic minority in science. One or more of the authors of this paper received support from a program designed to increase minority representation in science. One or more of the authors of this paper self-identifies as living with a disability. One or more of the authors of this paper self-identifies as a member of the LGBTQ+ community.
References
- ALBRENGUES J, SHIELDS MA, NG D, PARK CG, AMBRICO A, POINDEXTER ME, UPADHYAY P, UYEMINAMI DL, POMMIER A, KUTTNER V, BRUZAS E, MAIORINO L, BAUTISTA C, CARMONA EM, GIMOTTY PA, FEARON DT, CHANG K, LYONS SK, PINKERTON KE, TROTMAN LC, GOLDBERG MS, YEH JT & EGEBLAD M 2018. Neutrophil extracellular traps produced during inflammation awaken dormant cancer cells in mice. Science, 361. [DOI] [PMC free article] [PubMed] [Google Scholar]
- AWAD RM, DE VLAEMINCK Y, MAEBE J, GOYVAERTS C & BRECKPOT K 2018. Turn Back the TIMe: Targeting Tumor Infiltrating Myeloid Cells to Revert Cancer Progression. Frontiers in Immunology, 9. [DOI] [PMC free article] [PubMed] [Google Scholar]
- BEURY DW, CARTER KA, NELSON C, SINHA P, HANSON E, NYANDJO M, FITZGERALD PJ, MAJEED A, WALI N & OSTRAND-ROSENBERG S 2016. Myeloid-Derived Suppressor Cell Survival and Function Are Regulated by the Transcription Factor Nrf2. J Immunol, 196, 3470–8. [DOI] [PMC free article] [PubMed] [Google Scholar]
- BONAPACE L, COISSIEUX MM, WYCKOFF J, MERTZ KD, VARGA Z, JUNT T & BENTIRES-ALJ M 2014. Cessation of CCL2 inhibition accelerates breast cancer metastasis by promoting angiogenesis. Nature, 515, 130–3. [DOI] [PubMed] [Google Scholar]
- BREMPELIS KJ, COWAN CM, KREUSER SA, LABADIE KP, PRIESKORN BM, LIEBERMAN NAP, ENE CI, MOYES KW, CHINN H, DEGOLIER KR, MATSUMOTO LR, DANIEL SK, YOKOYAMA JK, DAVIS AD, HOGLUND VJ, SMYTHE KS, BALCAITIS SD, JENSEN MC, ELLENBOGEN RG, CAMPBELL JS, PIERCE RH, HOLLAND EC, PILLARISETTY VG & CRANE CA 2020. Genetically engineered macrophages persist in solid tumors and locally deliver therapeutic proteins to activate immune responses. J Immunother Cancer, 8. [DOI] [PMC free article] [PubMed] [Google Scholar]
- BRUNDA MJ, LUISTRO L, WARRIER RR, WRIGHT RB, HUBBARD BR, MURPHY M, WOLF SF & GATELY MK 1993. Antitumor and antimetastatic activity of interleukin 12 against murine tumors. J Exp Med, 178, 1223–30. [DOI] [PMC free article] [PubMed] [Google Scholar]
- BUTLER A, HOFFMAN P, SMIBERT P, PAPALEXI E & SATIJA R 2018. Integrating single-cell transcriptomic data across different conditions, technologies, and species. Nat Biotechnol, 36, 411–420. [DOI] [PMC free article] [PubMed] [Google Scholar]
- CAO X & XU J 2019. Insights into inflammasome and its research advances in cancer. Tumori, 300891619868007. [DOI] [PubMed] [Google Scholar]
- CASANOVA-ACEBES M, A. G. N, WEISS LA & HIDALGO A 2014. Innate immune cells as homeostatic regulators of the hematopoietic niche. Int J Hematol, 99, 685–94. [DOI] [PubMed] [Google Scholar]
- CHEN J, LÓPEZ-MOYADO IF, SEO H, LIO CJ, HEMPLEMAN LJ, SEKIYA T, YOSHIMURA A, SCOTT-BROWNE JP & RAO A 2019. NR4A transcription factors limit CAR T cell function in solid tumours. Nature, 567, 530–534. [DOI] [PMC free article] [PubMed] [Google Scholar]
- CHRISTOPH HAFEMEISTER RS Normalization and variance stabilization of single-cell RNA-seq data using regularized negative binomial regression. bioRxiv. [DOI] [PMC free article] [PubMed] [Google Scholar]
- COLOMBO MP & TRINCHIERI G 2002. Interleukin-12 in anti-tumor immunity and immunotherapy. Cytokine Growth Factor Rev, 13, 155–68. [DOI] [PubMed] [Google Scholar]
- CROASDELL A, DUFFNEY PF, KIM N, LACY SH, SIME PJ & PHIPPS RP 2015. PPARgamma and the Innate Immune System Mediate the Resolution of Inflammation. PPAR Res, 2015, 549691. [DOI] [PMC free article] [PubMed] [Google Scholar]
- DAVIDSON SM, JONAS O, KEIBLER MA, HOU HW, LUENGO A, MAYERS JR, WYCKOFF J, DEL ROSARIO AM, WHITMAN M, CHIN CR, CONDON KJ, LAMMERS A, KELLERSBERGER KA, STALL BK, STEPHANOPOULOS G, BAR-SAGI D, HAN J, RABINOWITZ JD, CIMA MJ, LANGER R & VANDER HEIDEN MG 2017. Direct evidence for cancer-cell-autonomous extracellular protein catabolism in pancreatic tumors. Nat Med, 23, 235–241. [DOI] [PMC free article] [PubMed] [Google Scholar]
- DAVIS S & MELTZER PS 2007. GEOquery: a bridge between the Gene Expression Omnibus (GEO) and BioConductor. Bioinformatics, 23, 1846–7. [DOI] [PubMed] [Google Scholar]
- DEL VECCHIO M, BAJETTA E, CANOVA S, LOTZE MT, WESA A, PARMIANI G & ANICHINI A 2007. Interleukin-12: Biological Properties and Clinical Application. Clinical Cancer Research, 13, 4677–4685. [DOI] [PubMed] [Google Scholar]
- DULL T, ZUFFEREY R, KELLY M, MANDEL RJ, NGUYEN M, TRONO D & NALDINI L 1998. A third-generation lentivirus vector with a conditional packaging system. J Virol, 72, 8463–71. [DOI] [PMC free article] [PubMed] [Google Scholar]
- FINAK G, MCDAVID A, YAJIMA M, DENG J, GERSUK V, SHALEK AK, SLICHTER CK, MILLER HW, MCELRATH MJ, PRLIC M, LINSLEY PS & GOTTARDO R 2015. MAST: a flexible statistical framework for assessing transcriptional changes and characterizing heterogeneity in single-cell RNA sequencing data. Genome Biol, 16, 278. [DOI] [PMC free article] [PubMed] [Google Scholar]
- FUJIMURA T, KAMBAYASHI Y & AIBA S 2012. Crosstalk between regulatory T cells (Tregs) and myeloid derived suppressor cells (MDSCs) during melanoma growth. Oncoimmunology, 1, 1433–1434. [DOI] [PMC free article] [PubMed] [Google Scholar]
- GABRILOVICH DI 2017. Myeloid-Derived Suppressor Cells. Cancer Immunol Res, 5, 3–8. [DOI] [PMC free article] [PubMed] [Google Scholar]
- GABRILOVICH DI, OSTRAND-ROSENBERG S & BRONTE V 2012. Coordinated regulation of myeloid cells by tumours. Nat Rev Immunol, 12, 253–68. [DOI] [PMC free article] [PubMed] [Google Scholar]
- GAJEWSKI TF, MENG Y & HARLIN H 2006. Immune suppression in the tumor microenvironment. J Immunother, 29, 233–40. [DOI] [PubMed] [Google Scholar]
- GARDELL JL, MATSUMOTO LR, CHINN H, DEGOLIER KR, KREUSER SA, PRIESKORN B, BALCAITIS S, DAVIS A, ELLENBOGEN RG & CRANE CA 2020. Human macrophages engineered to secrete a bispecific T cell engager support antigen-dependent T cell responses to glioblastoma. J Immunother Cancer, 8. [DOI] [PMC free article] [PubMed] [Google Scholar]
- GENTLEMAN RC, CAREY VJ, BATES DM, BOLSTAD B, DETTLING M, DUDOIT S, ELLIS B, GAUTIER L, GE Y, GENTRY J, HORNIK K, HOTHORN T, HUBER W, IACUS S, IRIZARRY R, LEISCH F, LI C, MAECHLER M, ROSSINI AJ, SAWITZKI G, SMITH C, SMYTH G, TIERNEY L, YANG JYH & ZHANG J 2004. Bioconductor: open software development for computational biology and bioinformatics. Genome Biology, 5, R80. [DOI] [PMC free article] [PubMed] [Google Scholar]
- GILES AJ, REID CM, EVANS JD, MURGAI M, VICIOSO Y, HIGHFILL SL, KASAI M, VAHDAT L, MACKALL CL, LYDEN D, WEXLER L & KAPLAN RN 2016. Activation of Hematopoietic Stem/Progenitor Cells Promotes Immunosuppression Within the Pre-metastatic Niche. Cancer Res, 76, 1335–47. [DOI] [PMC free article] [PubMed] [Google Scholar]
- GRZYWA TM, SOSNOWSKA A, MATRYBA P, RYDZYNSKA Z, JASINSKI M, NOWIS D & GOLAB J 2020. Myeloid Cell-Derived Arginase in Cancer Immune Response. Front Immunol, 11, 938. [DOI] [PMC free article] [PubMed] [Google Scholar]
- GUI J, ZAHEDI F, ORTIZ A, CHO C, KATLINSKI KV, ALICEA-TORRES K, LI J, TODD L, ZHANG H, BEITING DP, SANDER C, KIRKWOOD JM, SNOW BE, WAKEHAM AC, MAK TW, DIEHL JA, KOUMENIS C, RYEOM SW, STANGER BZ, PURÉ E, GABRILOVICH DI & FUCHS SY 2020. Activation of p38α stress-activated protein kinase drives the formation of the pre-metastatic niche in the lungs. Nature Cancer, 1, 603–619. [DOI] [PMC free article] [PubMed] [Google Scholar]
- GULDNER IH, WANG Q, YANG L, GOLOMB SM, ZHAO Z, LOPEZ JA, BRUNORY A, HOWE EN, ZHANG Y, PALAKURTHI B, BARRON M, GAO H, XUEI X, LIU Y, LI J, CHEN DZ, LANDRETH GE & ZHANG S 2020. CNS-Native Myeloid Cells Drive Immune Suppression in the Brain Metastatic Niche through Cxcl10. Cell, 183, 1234–1248 e25. [DOI] [PMC free article] [PubMed] [Google Scholar]
- GUO B, FU S, ZHANG J, LIU B & LI Z 2016. Targeting inflammasome/IL-1 pathways for cancer immunotherapy. Sci Rep, 6, 36107. [DOI] [PMC free article] [PubMed] [Google Scholar]
- HADLEY W 2016. Ggplot2, New York, NY, Springer Science+Business Media, LLC. [Google Scholar]
- HAY SB, FERCHEN K, CHETAL K, GRIMES HL & SALOMONIS N 2018. The Human Cell Atlas bone marrow single-cell interactive web portal. Exp Hematol, 68, 51–61. [DOI] [PMC free article] [PubMed] [Google Scholar]
- HECZEY A, LOUIS CU, SAVOLDO B, DAKHOVA O, DURETT A, GRILLEY B, LIU H, WU MF, MEI Z, GEE A, MEHTA B, ZHANG H, MAHMOOD N, TASHIRO H, HESLOP HE, DOTTI G, ROONEY CM & BRENNER MK 2017. CAR T Cells Administered in Combination with Lymphodepletion and PD-1 Inhibition to Patients with Neuroblastoma. Mol Ther, 25, 2214–2224. [DOI] [PMC free article] [PubMed] [Google Scholar]
- HIRATSUKA S, NAKAMURA K, IWAI S, MURAKAMI M, ITOH T, KIJIMA H, SHIPLEY JM, SENIOR RM & SHIBUYA M 2002. MMP9 induction by vascular endothelial growth factor receptor-1 is involved in lung-specific metastasis. Cancer Cell, 2, 289–300. [DOI] [PubMed] [Google Scholar]
- HIRATSUKA S, WATANABE A, SAKURAI Y, AKASHI-TAKAMURA S, ISHIBASHI S, MIYAKE K, SHIBUYA M, AKIRA S, ABURATANI H & MARU Y 2008. The S100A8-serum amyloid A3-TLR4 paracrine cascade establishes a pre-metastatic phase. Nat Cell Biol, 10, 1349–55. [DOI] [PubMed] [Google Scholar]
- HONG C, KIDANI Y, A. G. N, PHUNG T, ITO A, RONG X, ERICSON K, MIKKOLA H, BEAVEN SW, MILLER LS, SHAO WH, COHEN PL, CASTRILLO A, TONTONOZ P & BENSINGER SJ 2012. Coordinate regulation of neutrophil homeostasis by liver X receptors in mice. J Clin Invest, 122, 337–47. [DOI] [PMC free article] [PubMed] [Google Scholar]
- HONG IS 2016. Stimulatory versus suppressive effects of GM-CSF on tumor progression in multiple cancer types. Exp Mol Med, 48, e242. [DOI] [PMC free article] [PubMed] [Google Scholar]
- HOYE AM & ERLER JT 2016. Structural ECM components in the premetastatic and metastatic niche. Am J Physiol Cell Physiol, 310, C955–67. [DOI] [PubMed] [Google Scholar]
- HUTLOFF A, DITTRICH AM, BEIER KC, ELJASCHEWITSCH B, KRAFT R, ANAGNOSTOPOULOS I & KROCZEK RA 1999. ICOS is an inducible T-cell co-stimulator structurally and functionally related to CD28. Nature, 397, 263–6. [DOI] [PubMed] [Google Scholar]
- JOYCE JA & POLLARD JW 2009. Microenvironmental regulation of metastasis. Nat Rev Cancer, 9, 239–52. [DOI] [PMC free article] [PubMed] [Google Scholar]
- KACZANOWSKA S & KAPLAN RN 2020. Mapping the switch that drives the pre-metastatic niche. Nature Cancer, 1, 577–579. [DOI] [PubMed] [Google Scholar]
- KANEDA MM, MESSER KS, RALAINIRINA N, LI H, LEEM CJ, GORJESTANI S, WOO G, NGUYEN AV, FIGUEIREDO CC, FOUBERT P, SCHMID MC, PINK M, WINKLER DG, RAUSCH M, PALOMBELLA VJ, KUTOK J, MCGOVERN K, FRAZER KA, WU X, KARIN M, SASIK R, COHEN EE & VARNER JA 2016. PI3Kgamma is a molecular switch that controls immune suppression. Nature, 539, 437–442. [DOI] [PMC free article] [PubMed] [Google Scholar]
- KAPLAN RN, RIBA RD, ZACHAROULIS S, BRAMLEY AH, VINCENT L, COSTA C, MACDONALD DD, JIN DK, SHIDO K, KERNS SA, ZHU Z, HICKLIN D, WU Y, PORT JL, ALTORKI N, PORT ER, RUGGERO D, SHMELKOV SV, JENSEN KK, RAFII S & LYDEN D 2005. VEGFR1-positive haematopoietic bone marrow progenitors initiate the pre-metastatic niche. Nature, 438, 820–7. [DOI] [PMC free article] [PubMed] [Google Scholar]
- KATZENELENBOGEN Y, SHEBAN F, YALIN A, YOFE I, SVETLICHNYY D, JAITIN DA, BORNSTEIN C, MOSHE A, KEREN-SHAUL H, COHEN M, WANG SY, LI B, DAVID E, SALAME TM, WEINER A & AMIT I 2020. Coupled scRNA-Seq and Intracellular Protein Activity Reveal an Immunosuppressive Role of TREM2 in Cancer. Cell, 182, 872–885.e19. [DOI] [PubMed] [Google Scholar]
- KERKAR SP, GOLDSZMID RS, MURANSKI P, CHINNASAMY D, YU Z, REGER RN, LEONARDI AJ, MORGAN RA, WANG E, MARINCOLA FM, TRINCHIERI G, ROSENBERG SA & RESTIFO NP 2011. IL-12 triggers a programmatic change in dysfunctional myeloid-derived cells within mouse tumors. J Clin Invest, 121, 4746–57. [DOI] [PMC free article] [PubMed] [Google Scholar]
- KLICHINSKY M, RUELLA M, SHESTOVA O, LU XM, BEST A, ZEEMAN M, SCHMIERER M, GABRUSIEWICZ K, ANDERSON NR, PETTY NE, CUMMINS KD, SHEN F, SHAN X, VELIZ K, BLOUCH K, YASHIRO-OHTANI Y, KENDERIAN SS, KIM MY, O’CONNOR RS, WALLACE SR, KOZLOWSKI MS, MARCHIONE DM, SHESTOV M, GARCIA BA, JUNE CH & GILL S 2020. Human chimeric antigen receptor macrophages for cancer immunotherapy. Nat Biotechnol, 38, 947–953. [DOI] [PMC free article] [PubMed] [Google Scholar]
- KO JH, LEE HJ, JEONG HJ & OH JY 2017. Ly6C(hi) monocytes are required for mesenchymal stem/stromal cell-induced immune tolerance in mice with experimental autoimmune uveitis. Biochem Biophys Res Commun, 494, 6–12. [DOI] [PubMed] [Google Scholar]
- KOEFFLER HP 2003. Peroxisome proliferator-activated receptor gamma and cancers. Clin Cancer Res, 9, 1–9. [PubMed] [Google Scholar]
- KOROTKEVICH G, SUKHOV V & SERGUSHICHEV A 2019. Fast gene set enrichment analysis. bioRxiv, 060012. [Google Scholar]
- KUMAR V, PATEL S, TCYGANOV E & GABRILOVICH DI 2016. The Nature of Myeloid-Derived Suppressor Cells in the Tumor Microenvironment. Trends Immunol, 37, 208–220. [DOI] [PMC free article] [PubMed] [Google Scholar]
- LEE JW, KOMAR CA, BENGSCH F, GRAHAM K & BEATTY GL 2016. Genetically Engineered Mouse Models of Pancreatic Cancer: The KPC Model (LSL-Kras(G12D/+) ;LSL-Trp53(R172H/+) ;Pdx-1-Cre), Its Variants, and Their Application in Immuno-oncology Drug Discovery. Curr Protoc Pharmacol, 73, 14 39 1–14 39 20. [DOI] [PMC free article] [PubMed] [Google Scholar]
- LEE JW, STONE ML, PORRETT PM, THOMAS SK, KOMAR CA, LI JH, DELMAN D, GRAHAM K, GLADNEY WL, HUA X, BLACK TA, CHIEN AL, MAJMUNDAR KS, THOMPSON JC, YEE SS, O’HARA MH, AGGARWAL C, XIN D, SHAKED A, GAO M, LIU D, BORAD MJ, RAMANATHAN RK, CARPENTER EL, JI A, DE BEER MC, DE BEER FC, WEBB NR & BEATTY GL 2019. Hepatocytes direct the formation of a pro-metastatic niche in the liver. Nature, 567, 249–252. [DOI] [PMC free article] [PubMed] [Google Scholar]
- LI D, LI X, ZHOU WL, HUANG Y, LIANG X, JIANG L, YANG X, SUN J, LI Z, HAN WD & WANG W 2019. Genetically engineered T cells for cancer immunotherapy. Signal Transduct Target Ther, 4, 35. [DOI] [PMC free article] [PubMed] [Google Scholar]
- LIU Y & CAO X 2016. Characteristics and Significance of the Pre-metastatic Niche. Cancer Cell, 30, 668–681. [DOI] [PubMed] [Google Scholar]
- LIU Y, GU Y, HAN Y, ZHANG Q, JIANG Z, ZHANG X, HUANG B, XU X, ZHENG J & CAO X 2016. Tumor Exosomal RNAs Promote Lung Pre-metastatic Niche Formation by Activating Alveolar Epithelial TLR3 to Recruit Neutrophils. Cancer Cell, 30, 243–256. [DOI] [PubMed] [Google Scholar]
- LONG AH, HIGHFILL SL, CUI Y, SMITH JP, WALKER AJ, RAMAKRISHNA S, EL-ETRIBY R, GALLI S, TSOKOS MG, ORENTAS RJ & MACKALL CL 2016. Reduction of MDSCs with All-trans Retinoic Acid Improves CAR Therapy Efficacy for Sarcomas. Cancer Immunol Res, 4, 869–880. [DOI] [PMC free article] [PubMed] [Google Scholar]
- MANTOVANI A, BARAJON I & GARLANDA C 2018. IL-1 and IL-1 regulatory pathways in cancer progression and therapy. Immunol Rev, 281, 57–61. [DOI] [PMC free article] [PubMed] [Google Scholar]
- MARTNER A, AYDIN E & HELLSTRAND K 2019. NOX2 in autoimmunity, tumor growth and metastasis. The Journal of Pathology, 247, 151–154. [DOI] [PMC free article] [PubMed] [Google Scholar]
- MAUDE SL, BARRETT D, TEACHEY DT & GRUPP SA 2014. Managing cytokine release syndrome associated with novel T cell-engaging therapies. Cancer J, 20, 119–22. [DOI] [PMC free article] [PubMed] [Google Scholar]
- MEADORS JL, CUI Y, CHEN QR, SONG YK, KHAN J, MERLINO G, TSOKOS M, ORENTAS RJ & MACKALL CL 2011. Murine rhabdomyosarcoma is immunogenic and responsive to T-cell-based immunotherapy. Pediatr Blood Cancer, 57, 921–9. [DOI] [PMC free article] [PubMed] [Google Scholar]
- MORIKAWA K, WALKER SM, NAKAJIMA M, PATHAK S, JESSUP JM & FIDLER IJ 1988. Influence of organ environment on the growth, selection, and metastasis of human colon carcinoma cells in nude mice. Cancer Res, 48, 6863–71. [PubMed] [Google Scholar]
- MOYES KW, LIEBERMAN NA, KREUSER SA, CHINN H, WINTER C, DEUTSCH G, HOGLUND V, WATSON R & CRANE CA 2017. Genetically Engineered Macrophages: A Potential Platform for Cancer Immunotherapy. Hum Gene Ther, 28, 200–215. [DOI] [PubMed] [Google Scholar]
- MURGAI M, JU W, EASON M, KLINE J, BEURY DW, KACZANOWSKA S, MIETTINEN MM, KRUHLAK M, LEI H, SHERN JF, CHEREPANOVA OA, OWENS GK & KAPLAN RN 2017. KLF4-dependent perivascular cell plasticity mediates pre-metastatic niche formation and metastasis. Nat Med, 23, 1176–1190. [DOI] [PMC free article] [PubMed] [Google Scholar]
- MUSSAR K, PARDIKE S, HOHL TM, HARDIMAN G, CIRULLI V & CRISA L 2017. A CCR2+ myeloid cell niche required for pancreatic beta cell growth. JCI Insight, 2. [DOI] [PMC free article] [PubMed] [Google Scholar]
- A. G. N & CASTRILLO A 2011. Liver X receptors as regulators of macrophage inflammatory and metabolic pathways. Biochim Biophys Acta, 1812, 982–94. [DOI] [PubMed] [Google Scholar]
- NAGARAJ S, GUPTA K, PISAREV V, KINARSKY L, SHERMAN S, KANG L, HERBER DL, SCHNECK J & GABRILOVICH DI 2007. Altered recognition of antigen is a mechanism of CD8+ T cell tolerance in cancer. Nat Med, 13, 828–35. [DOI] [PMC free article] [PubMed] [Google Scholar]
- NAIK S, LARSEN SB, COWLEY CJ & FUCHS E 2018. Two to Tango: Dialog between Immunity and Stem Cells in Health and Disease. Cell, 175, 908–920. [DOI] [PMC free article] [PubMed] [Google Scholar]
- OBSTFELD AE, FREY NV, MANSFIELD K, LACEY SF, JUNE CH, PORTER DL, MELENHORST JJ & WASIK MA 2017. Cytokine release syndrome associated with chimeric-antigen receptor T-cell therapy: clinicopathological insights. Blood, 130, 2569–2572. [DOI] [PubMed] [Google Scholar]
- PAGET S 1989. The distribution of secondary growths in cancer of the breast. 1889. Cancer Metastasis Rev, 8, 98–101. [PubMed] [Google Scholar]
- PAPPO AS, ANDERSON JR, CRIST WM, WHARAM MD, BREITFELD PP, HAWKINS D, RANEY RB, WOMER RB, PARHAM DM, QUALMAN SJ & GRIER HE 1999. Survival after relapse in children and adolescents with rhabdomyosarcoma: A report from the Intergroup Rhabdomyosarcoma Study Group. J Clin Oncol, 17, 3487–93. [DOI] [PubMed] [Google Scholar]
- PARK MJ, LEE SH, KIM EK, LEE EJ, BAEK JA, PARK SH, KWOK SK & CHO ML 2018. Interleukin-10 produced by myeloid-derived suppressor cells is critical for the induction of Tregs and attenuation of rheumatoid inflammation in mice. Sci Rep, 8, 3753. [DOI] [PMC free article] [PubMed] [Google Scholar]
- PEINADO H, ALEČKOVIĆ M, LAVOTSHKIN S, MATEI I, COSTA-SILVA B, MORENO-BUENO G, HERGUETA-REDONDO M, WILLIAMS C, GARCÍA-SANTOS G, GHAJAR C, NITADORI-HOSHINO A, HOFFMAN C, BADAL K, GARCIA BA, CALLAHAN MK, YUAN J, MARTINS VR, SKOG J, KAPLAN RN, BRADY MS, WOLCHOK JD, CHAPMAN PB, KANG Y, BROMBERG J & LYDEN D 2012. Melanoma exosomes educate bone marrow progenitor cells toward a pro-metastatic phenotype through MET. Nat Med, 18, 883–91. [DOI] [PMC free article] [PubMed] [Google Scholar]
- PEINADO H, ZHANG H, MATEI IR, COSTA-SILVA B, HOSHINO A, RODRIGUES G, PSAILA B, KAPLAN RN, BROMBERG JF, KANG Y, BISSELL MJ, COX TR, GIACCIA AJ, ERLER JT, HIRATSUKA S, GHAJAR CM & LYDEN D 2017. Pre-metastatic niches: organ-specific homes for metastases. Nature Reviews Cancer, 17, 302–317. [DOI] [PubMed] [Google Scholar]
- POLLARD JW 2004. Tumour-educated macrophages promote tumour progression and metastasis. Nat Rev Cancer, 4, 71–8. [DOI] [PubMed] [Google Scholar]
- PSAILA B & LYDEN D 2009. The metastatic niche: adapting the foreign soil. Nat Rev Cancer, 9, 285–93. [DOI] [PMC free article] [PubMed] [Google Scholar]
- QIAN B, DENG Y, IM JH, MUSCHEL RJ, ZOU Y, LI J, LANG RA & POLLARD JW 2009. A distinct macrophage population mediates metastatic breast cancer cell extravasation, establishment and growth. PLoS One, 4, e6562. [DOI] [PMC free article] [PubMed] [Google Scholar]
- RAHMANI W, LIU Y, ROSIN NL, KLINE A, RAHARJO E, YOON J, STRATTON JA, SINHA S & BIERNASKIE J 2018. Macrophages Promote Wound-Induced Hair Follicle Regeneration in a CX3CR1- and TGF-beta1-Dependent Manner. J Invest Dermatol, 138, 2111–2122. [DOI] [PubMed] [Google Scholar]
- RODRIGUEZ-GARCIA A, PALAZON A, NOGUERA-ORTEGA E, POWELL DJ JR. & GUEDAN S 2020. CAR-T Cells Hit the Tumor Microenvironment: Strategies to Overcome Tumor Escape. Front Immunol, 11, 1109. [DOI] [PMC free article] [PubMed] [Google Scholar]
- ROVE KO & CRAWFORD ED 2009. Metastatic cancer in solid tumors and clinical outcome: skeletal-related events. Oncology (Williston Park), 23, 21–7. [PubMed] [Google Scholar]
- SCHILBACH K, WELKER C, KRICKEBERG N, KAISSE C, SCHLEICHER S & HASHIMOTO H 2020. In the Absence of a TCR Signal IL-2/IL-12/18-Stimulated γδ T Cells Demonstrate Potent Anti-Tumoral Function Through Direct Killing and Senescence Induction in Cancer Cells. Cancers (Basel), 12. [DOI] [PMC free article] [PubMed] [Google Scholar]
- SCULLY OJ, BAY BH, YIP G & YU Y 2012. Breast cancer metastasis. Cancer Genomics Proteomics, 9, 311–20. [PubMed] [Google Scholar]
- SEHGAL A, DONALDSON DS, PRIDANS C, SAUTER KA, HUME DA & MABBOTT NA 2018. The role of CSF1R-dependent macrophages in control of the intestinal stem-cell niche. Nat Commun, 9, 1272. [DOI] [PMC free article] [PubMed] [Google Scholar]
- SHAO Y, CHEN T, ZHENG X, YANG S, XU K, CHEN X, XU F, WANG L, SHEN Y, WANG T, ZHANG M, HU W, YE C, YU X, SHAO J & ZHENG S 2018. Colorectal cancer-derived small extracellular vesicles establish an inflammatory premetastatic niche in liver metastasis. Carcinogenesis, 39, 1368–1379. [DOI] [PubMed] [Google Scholar]
- SOARES KC, FOLEY K, OLINO K, LEUBNER A, MAYO SC, JAIN A, JAFFEE E, SCHULICK RD, YOSHIMURA K, EDIL B & ZHENG L 2014. A preclinical murine model of hepatic metastases. J Vis Exp, 51677. [DOI] [PMC free article] [PubMed] [Google Scholar]
- SOLDEVILLA MM, VILLANUEVA H, MERAVIGLIA-CRIVELLI D, MENON AP, RUIZ M, CEBOLLERO J, VILLALBA M, MORENO B, LOZANO T, LLOPIZ D, PEJENAUTE A, SAROBE P & PASTOR F 2019. ICOS Costimulation at the Tumor Site in Combination with CTLA-4 Blockade Therapy Elicits Strong Tumor Immunity. Mol Ther. [DOI] [PMC free article] [PubMed] [Google Scholar]
- STEDING CE, WU ST, ZHANG Y, JENG MH, ELZEY BD & KAO C 2011. The role of interleukin-12 on modulating myeloid-derived suppressor cells, increasing overall survival and reducing metastasis. Immunology, 133, 221–38. [DOI] [PMC free article] [PubMed] [Google Scholar]
- STRAUSS J, HEERY CR, KIM JW, JOCHEMS C, DONAHUE RN, MONTGOMERY AS, MCMAHON S, LAMPING E, MARTE JL, MADAN RA, BILUSIC M, SILVER MR, BERTOTTI E, SCHLOM J & GULLEY JL 2019. First-in-Human Phase I Trial of a Tumor-Targeted Cytokine (NHS-IL12) in Subjects with Metastatic Solid Tumors. Clin Cancer Res, 25, 99–109. [DOI] [PMC free article] [PubMed] [Google Scholar]
- STUART T, BUTLER A, HOFFMAN P, HAFEMEISTER C, PAPALEXI E, MAUCK WM 3RD, HAO Y, STOECKIUS M, SMIBERT P & SATIJA R 2019. Comprehensive Integration of Single-Cell Data. Cell, 177, 1888–1902 e21. [DOI] [PMC free article] [PubMed] [Google Scholar]
- SVENSSON E, CHRISTIANSEN CF, ULRICHSEN SP, RORTH MR & SORENSEN HT 2017. Survival after bone metastasis by primary cancer type: a Danish population-based cohort study. BMJ Open, 7, e016022. [DOI] [PMC free article] [PubMed] [Google Scholar]
- TATSUMI T, HUANG J, GOODING WE, GAMBOTTO A, ROBBINS PD, VUJANOVIC NL, ALBER SM, WATKINS SC, OKADA H & STORKUS WJ 2003. Intratumoral delivery of dendritic cells engineered to secrete both interleukin (IL)-12 and IL-18 effectively treats local and distant disease in association with broadly reactive Tc1-type immunity. Cancer Res, 63, 6378–86. [PubMed] [Google Scholar]
- TAVAZOIE MF, POLLACK I, TANQUECO R, OSTENDORF BN, REIS BS, GONSALVES FC, KURTH I, ANDREU-AGULLO C, DERBYSHIRE ML, POSADA J, TAKEDA S, TAFRESHIAN KN, ROWINSKY E, SZAREK M, WALTZMAN RJ, MCMILLAN EA, ZHAO C, MITA M, MITA A, CHMIELOWSKI B, POSTOW MA, RIBAS A, MUCIDA D & TAVAZOIE SF 2018. LXR/ApoE Activation Restricts Innate Immune Suppression in Cancer. Cell, 172, 825–840 e18. [DOI] [PMC free article] [PubMed] [Google Scholar]
- TENG JJ, ZHANG J, ZHANG TY, ZHANG S & LI BS 2016. Prognostic value of peripheral blood lymphocyte-to-monocyte ratio in patients with solid tumors: a meta-analysis. Onco Targets Ther, 9, 37–47. [DOI] [PMC free article] [PubMed] [Google Scholar]
- TURTLE CJ, HANAFI LA, BERGER C, GOOLEY TA, CHERIAN S, HUDECEK M, SOMMERMEYER D, MELVILLE K, PENDER B, BUDIARTO TM, ROBINSON E, STEEVENS NN, CHANEY C, SOMA L, CHEN X, YEUNG C, WOOD B, LI D, CAO J, HEIMFELD S, JENSEN MC, RIDDELL SR & MALONEY DG 2016. CD19 CAR-T cells of defined CD4+:CD8+ composition in adult B cell ALL patients. J Clin Invest, 126, 2123–38. [DOI] [PMC free article] [PubMed] [Google Scholar]
- VEGLIA F, TYURIN VA, BLASI M, DE LEO A, KOSSENKOV AV, DONTHIREDDY L, TO TKJ, SCHUG Z, BASU S, WANG F, RICCIOTTI E, DIRUSSO C, MURPHY ME, VONDERHEIDE RH, LIEBERMAN PM, MULLIGAN C, NAM B, HOCKSTEIN N, MASTERS G, GUARINO M, LIN C, NEFEDOVA Y, BLACK P, KAGAN VE & GABRILOVICH DI 2019. Fatty acid transport protein 2 reprograms neutrophils in cancer. Nature, 569, 73–78. [DOI] [PMC free article] [PubMed] [Google Scholar]
- WANG ECE, DAI Z, FERRANTE AW, DRAKE CG & CHRISTIANO AM 2019a. A Subset of TREM2(+) Dermal Macrophages Secretes Oncostatin M to Maintain Hair Follicle Stem Cell Quiescence and Inhibit Hair Growth. Cell Stem Cell, 24, 654–669 e6. [DOI] [PubMed] [Google Scholar]
- WANG G, VAN DRIEL BJ, LIAO G, O’KEEFFE MS, HALIBOZEK PJ, FLIPSE J, YIGIT B, AZCUTIA V, LUSCINSKAS FW, WANG N & TERHORST C 2015. Migration of myeloid cells during inflammation is differentially regulated by the cell surface receptors Slamf1 and Slamf8. PLoS One, 10, e0121968. [DOI] [PMC free article] [PubMed] [Google Scholar]
- WANG K, XU T, RUAN H, XIAO H, LIU J, SONG Z, CAO Q, BAO L, LIU D, WANG C, CHENG G, LIANG H, CHEN Z, YANG H, CHEN K & ZHANG X 2019b. LXRalpha promotes cell metastasis by regulating the NLRP3 inflammasome in renal cell carcinoma. Cell Death Dis, 10, 159. [DOI] [PMC free article] [PubMed] [Google Scholar]
- WANG S, YANG J, QIAN J, WEZEMAN M, KWAK LW & YI Q 2006. Tumor evasion of the immune system: inhibiting p38 MAPK signaling restores the function of dendritic cells in multiple myeloma. Blood, 107, 2432–9. [DOI] [PMC free article] [PubMed] [Google Scholar]
- WELCH DR & HURST DR 2019. Defining the Hallmarks of Metastasis. Cancer Res, 79, 3011–3027. [DOI] [PMC free article] [PubMed] [Google Scholar]
- WIENS AL & HATTAB EM 2014. The pathological spectrum of solid CNS metastases in the pediatric population. J Neurosurg Pediatr, 14, 129–35. [DOI] [PubMed] [Google Scholar]
- WOLF SF, TEMPLE PA, KOBAYASHI M, YOUNG D, DICIG M, LOWE L, DZIALO R, FITZ L, FERENZ C, HEWICK RM & et al. 1991. Cloning of cDNA for natural killer cell stimulatory factor, a heterodimeric cytokine with multiple biologic effects on T and natural killer cells. J Immunol, 146, 3074–81. [PubMed] [Google Scholar]
- XIAO Z, CASEY KA, JAMESON SC, CURTSINGER JM & MESCHER MF 2009. Programming for CD8 T cell memory development requires IL-12 or type I IFN. J Immunol, 182, 2786–94. [DOI] [PMC free article] [PubMed] [Google Scholar]
- YAMAMOTO M, KIKUCHI H, OHTA M, KAWABATA T, HIRAMATSU Y, KONDO K, BABA M, KAMIYA K, TANAKA T, KITAGAWA M & KONNO H 2008. TSU68 prevents liver metastasis of colon cancer xenografts by modulating the premetastatic niche. Cancer Res, 68, 9754–62. [DOI] [PubMed] [Google Scholar]
- YANG Z, ZHANG X, DARRAH PA & MOSSER DM 2010. The regulation of Th1 responses by the p38 MAPK. J Immunol, 185, 6205–13. [DOI] [PMC free article] [PubMed] [Google Scholar]
- ZHANG L, KERKAR SP, YU Z, ZHENG Z, YANG S, RESTIFO NP, ROSENBERG SA & MORGAN RA 2011. Improving adoptive T cell therapy by targeting and controlling IL-12 expression to the tumor environment. Mol Ther, 19, 751–9. [DOI] [PMC free article] [PubMed] [Google Scholar]
- ZHANG L, MORGAN RA, BEANE JD, ZHENG Z, DUDLEY ME, KASSIM SH, NAHVI AV, NGO LT, SHERRY RM, PHAN GQ, HUGHES MS, KAMMULA US, FELDMAN SA, TOOMEY MA, KERKAR SP, RESTIFO NP, YANG JC & ROSENBERG SA 2015. Tumor-infiltrating lymphocytes genetically engineered with an inducible gene encoding interleukin-12 for the immunotherapy of metastatic melanoma. Clin Cancer Res, 21, 2278–88. [DOI] [PMC free article] [PubMed] [Google Scholar]
- ZHANG S, MA X, ZHU C, LIU L, WANG G & YUAN X 2016. The Role of Myeloid-Derived Suppressor Cells in Patients with Solid Tumors: A Meta-Analysis. PLoS One, 11, e0164514. [DOI] [PMC free article] [PubMed] [Google Scholar]
Associated Data
This section collects any data citations, data availability statements, or supplementary materials included in this article.
Supplementary Materials
Fig. S1. Flow cytometry characterization of immune populations in pre-metastatic lungs, Related to Figure 1A–B
A) Tumor volume measurements of mice that were injected with M3-9-M ffluc-eGFP rhabdomyosarcoma primary tumor orthotopically in the gastrocnemius muscle of the leg. B) M3-9-M ffluc-eGFP tumor cells detected in the lungs of mice by flow cytometry, gated on live, single, CD45− cells. The dashed line represents the threshold of metastatic lesions that were visible to the naked eye. The gating strategy for C) myeloid and D) lymphocyte flow cytometry staining panels are shown. Arrows indicate the parent population that the subsequent plot is gated on. Gates were drawn manually based on fluorescence minus one (FMO) controls. E) The expression of T cell activation markers PD1 and CD44 over time after IL12-GEMy treatment. In boxplots, the center line represents the median, the box limits denote the 25th to the 75th percentile and the whiskers represent the minimum and maximum value. All populations are gated on live CD45+CD3+ single cells. Data was analyzed by ordinary one-way ANOVA with Dunnett’s multiple comparisons test between the mean of day 0 and each time point. F) T cells were isolated from naïve or M3-9-M tumor-bearing mice on day 18 post tumor inoculation by magnetic bead negative selection. Cells were pulsed with CellTrace Violet and activated with Mouse T-Activator CD3/CD28 beads at a 1:1 ratio in the presence of 10 ng/mL of IL-7 for 3 days. Cell proliferation was analyzed by flow cytometry gating on CD4+ or CD8+ T cells.
Fig. S2. Transcriptional programs are drastically altered in pre-metastatic lungs, Related to Figure 1C–D
A) Hierarchical clustering by one minus Pearson correlation of the top 500 differentially-expressed genes from bulk RNA sequencing of lungs from pre-metastatic versus naïve mice. B) Principle component analysis (PCA) was performed using Partek Flow. C) The top 50 genes with the highest fold change increase and decrease in the lungs of tumor-bearing versus naïve mice. Only genes with a p-value < 0.05 are shown. D) Log-fold changes of the top 50 genes up-regulated in pre-metastatic lungs (red) and the top 50 genes down-regulated in pre-metastatic lungs (blue) in published datasets. P-values were determined using a one-sided Wilcoxon rank-sum test. E) Select pathways from Ingenuity pathway analysis (IPA) of differentially expressed genes between pre-metastatic and naïve lungs. Red bars indicate positive z-scores; blue bars indicate negative z-scores. F) Database for Annotation, Visualization and Integrated Discovery (DAVID) Gene Ontology (GO) analysis of the top 50 genes upregulated in pre-metastatic compared to naïve lungs. Relevant, significantly changed GO terms associated with pre-metastatic lungs are shown. Arrows indicate >100-fold enrichment.
Fig. S4. Immune suppression genes found in the pre-metastatic lung are also present in the hematopoietic stem cell niche of the bone marrow in humans, Related to Figure 1
A) Data from normal human bone marrow was queried using the Human Cell Atlas bone marrow single-cell interactive web portal80 B) Gene expression data of select transcripts per cluster in pre-metastatic lungs.
Fig. S5. IL12-GEMy phenotype, cytokine production and impact on immune cell populations in vivo, Related to Figure 2
A) Cells transduced with Thy1.1 vector control or Thy1.1-IL12 were harvested after 4 days in culture and analyzed by flow cytometry. Representative images are shown. Transduction efficiency was consistent between experiments. B) Cells were transduced with various dilutions of IL-12-encoding lentivirus for 4 days and assessed for IL-12 secretion by ELISA. C-D) 8×10⁶ IL12-GEMy or vector control cells were adoptively transferred into mice on day 12 post tumor inoculation. C) Tissues were harvested, flash frozen, homogenized in tissue protein extraction reagent with HALT protease inhibitor (Thermo Fisher Scientific), and evaluated by ELISA (R&D Systems). D) CD45.1+ transferred cells as a percentage of live cells 24 hours after transfer of 8×10⁶ cells. E) The phenotype of endogenous myeloid cells and transferred IL12-GEMys in the lungs of tumor-bearing mice by flow cytometry 24 hours after transfer of 8×10⁶ cells. F) 1.85×10⁶ IL12-GEMys were transferred into M3-9-M ffluc-mCherry tumor-bearing mice on day 11 post tumor inoculation. Lungs were harvested one, three, and seven days post-treatment. Myeloid populations analyzed by flow cytometry gated on live CD45+ single cells (Myeloid = CD11b+CD11c−, Granulocytes = CD11b+Ly6G+, Monocytic Dendritic Cells = CD11b+CD11c+, Conventional Dendritic Cells = CD11b−CD11c+, Macrophages = CD11b+CD43+Ly6C+F4/80+). G) Mice were inoculated with M3-9-M ffluc-mCherry tumor and not treated (n=9) or treated with non-transduced myeloid cells (n=5) or IL12-GEMys (n=10) on days 12, 19, and 26 (4.1×10⁶, 2.8×10⁵, and 5×10⁶ IL12-GEMy cells at each time point, respectively). Tissues were harvested on day 27 and analyzed by flow cytometry gated on live CD45+ single cells. Myeloid cell populations in the spleen, non-draining inguinal lymph node, and tumor (Myeloid = CD11b+CD11c−, Granulocytes = CD11b+Ly6G+, Monocytic Dendritic Cells = CD11b+CD11c+, Conventional Dendritic Cells = CD11b−CD11c+, Non-Classical Monocytes = CD11b+CD43+Ly6C−, Classical Monocytes = CD11b+CD43+Ly6C+, Macrophages = CD11b+CD43+Ly6C+F4/80+). Data was analyzed by multiple Kolmogorov-Smirnov tests. H) Experiment as described in F. Lymphoid populations (T Cells = CD3+, CD8+ T cells = CD3+CD8+, CD4+ T Cells = CD3+CD4+, NK Cells = CD3−NK1.1+) and I) lymphocyte activation markers PD-1 and CD44 in the lung are shown. J) Experiment as described in in G. T and NK cells in the spleen, non-draining inguinal lymph node and tumor (T Cells = CD3+, NK Cells = CD3−NK1.1+). Flow cytometry data was analyzed by multiple Kolmogorov-Smirnov tests. K) Experiment as described in F. CD45.1+ transferred cells were analyzed by flow cytometry. **** p < 0.0001; *** 0.0001 < p < 0.001; ** 0.001 < p < 0.01; * 0.01 < p < 0.05. In line graphs, data are represented as mean ± SEM. In boxplots, the center line represents the median, the box limits denote the 25th to the 75th percentile and the whiskers represent the minimum and maximum value.
Fig. S7. Validation of IL12-GEMy treatment models, Related to Figures 6
A) M3-9-M ffluc-mCherry tumor-bearing mice were treated with three doses of isotype, anti-CD8, anti-CD4 or anti-NK1.1 antibody i.p. on days 9, 11, and 12 post tumor inoculation. 8×10⁶ IL12-GEMys were transferred on day 12. Isotype, anti-CD8, and anti-CD4 were also administered on day 15 in accordance with the treatment schedule. Blood was collected one week after the initiation of the depletion therapy and immune cell populations were analyzed by flow cytometry. Statistical analysis was performed by ordinary one-way ANOVA with Tukey’s multiple comparisons test. B) M3-9-M ffluc-mCherry cells were transduced with the lentiviral vector containing ovalbumin (OVA). SIINFEKL-positive cells were sorted by FACS to establish the M3-9-M ffluc-mCherry-OVA cell line. The expression of the ovalbumin peptide SIINFEKL in the context of H2-Kb on the surface of the transduced cells was measured by flow cytometry. C) Splenocytes from OT-I mice were activated in culture with 1 μg/mL SIINFEKL peptide and 50 units/mL of recombinant IL-2. M3-9-M ffluc-mCherry and M3-9-M ffluc-mCherry-OVA cells were plated and allowed to adhere overnight. OT-I cells were collected on day 5 post-activation and plated onto the tumor cells at the indicated ratios. Supernatant was collected at 24 hours and analyzed by ELISA for IFNγ. After the supernatant was removed, luciferin was added to the cells and luminescence was recorded as a readout for luciferase-expressing tumor cell abundance. Percent tumor killing was calculated as follows: 100 − [(tumor cells + T cells) / (tumor cells alone) × 100]. Statistics were calculated by unpaired t test at each ratio. D) Non-tumor-bearing mice were treated with 2 mg of cyclophosphamide and 5 mg of fludarabine i.p., and immune cell populations in the blood were analyzed by flow cytometry 48 hours after treatment. There were no significant differences by Kolmogorov-Smirnov test. E-G) 8×10⁶ IL12-GEMy or vector control cells were adoptively transferred into mice on day 12 post M3-9-M ffluc2-mCherry tumor inoculation, 2 days following Cy/Flu administration. E) Tissues were harvested at 4, 7, and 17 days after IL12-GEMy injection and processed for flow cytometry (n=4–8 mice per group). Cells are gated on live, single cells. Transduced cells were detected by gating on Thy1.1+CD45.1+ cells. Statistical analysis was performed between the IL12-GEMy and Cy/Flu+IL12-GEMy groups by Kolmogorov-Smirnov test at each time point. F) Tissues were harvested, flash frozen, homogenized and evaluated by ELISA. Statistical analysis was performed between the IL12-GEMy and Cy/Flu+IL12-GEMy groups by Kolmogorov-Smirnov test (n=3–5 mice per group). G) Tissues were harvested at 4, 7, 17, and 38 days following IL12-GEMy treatment and processed for flow cytometry staining. Cells are gated on live, single, CD45.2+, CD3+, CD8+, PD1+, Lag3− cells. Statistical analysis was performed between the IL12-GEMy and Cy/Flu+IL12-GEMy groups by Kolmogorov-Smirnov test. H) Mice were treated with Cy/Flu on day 10 and 8×10⁶ IL12-GEMys on day 12 post tumor inoculation. Anti-mouse IL-12 p75 or rat IgG2b isotype was administered i.p. on day 12 post tumor inoculation and every 5 days for the duration of the experiment. Serum was collected on day 104 post-tumor inoculation, day 92 post treatment with 8×10⁶ IL12-GEMys, 2 days after antibody treatment, and IL-12 was analyzed by ELISA (R&D Systems). Statistics were calculated using the Kolmogorov-Smirnov test. **** p < 0.0001; *** 0.0001 < p < 0.001; ** 0.001 < p < 0.01; * 0.01 < p < 0.05. In bar and line graphs, data are represented as mean ± SEM. In boxplots, the center line represents the median, the box limits denote the 25th to the 75th percentile and the whiskers represent the minimum and maximum value.
Fig. S6. Transcriptional changes in pre-metastatic lungs in response to IL12-GEMy treatment, IL-12 pre-treatment and dosing experiments, Related to Figure 3A–C and Figure 4
A-C) RNA was isolated and sequenced from the lungs of mice that were naïve, tumor-bearing, or tumor-bearing treated with 8×10⁶ IL12-GEMys. A) Principle component analysis (PCA) was performed using Partek Flow on non-treated and IL12-GEMy-treated mice. B) Volcano plot of differential gene expression between IL12-GEMy treated and non-treated mice. C) Select pathways that are significantly up and down regulated in IL12-GEMy-treated mice by Ingenuity pathway analysis (IPA). D) ScRNA-seq was performed on lungs from tumor-bearing mice or tumor-bearing mice treated with 8×10⁶ IL12-GEMys 3 days post IL12-GEMy treatment, 15 days post tumor inoculation. UMAP plots of single cell RNA sequencing analysis of lungs from non-treated and IL12-GEMy-treated mice. E-F) Mice were orthotopically inoculated with 5×10⁵ M3-9-M ffluc-mCherry cells and treated with equal numbers of control myeloid cells, myeloid cells cultured in the presence of 10 ng/mL IL-12, or IL12-GEMys on days 12, 19, and 26 post tumor inoculation (4.1×10⁶, 2.8×10⁵, and 5×10⁶ cells at each time point, respectively). E) Mice were followed for primary tumor growth and survival (n=8). Primary tumor volume was analyzed on day 27 by Kruskal-Wallis test with Dunn’s multiple comparisons test (no treatment: n=12, myeloid: n=9, IL-12 pre-treated: n=9, IL12-GEMy: n=12). F) Lung metastasis was assessed by bioluminescent imaging ex vivo by IVIS on day 27. Pictures of lungs were normalized, visually inspected for bioluminescence, and categorically grouped into high metastasis (presence of bioluminescence) or no/low metastasis (no bioluminescence). Statistical analysis was determined by Fisher’s exact test. G) M3-9-M ffluc-mCherry mice were treated with low dose (1×10⁶) or high dose (8×10⁶) of IL12-GEMys and followed for survival and tumor growth. Survival was analyzed by Log-rank (Mantel-Cox) test. H) Experiment as described in D. Cytotoxic T cell, Non-Cytotoxic T cell, NK cell, and Other Lymphocyte clusters were subsetted from the whole lung scRNA-seq analysis and reclustered to identify more specific cell subsets. **** p < 0.0001; *** 0.0001 < p < 0.001; ** 0.001 < p < 0.01; * 0.01 < p < 0.05. In line graphs, data are represented as mean ± SEM. In boxplots, the center line represents the median, the box limits denote the 25th to the 75th percentile and the whiskers represent the minimum and maximum value.
Fig. S3. Single cell RNA sequencing cluster identification and expression of pre-metastatic signature genes associated with immune suppression, Related to Figure 1E–G
A) UMAP plot of combined samples color-coded to indicate cluster identity annotations. B) Heat map displaying the top 10 genes used to define each cluster. C-D) Violin plots of genes associated with immune suppression. Statistical differences between groups analyzed by Wilcoxon test. **** p < 0.0001; *** 0.0001 < p < 0.001; ** 0.001 < p < 0.01; * 0.01 < p < 0.05.
Data Availability Statement
Data generated in this study are available in the Gene Expression Omnibus (GEO) database under the accession numbers GSE166763 for bulk RNA-seq and GSE number pending for scRNA-seq data. All the Software packages and methods used in this study are referenced under Method Details.