

Abstract
Total daily energy expenditure (“total expenditure”, MJ/d) reflects daily energy needs and is a critical variable in human health and physiology, yet it is unclear how daily expenditure changes over the life course. Here, we analyze a large, globally diverse database of total expenditure measured by the doubly labeled water method for males and females aged 8 days to 95 yr. We show that total expenditure is strongly related to fat free mass in a power-law manner and identify four distinct metabolic life stages. Fat free mass-adjusted daily expenditure accelerates rapidly in neonates (0-1yr) to ~46% above adult values at ~1 yr, declines slowly throughout childhood and adolescence (1-20 yr) to adult levels at ~20 yr, remains stable in adulthood (20-60 yr) even during pregnancy, and declines in older adults (60+ yr). These changes in total expenditure shed new light on human development and aging and should help shape nutrition and health strategies across the lifespan.
One Sentence Summary:
Expenditure varies as we age, with four distinct metabolic life stages reflecting changes in behavior, anatomy, and tissue metabolism.
All of life’s essential tasks, from development and reproduction to maintenance and movement, require energy. Total expenditure is thus fundamental to understanding both daily nutritional requirements and the body’s investment among activities. Yet we know surprisingly little about the determinants of total expenditure in humans or how it changes over the lifespan. Most large (n>1,000) analyses of human energy expenditure have been limited to basal expenditure, the metabolic rate at rest (1), which accounts for only a portion (usually ~50-70%) of total expenditure, or have estimated total expenditure from basal expenditure and daily physical activity (2–5). Measurements of total expenditure in humans during daily life, outside of the laboratory, became possible in the 1980’s with the advancement of the doubly labeled water method , but doubly labeled water studies to date have been limited in sample size (n < 600), geographic and socioeconomic representation, and/or age (6–9).
Body composition, size, and physical activity change over the life course, often in concert, making it difficult to parse the determinants of energy expenditure. Total expenditure increases with age as children grow (10), but the relative effects of increasing physical activity (11–13) and age-related changes in tissue-specific metabolic rates, as have been reported for the brain (14), are unclear. Total and basal expenditure increase from childhood through puberty, but much of this increase is attributable to increased fat free mass, and the role of endocrine or other effects is uncertain (15). The decline in total expenditure beginning in the sixth decade of life corresponds with a decline in fat free mass (9) and “physical activity level”, PAL (the ratio of total/basal expenditure), but may also reflect age-related reductions in organ metabolism.
We investigated the effects of age, body composition, and sex on total expenditure and its components, using a large (n = 6,421; 64% female), geographically and economical diverse (n = 29 countries) database of doubly labeled water measurements for subjects aged eight days to 95 years (16), calculating total expenditure from isotopic measurements using a single, validated equation for all subjects (17). Basal expenditure, measured via indirect calorimetry, was available for a n = 2,008 subjects, and we augmented the dataset with additional published meaures of basal expenditure in neonates and doubly labeled water-mesaured total expenditure in pregnant and post-partum women (Methods; Table S1).
We found that both total and basal expenditure increased with fat free mass in a power-law manner (TEE= 0.677FFM0.708, r2=0.83 Figures 1, S1, S2, Table S1). Thus, body size, particularly fat free mass, accounted for most (83%) of the variation in daily expenditure, requiring us to adjust for body size in subsequent analyses of expenditure across subjects and cohorts to isolate potential effects of age, sex, and other factors. Notably, analyses indicated an exponent <1, meaning that the ratio of energy expenditure/mass does not adequately control for body size because the ratio inherently trends lower for larger individuals (Figure S1 (18)). Instead, we used regression analysis to control for body size (18). A general linear model with ln-transformed values of energy expenditure (total or basal), fat free mass, and fat mass in adults 20 – 60 y (Table S2) was used to calculate residual energy expenditures for each subject. We converted these residuals to “adjusted” expenditures for clarity in discussing age-related changes: 100% indicates an expenditure that matches the expected value given the subject’s fat free mass and fat mass, 120% indicates an expenditure 20% above expected, etc. (Methods). Using this approach, we also calculated the portion of adjusted total expenditure attributed to basal expenditure (Figure 2D; Methods). Segmented regression analysis of (Methods) revealed four distinct phases of adjusted (or residual) total and basal expenditure over the lifespan.
Figure 1.
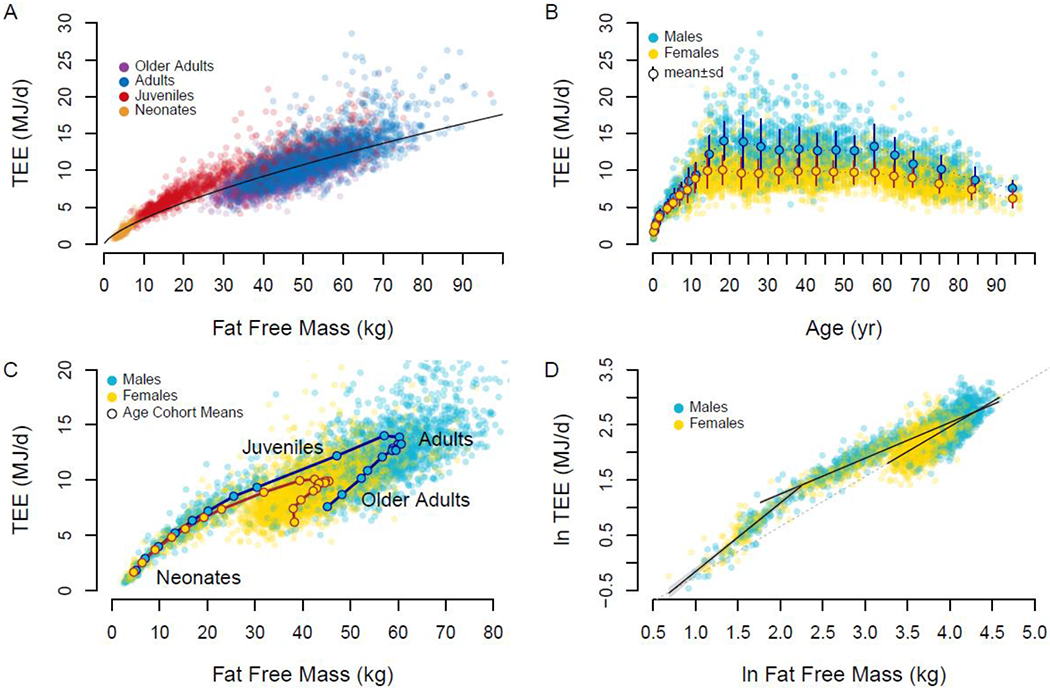
A. Total expenditure (TEE) increases with fat free mass in a power-law manner, but age groups cluster about the trend line differently. B. Total expenditure rises in childhood, is stable through adulthood, and declines in older adults. Means±sd for age-sex cohorts are shown. C. Age-sex cohort means show a distinct progression of total expenditure and fat free mass over the life course. D. Neonate, juveniles, and adults exhibit distinct relationships between fat free mass and expenditure. The dashed line, extrapolated from the regression for adults, approximates the regression used to calculate adjusted total expenditure.
Figure 2.
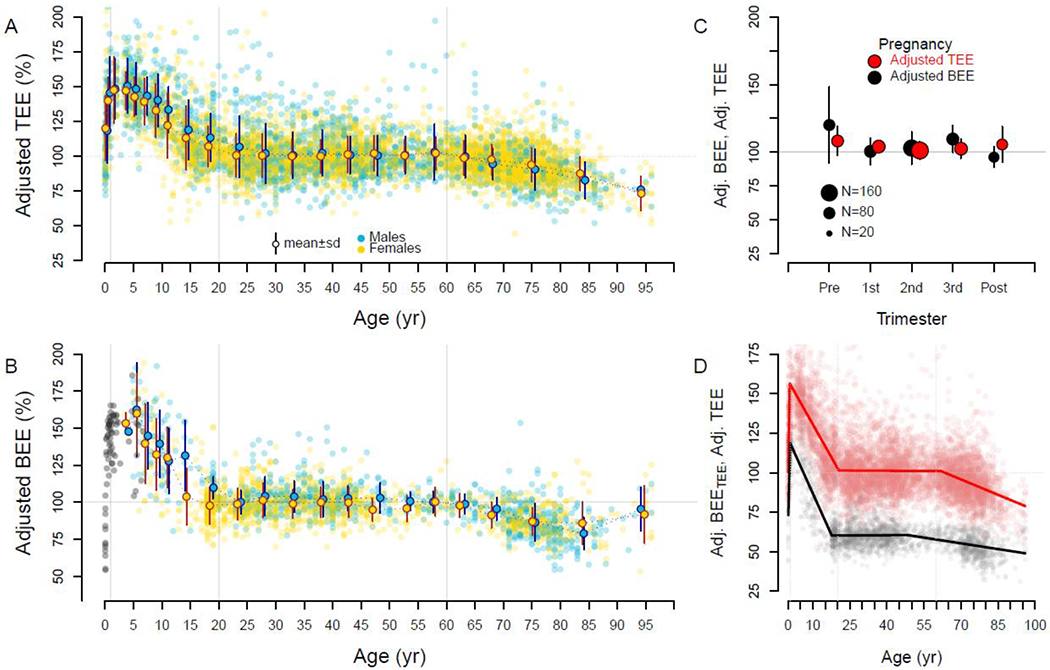
Fat free mass- and fat mass-adjusted expenditures over the life course. Individual subjects and age-sex cohort mean ± SD are shown. For both total (Adj. TEE) (A) and basal (Adj. BEE) expenditure (B), adjusted expenditures begin near adult levels (~100%) but quickly climb to ~150% in the first year. Adjusted expenditures decline to adult levels ~20y, then decline again in older adults. Basal expenditures for infants and children not in the doubly labeled water database are shown in gray. C. Pregnant mothers exhibit adjusted total and basal expenditures similar to non-reproducing adults (Pre: prior to pregnancy; Post: 27 weeks post-partum). D. Segmented regression analysis of adjusted total (red) and adjusted basal expenditure (calculated as a portion of total; Adj. BEETEE; black) indicates a peak at ~1 y, adult levels at ~20 y, and decline at ~60 y (see text).
Neonates (0 to 1 y):
Neonates in the first month of life had size-adjusted energy expenditures similar to adults, with adjusted total expenditure of 99.0 ± 17.2% (n = 35) and adjusted basal expenditure of 78.1 ± 15.0% (n = 34; Figure 2). Both measures increased rapidly in the first year. In segmented regression analysis, adjusted total expenditure rose 84.7 ± 7.2% per year from birth to a break point at 0.7 years (95% CI: 0.6, 0.8); a similar rise (75.5 ± 5.6%) and break point (1.0 y, 95% CI: 0.9, 1.1) were evident in adjusted basal expenditure (Table S4). For subjects between 9 and 15 months, adjusted total and basal expenditures were nearly ~50% elevated compared to adults (Figure 2).
Juveniles (1 to 20 y):
Total and basal expenditure, along with fat free mass, continued to increase with age throughout childhood and adolescence (Figure 1), but body size-adjusted expenditures steadily declined. Adjusted total expenditure declined at a rate of −2.8 ± 0.1% per year from 147.8 ± 22.6% for subjects 1 – 2 y (n = 102) to 102.7 ± 18.1% for subjects 20 – 25 y (n = 314; Tables S2, S4). Segmented regression analysis identified a breakpoint in adjusted total expenditure at 20.5 y (95% CI: 19.8, 21.2), after which it plateaued at adult levels (Figure 2). A similar decline (−3.8 ± 0.2% per year) and break point (18.0 y, 95% CI: 16.8, 19.2) were evident in adjusted basal expenditure (Figure 2, Text S1, Table S4). No pubertal increases in adjusted total or basal expenditure were evident among subjects 10 – 15 y. In multivariate regression for subjects 1 to 20 y, males had a higher total expenditure and adjusted total expenditure (Tables S2, S3), but sex had no detectable effect on the rate of decline in adjusted total expenditure with age (sex:age interaction p=0.30).
Adults (20 to 60 y):
Total and basal expenditure and fat free mass were all stable from age 20 to 60 (Figure 1, 2; Tables S1, S2; Text S1). Sex had no effect on total expenditure in multivariate models with fat free mass and fat mass, nor in analyses of adjusted total expenditure (Tables S2, S4). Adjusted total and basal expenditures were stable even during pregnancy, the elevation in unadjusted expenditures matching those expected from the gain in mothers’ fat free mass and fat mass (Figure 2C). Segmented regression analysis identified a break point at 63.0 y (95% CI: 60.1, 65.9), after which adjusted TEE begins to decline. This break point was somewhat earlier for adjusted basal expenditure (46.5, 95% CI: 40.6, 52.4), but the relatively small number of basal measures for 45 – 65 y (Figure 2D) reduces our precision in determining this break point.
Older adults (>60 y):
At ~60 y, total and basal expenditure begin to decline, along with fat free mass and fat mass (Figures 1, S3, Table S1). Declines in expenditure are not only a function of reduced fat free mass and fat mass, however. Adjusted total expenditure declined by −0.7 ± 0.1% per year, and adjusted basal expendiure fell at a similar rates (Figure 2, Figure S3, Text S1, Table S4). For subjects in their nineties, adjusted TEE was ~26% below that of middle-aged adults.
In addition to providing empirical measures and predictive equations for total expenditure from infancy to old age (Tables S1, S2), our analyses bring to light major changes in metabolic rate across the life course. To begin, we can infer fetal metabolic rates from maternal measures during pregnancy: if body size-adjusted expenditures were elevated in the fetus, then adjusted expenditures for pregnant mothers, particularly late in pregnancy when the fetus accounts for a substantial portion of a mother’s weight, would be likewise elevated. Instead, the stability of adjusted total and basal expenditures at ~100% during pregnancy (Figure 2B) indicates that the growing fetus maintains a fat free mass- and fat mass-adjusted metabolic rate similar to adults, which is consistent with adjusted expenditures of neonates (both ~100%; Figure 2) in the first weeks after birth. Total and basal expenditures, both absolute and size-adjusted values, then accelerate rapidly over the first year. This early period of metabolic acceleration corresponds to a critical period in early development in which growth often falters in nutritionally-stressed populations (19). Increasing energy demands could be a contributing factor.
After rapid acceleration in total and basal expenditure during the first year, adjusted expenditures progressively decline thereafter, reaching adult levels at ~20 yr. Elevated adjusted expenditures in this life stage may reflect the metabolic demands of growth and development. Adult expenditures, adjusted for body size and composition, are remarkably stable, even during pregnancy and post-partum. Declining metabolic rates in older adults could increase the risk of weight gain. However, neither fat mass nor percentage increased in this period (Figure S3), consistent with the hypothesis that energy intake is coupled to expenditure (20).
Following previous studies (21–25), we calculated the effect of organ size on basal expenditure over the lifespan (Methods). At rest, the tissue-specific metabolic rates (Watts/gram) of the heart, liver, brain, and kidneys are much greater than those of the muscles and other lean tissue or fat (21–25). Organs with a high tissue-specific metabolic rate, particularly the brain and liver, account for a greater proportion of fat free mass in young individuals, and thus organ-based basal expenditure, estimated from organ size and tissue-specific metabolic rate, follows a power-law relationship with fat free mass, roughly consistent with observed basal expenditures (Methods, Figure S6). Still, observed basal expenditure exceeded organ-based estimates by ~30% in early life (1 – 20 y) and was ~20% lower than organ-based estimates in subjects over 60 y (Figure S6), consistent with previous work indicating that tissue-specific metabolic rates are elevated in children and adolescents (22, 24) and reduced in older adults (21, 23, 25).
We investigated the contributions of daily physical activity and changes in tissue-specific metabolic rate to total and basal expenditure using a simple model with two components: activity and basal expenditure (Figure 3; Methods). Activity expenditure was modeled as a function of physical activity and body mass, assuming activity costs are proportional to weight, and could either remain constant at adult levels over the lifespan or follow the trajectory of daily physical activity measured via accelerometry, peaking at 5 – 10 y and declining thereafter (11, 26, 27) (Figure 3). Similarly, basal expenditure was modeled as a power function of fat free mass (consistent with organ-based BEE estimates; Methods) multiplied by a “tissue specific metabolism” term, which could either remain constant at adult levels across the lifespan or follow the trajectory observed in adjusted basal expenditure (Figure 2). For each scenario, total expenditure was modeled as the sum of activity and basal expenditure (Methods).
Figure 3.
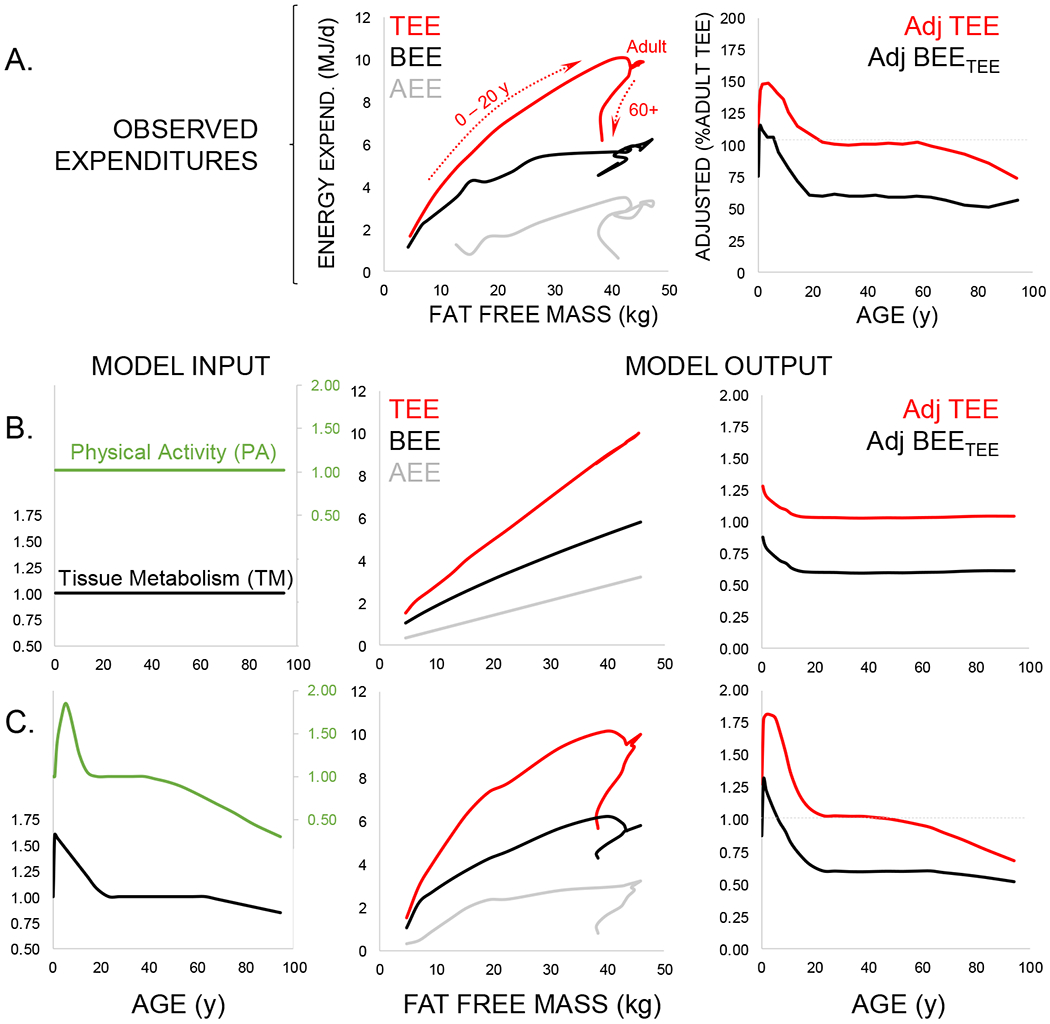
Modeling the contribution of physical activity and tissue-specific metabolism to daily expenditures. A. Observed total (TEE, red), basal (BEE, black), and activity (AEE, gray) expenditures (Table S1) show age-related variation with respect to fat free mass (see Figure 1C) that is also evident in adjusted values (Table S3; see Figure 2D). B. These age effects do not emerge in models assuming constant physical activity (PA, green) and tissue-specific metabolic rate (TM, black) across the life course. C. When physical activity and tissue-specific metabolism follow the life course trajectories evident from accelerometry and adjusted basal expenditure, respectively, model output is similar to observed expenditures.
Models that hold physical activity or tissue-specific metabolic rates constant over the lifespan do not reproduce the observed patterns of age-related change in absolute or adjusted measures of total or basal expenditure (Figure 3). Only when age-related changes in physical activity and tissue-specific metabolism are included does model output match observed expenditures, indicating that variation in both physical activity and tissue-specific metabolism contribute to total expenditure and its components across the lifespan. Elevated tissue-specific metabolism in early life may be related to growth or development (22, 24). Conversely, reduced expenditures in later life may reflect a decline in organ level metabolism (23, 25, 28).
Metabolic models of life history commonly assume continuity in tissue-specific metabolism over the life course, with cellular metabolic rates increasing in a power-law manner (Energy = aMassb) and the energy available for growth during the juvenile period made available for reproduction in adults (29, 30). Measures of humans here challenge this view, with size adjusted metabolism elevated ~50% in childhood compared to adults (including pregnant females), and ~25% lower in the oldest subjects. It remains to be determined whether these fluctuations occur in other species. In addition to affecting energy balance, nutritional needs, and body weight, these metabolic changes present a potential target for clinical investigation into the kinetics of disease, pharmaceutical activity, and healing, processes intimately related to metabolic rate. Further, there is considerable metabolic variation among individuals, with TEE and its components varying more than ± 20% even when controlling for fat free mass, fat mass, sex, and age (Figure 1, 2, Table S2). Elucidating the processes underlying metabolic changes across the life course and variation among individuals may help reveal the roles of metabolic variation in health and disease.
Supplementary Material
Acknowledgements
The DLW database, which can be found at https://doubly-labelled-water-database.iaea.org/home or https://www.dlwdatabase.org/, is generously supported by the IAEA, Taiyo Nippon Sanso and, SERCON. We are grateful to these companies for their support and especially to Takashi Oono for his tremendous efforts at fund raising on our behalf. The authors also gratefully acknowledge funding from the US National Science Foundation (BCS-1824466) awarded to Herman Pontzer. The funders played no role in the content of this manuscript.
Footnotes
Conflict of interest
The authors have no conflicts of interest to declare.
Data Availability
All data used in these analyses is freely available via the IAEA Doubly Labelled Water Database (https://doubly-labelled-water-database.iaea.org/home or https://www.dlwdatabase.org/).
References
- 1.Henry CJ, Basal metabolic rate studies in humans: measurement and development of new equations. Public Health Nutr 8, 1133–1152 (2005). [DOI] [PubMed] [Google Scholar]
- 2.FAO, Human energy requirements: report of a joint FAO/ WHO/UNU Expert Consultation. Food Nutr Bull 26, 166 (2005). [PubMed] [Google Scholar]
- 3.Westerterp KR, de Boer JO, Saris WHM, Schoffelen PFM, ten Hoor F, Measurement of energy expenditure using doubly labelled water. Int J Sport Med 5, S74–75 (1984). [Google Scholar]
- 4.Klein PD et al. Calorimetric validation of the doubly-labelled water method for determination of energy expenditure in man. Hum Nutr Clin Nutr 38, 95–106 (1984). [PubMed] [Google Scholar]
- 5.Speakman JR, Doubly Labelled Water: Theory and Practice. (Chapman and Hall, London, 1997). [Google Scholar]
- 6.Black AE, Coward WA, Cole TJ, Prentice AM, Human energy expenditure in affluent societies: an analysis of 574 doubly-labelled water measurements. Eur J Clin Nutr 50, 72–92 (1996). [PubMed] [Google Scholar]
- 7.Dugas LR et al. Energy expenditure in adults living in developing compared with industrialized countries: a meta-analysis of doubly labeled water studies. Am J Clin Nutr 93, 427–441 (2011). [DOI] [PMC free article] [PubMed] [Google Scholar]
- 8.Pontzer H et al. Constrained Total Energy Expenditure and Metabolic Adaptation to Physical Activity in Adult Humans. Curr Biol 26, 410–417 (2016). [DOI] [PMC free article] [PubMed] [Google Scholar]
- 9.Speakman JR, Westerterp KR, Associations between energy demands, physical activity, and body composition in adult humans between 18 and 96 y of age. Am J Clin Nutr 92, 826–834 (2010). [DOI] [PubMed] [Google Scholar]
- 10.Butte NF, Fat intake of children in relation to energy requirements. Am J Clin Nutr 72, 1246s–1252s (2000). [DOI] [PubMed] [Google Scholar]
- 11.Wolff-Hughes DL, Bassett DR, Fitzhugh EC, Population-referenced percentiles for waist-worn accelerometer-derived total activity counts in U.S. youth: 2003 - 2006 NHANES. PLoS One 9, e115915 (2014). [DOI] [PMC free article] [PubMed] [Google Scholar]
- 12.Schmutz EA et al. Physical activity and sedentary behavior in preschoolers: a longitudinal assessment of trajectories and determinants. Int J Behav Nutr Phys Act 15, 35 (2018). [DOI] [PMC free article] [PubMed] [Google Scholar]
- 13.Hnatiuk JA, Lamb KE, Ridgers ND, Salmon J, Hesketh KD, Changes in volume and bouts of physical activity and sedentary time across early childhood: a longitudinal study. Int J Behav Nutr Phys Act 16, 42 (2019). [DOI] [PMC free article] [PubMed] [Google Scholar]
- 14.Kuzawa CW et al. Metabolic costs and evolutionary implications of human brain development. Proc Natl Acad Sci U S A 111, 13010–13015 (2014). [DOI] [PMC free article] [PubMed] [Google Scholar]
- 15.Cheng HL, Amatoury M, Steinbeck K, Energy expenditure and intake during puberty in healthy nonobese adolescents: a systematic review. Am J Clin Nutr 104, 1061–1074 (2016). [DOI] [PubMed] [Google Scholar]
- 16.Speakman JR et al. The International Atomic Energy Agency International Doubly Labelled Water Database: Aims, Scope and Procedures. Ann Nutr Metab 75, 114–118 (2019). [DOI] [PubMed] [Google Scholar]
- 17.Speakman JR et al. A standard calculation methodology for human doubly labeled water studies. Cell Rep Med 2, 100203 (2021). [DOI] [PMC free article] [PubMed] [Google Scholar]
- 18.Allison DB, Paultre F, Goran MI, Poehlman ET, Heymsfield SB, Statistical considerations regarding the use of ratios to adjust data. Int J Obes Relat Metab Disord 19, 644–652 (1995). [PubMed] [Google Scholar]
- 19.Alderman H, Headey D, The timing of growth faltering has important implications for observational analyses of the underlying determinants of nutrition outcomes. PLoS One 13, e0195904 (2018). [DOI] [PMC free article] [PubMed] [Google Scholar]
- 20.Blundell JE et al. The drive to eat in homo sapiens: Energy expenditure drives energy intake. Physiol Behav 219, 112846 (2020). [DOI] [PubMed] [Google Scholar]
- 21.Gallagher D, Allen A, Wang Z, Heymsfield SB, Krasnow N, Smaller organ tissue mass in the elderly fails to explain lower resting metabolic rate. Ann N Y Acad Sci 904, 449–455 (2000). [DOI] [PubMed] [Google Scholar]
- 22.Hsu A et al. Larger mass of high-metabolic-rate organs does not explain higher resting energy expenditure in children. Am J Clin Nutr 77, 1506–1511 (2003). [DOI] [PubMed] [Google Scholar]
- 23.Wang Z et al. Specific metabolic rates of major organs and tissues across adulthood: evaluation by mechanistic model of resting energy expenditure. Am J Clin Nutr 92, 1369–1377 (2010). [DOI] [PMC free article] [PubMed] [Google Scholar]
- 24.Wang Z et al. A cellular level approach to predicting resting energy expenditure: Evaluation of applicability in adolescents. Am J Hum Biol 22, 476–483 (2010). [DOI] [PMC free article] [PubMed] [Google Scholar]
- 25.Wang Z, Heshka S, Heymsfield SB, Shen W, Gallagher D, A cellular-level approach to predicting resting energy expenditure across the adult years. Am J Clin Nutr 81, 799–806 (2005). [DOI] [PubMed] [Google Scholar]
- 26.Wolff-Hughes DL, Fitzhugh EC, Bassett DR, Churilla JR, Waist-Worn Actigraphy: Population-Referenced Percentiles for Total Activity Counts in U.S. Adults. J Phys Act Health 12, 447–453 (2015). [DOI] [PubMed] [Google Scholar]
- 27.Aoyagi Y, Park S, Cho S, Shephard RJ, Objectively measured habitual physical activity and sleep-related phenomena in 1645 people aged 1-91 years: The Nakanojo Community Study. Prev Med Rep 11, 180–186 (2018). [DOI] [PMC free article] [PubMed] [Google Scholar]
- 28.Yamada Y et al. Extracellular water may mask actual muscle atrophy during aging. J Gerontol A Biol Sci Med Sci 65, 510–516 (2010). [DOI] [PubMed] [Google Scholar]
- 29.West GB, Brown JH, Enquist BJ, A general model for ontogenetic growth. Nature 413, 628–631 (2001). [DOI] [PubMed] [Google Scholar]
- 30.Brown JH, Gillooly JF, Allen AP, Savage VM, West GB, Toward a metabolic theory of ecology. Ecology 85, 1771–1789 (2004). [Google Scholar]
- 31.Montgomery RD, Changes in the basal metabolic rate of the malnourished infant and their relation to body composition. J Clin Invest 41, 1653–1663 (1962). [DOI] [PMC free article] [PubMed] [Google Scholar]
- 32.Brooke OG, Cocks T, Resting metabolic rate in malnourished babies in relation to total body potassium. Acta Paediatr Scand 63, 817–825 (1974). [DOI] [PubMed] [Google Scholar]
- 33.Butte NF et al. Energy requirements derived from total energy expenditure and energy deposition during the first 2 y of life. Am J Clin Nutr 72, 1558–1569 (2000). [DOI] [PubMed] [Google Scholar]
- 34.Hernández-Triana M et al. Total energy expenditure by the doubly-labeled water method in rural preschool children in Cuba. Food Nutr Bull 23, 76–81 (2002). [PubMed] [Google Scholar]
- 35.Summer SS, Pratt JM, Koch EA, Anderson JB, Testing a novel method for measuring sleeping metabolic rate in neonates. Respir Care 59, 1095–1100 (2014). [DOI] [PubMed] [Google Scholar]
- 36.Butte NF et al. Energy expenditure and deposition of breast-fed and formula-fed infants during early infancy. Pediatr Res 28, 631–640 (1990). [DOI] [PubMed] [Google Scholar]
- 37.Gilmore LA et al. Energy Intake and Energy Expenditure for Determining Excess Weight Gain in Pregnant Women. Obstet Gynecol 127, 884–892 (2016). [DOI] [PMC free article] [PubMed] [Google Scholar]
- 38.Goldberg GR et al. Longitudinal assessment of energy expenditure in pregnancy by the doubly labeled water method. Am J Clin Nutr 57, 494–505 (1993). [DOI] [PubMed] [Google Scholar]
- 39.Butte NF, Wong WW, Treuth MS, Ellis KJ, O’Brian Smith E, Energy requirements during pregnancy based on total energy expenditure and energy deposition. Am J Clin Nutr 79, 1078–1087 (2004). [DOI] [PubMed] [Google Scholar]
- 40.Weir JB, New methods for calculating metabolic rate with special reference to protein metabolism. J Physiol 109, 1–9 (1949). [DOI] [PMC free article] [PubMed] [Google Scholar]
- 41.Team RC, R: A language and environment for statistical computing. R Foundation for Statistical Computing. (Vienna, Austria, 2020). [Google Scholar]
- 42.Muggeo VMR, . Segmented: an R package to fit regression models with broken-line relationships. R News 8/1, 20–25 (2008). [Google Scholar]
- 43.Elia M, in Physiology, Stress, and Malnutrition, Kinney JM, Tucker HN, Eds. (Raven Press, Philadelphia, 1997), pp. 383–411. [Google Scholar]
- 44.Holliday MA, Potter D, Jarrah A, Bearg S, The relation of metabolic rate to body weight and organ size. Pediatr Res 1, 185–195 (1967). [DOI] [PubMed] [Google Scholar]
- 45.Holliday MA, Metabolic rate and organ size during growth from infancy to maturity and during late gastation and early infancy. Pediatrics 47, Suppl 2:169+ (1971). [PubMed] [Google Scholar]
- 46.Molina DK et al. Organ Weight Reference Ranges for Ages 0 to 12 Years. Am J Forensic Med Pathol 40, 318–328 (2019). [DOI] [PubMed] [Google Scholar]
- 47.Sawabe M et al. Standard organ weights among elderly Japanese who died in hospital, including 50 centenarians. Pathol Int 56, 315–323 (2006). [DOI] [PubMed] [Google Scholar]
- 48.Kwon S, Honegger K, Mason M, Daily Physical Activity Among Toddlers: Hip and Wrist Accelerometer Assessments. Int J Environ Res Public Health 16, (2019). [DOI] [PMC free article] [PubMed] [Google Scholar]
- 49.Hager ER et al. Toddler physical activity study: laboratory and community studies to evaluate accelerometer validity and correlates. BMC Public Health 16, 936 (2016). [DOI] [PMC free article] [PubMed] [Google Scholar]
- 50.Silva P et al. Lifespan snapshot of physical activity assessed by accelerometry in Porto. J Phys Act Health 8, 352–360 (2011). [DOI] [PubMed] [Google Scholar]
- 51.Doherty A et al. Large Scale Population Assessment of Physical Activity Using Wrist Worn Accelerometers: The UK Biobank Study. PLoS One 12, e0169649 (2017). [DOI] [PMC free article] [PubMed] [Google Scholar]
- 52.Blair PS et al. Childhood sleep duration and associated demographic characteristics in an English cohort. Sleep 35, 353–360 (2012). [DOI] [PMC free article] [PubMed] [Google Scholar]
- 53.Kohyama J, Mindell JA, Sadeh A, Sleep characteristics of young children in Japan: internet study and comparison with other Asian countries. Pediatr Int 53, 649–655 (2011). [DOI] [PubMed] [Google Scholar]
- 54.Iglowstein I, Jenni OG, Molinari L, Largo RH, Sleep duration from infancy to adolescence: reference values and generational trends. Pediatrics 111, 302–307 (2003). [DOI] [PubMed] [Google Scholar]
- 55.Brambilla P et al. Sleep habits and pattern in 1-14 years old children and relationship with video devices use and evening and night child activities. Ital J Pediatr 43, 7 (2017). [DOI] [PMC free article] [PubMed] [Google Scholar]
Associated Data
This section collects any data citations, data availability statements, or supplementary materials included in this article.
Supplementary Materials
Data Availability Statement
All data used in these analyses is freely available via the IAEA Doubly Labelled Water Database (https://doubly-labelled-water-database.iaea.org/home or https://www.dlwdatabase.org/).