

Abstract
Changes in the composition and viscoelasticity of the extracellular matrix in load-bearing cartilage influence the proliferation and phenotypes of chondrocytes, and are associated with osteoarthritis. However, the underlying molecular mechanism is unknown. Here, we show that the viscoelasticity of alginate hydrogels regulates cellular volume in healthy human chondrocytes (with faster stress relaxation allowing cell expansion and slower stress relaxation restricting it) but not in osteoarthritic chondrocytes. Cellular-volume regulation in healthy chondrocytes was associated with changes in anabolic gene expression, in the secretion of multiple pro-inflammatory cytokines, and in the modulation of intracellular calcium regulated by the ion-channel protein TRPV4 (transient receptor potential cation channel subfamily V member 4), which controls the phosphorylation of GSK3β (glycogen synthase kinase 3 beta), an enzyme with pleiotropic effects in osteoarthritis. But a dysfunctional TRPV4-GSK3β pathway in osteoarthritic chondrocytes rendered the cells unable to respond to environmental changes in viscoelasticity. Our findings suggest strategies for restoring chondrocyte homeostasis in osteoarthritis.
Osteoarthritis (OA) is a major disease affecting 1 in 6 adults above 60 years of age in the US that significantly impairs quality-of-life by impacting movement and function1,2. Currently, there are no disease-modifying or effective pharmacological treatments that slow the progression of OA, leaving only end-stage options of surgical total joint replacement2. Tissue health and disease is frequently governed by a complex and non-linear interplay of cell-intrinsic and systemic factors including both biochemical and biophysical cues. While it is widely appreciated that the OA disease pathology accompanies dynamic changes in ECM-cellular crosstalk in joint cartilage, the precise molecular players that regulate and transduce the changes in ECM composition and mechanical properties to the intracellular signaling have been elusive3.
Articular cartilage consists of chondrocytes and ECM, which is filled by interstitial fluid. Interactions among these components play a key role in cartilage homeostasis and OA progression. Fluid movement through porous cartilage tissue (poroelasticity) has been reported to alter transport of nutrients/growth factors, induce streaming potential, affect the cell-matrix interactions, and mechanotransdction4,5 In addition, fluid flow and pressure have been known to affect metabolism of chondrocytes as well as deformation of cell shape and extracellular matrix4,6. Cartilage ECM is composed mainly of type II collagen and proteoglycans with specific glycosaminoglycans (GAGs) such as hyaluronic acid and chondroitin sulphate. OA disease propagation involves secretion of multiple proteases, including MMPs and ADAMTSs, that can profoundly change the ECM composition and mechanical characteristics7–9.
Time-dependent mechanical behavior of articular cartilage is attributed to poroelasticity, viscoelasticity or a combination of these phenomenon, and has been shown to play a key role in load bearing, joint lubrication, and homeostasis10,11. Previous studies of mechanotransduction in cartilage biology have mainly focused on the impact of fluid flow4,6, ECM stiffness and adhesion ligand density on the function and fate of chondrocytes, by encapsulating cells in gels composed of different biomaterials including polyethylene glycol12,13, agarose12,14, alginate12,15–17, hyaluronic acid18, collagen19, and gelatin20. However, cartilage ECM is viscoelastic, exhibiting a time dependent response to mechanical stress or strain, and the time-dependent mechanical properties of ECM have been found to affect the proliferation, gene expression, and phenotype in bovine and porcine chondrocytes21,22. ECM viscoelasticity has been shown to impact a number of other processes, including cell spreading23–27, mesenchymal stem cell differentiation28,29, and cell migration30, in which integrin-mediated pathways are implicated. However, the molecular mechanisms through which ECM viscoelasticity is sensed and transduced by human chondrocytes remains unclear.
Here, we investigated the role of ECM viscoelasticity in regulating the function of healthy and osteoarthritic human chondrocytes. We found that the healthy human chondrocytes decrease expression of genes associated with cartilage matrix production and acquire a pro-inflammatory phenotype in gels with slow stress relaxation, in which cellular volume expansion is mechanically restricted. Mechanistically, intracellular calcium levels, which are regulated by TRPV4 ion channels in normal chondrocytes, change in response to ECM viscoelasticity to control GSK3β activation. Furthermore, the TRPV4-GSK3β molecular axis is impaired in osteoarthritic chondrocytes so that the OA cells cannot sense and respond to altered viscoelasticity of surrounding matrix. Together, these results reveal insights into how matrix viscoelasticity regulates chondrocyte function in healthy and diseased states.
Results
ECM viscoelasticity regulates the phenotype of human chondrocytes
To investigate the response of normal human chondrocytes to ECM stress relaxation, human adult articular chondrocytes obtained from 3 different donors (56, 63, and 66-year-old non-OA donor) and chondrocytes differentiated from human induced pluripotent stem cells (iChondrocytes)31 were cultured in alginate gels. Alginate gels with distinct viscoelastic properties were formed using two different average molecular weights of alginate, but the same concentration of alginate28. Viscoelasticity of the gels was quantified using a stress relaxation test performed under constant compression and shear stress, and the resulting stress was measured overtime (Figure 1a and Supplementary Figure 1). Stress relaxation corresponds to a decrease in the resistance to deformation over time. Faster stress relaxation corresponds to greater creep and a higher loss modulus and loss tangent in these gels (Supplementary Figure 1)21. Gels composed of low and high molecular weights exhibited relaxation half-times of 60 seconds, hereon referred to as fast relaxing, and 2400 seconds, referred to as slow relaxing, respectively. To determine the contribution of poroelasticity in stress relaxation, we also performed an unconfined compression test of gels with diameters ranging from 6 mm to 12 mm made from alginates with different molecular weights. We find that the stress relaxation in gels with different compositions does not depend on the diameter of gels (Supplementary Figure 1). This result demonstrates that these alginate gels exhibit stress relaxation determined primarily by viscoelasticity (minimal contribution of poroelasticity), i.e., caused by local rearrangement of polymer chains and/or crosslinks. The calcium crosslinking concentration was adjusted so that the initial elastic modulus was 3 kPa in both cases, as this value was observed to be conducive to the function of chondrocytes in 3D microenvironments21 (Supplementary Figure 1b). To test the porosity and molecular transport in the gels, release kinetics of bovine serum albumin (molecular weight ~66 kDa) and fluorescein (molecular weight ~412 Da) encapsulated in fast and slow relaxing gels were quantified (Supplementary Figure 2). Similar release kinetics in both fast and slow relaxing gels ruled out any major differences in gel porosity or molecular transport.
Fig. 1 |. Normal chondrocytes exhibit a robust response to differential stress relaxation with changes in volume, gene expression and secreted factors.
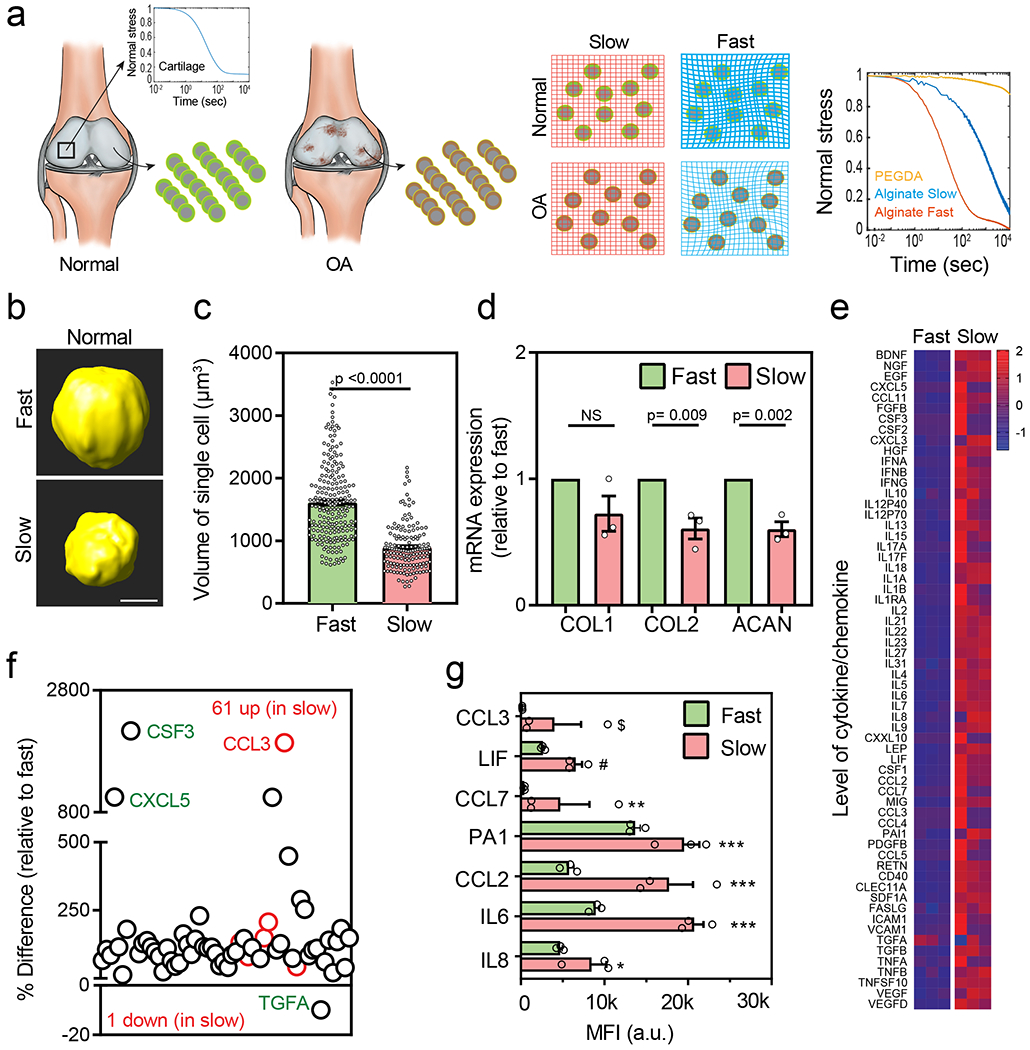
(a) Schematic of the experimental procedure to isolate healthy chondrocytes and diseased (OA) chondrocytes (from patients undergoing total knee arthroplasty). Inset graph depicts the stress relaxation profile of a normal cartilage. After isolation, chondrocytes were expanded and encapsulated in slow and fast relaxing 3D alginate gels with an initial modulus of ~3kPa (middle panels). Stress relaxation profiles of fast and slow relaxing gels without cells are also shown (right panel). The relaxation profile of PEGDA is shown which is a generally used covalently crosslinked synthetic biopolymer for 3D cell encapsulation, (b) Representative 3D rendering of single normal chondrocytes from confocal imaging in fast (top panel) and slow (bottom panel) stress relaxation states at day 7with Representative 3D rendering of single normal chondrocytes from confocal imaging in fast (top panel) and slow (bottom panel) stress relaxation states at day 7 (nFast =213, nSlow =155 single cells from 3 different normal donors, p < 0.0001, significance was determined by unpaired two-tailed Student’s t test), (d) mRNA expression of anabolic genes type I collagen (COL1), type II collagen (COL2), and aggrecan (ACAN) in fast and slow relaxing gels for normal (n=3, biological replicates from 3 different normal donors per condition. Expression values are evaluated relative to fast relaxing group. pCOL2 =0.009 and pACAN = 0.002, significance was determined by unpaired two-tailed Student’s t test), (e) Heatmap showing the results of quantitative 62-plex Luminex assay for cytokine/chemokine content in normal chondrocytes cultured in fast and slow relaxing gels. Data is normalized by evaluating Z-score. Colour bar represents the Z-Score. (f) Quantification of % difference (relative to fast relaxing gels) in cytokine/chemokine secretion in normal chondrocytes. Red circles denote all cytokines determined to be statistically different represented in (g), n=3 biological replicates from a single donor per condition, *** p < 0.0001, ** p = 0.0006, * p = 0.007, # p = 0.003, $ p = 0.018 by unpaired multiple t test corrected using Holm-Sidak method. MFI is a raw mean fluorescent intensity. Scale bar: (b) 5 μm. All data shown as mean ± SEM.
We first examined the impact of gel viscoelasticity on cell volume, proliferation and gene expression. Adult human chondrocytes were encapsulated in the fast and slow relaxing alginate gels respectively and cultured for 7 days. No differences in chondrocyte proliferation were observed between fast and slow relaxing gels at day 7 (Supplementary Figure 3). Interestingly, cellular volume of the single chondrocytes in fast relaxing gels was observed to be significantly expanded compared to the slow relaxing gels (Figure 1b, c and Supplementary Figure 4). Comparing the cellular volumes between days 1 and 7 clearly demonstrated that the difference in volume resulted from expansion of human chondrocytes in fast relaxing gels but not in slow relaxing gels (Supplementary Figure 5). Similar expansion of volume was also observed in fast relaxing gels when the initial elastic modulus of gels was increased to 20 kPa, which is within the range of moduli of e pericellular matrix (PCM) in native articular cartilage, or 10 kPa to 75 kPa (Supplementary Figure 6)32–34
In addition to the increase in cell volume, gene expression was altered by viscoelasticity of gels. The expression of anabolic genes involved in cartilage matrix synthesis such as type II collagen (COL2), and aggrecan (ACAN) were significantly increased in fast relaxing gels, while expression of catabolic genes involved in cartilage matrix degradation such as MMP3 and MMP13 were similar (Supplementary Figure 7). Similar observations were found with the iChondrocytes31 (Supplementary Figure 8). The iChondrocytes expand their volume and exhibit upregulation of anabolic genes in fast relaxing gels without altering most of the catabolic gene expressions except MMP3, compared to slow relaxing gels. No difference in the deposition of PCM, as characterized by staining for COL6, was observed after 7 days of chondrocyte culture (Supplementary Figure 9b). However, higher accumulation of COL2 and ACAN was seen in fast relaxing gels at day 21 (Supplementary Figure 9c).
Thereafter, we determined the role of viscoelastic gels in the regulation of inflammatory phenotype in chondrocytes. Previously, gene expression and secretion of IL-1β, a pro-inflammatory cytokine implicated in OA pathology, was observed to be increased in bovine chondrocytes cultured in slow relaxing gels21. However, gene expression of IL-1β in human chondrocytes was not significantly increased (but showed an increasing trend) in slow relaxing gels (Supplementary Figure 7). To identify the impact of ECM stress relaxation on the full set of inflammatory cytokines produced by human chondrocytes, we tested a broad panel of 62 major pro- and anti-inflammatory cytokines/chemokines utilizing a Luminex 62-plex immunoassay. An inflammatory signature in human chondrocytes was observed in slow relaxing gels relative to fast relaxing gels, with multiple cytokines being elevated (Figure 1 e, f). Specifically, cytokines CCL3, LIF, CCL7, PA1, CCL2, IL6 and IL8 were found to be significantly upregulated in slow relaxing gels. Taken together, these findings suggest that ECM stress relaxation exerts a broad effect on the human chondrocyte phenotype and function; while fast relaxation allows cell volume expansion and promotes matrix synthesis, slow relaxation induces a broad inflammatory state.
Slow stress relaxation primes normal chondrocytes for an elevated response to inflammatory cues
Since culture in slow relaxing hydrogels induced an inflammatory state in chondrocytes, we questioned whether such a state could lead to a heightened response to extrinsic pro-inflammatory cues. An inflamed synovium is known to secrete pro-inflammatory cytokines like IL-1β during the initiation and progression of osteoarthritis (as well as in other inflammatory conditions such as rheumatoid arthritis)35,36. To test this possibility, human normal chondrocytes were cultured in slow and fast relaxing gels with treatment of 40 ng/ml IL-1β for 48 hours. While IL-1β treatment reduced expression of the anabolic genes COL1, COL2, and ACAN in both fast and slow relaxing gels, the reduction of the expression was significantly greater in slow relaxing gels (Figure 2a). Conversely, IL-1β treatment led to increased expression of the catabolic genes IL-1β, MMP3, and MMP13 in both gel types with the increase being significantly higher in slow relaxing gels (Figure 2b). Levels of multiple cytokines were increased in the slow relaxing gels upon IL-1β treatment as compared to the fast relaxing gels (Figure 2c–e). Known chemokines that contribute towards OA initiation and progression, like CCL2, 3 and 4 along with CSF2 and FGFβ were significantly higher in slow relaxing gels37–42 (Figure 2e). On the other hand, IL8, CXCL3 and CCL5 were lower in the slow relaxing gels. It has however been established that CCL2 and not CCL5 is the major chemokine attracting immune cells in OA37. Overall, these results suggest that viscoelasticity of the surrounding matrix can modulate the response of chondrocytes to inflammatory cytokines during OA initiation and progression.
Fig. 2 |. Slow ECM stress relaxation primes normal chondrocytes for an elevated response to inflammatory cues.
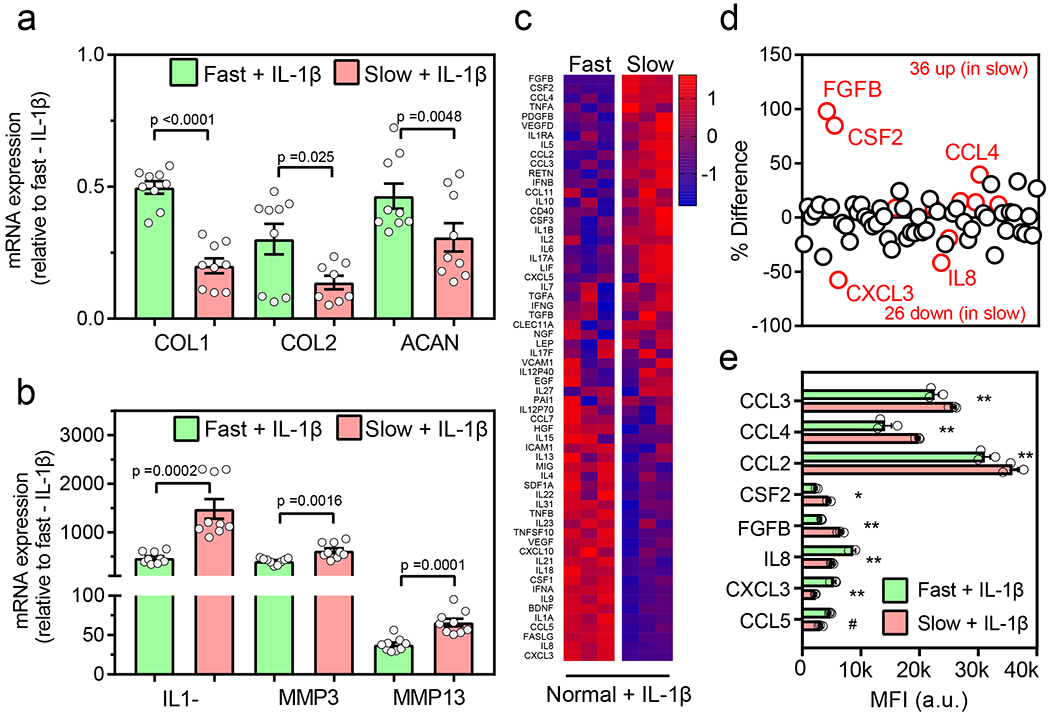
Normal chondrocytes encapsulated in fast and slow relaxing gels were treated with 40 ng/ml IL1-β for 48 hr. (a) Relative mRNA expression of anabolic genes, type I collagen (COL1), type II collagen (COL2), and aggrecan (ACAN), and (b) catabolic genes, interleukin 1β (IL1-β), matrix metallopeptidases 3 (MMP3) and 13 (MMP13) for normal chondrocytes in fast and slow relaxing gels (nslow_COL2=8 and others n=9 biological replicates per condition from a single normal donor, pCOL1 <0.0001, pCOL2 =0.025, pACAN =0.0048, pIL1-β=0.0002, pMMP3 =0.0016, pMMP13 =0.0001, significance determined by unpaired two-tailed Student’s t test). Expression values are normalized to fast - IL1-β group, (c) Heatmap showing the results of quantitative 62-plex Luminex assay for cytokine/chemokine content in normal chondrocytes in fast and slow relaxing gels. Data is normalized by evaluating Z-score. Colour bar represents the Z-Score. (d) Quantification of % difference (relative to fast relaxing gels) in cytokine/chemokine secretion in normal chondrocytes in fast and slow relaxing gels. Red circles denote all cytokines determined to be statistically different represented in (e), n=3 biological replicates from a single donor per condition, ** p < 0.0001, * p = 0.0002, # p = 0.009 by unpaired multiple t test corrected using Holm-Sidak method. MFI is a raw mean fluorescent intensity. All data shown as mean ± SEM.
Intracellular calcium-dependent changes in cellular signaling landscape in response to changes in viscoelasticity
We next sought to investigate the molecular players and pathways through which chondrocytes can sense and transduce the impact of ECM stress relaxation. Intracellular calcium ion [Ca2+] concentration is known to play an important role in volume regulation in chondrocytes by regulating gene expression and metabolic changes43. Thus, we examined levels of intracellular calcium for chondrocytes encapsulated in fast and slow relaxing gels. Intracellular calcium concentration was significantly higher in chondrocytes encapsulated in slow relaxing gels compared to the fast relaxing gels (Figure 3a–b and Supplementary Figure 10). Intracellular calcium levels were higher in the slow relaxing gels where a lower amount of calcium was used for crosslinking, indicating that extracellular calcium did not impact intracellular calcium levels. To further test this, normal chondrocytes were cultured in low melting agarose gels that exhibit fast relaxation in the absence or presence of calcium amounts that were used to crosslink fast relaxing alginate gels. Presence or absence of calcium in the medium did not affect either intracellular calcium levels or the cellular volume (Supplementary Figure 11), demonstrating that intracellular calcium levels are not impacted by the crosslinking calcium levels. Next, to evaluate the broader influence on intracellular signaling in inducing an osteoarthritic phenotype in chondrocytes, the activity of 26 mitogen activated protein kinases (MAPK) was assessed by quantifying the phosphorylation levels of these kinases (p-MAPK) on an array. These MAPK regulate multiple pathways and many of them are known to have a regulatory role in OA44–48. ECM stress relaxation influenced the cellular signaling landscape as the protein levels of 17 p-MAPK were found to be significantly altered between fast and slow relaxing gels (Figure 3c–e and Supplementary Figure 12). Among them, GSK3β (~50 fold increase), P38α (~3 fold increase), and CREB (~2.3 fold increase) showed significantly higher levels in slow relaxing gels, whereas ERK2 (~2 fold increase) levels were significantly higher in fast relaxing gels (Figure 3c–e). Levels of phosphorylated GSK3β and P38α were independently validated by immunostaining. Increased levels of phosphorylated GSK3β were observed in chondrocytes cultured in slow relaxing gels compared to the fast relaxing gels (Figure 3f–g and Supplementary Figure 13). Differences in the phosphorylated p38α levels were however less pronounced (Supplementary Figure 14). Previous data in chondrocytes stimulated with inflammatory cues like IL-1β or TNFα showed an increase in phosphorylated GSK3β, CREB, Erk1/2 and Hsp27, demonstrating that GSK3β is one of the key modulators of the response to inflammatory cues in chondrocytes49,50,48,51. Based on these results, we hypothesized that high intracellular calcium concentration in chondrocytes in slow relaxing gels can induce pro-inflammatory phenotype through phosphorylation of GSK3β.
Fig. 3 |. Intracellular calcium-dependent changes in cellular signaling landscape in normal chondrocytes.
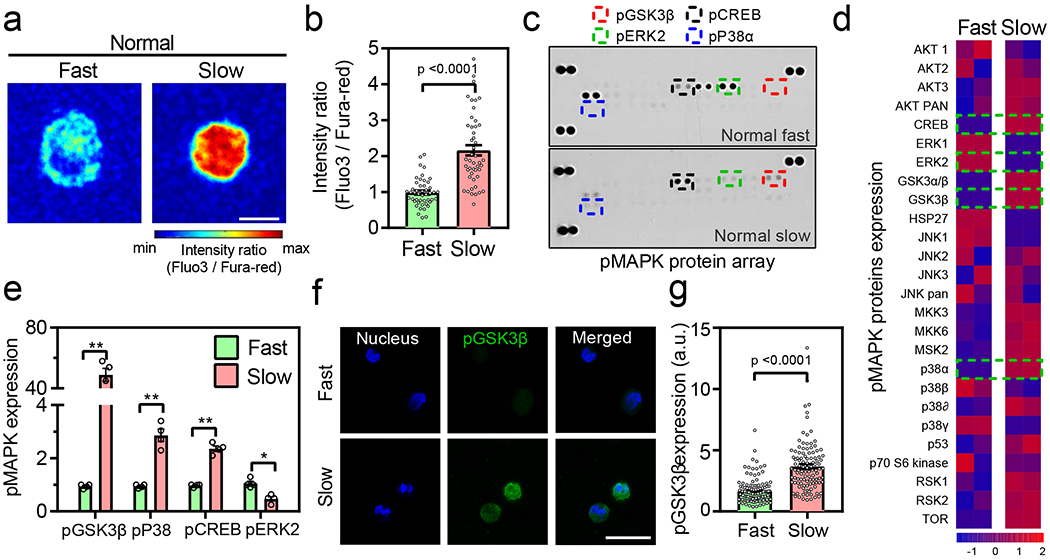
(a-b) Representative images and quantification of intracellular calcium in normal chondrocytes cultured in fast and slow relaxing gels on day 7 (n= 47 single cells from 3 normal donors per condition, p < 0.0001 significance determined by unpaired two-tailed Student’s t test), (c-d) Representative images and heatmap of phospho MAPK protein array for normal chondrocytes cultured in fast and slow relaxing gels. Data in heatmap is normalized by evaluating Z-score. Colour bar represents the Z-Score. (e) Quantification of expression of phosphorylated GSK3β, P38α, CREB, and ERK2 normal chondrocytes cultured in fast and slow relaxing gels (n=4 biological replicates per condition from cells derived from a single normal donor, ** p < 0.0001, * p = 0.02 by unpaired multiple t test corrected using Holm-Sidak method. Values are normalized to fast relaxing group, (f) Representative confocal images (>100 single cells were imaged per group) of nucleus (blue) and pGSK3β (green) for normal chondrocytes in fast and slow relaxing gels. Bar graph in (g) represents the quantification of pGSK3β fluorescence in all conditions (nfast = 120 and nslow = 109 single cells from 3 normal donors per condition, p < 0.0001 significance determined by unpaired two-tailed Student’s t test). Scale bar: (a) 10 μm (g) 25 μm. All data shown as mean ± SEM.
Intracellular calcium levels regulate GSK3β activity
To test this hypothesis, we examined the relation between calcium levels and GSK3β activity. The levels of intracellular calcium concentration were modulated using small molecule agonist and antagonist of transient receptor potential vanilloid-4 (TRPV4) ion channels. TRPV4 is a Ca2+ permeable ion channel that regulates mechanical loading in cartilage, and genetic modulation of TRPV4 has distinct effects in age-associated and post-traumatic OA52,53. Treatment with a small molecule agonist of TRPV4, GSK10154, did not impact cell viability but increased the levels of intracellular Ca2+ in chondrocytes encapsulated in fast relaxing gels (Figure 4a–b and Supplementary Figures 15 and 16a). However, increased calcium levels by TRPV4 activator did not inhibit the expansion of volume of the chondrocytes cultured in fast relaxing gels (Figure 4c and Supplementary Figure 16b), suggesting that TRPV4 is not the upstream ‘sensor’ of ECM stress relaxation. TRPV4 activation and the resulting increase in intracellular calcium levels however led to a significant decrease in the gene expression of COL2, a cartilage-specific anabolic gene (Figure 4d), however, the deposition of COL6 did not change at day 7 of culture (Supplementary Figure 17), and increase in the levels of pro-inflammatory cytokines including IL8 and CCL2 (Figure 4e–f). Out of these chemokines, PA1, which was differentially upregulated in slow relaxing gels (Figure 1g), was also significantly upregulated (~2.64 fold increase) upon TRPV4 activation. Increased expression of PA1 is directly co-related with the increased severity of OA55, and most of the increased cytokines such as CCL2, CCL3, CSF2, IL17, and IL23 are associated with increased inflammation in OA38,41,56 These results established that intracellular calcium flux through TRPV4 is indeed a molecular ‘transducer’ for ECM stress relaxation as increased intracellular calcium influx from enhanced TRPV4 activation partially shifted the chondrocyte phenotype towards the one observed in slow relaxing gels. To test if intracellular calcium level modulated by TRPV4 function is an upstream regulator of GSK3β, we performed immunohistochemistry to test levels of phosphorylated GSK3β after treating cells with TRPV4 activator in fast relaxing gels. High intracellular calcium levels triggered by TRPV4 activation directly induced higher levels of phosphorylated GSK3β (Figure 4 g, h and Supplementary Figure 16c), establishing TRPV4 to be an upstream regulator of GSK3β.
Fig. 4 |. Activation of TRPV4 leads to increased intracellular calcium levels, pGSK3β expressed and increased inflammatory phenotype.
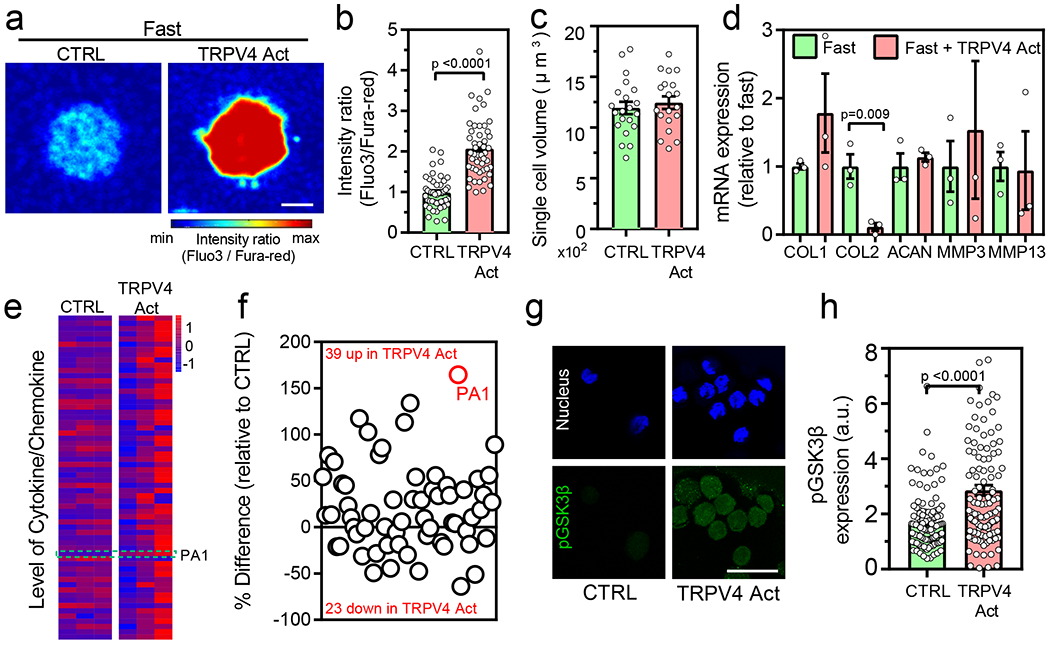
(a-b) Representative images and quantification of intracellular calcium in normal chondrocytes after treatment with TRPV4 activator (nfast=47, nfast+TRPV4Act=51 single cells from 3 normal donors, p <0.0001 significance determined by unpaired two-tailed Student’s t test), (c) Quantification of volume in normal chondrocytes cultured in indicated conditions (nfast=19, nfast+TRPV4Act=21 single cells derived from a single normal donor, not significant by unpaired two-tailed Student’s t test), (d) Relative mRNA expression of anabolic and catabolic genes (COL1, COL2 ACAN, MMP3, and MMP13) for normal chondrocytes cultured in indicated conditions (nfast=3, nfast+TRPV4Act=3 replicates from a single normal donor, p= 0.009 significance determined by unpaired two-tailed Student’s t test). Expression values in fast relaxing group is utilized to normal the data, (e) Heatmap showing the results of quantitative 62-plex Luminex assay for cytokine/chemokine content in normal chondrocytes from a single donor cultured in indicated conditions. Data in heatmap is normalized by evaluating Z-score. Colour bar represents the Z-Score. Quantification of % difference in cytokine/chemokine secretion is also shown in (f) for the indicated conditions. Red circles denote all cytokines determined to be statistically different by unpaired multiple t test corrected using Holm-Sidak method (p <0.0001 for PA1) (g) Representative confocal images of nucleus (blue) and pGSK3β (green) for normal chondrocytes cultured in the indicated conditions and the quantification of pGSK3β is shown in (h) (nfast=120, nfast+TRPV4Act=116 single cells derived from 3 different normal donors, p <0.0001 significance determined by unpaired two-tailed Student’s t test). Scale bar: (a) 10 μm (g) 25 μm. All data shown as mean ± SEM.
As a corollary, GSK205, a small molecule inhibitor of TRPV4 with high specificity52, was used to test whether reducing intracellular calcium through TRPV4 inhibition can prevent the osteoarthritic phenotype of chondrocytes in slow relaxing gels. Treatment with TRPV4 inhibitor did not influence the viability but significantly decreased the levels of intracellular calcium ions in chondrocytes in slow relaxing gels, however there was no change in chondrocyte volume (Figure 5a–c and Supplementary Figure 15 and 16a–b). Additionally, deposition of COL6 also did not change at day 7 of culture (Supplementary Figure 17). These observations again confirmed that volume change in response to ECM stress relaxation is upstream of TRPV4 activity. TRPV4 inhibition led to a significant decrease in the catabolic genes, MMP3 and MMP13 (Figure 5d) and a significant decrease in the levels of IL6, IL8, and CCL2 (Figure 5e–f). These data showed that decreased levels of intracellular calcium by TRPV4 inhibition shifted the chondrocyte phenotype towards the one observed in the fast relaxing gels. Alleviated level of intracellular calcium by TRPV4 inhibition also significantly reduced the levels of phosphorylated GSK3β (Figure 5g–h and Supplementary Figure 16c) consistent with the activator treatment, thereby confirming that TRPV4 regulates GSK3β activity. Taken together, all these findings elucidate that changes in ECM stress relaxation are transduced through the TRPV4-GSK3β molecular pathway. Volume change is the first response to ECM stress relaxation that affects the levels of intracellular calcium levels regulated by TRPV4 activity that consequently regulates GSK3β activity, thereby constituting the ‘mechanosensitive’ molecular axis in normal chondrocytes.
Fig. 5 |. Inhibition of TRPV4 leads to decreased intracellular calcium levels, pGSK3β expression and reduced inflammatory phenotype.
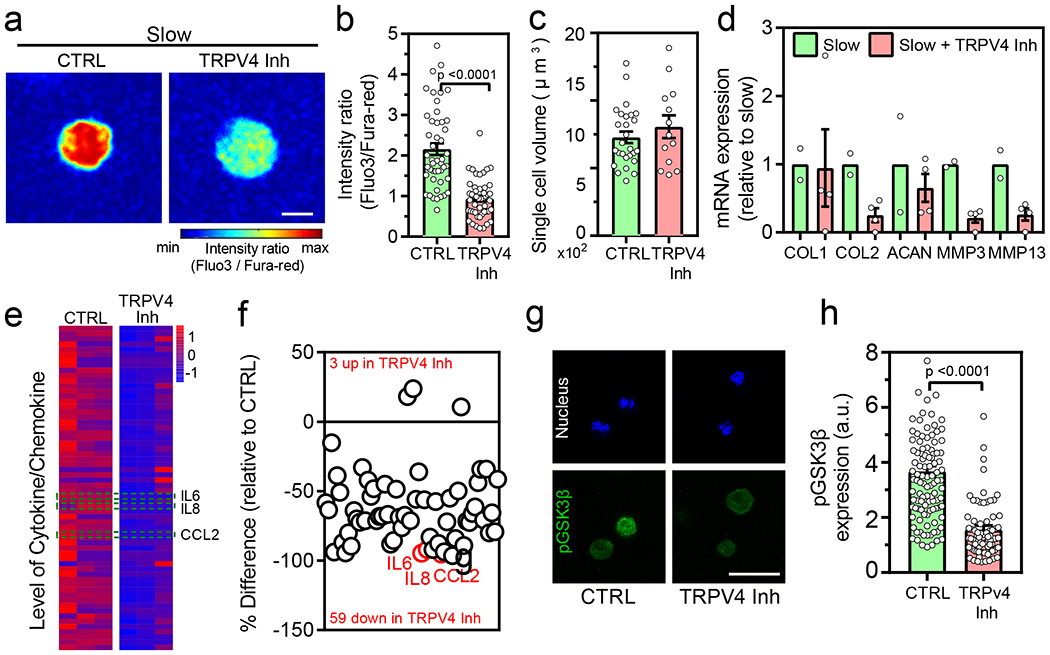
(a-b) Representative images and quantification of intracellular calcium in normal chondrocytes cultured after treatment with TRPV4 inhibitor (nslow=47 and nslow+TRPV4Inh=48 single cells from 3 normal donors, p <0.0001 significance determined by unpaired two-tailed Student’s t test), (c) Quantification of volume in normal chondrocytes cultured in indicated conditions (nslow=27 and nslow+TRPV4Inh=13 single cells derived from a single normal donor, not significant by unpaired two-tailed Student’s t test), (d) Relative mRNA expression of anabolic and catabolic genes (COL1, COL2 ACAN, MMP3, and MMP13) for normal chondrocytes cultured in indicated conditions (nslow=2 and nslow+TRPV4Inh=4 replicates from a single normal donor, significance determined by unpaired two-tailed Student’s t test). Expression values in slow relaxing group is utilized as an internal control, (e) Heatmap showing the results of quantitative 62-plex Luminex assay for cytokine/chemokine content in normal chondrocytes from a single donor cultured in indicated conditions. Data in heatmap is normalized by evaluating Z-score. Colour bar represents the Z-Score. Quantification of % difference in cytokine/chemokine secretion is also shown in (f) for the indicated conditions. Red circles denote all cytokines determined to be statistically different by unpaired multiple t test corrected using Holm-Sidak method (p <0.0001 for IL6, CCL2 and p=0.016 for IL8) (g) Representative confocal images of nucleus (blue) and pGSK3β (green) for normal chondrocytes cultured in the indicated conditions and the quantification of pGSK3β is shown in (h) (nslow=109 and nslow+TRPV4Inh=84 single cells derived from 3 different normal donors, p <0.0001 significance determined by unpaired two-tailed Student’s t test). Scale bar: (a) 10 μm (g) 25 μm. All data shown as mean ± SEM.
Osteoarthritic chondrocytes are impaired in their response to ECM stress relaxation
Next, we sought to investigate osteoarthritic chondrocytes and their response to ECM stress relaxation especially in fast relaxing gels that seemed to provide a microenvironment that was protective from inflammation. OA chondrocytes were derived from discarded tissues of 7 OA patients undergoing total knee arthroplasty, expanded in high density monolayers for limited (1- 3) passages and utilized as described previously57. Consistent with previous reports58, OA chondrocytes expressed high levels of characteristic chondrogenic (COL2, ACAN) as well as catabolic (MMP3, MMP13, ADAMTS4) genes (Supplementary Figure 18). OA chondrocytes were encapsulated and cultured in fast or slow relaxing gels for 7 days. No differences in cellular proliferation was observed between fast and slow relaxing gels (Supplementary Figure 19). Surprisingly, in contrast to normal chondrocytes, the volume of OA chondrocytes in fast relaxing gels did not increase as compared to the slow relaxing gels (Figure 6a, b and Supplementary Figure 20). Accordingly, gene expressions of either anabolic (except COL1) or catabolic genes were not different in the OA chondrocytes cultured in fast and slow relaxing gels respectively (Figure 6c and Supplementary Figure 21a). Deposition of pericellular matrix, mainly COL6 was not observed at day 7 (Supplementary Figure 22). Even after 21 days culture, the accumulation of cartilage matrix (COL2 and ACAN) was not significantly different in OA chondrocytes between fast relaxing gels and slow relaxing gels (Supplementary Figure 22). The response to ECM relaxation in terms of the secreted cytokines was also minimal in OA chondrocytes with the only significant change being in IL8 levels which were significantly upregulated (~1.5 fold) in fast relaxing gels (Figure 6d and Supplementary Figure 21b). IL-1β treatment led to similar responses of OA chondrocytes in slow and fast relaxing gels without significant alteration observed in either anabolic or catabolic gene expression or any of the cytokines quantified (Supplementary Figure 23). Overall, these results demonstrate that the OA chondrocytes are unable to respond to ECM stress relaxation, in contrast to normal chondrocytes.
Fig. 6 |. Response to viscoelasticity is absent in OA chondrocytes.
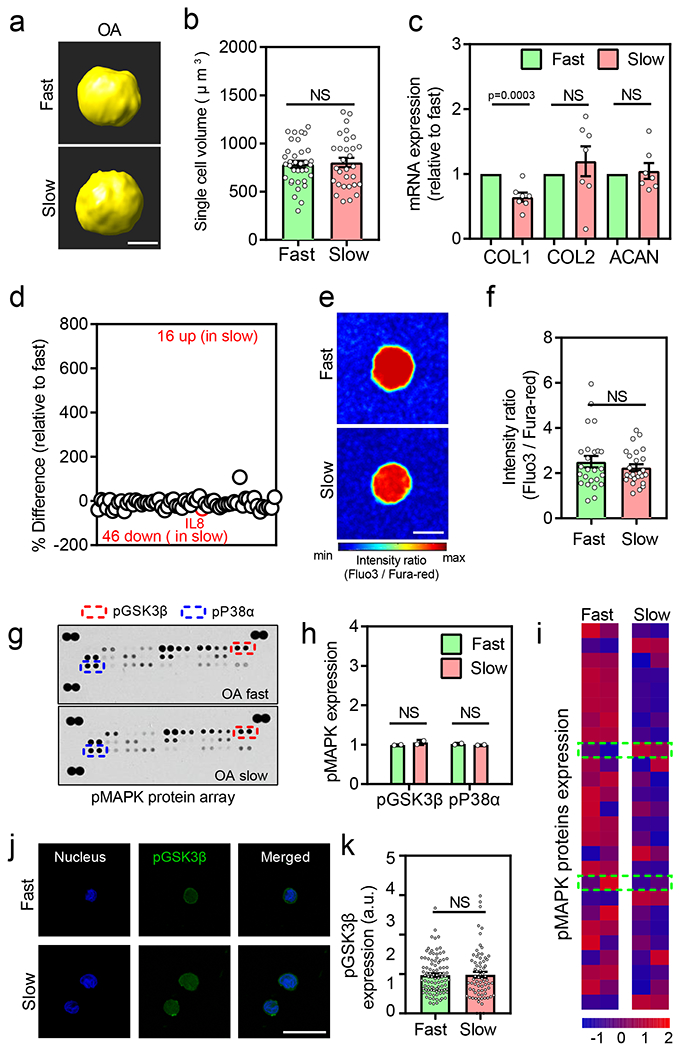
(a) Representative 3D rendering of single OA chondrocytes from confocal imaging in different stress relaxation at day 7. (b) Quantification of cell volumes of chondrocytes cultured in different stress relaxation at day 7 (nFast =30 and nslow =35 single cells derived from 3 different OA donors, not significant by unpaired two-tailed Student’s t test), (c) Relative mRNA expression of anabolic genes type I collagen (COL1), type II collagen (COL2), and aggrecan (ACAN) in fast and slow relaxing gels for OA chondrocytes (n=7 OA patients per condition, pCOL1 =0.0003 significance determined by unpaired two-tailed Student’s t test), (d) Quantification of % difference (relative to fast relaxing gels) in cytokine/chemokine secretion in OA chondrocytes. Red circles denote all cytokines determined to be statistically different (n=3 OA patients per condition), p = 0.038 by unpaired multiple t test corrected using Holm-Sidak method), (e-f) Representative images and quantification of intracellular calcium in OA chondrocytes cultured in fast and slow relaxing gels on day 7 (n=26 single cells from 3 different OA patients per condition, not significant by unpaired two-tailed Student’s t test), (g-i) Representative images, quantification of expression of phosphorylated GSK3β and p38α, and heatmap of MAPK protein array for OA chondrocytes cultured in fast and slow relaxing gels Values in (h) are normalized to fast relaxing group (n=2 biological replicates per condition from a single OA donor, significance determined by multiple t test corrected using Holm-Sidak method ). Data in (i) is normalized by evaluating Z-score. Colour bar represents the Z-Score. Top and bottom green-dashed box regions represent data for phosphorylated GSK3β and p38α, respectively, (j) Representative confocal images of nucleus (blue) and pGSK3β (green) for normal chondrocytes in fast and slow relaxing gels. Bar graph in (k) represents the quantification of pGSK3β in all fast and slow relaxing gels (nfast =95 and nslow= 72 single cells from at least 3 OA patients per condition, not significant by unpaired two-tailed Student’s t test). Scale bar: (a) 5 μm, (e) 10 μm (j) 25 μm. All data shown as mean ± SEM.
Given the impaired response of OA chondrocytes to ECM stress relaxation, we next examined intracellular calcium levels in the gels. Interestingly, levels of intracellular calcium were found to be high in both fast and slow relaxing gels unlike the low calcium levels observed in normal chondrocytes in fast relaxing gels (Figure 6e–f). Accordingly, the levels of phosphorylated GSK3β and P38α were also unaffected by ECM stress relaxation in OA chondrocytes by both the p-MAPK arrays (Figure 6g–i) and immunostaining (Figure 6j, k and Supplementary Figure 24). Together, these data suggest that during OA pathogenesis, chondrocytes lose the ability to respond to ECM stress relaxation to regulate their cell volume and intracellular calcium levels. Upon testing the gene expression of TRPV4, it was expressed in both normal and OA chondrocytes, however, the expression was surprisingly higher in the OA chondrocytes. A recently published RNA-Seq data set was in agreement with our observations (Supplementary Figure 25).
The molecular explanation for the impaired response in OA chondrocytes became evident upon testing the TRPV4 inhibitor. The high intracellular calcium levels in OA chondrocytes were not decreased upon treatment with TRPV4 inhibitor in either the fast or slow relaxing gels showing that although TRPV4 was expressed, its function was impaired in OA chondrocytes. (Figure 7a, b and Supplementary Figure 26a). The levels of phosphorylated GSK3β, similarly, were unaffected by a treatment with the TRPV4 inhibitor (Figure 7 c, d and Supplementary Figure 26c). Overall, the OA chondrocytes are unable to sense and respond to viscoelasticity by regulating their volume or intracellular calcium levels through TRPV4, suggesting an impairment in mechanotransduction at multiple levels.
Fig. 7 |. OA chondrocytes fail to regulate intracellular calcium through TRPV4 leading to perpetually high GSK3β and inflammation.
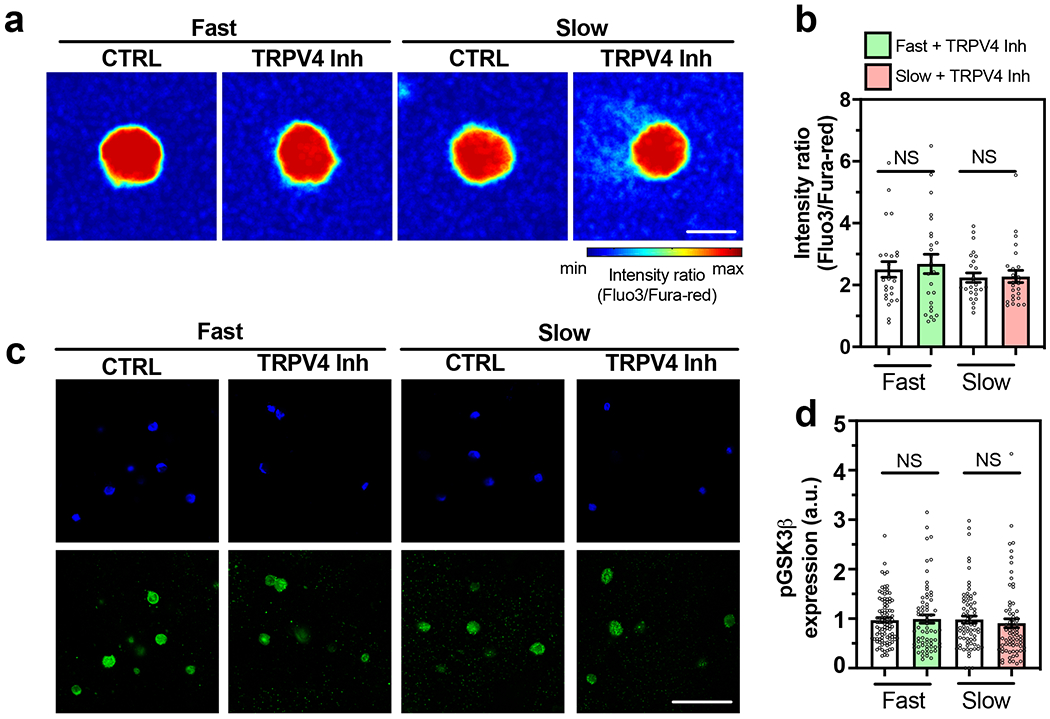
(a-b) Representative images and quantification of intracellular calcium in OA chondrocytes cultured in fast and slow relaxing gels after treatment with TRPV4 inhibitor (n=25 single cells from 3 OA patients, not significant by unpaired two-tailed Student’s t test), (c) Representative confocal images of nucleus (blue) and pGSK3β (green) as well as the quantification of pGSK3β fluorescence in (d) for OA chondrocytes cultured in the indicated conditions (nfast =95, nfast+TRPV4Inh =67, nslow =72, nslow+TRPV4Inh =71 single cells from 3 OA patients per condition, not significant by unpaired two-tailed by Student’s t test). Scale bar: (a) 10 μm, (c) 50 μm. All data shown as mean ± SEM.
Discussion
Our studies have identified how ECM viscoelasticity is sensed and transduced in healthy chondrocytes. The role of cell volume regulation has recently emerged as an important factor in various cellular processes such as stem cell differentiation29,59 cell migration60, and cell division61. We had reported in a recent study that juvenile bovine chondrocytes respond to matrix viscoelasticity with volume expansion or restriction, which altered their ability to synthesize cartilage matrix21. Here, we observe that normal human chondrocytes, both adult and iPSC-derived chondrocytes, mechanically interact with the microenvironment and respond by changing their volume even without external mechanical stimulation.
Previous studies have reported that the external mechanical stimulus (hydrostatic pressure, dynamic compression, or cyclic compression) are important for the health of chondrocytes62. It is well known that the mechanical loading to chondrocytes in physiological range enhances anabolic activities in chondrocytes by increasing ECM synthesis, while abnormal loading conditions induce catabolic activities in chondrocytes by IL-1β mediated increased expression of MMPs and reduced expression of ECM components62. However, our observations highlight that even under static condition, human chondrocytes actively interact with their surrounding ECM without any external mechanical stimulus. Human chondrocytes increase their cellular volume to sense the viscoelastic ECM (Supplementary Figure 5). This expansion of cellular volume is accompanied by an increase in the expression of genes involved in matrix production in fast relaxing gels (Figure 8). In contrast, chondrocytes sense resistance to volume expansion in slow relaxing gels (Supplementary Figure 5) leading not only to inhibition of genes associated with matrix production but also activation of an inflammatory cascade of multiple cytokines (Figure 8). Slow relaxing ECM can therefore shift the chondrocyte phenotype to a pro-inflammatory state. In addition, this chondrocyte state is primed for a heightened response to extrinsic inflammatory cues. These data indicate that local changes in ECM viscoelasticity leading to slow stress relaxation can provide a biomechanical niche to prime human chondrocytes for an elevated response to inflammatory cues. Even a transient local change in viscoelasticity can therefore initiate a feed-forward loop of inflammation, thereby potentially contributing to OA initiation and ultimate progression to the chronic inflammation that is a hallmark of the end-stage OA.
Fig. 8 |. Matrix viscoelasticity is transduced to chondrocytes via TRPV4-GSK3β axis in normal cartilage but not osteoarthritic cartilage.
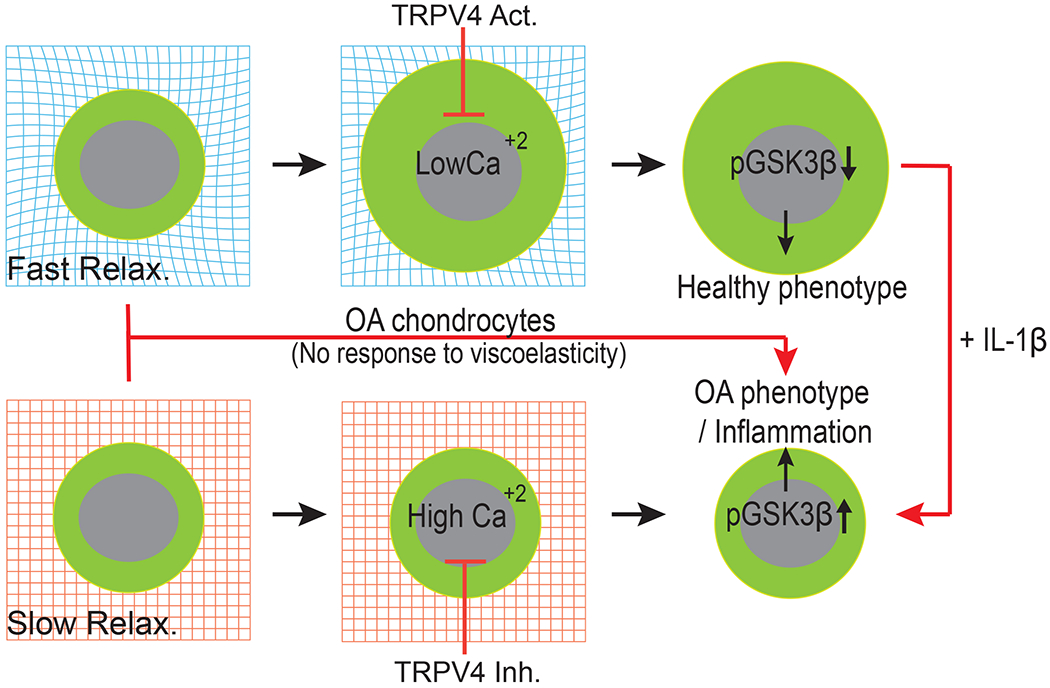
Chondrocytes cultured in fast relaxation (viscoelastic) matrices can readily remodel their surrounding ECM to dissipate physical stresses, expands volume, and decrease intracellular calcium concentration (low TRPV4 activity). This decrease in intracellular calcium enable higher GSK3β activity (by decreasing phosphorylation of GSK3β) which in turn increases cartilage matrix production and low inflammation associated with healthy phenotype of chondrocytes. In slow relaxing (elastic) matrices (much like a pre-OA microenvironment) physical stress inhibits volume expansion and enables accumulation of intracellular calcium (high TRPV4 activity). This in turn inactivates GSK3β by increasing its phosphorylation leading to high susceptibility to inflammatory insults.
Interestingly, in our studies, PCM deposition does not appear to be a major driver for sensing viscoelasticity as no differences in PCM deposition (as tested broadly by COL6 immunostaining) were observed among normal and OA chondrocytes in any of the tested conditions. Our studies identified TRPV4-GSK3β molecular axis as the mechanotransduction pathway through which human chondrocytes sense ECM viscoelasticity. In fast relaxing gels, human chondrocytes expanded their volume, leading to a decrease in intracellular calcium levels (Figure 8). In contrast, restriction to volume expansion in slow relaxing gels increased the intracellular calcium levels through TRPV4 activity, which in turn inactivated GSK3β through its phosphorylation (Figure 8). Inactive GSK3β has previously been shown to upregulate multiple transcription factors such as β-catenin63, c-Jun64, and NF-kB50 implicated in increased inflammation and cartilage degradation. Using a selective inhibitor of TRPV4 in slow relaxing gels was sufficient to decrease calcium levels, reduce GSK3β phosphorylation and inactivation and in turn reduce inflammation in chondrocytes, shifting their fate towards the phenotype observed in the fast relaxing gels. A TRPV4 activator in the fast relaxing gels, by corollary, increased calcium levels, increased GSK3β phosphorylation and inactivation and hence increased inflammation in chondrocytes. Although the data clearly implicated TRPV4 as a regulator of the calcium levels in response to ECM viscoelasticity, inhibition or activation of TRPV4 did not alter cell volume in either fast or slow relaxing gels. Cell volume regulation is therefore upstream of TRPV4 activity in response to ECM viscoelasticity suggesting that additional mechanosensitive players are involved in these processes. Cell volume changes have been shown to activate a number of Ca2+, Na+, K+, and Cl− ion transporters65. Intracellular calcium levels in the cells are also shown to be regulated by TRPC1, TRPV6, Piezo 1/2 ion channels which may also be involved in the mechanotransduction in chondrocytes66. Both TRPV4 and GSK3β are known players associated with OA, but our data have revealed a their mechanosensitive role in association with ECM viscoelasticity in cartilage biology.
Changes in the mechanical properties of the cartilage ECM have long been implicated in playing a crucial role in the initiation and progression of osteoarthritis7. Our results that OA chondrocytes are unable to sense or transduce changes in ECM viscoelasticity however suggest an additional cell intrinsic switch in the chondrocyte fate during the OA pathology. The OA chondrocytes are incapable of regulating their volume in response to ECM viscoelasticity in contrast to the normal chondrocytes. Additionally, the TRPV4-GSK3β mechanotransduction axis is impaired in OA chondrocytes, as TRPV4 activity fails to regulate intracellular calcium levels, and as the OA chondrocytes also fail to regulate their volume in response to changes in ECM viscoelasticity. A potential feedback loop of unregulated high levels of intracellular calcium levels could be responsible for the desensitization of volume regulation in the OA chondrocytes. As a result, the OA chondrocytes appear trapped in a continuously high inflammatory and catabolic state in contrast to the normal chondrocytes that have the capability to periodically regulate and dampen the catabolic and inflammatory factors while upregulating the anabolic factors in response to mechanical cues. It has been previously reported that a global knockout of TRPV4 in mice led to accelerated age-and obesity-associated OA development67. In contrast, a cartilage-specific genetic knockdown of TRPV4 in mice decreased the progression of aging-related OA53. These two studies clearly indicate a complex role of non-cartilage tissues in OA progression in the global TRPV4 knockout mice. Indeed, one possible explanation has the increased formation of ectopic bone in the global TRPV4 knockout mice owing to the role of TRPV4 in osteoclast function53,68.
In our study, treatment with TRPV4 inhibitor in normal aged-chondrocytes cultured in slow relaxing gels (comparable to cartilage-specific TRPV4 knockdown in mice) significantly decreases the calcium levels, catabolic gene expression, and production of pro-inflammatory cytokines (Figure 5a–h), thereby protecting normal chondrocyte from acquiring an OA-like phenotype. These results are in agreement with the cartilage-specific TRPV4 knockdown. However, in OA chondrocytes, although the TRPV4 gene expression is high (Supplementary Figure 25), TRPV4 function is impaired since treatment with TRPV4 inhibitor did not change the calcium levels. Collectively, our data reveal that while TRPV4 is a significant player in mechanotransduction in normal chondrocytes, it is dysfunctional in OA chondrocytes. These insights can help reconcile published reports regarding the failure of TRPV4 modulation as a therapy in animal models of post-traumatic OA despite multiple studies providing evidence for its role in mechano-transduction in loading in normal articular cartilage53,69,70. It will be critical to identify the molecular players responsible for the persistently high calcium levels in OA chondrocytes and the effects of their modulation71–73. In future experiments, it will also be important to determine the timing and mechanism of the molecular switch in OA chondrocytes that impairs their ability to respond to ECM viscoelasticity. A deeper understanding can allow efforts to restore this function to OA chondrocytes and investigations of such interventions in OA pathology. Our understanding of the fundamental mechanotransduction pathways is still nascent but it is clear that additional insights into this molecular network can enhance our understanding of OA and potentially lead to the discovery of a new class of drugs targeting the local mechanical environment.
Methods
Alginate preparation and its mechanical characterization
Sodium alginates (~270kDa, high molecular weight, FMC Biopolymers) were modulated with 8Mrad cobalt radiation to obtain low molecular weight of alginate (~35kDa)21,28. The high molecular weight (HMW) of alginate and the low molecular weight (LMW) of alginate were used to make slow relaxing gels and fast relaxing gels, respectively. Mechanical properties of alginate hydrogels were measured with stress relaxation tests under unconfined compression and shear relaxation. Unconfined compression test was conducted using a 5848 mechanical tester (Instron)21,28. Fast relaxing gels were composed of 2% (w/v) low molecular weight alginate and crosslinked using 14.6 mM CaSO4. Slow relaxing gels were composed of 2% (w/v) high molecular weight alginate and crosslinked using 9.8 mM CaSO4. All the solutions were prepared in DMEM/F12 medium that uses a sodium bicarbonate buffer system. After mixing, the solutions were immediately poured into a mold. The gels were allowed to crosslink for 45 min, and then a biopsy punch was used to punch out identically shaped discs of alginate with 2 mm thickness and 6, 8, and 12 mm diameter. The gel discs were equilibrated in DMEM for 1 day and then compressed to 15% strain with a constant deformation rate of 1mm/min and held for 3 hours by a 5848 mechanical tester. The slope of the stress vs. strain curve from the initial compression of each gel was fitted within a 5-10% strain range to determine an initial elastic modulus of the alginate. The time it took for the stress to reach half its initial value (T1/2) during the stress relaxation phase of the mechanical test was used as an empirical measure of stress relaxation. Shear relaxation tests were conducted using an AR-G2 rheometer21. Sample preparation was followed with a similar procedure of the unconfined compression test, but the mixtures of alginate hydrogels were directly poured between plates of the rheometer following mixing. The alginate mixtures were gelled for 45mins until reaching an equilibrium of both loss and storage modulus. A constant shear strain of 15% strain were then applied for 10,000s and measure stress relaxation property of hydrogels. Agarose hydrogels were prepared with low gelling temperature agarose (Sigma, A4018) and gelled on the plate at 4 C until the storage modulus and loss tangent reached an equilibrium value. Stress relaxation tests were then conducted at 37 C during 10,000s. Storage modulus and loss tangents of hydrogels were reported with the last recorded values before conducting the stress relaxation tests.
BSA and fluorescein release study
Fast (LMW) and slow (HMW) relaxing gels were prepared as described above. BSA was also added to the solution while preparing gels to reach final concentration of 2% (w/v). After gelation, identical disks with 1 mm thickness and 8 mm diameter were punched. Each disks (containing ~1000 ug BSA) were then placed in 24 well plate and incubated with 1 ml of the DMEM medium. At appropriate time points, medium was collected and replenished with the fresh medium. Amount of BSA released was estimated using BCA protein estimation kit (ThermoFisher) as per the manufacturer’s recommendation. For fluorescein (Fisher, Cat# AC410641000) release kinetics study, fluorescein was added to the gels (final concentration 1 μM) during preparation. The disks were placed in an Eppendorf tube and incubated with 1 ml of the DMEM medium. 50 μΙ of the medium was collected at appropriate time intervals and fluorescence was measured using a spectrophotometer.
Chondrocyte isolation and culture
Adult normal chondrocytes were purchased from Cell Applications, Inc. (N1: 56 years, male) and Articular Engineering, LLC (N2: 63 years, Male and N3: 66 years, Male) and expanded for limited passages (1-4) in chondrocyte growth medium. Human induced pluripotent stem cells (hiPSCs) derived chondrocytes (iChondrocytes) were generated and cultured as previously described31 in chondrocyte growth medium (Lonza) on gelatin coated plates. Osteoarthritic chondrocytes (OA) were harvested from articular cartilage samples obtained from patients (n=7, 50-70 years) during total knee arthroplasty after obtaining informed consent and in accordance to the methods and protocols approved by Institutional Review Board of Stanford University. Briefly, 4-5 mm cartilage biopsies were cut followed by ECM digestion using 1:1 ratio of collagenase II (125 U/ml) and collagenase IV (160 U/ml) in chondrocyte growth medium at 37 °C and 5% CO2 for 24 hours. The following day, the digested tissues were filtered using cell strainer (pore size: 70 μm), washed twice with DMEM/F12, and finally seeded on 150 mm tissue culture plates. OA chondrocytes were expanded for 1-2 passages before encapsulation. OA cells were cultured in DMEM/F12 supplemented with 10% fetal bovine serum (FBS), 25 μg/ml ascorbic acid, 2 mM L-glutamine, and antimicrobials (100 U/ml penicillin, 100 μg/ml streptomycin, and 0.25 μg/ml amphotericin B).
Encapsulation and culture of chondrocytes in 3D gels
Normal chondrocytes and iChondrocytes were dissociated from monolayer culture using trypsin/EDTA and gentle dissociation reagent, respectively. Whereas, OA cells were treated with collagenase II and collagenase IV solution for dissociation, a day prior to the encapsulation. For encapsulation, each cell was prepared in serum free DMEM at final density, 30million cells/ml. Alginate (LMW and HMW) were homogeneously dissolved in serum free DMEM at 3% (w/v) concentration. Alginate solution was mixed with cell solution and added to 1ml Luer lock syringes. Calcium crosslinkers were prepared with serum-free DMEM containing CaSO4 at a target concentration in another 1ml Luer lock syringe. These two 1ml syringes were connected with a female-female Luer lock coupler and homogeneously mixed. The mixed solutions were poured in a glass mold and allowed to fully gel. To encapsulate cells in agarose hydrogels, precursor solution composed of 4% (w/v) low melting agarose (Sigma, A4018) in PBS was heated at 60 °C. Precursor solution was allowed to slightly cool, mixed with the cell solution and finally poured in a glass mold to gel. The cell laden gels were punched with biopsy punch and moved in culture medium, DMEM/F12 supplemented with 10% fetal bovine serum (FBS), 25 μg/ml ascorbic acid, 2 mM L-glutamine, and antimicrobials (100 U/ml penicillin, 100 μg/ml streptomycin, and 0.25 μg/ml amphotericin B)14,34
Gene expression analysis
After 3 and 7 days of culture, cells were harvested from the gel by treating them with 75 mM of sodium citrate solution for 5-10 minutes. After the treatment, cells were centrifuged to form a pellet. For quantitative RT-PCR (qRT-PCR) analysis, RNAs were first extracted from the cells using Quick-RNA Microprep kit (Zymo) following the manufacturer’s instructions. Next, reverse transcription was carried out to generate complementary DNA (cDNA) using the High capacity cDNA reverse transcription kit (Applied Biosystems). The qRT-PCR was conducted with the TaqMan fast advanced master mix (Applied Biosystems) using a real time PCR system and human specific Taqman primers. Relative gene expression (ΔΔCt) was obtained by normalization using β-actin (Hs01060665_g1) and the control groups. Used anabolic genes were type I collagen (COL1, Hs00164004_m1), type II collagen (COL2, Hs00264051_m1), and aggrecan (ACAN, Hs00153936_m1), and catabolic genes were matrix metallopeptidases 3 (MMP3, Hs00233962_m1), 13 (MMP13, Hs00233992_m1), and ADAMTS4 (Hs00943939_m1). Gene expression of interleukin 1-β (IL-1β, Hs00174097_m1) was also similarly quantified.
Supernatant collection and luminex assay for cytokine analysis
Luminex assay was performed by combining proteins secreted in the media and proteins entrapped in the gel. Gel constructs (3 constructs/condition) were first treated with 75 mM sodium citrate solution in order to uncrosslink the alginate gel and ascertain the complete release of cytokines into the culture medium. Culture medium (also contains cells released from the gels) was then collected and centrifuged. 500 μl of supernatant was stored at −80 °C for the assay. Total DNA content of cell collected after centrifuge was also quantified using the Quant-iT Pico green dsDNA assay kit (Thermofisher). Luminex assays were performed in the Human Immune Monitoring Center at Stanford University. Human 62-plex kits were purchased from eBiosciences/Affymetrix and used according to the manufacturer’s recommendations. Mean fluorescence intensities (MFI) obtained from the assay were normalized to DNA content.
IL-1β treatment studies
Normal and OA chondrocytes were first cultured in chondrocyte culture medium for 24 hours after encapsulation to acclimatize to alginate gels After that, gel constructs were placed in culture medium containing 40 ng/ml human recombinant IL-1β (Peprotech) for 48 hours. Note that typical concentration of IL-1β in 3D cultured chondrocytes is ~20 ng/ml74. We chose a higher concentration in our experiments since we did not observe an effect at lower dosages) Thereafter, gene expression and luminex assay were performed as described above.
Phospho-MAPK protein array
Normal (with and without IL-1β treatment) and OA chondrocytes were cultured in gels for 3 days. After day 3, gels were treated with 75 mM sodium citrate to isolate the cells. Cells were then washed with PBS and lysed using the lysis buffer. Quantity of total protein was estimated using Pierce 660 nm protein assay reagent (Thermo scientific). After that human phosphor-MAPK array kit (R&D systems) was used according to manufacturer’s recommendation.
Calcium imaging
For intracellular calcium imaging, chondrocytes in alginate gels after day 7 of culture were incubated within serum free DMEM with Fura-red AM (33 μΜ, ThermoFisher Scientific) and Fluo-3 AM (20 μΜ, ThermoFisher Scientific) for 1 hour. The incubated gels were washed three times with sterilized PBS to remove residual calcium dyes. Live cell imaging using a confocal microscope (Zeiss LSM 880 laser scanning confocal microscope) was performed to record intensity of calcium dyes in cells. Fluorescent intensities of Fura-red and Fluo-3 were measured by exciting at 488 nm and detecting at >610nm (Fura-red) and at 515-580 nm (Fluo-3), respectively29. Intracellular concentration of calcium was estimated as the ratio between Fluo-3 to Fura-red intensity29, 75
Sample preparation for immunohistochemistry
Gels with normal or OA chondrocytes were fixed on day 7 or day 21 using 4% paraformaldehyde for 30 minutes. After 30 minutes, gels were washed with PBS and incubated overnight with 30% sucrose solution in PBS. Next day, tissues were incubated for 4-5 hours with solution containing equal parts of OCT and 30% sucrose. Solution was then removed, and gel were placed in a mold. Gels were then embedded in 100% OCT, frozen, and sectioned using a cryostat (Leica). 60 μm and 300 μm sections were prepared for 3D volume measurement and immunohistochemistry, respectively.
3D volume measurement
3D volumes of cells in gels were measured in 60 pm sectioned samples. OCT embedded samples were washed with DPBS three times. Staining solution accompanied with octadecyl rhodamine B chloride (1:1000 dilution, R18, ThermoFisher Scientific) and DAPI (1:500 dilution) were applied to stain the cell membrane and the nucleus for 20 minutes. The 3D image stacks were taken with a Leica SP8 confocal microscope with a 63X NA1.40 PlanApo oil immersion objective with 0.4μm z-axis interval. The obtained stacks of single cell images were analyzed and visualized with Imaris (Bitplane) 3D Image Analysis Software.
Immunohistochemistry
The sectioned samples were washed 3 times with PBS, and permeabilized with 0.25% Triton X-100 (Sigma). Samples were then incubated in 1% BSA, 22.5 mg/ml glycine in PBST (1 × PBS and 0.1% Tween 20) at room temperature for 1 hour to block non-specific binding, followed by overnight incubation at 4 °C with primary antibodies (pGSK-3β, Santa Cruz Biotechnology; sc-373800, pP38α, Cell Signaling Technologies, 9211S, collagen type II, abeam, ab34712, aggrecan, abeam, ab3778, collagen type V1, sc-20649). The samples were then washed 3 times with PBS and incubated in the dark at room temperature for 1 hour with secondary antibodies (such as goat anti-mouse IgG Dylight 488, goat anti-rabbit IgG Dylight 594 in 1:200 dilution). All the antibodies were diluted in 1% BSA in PBST. Finally, samples were washed and stained for nuclei using DAPI and/or F-actin using phalloidin (1:40 dilution). Samples were imaged using Zeiss LSM 880 laser scanning confocal microscope. The obtained images were analyzed using FIJI-imageJ v1.52i software.
TRPV4 inhibition and activation studies
Normal chondrocytes, after encapsulation in alginate gels were placed in the growth medium for 7 days containing TRPV4 activator (GSK 101, Calbiochem) and TRPV4 inhibitor (GSK 205, Calbiochem) at a final concentration of 50 nM and 10 μΜ, respectively. After 7 days, gene expression and luminex assay were performed as described above.
Proliferation and viability studies
After 7 days of culture, gels were removed from the culture medium, frozen, and lyophilized. Thereafter, lyophilized gels were digested in pappainase solution at 60 °C for 16 hrs. DNA content was then quantified using the Quant-iT Pico green dsDNA assay kit (Thermofisher).
Statistical analysis
All experiments were performed with at least three biological replicates. Statistical analysis was performed using GraphPad Prism 7.03 software. Analysis of cell volume, calcium concentration, images were performed with n ≥ 20 cells per condition. Two-tailed Student’s t-test was used to compare two experimental groups. For more than two groups one way ANOVA test was applied.
Supplementary Material
Acknowledgements
The authors would like to thank Yael Rosenberg-Hasson at the Stanford Human Immune Profiling Center for help with the Luminex analysis.
Funding:
These studies were supported by funding from the Stanford Bio-X Interdisciplinary Initiatives Seed Grants Program (IIP) (R9-52 to N.B. and O.C.), National Institute of Health grants (R01 AR070864 and R01 AR070865 to N.B., R21 AR074070 to O.C.), and Stanford Bio-X fellowship (to H.L.).
Footnotes
Competing interests
The authors declare no competing interests. Neither financial support nor other benefits have been obtained from any commercial sources for this study.
Reporting summary. Further information on research design is available in the Nature Research Reporting Summary linked to this article.
Data availability
The main data supporting the results in this study are available within the paper and its Supplementary Information. The raw and analysed datasets are available in figshare with the identifier https://doi.org/10.6084/m9.figshare.13184909 (ref.76).
References
- 1.Glyn-Jones S et al. Osteoarthritis. The Lancet 386, 376–387 (2015). [DOI] [PubMed] [Google Scholar]
- 2.Martel-Pelletier J et al. Osteoarthritis. Nat. Rev. Dis. Primer 2, 16072 (2016). [DOI] [PubMed] [Google Scholar]
- 3.Vincent TL Targeting mechanotransduction pathways in osteoarthritis: a focus on the pericellular matrix. Curr. Opin. Pharmacol. 13, 449–454 (2013). [DOI] [PubMed] [Google Scholar]
- 4.Kim YJ, Bonassar LJ & Grodzinsky AJ The role of cartilage streaming potential, fluid flow and pressure in the stimulation of chondrocyte biosynthesis during dynamic compression. J. Biomech. 28, 1055–1066 (1995). [DOI] [PubMed] [Google Scholar]
- 5.Gu WY, Lai WM & Mow VC Transport of fluid and ions through a porous-permeable charged-hydrated tissue, and streaming potential data on normal bovine articular cartilage. J. Biomech. 26, 709–723 (1993). [DOI] [PubMed] [Google Scholar]
- 6.Buschmann MD, Gluzband YA, Grodzinsky AJ & Hunziker EB Mechanical compression modulates matrix biosynthesis in chondrocyte/agarose culture. J. Cell Sci. 108, 1497–1508 (1995). [DOI] [PubMed] [Google Scholar]
- 7.Guilak F Biomechanical factors in osteoarthritis. Best Pract. Res. Clin. Rheumatol. 25, 815–823 (2011). [DOI] [PMC free article] [PubMed] [Google Scholar]
- 8.Maldonado M & Nam J The role of changes in extracellular matrix of cartilage in the presence of inflammation on the pathology of osteoarthritis. BioMed Res. Int. 2013, 284873 (2013). [DOI] [PMC free article] [PubMed] [Google Scholar]
- 9.Goldring SR & Goldring ΜB Changes in the osteochondral unit during osteoarthritis: structure, function and cartilage-bone crosstalk. Nat. Rev. Rheumatol 12, 632–644 (2016). [DOI] [PubMed] [Google Scholar]
- 10.Mow VC, Kuei SC, Lai WM & Armstrong CG Biphasic creep and stress relaxation of articular cartilage in compression? Theory and experiments. J. Biomech. Eng. 102, 73–84 (1980). [DOI] [PubMed] [Google Scholar]
- 11.Nia ΗT, Han L, Li Y, Ortiz C & Grodzinsky A Poroelasticity of Cartilage at the Nanoscale. Biophys. J. 101, 2304–2313 (2011). [DOI] [PMC free article] [PubMed] [Google Scholar]
- 12.Mouw JK, Case ND, Guldberg RE, Plaas AΗK & Levenston ΜE Variations in matrix composition and GAG fine structure among scaffolds for cartilage tissue engineering. Osteoarthritis Cartilage 13. 828–836 (2005). [DOI] [PubMed] [Google Scholar]
- 13.Smeriglio P, Lai JH, Yang F & Bhutani N 3D Hydrogel Scaffolds for Articular Chondrocyte Culture and Cartilage Generation. J. Vis. Exp. (2015) doi: 10.3791/53085. [DOI] [PMC free article] [PubMed] [Google Scholar]
- 14.Jutila AA, Zignego DL, Schell WJ & June RK Encapsulation of chondrocytes in high-stiffness agarose microenvironments for in vitro modeling of osteoarthritis mechanotransduction. Ann. Biomed. Eng. 43, 1132–1144 (2015). [DOI] [PubMed] [Google Scholar]
- 15.Guo JF, Jourdian GW & MacCallum DK Culture and growth characteristics of chondrocytes encapsulated in alginate beads. Connect. Tissue Res. 19, 277–297 (1989). [DOI] [PubMed] [Google Scholar]
- 16.Genes NG, Rowley JA, Mooney DJ & Bonassar LJ Effect of substrate mechanics on chondrocyte adhesion to modified alginate surfaces. Arch. Biochem. Biophys. 422, 161–167 (2004). [DOI] [PubMed] [Google Scholar]
- 17.Degala S, Zipfel WR & Bonassar LJ Chondrocyte calcium signaling in response to fluid flow is regulated by matrix adhesion in 3-D alginate scaffolds. Arch. Biochem. Biophys. 505, 112–117 (2011). [DOI] [PubMed] [Google Scholar]
- 18.Tan H, Chu CR, Payne KA & Marra KG Injectable in situ forming biodegradable chitosan-hyaluronic acid based hydrogels for cartilage tissue engineering. Biomaterials 30, 2499–2506 (2009). [DOI] [PMC free article] [PubMed] [Google Scholar]
- 19.Cheng H-W, Tsui Y-K, Cheung KMC, Chan D & Chan BP Decellularization of Chondrocyte-Encapsulated Collagen Microspheres: A Three-Dimensional Model to Study the Effects of Acellular Matrix on Stem Cell Fate. Tissue Eng. Part C Methods 15, 697–706 (2009). [DOI] [PubMed] [Google Scholar]
- 20.Conrad B, Han L-H & Yang F Gelatin-Based Microribbon Hydrogels Accelerate Cartilage Formation by Mesenchymal Stem Cells in Three Dimensions. Tissue Eng. Part A 24, 1631–1640 (2018). [DOI] [PMC free article] [PubMed] [Google Scholar]
- 21.Lee H, Gu L, Mooney DJ, Levenston ME & Chaudhuri O Mechanical confinement regulates cartilage matrix formation by chondrocytes. Nat. Mater. 16, 1243–1251 (2017). [DOI] [PMC free article] [PubMed] [Google Scholar]
- 22.Richardson BM, Wilcox DG, Randolph MA & Anseth KS Hydrazone covalent adaptable networks modulate extracellular matrix deposition for cartilage tissue engineering. Acta Biomater. 83, 71–82 (2019). [DOI] [PMC free article] [PubMed] [Google Scholar]
- 23.Gong Z et al. Matching material and cellular timescales maximizes cell spreading on viscoelastic substrates. Proc. Natl. Acad. Sci. 115, E2686–E2695 (2018). [DOI] [PMC free article] [PubMed] [Google Scholar]
- 24.Control of cell morphology and differentiation by substrates with independently tunable elasticity and viscous dissipation | Nature Communications. https://www.nature.com/articles/s41467-018-02906-9. [DOI] [PMC free article] [PubMed]
- 25.McKinnon DD, Domaille DW, Cha JN & Anseth KS Biophysically Defined and Cytocompatible Covalently Adaptable Networks as Viscoelastic 3D Cell Culture Systems. Adv. Mater. 26, 865–872 (2014). [DOI] [PMC free article] [PubMed] [Google Scholar]
- 26.Cameron Andrew. R., Frith Jessica. E. & Cooper-White Justin. J. The influence of substrate creep on mesenchymal stem cell behaviour and phenotype. Biomaterials 32, 5979–5993 (2011). [DOI] [PubMed] [Google Scholar]
- 27.Chaudhuri O et al. Substrate stress relaxation regulates cell spreading. Nat. Commun. 6, 6364 (2015). [DOI] [PMC free article] [PubMed] [Google Scholar]
- 28.Chaudhuri O et al. Hydrogels with tunable stress relaxation regulate stem cell fate and activity. Nat. Mater. 15, 326–334 (2016). [DOI] [PMC free article] [PubMed] [Google Scholar]
- 29.Lee H, Stowers R & Chaudhuri O Volume expansion and TRPV4 activation regulate stem cell fate in three-dimensional microenvironments. Nat. Commun. 10, 529 (2019). [DOI] [PMC free article] [PubMed] [Google Scholar]
- 30.Matrix mechanical plasticity regulates cancer cell migration through confining microenvironments | Nature Communications. https://www.nature.com/articles/s41467-018-06641-z. [DOI] [PMC free article] [PubMed]
- 31.Lee J et al. Early induction of a prechondrogenic population allows efficient generation of stable chondrocytes from human induced pluripotent stem cells. FASEB J. 29, 3399–3410 (2015). [DOI] [PMC free article] [PubMed] [Google Scholar]
- 32.Darling EM, Wilusz RE, Bolognesi MP, Zauscher S & Guilak F Spatial Mapping of the Biomechanical Properties of the Pericellular Matrix of Articular Cartilage Measured In Situ via Atomic Force Microscopy. Biophys. J. 98, 2848–2856 (2010). [DOI] [PMC free article] [PubMed] [Google Scholar]
- 33.Alexopoulos LG, Williams GM, Upton ML, Setton LA & Guilak F Osteoarthritic changes in the biphasic mechanical properties of the chondrocyte pericellular matrix in articular cartilage. J. Biomech. 38, 509–517 (2005). [DOI] [PubMed] [Google Scholar]
- 34.McLeod MA, Wilusz RE & Guilak F Depth-dependent anisotropy of the micromechanical properties of the extracellular and pericellular matrices of articular cartilage evaluated via atomic force microscopy. J. Biomech. 46, 586–592 (2013). [DOI] [PMC free article] [PubMed] [Google Scholar]
- 35.Chen D et al. Osteoarthritis: toward a comprehensive understanding of pathological mechanism. Bone Res. 5, 16044 (2017). [DOI] [PMC free article] [PubMed] [Google Scholar]
- 36.Wenham CYJ & Conaghan PG The Role of Synovitis in Osteoarthritis. Ther. Adv. Musculoskelet. Dis. 2, 349–359 (2010). [DOI] [PMC free article] [PubMed] [Google Scholar]
- 37.Raghu H et al. CCL2/CCR2, but not CCL5/CCR5, mediates monocyte recruitment, inflammation and cartilage destruction in osteoarthritis. Ann. Rheum. Dis. 76, 914–922 (2017). [DOI] [PMC free article] [PubMed] [Google Scholar]
- 38.Zhao XY et al. CCL3 serves as a potential plasma biomarker in knee degeneration (osteoarthritis). Osteoarthritis Cartilage 23, 1405–1411 (2015). [DOI] [PubMed] [Google Scholar]
- 39.Yan D et al. Fibroblast growth factor receptor 1 is principally responsible for fibroblast growth factor 2-induced catabolic activities in human articular chondrocytes. Arthritis Res. Ther 13, R130 (2011). [DOI] [PMC free article] [PubMed] [Google Scholar] [Retracted]
- 40.Scanzello CR Chemokines and Inflammation in Osteoarthritis: Insights From Patients and Animal Models. J. Orthop. Res. Off. Publ. Orthop. Res. Soc 35, 735–739 (2017). [DOI] [PMC free article] [PubMed] [Google Scholar]
- 41.Leah E Experimental arthritis: GM-CSF mediates pain and disease in a mouse model of osteoarthritis. Nat. Rev. Rheumatol. 8, 634 (2012). [DOI] [PubMed] [Google Scholar]
- 42.Cook AD et al. Granulocyte-macrophage colony-stimulating factor is a key mediator in experimental osteoarthritis pain and disease development. Arthritis Res. Ther. 14, R199 (2012). [DOI] [PMC free article] [PubMed] [Google Scholar]
- 43.Erickson GR, Alexopoulos LG & Guilak F Hyper-osmotic stress induces volume change and calcium transients in chondrocytes by transmembrane, phospholipid, and G-protein pathways. J. Biomech. 34, 1527–1535 (2001). [DOI] [PubMed] [Google Scholar]
- 44.Loeser RF, Erickson EA & Long DL Mitogen-activated protein kinases as therapeutic targets in osteoarthritis: Curr. Opin. Rheumatol. 20, 581–586 (2008). [DOI] [PMC free article] [PubMed] [Google Scholar]
- 45.Saklatvala J Inflammatory signaling in cartilage: MAPK and NF-kappaB pathways in chondrocytes and the use of inhibitors for research into pathogenesis and therapy of osteoarthritis. Curr. Drug Targets 8, 305–313 (2007). [DOI] [PubMed] [Google Scholar]
- 46.Thalhamer T, McGrath MA & Harnett ΜM MAPKs and their relevance to arthritis and inflammation. Rheumatology 47, 409–414 (2007). [DOI] [PubMed] [Google Scholar]
- 47.Ge H, Zou F, Li Y, Liu A & Tu M JNK pathway in osteoarthritis: pathological and therapeutic aspects. J. Recept. Signal Transduct. 37, 431–436 (2017). [DOI] [PubMed] [Google Scholar]
- 48.Melas IN et al. Modeling of signaling pathways in chondrocytes based on phosphoproteomic and cytokine release data. Osteoarthritis Cartilage 22, 509–518 (2014). [DOI] [PubMed] [Google Scholar]
- 49.Corr M Wnt-β-catenin signaling in the pathogenesis of osteoarthritis. Nat. Rev. Rheumatol. 4, 550–556 (2008). [DOI] [PubMed] [Google Scholar]
- 50.Miclea RL et al. Inhibition of Gsk3β in cartilage induces osteoarthritic features through activation of the canonical Wnt signaling pathway. Osteoarthritis Cartilage 19, 1363–1372 (2011). [DOI] [PubMed] [Google Scholar]
- 51.Guidotti S et al. GSK3β inactivation affects chondrocyte mitochondria leading to oxidative DNA damage, GADD45 beta induction, hypertrophy and cellular senescence. Osteoarthritis Cartilage 22, S163–S164 (2014). [Google Scholar]
- 52.O’Conor CJ, Leddy HA, Benefield HC, Liedtke WB & Guilak F TRPV4-mediated mechanotransduction regulates the metabolic response of chondrocytes to dynamic loading. Proc. Natl. Acad. Sci. U. S. A. 111, 1316–1321 (2014). [DOI] [PMC free article] [PubMed] [Google Scholar]
- 53.O’Conor CJ et al. Cartilage-Specific Knockout of the Mechanosensory Ion Channel TRPV4 Decreases Age-Related Osteoarthritis. Sci. Rep. 6, 29053 (2016). [DOI] [PMC free article] [PubMed] [Google Scholar]
- 54.Jin M et al. Determinants of TRPV4 Activity following Selective Activation by Small Molecule Agonist GSK1016790A. PLoS ONES, (2011). [DOI] [PMC free article] [PubMed] [Google Scholar]
- 55.Ramos YFM et al. Genes involved in the osteoarthritis process identified through genome wide expression analysis in articular cartilage; the RAAK study. PloS One 9, e103056 (2014). [DOI] [PMC free article] [PubMed] [Google Scholar]
- 56.Askari A et al. Increased Serum Levels of IL-17A and IL-23 Are Associated with Decreased Vitamin D3 and Increased Pain in Osteoarthritis. PLOS ONE 11, e0164757 (2016). [DOI] [PMC free article] [PubMed] [Google Scholar]
- 57.Taylor SEB et al. Identification of Human Juvenile Chondrocyte-Specific Factors that Stimulate Stem Cell Growth. Tissue Eng. Part A 22, 645–653 (2016). [DOI] [PubMed] [Google Scholar]
- 58.Aigner T, Zien A, Gehrsitz A, Gebhard PM & McKenna L Anabolic and catabolic gene expression pattern analysis in normal versus osteoarthritic cartilage using complementary DNA-array technology. Arthritis Rheum. 44, 2777–2789 (2001). [DOI] [PubMed] [Google Scholar]
- 59.Guo M et al. Cell volume change through water efflux impacts cell stiffness and stem cell fate. Proc. Natl. Acad. Sci. 114, E8618–E8627 (2017). [DOI] [PMC free article] [PubMed] [Google Scholar]
- 60.Stroka KM et al. Water Permeation Drives Tumor Cell Migration in Confined Microenvironments. Cell 157, 611–623 (2014). [DOI] [PMC free article] [PubMed] [Google Scholar]
- 61.Zlotek-Zlotkiewicz E, Monnier S, Cappello G, Berre ML & Piel M Optical volume and mass measurements show that mammalian cells swell during mitosis. J Cell Biol 211, 765–774 (2015). [DOI] [PMC free article] [PubMed] [Google Scholar]
- 62.Bader DL, Salter DM & Chowdhury TT Biomechanical influence of cartilage homeostasis in health and disease. Arthritis 2011, 979032 (2011). [DOI] [PMC free article] [PubMed] [Google Scholar]
- 63.Smurf2 induces degradation of GSK-3beta and upregulates beta-catenin in chondrocytes: a potential mechanism for Smurf2-induced degeneration of arti… - NCBI. https://www.ncbi.nlm.nih.gov/pubmed/19481076. [DOI] [PMC free article] [PubMed]
- 64.Boyle WJ et al. Activation of protein kinase C decreases phosphorylation of c-Jun at sites that negatively regulate its DNA-binding activity. Cell 64, 573–584 (1991). [DOI] [PubMed] [Google Scholar]
- 65.Lewis R, Feetham CH & Barrett-Jolley R Cell Volume Regulation in Chondrocytes. Cell. Physiol. Biochem. 28, 1111–1122 (2011). [DOI] [PubMed] [Google Scholar]
- 66.M Rocio Servin-Vences, Moroni M, Lewin G & Poole K Direct measurement of TRPV4 and PIEZO1 activity reveals multiple mechanotransduction pathways in chondrocytes, elife. [DOI] [PMC free article] [PubMed] [Google Scholar]
- 67.O’Connor CJ Increased susceptibility of Trpv4-deficient mice to obesity and obesity-induced osteoarthritis with very high-fat diet. Ann. Rheum. Dis. 72, (2013). [DOI] [PMC free article] [PubMed] [Google Scholar]
- 68.van der Eerden BC TRPV4 deficiency causes sexual dimorphism in bone metabolism and osteoporotic fracture risk. Bone 57, (2013). [DOI] [PubMed] [Google Scholar]
- 69.Clark AL, Votta BJ, Kumar S, Liedtke W & Guilak F Chondroprotective role of the osmotically sensitive ion channel transient receptor potential vanilloid 4: Age- and sex-dependent progression of osteoarthritis in Trpv4-deficient mice. Arthritis Rheum. 62, 2973–2983 (2010). [DOI] [PMC free article] [PubMed] [Google Scholar]
- 70.McNulty AL, Leddy HA, Liedtke W & Guilak F TRPV4 as a Therapeutic Target for Joint Diseases. Naunyn. Schmiedebergs Arch. Pharmacol. 388, 437–450 (2015). [DOI] [PMC free article] [PubMed] [Google Scholar]
- 71.Jones RC et al. Piezo1 expression is increased in response to non-invasive impact of mouse knee joint. Osteoarthritis Cartilage 26, S113–S114 (2018). [Google Scholar]
- 72.Lee W et al. Synergy between Piezo1 and Piezo2 channels confers high-strain mechanosensitivity to articular cartilage. Proc. Natl. Acad. Sci. U. S. A. 111, E5114–E5122 (2014). [DOI] [PMC free article] [PubMed] [Google Scholar]
- 73.Pritchard S & Guilak F Effects of interleukin-1 on calcium signaling and the increase of filamentous actin in isolated and in situ articular chondrocytes. Arthritis Rheum. 54, 2164–2174 (2006). [DOI] [PubMed] [Google Scholar]
- 74.Beekman B, Verzijl N, de Roos JADM & TeKoppele JM Matrix degradation by chondrocytes cultured in alginate: IL-1β induces proteoglycan degradation and proMMP synthesis but does not result in collagen degradation. Osteoarthritis Cartilage 6, 330–340 (1998). [DOI] [PubMed] [Google Scholar]
- 75.Walczysko P, Wagner E & Albrechtová JTP Use of co-loaded Fluo-3 and Fura Red fluorescent indicators for studying the cytosolic Ca2+concentrations distribution in living plant tissue†. Cell Calcium 28, 23–32 (2000). [DOI] [PubMed] [Google Scholar]
- 76.Agarwal P et al. Dataset for The TRPV4-GSK3β pathway mediates mechanotransduction in normal but not osteoarthritic chondrocytes, figshare 10.6084/m9.figshare.13184909 (2020). [DOI] [Google Scholar]
Associated Data
This section collects any data citations, data availability statements, or supplementary materials included in this article.
Supplementary Materials
Data Availability Statement
The main data supporting the results in this study are available within the paper and its Supplementary Information. The raw and analysed datasets are available in figshare with the identifier https://doi.org/10.6084/m9.figshare.13184909 (ref.76).