Abstract
In the present work, a hydrogen‐free one‐step catalytic fractionation of woody biomass using commercial β‐zeolite as catalyst in a flow‐through reactor was carried out. Birch, spruce, and walnut shells were compared as lignocellulosic feedstocks. β‐Zeolite acted as a bifunctional catalyst, preventing lignin repolymerization due to its size‐selective properties and also cleaving β‐O‐4 lignin intralinkages while stabilizing reactive intermediates. A rate‐limiting step analysis using different reactor configurations revealed a mixed regime where the rates of both solvolytic delignification and zeolite‐catalyzed depolymerization and dehydration affected the net rate of aromatic monomer production. Oxalic acid co‐feeding was found to enhance monomer production at moderate concentrations by improving solvolysis, while it caused structural changes to the zeolite and led to lower monomer yields at higher concentrations. Zeolite stability was assessed through catalyst recycling and characterization. Main catalyst deactivation mechanisms were found to be coking and leaching, leading to widening of the pores and decrease of zeolite acidity, respectively.
Keywords: depolymerization, flow-through, lignin, lignocellulose, zeolites
Better with beta: This work addresses crucial aspects for the understanding and rational optimization of the β‐zeolite‐assisted lignin‐first fractionation: elucidation of the role β‐zeolite in the reaction network, rate‐limiting step analysis, effect of different biomass feedstocks, homogeneous acid co‐addition, and catalyst stability studies.

Introduction
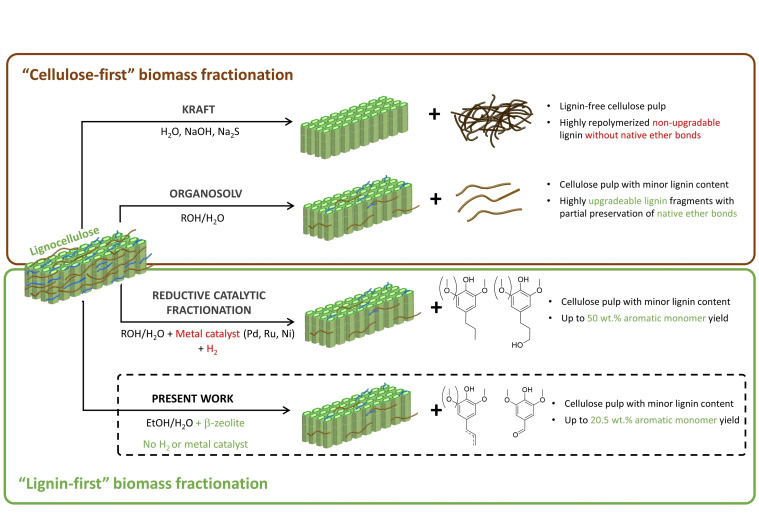
Increasing consumption of fossil resources is a major contributor to anthropogenic global warming, which endangers the existence of numerous lifeforms, including humans, in the long term.[ 1 , 2 ] Lignocellulosic biomass is a promising alternative to fossil feedstocks in order to sustain human needs in an environmentally friendly manner.[ 3 , 4 ] Despite the great valorization potential of lignocellulosic biomass (consisting of cellulose, hemicellulose, and lignin) towards platform molecules, [5] it is still predominantly used in pulp and paper industry through the Kraft pulping process, [6] where the lignin fraction is underutilized as low‐grade fuel. However, valorization of all three components is essential for biomass to become an economically viable alternative to fossil feedstocks. [7] Lignin is an organic biopolymer comprised of phenolic building blocks, which are the sole renewable source of monoaromatic compounds. As shown in Figure 1, different valorization approaches strongly affect the fate of the resulting lignin stream.
Figure 1.
Scheme of different lignocellulose fractionation methods
At aggressive pH and temperature conditions used in conventional lignin extractive processes (i. e., Kraft), native ether bonds in lignin are cleaved, leading to the irreversible formation of stable carbon‐carbon bonds. [8] Hence, these processes hinder the subsequent production of monoaromatic compounds and lead to a poorly soluble and highly recalcitrant lignin. Alternatively, organosolv processes employ aqueous mixtures of organic solvents at mild conditions, enabling the partial preservation of lignin's native chemical structure and thus its valorization potential into valuable aromatic monomers.[ 9 , 10 ] In the so‐called “lignin‐first” approaches, removal of lignin under organosolv conditions is coupled with an active stabilization step. Particularly, reductive catalytic fractionation (RCF) is a popular lignin‐first valorization strategy,[ 11 , 12 ] where metals such as Pd or Ru are employed as catalysts for the hydrogenation of allylic alcohols, which are highly reactive intermediates that are believed to play a key role during lignin recondensation.[ 13 , 14 , 15 ] RCF requires pressurized hydrogen or a hydrogen donor, such as a protic solvent (e. g., MeOH, EtOH) or hemicellulose‐derived compounds.[ 12 , 16 , 17 ] The main drawbacks of RCF are the costly high‐pressure requirements, [18] the environmental impact of using fossil‐based molecular hydrogen,[ 19 , 20 , 21 ] and the catalyst deactivation by poisoning, leaching, and sintering.[ 22 , 23 ] Additionally, when RCF is carried out in batch reactors, subsequent separation of lignocellulosic pulp from catalyst becomes a challenging task. This can be avoided by using multi‐bed flow‐through systems or a rotating basket,[ 14 , 17 , 24 ] which physically separate biomass from the catalyst.
Very recently, protonic zeolites such as β‐zeolite have been reported as suitable catalysts for lignin‐first fractionation of birch wood by Subbotina et al. [25] They have been tested in a batch reactor, rendering phenolic monomers and holocellulose‐based valuable products such as furfural and ethyl levulinate. Unlike in RCF, the stabilization of monomeric species in the β‐zeolite‐assisted process has been explained by the combined effect of the size‐selectivity and the Brønsted acidity of the microporous catalyst. In particular, Subbotina et al. argue that the stabilizing role of the zeolites lies in the fact that the acid‐catalyzed dehydration of allylic alcohols, which are reactive intermediates commonly known to play a key role during lignin repolymerization, takes place in the relatively small pores of the zeolite, free of higher‐molecular‐weight oligomers. Thus, the combined effect of the pore structure and the Brønsted acidity of β‐zeolites appears to prevent the recondensation of unstable reactive intermediates, and in this way enables the hydrogen‐ and additive‐free lignin conversion into aromatic monomers. This makes the β‐zeolite‐assisted lignin‐first process a potential candidate for scale‐up. However, beyond the very recent pioneering work by Subbotina et al. in batch reactors, this novel β‐zeolite‐assisted lignin‐first process has not been further investigated. Fundamental questions concerning the role of β‐zeolite in the context of this complex reaction network (e. g., during depolymerization and/or stabilization reactions) remain unclear. In addition, other critical issues such as catalyst stability, the suitability of this process for continuous operation, and its applicability to other attractive lignocellulosic feedstocks are yet to be explored.
In the present work, we leverage the unique characteristics of flow‐through reactors in biomass fractionation to investigate this novel β‐zeolite‐assisted lignin‐first process.[ 22 , 26 ] This technique allows decoupling of solvolytic and catalytic steps, enabling the study of process parameters affecting individual rate steps. Through variations of the reactor configuration (e. g., packing strategy) and process conditions, we carry out a rate‐limiting step analysis, which is crucial for process intensification purposes. Analysis of the resulting lignin with 2D heteronuclear single quantum coherence (HSQC) NMR spectroscopy is used to study the role of β‐zeolite on β‐O‐4 bond cleavage, and correlate with the monomer yields. Subsequently, the co‐addition of oxalic acid as a homogeneous acid was investigated. Due to the physical separation between biomass and catalyst in this reactor configuration, it is also possible to recover the spent zeolite and study its stability under process conditions. Thorough characterization of the (spent) β‐zeolite as well as a series of catalyst recycling experiments, this work provides insights into the deactivation mechanisms. Finally, the versatility of β‐zeolite was evaluated by comparing the performance of birch hardwood with other relevant lignocellulosic feedstocks such as spruce as a softwood and walnut shells as an agricultural residue.
Results and Discussion
Effect of zeolite addition
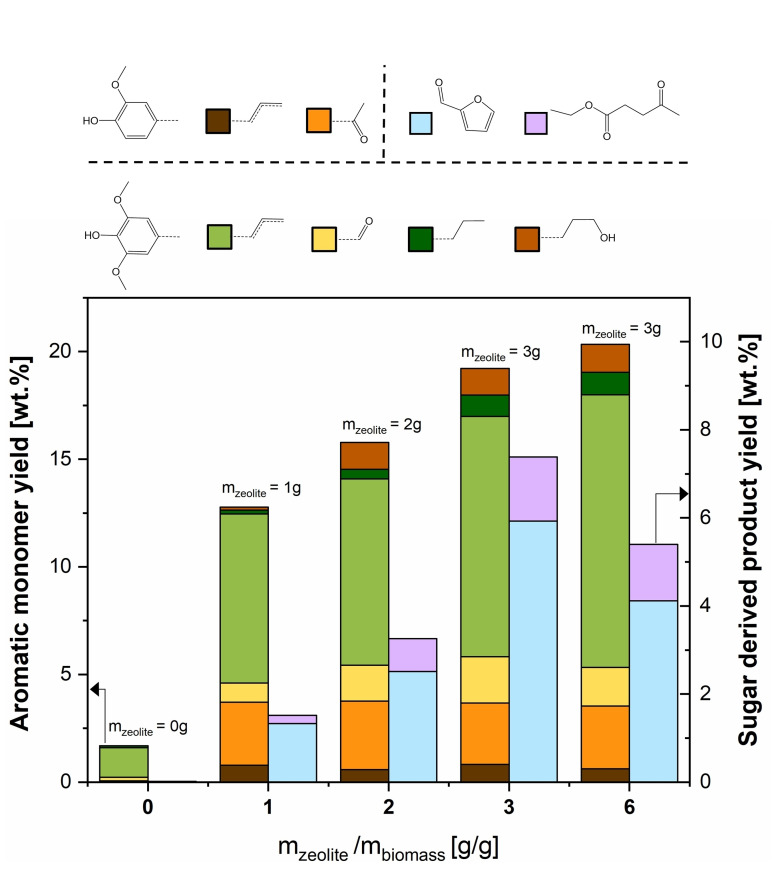
To investigate the potential of β‐zeolite as a stabilizing agent to produce lignin‐based phenolic monomers in flow, experiments were carried out varying weight ratios of biomass and zeolite loadings combined in sequential reactors. In order to ensure a constant bed voidage, silicon carbide was mixed in corresponding amounts with the zeolite and added to the second reactor. As shown in Figure 2, adding a zeolite loading of 1–3 g to 1 g biomass (i. e., zeolite/biomass mass ratio of 1–3) leads to an increase in monomer yields between 12.9 and 19.4 wt%, which are significantly higher than the 1.7 wt% yield for the experiment without zeolite. Furthermore, an experiment with a higher biomass/zeolite mass ratio was performed by decreasing the biomass loading in the first reactor to 0.5 g. The corresponding biomass/zeolite mass ratio of 6 did not lead to a significantly higher monomer yield, indicating that monomer production is not limited by catalytic stabilization at these conditions.
Figure 2.
Effect of zeolite loading on the aromatic monomer yield. Experiments carried out at standard conditions: Birch wood, T=220 °C, F L=0.5 mL min−1, no oxalic acid addition, total duration of 3 h in segregated reactor configuration.
The obtained monomeric aromatic products are assigned as 62–67 wt% unsaturated aromatics, namely eugenol, isoeugenol, and 2,6‐dimethoxy‐4‐propylphenol in accordance with previous reports, [25] while only traces of the corresponding saturated monomers were observed. Moreover, 23–30 wt% of carbonyl‐containing monomers were detected based on syringaldehyde and 4‐hydroxy‐3‐methoxyacetophenone. Noteworthy, as shown in Figure 2, the product distribution of phenolic monomers was not affected by varying the biomass/catalyst ratio. In addition, β‐zeolite also facilitated the production of holocellulose‐based products, particularly furfural and ethyl levulinate. An increase in biomass/catalyst mass ratio from 1 to 3 leads to an increase in total sugar‐derived products yield from 1.6 to 7.1 g sugar‐derived products per g initial holocellulose. This outcome is in line with previous studies, where β‐zeolite was used to produce furfural and ethyl levulinate from monosaccharides. [27]
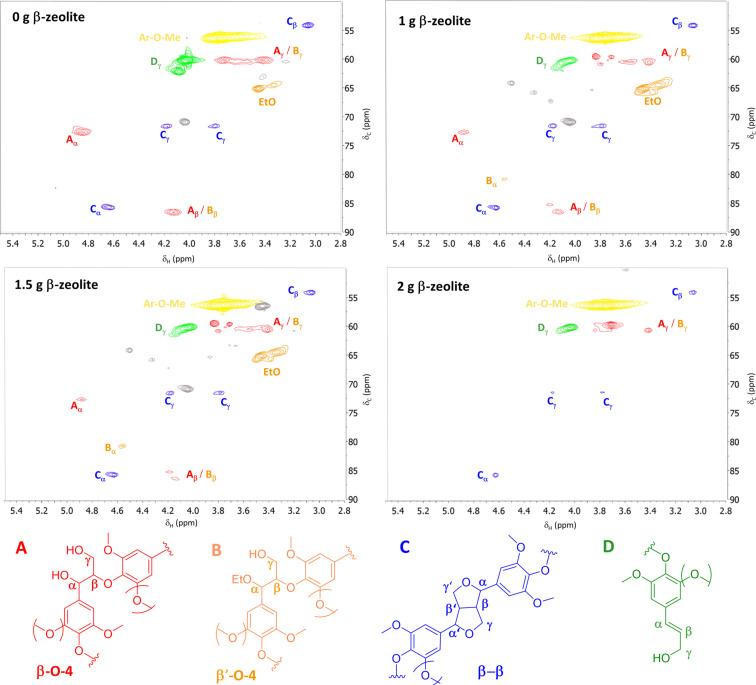
Lignin samples obtained with different zeolite loadings were analyzed by 2D HSQC NMR spectroscopy, and the corresponding spectra are shown in Figure 3. Characteristic α‐alkoxy fragments were observed, indicating that α‐ethoxylation of the β‐O‐4 linkage takes place during delignification with ethanol, as suggested earlier. [30] This leads to an increase in lignin solubility and enables efficient delignification. The spectra also reveal the presence of allylic alcohol‐containing moieties, which have been identified as possible unstable reactive intermediates, at least partially responsible for undesirable lignin repolymerization.[ 14 , 15 , 25 ] Characteristic β‐O‐4 signals were observed to decrease with increasing zeolite loading, indicating that acid sites in β‐zeolite are involved in the cleavage of these ether bonds.
Figure 3.
2D HSQC NMR spectra of lignin samples from experiments at different zeolite loadings.
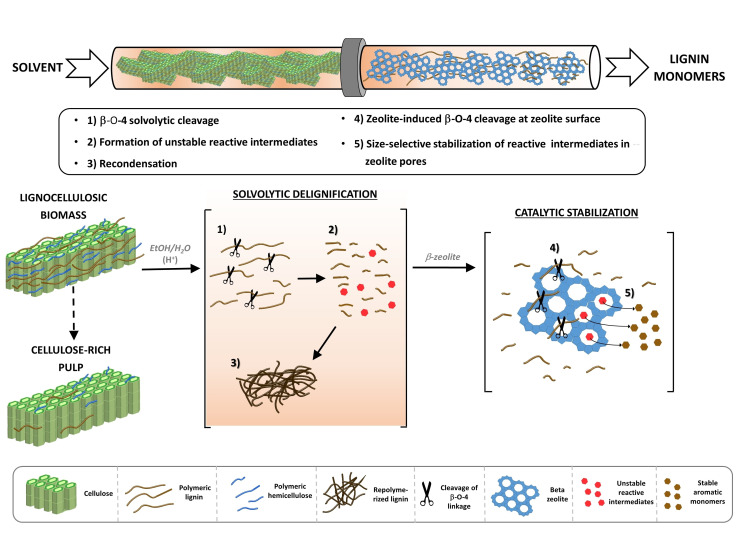
Based on the observed trends, it is reasonable to question whether the increased in monomeric yield in the β‐zeolite‐assisted process is merely a result of the Brønsted acid‐catalyzed β‐O‐4 cleavage. Thus, we compared the performance of 2 g β‐zeolite with that of an equivalent concentration of homogeneous oxalic acid (see the Supporting Information, Section 15). The conversion of birch wood with 0.1 m oxalic leads to a monomer yield of 4 wt%, which is significantly lower than the yields achieved using β‐zeolite. This low monomer yield in the case of the homogeneously catalyzed conversion is attributed to acid‐catalyzed lignin repolymerization reactions,[ 31 , 32 ] thereby confirming the synergistic role of the zeolite acidity and its pore structure in preserving high monomeric yields. Consequently, we conclude that there are at least two distinct functions carried out by the zeolite: contribution to depolymerization reactions through ether cleavage, and size‐selective properties that hinder bimolecular recondensation of reactive intermediates through dehydration reaction, as shown in a prior study. [25] Given the fact that β‐zeolite pores are too small to accommodate lignin fragments larger than dimers (see Figure S20), the depolymerization reaction likely occurs at the outer surface of the zeolite and not inside its pores. According to these findings, a proposed reaction scheme for the lignin transformation from lignocellulose to aromatic monomers is shown in Figure 4. As ethanol conversion to ethylene is known to take place in the presence of zeolite,[ 28 , 29 ] and solvent reusability is highly desirable in lignin‐first biomass fractionation, gas samples were taken during reaction and analyzed by GC. Ethylene was found in trace amounts, corresponding to ethanol conversions well below 0.1 wt% (see the Supporting Information, Section 21). No additional ethanol‐derived products were observed.
Figure 4.
Reaction scheme for flow‐through β‐zeolite‐assisted lignocellulose fractionation.
Rate‐limiting step analysis
The transformation of in‐planta lignin into aromatic monomers using β‐zeolite may be governed not only by chemical transformations but also by physical phenomena such as internal/external mass transfer of the reactive species in and around the solid biomass and/or the solid catalyst. Mass transfer limitations can affect the overall monomer generation rate and, in general, should be avoided for optimal system operation. [33] Specifically for lignocellulosic biomass and microporous zeolites, the system is prone to internal mass transfer limitations due to the interaction of large lignin macromolecules with microporous solids. [34] In order to ensure absence of internal and external mass transfer limitations during delignification, we have studied the effect of biomass particle size in the delignification rate of birch wood (see the Supporting Information, Section 16) and concluded that there are no diffusional limitations for particles below 150 μm and a solvent flow rate of at least 0.5 mL min−1. To rule out mass transfer limitations for the zeolite‐catalyzed reactions, the effect of β‐zeolite particle size was evaluated by comparing the performance of 40–80 μm particles (i. e., reference case) with that of 80–150 μm particles. Using larger β‐zeolite particles did not cause any significant change in phenolic monomer yield (see Figure S19), demonstrating the absence of diffusional effects around and inside the catalyst particles. After discarding mass transfer effects, we examined the contribution of the individual conversion steps on the net monomer production rate. As sketched in Figure 4, when exposed to flow‐through of ethanol/water at 220 °C, the solid biomass first undergoes solvolytic delignification (i. e., the release and dissolution of lignin fragments from the solid biomass into the liquid stream). Important parameters that influence the rate of this step are solvent composition and temperature (which are kept constant in this part of study). Thus, as the biomass/solvent feed flow ratio is kept constant, the resulting (time‐dependent) concentration of solubilized lignin remains comparable throughout the set of experiments presented in this study. Accordingly, the extent of biomass delignification is determined by the total duration of the process (i. e., residence time of the solid, t solid), which is set to 3 h in the present study.
Once dissolved in the liquid stream, lignin will undergo β‐O‐4 solvolytic cleavage, giving rise to the formation of unstable intermediates and consecutive recondensation in the liquid phase (see Figure S21). Subsequent to the β‐O‐4 solvolytic cleavage and in parallel to the homogeneous recondensation reactions, β‐zeolite catalysis includes the β‐O‐4 cleavage of lignin oligomers and catalytic stabilization of the unstable lignin monomers. Accordingly, we may define τ homo and τ hetero as the residence times that determine the progress of the homogeneous and heterogeneous reaction pathways, respectively. For a given flow rate, τ homo and τ hetero should be proportional to the volume in between particles and the catalyst volume, respectively. Taking advantage of to the degrees of freedom of a flow‐through reactor, we evaluate the performance of different reactor configurations (Figure 5) where τ homo and τ hetero are varied independently with the help of a solid diluent (i. e., SiC). Of particular interest is the possibility to decouple the residence time prior to catalytic stabilization from that during catalytic stabilization (e. g., by adjusting the void fraction before the catalytic bed) in order to investigate the significance of the individual steps on the overall process.
Figure 5.
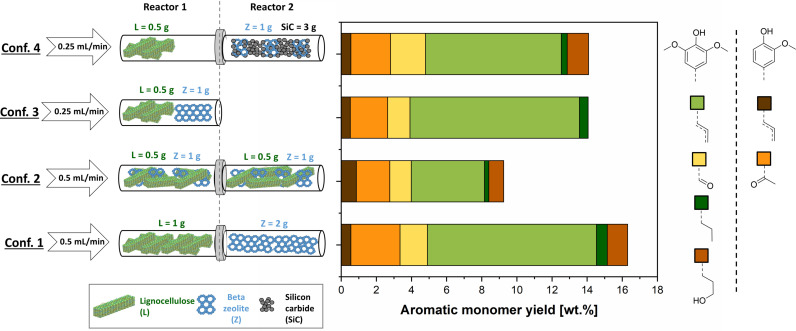
Effect of different reactor configurations in the aromatic monomer yield. Experiments carried out at the following conditions: Birch wood, T=220 °C, P=50 bar with a total duration of 3 h. No oxalic acid addition. Masses of lignocellulose, zeolite, and silicon carbide are described for each reactor and configuration according to the legend on the left.
To study the influence of solvolytic recondensation on the phenolic monomer yield, we first consider a case when the biomass and zeolite are segregated in two reactors (i. e., configuration 1), where τ homo before the catalytic stabilization (τ homo1) is approximately the same as that during catalytic stabilization (τ homo2). This configuration was compared with the case when both reactor zones were filled with a physical mixture of the same amount of biomass and zeolite (i. e., configuration 2, with negligible τ homo1). Although the total residence time for homogeneous and heterogeneous reactions is comparable in these two configurations, the latter introduces early‐stage contact between the unstable intermediates and the zeolite bed, thus ensuring their rapid stabilization. On the other hand, by spreading the biomass along the entire reactor, the solubilized lignin that is released from the solid biomass near the reactor exit spends relatively less amount of time in the reactor. As shown in Figure 5, the physical mixture (i. e., configuration 2) leads to a yield of 9.4 %, significantly inferior to the 16.5 % of the segregated case (i. e., configuration 1), indicating that monomer yield is not limited by solvolytic repolymerization, but rather by the relatively slow formation of reactive intermediates. In other words, prompt stabilization is not required. To verify this, we further increased the average liquid residence time in the first reactor (τ homo1) in configuration 4. Here, we halved the biomass loading and solvent flow rate proportionally in order to free some space between the biomass and catalyst beds. To rule out additional effects derived from this decrease in biomass and flow rate, a control experiment was carried out using a single reactor with the same biomass and zeolite loading as seen in configuration 3. Configurations 3 and 4 showed no significant differences in monomer yield, supporting that the observed monomer generation rate is not affected by solvolytic repolymerization.
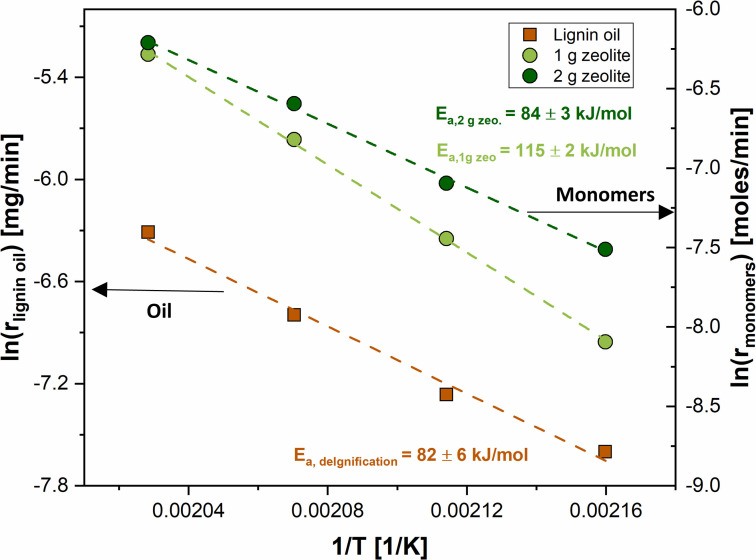
So far, we proved that monomer production rate is neither affected by solvolytic repolymerization nor by mass transfer at these reaction conditions. Thus, we now explore the effects of solvolytic delignification and catalytic stabilization (i. e., here understood as the sequence of zeolite catalyzed reactions that include β‐O‐4 cleavage of solubilized lignin fragments and subsequent formation of monomers under stabilizing conditions in the zeolite pores) on the overall rate on monomer production by studying the effects of zeolite loading at different temperatures. To that end, the kinetic parameters of these reactions are studied by leveraging the time‐resolved data provided by the flow‐through system and following a similar methodology as described in prior kinetic studies of lignin‐first RCF in flow‐through reactors. [24] Delignification and catalytic monomer production are conceptualized as reactions in series. As shown in Figures S24 and S25, cumulative monomer yields show a linear trend during the first 30–40 min of reaction, indicating a constant reaction rate during this period. This suggests a zero‐order‐like behavior where the reaction rate is not depending on the concentration of reactant, and hence the rate is directly proportional to the kinetic constant during the initial stages of the reaction. Consequently, an Arrhenius plot can be obtained using the initial reaction rates measured at different temperatures, and the activation energy for monomer production can be directly calculated from its slope. Similarly, delignification rate was determined by quantifying the dissolved lignin during the initial 30 min period through liquid‐liquid extraction and gravimetry of the resulting oil obtained for temperatures ranging from 190 to 220 °C. As shown in Figure 6, the apparent activation energy for the delignification rate is 82±6 kJ mol−1, on par with literature data for delignification of hardwood under organosolv conditions. [24] As displayed in Figure 6, using a zeolite loading of 2 g in a segregated bed configuration leads to an apparent activation energy of 84±3 kJ mol−1 for the monomer production rate, very similar to that of delignification. The similarity between these two values would suggest that the overall rate of monomer production is indeed determined by the rate of lignin release, in line with previous literature that describes the delignification as a rather slow process, usually accelerated by the presence of acids.[ 31 , 35 ] Nevertheless, it is remarkable that the apparent activation energy of for the monomer production increases up to 115±2 kJ mol−1 when lowering the zeolite loading to 1 g, while that of the delignification reaction remains the same as it is independent of the catalyst loading. The fact that activation energy based on monomers is a function of zeolite loading suggests that the overall rate of monomer generation is to some extent affected by the solid‐catalyzed reactions (particularly when using limited zeolite loadings), as well as solvolytic delignification, particularly when using sufficiently large zeolite loadings. This is in line with our earlier findings in Figure 2, which showed that zeolite addition leads to a substantial increase in monomer yield within a certain range and becomes ineffective at high zeolite loading. In this sense, the system operates in a mixed kinetic regime where both solvolytic delignification and catalytic stabilization play a role. Thus, process intensification strategies should target the acceleration of these two steps. In addition, these results also reveal that the true activation energy of the stabilization reactions should be greater or equal than that of the delignification reactions (≥115 kJ mol−1), suggesting that even higher reaction temperatures will be beneficial for the process.
Figure 6.
Arrhenius plot for delignification and monomer production reactions. Experiments carried out in a temperature range of 190–220 °C. Birch wood, F L=0.5 mL min−1, P=50 bar, 1 g biomass, 1–2 g β‐zeolite in segregated reactor configuration. No oxalic acid addition.
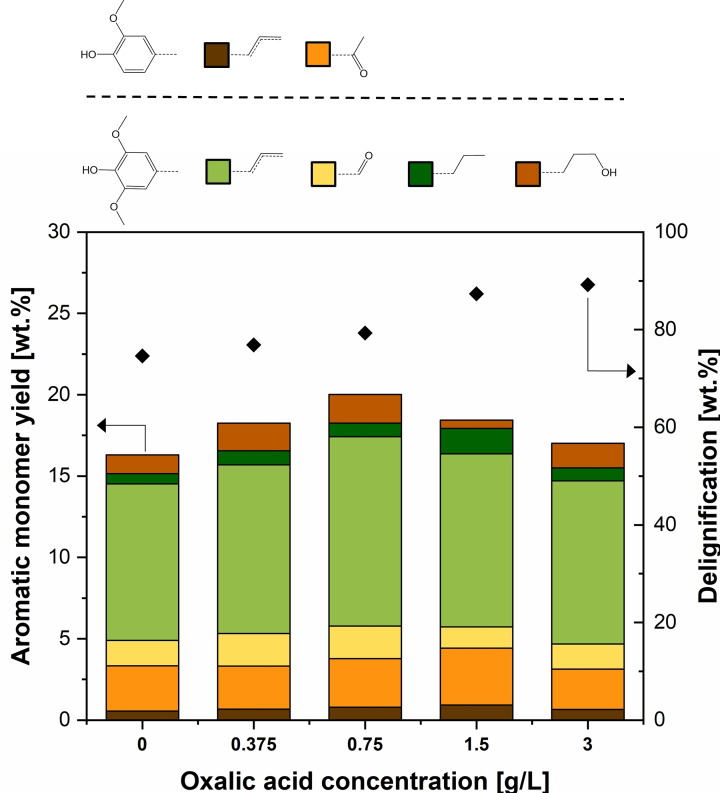
The systematic rate‐limiting step analysis suggests that it is necessary to increase both solvolytic and catalytic reaction rates to enhance the phenolic monomer yield. Homogeneous acid addition is known to increase β‐O‐4 bond cleavage through hydrolysis, leading to a higher delignification rate.[ 26 , 34 ] Nevertheless, acid‐catalyzed lignin depolymerization may also lead to more severe lignin recondensation. [18] Thus, we evaluate the co‐addition of a homogeneous acid on the monomer yield. It is well‐known that most homogeneous acids lead to compositional and textural modifications of aluminosilicates at high concentrations.[ 35 , 36 ] Oxalic acid was selected as the homogeneous acid, as it is completely biodegradable and a more sustainable alternative to the usually strong mineral acids used in lignocellulose fractionation.[ 39 , 40 , 41 ] The effect of oxalic acid addition in different concentrations on the delignification and aromatic monomer yield is shown in Figure 7.
Figure 7.
Effect of acid addition on delignification and aromatic monomer yield. Birch wood: T=220 °C, F L=0.5 mL min−1, Birch wood with a total duration of 3 h, 1 g biomass, 2 g β‐zeolite in segregated reactor configuration. Oxalic acid addition in concentrations ranging from 0 to 3 g L−1.
Oxalic acid addition leads to a minor decrease in cellulose and hemicellulose retention for concentrations below 3 g L−1 (see Figure S29). A gradual increase in monomer yield and delignification is observed for an incremental addition of oxalic acid in a concentration between 0 and 0.75 g L−1. However, even higher acid concentrations up to 3 g L−1 render lower monomer yield, despite the monotonic increase in delignification. These results could be explained by the expected increase in the rate of recondensation reactions, leading to higher lignin molar weight products. Nevertheless, gel permeation chromatography (GPC) data showed no clear indications of molar weight increase with increasing acid concentration (see Figure S17). Hence the decrease in monomer yield does not seem to be attributed to acid‐catalyzed lignin repolymerization. Another reasonable hypothesis is that increasing concentrations of oxalic acid modify the microporous and textural properties of the β‐zeolite, which is a known phenomenon for various aluminosilicates.[ 42 , 43 , 44 ] To assess this hypothesis, N2 physisorption studies were carried out on spent zeolites with and without acid addition. As shown later on in Figure 9, acid addition leads to a lower zeolite surface area, but also to a smaller pore and micropore volumes, probably having a detrimental effect on the size‐selective properties of the zeolite and its ability to inhibit lignin repolymerization. Hence, the combination of oxalic acid with β‐zeolite seems to be an attractive strategy that can be further optimized to achieve higher monomer yields, but the prolonged use of zeolite under these conditions may lead to undesirable changes in its microporous structure.
Figure 9.
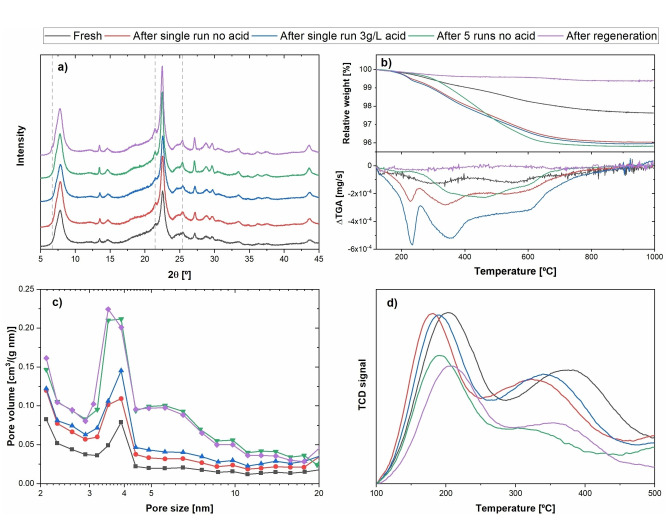
Solid characterization results for different characteristic zeolite samples. (a) XRD; (b) TGA and ΔTGA; (c) pore size distribution calculated from N2 physisorption data; (d) NH3 TPD.
Stability and regeneration of β‐zeolite
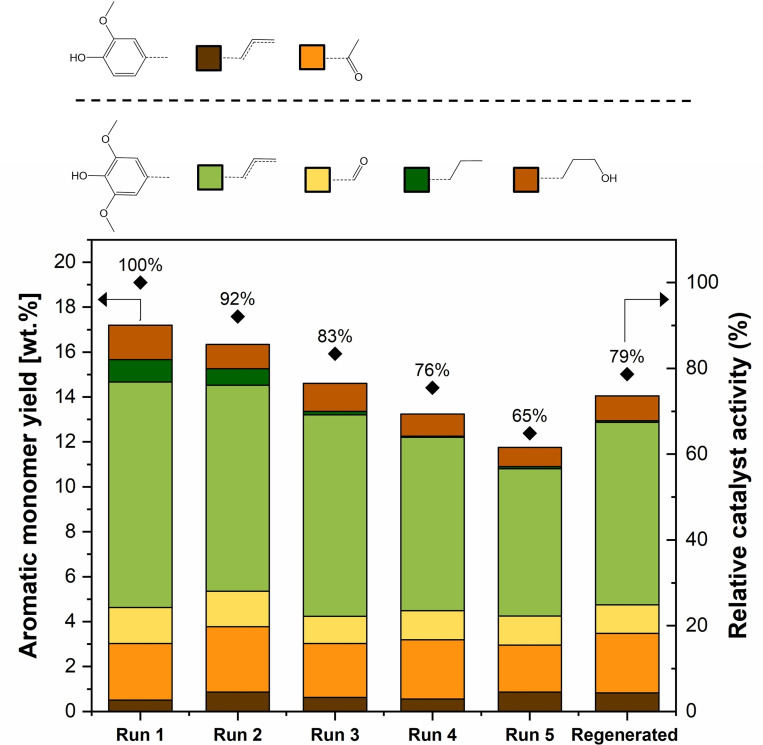
In order to evaluate the stability of β‐zeolite as a catalyst in the treatment of lignocellulosic biomass, recycle experiments were carried out according to reactor configuration 1 in Figure 5; by successively replacing biomass in the first reactor while keeping the second reactor's content unchanged. Recycle experiments were conducted with 2 g β‐zeolite loading, since it is below the full conversion limit as seen in Figure 2. After the last recycle experiment, the content of the second reactor was emptied and collected for analysis and regeneration following the same calcination procedure used to activate fresh β‐zeolite. The effect of catalyst recycle and regeneration on aromatic monomer yield is displayed in Figure 8.
Figure 8.
Effect of catalyst recycle and regeneration in the aromatic monomer yield. Birch wood: T=220 °C, FL=0.5 mL min−1 with a total duration of 3 h, 1 g biomass, 2 g β‐zeolite in segregated reactor configuration. No oxalic acid addition. Relative catalyst activity calculated as the monomer yield of each experiment divided by the monomer yield obtained after the first run.
After a total of five recycle experiments, a relative drop of 35 % was detected in phenolic monomer yield, while no significant change was observed in product distribution. The progressive decrease in catalytic activity for successive recycle runs is an indication of catalyst deactivation. It was observed that spent zeolites were significantly darker than the fresh ones (see Figure S9), suggesting coke deposition. After thermal regeneration, zeolites regained their original white appearance, but catalytic activity was only partially recovered. To understand the possible root causes of the observed deactivation, spent zeolites were analyzed by using thermogravimetric analysis (TGA), N2 physisorption, NH3 temperature‐programmed desorption (TPD), and X‐ray diffraction (XRD). The results provided by these techniques are shown in Figure 9.
XRD patterns showed no significant differences for the main characteristic peaks of β‐zeolite, [45] with the exception of the regions at 6.7, 21.5, and 25.6°, which show minor peak development, especially for the five‐times used and regenerated catalysts. These results indicate that the crystalline structure of β‐zeolite is mostly unchanged after a single run, but after repeated recycling and regeneration, minor structural changes take place.
TGA was carried out at a temperature program that ensured sample dewatering in order to provide a quantitative comparison free of moisture effects (see Section 10.2 in the Supporting Information). The spent catalyst after one run exhibits a significantly higher mass loss than the fresh zeolite, further supporting that catalyst coking takes place. Similar trends in mass loss for the one‐time and five‐times used zeolites indicate that the amount of coking is not proportional to the total time on stream of the catalyst. However, the mass loss derivative (ΔTGA) is significantly lower for the five‐times recycled catalyst when compared with fresh zeolite. These results suggest that coke deposits become more recalcitrant with increasing time on stream, potentially requiring higher temperatures for full thermal decoking.
Nitrogen physisorption data allowed to calculate surface area and pore volume for the solid samples, as shown in Table 1. One‐time and five‐times used zeolites, respectively, displayed a significantly lower surface area and pore volume compared with fresh β‐zeolite. This is likely due to pore blocking caused by biomass‐derived coke deposits, in agreement with TGA data. As a consequence of pore size broadening and despite the occurrence of coking, β‐zeolite shows a slight increase in surface area and pore volume upon time on stream. Given the relevance of the β‐zeolite pore structure to the chemical transformation of lignin, pore size distribution data was obtained for the solid samples. Fresh zeolite shows pore sizes narrowly distributed around 4 nm. Spent zeolites after one and five runs, respectively, show gradual pore size broadening as seen in Figure 9. Thermal regeneration leads to a full recovery of the original surface area and a higher pore volume than fresh β‐zeolite. However, used zeolites show a smaller fraction of the pore volume being comprised by micropores. The observed trend suggests that catalytic activity loss could be caused by zeolite leaching. NH3‐TPD results shown in Figure 9 display a lower‐temperature peak at 200 °C corresponding to weaker Lewis sites and a broader peak at higher temperatures (350–600 °C) for stronger Brønsted acid sites, in agreement with prior literature studies with β‐zeolite.[ 44 , 45 ] The desorption temperature (as indicative of the acid strength) and the corresponding amounts of these acid sites are summarized in Table 1 for all catalyst samples. Used zeolites show a decrease in acidic strength and amount for both Lewis and Brønsted acid sites. The five‐times used zeolite does not show further change in Lewis sites; however, a significant drop in Brønsted acidic strength and concentration was observed. Thermal regeneration restores acidic strength for both acid site types but has no effect on their concentration.
Table 1.
Surface area and pore volume for all solid samples as determined by nitrogen physisorption. Peak temperatures and concentrations for Lewis and Brønsted acid sites obtained from NH3‐TPD data.
|
Entry |
Surface area [m2 g−1] |
Pore volume [cm3 g−1] |
Micropore volume[c] [cm3 g−1] |
T Lewis [°C] |
T Brønsted [°C] |
Lewis conc. [mmol g−1] |
Brønsted conc. [mmol g−1] |
|---|---|---|---|---|---|---|---|
|
fresh |
437 |
0.263 |
0.151 |
205 |
371 |
0.075 |
0.145 |
|
1 time used[a] |
358 |
0.231 |
0.112 |
182 |
325 |
0.046 |
0.125 |
|
1 time used[b] |
302 |
0.211 |
0.093 |
189 |
340 |
0.057 |
0.124 |
|
5 times used[a] |
379 |
0.256 |
0.120 |
191 |
302 |
0.046 |
0.073 |
|
regenerated |
434 |
0.286 |
0.136 |
202 |
350 |
0.047 |
0.064 |
[a] No oxalic acid used in the reaction. [b] 3 g L−1 of oxalic acid used in the reaction. [c] Obtained with t‐plot method.
In order to assess if zeolite dealumination takes place during the reaction, fresh and spent zeolite samples were digested in concentrated HNO3 and compositionally analyzed for aluminum content by inductively coupled plasma atomic emission spectroscopy (ICP‐AES) (see the Supporting Information, Section 20). As shown in Figure S26, the aluminum content of spent zeolites is lower in comparison with fresh zeolite. This confirms that the observed decrease in zeolite acidity is at least partially caused by dealumination. Based on the results obtained with the different characterization techniques employed, we conclude that the main deactivation mechanisms are: (1) coking through carbon deposition, and (2) leaching, which leads to a decrease in the concentration of acidic active sites by dealumination and pore size broadening, being detrimental for the size‐selective properties of β‐zeolite in the prevention of recondensation reactions. While the effects of coking can be reversed through thermal treatment, the leaching and observed acidity loss is likely the root cause for the irreversible loss of catalytic activity. Overall, the results of this stability study are meant to highlight attention areas for future development of promising tailor‐made microporous aluminosilicates for lignin‐first biorefining.
Effect of different lignocellulosic feedstocks
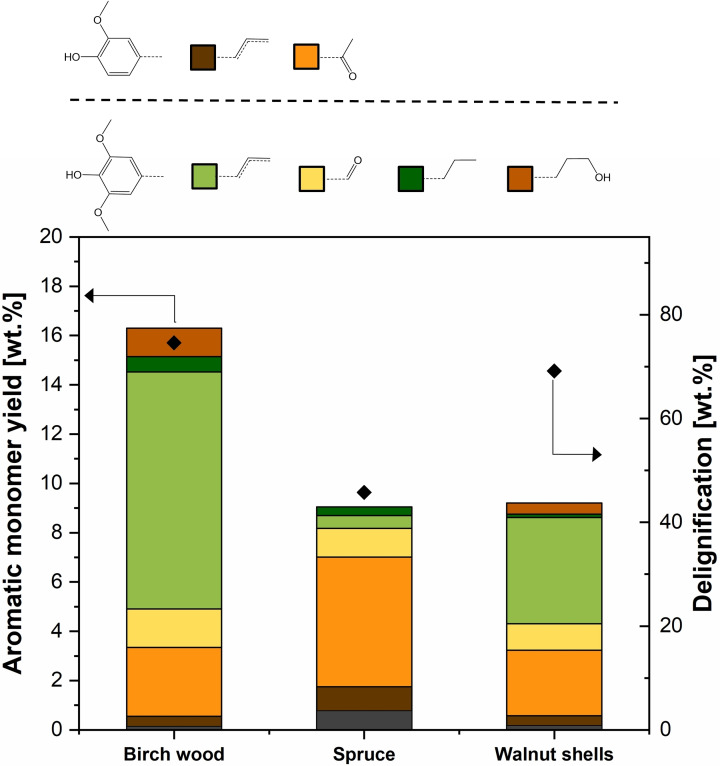
As the types of biomass feedstocks vary across the world, it is valuable for future biorefineries to be flexibly operable with a diverse range of lignocellulosic feedstocks from an economic (e. g., logistics) as well as environmental (e. g., biodiversity) perspective. Accordingly, the system was studied using different feedstocks that represent the diversity of lignocellulosic biomass types: birch as a hardwood, spruce as a softwood, and walnut shells as an agricultural residue.
The phenolic monomer yield and the extent of delignification for different feedstocks are provided in Figure 10. Compared to the 16.5 wt% phenolic monomer yield obtained with birch wood, relatively lower yields were obtained from spruce and walnut shells (i. e., 9.8 and 9.4 wt% of the initial lignin, respectively). Nonetheless, considering the higher native lignin content of spruce and walnut shells, the total aromatic monomer production per gram of initial biomass is comparable for all three feedstocks. 2D HSQC NMR analysis of the lignin obtained from spruce wood and walnut shells shows showed very weak β‐O‐4 characteristic signals (see Figure S14), indicating extensive ether bond cleavage. All three feedstocks enabled the generation of holocellulose‐based furfural and ethyl levulinate in varying yields (see Table S1).
Figure 10.
Effect of using different lignocellulosic feedstocks in the aromatic monomer yield. Birch wood, spruce wood, and walnut shells as feedstocks, respectively, T=20 °C, FL=0.5 mL min−1, total duration of 3 h, 1 g biomass, 2 g β‐zeolite in segregated reactor configuration. No oxalic acid addition.
The considerably lower delignification extent of spruce signifies that there are possibilities for further increasing monomer yield by using more severe solvolytic conditions such as a higher temperature or acidity. Significant differences in monomeric product distribution were observed for each feedstock. For birch, spruce, and walnut shells, respectively, 72, 19, and 60 mol% of the phenolic products were detected to be single‐methoxy aromatics (S units). These differences are in agreement with the ratio of S/G units present in the native structure of these feedstocks.[ 48 , 49 ] Hence, the monomeric product distribution obtained with the different feedstocks is mainly influenced by the in‐planta lignin composition and structure.
Overall, all selected feedstocks were successfully valorized using β‐zeolite as a stabilizing agent. The comparable yields in terms of lignin‐based phenolic monomers as well as holocellulose‐based products demonstrate the robustness of β‐zeolite in lignocellulose processing. In light of these findings, there is great potential for improving operation conditions as well as designing tailor‐made zeolite catalysts to optimize this approach towards an economically and environmentally benign process for lignocellulose valorization.
Conclusions
In this study, a one‐step β‐zeolite‐assisted fractionation of lignocellulosic biomass in a flow‐through reactor is reported, using birch as main feedstock and 9 : 1 v/v ethanol/water as solvent at 220 °C. We conclude that β‐zeolite is active in ether bond cleavage as well as in the acid‐catalyzed stabilization of reactive intermediates, and that both the zeolite pore structure and its acidity are key parameters to the success of the lignin‐first fractionation strategy.
In an effort to optimize the chemically and physically complex process, a systematic approach was followed to identify the limiting steps. Reactor configurations with increasing liquid residence time before zeolite‐based stabilization did not lead to a decrease in monomer yield, leading to the conclusion that solvolytic lignin recondensation is not the rate‐limiting step in aromatic monomer production. By comparing the rates of production of lignin oil and monoaromatics at different temperatures and zeolite loadings, we concluded that both solvolytic delignification and zeolite‐catalyzed reactions are rate‐determining steps in the overall production of lignin monomers. Accordingly, promotion of zeolite‐assisted stabilization through increase in zeolite/biomass mass ratio from 1 to 6 has a beneficial effect on increasing from 12.9 to 20.5 wt%. To further accelerate solvolytic delignification, the co‐addition of oxalic acid was studied. A volcano curve for different acid concentrations and optimum in 0.75 g L−1 of acid was obtained. Nevertheless, the addition of acid also led to unwanted modifications in the pore structure of β‐zeolite.
Catalyst recycling experiments showed a relative drop of 35 % in monomer yield over five experimental runs. The catalyst deactivation is attributed to the combined effects of coking and structural modifications of zeolite, such as increase in pore size and loss of acidity through leaching, leading to zeolite dealumination. Finally, in order to demonstrate the versatility of β‐zeolite in lignin‐first biorefining, spruce wood, and walnut shells were considered as alternative feedstocks, leading to comparable monomer yields but providing different product distributions as a result of varying native lignin structure.
Experimental Section
Lignocellulosic biomass was drilled, ball milled and sieved to a particle size of 50–150 μm in order to avoid mass transfer limitations during delignification. [33] Milled biomass was pre‐extracted and dried. Lignin content of lignocellulosic solids before and after reaction was determined according to NREL procedure. [50] All yields are reported in dry and pre‐extracted biomass weight basis.
Experiments were carried out in a modular Swagelok ’’ Hastelloy tubular reactor, consisting of two individual tubes of 10 cm in length connected to each other by a threaded element. In order to prevent inefficient solid–liquid contact, the reactor was placed vertically and packed with 2 mm glass beads and quartz wool. In standard sequential configuration, the first reactor contained biomass particles and the second one contained the β‐zeolite. To enable operation in flow, zeolites were pelletized, milled, and sieved to a particle size of 40–150 μm. Metal gaskets with 5 and 60 μm pore size, respectively, were used on the sides of the reactors to ensure no loss of solid. Zeolites were calcined at a temperature of 550 °C for 5 h. Experiments in a temperature range of 190–220 °C were carried out at a pressure of 50 bar in order to ensure liquid‐phase operation (Figure S6). A 9 : 1 v/v ethanol/water solvent mixture was used for all experiments. Solvent composition was selected based on prior studies. [25]
Liquid samples were collected every 10 min during the first hour of reaction and every 20 min during the next 2 h. Monomeric compounds in the untreated sample mixture were identified through GC‐MS. Monomer yield was quantified through GC‐FID (flame ionization detector) with isopropyl phenol as standard and using the effective carbon number (ECN) methodology. [51] For further lignin analysis, solvent removal was performed at 75 mbar and 40 °C, followed by a liquid‐liquid extraction with ethyl acetate/water (3×10 mL) and subsequent solvent evaporation under vacuum, leading to lignin oil. The resulting lignin oil was dissolved in DMSO‐d6 to a concentration of 70 mg oil mL−1 for subsequent 2D HSQC NMR analysis. Similarly, GPC analysis was carried out by dissolving lignin oil to a concentration of 5 mg mL−1 in THF.
Spent zeolite was collected after reaction and dried overnight at 105 °C. NH3‐TPD was used to characterize zeolite acid sites. TGA was used to analyze the occurrence of coking. XRD was employed to study the crystallographic structure of the zeolite. Nitrogen physisorption at 77 K was employed to study the microstructure of zeolite samples.
Further details on the experimental procedures and materials can be found in the electronic Supporting Information.
Conflict of interest
The authors declare no conflict of interest.
Supporting information
As a service to our authors and readers, this journal provides supporting information supplied by the authors. Such materials are peer reviewed and may be re‐organized for online delivery, but are not copy‐edited or typeset. Technical support issues arising from supporting information (other than missing files) should be addressed to the authors.
Supporting Information
Acknowledgements
The authors would like to acknowledge Peter Deuss for carrying out the GPC analyses reported in the present work.
A. Kramarenko, D. Etit, G. Laudadio, F. N. D'Angelo, ChemSusChem 2021, 14, 3838.
A previous version of this manuscript has been deposited on a preprint server (https://doi.org/10.26434/chemrxiv.14161355.v2).
References
- 1. Butler C., Int. J. Environ. Res. Public Health 2018, 15, 2266. [Google Scholar]
- 2. Allan B., Int. Stud. Q. 2017, 61, 809–820. [Google Scholar]
- 3. Arevalo-Gallegos A., Ahmad Z., Asgher M., Parra-Saldivar R., Iqbal H. M. N., Int. J. Biol. Macromol. 2017, 99, 308–318. [DOI] [PubMed] [Google Scholar]
- 4. Wang F., Ouyang D., Zhou Z., Page S. J., Liu D., Zhao X., J. Energy Chem. 2021, 57, 247–280. [Google Scholar]
- 5. Zhou Z., Lei F., Li P., Jiang J., Biotechnol. Bioeng. 2018, 115, 2683–2702. [DOI] [PubMed] [Google Scholar]
- 6. Luo H., Abu-Omar M. M. in Encyclopedia of Sustainable Technologies, Elsevier, 2017, pp. 573–585. [Google Scholar]
- 7. Armstrong R. C., Wolfram C., de Jong K. P., Gross R., Lewis N. S., Boardman B., Ragauskas A. J., Ehrhardt-Martinez K., Crabtree G., Ramana M. V., Nat. Energy 2016, 1, 15020. [Google Scholar]
- 8. Kim K. H., Kim C. S., Front. Energy Res. 2018, 6, 1–7. [Google Scholar]
- 9. Zhao X., Li S., Wu R., Liu D., Biofuels Bioprod. Biorefin. 2017, 11, 567–590. [Google Scholar]
- 10. Sun Z., Fridrich B., de Santi A., Elangovan S., Barta K., Chem. Rev. 2018, 118, 614–678. [DOI] [PMC free article] [PubMed] [Google Scholar]
- 11. Ferrini P., Rinaldi R., Angew. Chem. Int. Ed. 2014, 53, 8634–8639; [DOI] [PubMed] [Google Scholar]; Angew. Chem. 2014, 126, 8778–8783. [Google Scholar]
- 12. Renders T., Van Den Bossche G., Vangeel T., Van Aelst K., Sels B., Curr. Opin. Biotechnol. 2019, 56, 193–201. [DOI] [PubMed] [Google Scholar]
- 13. Renders T., Cooreman E., Van Den Bosch S., Schutyser W., Koelewijn S. F., Vangeel T., Deneyer A., Van Den Bossche G., Courtin C. M., Sels B. F., Green Chem. 2018, 20, 4607–4619. [Google Scholar]
- 14. Van Den Bosch S., Renders T., Kennis S., Koelewijn S., Van Den Bossche G., Vangeel T., Deneyer A., Depuydt D., Courtin C. M., Thevelein J. M., Schutyser W., Sels B. F., Green Chem. 2017, 19, 3313—3326. [Google Scholar]
- 15. Kumaniaev I., Subbotina E., Sävmarker J., Larhed M., Galkin M. V., Samec J. S. M., Green Chem. 2017, 19, 5767–5771. [Google Scholar]
- 16. Abu-Omar M. M., Barta K., Beckham G. T., Luterbacher J. S., Ralph J., Rinaldi R., Román-Leshkov Y., Samec J. S. M., Sels B. F., Wang F., Energy Environ. Sci. 2021, 14, 262–292. [Google Scholar]
- 17. Galkin M. V., Samec J. S. M., ChemSusChem 2016, 9, 1544–1558. [DOI] [PubMed] [Google Scholar]
- 18. Cooreman E., Vangeel T., Van Aelst K., Van Aelst J., Lauwaert J., Thybaut J. W., Van den Bosch S., Sels B. F., Ind. Eng. Chem. Res. 2020, 59, 17035–17045. [Google Scholar]
- 19. Nikolaidis P., Poullikkas A., Renewable Sustainable Energy Rev. 2017, 67, 597–611. [Google Scholar]
- 20. Mehmeti A., Angelis-Dimakis A., Arampatzis G., McPhail S., Ulgiati S., Environment 2018, 5, 24. [Google Scholar]
- 21. Acar C., Dincer I., J. Cleaner Prod. 2019, 218, 835–849. [Google Scholar]
- 22. Anderson E. M., Stone M. L., Katahira R., Reed M., Beckham G. T., Román-Leshkov Y., Joule 2017, 1, 613–622. [Google Scholar]
- 23. Lan W., Du Y. P., Sun S., Behaghel De Bueren J., Héroguel F., Luterbacher J. S., Green Chem. 2021, 23, 320–327. [Google Scholar]
- 24. Anderson E. M., Stone M. L., Hülsey M. J., Beckham G. T., Román-Leshkov Y., ACS Sustainable Chem. Eng. 2018, 6, 7951–7959. [Google Scholar]
- 25. Subbotina E., Velty A., Samec J. S. M., Corma A., ChemSusChem 2020, 13, 4528–4536. [DOI] [PubMed] [Google Scholar]
- 26. Kumaniaev I., Subbotina E., Sävmarker J., Larhed M., Galkin M. V., Samec J. S. M., Green Chem. 2017, 19, 5767–5771. [Google Scholar]
- 27. Gallo J. M. R., Alonso D. M., Mellmer M. A., Yeap J. H., Wong H. C., Dumesic J. A., Top. Catal. 2013, 56, 1775–1781. [Google Scholar]
- 28. Wu C. Y., Wu H. S., ACS Omega 2017, 2, 4287–4296. [DOI] [PMC free article] [PubMed] [Google Scholar]
- 29. Wu Z., Zhang J., Su Z., Wang P., Tan T., Xiao F. S., Ind. Eng. Chem. Res. 2020, 59, 17300–17306. [Google Scholar]
- 30. Zijlstra D. S., Lahive C. W., Analbers C. A., Figueirêdo M. B., Wang Z., Lancefield C. S., Deuss P. J., ACS Sustainable Chem. Eng. 2020, 8, 5119–5131. [Google Scholar]
- 31. Ouyang X., Huang X., Hendriks B. M. S., Boot M. D., Hensen E. J. M., Green Chem. 2018, 20, 2308–2319. [Google Scholar]
- 32. Huang X., Ouyang X., Hendriks B. M. S., Gonzalez O. M. M., Zhu J., Korányi T. I., Boot M. D., Hensen E. J. M., Faraday Discuss. 2017, 202, 141–156. [DOI] [PubMed] [Google Scholar]
- 33. Thornburg N. E., Pecha M. B., Brandner D. G., Reed M. L., Vermaas J. V., Michener W. E., Katahira R., Vinzant T. B., Foust T. D., Donohoe B. S., Román-Leshkov Y., Ciesielski P. N., Beckham G. T., ChemSusChem 2020, 13, 4495–4509. [DOI] [PubMed] [Google Scholar]
- 34. Gernat D. C., Rozenbroek R., Brouwer E. R., van der Wielen L. A. M., Ottens M., J. Chem. Technol. Biotechnol. 2020, 95, 3134–3148. [Google Scholar]
- 35. Huang X., Ludenhoff J. M., Dirks M., Ouyang X., Boot M. D., Hensen E. J. M., ACS Catal. 2018, 8, 11184–11190. [DOI] [PMC free article] [PubMed] [Google Scholar]
- 36. Anderson E. M., Katahira R., Reed M., Resch M. G., Karp E. M., Beckham G. T., Román-Leshkov Y., ACS Sustainable Chem. Eng. 2016, 4, 6940–6950. [Google Scholar]
- 37. Chung K. H., Microporous Mesoporous Mater. 2008, 111, 544–550. [Google Scholar]
- 38. Fan Y., Bao X., Lin X., Shi G., Liu H., J. Phys. Chem. B 2006, 110, 15411–15416. [DOI] [PubMed] [Google Scholar]
- 39. Xiao C., Li S., Yi F., Zhang B., Chen D., Zhang Y., Chen H., Huang Y., RSC Adv. 2020, 10, 18704–18714. [DOI] [PMC free article] [PubMed] [Google Scholar]
- 40. Li D., Henschen J., Ek M., Green Chem. 2017, 19, 5564–5567. [Google Scholar]
- 41. Lindsay A. C., Kudo S., Sperry J., Org. Biomol. Chem. 2019, 17, 7408–7415. [DOI] [PubMed] [Google Scholar]
- 42. Roberge D. M., Hausmann H., Hölderich W. F., Phys. Chem. Chem. Phys. 2002, 4, 3128–3135. [Google Scholar]
- 43. Bai G., Dou H., Qiu M., Fan X., He F., Niu L., Ma Z., Catal. Lett. 2010, 138, 187–192. [Google Scholar]
- 44. Qin Z., Hafiz L., Shen Y., Van Daele S., Boullay P., Ruaux V., Mintova S., Gilson J. P., Valtchev V., J. Mater. Chem. A 2020, 8, 3621–3631. [Google Scholar]
- 45. Hao W., Zhang W., Guo Z., Ma J., Li R., Catalysts 2018, 8, 504. [Google Scholar]
- 46. Wang H., Xin W., Catal. Lett. 2001, 76, 225–229. [Google Scholar]
- 47. Camiloti A. M., Jahn S. L., Velasco N. D., Moura L. F., Cardoso D., Appl. Catal. A 1999, 182, 107–113. [Google Scholar]
- 48. Queirós C. S. G. P., Cardoso S., Lourenço A., Ferreira J., Miranda I., Lourenço M. J. V., Pereira H., Biomass Convers. Biorefin. 2020, 10, 175–188. [Google Scholar]
- 49. Lupoi J. S., Singh S., Parthasarathi R., Simmons B. A., Henry R. J., Renewable Sustainable Energy Rev. 2015, 49, 871–906. [Google Scholar]
- 50.A. Sluiter, B. Hames, R. Ruiz, C. Scarlata, J. Sluiter, D. Templeton, D. Crocker, NREL/TP-510-42618 Laboratory Analytical Procedure, 2011.
- 51. Talebi Amiri M., Dick G. R., Questell-Santiago Y. M., Luterbacher J. S., Nat. Protoc. 2019, 14, 921–954. [DOI] [PubMed] [Google Scholar]
Associated Data
This section collects any data citations, data availability statements, or supplementary materials included in this article.
Supplementary Materials
As a service to our authors and readers, this journal provides supporting information supplied by the authors. Such materials are peer reviewed and may be re‐organized for online delivery, but are not copy‐edited or typeset. Technical support issues arising from supporting information (other than missing files) should be addressed to the authors.
Supporting Information


