

Abstract
Diphtheria toxin is among many bacterial toxins that utilize the endosomal pathway of cellular entry, which is ensured by the bridging of the endosomal membrane by the toxin’s translocation (T) domain. Endosomal acidification triggers a series of conformational changes of the T-domain, that take place first in aqueous and subsequently in membranous milieu. These rearrangements ultimately result in establishing membrane-inserted conformation(s) and translocation of the catalytic moiety of the toxin into the cytoplasm. We discuss here the strategy for combining site-selective labeling with various spectroscopic methods to characterize structural and thermodynamic aspects of protonation-dependent conformational switching and membrane insertion of the diphtheria toxin T-domain. Among the discussed methods are FRET, FCS and depth-dependent fluorescence quenching with lipid-attached bromine atoms and spin probes. The membrane-insertion pathway of the T-domain contains multiple intermediates and is governed by staggered pH-dependent transitions involving protonation of histidines and acidic residues. Presented data demonstrate that the lipid bilayer plays an active part in T-domain functioning and that the so-called Open-Channel State does not constitute the translocation pathway, but is likely to be a byproduct of the translocation. The spectroscopic approaches presented here are broadly applicable to many other systems of physiological and biomedical interest for which conformational changes can lead to membrane insertion (e.g., other bacterial toxins, host defense peptides, tumor-targeting pHLIP peptides and members of Bcl-2 family of apoptotic regulators).
1. Introduction
Diphtheria toxin is an exotoxin secreted by Corynebacterium diphtheriae and causes disease in humans by inhibiting protein synthesis. It enters the cell via the endosomal pathway [Murphy, 2011], a feature shared by many other A-B toxins, including botulinum, tetanus, and anthrax [Collier & Young, 2003; Hoch et al., 1985; Koriazova & Montal, 2003; Neale, 2003]. Although cellular entry of these toxins comprises complex and not fully understood processes, they have certain similarities with the entry pathway of diphtheria toxin. That is, they involve receptor-mediated endocytosis followed by endosome acidification and pH-triggered conformational changes. This refolding results in membrane insertion of the transporting protein and formation of either a permanent or transient passageway, through which the toxic enzymatic components are transported into the cell. Diphtheria toxin T-domain implements its function—translocation of the catalytic domain across the endosomal membrane under acidic conditions—without the help of any additional protein components [Oh, Senzel, Collier, & Finkelstein, 1999], and apparently as a monomer [Gordon & Finkelstein, 2001; Palchevskyy et al., 2006]. The ability of the T-domain to translocate relatively large macromolecules [Ren et al., 1999] in a pH-dependent manner, makes it a potential candidate for targeting tumors, which produce slightly acidic environment. Here, we will review the results of structural and thermodynamic studies of T-domain refolding, membrane insertion and translocation obtained in our lab for the past decade. We also present recent advancements in fluorescence-based methodologies for characterizing membrane insertion pathways, which are applicable to a large class of membrane-binding proteins.
Diphtheria toxin T-domain is considered by many to be the archetypal representative of a specific class of proteins that insert into biological membranes in a translocon-independent manner after being refolded from their initial water-soluble structures [Antignani & Youle, 2006; Vargas-Uribe, Rodnin, & Ladokhin, 2013]. Such transitions are common in a number of biologically important processes, such as the cellular entry of bacterial toxins [Collier & Young, 2003; Hoch et al., 1985; Koriazova & Montal, 2003; Ladokhin, 2013; Murphy, 2011; Neale, 2003], colicins [Jakes & Cramer, 2012; Zakharov & Cramer, 2004], and viruses [Kielian & Rey, 2006; Neuman et al., 2013], complement-mediated cytolysis, and the regulation of apoptosis by the Bcl-2 family of proteins [Antignani & Youle, 2006; Bogner, Leber, & Andrews, 2010; Chi, Kale, Leber, & Andrews, 2014; Hsu, Wolter, & Youle, 1997; Leber, Lin, & Andrews, 2007; Youle & Strasser, 2008]. The unique characteristic of these proteins is their ability to undergo conformational switching when they move from the polar environment of the aqueous medium to the non-polar milieu of the lipid bilayer in response to a given cellular/chemical signal. In the case of diphtheria toxin T-domain, this conformational switching occurs in response to the acidic environment of the endosome [Ladokhin, 2013], and ensures the toxin’s entry into the cell.
The crystallographic structure of the soluble form of the T-domain [Bennett & Eisenberg, 1994; Weiss, Blanke, Collier, & Eisenberg, 1995] (Fig. 1A) consists of nine helices of various lengths (TH1–9), eight of which completely surround the most hydrophobic one, TH8. The N-terminal helices TH1–4 (red and orange), do not penetrate into the membrane and are translocated with the catalytic domain [Oh et al., 1999; Senzel, Huynh, Jakes, Collier, & Finkelstein, 1998]. The core fragment consists of the TH8–9 hydrophobic hairpin that inserts first (brown helices in Fig. 1A), followed by the rest of the core sequence (TH5–7, blue and cyan).
Fig. 1.
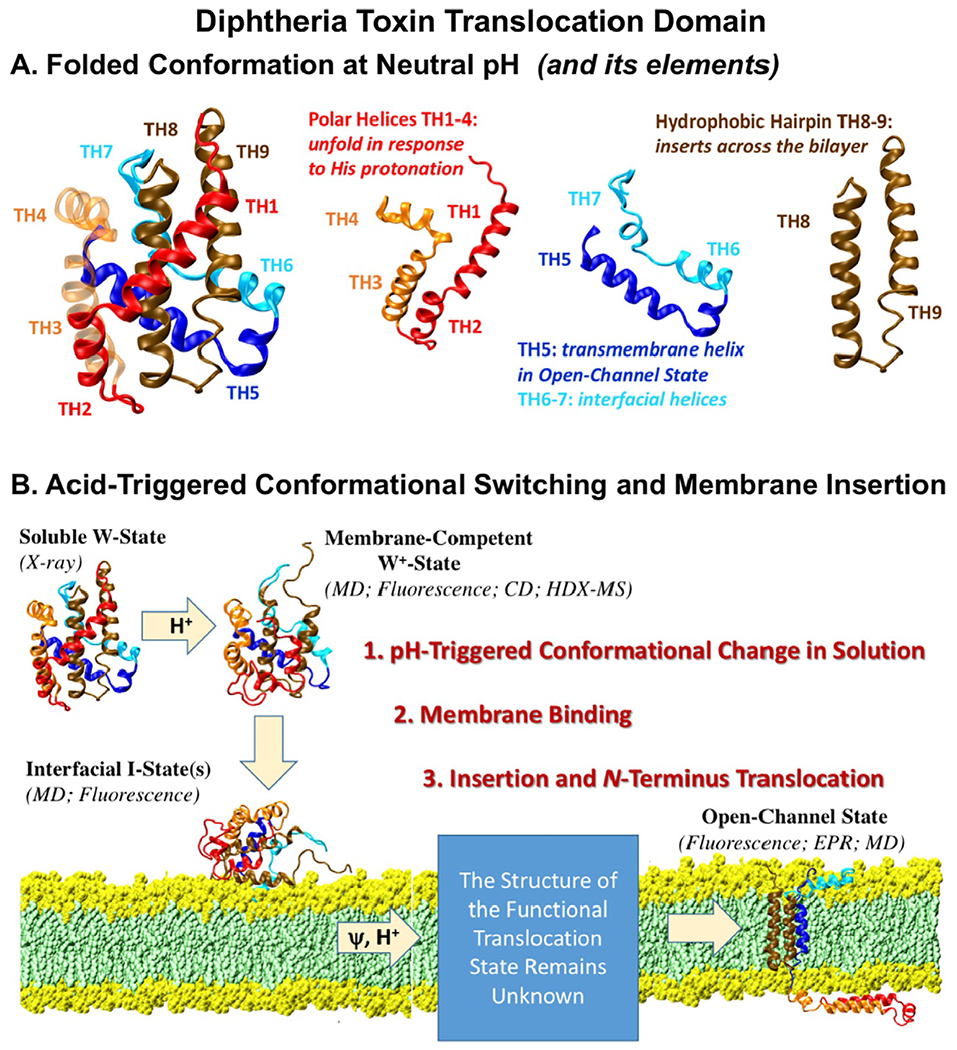
(A) Crystallographic structure of the diphtheria toxin translocation domain [Bennett & Eisenberg, 1994; Weiss et al., 1995] consists of several structural elements that undergo conformational changes in response to protonation and membrane interactions. (B) pH-triggered membrane insertion pathway of the diphtheria toxin T-domain [Kurnikov et al., 2013; Kyrychenko, Posokhov, Rodnin, & Ladokhin, 2009], responsible for the cellular entry of the toxin.
A schematic representation of the pH-dependent membrane insertion pathway of the T-domain is shown in Fig. 1B [Kyrychenko et al., 2009]. Protonation of key histidine residues triggers unfolding of the polar helices and exposure of the hydrophobic core [Kurnikov et al., 2013; Rodnin et al., 2010; Rodnin, Li, Gross, & Ladokhin, 2016]. The resulting membrane-competent W+-state (for protonated water-soluble) rapidly associates with the bilayer to form an interfacial intermediate I-state [Kyrychenko et al., 2009]. Subsequent insertion is facilitated by the presence of anionic lipids, which decrease the thermodynamic barrier for the insertion of the TH8–9 helical hairpin. The two protonation steps responsible for the formation of conformations capable of membrane association and insertion have overlapping pH ranges, suggesting that additional protonation can occur at the same pH value due to the shift of pKa values of titratable residues after their partitioning into the interfacial zone of the lipid bilayer. While numerous studies had shown the co-existence of multiple insertion intermediates [Chenal et al., 2002; Kyrychenko et al., 2009; Ladokhin, Legmann, Collier, & White, 2004; Montagner et al., 2007; Palchevskyy et al., 2006; Rodnin et al., 2011; Vargas-Uribe, Rodnin, Kienker, Finkelstein, & Ladokhin, 2013; Wang et al., 1997], the structure of the functional state of the T-domain responsible for the translocation of its N-terminus along with the catalytic domain remains unknown. The putative structural model representing the core in the post-translocated state (Fig. 1B, bottom right structure) is based on the Open-Channel State (OCS) model [Senzel et al., 2000] (derived from conductivity measurements in planar bilayers [Huynh et al., 1997; Mindell, Silverman, Collier, & Finkelstein, 1994a, 1994b]) and is now confirmed by a combination of site-specific labeling and depth-dependent fluorescence quenching experiments [Kyrychenko et al., 2018].
One of the main reasons for the gaps in our understanding of the physiological action of the T-domain and other self-inserting proteins, is the shortage of appropriate experimental tools to study the protein folding inside the lipid bilayer. For example, the high-resolution methods (e.g., X-ray crystallography and NMR) are difficult to apply, because the refolding of the soluble conformation on membrane interface and subsequent transbilayer insertion produces multiple intermediate states. As a result, structural information has to be teased out by various types of low-resolution methods, like fluorescence and EPR [Heuck & Johnson, 2002; Kyrychenko et al., 2018, 2009; Ladokhin, Isas, Haigler, & White, 2002; Oh, Altenbach, Collier, & Hubbell, 2000; Oh et al., 1996; Perier et al., 2007; Vasquez-Montes et al., 2019; Wang et al., 1997], which can be complemented with Molecular Dynamics (MD) simulations to get atomistic presentation of the membrane-inserted conformations [Flores-Canales, Ladokhin, & Kurnikova, 2014; Flores-Canales, Vargas-Uribe, Ladokhin, & Kurnikova, 2015; Kyrychenko et al., 2018]. In the following sections, we will show how fluorescence-based approaches can be applied to monitor different aspects of protein membrane insertion, including kinetic pathways of membrane insertion and free energy landscapes, specific conformational changes, structure and topology of membrane-inserted states, as well as elucidating the role of lipids on the membrane protein insertion pathways.
2. Methods for studies of kinetics and thermodynamics of protein-membrane interactions
2.1. Application of environment-sensitive probes and FRET for membrane binding/insertion assays
The use of environment-sensitive fluorescence probes is a ubiquitous method to monitor partitioning of proteins into lipid bilayers. The examples of such probes include the natural amino acid tryptophan and the commercially available external probes NBD (derivatives of 7-nitro-2-1,3-benzoxadiazol-4-amine) and Bimane (derivative of 3-(bromomethyl)-2, 5,6-trimethyl-1H,7H-pyrazolo[1,2-a]pyrazole-1,7-dione). When the protein-attached probe is transferred from aqueous to membranous environments, its quantum yield and fluorescence lifetime often increase and the position of emission maximum shifts toward shorter wavelengths (blue-shift). Thus, following these changes in spectroscopic signature allows monitoring the partitioning of a labeled protein between the aqueous solution and the lipid bilayer. The general principles and specific applications of spectroscopic titration for the quantitative analysis of thermodynamics of membrane partitioning, has been described in detail elsewhere [Ladokhin, 2009]. With respect to environment-sensitive probes, however, one should keep in mind that not all spectroscopic signals constitute linear-response functions, suitable for quantitative analysis of binding. Unlike the total intensity (or that measured at a constant wavelength), the peak intensity or the position of spectral maximum do not scale linearly with the fraction of bound species and therefore are not suitable for analysis of binding [Ladokhin, Jayasinghe, & White, 2000].
Intrinsic tryptophan fluorescence is a classical tool to monitor membrane partitioning and refolding of membrane-active peptides and proteins [Kyrychenko et al., 2014; Kyrychenko, Vasquez-Montes, Ulmschneider, & Ladokhin, 2015; Ladokhin et al., 2000; Reshetnyak, Segala, Andreev, & Engelman, 2007; Vargas-Uribe, Rodnin, Kienker, et al., 2013; Vasquez-Montes, Gerhart, King, Thevenin, & Ladokhin, 2018]. An important advantage of tryptophan fluorescence is that it does not require site-selective-labeling, because the amino acid is incorporated as part of the peptide sequence. However, tryptophan fluorescence has some disadvantages because proteins usually have multiple tryptophan residues, or the signal-to-noise ratio is often not optimal when proteins have a single tryptophan residue. In certain instances, this can be circumvented by the application of quenching-enhanced titration protocols, which utilize aqueous quenchers, such as I− or Cs+ ions. The latter would preferentially quench fluorescence coming from proteins in solution, rather than from membrane-bound proteins, thus increasing the difference in the signal upon binding [Posokhov, Gottlieb, & Ladokhin, 2007]. Additional issues regarding tryptophan fluorescence, such as how to deal with light-scattering effects arising from the presence of vesicles, are discussed elsewhere [Ladokhin et al., 2000]. Most of these challenges, however, can be bypassed by site-selective-labeling of the protein with environment-sensitive dyes, such as NBD, BODIPY or Bimane, which can substantially improve the signal-to-noise ratio [Kaback & Wu, 1999; Rosconi & London, 2002; Vargas-Uribe, Rodnin, & Ladokhin, 2013; Wang, Rosconi, & London, 2006].
Application of the Förster Resonance Energy Transfer (FRET) is a common strategy to detect binding between two fluorescence-labeled particles [May & Kühn, 2011]. In contrast to the use of environment-sensitive probes, this approach does not require the probe to become embedded into the lipid bilayer to yield a fluorescence response. Instead, there is a change in signal that can be experimentally monitored because a donor probe transfers energy to an acceptor probe when they are within the Förster’s distance [Kyrychenko et al., 2009; Vargas-Uribe, Rodnin, & Ladokhin, 2013; Vasquez-Montes et al., 2018]. The experiment consists of labeling the protein and membrane with the donor/acceptor pair, so that the partitioning of the protein causes FRET between the probes. Below, we will discuss how the comparison of FRET-based membrane-association kinetics with to NBD-based membrane-insertion kinetics allowed for characterization of insertion intermediates in diphtheria toxin T-domain.
The formation of intermediates and subsequent transbilayer insertion is mediated by a subtle balance of hydrophobic and electrostatic interactions between proteins and the membrane interface. The applications of fluorescence spectroscopy for kinetic measurements of the T-domain insertion along the pathway from aqueous W-state to interfacial intermediate I-state and finally to transbilayer inserted T-state is summarized in Fig. 2. Kinetic measurements using the FRET signal between AlexaFluor488-labeled T-domain and Rhodamine-labeled LUV were used to study the time-dependent association of T-domain with the membrane. The validity of this FRET approach was verified by comparing equilibrium titration profiles with those obtained by FCS (Fig. 3A, circles and diamonds). In addition, FRET-based binding kinetics (Fig. 2A and B) were compared to those observed with the environmentally sensitive probe NBD attached to a single-Cys residue in the Q369C mutant of the T-domain (Fig. 2A and C). This residue is relatively solvent-exposed in the soluble T-domain at neutral pH (W-state) and according to our topology result (Fig. 2A) is in the middle of the TM segment in the inserted T-state. Such a transition is expected to result in a substantial increase of the fluorescence of NBD, which was indeed observed, as shown by the kinetics measurements in Fig. 2C. In contrast to the fast FRET-based binding kinetics (Fig. 2B), fluorescence kinetics of NBD was slow and dependent on the lipid composition (Fig. 2C). This indicates that there is a membrane-bound, but not fully inserted, kinetic intermediate (I-state) that can be kinetically trapped. Accurate measurements of pH-dependent binding and insertion of the T-domain revealed that the protonation transitions allowing membrane binding and TM insertion are staggered rather than consecutive [Kyrychenko et al., 2009]. This is likely to be related to an additional protonation event of the T-domain on the interface due to variations in pKa between bulk solvent and the membrane interfacial zone. While the first transition (W-to-W+) involves protonation of N-terminal histidines [Kurnikov et al., 2013; Rodnin et al., 2010, 2016], the second one (Interfacial-to-Transmembrane state) depends on the protonation of E362 and another, not yet identified, residue [Ghatak et al., 2015; Kyrychenko et al., 2018].
Fig. 2.

(A) Crystallographic structure of the diphtheria toxin T-domain in soluble form at neutral pH [Bennett & Eisenberg, 1994]. The consensus insertion hairpin consisting of helices TH8 and TH9 is shown solid, while the rest of the structure is shown semitransparent. Two residues, N235 and Q369 (highlighted in CPK), along TH9 were replaced with cysteines (one at a time), providing unique labeling sites for fluorescence dye (NBD or AlexaFluor488) used in steady-state and kinetic measurements of insertion. (B and C) Membrane binding and insertion kinetics of the T-domain measured with LUV of specified lipid compositions (color-coded). (B) Binding kinetics were followed by the change in FRET signal between donor-labeled T-domain and acceptor-labeled LUV. (C) Insertion kinetics were followed by changes in fluorescence intensity of environment-sensitive probe NBD attached to the center region of the membrane-insertion domain (Q369C-NBD). Differences observed in the two types of kinetics reveal the insertion intermediate, which depends on pH and lipid composition. Modified from Kyrychenko, A., Posokhov, Y.O., Rodnin, M.V., Ladokhin, A.S. (2009) Kinetic intermediate reveals staggered pH-dependent transitions along the membrane insertion pathway of the diphtheria toxin T-domain. Biochemistry, 48, 7584–7594.
Fig. 3.

pH-dependent conversion of the T-domain from the soluble W-state into the membrane-competent W+-state. (A) Identification of W-to-W+ transition through membrane binding at lipid saturation. Mobility measurements based on FCS (diamonds) and measurements of FRET between donor-labeled T-domain and acceptor-labeled LUVs (circles) were performed as described in [Kyrychenko et al., 2009]. Triangles represent the increase in fluorescence intensity of environment-sensitive probe bimane attached to a single cysteine in position 369 (Fig. 2A). (B) Illustration of conformational changes associated with protonation of T-domain’s six histidines studied by MD simulations [Kurnikov et al., 2013]. The collapse of TH1–2 and exposure of TH8 are also confirmed by HDX-MS [Li, Rodnin, Ladokhin, & Gross, 2014; Rodnin et al., 2016]. Reprinted from Kyrychenko, A., Posokhov, Y.O., Rodnin, M.V., Ladokhin, A.S. (2009) Kinetic intermediate reveals staggered ph-dependent transitions along the membrane insertion pathway of the diphtheria toxin t-domain. Biochemistry, 48, 7584–7594; Copyright 2013, with permission from Elsevier.
2.2. FCS-based methods to quantify membrane interactions in the presence of membrane-competent and incompetent protein conformations
Combining linear-response spectroscopic techniques with lipid titrations is a popular approach in the thermodynamic characterization of membrane binding of proteins and peptides [Ladokhin et al., 2000; White & Wimley, 1998]. Measurements of fluorescence intensity or those of quantum yield-weighted anisotropy provide sensitive and accurate measures of the fractional saturation of membrane partitioning. While all titration-based approaches can be extremely useful for simple binding studies, their application to complex multistate systems is more challenging. In contrast, Fluorescence Correlation Spectroscopy (FCS), which relies on diffusion measurements is well suited to tackle such systems and was successfully applied to thermodynamic measurements of membrane interactions of the T-domain [Kurnikov et al., 2013; Posokhov, Rodnin, Das, Pucci, & Ladokhin, 2008; Vargas-Uribe et al., 2015]. Below, we briefly summarize the formalism of FCS analysis as it applies to a complex binding equilibrium typical for the T-domain and other proteins that undergo pH-dependent membrane binding [Kurnikov et al., 2013; Ladokhin, 2009; Posokhov, Rodnin, Das, et al., 2008; Vargas-Uribe et al., 2015].
The autocorrelation function G(τ) for single diffusing species undergoing Brownian motion can be described with the Eq. (1) [Haustein & Schwille, 2007; Hess, Huang, Heikal, & Webb, 2002]:
| (1) |
where N is the average number of fluorescent molecules in the focal volume and τD is the correlation time of the particles. The correlation time represents the diffusion time through the focus volume and equals τD = ω2/4D, where ω2 is the square of the radius of the laser focus and D is the diffusion constant. S is the ratio of the distances from the center of the laser beam focus in the radial and axial directions, respectively. T is the fraction of fluorophores in the triplet state and τTr is the triplet lifetime.
The measured correlation function G(τ) of a multicomponent system is a weighted sum of the autocorrelation functions of each component Gi(τ) with amplitudes Ai [Ladokhin, 2009; Posokhov, Rodnin, Lu, & Ladokhin, 2008; Rhoades, Ramlall, Webb, & Eliezer, 2006; Rusu, Gambhir, McLaughlin, & Radler, 2004] as shown by Eq. (2).
| (2) |
where Ni is the mean particle number and qi is the ratio of the fluorescence yield of the ith component to that of the first component. qi = 1 if binding of dye-labeled membrane protein to vesicles does not change fluorescence intensity of fluorescent labels. For binding of membrane protein to vesicles only two diffusing species are considered, namely, the fluorescently labeled proteins (index P) and LUV with bound fluorescently labeled proteins (index V):
| (3) |
If the quantum yield of a fluorophore is not environment-sensitive and does not change upon protein association with the membrane (which is often the case with AlexaFluor series of dyes), the amplitudes in Eq. 3 will depend only on the numbers of fast and slow moving particles in the focal volume (NP and NV, respectively).
| (4) |
Under conditions of infinite dilution regime, the fraction of bound protein is equal [Ladokhin, 2009; Posokhov, Rodnin, Lu, & Ladokhin, 2008]:
| (5) |
The resulting titration isotherm is fitted to a mole fraction partitioning equation [Ladokhin et al., 2000; White, Wimley, Ladokhin, & Hristova, 1998], modified to account for the presence of membrane-incompetent protein species [Kyrychenko et al., 2009; Ladokhin, 2009; Posokhov, Rodnin, Lu, & Ladokhin, 2008]:
| (6) |
| (7) |
where FMC is the membrane-competent fraction (determined at lipid saturation), [L] is lipid concentration, [W] is water concentration (55.3M), and Kx is a mole fraction partitioning coefficient which is used to determine the free energy ΔG of binding. Because FCS measurements are not dependent on the approximations of the signal saturation critical for other techniques, they often serve as a golden standard to which other methods, such as application of environment-sensitive probes and FRET, can be compared to (e.g., Fig. 3A, [Kurnikov et al., 2013]).
The described-above methodology was applied to determine both the pH-dependent formation of the membrane-competent form of the T-domain and the free energy of transfer of the T-domain from solution to the interfacial and membrane inserted states [Kurnikov et al., 2013; Posokhov, Rodnin, Das, et al., 2008; Vargas-Uribe et al., 2015]. The free energy measurements required application of fluorinated surfactants, that can chaperone membrane protein insertion and are particularly useful for controlling aggregation in solution, without compromising bilayer insertion [Kyrychenko et al., 2012; Palchevskyy et al., 2006; Rodnin et al., 2008]. The main gain in free energy was found to occur upon partitioning of the membrane-competent form of the T-domain to the interface (−8.2 kcal/mol), while the subsequent insertion was found to be only half as favorable (−3.0/−4.0 kcal/mol) [Posokhov, Rodnin, Das, et al., 2008; Vargas-Uribe et al., 2015]. These results confirm the conclusions of an earlier hydrophobicity analysis [Ladokhin et al., 2004] with regard to the critical role of the bilayer interface in modulating the insertion process.
2.3. pH-dependent formation of membrane-competent state of the T-domain
The formation of the membrane-competent form of the T-domain (W+-state) is the first step along a complex pathway, leading from a soluble conformation with a known crystallographic structure [Bennett & Eisenberg, 1994] (W-state) to ultimately the membrane-inserted states (Fig. 1B) [Kyrychenko et al., 2018, 2009; Ladokhin, 2013; Palchevskyy et al., 2006; Rodnin et al., 2010; Vargas-Uribe et al., 2015]. Protonation of T-domain histidine sidechains has been recognized to play an important role in various stages of the membrane insertion process. In particular, H257 and H223 were implicated to act as a molecular switch that triggers disruption of the native structure of W-state of T-domain in low pH solutions [Kurnikov et al., 2013; Ladokhin, 2013; Rodnin et al., 2010, 2011]. The pH-dependent conformational transition W-to-W+ is normally identified in a membrane-binding assay conducted under conditions of LUV saturation [Ladokhin, 2013; Vargas-Uribe et al., 2015]. The application of three independent fluorescence methods for the T-domain’s interaction with LUV are summarized in Fig. 3: (i) diffusion measurements by FCS technique (Fig. 3A, diamonds), (ii) association of donor-labeled T-domain and acceptor-labeled vesicles by FRET (Fig. 3A, circles) [Kyrychenko et al., 2009], and (iii) changes in polarity of a specifically attached environment-sensitive bimane probe by increase in fluorescence intensity (Fig. 3A, triangles) [Kurnikov et al., 2013]. All combined datasets were fitted with Eq. 8 and could be adequately described by a single fitting curve with a pKa of 6.2 and a Hill coefficient of about 2 (Fig. 3A, line). Thus, these measurements confirmed that W+-state is an experimentally observable state of the protein with a conformation different from that of the W-state. The structure and dynamics of the pH-dependent conformational switching of the T-domain have been a subject of MD simulations reported elsewhere [Flores-Canales & Kurnikova, 2015; Flores-Canales et al., 2015; Ghatak et al., 2015; Kurnikov et al., 2013; Kyrychenko et al., 2018].
| (8) |
where pKa is a negative logarithm of the dissociation constant, and n is the Hill coefficient.
3. Methods for studies of structure and topology of membrane-inserted proteins
3.1. FRET-based topology assay
Another application of FRET methodology is related to the determination of bilayer topology of membrane-inserted proteins (i.e., position of a particular site with respect to the two leaflets of the lipid bilayer). The insertion topology can be determined by combining site-selective labeling of the protein with a fluorescent probe and symmetric or asymmetric labeling of the membrane with a medium-range FRET-quencher [Everett, Zlotnick, Tennyson, & Holloway, 1986; Ladokhin, 2000; Ladokhin & White, 2004; Matsuzaki, Murase, Fujii, & Miyajima, 1995; Wimley & White, 2000]. The idea is that cis- or trans-positioning of the attached probe in the bilayer can be deduced by comparing the fluorescent response of the fluorophore upon interaction of the donor-labeled protein with membranes labeled symmetrically or asymmetrically with acceptors. Examples of these quenchers include Lyso-MC, a methylcoumarin derivative capable of quenching tryptophan fluorescence [Ladokhin & White, 2004; Wimley & White, 2000]; and Lyso-UB, a UniBlue chromophore derivative capable of quenching NBD fluorescence [Ladokhin et al., 2002; Posokhov & Ladokhin, 2006]. In both cases, the quenching occurs through non-radiative Förster type energy transfer (FRET). Because single-chain lyso-lipids have significant water solubility and form micelles, they can be incorporated easily into the outer leaflet when added to preformed bilayer vesicles. The bulky charged quencher headgroup and single-acyl chain act in concert to slow lipid flip-flop, resulting in an asymmetric distribution, which is stable for topology measurements under equilibrium conditions.
While Lyso-MC has been useful for determining the topology of relatively short tryptophan-containing peptides [Ladokhin & White, 2004; Wimley & White, 2000], several problems arise when it is applied to proteins (e.g., weak tryptophan fluorescence, poor spectral selectivity, parasitic Lyso-MC fluorescence). These problems can be bypassed by using Lyso-UB as quencher of NBD fluorescence [Ladokhin et al., 2002; Posokhov & Ladokhin, 2006]. Another advantage of Lyso-UB is that the Förster radius from NBD to Lyso-UB, which ranges from 30 to 35Å depending on donor’s quantum yield and spectral position, is about the same as the thickness of the bilayer hydrocarbon core. Thus, FRET efficiency will be the highest when the quencher and fluorophore are in the same leaflet and the lowest when they are separated by the bilayer. This can be measured by monitoring changes in donor intensity or lifetime [Posokhov & Ladokhin, 2006], where the latter is preferred because it is less susceptible to artifacts associated with partial loss of sample.
In order to test the insertion topology of the diphtheria toxin T-domain, the NBD probe was attached to the very tip of the insertion domain formed by helices TH8 and TH9 using the L350C and P378C mutants (Fig. 4) [Kyrychenko et al., 2009]. If these helices adopt a TM conformation upon insertion, the probe that is translocated across the bilayer becomes inaccessible to the externally added Lyso-UB quencher. If the helices remain interfacial, the quenching will be substantial for both mutants. Lyso-UB quenching experiments were performed after T-domain insertion had come to equilibrium at 1 h after mixing the T-domain and LUV at low pH. In order to describe Lyso-UB quenching, and the resulting topology, in a quantitative way, the fluorescence decay for all samples was analyzed and the ratio of the average lifetime upon addition of the quencher was calculated, as described in [Posokhov & Ladokhin, 2006]. We found that the degree of quenching depends on the lipid composition. The amplitude-averaged lifetime ratio τα/τ0 of about 1.1 observed in 75POPC:25POPG and 25POPC:75POPG is indicative of efficient translocation, while the ratio τα/τ0 of 1.7 observed in 90POPC:10POPG confirms an interfacial topology (Fig. 4). In fact, the same quenching ratio was observed in a control experiment using the NBD-labeled P378C mutant, for which no translocation is expected during TH8-TH9 insertion (Fig. 4). These topology methods were critical for correct interpretation of measurements of lipid-dependent kinetics and thermodynamics [Kyrychenko et al., 2009; Posokhov, Rodnin, Das, et al., 2008; Vargas-Uribe et al., 2015].
Fig. 4.

(Top left) Chemical structure of LysoUB, a compound comprised of UniBlue chromophore attached to a lyso-lipid. (Top right) Structure of the T-domain with highlighted residues P378 and L350, flanking TH9. (Middle) Fluorescence lifetime quenching with Lyso-UB of the NBD-labeled P378C and L350C mutants in membranes containing various fractions of zwitterionic PC and anionic PG lipids [Kyrychenko et al., 2009]. (Bottom) Schematic representation of insertion pathway of TH8–9 of T-domain studied with LysoUB/NBD topology method. Shaded circles illustrate the approximate range of efficient quenching from an NBD-labeling site, consistent with the quenching results in the middle panel.
3.2. Method of distribution analysis (DA) for depth-dependent fluorescence quenching by lipid-attached quenchers
Accurate determination of the penetration depth of proteins and peptides into lipid bilayers is an important step in studying of binding, topology and folding of membrane proteins. However, extracting of quantitative information about the membrane location of an intrinsic fluorophore or a site-selectively attached external probe from fluorescence studies is typically complicated by broad distributions of the transverse positions of both quenchers and fluorophores. Therefore, depth-dependent fluorescence quenching with a series of lipid-attached quenchers, such as bromine atoms or paramagnetic Tempo and Doxyl groups (Fig. 5A), has become an important spectroscopic tool for calculating the precise depth of a fluorescent moiety [Ladokhin, 1997, 1999, 2014; London & Ladokhin, 2002]. While bromolipids can be utilized as quenchers for tryptophan and pyrene fluorescence, the lipid-attached spin moieties, in addition to those, can also quench other organic fluorophores, including NBD, rhodamine, bimane and anthracene. The transverse position of bromine atoms has been determined by X-ray diffraction [McIntosh & Holloway, 1987], while the position of spin labels has been recently refined by MD simulations [Kyrychenko & Ladokhin, 2013].
Fig. 5.

(A and B) Lipid-attached fluorescence quenchers used for depth-dependent measurements and their depth (the distances from bilayer center to the quencher) [Kyrychenko & Ladokhin, 2013; McIntosh & Holloway, 1987]. (A) Brominated phospholipids: 1-palmitoyl-2-(n,n-dibromo)stearoyl-sn-glycero-3-phosphocholine (n,n-Br-PC). (B) Spin-labeled phospholipids: 1-palmitoyl-2-oleoyl-sn-glycero-3-phospho(TEMPO) choline (Tempo-PC), 1-palmitoyl-2-stearoyl-(n-doxyl)-sn-glycero-3-phosphocholine (n-doxyl-PC). (C) The DA methodology approximates the transverse quenching profile (QP(h)) with a sum of two mirror-image Gaussian functions (G(h)), where hm—the center (mean) of the quenching profile, σ—the width of the distribution, and S—the area of the quenching profile [Ladokhin, 1997, 1999, 2014; London & Ladokhin, 2002]. (D) Top Right: Structure of NBD-PE and TEMPO-PC. Bottom Left: An MD snapshot of a lipid bilayer composed of Tempo-PC and POPC with a ratio of that correspond to 11 mol% of bilayer spin-labeling, respectively. The POPC phosphorus atoms are shown as blue balls. POPC and Tempo-PC are shown in stick representations in olive and red, respectively, with the Tempo moieties shown using van der Waals representation Bottom Right: Comparison of the MD-simulated distribution of a NBD moiety [Kyrychenko, Rodnin, & Ladokhin, 2015] (shaded area) with those estimated from experimental data (red and green lines). Green profile corresponds to the result obtained when Tempo is assumed to reside above the phosphate level, as suggested by Schrader and Han [Schrader & Han, 2017], while red profile corresponds to the result obtained when position of Tempo is taken from our MD simulation ([Kyrychenko & Ladokhin, 2013] and central panel). The latter gives excellent correspondence to the MD-determined profile of the NBD (blue), thus validating the DA approach. Reprinted by permission from [Kyrychenko, A., Ladokhin, A.S. (2020) Location of TEMPO-PC in lipid bilayers: Implications for fluorescence quenching. The Journal of Membrane Biology, 253, 73–77.], COPYRIGHT 2020 from Springer
The main assumption of the depth-dependent quenching methodology is that the quenching between a fluorescence dye and a quencher will be greatest when they are located at the same depth within the bilayer. To quantitate membrane penetration the quenching profiles are measured and fitted using Distribution Analysis (DA) method [Ladokhin, 1997, 2014]. DA reconstructs a depth-dependent quenching profile by using the quenching data collected from a series of quenchers, located at the known depths (h) within the membrane (Fig. 5). The DA methodology approximates the transverse quenching profile (QP(h)) of a fluorophore with a symmetrical twin Gaussian function (Fig. 5B), which has three fitting parameters: hm = the center (mean) of the quenching profile, σ = the width of the distribution, and S = the area of the quenching profile. These parameters correspond to the most probable depth of penetration, fluctuations in the transverse position, and overall accessibility to quenching (i.e., quenching efficiency), respectively [Ladokhin, 1999]. Unlike in the previously described LysoUB quenching method (Section 3.1), the quenchers are distributed in both leaflets. In order to account for possible trans-leaflet quenching of deeply penetrating fluorophores, the mirror-image G(−h) component is added to main Gaussian component G(h) [Ladokhin, 1999].
The accuracy of membrane depth calculations is crucially dependent on the knowledge of the precise positioning of the lipid-attached spin-quenchers within the bilayer. Therefore, the average positions of the spin quencher calculated from the center of the lipid bilayer have recently been determined by molecular dynamics (MD) simulations of a series of spin-labeled lipids in the model membrane [Kyrychenko & Ladokhin, 2013]. A combination of MD simulations and depth-dependent fluorescence quenching was used to calibrate the methodology for extracting quantitative information on membrane penetration of fluorescent-labeled molecules [Kyrychenko, Rodnin, & Ladokhin, 2015]. One of such model systems, NBD-PE in a POPC bilayer, is illustrated in Fig. 5D. The MD-simulated depth profile of the lipid-attached NBD probe is shown as a blue distribution on the Bottom Right panel (Fig. 5D). The red and green lines correspond to two alternative application of the DA methodology to the same set of experimental data obtained with the full set of lipid-attached spin labels, including TEMPO (Fig. 5B). The difference between the two DA-generated profiles is in the transverse positioning of the TEMPO group. Assuming that TEMPO is located above phosphates, as sometimes suggested in the literature [Schrader & Han, 2017], results in large discrepancy between MD and experimental position of NBD (green line). In contrast, positioning of TEMPO below the level of phosphates during DA analysis (as suggested by MD simulations [Kyrychenko & Ladokhin, 2013]) and Fig. 5D, Bottom Left panel), results in excellent correlation between the reconstructed quenching profile (Fig. 5D, Bottom Right panel, red curve) and MD-generated [Kyrychenko, Rodnin, & Ladokhin, 2015] profile for the NBD (shaded blue area).
3.3. Application of DA method to structural studies of translocation domain in the lipid bilayer
The membrane depth of NBD probes attached at various positions in the diphtheria toxin T-domain were examined by depth-dependent fluorescence quenching using the DA methodology [Kyrychenko et al., 2018]. The steady-state and lifetime fluorescence of NBD-labeled T-domain inserted into lipid vesicles were examined in the absence and presence of spin-labeled lipids. Depth-dependent QP’s were constructed using measurements of fluorescence intensity, F, and lifetime, τ, as functions of quencher depth, h, to determine the transverse position of the NBD probes in the lipid bilayer (see Section 3.2 for details).
We use two limiting cases to illustrate the quantitative application of depth-dependent quenching with the DA methodology: The shallow penetrating residue P378C (Fig. 6) and the deeply penetrating residue A282C (Fig. 7). Panels A in Figs. 6 and 7 show the primary experimental data for the steady-state intensity (triangles) and lifetime quenching (squares) of these residues. The data is plotted as the fluorescence ratio between measurements in the absence (F0 or τ0) and presence (F or τ) of spin lipids. In both cases the “dynamic” quenching (triangles) is much weaker than the total quenching (squares). The former is likely influenced by experimental difficulties of lifetime measurements in scattering samples. As a result, the “dynamic” quenching refers to all events that occur on a timescale longer than 0.1 ns. The presented τ parameter represents the amplitude-weighted average of the two longest lifetime components.
Fig. 6.

Application of Distribution Analysis (DA) to depth-dependent fluorescence quenching of shallow penetrating probe in P378C-NBD mutant [Kyrychenko et al., 2018]. (A) Fluorescence steady-state (triangles) and time-resolved (squares) quenching profiles plotted against the depth of the following quenchers (from right to left): Tempo—PC and n-Doxyl—PCs with n= 5, 7, 10, 12, and 14. (B) Static QP calculated from the data in panel A as QP(h) = (F0/F(h))/(τ(h)/τ0). Solid lines represent the fit of the corresponding datasets using DA equation from Fig. 5C. The shaded areas represent a Gaussian function for the single leaflet quenching profiles. The sum of the shaded area, G(h), and its mirror image, G(−h), represents the total fitting function of DA, with the total of three fitting parameters: hm, σ and S. (C) Support-plane analysis of the robustness of the determination of the parameter for the most probable depth of the NBD dye (see text for details).
Fig. 7.
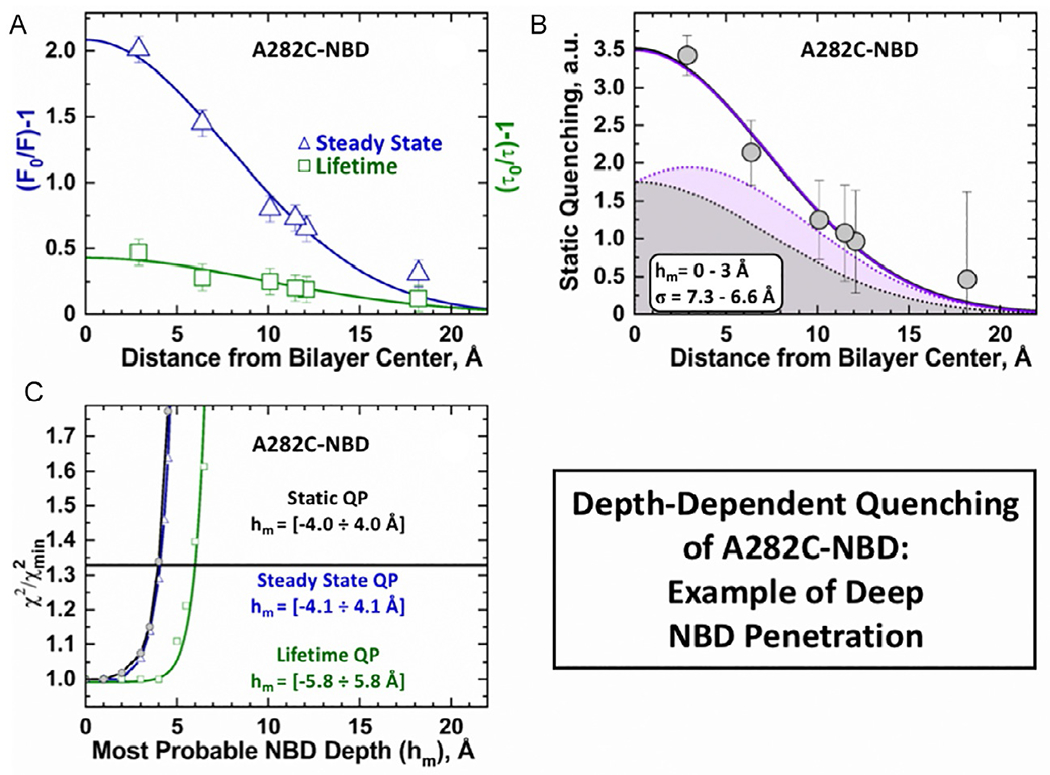
Application of DA to depth-dependent fluorescence quenching of deep penetrating probe in A282C-NBD mutant [Kyrychenko et al., 2018]. The steady-state (panel A, triangles) and time-resolved data (panel A, squares), as well as the static (panel B) quenching profiles were obtained as described in Fig. 6. Solid shapes represent two examples of individual solutions for a single-leaflet quenching profile (G(h) in Eq. 1) with hm = 0Å (gray) and hm = 3Å (purple). Both solutions produce essentially overlapping two-leaflet quenching profiles (correspondingly colored solid lines that go through the data). (C) Support-plane analysis of the robustness of the determination of the parameter for the most probable depth of the NBD dye (see text for details).
Data in panels B in Figs. 6 and 7 was derived from the primary experimental data (panels A) and represent the depth-dependent static QP, calculated as QP(h) = (F0/F(h))/(τ(h)/τ0). The datasets were fitted (solid lines) with DA equation from Fig. 5C to obtain the most probable depth of the NBD probe, hm, and the dispersion in transverse position, σ. The colored profiles denote individual Gaussian functions, G(h); while the total QP’s are a sum of G(h) and its mirror image G(−h), where both functions share the same parameters. The single gaussian fit is a simplified approach that only considers the quenching in a single leaflet, while the double Gaussian function used in DA analysis also accounts for transleaflet quenching. The improvement of depth determination by the double gaussian approach is more evident at deeply penetrating positions, such as in the case of A282C-NBD (Fig. 7) and is discussed in a greater detail below.
The robustness of the NBD penetration depths, hm, obtained by DA were determined by subjecting the fits to support-plane analysis [Montgomery & Peck, 1982]. This statistical procedure relies on the χ2 parameter of the goodness of the least-squares fit of a series of solutions where hm was fixed at various values (in 0.2–0.5 Å increments) around the most optimal solution (). The support plane analysis of the quenching distributions obtained from the primary fluorescence data and DA analysis are plotted in Fig. 6C and 7C. A cut-off (horizontal line), corresponding to 1-standard deviation, was used to estimate the hm ranges that produce statistically indistinguishable fits [Montgomery & Peck, 1982].
In the case of the shallow penetrating fluorophore P378C-NBD (Fig. 6C), the steady-state QP (blue) and static QP (black) produce similar results, with well-defined profiles centered at ~15 Å from the center of the bilayer. The lack of definition in the lifetime QP suggests that the highest contribution to the dynamic quenching component is present at depths ranging from 16 to 19 Å. All three QP’s of the deeply penetrating fluorophore A282C-NBD (Fig. 7) are less defined than those determined for P378C-NBD. This difference is primarily due to the uncertainty introduced by the cross-leaflet quenching near the middle of the bilayer. As a result, data fitting in this region is challenging and yields equivalent solutions for distributions centered between 0 and 3 Å (individual colored profiles in Fig. 7B). Consistently, the support plane analysis indicates that the NBD’s most probable position for residue A282C ranges within the 4 Å range on either side of the bilayer center (Fig. 7C).
The exact positioning of the helix will allow us to generate realistic starting positions for future studies of the membrane-inserted T-domain by MD computer simulations.
3.4. Is the Open-Channel State needed for the translocation? (Positioning of TH5 helix in T-domain WT and H322Q mutant)
Recent results indicate that C-terminal histidines (Fig. 8), and especially H322, are critical for the insertion of the N-terminal part of the T-domain and formation of the OCS [Rodnin et al., 2011; Vargas-Uribe, Rodnin, Kienker, et al., 2013]. Replacements with Q, R or K, while not affecting folding in solution or proper insertion of TH8–9, lead to an alternative folding pathway and inhibit the channel activity in planar lipid bilayer. This alternative folding is revealed by the red-shifted tryptophan fluorescence, associated with changes in insertion of W281 located in TH5. The spectroscopic changes become even more pronounced in a single-Trp mutant W206F (Fig. 8, central panel and Ref. [Ladokhin et al., 2017]). This variation in the insertion mode is confirmed by the results on an independent depth-dependent quenching experiments using three commercially available bromolipids with differed depths, h: 6-7BrPC (h = 11 Å), 9-10BrPC (h = 8.3 Å) and 11-12BrPC (h = 6.5 Å) (Fig. 5A). Each of the bromolipids was mixed with anionic POPG in 1:1M ratio. The intensity of tryptophan fluorescence of the T-domain was measured in the presence of quenching vesicles, F(h) and in quencher-free POPC-POPG LUV, F0. The “total” quenching profile was generated as QP(h) = F0/F(h)-1 and analyzed using the DA method [Ladokhin, 1997, 2014] by fitting to the twin Gaussian function (equation in Fig. 5B and C). Because the quenching profile for the mutant was poorly defined, the dispersion parameter σ representing the width of the distribution was fixed at 5, 6 or 7 Å. Regardless of the chosen value, the results indicate that W281 in the WT is located close to the center of the lipid bilayer, but remains close to the interface in the H223Q mutant (Fig. 8, central panel). Both spectroscopic experiments presented in Fig. 8 support the conclusion that the H322Q mutant does not form an OCS conformation [Ladokhin et al., 2017; Rodnin et al., 2011; Vargas-Uribe, Rodnin, Kienker, et al., 2013].
Fig. 8.

Left bottom panel: TH8–9 hydrophobic hairpin with highlighted histidine residues. Top panel: A single replacement of H322 results in repositioning of the TH5 helix from TM state (WT, black) to IF state (H322Q mutant, red), associated with loss of channel activity [Rodnin et al., 2011; Vargas-Uribe, Rodnin, Kienker, et al., 2013]. This repositioning can be followed by changes in spectral position of W281 (lower insert) and it’s quenching with brominated lipids (upper insert). Right bottom panel: Summary of the relative cellular toxicity in various mutants of diphtheria toxin and relative OCS activity of the T-domain with the same mutations in planar bilayers [Ladokhin, Vargas-Uribe, Rodnin, Ghatak, & Sharma, 2017]. The Activity Ratio (AR) between the two activities significantly deviates from one for the mutants with C-terminal histidine substitutions, indicating that channel activity is not required for the cytotoxicity associated with the translocation of the catalytic domain. Reprinted by permission from Kyrychenko, A., Posokhov, Y.O., Vargas-Uribe, M., Ghatak, C., Rodnin, M.V., Ladokhin, A.S., Fluorescence applications for structural and thermodynamic studies of membrane protein insertion, in: C.D. Geddes (Ed.), Reviews in fluorescence 2016, Springer 2017, pp. 243–274; COPYRIGHT 2017 from Springer.
While the exact mechanism for how the replacement of H322 influences the topology of a segment some 40 residues away remains a mystery. This result, however, confirms that fluorescence measurements constitute an important tool for studies of membrane protein folding. It is also surprising that the strong inhibition of the channel activity, caused by replacement of C-terminal histidines, does not translate into comparable loss of the cytotoxic activity when the same mutations are introduced into the full-length toxin (Fig. 8, right panel and Ref. [Ladokhin et al., 2017]). This implies that OCS is not directly involved in the translocation pathway for the catalytic domain but is likely to be a byproduct of translocation process.
4. Perspectives
Fluorescence spectroscopy is an important tool for studies of insertion of proteins into lipid bilayers. As demonstrated with the example of diphtheria toxin translocation domain, various fluorescence approaches can be applied to obtain critical structural and thermodynamic information enabling the deciphering of complex insertion/refolding pathways. Measurements of the insertion topology and bilayer penetration of protein sites, selectively labeled with appropriate probes, have a potential to fill an important knowledge gap in the structure-function relationship of a wide variety of proteins interacting with lipid bilayers. The methods described here are opening the doors for addressing fundamental questions related to lipid-dependent regulation of protein function via conformational switching and signaling on membrane interfaces. Future studies of the diphtheria toxin will be geared toward deciphering the elusive structure of the active conformation involved in the translocation (Fig. 1B); characterizing the protonation states of the titratable residues responsible for conformational switching in the lipid bilayer and ultimately visualizing and studying the infection process inside the cell.
Acknowledgments
Supported by NIH GM-126778 (A.S.L.). A.K. acknowledges the Grant 0119U002536 of Ministry of Education and Science of Ukraine.
Abbreviations
- DA
distribution analysis
- FCS
fluorescence correlation spectroscopy
- FRET
Förster resonance energy transfer
- HDX-MS
hydrogen deuterium exchange mass spectrometry
- IF
interfacial
- LUV
large unilamellar lipid vesicles
- LysoUB
FRET quencher for NBD fluorescence used to study membrane topology of membrane proteins
- MD
molecular dynamics (simulations)
- MP(s)
membrane protein(s)
- NBD-PE
fluorescent lipid (1,2-dipalmitoyl-snglycero-3-phosphoethanolamine-N-(7-nitro-2-1,3-benzoxadiazol-4-yl)
- OCS
Open-Channel State
- POPC
1-palmitoyl-2-oleoyl-sn-glycero-3-phosphocholine
- POPG
1-palmitoyl-2-oleoyl-sn-glycero-3-phospho-(1′-rac-glycerol)
- QP
quenching profile
- T-domain
diphtheria toxin translocation domain
- TM
transmembrane
References
- Antignani A, & Youle RJ (2006). How do Bax and Bak lead to permeabilization of the outer mitochondrial membrane? Current Opinion in Cell Biology, 18, 685–689. [DOI] [PubMed] [Google Scholar]
- Bennett MJ, & Eisenberg D (1994). Refined structure of monomeric diphtheria toxin at 2.3 å resolution. Protein Science, 3, 1464–1475. [DOI] [PMC free article] [PubMed] [Google Scholar]
- Bogner C, Leber B, & Andrews DW (2010). Apoptosis: Embedded in membranes. Current Opinion in Cell Biology, 22, 845–851. [DOI] [PubMed] [Google Scholar]
- Chenal A, Savarin P, Nizard P, Guillain F, Gillet D, & Forge V (2002). Membrane protein insertion regulated by bringing electrostatic and hydrophobic interactions into play. A case study with the translocation domain of the diphtheria toxin. The Journal of Biological Chemistry, 277, 43425–43432. [DOI] [PubMed] [Google Scholar]
- Chi X, Kale J, Leber B, & Andrews DW (2014). Regulating cell death at, on, and in membranes. Biochimica et Biophysica Acta, 1843, 2100–2113. [DOI] [PubMed] [Google Scholar]
- Collier RJ, & Young JA (2003). Anthrax toxin. Annual Reviews in Cell Develepment Biology, 19, 45–70. [DOI] [PubMed] [Google Scholar]
- Everett J, Zlotnick A, Tennyson J, & Holloway PW (1986). Fluorescence quenching of cytochrome b5 in vesicles with an asymmetric transbilayer distribution of brominated phosphatidylcholine. The Journal of Biological Chemistry, 261, 6725–6729. [PubMed] [Google Scholar]
- Flores-Canales JC, & Kurnikova M (2015). Microsecond simulations of the diphtheria toxin translocation domain in association with anionic lipid bilayers. The Journal of Physical Chemistry. B, 119, 12074–12085. [DOI] [PMC free article] [PubMed] [Google Scholar]
- Flores-Canales JC, Ladokhin AS, & Kurnikova M (2014). Multiscale simulations of diphtheria toxin T-domain membrane association. Biophysical Journal, 106, 441a. [Google Scholar]
- Flores-Canales JC, Vargas-Uribe M, Ladokhin AS,& Kurnikova M (2015).Membrane association of the diphtheria toxin translocation domain studied by coarse-grained simulations and experiment. The Journal of Membrane Biology, 248(3), 1–15. [DOI] [PMC free article] [PubMed] [Google Scholar]
- Ghatak C, Rodnin MV, Vargas-Uribe M, McCluskey AJ, Flores-Canales JC, Kurnikova M, et al. (2015). Role of acidic residues in helices TH8–TH9 in membrane interactions of the diphtheria toxin T domain. Toxins, 7, 1303–1323. [DOI] [PMC free article] [PubMed] [Google Scholar]
- Gordon M, & Finkelstein A (2001). The number of subunits comprising the channel formed by the T domain of diphtheria toxin. The Journal of General Physiology, 118, 471–480. [DOI] [PMC free article] [PubMed] [Google Scholar]
- Haustein E, & Schwille P (2007). Fluorescence correlation spectroscopy: Novel variations of an established technique. Annual Review of Biophysics and Biomolecular Structure, 36, 151–169. [DOI] [PubMed] [Google Scholar]
- Hess ST, Huang S, Heikal AA, & Webb WW (2002). Biological and chemical applications of fluorescence correlation spectroscopy: A review. Biochemistry, 41, 697–705. [DOI] [PubMed] [Google Scholar]
- Heuck AP, & Johnson AE (2002). Pore-forming protein structure analysis in membranes using multiple independent fluorescence techiniques. Cell Biochemistry and Biophysics, 36, 89–101. [DOI] [PubMed] [Google Scholar]
- Hoch DH, Romero-Mira M, Ehrlich BE, Finkelstein A, DasGupta BR, & Simpson LL (1985). Channels formed by botulinum, tetanus, and diphtheria toxins in planar lipid bilayers: Relevance to translocation of proteins across membranes. Proceedings of the National Academy of Sciences, 82, 1692. [DOI] [PMC free article] [PubMed] [Google Scholar]
- Hsu YT, Wolter KG, & Youle RJ (1997). Cytosol-to-membrane redistribution of bax and Bcl-x(L) during apoptosis. Proceedings of the National Academy of Sciences of the United States of America, 94, 3668–3672. [DOI] [PMC free article] [PubMed] [Google Scholar]
- Huynh PD, Cui C, Zhan HJ, Oh KJ, Collier RJ, & Finkelstein A (1997). Probing the structure of the diphtheria toxin channel: Reactivity in planar lipid bilayer membranes of cysteine-substituted mutant channels with methanethiosulfonate derivatives. The Journal of General Physiology, 110, 229–242. [DOI] [PMC free article] [PubMed] [Google Scholar]
- Jakes KS, & Cramer WA (2012). Border crossings: Colicins and transporters. Annual Review of Genetics, 46, 209–231. [DOI] [PubMed] [Google Scholar]
- Kaback HR, & Wu JH (1999). What to do while awaiting crystals of a membrane transport protein and thereafter. Accounts of Chemical Research, 32, 805–813. [Google Scholar]
- Kielian M, & Rey FA (2006). Virus membrane-fusion proteins: More than one way to make a hairpin. Nature Reviews. Microbiology, 4, 67–76. [DOI] [PMC free article] [PubMed] [Google Scholar]
- Koriazova LK, & Montal M (2003). Translocation of botulinum neurotoxin light chain protease through the heavy chain channel. Nature Structural Biology, 10, 13–18. [DOI] [PubMed] [Google Scholar]
- Kurnikov IV, Kyrychenko A, Flores-Canales JC, Rodnin MV, Simakov N, Vargas-Uribe M, et al. (2013). pH-triggered conformational switching of the diphtheria toxin T-domain: The roles of N-terminal histidines. Journal of Molecular Biology, 425, 2752–2764. [DOI] [PMC free article] [PubMed] [Google Scholar]
- Kyrychenko A, Freites JA, He J, Tobias DJ, Wimley WC, & Ladokhin AS (2014). Structural plasticity in the topology of the membrane-interacting domain of HIV-1 gp41. Biophysical Journal, 106, 610–620. [DOI] [PMC free article] [PubMed] [Google Scholar]
- Kyrychenko A, & Ladokhin AS (2013). Molecular dynamics simulations of depth distribution of spin-labeled phospholipids within lipid bilayer. The Journal of Physical Chemistry. B, 117, 5875–5885. [DOI] [PMC free article] [PubMed] [Google Scholar]
- Kyrychenko A, Lim NM, Vasquez-Montes V, Rodnin MV, Freites JA, Nguyen LP, et al. (2018). Refining protein penetration into the lipid bilayer using fluorescence quenching and molecular dynamics simulations: The case of diphtheria toxin translocation domain. The Journal of Membrane Biology, 251, 379–391. [DOI] [PMC free article] [PubMed] [Google Scholar]
- Kyrychenko A, Posokhov YO, Rodnin MV, & Ladokhin AS (2009). Kinetic intermediate reveals staggered pH-dependent transitions along the membrane insertion pathway of the diphtheria toxin T-domain. Biochemistry, 48, 7584–7594. [DOI] [PMC free article] [PubMed] [Google Scholar]
- Kyrychenko A, Rodnin MV, & Ladokhin AS (2015). Calibration of distribution analysis of the depth of membrane penetration using simulations and depth-dependent fluorescence quenching. The Journal of Membrane Biology, 248, 583–594. [DOI] [PMC free article] [PubMed] [Google Scholar]
- Kyrychenko A, Rodnin MV, Posokhov YO, Holt A, Pucci B, Killian JA, et al. (2012). Thermodynamic measurements of bilayer insertion of a single transmembrane helix chaperoned by fluorinated surfactants. Journal of Molecular Biology, 416, 328–334. [DOI] [PMC free article] [PubMed] [Google Scholar]
- Kyrychenko A, Vasquez-Montes V, Ulmschneider MB, & Ladokhin AS (2015). Lipid headgroups modulate membrane insertion of pHLIP peptide. Biophysical Journal, 108, 791–794. [DOI] [PMC free article] [PubMed] [Google Scholar]
- Ladokhin AS (1997). Distribution analysis of depth-dependent fluorescence quenching in membranes: A practical guide. Methods in Enzymology, 278, 462–473. [DOI] [PubMed] [Google Scholar]
- Ladokhin AS (1999). Analysis of protein and peptide penetration into membranes by depth-dependent fluorescence quenching: Theoretical considerations. Biophysical Journal, 76, 946–955. [DOI] [PMC free article] [PubMed] [Google Scholar]
- Ladokhin AS (2000). Fluorescence spectroscopy in peptide and protein analysis. In Meyers RA (Ed.), Peptides and proteins (pp. 5762–5779). Chichester: John Wiley & Sons, Ltd. [Google Scholar]
- Ladokhin AS (2009). Fluorescence spectroscopy in thermodynamic and kinetic analysis of pH-dependent membrane protein insertion. Methods in Enzymology, 466, 19–42. [DOI] [PMC free article] [PubMed] [Google Scholar]
- Ladokhin AS (2013). pH-triggered conformational switching along the membrane insertion pathway of the diphtheria toxin t-domain. Toxins, 5, 1362–1380. [DOI] [PMC free article] [PubMed] [Google Scholar]
- Ladokhin AS (2014). Measuring membrane penetration with depth-dependent fluorescence quenching: Distribution analysis is coming of age. Biochimica et Biophysica Acta, 1838, 2289–2295. [DOI] [PMC free article] [PubMed] [Google Scholar]
- Ladokhin AS, Isas JM, Haigler HT, & White SH (2002). Determining the membrane topology of proteins: Insertion pathway of a transmembrane helix of annexin 12. Biochemistry, 41, 13617–13626. [DOI] [PubMed] [Google Scholar]
- Ladokhin AS, Jayasinghe S, & White SH (2000). How to measure and analyze tryptophan fluorescence in membranes properly, and why bother? Analytical Biochemistry, 285, 235–245. [DOI] [PubMed] [Google Scholar]
- Ladokhin AS, Legmann R, Collier RJ, & White SH (2004). Reversible refolding of the diphtheria toxin T-domain on lipid membranes. Biochemistry, 43, 7451–7458. [DOI] [PubMed] [Google Scholar]
- Ladokhin AS, Vargas-Uribe M, Rodnin MV, Ghatak C, & Sharma O (2017). Cellular entry of the diphtheria toxin does not require the formation of the open-channel state by its translocation domain. Toxins, 9, 299. [DOI] [PMC free article] [PubMed] [Google Scholar]
- Ladokhin AS, & White SH (2004). Interfacial folding and membrane insertion of a designed helical peptide. Biochemistry, 43, 5782–5791. [DOI] [PubMed] [Google Scholar]
- Leber B, Lin J, & Andrews DW (2007). Embedded together: The life and death consequences of interaction of the Bcl-2 family with membranes. Apoptosis: An International Journal on Programmed Cell Death, 12, 897–911. [DOI] [PMC free article] [PubMed] [Google Scholar]
- Li J, Rodnin MV, Ladokhin AS, & Gross ML (2014). Hydrogen deuterium exchange and mass spectrometry reveal the pH-dependent conformational changes of diphtheria toxin t domain. Biochemistry, 53, 6849–6856. [DOI] [PMC free article] [PubMed] [Google Scholar]
- London E, & Ladokhin AS (2002). Measuring the depth of amino acid residues in membrane-inserted peptides by fluorescence quenching. Current Topics in Membranes, 52, 89–115. [Google Scholar]
- Matsuzaki K, Murase O, Fujii N, & Miyajima K (1995). Translocation of a channel-forming antimicrobial peptide, magainin 2, across lipid bilayers by forming a pore. Biochemistry, 34, 6521–6526. [DOI] [PubMed] [Google Scholar]
- May V, & Kühn O (2011). Excitation energy transfer, Charge and energy transfer dynamics in molecular systems (pp. 467–558). Wiley-VCH Verlag GmbH & Co. KGaA. [Google Scholar]
- McIntosh TJ, & Holloway PW (1987). Determination of the depth of bromine atoms in bilayers formed from bromolipid probes. Biochemistry, 26, 1783–1788. [DOI] [PubMed] [Google Scholar]
- Mindell JA, Silverman JA, Collier RJ, & Finkelstein A (1994a). Structure function relationships in diphtheria toxin channels. II. A residue responsible for the channel’s dependence on trans ph. The Journal of Membrane Biology, 137, 29–44. [DOI] [PubMed] [Google Scholar]
- Mindell JA, Silverman JA, Collier RJ, & Finkelstein A (1994b). Structure-function relationships in diphtheria toxin channels. III. Residues which affect the cis pH dependence of channel conductance. The Journal of Membrane Biology, 137, 45–57. [DOI] [PubMed] [Google Scholar]
- Montagner C, Perier A, Pichard S, Vernier G, Menez A, Gillet D, et al. (2007). Behavior of the n-terminal helices of the diphtheria toxin T domain during the successive steps of membrane interaction. Biochemistry, 46, 1878–1887. [DOI] [PubMed] [Google Scholar]
- Montgomery DC, & Peck EA (1982). Introduction to linear regression analysis. New York: Wiley. [Google Scholar]
- Murphy JR (2011). Mechanism of diphtheria toxin catalytic domain delivery to the eukaryotic cell cytosol and the cellular factors that directly participate in the process. Toxins, 3, 294. [DOI] [PMC free article] [PubMed] [Google Scholar]
- Neale EA (2003). Moving across membranes. Nature Structural Biology, 10, 2–3. [DOI] [PubMed] [Google Scholar]
- Neuman BW, Kiss G, Al-Mulla HM, Dokland T, Buchmeier MJ, Weikl T, et al. (2013). Direct observation of membrane insertion by enveloped virus matrix proteins by phosphate displacement. PLoS One, 8, e57916. [DOI] [PMC free article] [PubMed] [Google Scholar]
- Oh KJ, Altenbach C, Collier RJ, & Hubbell WL (2000). Site-directed spin labeling of proteins. Applications to diphtheria toxin. Methods in Molecular Biology, 145, 147–169. [DOI] [PubMed] [Google Scholar]
- Oh KJ, Senzel L, Collier RJ, & Finkelstein A (1999). Translocation of the catalytic domain of diphtheria toxin across planar phospholipid bilayers by its own T domain. Proceedings of the National Academy of Sciences of the United States of America, 96, 8467–8470. [DOI] [PMC free article] [PubMed] [Google Scholar]
- Oh KJ, Zhan H, Cui C, Hideg K, Collier RJ, & Hubbell WL (1996). Organization of diphtheria toxin T domain in bilayers: A site-directed spin labeling study. Science, 273, 810–812. [DOI] [PubMed] [Google Scholar]
- Palchevskyy SS, Posokhov YO, Olivier B, Popot J-L, Pucci B, & Ladokhin AS (2006). Chaperoning of insertion of membrane proteins into lipid bilayers by hemifluorinated surfactants: Application to diphtheria toxin. Biochemistry, 45, 2629–2635. [DOI] [PubMed] [Google Scholar]
- Perier A, Chassaing A, Raffestin S, Pichard S, Masella M, Menez A, et al. (2007). Concerted protonation of key histidines triggers membrane interaction of the diphtheria toxin t domain. The Journal of Biological Chemistry, 282, 24239–24245. [DOI] [PubMed] [Google Scholar]
- Posokhov YO, Gottlieb PA, & Ladokhin AS (2007). Quenching-enhanced fluorescence titration protocol for accurate determination of free energy of membrane binding. Analytical Biochemistry, 362, 290–292. [DOI] [PMC free article] [PubMed] [Google Scholar]
- Posokhov YO, & Ladokhin AS (2006). Lifetime fluorescence method for determining membrane topology of proteins. Analytical Biochemistry, 348, 87–93. [DOI] [PubMed] [Google Scholar]
- Posokhov YO, Rodnin MV, Das SK, Pucci B, & Ladokhin AS (2008). FCS study of the thermodynamics of membrane protein insertion into the lipid bilayer chaperoned by fluorinated surfactants. Biophysical Journal, 95, L54–L56. [DOI] [PMC free article] [PubMed] [Google Scholar]
- Posokhov YO, Rodnin MV, Lu L, & Ladokhin AS (2008). Membrane insertion pathway of annexin B12: Thermodynamic and kinetic characterization by fluorescence correlation spectroscopy and fluorescence quenching. Biochemistry, 47, 5078–5087. [DOI] [PubMed] [Google Scholar]
- Ren J, Kachel K, Kim H, Malenbaum SE, John R, Collier L, et al. (1999). Interaction of diphtheria toxin t domain with molten globule-like proteins and its implications for translocation. Science, 284, 955. [DOI] [PubMed] [Google Scholar]
- Reshetnyak YK, Segala M, Andreev OA, & Engelman DM (2007). A monomeric membrane peptide that lives in three worlds: In solution, attached to, and inserted across lipid bilayers. Biophysical Journal, 93, 2363–2372. [DOI] [PMC free article] [PubMed] [Google Scholar]
- Rhoades E, Ramlall TF, Webb WW, & Eliezer D (2006). Quantification of alpha-synuclein binding to lipid vesicles using fluorescence correlation spectroscopy. Biophysical Journal, 90, 4692–4700. [DOI] [PMC free article] [PubMed] [Google Scholar]
- Rodnin MV, Kyrychenko A, Kienker P, Sharma O, Posokhov YO, Collier RJ, et al. (2010). Conformational switching of the diphtheria toxin T domain. Journal of Molecular Biology, 402, 1–7. [DOI] [PMC free article] [PubMed] [Google Scholar]
- Rodnin MV, Kyrychenko A, Kienker P, Sharma O, Vargas-Uribe M, Collier RJ, et al. (2011). Replacement of c-terminal histidines uncouples membrane insertion and translocation in diphtheria toxin t-domain. Biophysical Journal, 101, L41–L43. [DOI] [PMC free article] [PubMed] [Google Scholar]
- Rodnin MV, Li J, Gross ML, & Ladokhin AS (2016). The pH-dependent trigger in diphtheria toxin T domain comes with a safety latch. Biophysical Journal, 111, 1946–1953. [DOI] [PMC free article] [PubMed] [Google Scholar]
- Rodnin MV, Posokhov YO, Contino-Pepin C, Brettmann J, Kyrychenko A, Palchevskyy SS, et al. (2008). Interactions of fluorinated surfactants with diphtheria toxin T-domain: Testing new media for studies of membrane proteins. Biophysical Journal, 94, 4348–4357. [DOI] [PMC free article] [PubMed] [Google Scholar]
- Rosconi MP, & London E (2002). Topography of helices 5–7 in membrane-inserted diphtheria toxin T domain: Identification and insertion boundaries of two hydrophobic sequences that do not form a stable transmembrane hairpin. The Journal of Biological Chemistry, 277, 16517–16527. [DOI] [PubMed] [Google Scholar]
- Rusu L, Gambhir A, McLaughlin S, & Radler J (2004). Fluorescence correlation spectroscopy studies of peptide and protein binding to phospholipid vesicles. Biophysical Journal, 87, 1044–1053. [DOI] [PMC free article] [PubMed] [Google Scholar]
- Schrader AM, & Han S (2017). Location of the tempo moiety of TEMPO-PC in lipid bilayers. Biophysical Journal, 113, 966–969. [DOI] [PMC free article] [PubMed] [Google Scholar]
- Senzel L, Gordon M, Blaustein RO, Oh KJ, Collier RJ, & Finkelstein A (2000). Topography of diphtheria toxin’s T domain in the open channel state. The Journal of General Physiology, 115, 421–434. [DOI] [PMC free article] [PubMed] [Google Scholar]
- Senzel L, Huynh PD, Jakes KS, Collier RJ, & Finkelstein A (1998). The diphtheria toxin channel-forming t domain translocates its own NH2-terminal region across planar bilayers. The Journal of General Physiology, 112, 317–324. [DOI] [PMC free article] [PubMed] [Google Scholar]
- Vargas-Uribe M, Rodnin MV, Kienker P, Finkelstein A, & Ladokhin AS (2013). Crucial role of H322 in folding of the diphtheria toxin T-domain into the open-channel state. Biochemistry, 52, 3457–3463. [DOI] [PMC free article] [PubMed] [Google Scholar]
- Vargas-Uribe M, Rodnin MV, & Ladokhin AS (2013). Comparison of membrane insertion pathways of the apoptotic regulator Bcl-xL and the diphtheria toxin translocation domain. Biochemistry, 52, 7901–7909. [DOI] [PMC free article] [PubMed] [Google Scholar]
- Vargas-Uribe M, Rodnin MV, Ojemalm K, Holgado A, Kyrychenko A, Nilsson I, et al. (2015). Thermodynamics of membrane insertion and refolding of the diphtheria toxin T-domain. The Journal of Membrane Biology, 248, 383–394. [DOI] [PMC free article] [PubMed] [Google Scholar]
- Vasquez-Montes V, Gerhart J, King KE, Thevenin D, & Ladokhin AS (2018). Comparison of lipid-dependent bilayer insertion of pHLIP and its p20g variant. Biochimica et Biophysica Acta, Biomembranes, 1860, 534–543. [DOI] [PMC free article] [PubMed] [Google Scholar]
- Vasquez-Montes V, Vargas-Uribe M, Pandey NK, Rodnin MV, Langen R, & Ladokhin AS (2019). Lipid-modulation of membrane insertion and refolding of the apoptotic inhibitor bcl-xl. Biochimica et Biophysica Acta. Proteins and Proteomics, 1867, 691–700. [DOI] [PMC free article] [PubMed] [Google Scholar]
- Wang Y, Malenbaum SE, Kachel K, Zhan HJ, Collier RJ, & London E (1997). Identification of shallow and deep membrane-penetrating forms of diphtheria toxin T domain that are regulated by protein concentration and bilayer width. The Journal of Biological Chemistry, 272, 25091–25098. [DOI] [PubMed] [Google Scholar]
- Wang J, Rosconi MP, & London E (2006). Topography of the hydrophilic helices of membrane-inserted diphtheria toxin T domain: TH1-TH3 as a hydrophilic tether. Biochemistry, 45, 8124–8134. [DOI] [PMC free article] [PubMed] [Google Scholar]
- Weiss MS, Blanke SR, Collier RJ, & Eisenberg D (1995). Structure of the isolated catalytic domain of diphtheria toxin. Biochemistry, 34, 773–781. [DOI] [PubMed] [Google Scholar]
- White SH, & Wimley WC (1998). Hydrophobic interactions of peptides with membrane interfaces. Biochimica et Biophysica Acta, 1376, 339–352. [DOI] [PubMed] [Google Scholar]
- White SH, Wimley WC, Ladokhin AS, & Hristova K (1998). Protein folding in membranes: Determining the energetics of peptide-bilayer interactions. Methods in Enzymology, 295, 62–87. [DOI] [PubMed] [Google Scholar]
- Wimley WC, & White SH (2000). Determining the membrane topology of peptides by fluorescence quenching. Biochemistry, 39, 161–170. [DOI] [PubMed] [Google Scholar]
- Youle RJ, & Strasser A (2008). The BCL-2 protein family: Opposing activities that mediate cell death. Nature Reviews Molecular Cell Biology, 9, 47–59. [DOI] [PubMed] [Google Scholar]
- Zakharov SD, & Cramer WA (2004). On the mechanism and pathway of colicin import across the e. coli outer membrane. Frontiers in Bioscience, 9, 1311–1317. [DOI] [PubMed] [Google Scholar]