Abstract
Vascular malformations are considered monogenic disorders that result in dysregulated vessel growth. Cerebral cavernous malformations (CCMs) arise due to inactivation of the endothelial CCM protein complex required to dampen MEKK3 activity1–4. Environmental factors explain differences in CCM natural history between individuals5, but why single CCMs often exhibit sudden, rapid growth culminating in stroke or seizure is unknown. Here we demonstrate that CCM growth requires increased PI3K-mTOR signaling and loss of CCM function. We identify PIK3CA gain of function (GOF) and CCM loss of function (LOF) somatic mutations in the same cells in a majority of human CCMs. Using mouse models, we show that CCM growth requires both PI3K GOF and CCM LOF in endothelial cells, and that both CCM LOF and increased expression of the transcription factor KLF4, a downstream MEKK3 effector, augment mTOR signaling in endothelial cells. Consistent with these findings, the mTORC1 inhibitor Rapamycin effectively blocks CCM formation in mouse models. We establish a three-hit mechanism analogous to cancer in which aggressive vascular malformations arise through the loss of vascular “suppressor genes” that constrain vessel growth and gain of a vascular “oncogene” that stimulates excess vessel growth. These findings suggest that aggressive CCMs may be treated using clinically approved mTORC1 inhibitors.
Introduction
Vascular malformations such as cerebral cavernous malformations (CCMs) that arise in the central nervous system are an important cause of stroke and disability in younger individuals6. Classic genetic studies have supported a monogenic basis for CCM disease associated with biallelic loss of function (LOF) mutations in three genes, KRIT1, CCM2, and PDCD10, that encode the components of a heterotrimeric CCM protein complex7,8. Mouse models have further revealed that deletion of any of the CCM genes in brain endothelial cells of neonatal mice confers CCM lesions due in part to increased MEKK3-KLF2/4 signaling1–4.
Serial imaging of human CCMs has revealed that most are slow-growing and clinically silent9. In contrast, those that cause stroke and seizure are typically fast-growing and associated with repeated lesional hemorrhage10,11. Such aggressive, symptomatic lesions are surgically resected if possible to prevent or treat associated neurologic complications, but surgery is associated with high morbidity and cost and is impractical for patients with multiple lesions or lesions in less surgically-accessible locations. Why a subset of CCM lesions exhibits rapid growth associated with clinical symptoms is unknown. The studies described below reveal that symptomatic CCM disease arises through a cancer-like paradigm in which the accumulation of multiple somatic mutations in the same cell results in both the loss of a vascular malformation suppressor gene (i.e. the CCM gene) and the gain of vascular malformation growth gene (i.e. PIK3CA).
Results
Mature mice form testicular cavernomas
CCMs arise in the angiogenic vascular beds of the neonatal retina and hindbrain following genetic endothelial cell deletion of Krit1, Ccm2 or Pdcd10 in mice2,12–15. Unlike human CCM lesions, however, CCMs do not form following endothelial gene deletion in adult mice (Ext. Data Fig. 1a–d and2,12,14). We administered tamoxifen to 2-month-old Cdh5-CreERT2;Krit1fl/fl (“Krit1iECKO”) animals, and examined all organs at 6 months. The vasculature of all organs appeared unchanged with the exception of the testis that appeared bloody and swollen (Ext. Data Fig. 1e). Histologic examination revealed testicular cavernomas like those in the brain (Ext. Data Fig. 1e vs. 1b and2,16). Molecular hallmarks of brain CCM include elevated expression of the KLF4 transcription factor and peri-vascular staining for DPEAAE, a marker of ADAMTS-cleaved versican1,2,17,18, both of which were detected in testicular cavernomas (Ext. Data Fig. 1f–h). Although no CCMs formed in the brain, immunostaining revealed elevated KLF4 levels in the brain endothelial cells of adult Krit1iECKO animals (Ext. Data Fig. 1f). Thus endothelial loss of KRIT1 in mature mice is sufficient to confer cavernous vascular malformations in the testis, but not in the brain, despite increased downstream MEKK3-KLF2/4 signaling at both sites.
PIK3CA GOF synergizes with CCM LOF in mice
Since testicular endothelial cells exhibit the highest rate of basal proliferation of those in all organs19, we hypothesized that CCM formation might require proliferative signals. GOF mutations in phosphatidylinositol-4,5-bisphosphate 3-kinase catalytic subunit alpha (PIK3CA) drive cell proliferation in cancer and confer venous and lymphatic malformations when they arise in endothelial cells20–25. To test whether genetic gain of PIK3CA function might augment CCM formation in vivo we used the Slco1c1(BAC)-CreERT2 transgene to drive expression of PIK3CA H1047R (using a R26-LSL-Pik3caH1047R allele, “iPik3caH1047R”) exclusively in brain endothelial cells5,26. To stringently test for interaction with CCM LOF, we used a Krit1fl/fl colony that fails to develop CCM lesions in neonatal mice following loss of KRIT1 alone due to the presence of a “resistant” gut microbiome that reduces basal MEKK3-KLF2/4 signaling5. Following tamoxifen administration at P1, we examined Slco1c1(BAC)-CreERT2;Kritfl/fl (“Krit1iBECKO”), Slco1c1(BAC)-CreERT2;iPik3caH1047R (“Pik3caiBECGOF”), and Krit1iBECKO;Pik3caiBECGOF littermates at P7 (Fig. 1a). Krit1iBECKO animals with a resistant microbiome failed to develop CCM lesions (Fig. 1b, c), while Pik3caiBECGOF animals developed small vascular lesions in both the hindbrain and forebrain (Fig. 1b, c). Visual and microCT analysis revealed a synergistic effect of CCM LOF and PIK3CA GOF on lesion formation in Krit1iBECKO;Pik3caiBECGOF double mutants (Fig. 1b, c). Hematoxylin-eosin staining of hindbrain sections revealed dilated, blood-filled post-capillary venules and veins in the white matter of P6 Pik3caiBECGOF animals, the site where CCM lesions also first arise (Ext. Data Fig. 2 and2). Endothelial loss of PTEN, a well-characterized inhibitor of PI3K signaling, similarly augmented CCM formation in a dose-dependent manner in neonatal animals (Ext. Data Fig. 3).
Figure 1. CCM LOF and PIK3CA GOF synergize during cavernous malformation in the neonatal brain and are both required for malformations in the adult brain.
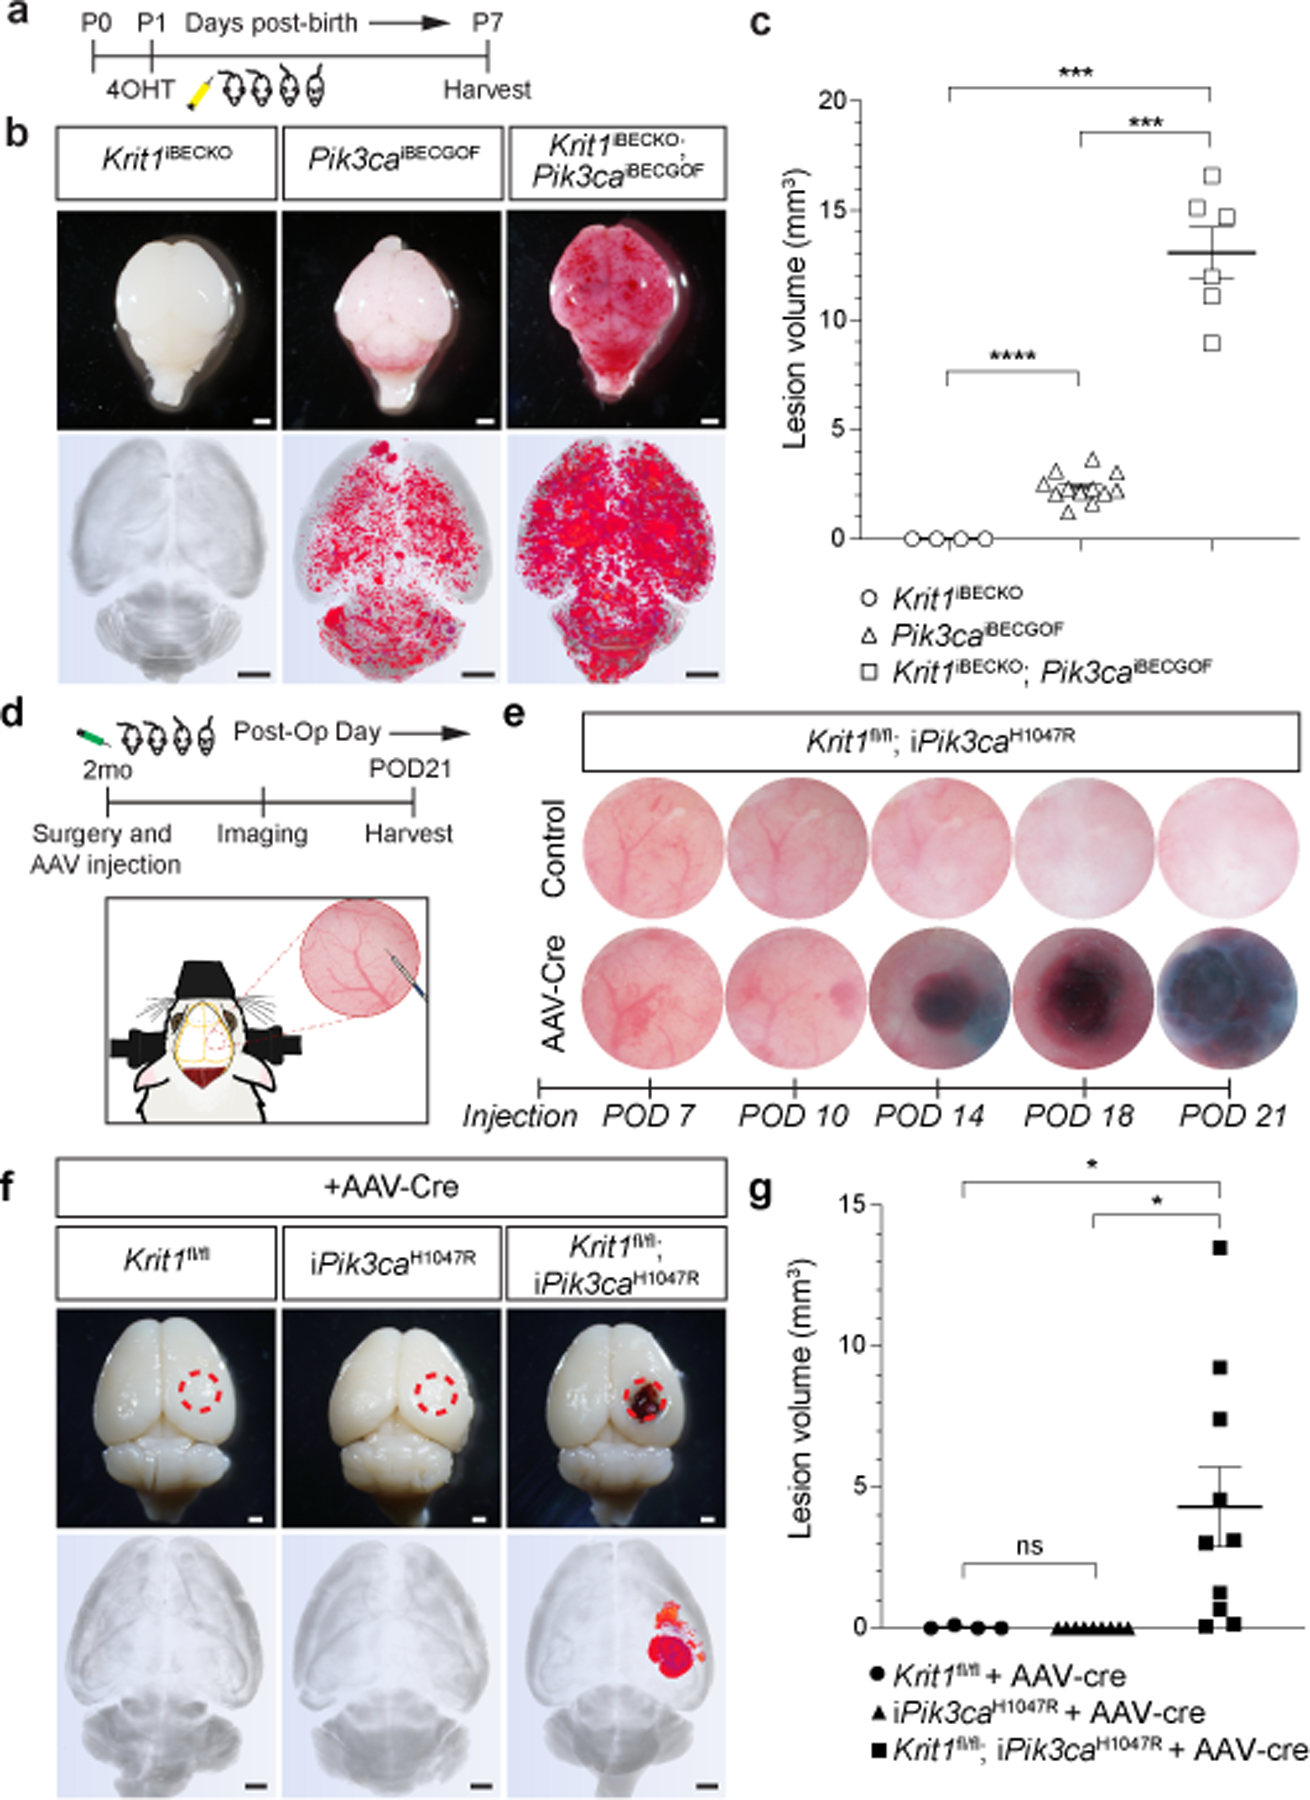
a, Schematic of neonatal induction of Krit1 deletion and/or PIK3CAH1047R expression. 4-hydroxytamoxifen (4OHT) injection at P1 was used to inducibly delete Krit1 (Krit1iBECKO), drive expression of PIK3CAH1047R (Pik3caiBECGOF) or both specifically in the brain endothelial cells of mice carrying a resistant gut microbiome. b, Representative visual and microCT images of the indicated P7 brains. Note that loss of KRIT1 alone is not sufficient for CCM formation in animals with a resistant microbiome. Scale bars, 1mm. c, MicroCT quantitation of lesion volumes at P7. (Krit1iBECKO, n=4; Pik3caiBECGOF, n=12; Krit1iBECKO;Pik3caiBECGOF , n=6). Indicated p-values are: p=0.0002; p=0.0001; p=8e−8 (top to bottom). d, Schematic and diagram of the experimental approach in which a cranial window is created and AAV virus injected into the brains of 2 month old mice with serial imaging on indicated post-operative days (POD). e, Serial images obtained through the same cranial window of Krit1fl/fl;iPik3caH1047R animals following injection of control or Cre-expressing AAV vectors. Cranial window images representative of 4 animals/group. f, Representative visual and microCT images of brains harvested 21 days after injection of AAV-Cre into adult animals with the indicated genotypes. iPik3caH1047R designation includes iPik3caH1047R and/or Krit1fl/+;iPik3caH1047R genotypes. Dotted circles indicate the site of cranial window and AAV-Cre injection. Scale bars, 1mm. g, MicroCT quantitation of lesion volumes 21 days after injection of AAV-Cre. (Krit1fl/fl, n=4; iPik3caH1047R, n=9; Krit1fl/fl;iPik3caH1047R, n=10). Indicated p-values are: p=0.0144; p=0.0140; p=0.4174 (top to bottom). Data are mean ± s.e.m. Unpaired, two-tailed Welch’s t-test. ns indicates p not significant, p>0.05; *indicates p<0.05; ***indicates p<0.001; ****indicates p<0.0001.
The findings described above suggested that, in addition to CCM LOF, CCM formation might require a threshold level of endothelial PI3K activity that is lacking in the adult brain. To test this hypothesis we first attempted to induce PIK3CA GOF and CCM LOF in the brain endothelial cells of adult mice using the Slco1c1(BAC)-CreERT2 transgene. However, lethal spontaneous neurologic symptoms associated with large single lesions were observed in Slco1c1(BAC)-CreERT2;Krit1fl/fl;iPik3caH1047R animals, but not single mutant littermates, in the absence of tamoxifen administration (Ext. Data Fig. 4a–e). Cre reporter expression revealed leaky Cre activity that was 99% restricted to the vascular endothelial cell population (Ext. Data Fig. 4f, g). These studies revealed that Cre-mediated recombination is sufficient for lesion formation in older animals only if it results in both PIK3CA GOF and CCM LOF, and that this synergy is mediated by interaction within or between endothelial cells.
To more rigorously test synergy in adult animals we next created cranial windows through which to directly inject viral AAV vector encoding Cre recombinase into the brains of Krit1fl/fl, Krit1fl/+;iPik3caH1047R, and Krit1fl/fl;iPik3caH1047R littermates at age 2 months (Fig. 1d–g and Ext. Data Fig. 5a–c). Cre reporter expression revealed Cre activity in both endothelial and neuronal cells following direct injection (Ext. Data Fig. 6). AAV-Cre injection into Krit1fl/fl or Krit1fl/+;iPik3caH1047R animals failed to induce lesion formation at 21 days. In contrast, injection into Krit1fl/fl;iPik3caH1047R animals resulted in the formation of large cavernomas at the site of injection that exhibited a classic “mulberry-like” appearance and peri-lesional iron deposition characteristic of human CCMs27 (Fig. 1e–g and Ext. Data Fig. 5b–d). These studies demonstrate that neither CCM LOF nor PIK3CA GOF alone is sufficient for lesion formation in the mature brain, but that the combination of the two results in the rapid formation of CCM lesions.
PIK3CA and CCM mutations in human CCMs
To determine whether human CCM lesions harbor mutations in PIK3CA or other cell proliferation genes, we sequenced 79 surgically resected CCM lesions on a panel of 66 genes including the CCM genes and PIK3CA. Lesions were classified as “familial”, “sporadic” or “unknown” based on genetic and clinical evidence. 68 surgically resected human brain arteriovenous malformations (bAVMs) served as a control set to determine if somatic mutations identified were unique to CCMs. We identified GOF PIK3CA somatic mutations in 56/79 (71%) CCMs and 0/68 bAVMs (Fig. 2a, b and Supplementary Table 1). Mutations in PIK3CA were present in both familial (14/21) and sporadic (12/15) CCMs (Fig. 2a, b) at <20% allele frequency (Ext. Data Fig. 7a). All PIK3CA mutations occurred at known hotspots in the catalogue of somatic mutations in cancer (COSMIC), and activate PI3K signaling28 (Fig. 2c).
Figure 2. GOF PIK3CA mutations and LOF CCM gene mutations co-exist in the same cell in human CCMs.
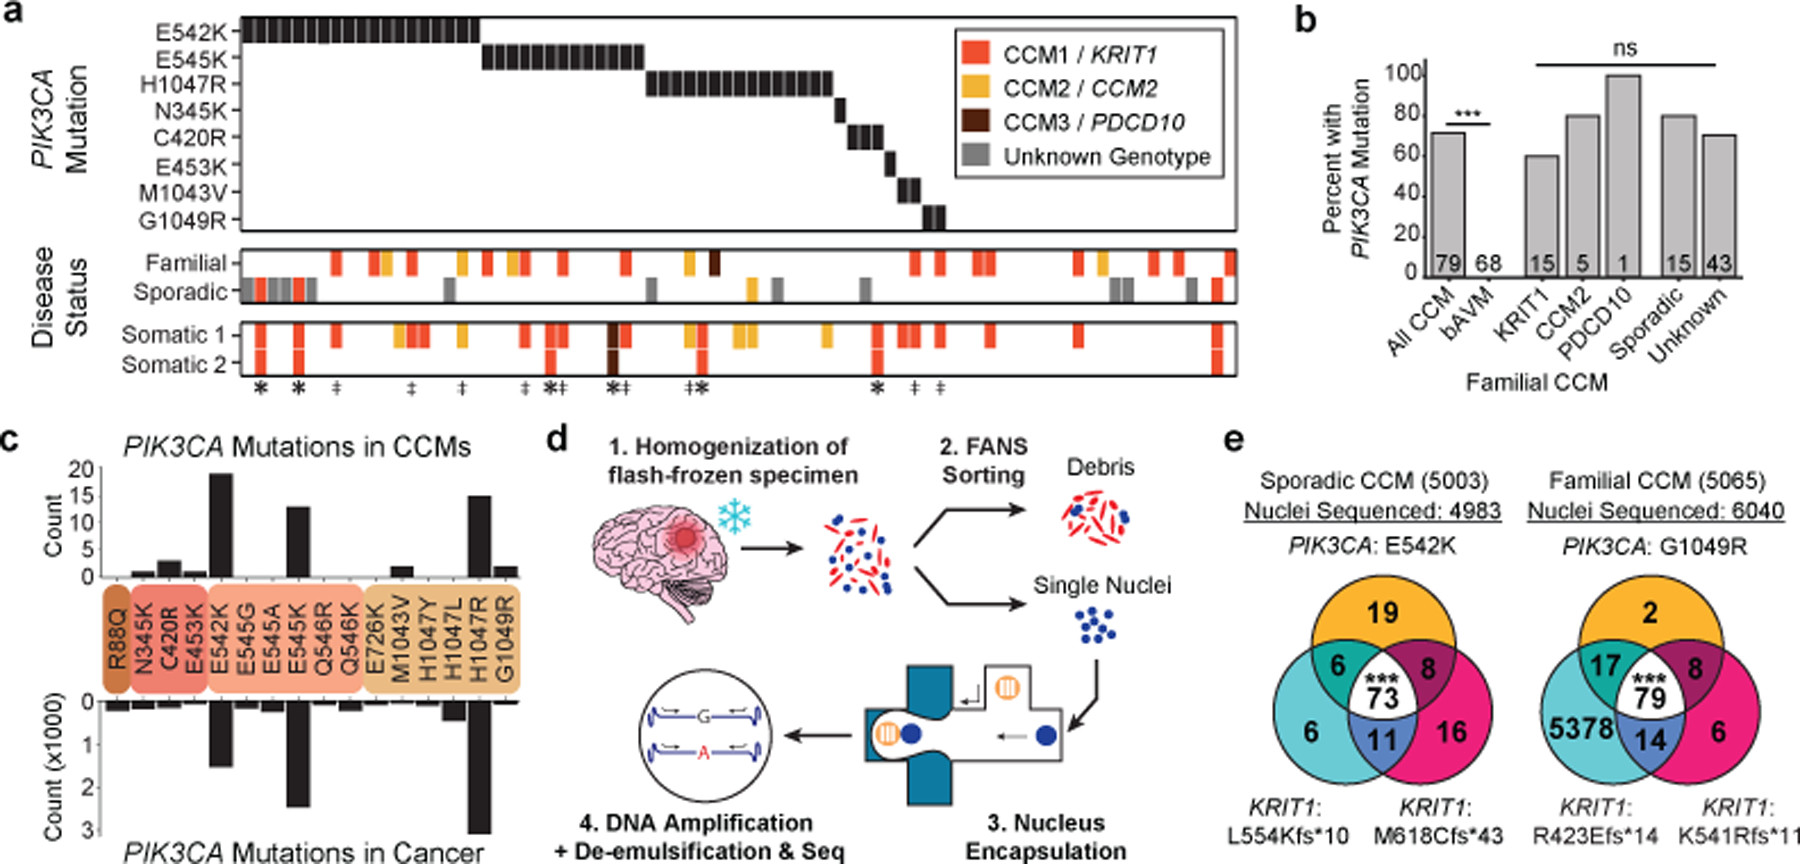
a, A schematic summary of the somatic PIK3CA mutations, the germline mutations in KRIT1, CCM2 and PDCD10, and the somatic mutations in KRIT1, CCM2 and PDCD10 as identified in 79 human CCMs via bulk sequencing of frozen resected tissue is shown. Color denotes the affected CCM gene. Samples listed as neither familial nor sporadic are deidentified banked CCMs lacking either clinical information or genetic evidence supporting either classification. ‡ indicates familial CCMs with an activating mutation in PIK3CA and both germline and somatic mutations in a CCM gene. indicates known or presumed sporadic CCMs with an activating mutation in PIK3CA and two somatic mutations in a CCM gene. b, Percentage of lesions with an activating mutation in PIK3CA present in all sequenced CCMs vs. control brain AVMs, all three forms of familial CCMs and sporadic CCMs. The value inside the bar shows the number of samples in the corresponding group. c, The distributions of the 16 most common somatic PIK3CA mutations identified in human CCMs (top) and cancer (bottom) as reported in the COSMIC database are shown. Colored boxes represent domains in PIK3CA in order from left to right: Adaptor BD, RAS BD, C2, Kinase. d, Schematic of workflow for processing frozen surgically-resected human CCM lesions for single-nucleus DNA sequencing. e, Representative data for sporadic and familial CCMs detailing the number of nuclei with each combination of PIK3CA and CCM mutations. p was determined by two-tailed chi-squared test between the observed and expected triple mutant nuclei predicted by a Poisson distribution (see Methods). ns indicates p not significant, p>0.05; ***indicates p<1e−16.
Consistent with prior studies29–31, somatic mutations in CCM genes were identified in 24/79 (30%) of CCM lesions. Three distinct genetic hits (two CCM alleles and one PIK3CA allele) were detected in 9 samples of familial CCM (‡ on Fig. 2a) and 6 samples of presumed sporadic CCM (* on Fig. 2a), indicating that no fewer than three independent somatic mutation events occurred in these lesions.
To determine whether the PIK3CA and CCM gene somatic mutations arise in the same cell in human CCMs, we next performed single-nucleus DNA sequencing (snDNA-seq) on 3 sporadic and 2 familial CCMs. Nuclei isolated from frozen tissue were sorted, and partitioned into microfluidic droplets from which the KRIT1, CCM2, PDCD10, and PIK3CA exons were amplified (Fig. 2d and Ext. Data Fig. 7b–e). snDNA-seq of sporadic CCMs (5003, 5038, and 5079) and familial CCMs (5065 and 5073) revealed that the majority of mutant nuclei harbored all identified CCM and PIK3CA somatic mutations (Fig. 2e and Ext. Data Fig. 7f). A smaller number of nuclei showed each of the possible genotype combinations (Ext. Data Fig. 7f), consistent with allelic dropout (ADO), a common technical artifact in single-nucleus/cell DNA sequencing data32. By comparing the ratio of heterozygous to homozygous nuclei for informative SNPs in our samples, we estimate the rate of ADO to be 8.4% ± 4.1%. Despite this confounder, snDNA-seq reveals that PIK3CA and CCM gene somatic mutations arise in the same cell in human CCMs.
CCM LOF and PIK3CA GOF activate mTOR
A primary mechanism by which loss of CCM function promotes lesion formation is through gain of MEKK3 activity and increased expression of the KLF2 and KLF4 transcription factors in endothelial cells1,2,17,33. Since either CCM LOF or PIK3CA GOF alone is sufficient to drive formation of dilated venous vessels of the white matter (Ext. Data Fig. 2), we first addressed whether PIK3CA GOF might also induce an increase in KLF2 and KLF4 expression in neonatal brain endothelial cells (Ext. Data Fig. 8a). Consistent with prior studies, immunostaining of lesional endothelium and qPCR analysis of brain endothelial cells isolated from P6 Krit1BECKO animals with a susceptible gut microbiome exhibited high KLF4 protein and Klf4 mRNA expression (Ext. Data Fig. 8b, c). In contrast, the endothelial cells lining vascular lesions or isolated from P6 Pik3caiBECGOF hindbrains did not express elevated levels of KLF4 protein or mRNA (Ext. Data Fig. 8b, c). Similarly, while knockdown of CCM genes in cultured human umbilical vein endothelial cells (HUVECs) conferred an increase in KLF2 and KLF4 gene expression, expression of PIK3CA H1047R did not (Ext. Data Fig. 8d and1,2). These studies suggest that PI3K signaling is unlikely to act upstream of the MEKK3-KLF2/4 pathway.
We next assessed whether the two pathways might intersect at the level of PI3K and/or mTORC1 signaling. mTORC1 activity results in phosphorylation of ribosomal protein S6 (S6). Consistent with PI3K GOF, neonatal Pik3caiBECGOF brain sections exhibited high phospho-S6 levels in endothelial cells lining venous lesions (Fig. 3a). Strikingly, elevated phospho-S6 levels were also detected in the endothelial cells lining CCM lesions in the white matter of P6 Krit1BECKO brains (Fig. 3a). Immunoblotting of cell lysate from P6 Krit1BECKO and control brain endothelial cells confirmed elevated S6 phosphorylation at Ser235/236 and Ser240/244 in KRIT1-deficient brain endothelial cells (Fig. 3b, c). siRNA-mediated CCM LOF in HUVECs conferred similar increases in phospho-S6 (Fig. 3d, e). In contrast to phospho-S6, significant changes in phospho-AKT were not detected in P6 Krit1BECKO brain endothelial cells or cultured endothelial cells exposed to KRIT1 siRNA (Fig. 3b–e). These studies reveal that CCM LOF augments mTORC1 activity in endothelial cells both in vivo and ex vivo.
Figure 3. Endothelial CCM LOF augments PI3K-mTORC1 signaling through KLF4.
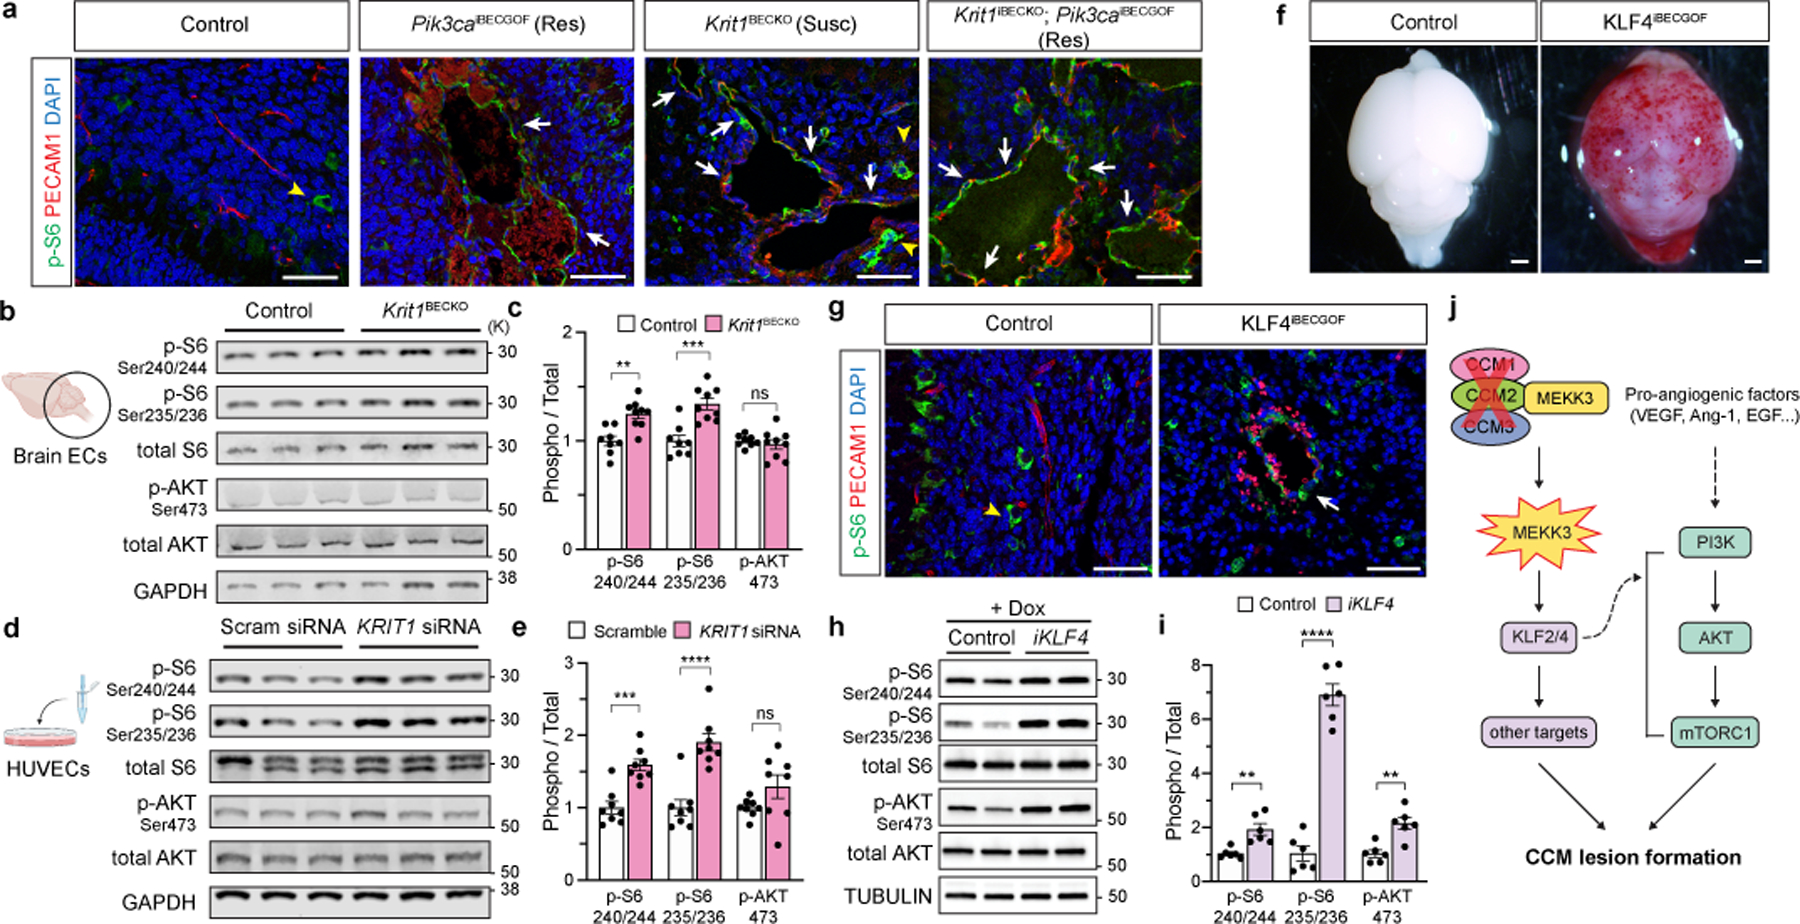
a, Immunostaining for phospho-S6 ribosomal protein (p-S6) and endothelial cell (EC) marker PECAM1 in P6 hindbrain sections with a resistant (Res) or susceptible (Susc) microbiome. White arrows indicate p-S6 positive ECs, yellow arrowheads indicate non-endothelial p-S6 positive cells in a and g. Scale bars, 50 microns. b, Immunoblot detection of phospho-AKT (p-AKT) and p-S6 in ECs from the hindbrains of P6 control and Krit1BECKO littermates. GAPDH loading control. c, Quantitation of immunoblotting for p-AKT and p-S6 relative to total AKT and S6 protein. (n=8 hindbrains/group) Indicated p-values are: p=0.0010; p=0.0003; p=0.5205 (left to right). d, Immunoblot detection of p-AKT and p-S6 in cultured HUVECs treated with scrambled or KRIT1 siRNAs. e, Quantitation of immunoblotting for p-AKT and p-S6 relative to total AKT and S6 protein. (n=8 individual wells/group over 4 independent experiments). Indicated p-values are: p=0.0002; p=7e−6; p=0.1208 (left to right). f, Visual images of P6 control and KLF4iBECGOF littermates. Images representative of 8 animals/group. Scale bars, 1mm. g, Immunostaining for p-S6 and PECAM1 in hindbrain sections from P6 control and KLF4iBECGOF littermates. Scale bars, 50 microns. h, Immunoblot detection of p-AKT and p-S6 in HUVECs with expression of KLF4-GFP (“iKLF4” cells) or control lentivirus. Tubulin loading control. i, Quantitation of immunoblotting for p-AKT and p-S6 relative to total AKT and S6 in control and iKLF4 HUVECs. (n=6 individual wells/group over 3 independent experiments). p=0.0067; p=9e−7; p=0.0022 (left to right). j, Pathway schematic of how gain of CCM-MEKK3-KLF2/4 signaling is proposed to augment PI3K-mTORC1 signaling to drive CCM formation. Immunofluorescence in a and g representative of 10 tissue sections from n=4 individual animals/genotype. Data are mean ± s.e.m. Unpaired, two-tailed Welch’s t-test. ns indicates p not significant, p>0.05; **indicates p<0.01; ***indicates p<0.001; ****indicates p<0.0001. For gel source data, see Supplementary Figure 1.
KLF4 augments EC PI3K-mTOR signaling
Prior studies have identified increased brain endothelial expression of KLF4 as a causal downstream effector mechanism of CCM formation in vivo1,2,17. To further elucidate the relationship between CCM LOF and PI3K-mTOR signaling, we next induced KLF4 expression in Slco1c1(BAC)-Cre; R26-LSL-rtTA;tetO-KLF4 (“KLF4iBECGOF”) animals by doxycycline administration starting at P1 (Ext. Data Fig. 9a, b). Induction of KLF4 expression resulted in the formation of vascular lesions associated with peri-lesional hemorrhage by P6 (Fig. 3f and Ext. Data Fig. 9b, c). Like those conferred by CCM LOF or PIK3CA GOF, lesions in KLF4iBECGOF animals arose primarily in the veins and post-capillary venules of the white matter (Ext. Data Fig. 9c). Immunostaining revealed elevated endothelial phospho-S6 in KLF4iBECGOF animals (Fig. 3g and Ext. Data Fig. 9d), a finding similar to that observed in Krit1BECKO animals (Fig. 3a). Expression of a KLF4-GFP fusion protein in HUVECs using a tetracycline-inducible lentivirus conferred increased levels of the known KLF4 target gene eNOS as well as both phospho-S6 and phospho-AKT (Fig. 3h, i and Ext. Data Fig. 9e). Thus increased expression of the causal downstream CCM effector KLF4 is sufficient to confer white matter venous lesions like those conferred by either CCM LOF or PI3K GOF in association with increased PI3K-mTORC1 signaling (Fig. 3j). Importantly, these studies do not exclude PI3K-independent mechanisms by which CCM LOF may also synergize with PI3K GOF.
Rapamycin prevents CCM formation in mice
The findings that PIK3CA GOF supports CCM formation in both adult mice and humans and that both CCM LOF and KLF4 GOF increase endothelial cell phospho-S6 suggested that increased mTOR activity may be required for CCM formation. Rapamycin (aka Sirolimus) is an FDA-approved mTORC1 inhibitor that is an effective therapy for venous and lymphatic malformations that arise due to PIK3CA GOF mutations20–25 identical to those we identified in human CCM lesions (Fig. 2). We therefore tested the ability of Rapamycin to prevent CCM formation in mice. Krit1 was constitutively deleted in the brain endothelial cells of neonatal Krit1BECKO animals with a susceptible microbiome, a single Rapamycin dose (50 micrograms) administered at P2, and CCM lesions assessed at P10 (Fig. 4a). Single dose rapamycin treatment reduced lesion formation in the neonatal model by approximately 75% compared with vehicle alone (P<0.001, Fig. 4b, c). To test its effect on CCM lesions that arise due to compound CCM LOF mutations and PIK3CA GOF mutations like those identified in resected human lesions, Rapamycin was administered daily at either low dose (100 micrograms) or high dose (400 micrograms) starting 7 days after cranial window surgery and viral Cre injection in the adult model (Fig. 4d), a timepoint that coincides with the earliest visual lesion detection of CCM lesions (Ext. Data Fig. 5). Rapamycin treatment virtually ablated CCM growth using either low or high dose treatments (Fig. 4e, f and Ext. Data Fig. 10a–d). Consistent with a downstream mechanism of action, Rapamycin treatment ablated the rise in phospho-S6 but not the rise in KLF4 in Krit1BECKO brain endothelial cells (Ext. Data Fig. 10e–g) and reduced lesion volume by approximately 68% in KLF4iBECGOF animals (Fig. 4g–i). These concordant findings (i) are consistent with a mechanism in which S6 activation is downstream of MEKK3-KLF2/4 signaling (Fig. 3j), (ii) support a central role for mTOR signaling in CCM pathogenesis, and (iii) identify Rapamycin as a potentially powerful and available drug to treat CCM disease.
Figure 4. Rapamycin prevents lesion formation due to CCM LOF and KLF4 GOF in neonatal and adult mice.
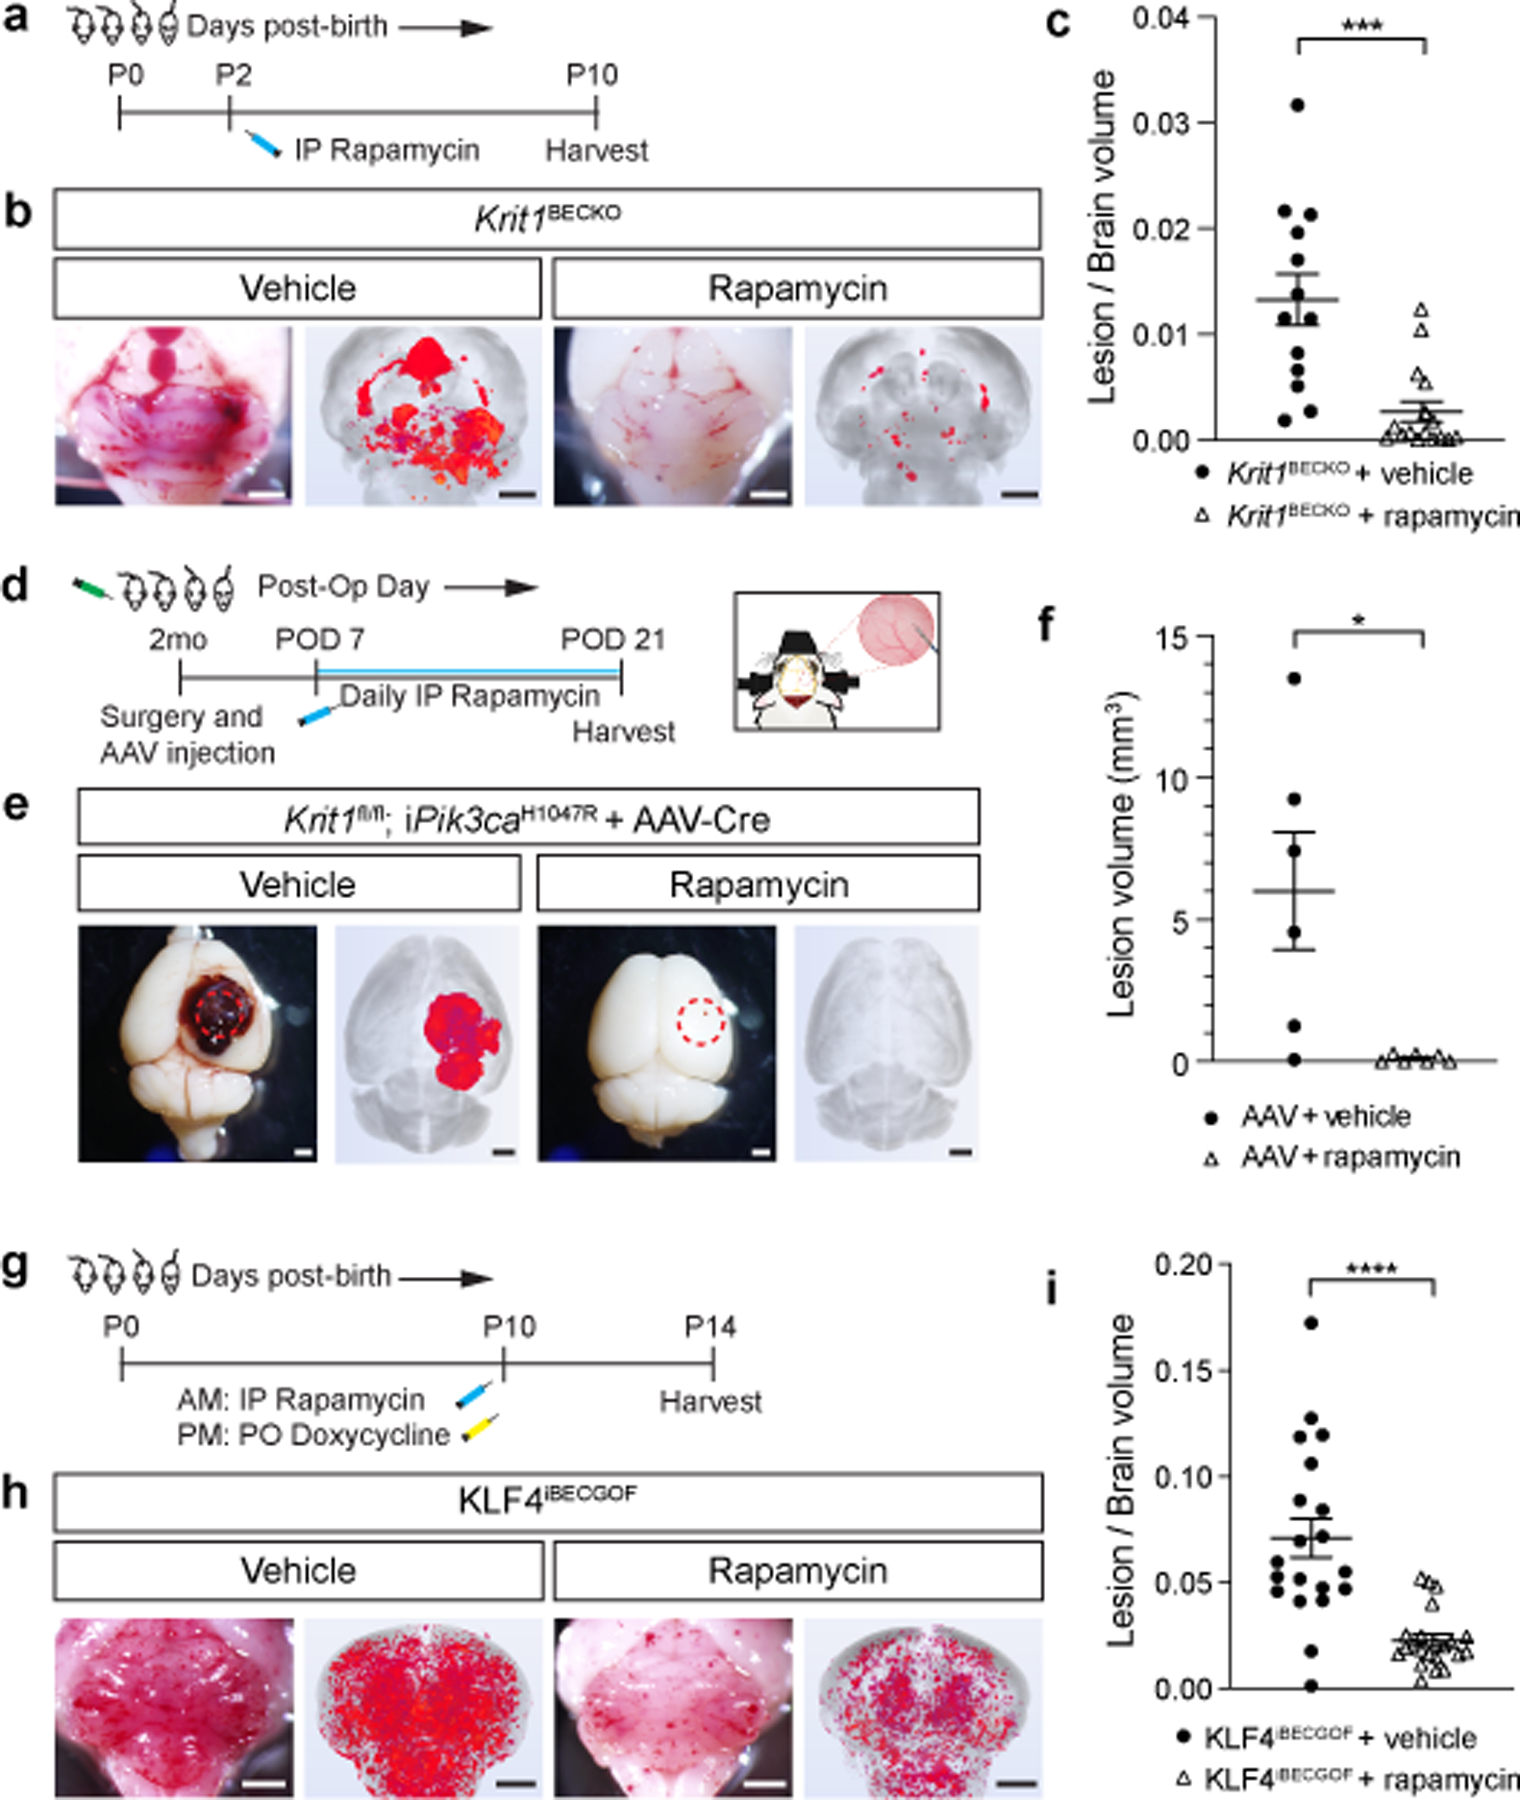
a, Schematic of neonatal Krit1BECKO animals with a susceptible microbiome administered a single dose treatment with Rapamycin or vehicle on P2. b, Representative visual and microCT images of the hindbrains of littermates treated with either vehicle or Rapamycin. Scale bars, 1mm. c, MicroCT quantitation of lesion volumes normalized to total brain volume following treatment with vehicle or Rapamycin. (Vehicle, n=13; Rapamycin, n=16). p=0.0009. d, Experimental design for Rapamycin or vehicle treatment of adult animals with combined CCM LOF and PIK3CA GOF (Krit1fl/fl;iPik3caH1047R) using cranial window surgery and AAV injection is shown. e, Representative visual and microCT images of brains harvested 21 days after injection of AAV-Cre into littermate animals. Dotted circles indicate the site of cranial window and AAV-Cre injection. Scale bars, 1mm. f, MicroCT quantitation of lesion volumes 21 days after creation of the cranial window and injection of AAV-Cre is shown. (Vehicle, n=6; Rapamycin, n=7). p=0.0358. g, Schematic of neonatal KLF4iBECGOF animals administered a single dose treatment with Rapamycin or vehicle followed by induction of KLF4 expression on P10. h, Representative visual and microCT images of the hindbrains of littermates treated with either vehicle or Rapamycin. Scale bars, 1mm. i, MicroCT quantitation of lesion volumes normalized to total brain volume following treatment of the indicated mice with vehicle or Rapamycin. (Vehicle, n=20; Rapamycin, n=22). p=4e−5. Data are mean ± s.e.m. Unpaired, two-tailed Welch’s t-test. *indicates p<0.05; ***indicates p<0.001; ****indicates p<0.0001.
Discussion
The most significant conceptual advance of this study is the discovery of a compound genetic mechanism of vascular malformation pathogenesis. While vascular malformations have been considered monogenic in origin, our studies identify a digenic, “triple-hit” mechanism involving the acquisition of as many as three distinct genetic mutations that culminate in CCM LOF and PIK3CA GOF as the basis for rapidly growing, clinically symptomatic CCMs. By analogy to cancer, the CCM genes may be considered vascular “suppressor genes”, required to constrain vessel growth, while PIK3CA may be considered a vascular “oncogene”, capable of driving excess vascular growth. As in cancer, the combined loss of a vascular suppressor and gain of a vascular activator is a potent combination that culminates in aggressive, symptomatic disease.
A clinical clue to the pathogenesis of human CCM disease that may be explained by our findings is the observation that sporadic CCMs frequently arise at sites of pre-existing developmental venous anomalies (DVAs) (24–32% assessed by MRI, and up to 100% in one surgical assessment11,34). DVA is found in a majority of individuals with Cowden syndrome, an inherited disease caused by germline heterozygous LOF mutations in PTEN that confer gain of PI3K function35. A parsimonious explanation for these observations is that endothelial cells with pre-existing PIK3CA mutations sufficient to confer DVA subsequently acquire CCM LOF mutations and transform into more aggressive sporadic CCM lesions. While such a molecular pathogenesis remains entirely speculative until DVA genetic sequencing is performed, it would support a mechanism highly analogous to cancer in which accrued mutations convert a benign vascular abnormality into a more malignant one.
Immediately translatable findings of this study are that PIK3CA GOF plays a causal role in the growth of clinically symptomatic, aggressive CCM lesions, and that mTORC1 inhibition using an approved drug may slow or arrest this growth. Although aggressive CCM lesions are relatively rare, they account for virtually all of the strokes and neurologic symptoms associated with this disease and they can presently only be treated by surgical resection. Sirolimus has recently been used successfully to treat lymphatic and venous/slow flow vascular malformations that are associated with identical PIK3CA GOF mutations36–38, and newer agents directly targeting PIK3CA itself have also been found to be effective for treatment of inoperable vascular malformations associated with PIK3CA GOF mutations39. It is reasonable to predict that such drugs will also be effective for treatment of aggressive CCM lesions.
Methods
Mice
Cdh5-CreERT240, Slco1c1(BAC)-Cre41 Slco1c1(BAC)-CreERT241, Pdgfb-CreERT2,42 Krit1fl/fl43, tetOn-KLF444, and Ptenfl/fl45 animals have been previously described. R26-nTnG (JAX #023035), R26-LSL-Pik3caH1047R (JAX#016977 and46) animals were obtained from the Jackson Laboratories. R26-CAGs-LSL-rtTA3 mice (JAX#029617) were generously provided by Lukas Dow. All experimental animals were maintained on a mixed-strain background and littermate controls were used for neonatal experiments unless otherwise indicated. Breeding pairs between 2 and 8 months of age were used to generate the neonatal CCM mouse model of the indicated genotypes. Sample size was determined by prior studies using similar animals and techniques.
For all neonatal CCM experiments utilizing the Cdh5-CreERT2;Krit1fl/fl (“Krit1iECKO”), Slco1c1(BAC)-CreERT2;Krit1fl/fl (“Krit1iBECKO”), Slco1c1(BAC)-Cre;Krit1fl/fl (“Krit1BECKO”) models, P1 pups were injected intra-gastrically by a 30-gauge needle with 40 μg of 4-hydroxytamoxifen (4OHT, Sigma Aldrich, H7904) dissolved in 9% ethanol/corn oil vehicle (50 μl total volume per injection). The solution was freshly prepared from pre-measured, 4OHT powder for every injection. The P1 time point was defined by checking experimental breeding pairs every evening for new litters. The following morning (P1), pups were injected with 4OHT in a blinded fashion without knowledge of genotypes. Pups were then harvested, as previously described2, at specified time points.
For adult CCM deletion experiments utilizing littermate Cdh5-CreERT2;Krit1fl/fl (“Krit1iECKO”) animals, tamoxifen (Sigma Aldrich, T564) was dissolved in a 100% corn oil vehicle. The solution was freshly prepared for every gavage. Male mice were given 3mg tamoxifen via gavage beginning at two months of age, twice a week for three weeks, for a total of six gavages, then placed on tamoxifen chow diet (Envigo, TD.160410) until harvested at six months of age.
For craniotomy experiments, adult mice of the genotypes Krit1fl/fl, Krit1fl/+;R26-LSL-Pik3caH1047R, or Krit1fl/fl; R26-LSL-Pik3caH1047R of either gender, between 6–10 weeks of age were used.
For KLF4 GOF experiments utilizing Slco1c1(BAC)-Cre; R26-LSL-rtTA;tetO-KLF4 (“KLF4iBECGOF”) animals, P1 pups were intra-gastrically injected by a 31G insulin syringe with 200 μg of doxycycline (Sigma-Aldrich, D9891) dissolved in PBS (20 μl total volume per injection). Pups were harvested at P6 unless otherwise indicated.
All mice were housed in individual, ventilated cages with 12-hr light/dark cycles with food and water ad libitum. All animals were housed in a pathogen-free environment in an AAALAC-approved vivarium at the University of Pennsylvania, and experiments were performed in accordance with the guidelines of the Institutional Animal Care and Use Committee (IACUC).
Histology, immunohistochemistry and quantification
Mice were anesthetized with IP injection of tribromoethanol (Avertin), followed by intracardial perfusion with 20mL of cold PBS and 4% (w/v) paraformaldehyde (PFA) in PBS (pH 7.4) for adult mice and 10ml respectively for neonates. Tissue samples were fixed in 4% PFA/PBS overnight at 4°C, dehydrated to 100% ethanol, and embedded in paraffin. Tissue sections of 6 μm underwent dewaxing and rehydration through xylene and ethanol treatment and were subsequently used for haematoxylin and eosin (H-E) and immunohistochemistry staining. For immunodetection, 10mM citrate buffer (pH 6) (Sigma - C9999) was used for antigen retrieval, and sections were blocked with 10% donkey serum in 1% BSA prior to primary antibody treatment overnight at 4°C. The following primary antibodies were used for immunostaining: rat anti-PECAM1/CD31 (1:200; HistoBioTec, DIA-310), goat anti-KLF4 (1:100; R&D Systems, AF3158), goat anti-GFP (1:100; Rockland Immunochemicals, 600–101-215), rabbit anti-ERG (1:100; Abcam, ab110639) , rabbit anti-phospho-S6 (1:200, Cell Signaling Technologies, 4858S). Fluorescence-conjugated Alexa Fluor secondary antibodies were used (1:500, Invitrogen) according to the primary antibody species and counterstained with DAPI (1:1000). Secondary antibodies were validated for non-specific staining by no primary antibody negative controls.
Control and experimental animal sections were stained at the same time under identical conditions. Sections were mounted on slides with ProLong Gold Antifade reagent. Images were acquired on a Nikon 80i Eclipse, an Olympus DP80 microscope, and/or Zeiss LSM 710 or Zeiss 880 Confocal microscope at the same exposure times, using x4, x10, x20, and x40 objectives, and subsequently processed in ImageJ software (NIH).
Quantification for the R26-nTnG leak experiment was done by counting the number of nGFP-positive, ERG-positive endothelial over total number of ERG-positive cells present within a lesion. 20 random 800um x 800um -fields, from three unique individual animals were assessed.
Isolation of cerebellar endothelial cells
At the specified time points, cerebellar endothelial cells were isolated by mechanical and enzymatic digestion followed by separation using magnetic-activated cell sorting by anti-CD31/PECAM1-conjugated magnetic beads (MACS MS system, Miltenyi Biotec), as previously described2.
siRNA knockdown and lentiviral expression in cultured endothelial cells
Cell culture: Pooled human umbilical vein endothelial cells (HUVECs) were purchased from Lonza (#CC- 5 2519) and cultured in endothelial basal medium (EBM, Lonza) supplemented with hydrocortisone (1μg/ml), bovine brain extract (12 μg/ml), gentamicin (50 μg/ml), human recombinant epidermal growth factor (10 ng/ml), and 10% fetal bovine serum (FBS, Life Technologies). HUVECs were tested negative for mycoplasma and cultured until the fourth passage. Cells were maintained at 37 °C in a humidified atmosphere with 5% CO2.
siRNAs directed against KRIT1 (s2510, Invitrogen) were used for the knockdown experiments at a concentration of 10nM. For overexpression studies, HUVECs were infected with a control lentivirus encoding either GFP, or mutant human PIK3CA with the H1047R mutation (constructed from pBabe puro HA PIK3CA H1047R from Jean Zhao (Addgene plasmid # 12524). Cells were harvested 48 hours post-infection or post-transfection and total RNA was isolated using TRIzol Reagent (Life Technologies). cDNA was generated from 500ng total RNA using the SuperScript IV VILO Master Mix (Thermo Fisher, 11756050) and real time qPCR was performed using Power SYBR Green PCR Master Mix (Applied Biosciences). Protein was harvested with RIPA buffer with complete protease inhibitor cocktail (Roche) and PhosSTOP phosphatase inhibitor cocktail (Roche).
Human primers:
GAPDH forward: 5’-CTGGGCTACACTGAGCACC-3’
GAPDH reverse: 5’-AAGTGGTCGTTGAGGGCAATG-3’
KLF2 forward: 5ʹ-CTACACCAAGAGTTCGCATCTG-3ʹ
KLF2 reverse: 5ʹ-CCGTGTGCTTTCGGTAGTG-3ʹ
KLF4 forward: 5ʹ-AGAGTTCCCATCTCAAGGCA -3ʹ
KLF4 reverse: 5ʹ-GTCAGTTCATCTGAGCGGG -3ʹ
PIK3CA forward: 5’- CCACGACCATCATCAGGTGAA-3’
PIK3CA reverse: 5’- CCTCACGGAGGCATTCTAAAGT-3’
Lentivirus generation, production and infection
For doxycycline-inducible lentiviral expression of a human GFP-tagged KLF4 (isoform 1) cDNA was cloned into pLVX-TetOne-Puro (Clontech). Virus production was performed by co-transfecting pMD2.G (Addgene, #12259), psPAX2 (Addgene, #12260) and transfer plasmids into HEK293FT cells. Transfections were performed with the Lipofectamine 2000 transfection reagent (Life Technologies) according to the manufacturer’s instructions. Viruses were harvested after 24 and 48 hours and then incubated with HUVECs for 16 hours in the presence of 8 μg/ml polybrene (Santa Cruz Biotechnology, #SC-134220). Fresh EBM media containing 1 μg/ml puromycin (InvivoGen, #ant-pr-1) was added to select transduced cells. To induce KLF4 expression, selected cells were treated with 300ng/mL doxycycline for 72 hours before harvesting. Lentiviruses encoding for GFP were used as a control.
Gene expression analysis from isolated endothelial cells
Total RNA was extracted from isolated endothelial cells using the RNEasy Mini Kit (Qiagen) and reverse transcribed using the SuperScript IV VILO Master Mix (Thermo Fisher, 11756050). To quantify transcript expression levels, real-time PCR was performed using Power SYBR Green PCR Master Mix (Thermo Fisher, 4368577). Relative gene expression was normalized to Gapdh levels and calculated using the ddCt method. The following mouse primers sequences were used:
Mouse primers:
Gapdh forward: 5’-AAATGGTGAAGGTCGGTGTGAACG-3’
Gapdh reverse: 5’-ATCTCCACTTTGCCACTGC-3’
Klf2 forward: 5’-CGCCTCGGGTTCATTTC-3’
Klf2 reverse: 5’-AGCCTATCTTGCCGTCCTTT-3’
Klf4 forward: 5’-GTGCCCCGACTAACCGTTG-3’
Klf4 reverse: 5’-GTCGTTGAACTCCTCGGTCT-3’
Pik3ca forward: 5’- CCACGACCATCTTCGGGTG-3’
Pik3ca reverse: 5’- GGGGAGTAAACATTCCACTAGGA-3’
Immunoblotting of protein from isolated or cultured endothelial cells
Western blot analyses were performed with precast gradient gels (Bio-Rad) using standard methods. Briefly, HUVECs were lysed in RIPA buffer (Sigma; 150 mM NaCl, 1.0% (v/v) IGEPAL CA-630, 0.5% sodium deoxycholate, 0.1% SDS, and 50 mM Tris, pH 8.0) supplemented with 1× EDTA-Free Complete Protease Inhibitor Cocktail (Roche) and 1 mM phenylmethylsulfonyl fluoride. Proteins were separated by SDS-PAGE (Tris-glycine gels with Tris/glycine/SDS buffer, Bio-Rad) and transferred onto nitrocellulose membranes using the Trans Turbo Blot system (Bio-Rad). Membranes were probed with specific primary antibodies and then with peroxidase-conjugated secondary antibodies. The following antibodies were used for immunoblotting: rabbit anti-GAPDH (1:2,000, Cell Signaling Technologies, 2118), rabbit anti-phospho-AKT Ser 473 (1:1000, Cell Signaling Technologies, 4060), rabbit anti-phospho-S6 Ser 235/236 (1:1000, Cell Signaling Technologies, 4858), mouse anti-total AKT (1:1000, Cell Signaling Technologies, 2920) and mouse anti-total S6 (1:1000, Cell Signaling Technologies, 2317). For the immunoblots shown, the following antibodies were used: eNOS (Cell Signaling Technology, #9586, 1:1000), GFP (Cell Signaling Technology, #2555, 1:5000), KLF4 (Cell Signaling Technology, #4038, 1:1000), Phospho-S6 (Ser 235/236) Ribosomal protein (Cell Signaling Technology, #4857, 1:4000), Phospho-S6 (Ser 240/244) Ribosomal protein (Cell Signaling Technology, #2215, 1:4000), S6-Ribosomal protein (Cell Signaling Technology, #2217, 1:4000), Phospho-AKT (Ser 473) (Cell Signaling Technology, #4060, 1:2000), Phospho-AKT (Thr 308) (Cell Signaling Technology, #4056, 1:1000), AKT (pan) (Cell Signaling Technology, #4685, 1:2000), Tubulin (Cell Signaling Technology, #2148, 1:5000). Secondary antibodies are peroxidase-conjugated Goat IgGs (1:5000) purchased from Jackson Immuno Research Labs. Quantification was normalized to total protein. Imaging was performed on a Licor Odyssey FC system and quantified using ImageStudio software.
X-ray microCT-based quantification of CCM lesions
For all experiments using microCT quantification of CCM lesion volume, brains were harvested and placed in 4% PFA/PBS. Brains remained in fixative until staining with non-destructive, iodine contrast and subsequent microCT imaging performed as previously described5. Tissue processing, imaging, and volume quantification were performed in a blinded manner by investigators at the University of Chicago without any knowledge of genotype and experimental details.
Craniotomy survival surgery
Animals were anesthetized with isoflurane (3% induction, 1–2% maintenance in 1L/min oxygen) for surgery. Mice were placed on heating pad covered with cotton pad to maintain body temperature of 37.5C. Depth of anesthesia was periodically monitored by testing the animal’s reflex through toe pinch. Eyes were covered with ophthalmic lubricant to prevent drying. A stereotactic frame (Stoeling Instruments) was used to immobilize the head using ear bars. All mice receiving craniotomies also received 1.5mg/kg of dexamethasone intramuscularly (Sigma) and 5mg/kg of 10% meloxicam (Midwest Vet Supply) subcutaneously.
After the head is immobilized, hair on the scalp was removed with Nair. The scalp was subsequently cleaned and sterilized with 70% ethanol and betadine at least three times. A midline scalp incision was made and resected to expose the skull. The periosteum was removed with blunt forceps. The outer table of the skull was thinned using a handheld high-speed dental drill (Foredom) using a 0.5mm burr. In the adult mice, a 3–4mm2 circumferential region was chosen over the right somatosensory cortex posterior to the coronal suture. Sterile saline was used to irrigate the drill burr to prevent build-up of bone residue and heating of the drill bit. Gelfoam in sterile saline was used to provide hemostasis and to remove bone dust. The border of the craniotomy was thinned until the inner table fractures. A fine-tip forcep (Fine Science Tools) or an up-angled curette (Fine Science Tools) can be used to lift the bone flap and gently elevate it from the dura. Gelfoam was used to provide hemostasis and prevent the brain surface from desiccating.
Upon completion of intraparenchymal viral injection, hemostasis was obtained. A cranial window made from #0 3mm coverslip cemented to a #0 5mm coverslip (Warner) was then placed over the craniotomy site and secured to the skull using cyanoacrylate glue. A custom-made imaging rig (3D printed using ABS) was then secured over the glass coverslip using cyanoacrylate glue and dental cement (Metabond).
Post-surgery, adult mice were monitored and kept separately from littermates until awake and mobile. Mice who developed any postoperative seizures were euthanized. A second dose of subcutaneous meloxicam was given to mice as necessary based on a second exam an hour after surgery. Mice were monitored and imaged for up to 21 days after AAV injection before they were harvested.
Adeno-associated virus injection
Recombinant AAV vectors were generously donated by the lab of Jakob Körbelin47. AAV-BR1 vectors carrying Cre recombinase under the control of the CAG promoter vector was injected into the right lateral hemisphere of mice using a beveled glass micropipette. 100nL of 5 × 10⁷ virus particles in sterile PBS was injected over the course of 5 minutes.
Lineage tracing AAV-Cre following intracranial injection of adult mice
Mice were housed in individually ventilated Green Line cages (Tecniplast) under a 12-hour light/dark cycle and fed an autoclaved pelleted mouse diet ad libitum. 12 weeks old Ai14 mice were stereotactic injected into the cortex with the AAV-BR1-CAG-Cre (2×10⁹ gp; 200nl). Mice were anesthetized with an intraperitoneal (i.p.) injection of a mixture of ketamine hydrochloride (65 μg g−1 body weight) and xylazine (15 μg g−1 body weight) in NaCl (0.9%). After loss of reflexes, animals were fixed in a stereotaxic frame (David Kopf instruments; Nr: 1900). The following coordinates relative to bregma were used for injections: lateral ventricle, anteroposterior −0,1,5 mm, mediolateral −0.75 mm, dorsoventral from the skull surface −2.0 mm. A small hole was made into the skull using a dental drill (freedom; K.1070 Micromotor Kit). After injection, the micropipette was kept in place for 5 min to avoid backflow of the injected vector during micropipette retraction. The scalp was sutured, and the animals were placed on a heating pad until full recovery from surgery and then returned to their home cage. Carprofen (5 mg kg−1 body weight; s.c.) was applied once a day for 2 days after rAAV injection. Two weeks after viral injection, mice were perfused with Ringer solution and afterwards with 4% paraformaldehyde (PFA) during deep aesthesia. Brains were postfixed in 4% PFA at 4 °C overnight. Sections (50 μm) were prepared with a vibratome. Free-floating sections were washed twice in PBS, permeabilized with 0.3% Triton X-100 in PBS (PBS-TX) for 30 min, and incubated in bovine serum albumin (5% in PBS-TX) for 2 h. Primary antibodies (anti-CD31, Bio Rad (MCA2388) 1:200 (5 μg/ml) in BSA-PBS-TX) were added followed by overnight incubation with gently shaking. Sections were washed twice in PBS-TX for 10 min and incubated for 2 h with secondary antibodies (anti-rat IgG (Alexa Fluor 488), ThermoFisher (A-21208), 1:400 (5 μg/ml) in BSA-PBS-TX). After washing twice in PBS, sections were incubated with DAPI (1 μg/ml in PBS) for 5 min and washed twice in PBS for 5 min. Then, sections were mounted on glass slides and covered with Mowiol.
Rapamycin injection
Rapamycin (MedChemExpress, HY-10219) was dissolved in DMSO for a 10mg/ml stock solution and diluted in sterile PBS for a 1mg/ml working solution. Slco1c1(BAC)-Cre; Krit1fl/fl ; littermate pups were injected intraperitoneally at P2 with either 50ug of rapamycin (volume of 50 ul) or vehicle and harvested at P10.
For adult rapamycin experiments, either drug or vehicle was administered to adult Krit1fl/fl; R26-LSL-Pik3caH1047R mice who underwent open craniotomy and injected with AAV-Cre. 50mg of rapamycin powder was dissolved in 1mL 100% ethanol to create a stock solution of which 1mg was freshly prepared in 5% DMSO in sterile PBS for every injection. Intraperitoneal injections of either rapamycin or vehicle (5% DMSO) began on post-operative day 7 when nascent cavernoma lesions could be visualized under microscopy. Injections were performed daily within a two-hour window until animals were harvested on post-operative day 21 at either a low dose (100μg) or high dose (400μg).
For KLF4 BEC-GOF rapamycin experiments, either 100ug of vehicle or rapamycin was injected intraperitoneally (50 μl total volume) to P10 Slco1c1(BAC)-Cre; R26-LSL-rtTA;tetOn-KLF4 and littermate Slco1c1(BAC)-Cre; R26-LSL-rtTA pups. To induce KLF4 expression, 400 μg of doxycycline was administered via oral gavage. Animals were harvested at P14.
Human CCM Collection
Human CCM tissue specimens were obtained from surgically resected specimens from three sources including the Barrow Neurological Institute, Angioma Alliance biobank, and University of Chicago. This study was approved by each institutions respective Institutional Review Board.
Human Brain AVM Collection
Brain AVM tissue specimens were obtained from the nidal tissue of surgically resected brain AVMs (M.T.L). For non-vascular lesion controls (NVLCs), temporal lobe specimens were similarly acquired from subjects undergoing anterior temporal lobectomies for medically refractory epilepsy. All tissues were frozen at −80 degrees and stored in a biobank. This study was approved by the University of California San Francisco Institutional Review Board and performed in compliance with the Health Insurance Portability and Accountability Act regulations.
DNA Extraction
DNA from human CCM samples was extracted using the DNeasy Blood and Tissue Kit (Qiagen). Extractions were done as per the manufacturers’ directions excepting cases where less than 25mg of tissue was available. For samples <25mg the manufacturer recommended volumes were either halved or quartered – depending on the amount of tissue available – to optimize final DNA concentration and yield. Final DNA concentrations were quantified using Qubit dsDNA BR assay kit (Invitrogen cat. Q32850) according to manufacturer recommended protocol.
Droplet Digital PCR
Identification of somatic PIK3CA mutations was performed using droplet digital PCR (ddPCR) according to manufacturer protocol for mutation detection assays (BioRad 10047489 Ver B). For each sample with sufficient DNA yield, 30–100ng of DNA was incorporated into droplets using the QX200 AutoDG system (BioRad). After PCR, fluorescence from the resulting droplets was read using the QX200 droplet reader (BioRad). These steps were repeated for three assays testing the presence of the three most common PIK3CA mutations: E542K, E545K, and H1047 (ThermoFisher assay IDs: Hs000000085_rm, Hs000000086_rm, Hs000000088_rm, respectively). Each assay included a no-template control, a wild-type control, and a mutation-positive control for the mutation being assayed. The mutation-positive controls were DNA extracted from cell lines with known heterozygous mutation of E542K (T84), E545K (HCT15), or H1047R (HCT116). The output of the droplet reader was analyzed using the QuantaSoft software (BioRad). The gates for positive and negative mutation status were drawn with respect to the distribution of droplets in the mutation-positive controls and applied to all samples.
SNaPshot
Human CCM samples with an E542K, E545K, or H1047R PIK3CA mutation identified by sequencing or ddPCR underwent tertiary confirmation of mutation status using SNaPshot (Applied Biosystems), a single-base extension sanger sequencing assay. An initial round of PCR amplified exons 9 and 20. In a second round of PCR, primers directly adjacent to the assayed nucleotide was extended with ddNTPs and sequenced on a 3130 Genetic Analyzer (Applied Biosystems). Sequences were examined using GeneMapper software (Applied Biosystems). The allele frequency of the mutation by dividing the area under the peak of the mutant allele by the total area under both allele peaks. The primers used in this analysis were synthesized according to designs in a previously published assay for PIK3CA mutations48.
Sequencing
Previous studies identifying somatic mutations in CCMs and bAVMs have reported alternate allele frequencies less than 1%. To enable the detection of variants at such low frequencies we aimed to sequence samples to an average of 1000x (actual mean coverage 1102x) coverage in addition to leveraging 10bp unique molecular identifiers (UMIs) to mitigate the impact of PCR duplication. These conditions allow us to theoretically detect variants as low as 0.5% allele frequency.
Sequencing libraries for the human CCMs and bAVMs were prepared using the SureSelect XT HS target enrichment workflow (Agilent). The targeting panel used for sequencing the CCMs covers the following genes:
KRIT1,CCM2,PDCD10,PIK3CA,PTEN,AKT1,KRAS,RAF,NRAS,MAP2K1,RASA1,TEK,GNAQ,GNA11,MAP2K2,PPP2R5D,ACVRL1,ENG,SMAD4,AKT2,AKT3,CCBE1,CDKN1C,FLT1,FLT4,FOXC2,GATA2,GDF2,GJC2,GLMN,KIF11,MTOR,PIK3R2,PTPN14,SOX18,STAMBP,VEGFC,MAP2K4,MAP3K1,MAPK1,JAK1,JAK2,JAK3,KDR,NOTCH1,PDGFRA,PDGFRB,RET,HRAS,TP53,MSH2,MYB,MYCN,MYC,ERBB2,EGFR,NTRK2,ODC1,SLC25A21,PTTG1,TSC1,TSC2,EPHB2,TGFBR1,TGFBR2,TGFBR3.
The bAVM samples were sequenced using a customized Agilent Comprehensive Cancer panel which covers 175 genes including PIK3CA. After library preparation, CCM samples were pooled and sequenced across 1 lane of a HiSeq4000 (illumina) with paired-end 150bp reads. bAVM samples were pooled and sequenced across a NovaSeq6000 SP flow cell (illumina) with paired-end 150bp reads.
Sequence Analysis
Sequencing data was processed according to the GATK (Broad Institute) best practices for somatic short variant discovery with slight modifications for “tumor-only” sequencing data. As a secondary method for variant discovery we developed custom software designed specifically for the detection of somatic mutations in sequencing data from samples with no available normal tissue. This software was implemented as part of Gonomics, an ongoing effort to develop an open-source genomics platform in the Go programming language. Gonomics can be accessed at github.com/vertgenlab/gonomics.
After variant calling the resulting variants were functionally using snpEff. In this process each variant was annotated with: the protein-level consequence of coding mutations: the predicted impact of missense mutations according to SIFT, PolyPhen2, and PROVEAN; membership in several SNP databases including dbSNP, 1000 Genomes project, and ExAC; and membership in the Catalogue of Somatic Mutations in Cancer (COSMIC). We filtered the resulting list of variants using the following inclusion criteria: >100x total coverage; >5 supporting reads; <90% strand specificity; >0.5% alternate allele frequency; <1% population allele frequency according to the above mentioned SNP databases; and membership in the COSMIC database.
Single-Nucleus DNA Sequencing
Frozen human CCM lesion tissue obtained from medically-indicated, surgical resection were prepared for single-nucleus DNA sequencing (snDNA-seq) following a nuclear isolation protocol provided by L. Martelotto49. All steps prior to loading on the Tapestri platform were performed in <3 hours. Nuclei were maintained at 4°C throughout the protocol. Frozen tissue was homogenized by Dounce in Nuclei EZ Lysis Buffer (Sigma-Aldrich), briefly washed, filtered through a 70um mesh, stained with DAPI, and filtered through a 35um mesh. The CCM homogenate was sorted using a FACSAriaII (BD) (70um nozzle, 70psi, 4-Way Purity, chiller) gating to retain singlet DAPI-positive events (Ext. Data Fig. 7b). Up to 400,000 sorted nuclei were collected in 1ml of the following buffer prepared with ultrapure nuclease-free water: Na2SO4 82mM, K2SO4 30mM, glucose 10mM, HEPES 10mM, MgCl2 • 6H2O 5mM, BSA 2%. Sorted nuclei were pelleted by centrifugation at 4°C (500rcf, 10min), supernatant discarded, and resuspended in 36ul of MissionBio Cell Buffer. The concentration of nuclei was determined by counting DAPI-positive nuclei with a hemocytometer on an EVOS FL (fluorescence) microscope (Thermo Fisher) while confirming that nuclei aggregates comprised <5% of total nuclei. Samples with <5% aggregate nuclei and a concentration within 2000–4000 nuclei/ul (diluting with additional MissionBio Cell Buffer where necessary) were used for snDNA-seq.
Library preparation was performed using the Tapestri platform (MissionBio) according to the manufacturers protocol (PN3354). Libraries were generated with a custom amplicon panel synthesized by MissionBio covering all exons of KRIT1, CCM2, PDCD10, and 7 amplicons covering somatic mutation hotspots in PIK3CA, per the COSMIC database. Up to three libraries were pooled and sequenced with a NextSeq Mid-Output 2×150bp kit (illumina). Data processing and QC was performed by the MissionBio cloud-based analysis pipeline. Data quality for each nuclei barcode was determined using MissionBio recommended filtering settings. Data from low quality nuclei barcodes were removed prior to mutation analysis. Following these filtering steps, the allele frequency of mutations detected by snDNAseq show high concordance with allele frequencies determined by bulk sequencing (Ext. Data Fig. 7c–e).
To determine the cellular phase of somatic mutations detected in bulk sequencing, nuclei barcodes were selected that had a minimum of 20x coverage across all mutant regions to ensure that all nuclei included in the analysis have appropriate sensitivity to detect a mutation (Ext. Data Fig. 7c–e). For each nuclei barcode and each mutant position, reads containing the ref and alt alleles were counted and recorded in Supplemental Table 2. Mutant regions that had both a minimum of 10 alt reads and 10% allele frequency were marked as mutation positive. The number of nuclei barcodes with each possible genotype are recorded in Ext. Data Fig. 7f.
The p value for each sample was determined by Chi-squared test comparing the observed number of triple mutant nuclei barcodes (or double mutant if only two mutations were identified) to the expected number of triple mutant nuclei barcodes if the null hypothesis is true. In this test the null hypothesis is that the observed somatic mutations do not occur in the same cell and instead exist in two clonal populations where the proportion of each population = 2 • variant allele frequency (assuming cells are diploid and heterozygous for the mutation). In samples where three somatic mutations were identified an alternative null hypothesis may be to use three clonal populations, however assuming that the three somatic mutations are partitioned into two clonal populations as asserted above is a more conservative test and therefore used here. To determine the expected number of triple mutant nuclei barcodes we first determined the expected number of droplets with two (or more) nuclei by approximating a Poisson distribution. The expected number of triple mutant nuclei barcodes is the product of the number of droplets with two nuclei, the proportion of mutant clone 1, and the proportion of mutant clone 2.
Here we report the Poisson estimation p value as this is the accepted method for estimating the rates of false-positive droplets when dealing with data generated using microfluidics. We can also consider a more intuitive upper bound for the p value by considering the extreme case where each droplet contains two nuclei. In this case the expected number of triple mutant nuclei barcodes is the product of the total number of nuclei barcodes, the proportion of mutant clone 1, and the proportion of mutant clone 2. Even in this extreme case the highest p value among our data is <1e-17.
Statistics
All neonatal experimental and control animals were littermates and none were excluded from analysis at the time of harvest. Experimental animals were excluded at the pre-defined point: (i) failure to properly inject the inducing agent (4OHT, tamoxifen, rapamycin) and (ii) observation of significant leakage. Sample sizes were estimated based on our previous experience with the neonatal CCM model and microCT quantification of lesion volume, as previously described2,5. All data were analyzed with GraphPad Prism software (version 8) and represented as mean ± SEM. P values were calculated using an unpaired 2-tailed Welch’s t-test, or one-way ANOVA and Tukey test for multiple comparisons as indicated in the figure legends. A log-rank test was used to assess the Kaplan-Meier survival curves. P values less than 0.05 were considered statistically significant and are denoted as follows: *<0.05, **<0.01, ***<0.001 and ****<0.0001.
Extended Data
Extended Data Figure 1. Endothelial loss of CCM function in adult mice confers cavernous vascular malformations in the testis but not the brain.
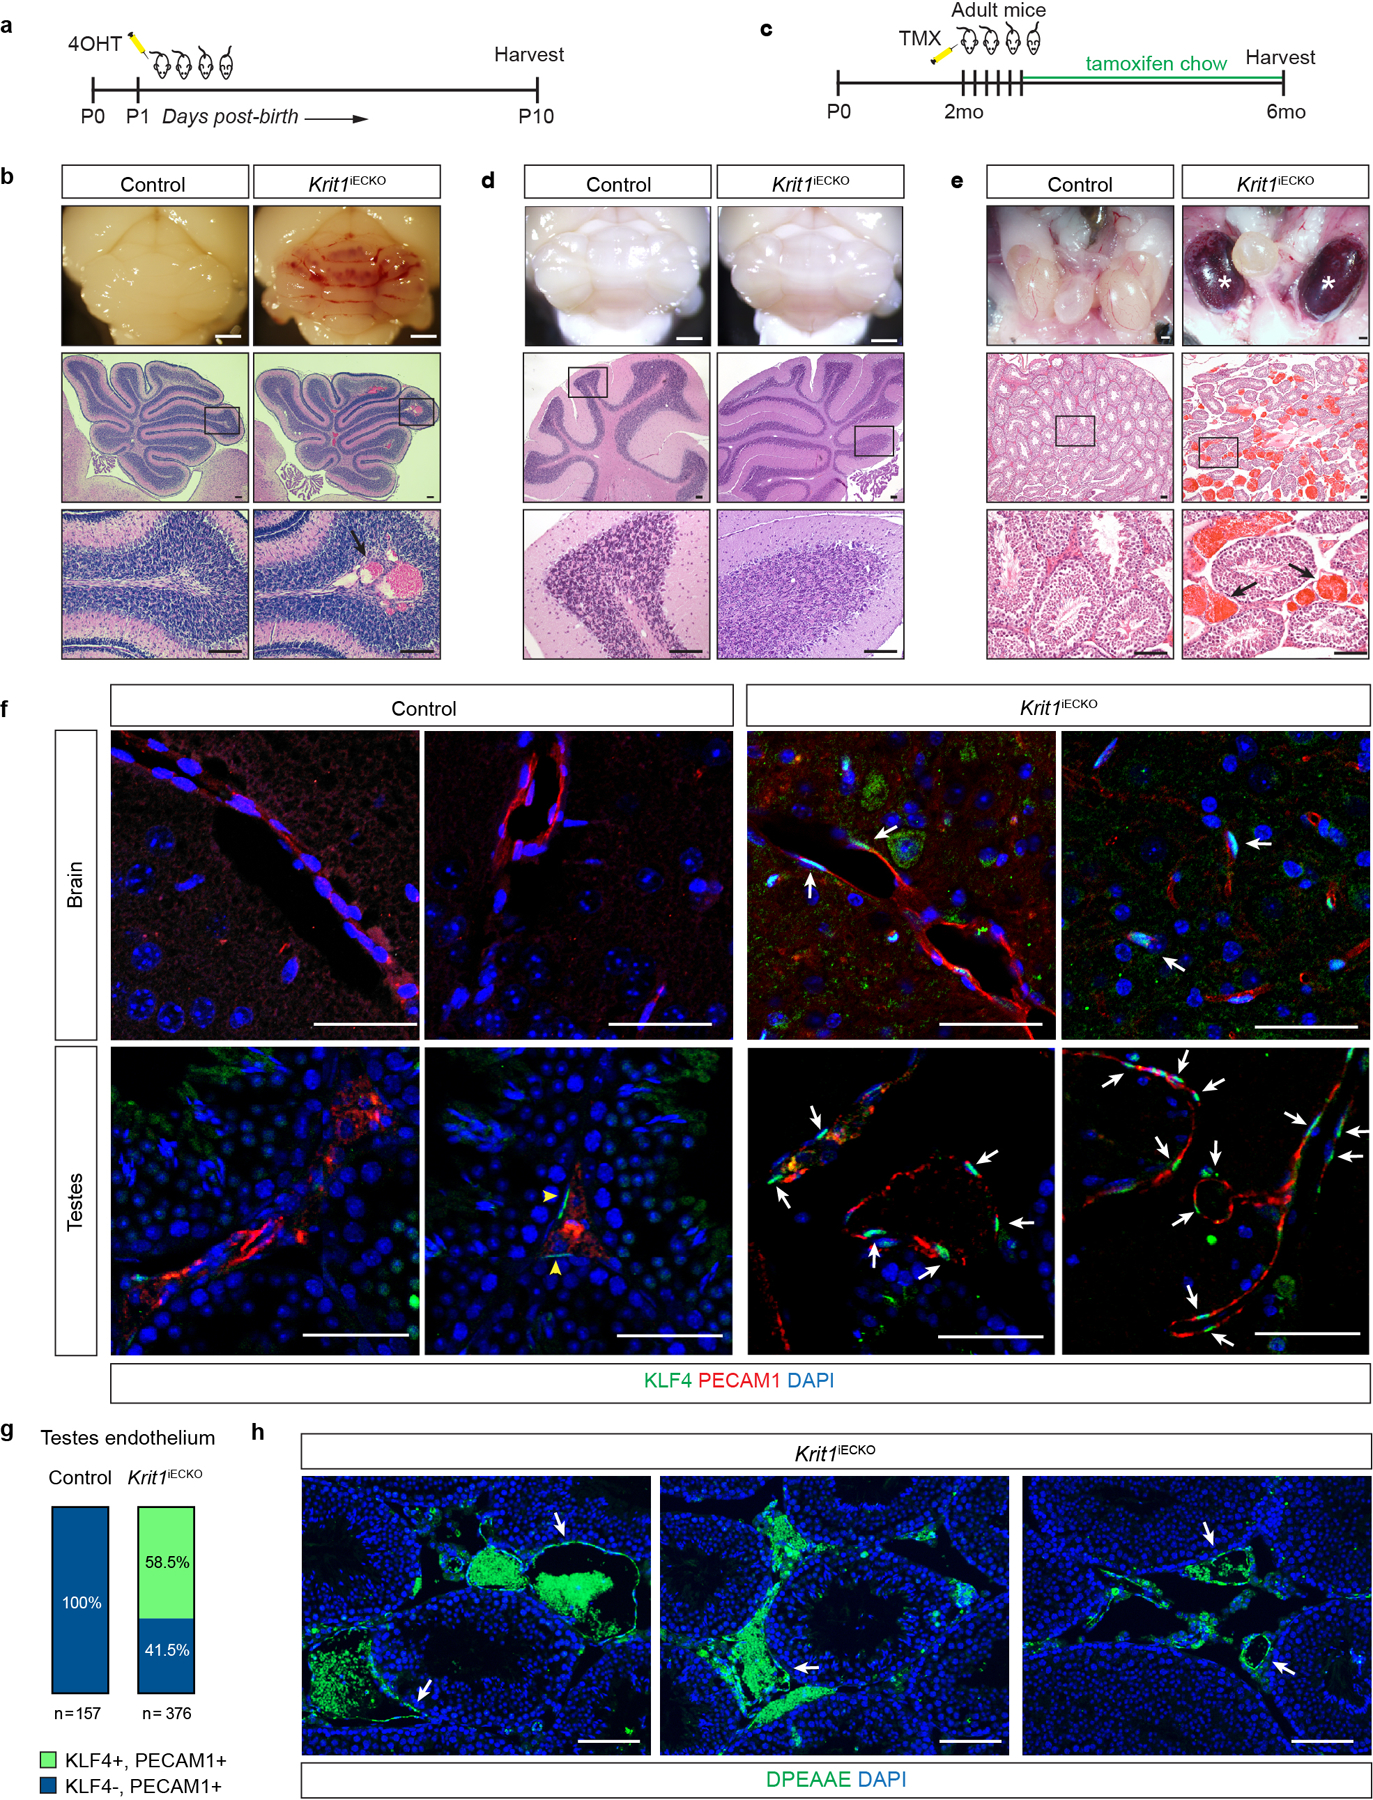
a, Schematic of the neonatal endothelial CCM deletion experiment. b, Cavernous malformations form by P10 in the hindbrain of Krit1iECKO animals with a susceptible gut microbiome. Images of hindbrains from the indicated animals are shown above, and Hematoxylin-Eosin (H-E) stained histologic sections shown below. Arrow indicates a CCM lesion in the white matter venous vessel. c, Schematic of CCM gene deletion in endothelial cells (ECs) of adult mice on a susceptible microbiome background. d, Cavernous malformations are not detected in the brain of 6 month old Krit1iECKO animals following tamoxifen administration. Images of hindbrains from the indicated animals are shown above, and H-E stained histologic sections shown below. e, Cavernous malformations are detected in the testis of 6 month old Krit1iECKO animals. Images of testis from the indicated animals are shown above and H-E stained histologic sections shown below. * indicate blood-filled testes. Arrows indicate cavernous blood-filled vessels around the seminiferous tubules. For panels b, d, e: Visual images representative of n=4 animals/genotype; H-E histology representative of 6 tissue sections from n=4 animals. Scale bars for visual images, 1mm; scale bars for histology, 0.1mm. f, Immunostaining for KLF4 and endothelial cell marker PECAM1 in brain (top) and testis (bottom) from the experiment in c is shown. Note endothelial CCM LOF in adult mice results in KLF4 upregulation without CCM formation in the brain. Arrows indicate KLF4+ nuclei in PECAM1+ ECs. Yellow arrowheads indicate KLF4+ peritubular myoid cells. Scale bars, 50 microns. g, Quantitation of KLF4+ and KLF4- ECs identified using co-staining for KLF4 and PECAM1 in testis is shown. Quantitation from 10 individual 800micron x 800micron HPF from 3 individual animals. h, Immunostaining for DPEAAE, a versican neo-epitope exposed by ADAMTS-mediated proteolysis, is shown for Krit1iECKO testis. Arrows indicate peri-endothelial cell detection of DPEAAE around testicular cavernomas. Scale bars, 0.1mm. “Control” genotype in panels b, d, e, f, g indicate animals with genotypes of either Cdh5-CreERT2; Krit1fl/+ or Krit1fl/fl. Immunofluorescence images in f & h representative of 6 tissue sections from n=4 individual animals/genotype.
Extended Data Figure 2. Vascular lesions due to CCM LOF and/or PIK3CA GOF arise in veins of the white matter.
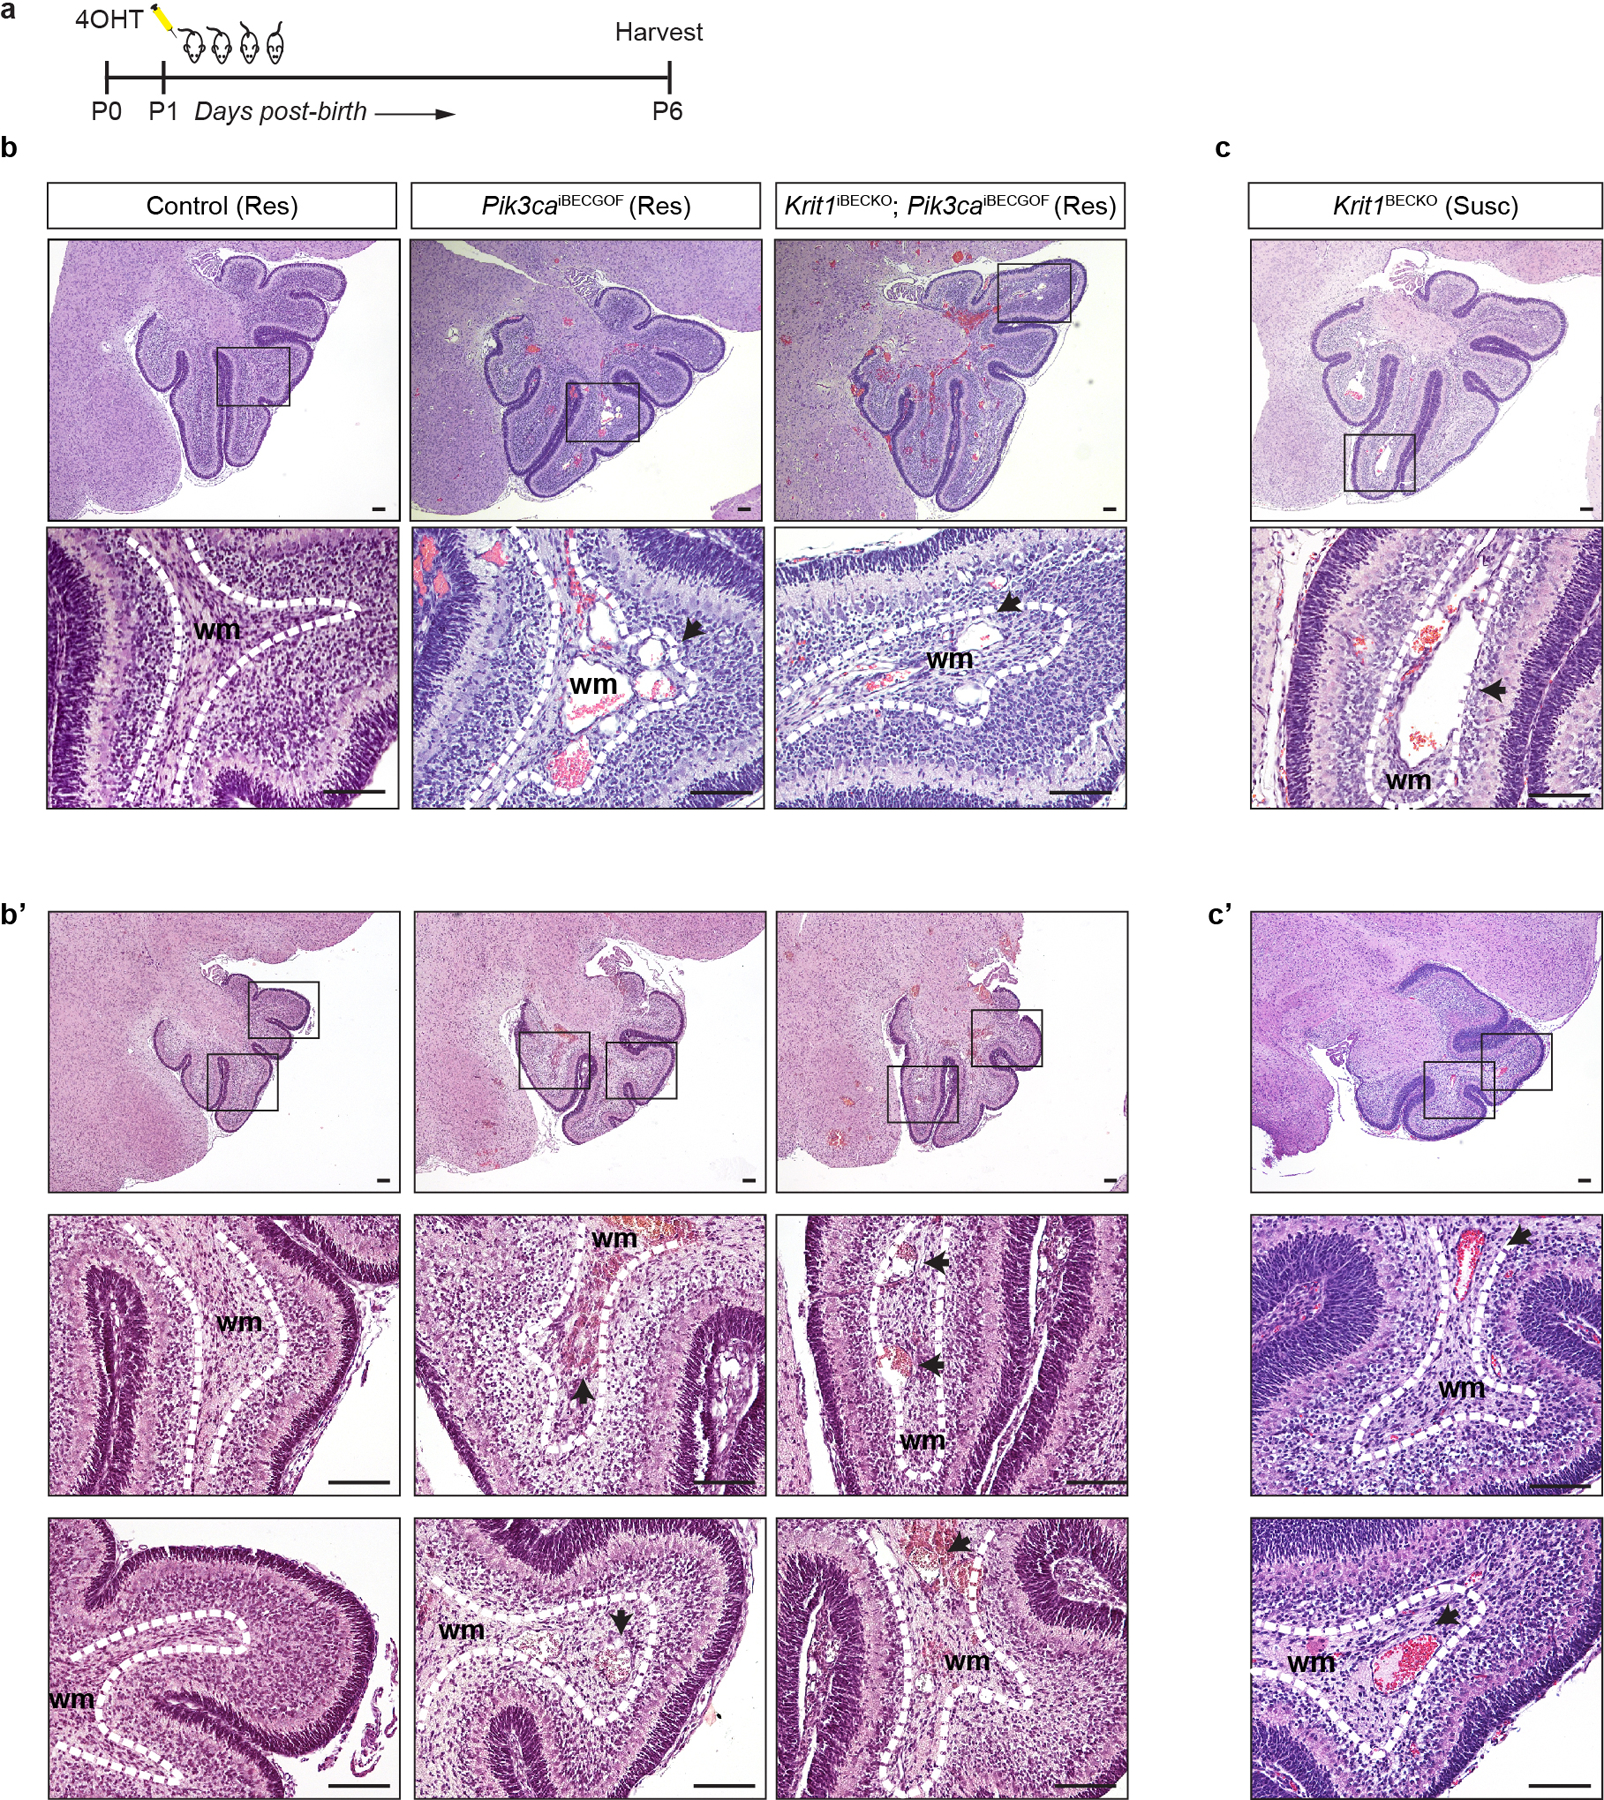
a, Schematic of neonatal endothelial induction of Krit1 deletion and/or PIK3CAH1047R expression. b & c, Hematoxylin-Eosin (H-E) staining of saggital hindbrain sections from P6 control, Pik3caiBECGOF, Krit1iBECKO;Pik3caiBECGOF (b and b’) and Krit1iBECKO (c and c’) animals with a resistant (Res) or susceptible (Susc) microbiome. b’and c’ samples were obtained from animals distinct from those in b and c. Note that lesions form in the white matter with both CCM loss of function and PIK3CA gain of function. Boxes in upper images denote area of magnified image immediately below. Dotted lines outline the white matter of the cerebellum. Arrows indicate lesions in white matter veins and venules. H-E images representative of 6 tissue sections from n=4 animals/genotype. wm, white matter. Scale bars, 0.1mm.
Extended Data Figure 3. Endothelial Pten LOF synergizes with Krit1 LOF in a dose-dependent manner.
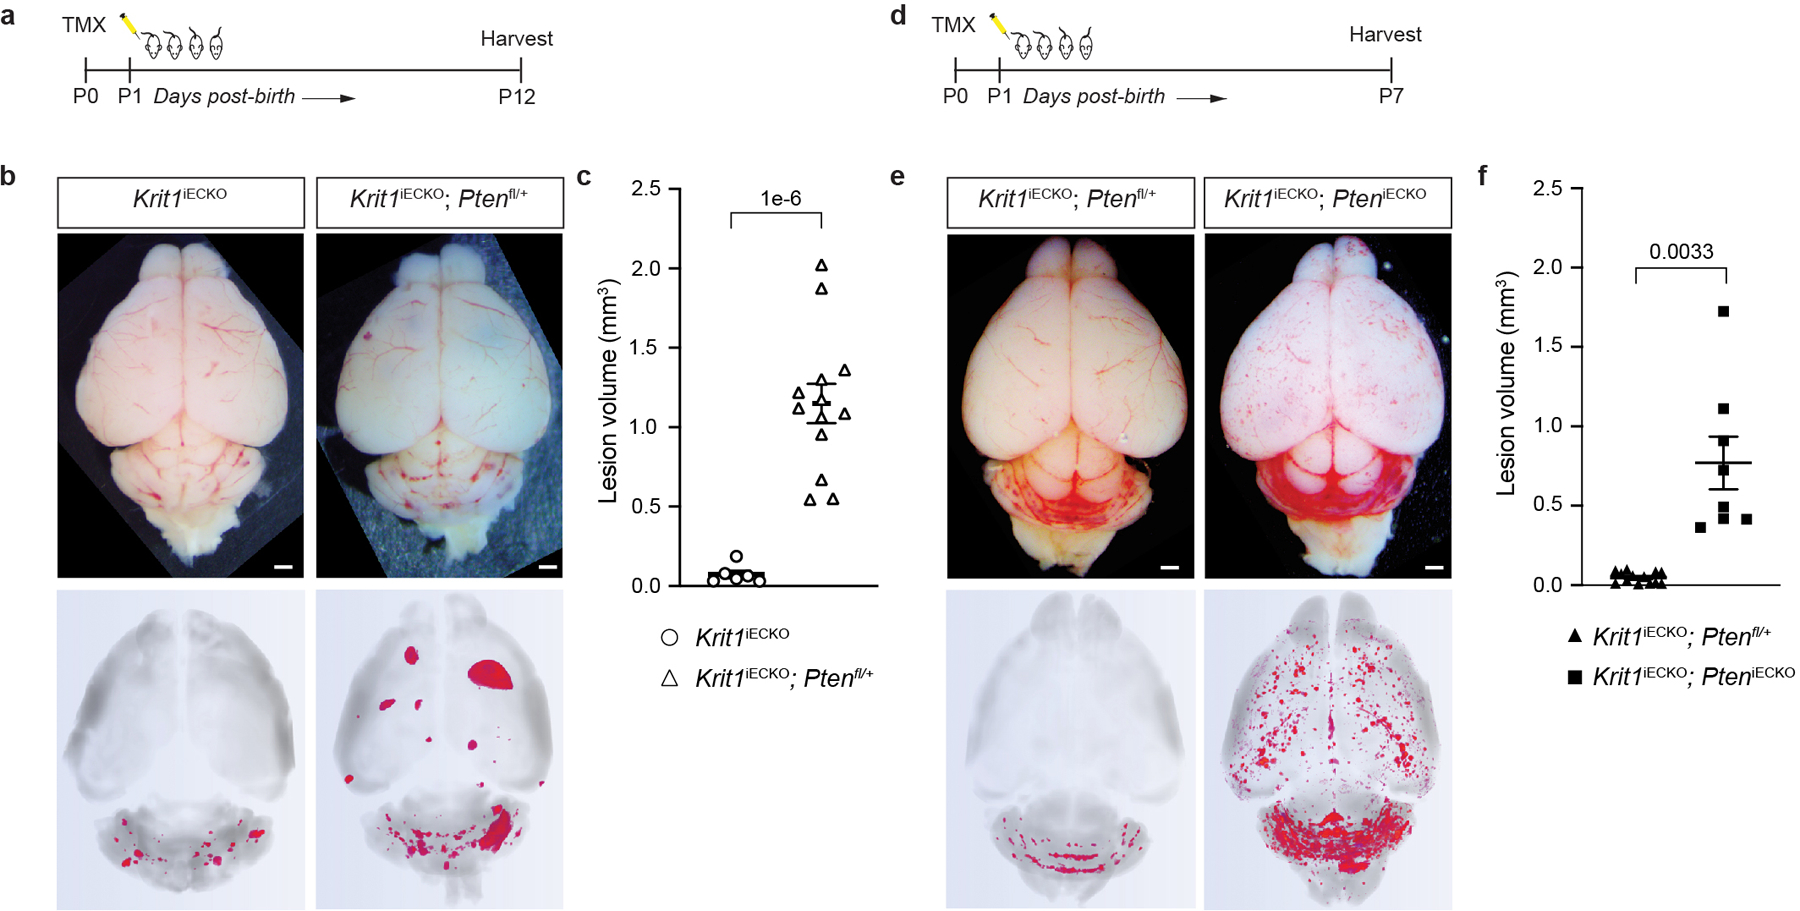
a, Schematic of neonatal endothelial induction with tamoxifen of Krit1 deletion and deletion of either none or one allele of Pten in endothelial cells using a Pdgfb-CreERT2 transgene. b, Representative visual and paired microCT images of Krit1iECKO and Krit1iECKO;Ptenfl/+ littermate mice on a susceptible microbiome background at P12. Scale bars, 1mm. These mice were produced from a Ptenfl/+ x Ptenfl/+ cross; however no Krit1iECKO;Ptenfl/fl littermates survived to P12. c, MicroCT quantification of lesion volumes at P12. (Krit1iECKO, n=6; Krit1iECKO;Ptenfl/+, n=13). d, Schematic of neonatal endothelial induction of Krit1 deletion and deletion of either one or both alleles of Pten in endothelial cells using a Pdgfb-CreERT2 transgene with brains harvested at P7. These mice were produced from a Ptenfl/+ x Ptenfl/fl cross. e, Representative visual and paired microCT images in Krit1iECKO;Ptenfl/+ and Krit1iECKO;PteniECKO littermate mice at P7. Scale bars, 1mm. f, MicroCT quantification of lesion volumes at P7. (Krit1iECKO;Ptenfl/+, n=13; Krit1iECKO;PteniECKO, n=8). Data are mean ± s.e.m. Unpaired, two-tailed Welch’s t-test.
Extended Data Figure 4. Uninduced Slco1c1-CreERT2; Krit1fl/fl; iPik3caH1047R animals develop focal lesions due to Slco1c1-CreERT2 transgene endothelial leak.
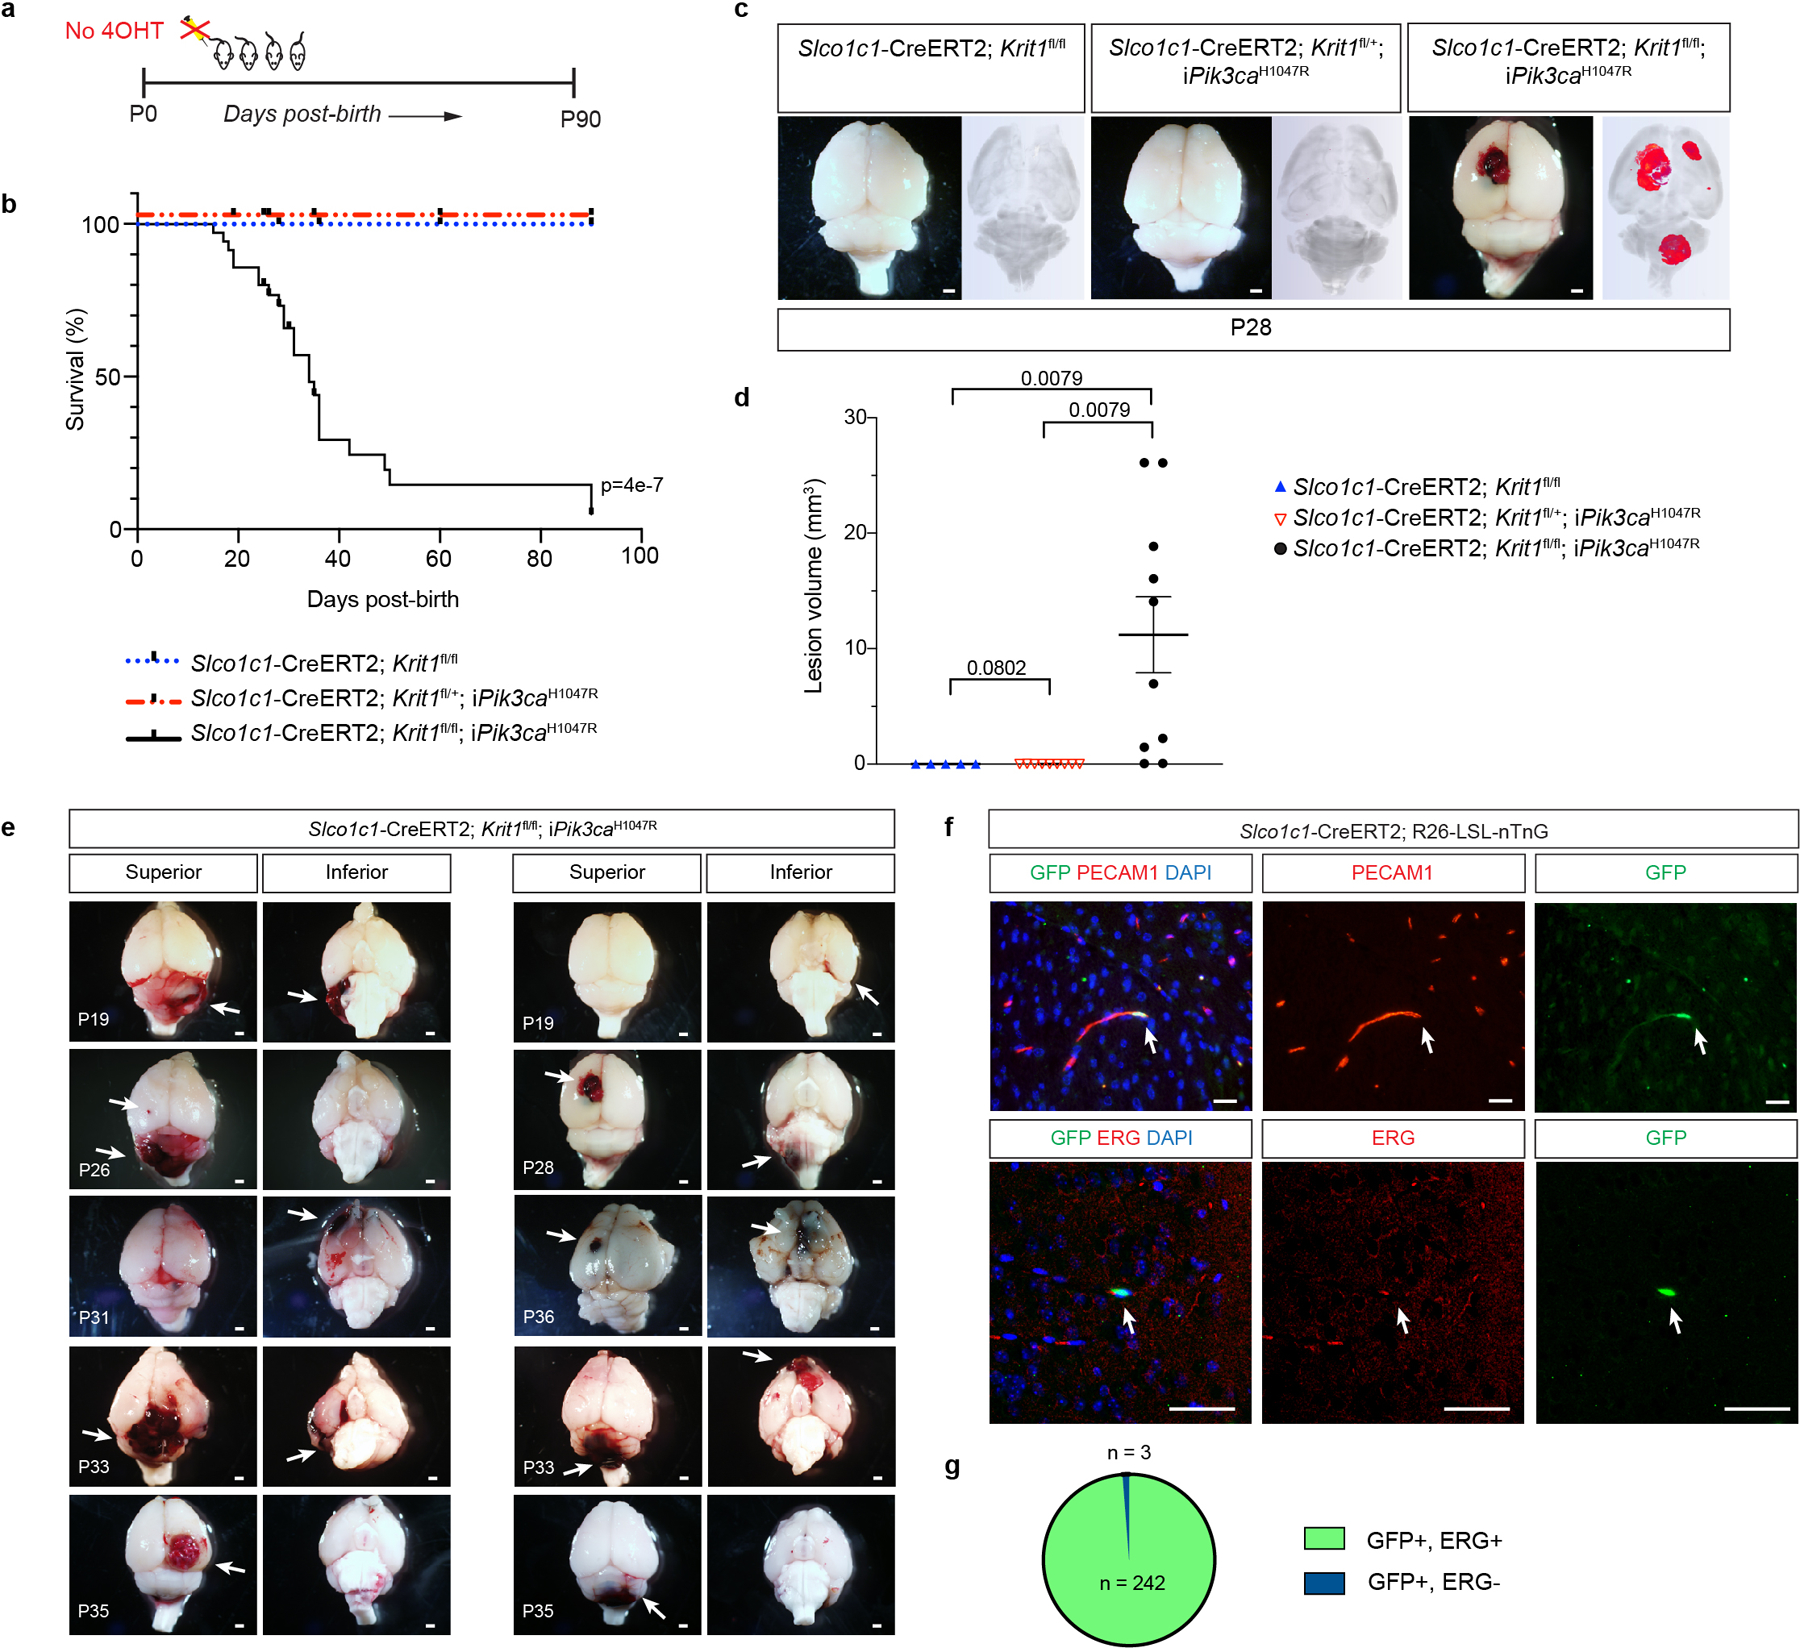
a, Schematic for generation of a survival curve in the absence of tamoxifen administration. b, Postnatal survival curve in the absence of tamoxifen administration is shown for indicated genotypes. (Slco1c1-CreERT2;Krit1fl/fl, n=15, Slco1c1-CreERT2;Krit1fl/+;iPik3caH1047R n=10, Slco1c1-CreERT2;Krit1fl/fl;iPik3caH1047R n=39). Log-rank test. c, Representative visual and paired microCT images of brains harvested from untreated P28 littermates. Scale bars, 1mm. d, MicroCT quantitation of lesion volumes of untreated P28 animals. (Slco1c1-CreERT2;Krit1fl/fl, n=5, Slco1c1-CreERT2;Krit1fl/+;iPik3caH1047R n=9, Slco1c1-CreERT2;Krit1fl/fl;iPik3caH1047R n=10). Data are mean ± s.e.m. Unpaired, two-tailed Welch’s t-test. e, Additional visual images of brains from a superior and inferior perspective from animals harvested at various timepoints (P19-P36). Arrows point to focal vascular lesions. Scale bars, 1mm. f, Leak assessed by immunostaining of brain sections with antibodies against GFP to identify Cre-expressing cells, and cell surface marker PECAM1 (top) and nuclear protein ERG (bottom) to identify endothelial cells is shown. Scale bars, 50 microns. Immunofluorescence images representative of 10 tissue sections from n=4 individual animals/genotype. g, Quantitation of GFP+; ERG+ nuclei (n = 242) and GFP+; ERG- nuclei (n = 3) from 20 individual 800micron x 800micron HPF.
Extended Data Figure 5. Exogenous delivery of Cre recombinase via AAV vector to drive combined loss of CCM function and gain of PIK3CA function results in CCM formation in the adult brain.
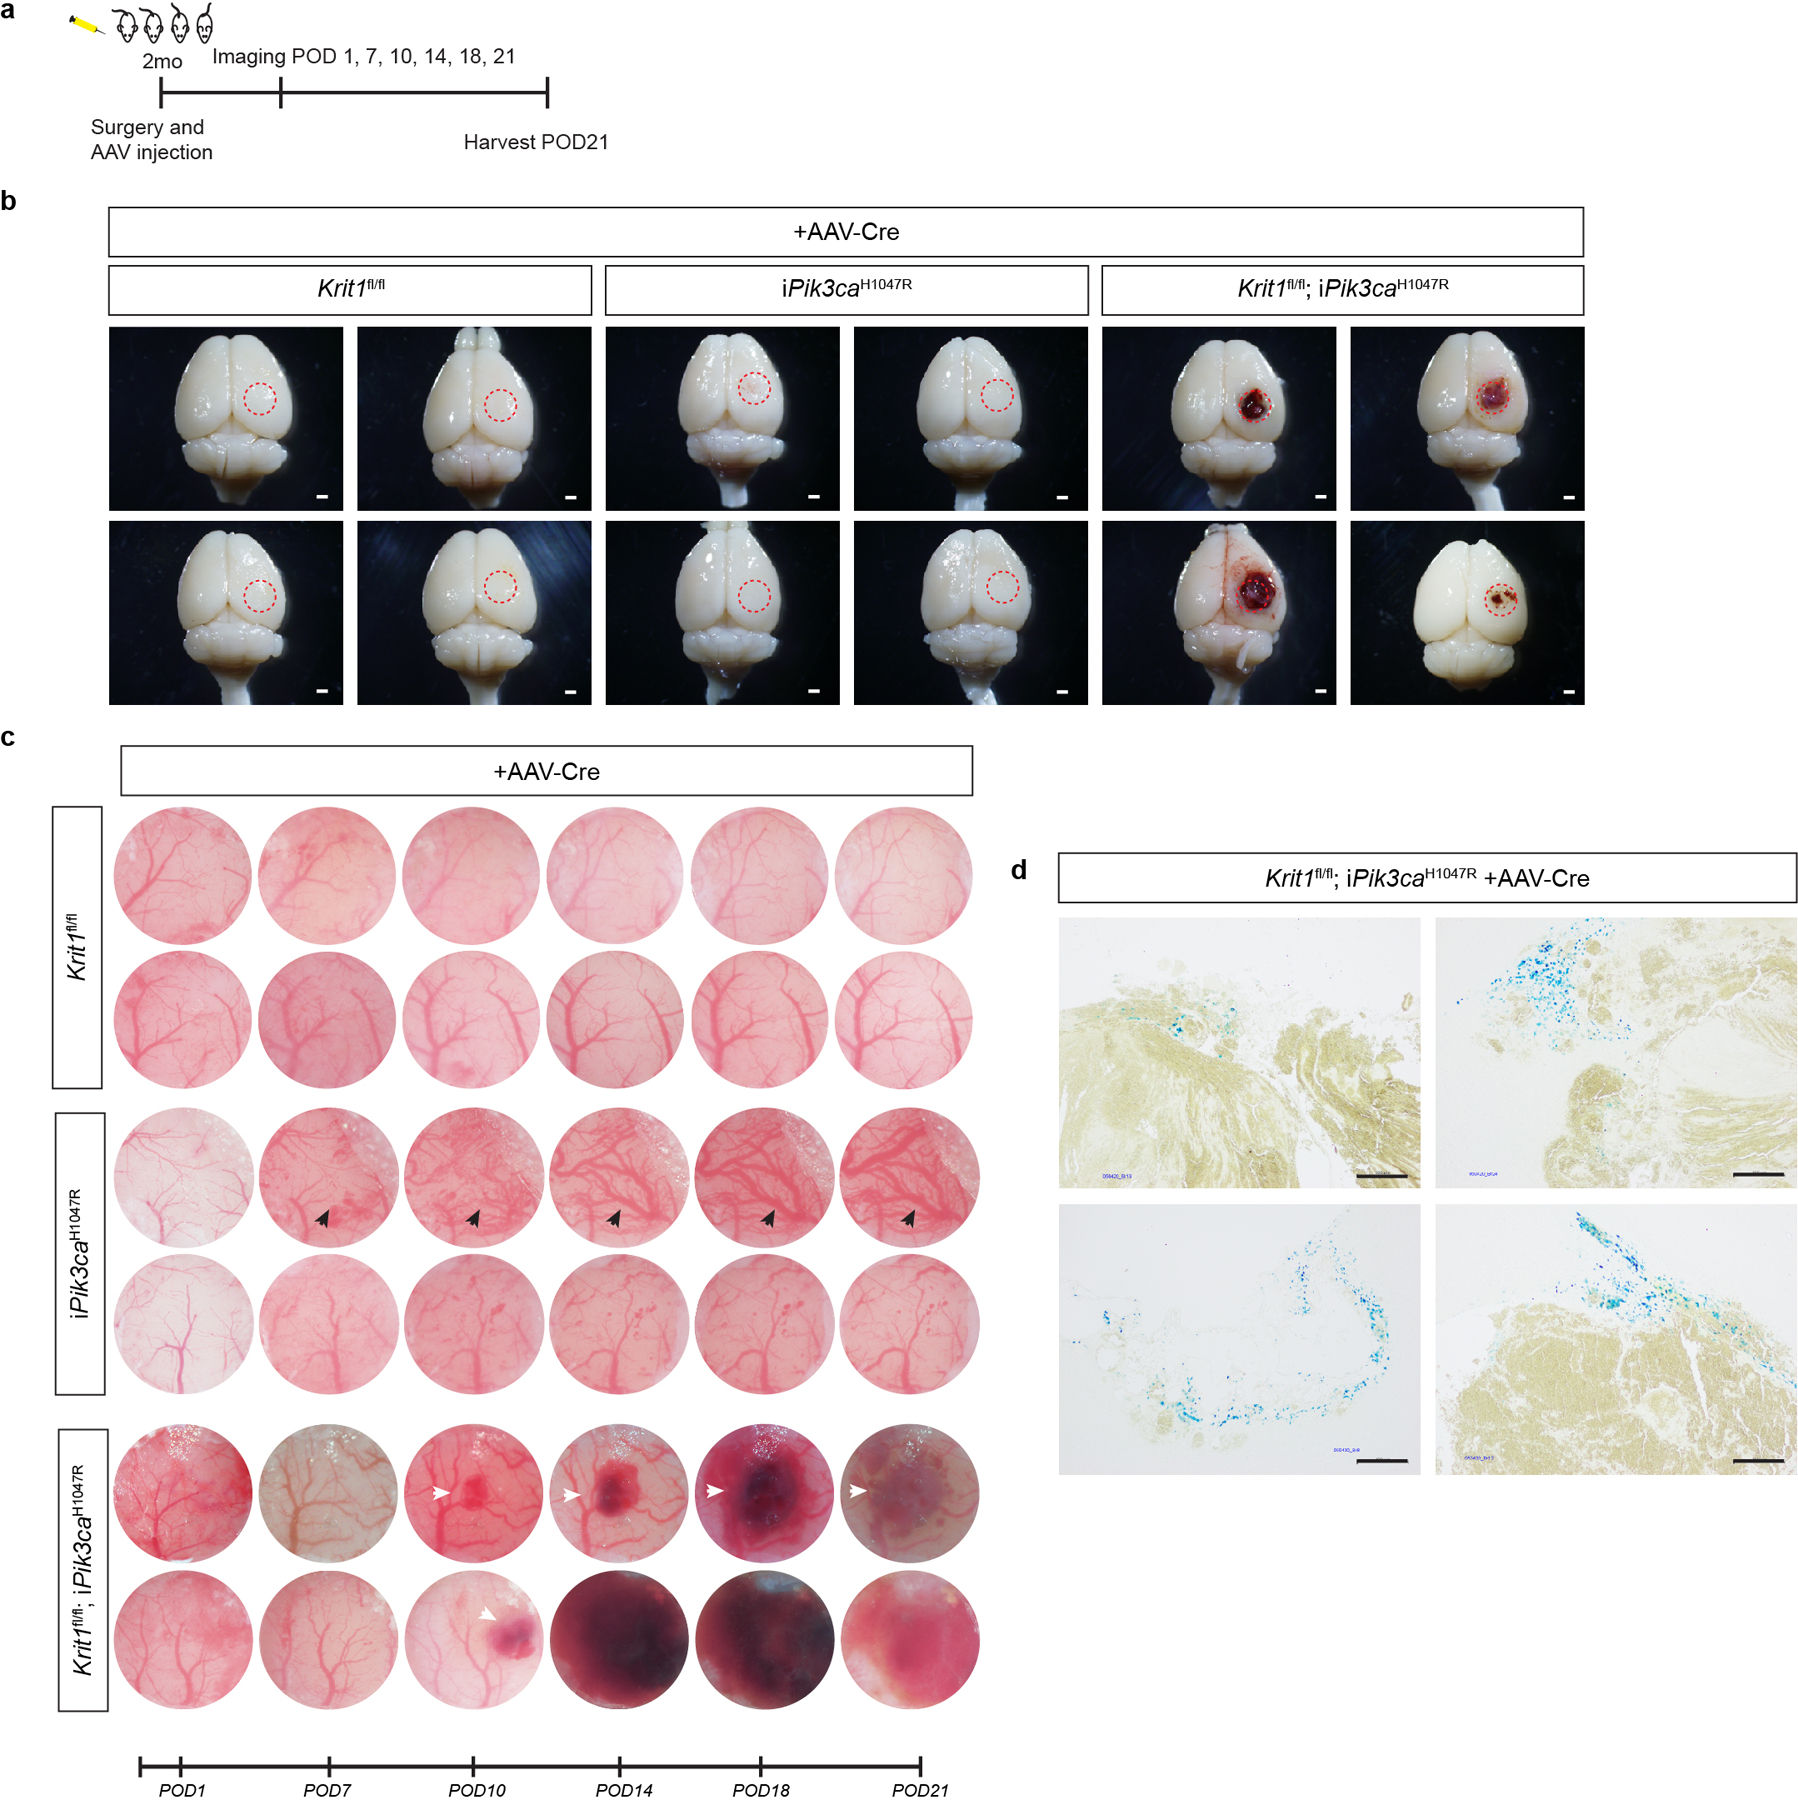
a, A schematic of the experimental approach in which a cranial window is created and AAV-Cre virus injected into the brains of 2 month old mice with serial imaging at post-operative days 1, 7, 10, 14, 18, and 21. b, Representative visual images of brains harvested 21 days after injection of AAV-Cre into adult animals. Dotted circles indicate the site of cranial window and AAV-Cre injection. Includes visual images displayed in Figure 1. Scale bars, 1mm. c, Serial images obtained through the same cranial window of mice of indicated genotypes following injection of AAV-Cre. iPik3caH1047R designation includes iPik3caH1047R and/or Krit1fl/+;iPik3caH1047R genotypes. White arrows indicate cavernous malformations in Krit1fl/fl;iPik3caH1047R mice. Black arrows indicate hypervascularity in iPik3caH1047R mice. d, Peri-lesional iron deposition stain in brains indicative of chronic bleed from four independent Krit1fl/fl;iPik3caH1047R mice at post-op day 21. Scale bars, 200 microns.
Extended Data Figure 6. Lineage tracing of AAV-Cre activity after direct injection into the mouse brain.
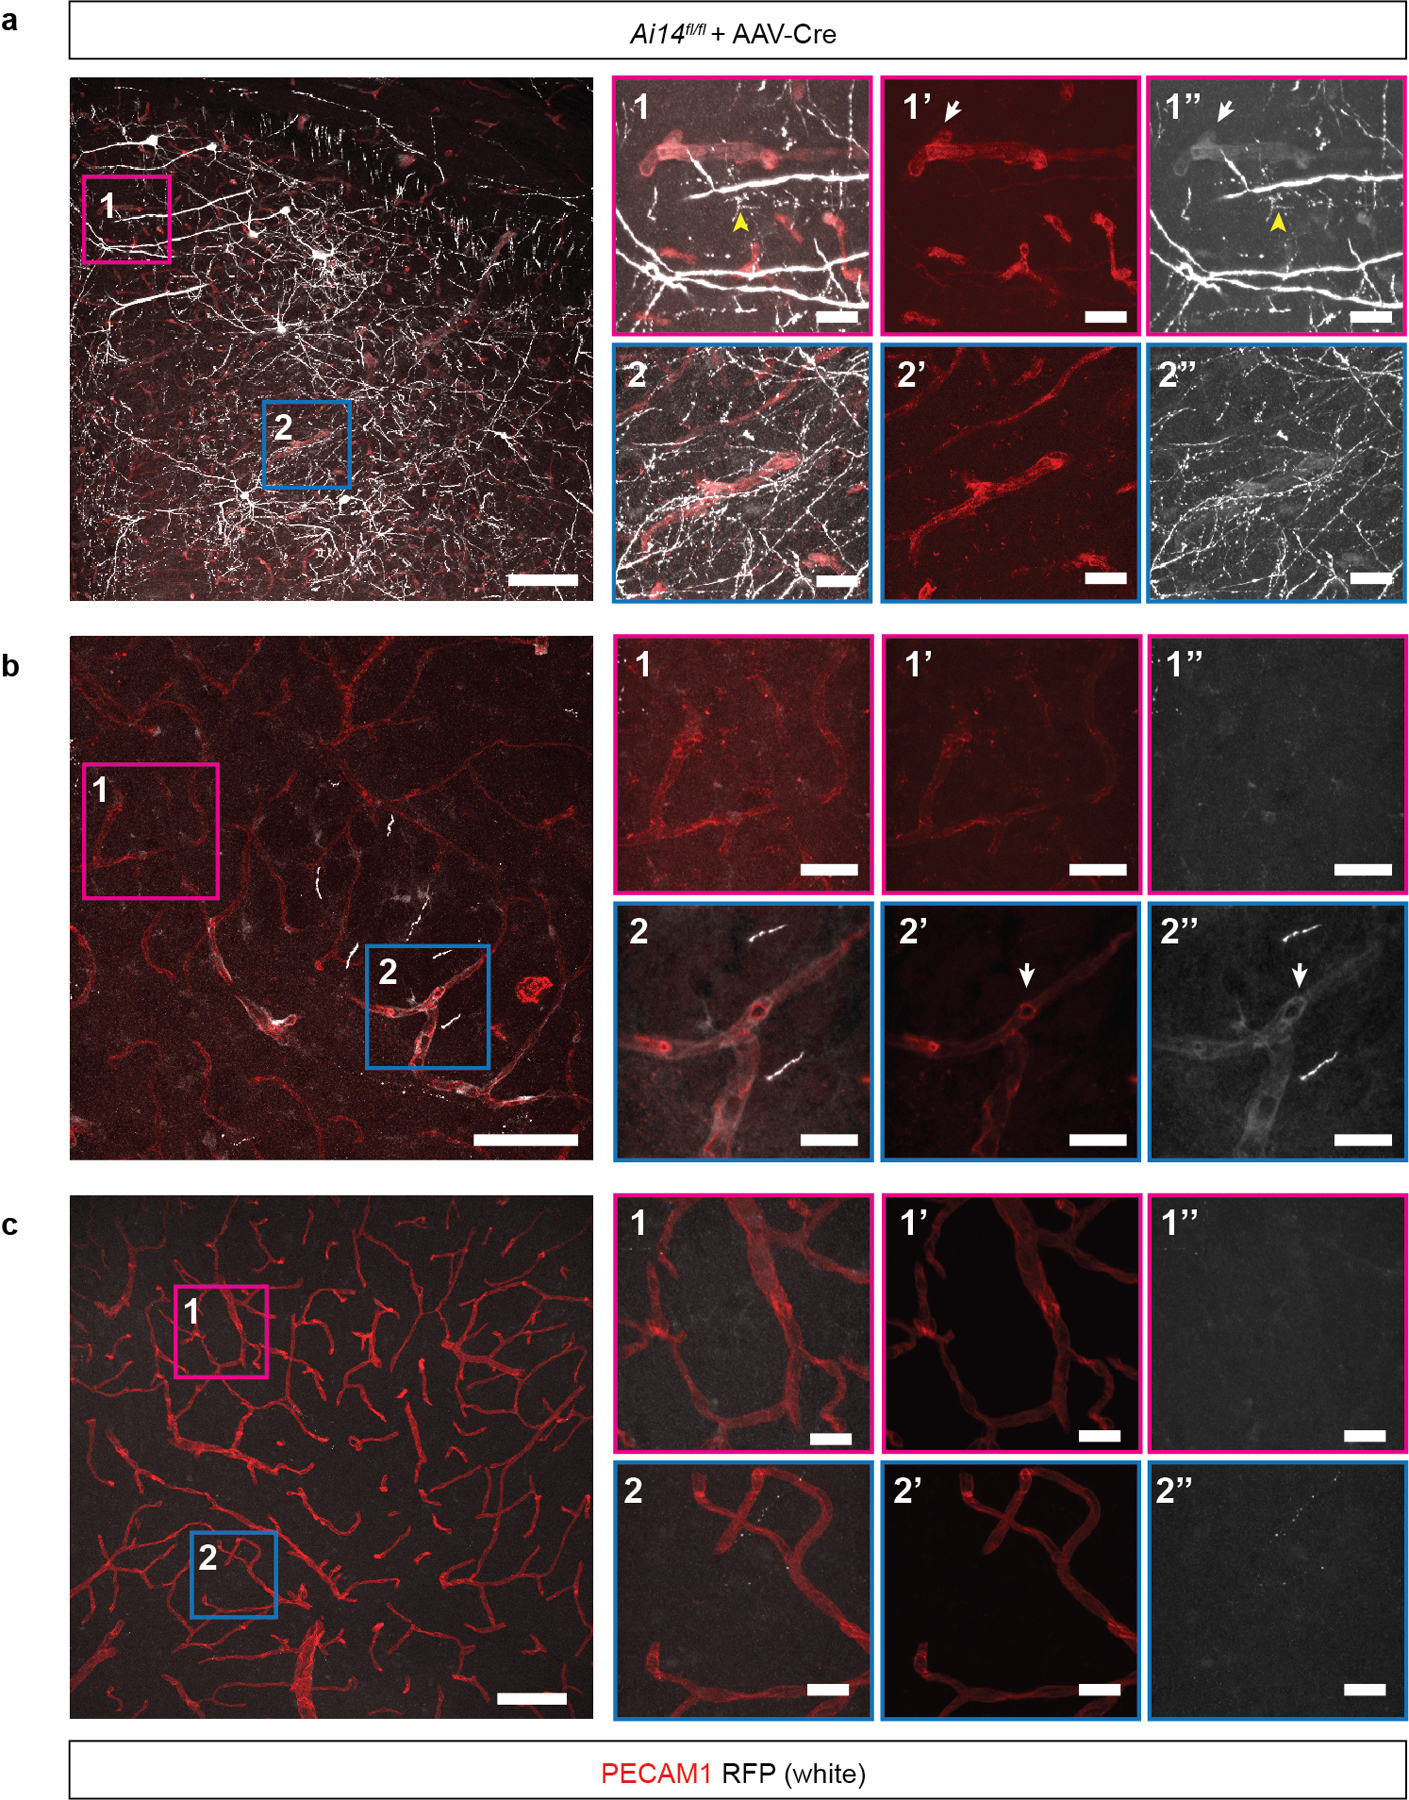
AAV-Cre virus was injected into the brain of Ai14 Cre reporter animals and Cre activity assessed by detection of the tdTomato (RFP) reporter 14 days after injection. a-c, Confocal microscopic overview from a, the injection site; b, the border region of the viral spread and c, the contralateral cortex of AAV-Cre injected Ai14 mice two weeks after stereotactic injection. AAV-Cre transduced cells expressed red fluorescent protein (RFP) (shown in white). RFP-positive vessels were identified by colocalization with PECAM1 (shown in red). White arrows point to representative RFP-positive vessels. Yellow arrowheads point to RFP-expressing neuronal cells. Scale bar, 100 microns. Boxed regions in 1 and 2 are shown at higher magnification on the right. 1 & 2 show PECAM1 staining for endothelial cells overlaid with RFP signal; 1’ & 2’ show PECAM staining alone; 1” & 2” shown RFP staining alone. These data are representative 12 separate images from 8 tissue sections from n=2 individual animals. Scale bar, 20 microns.
Extended Data Figure 7. Characterization of single-nucleus DNA sequencing of human CCM samples.
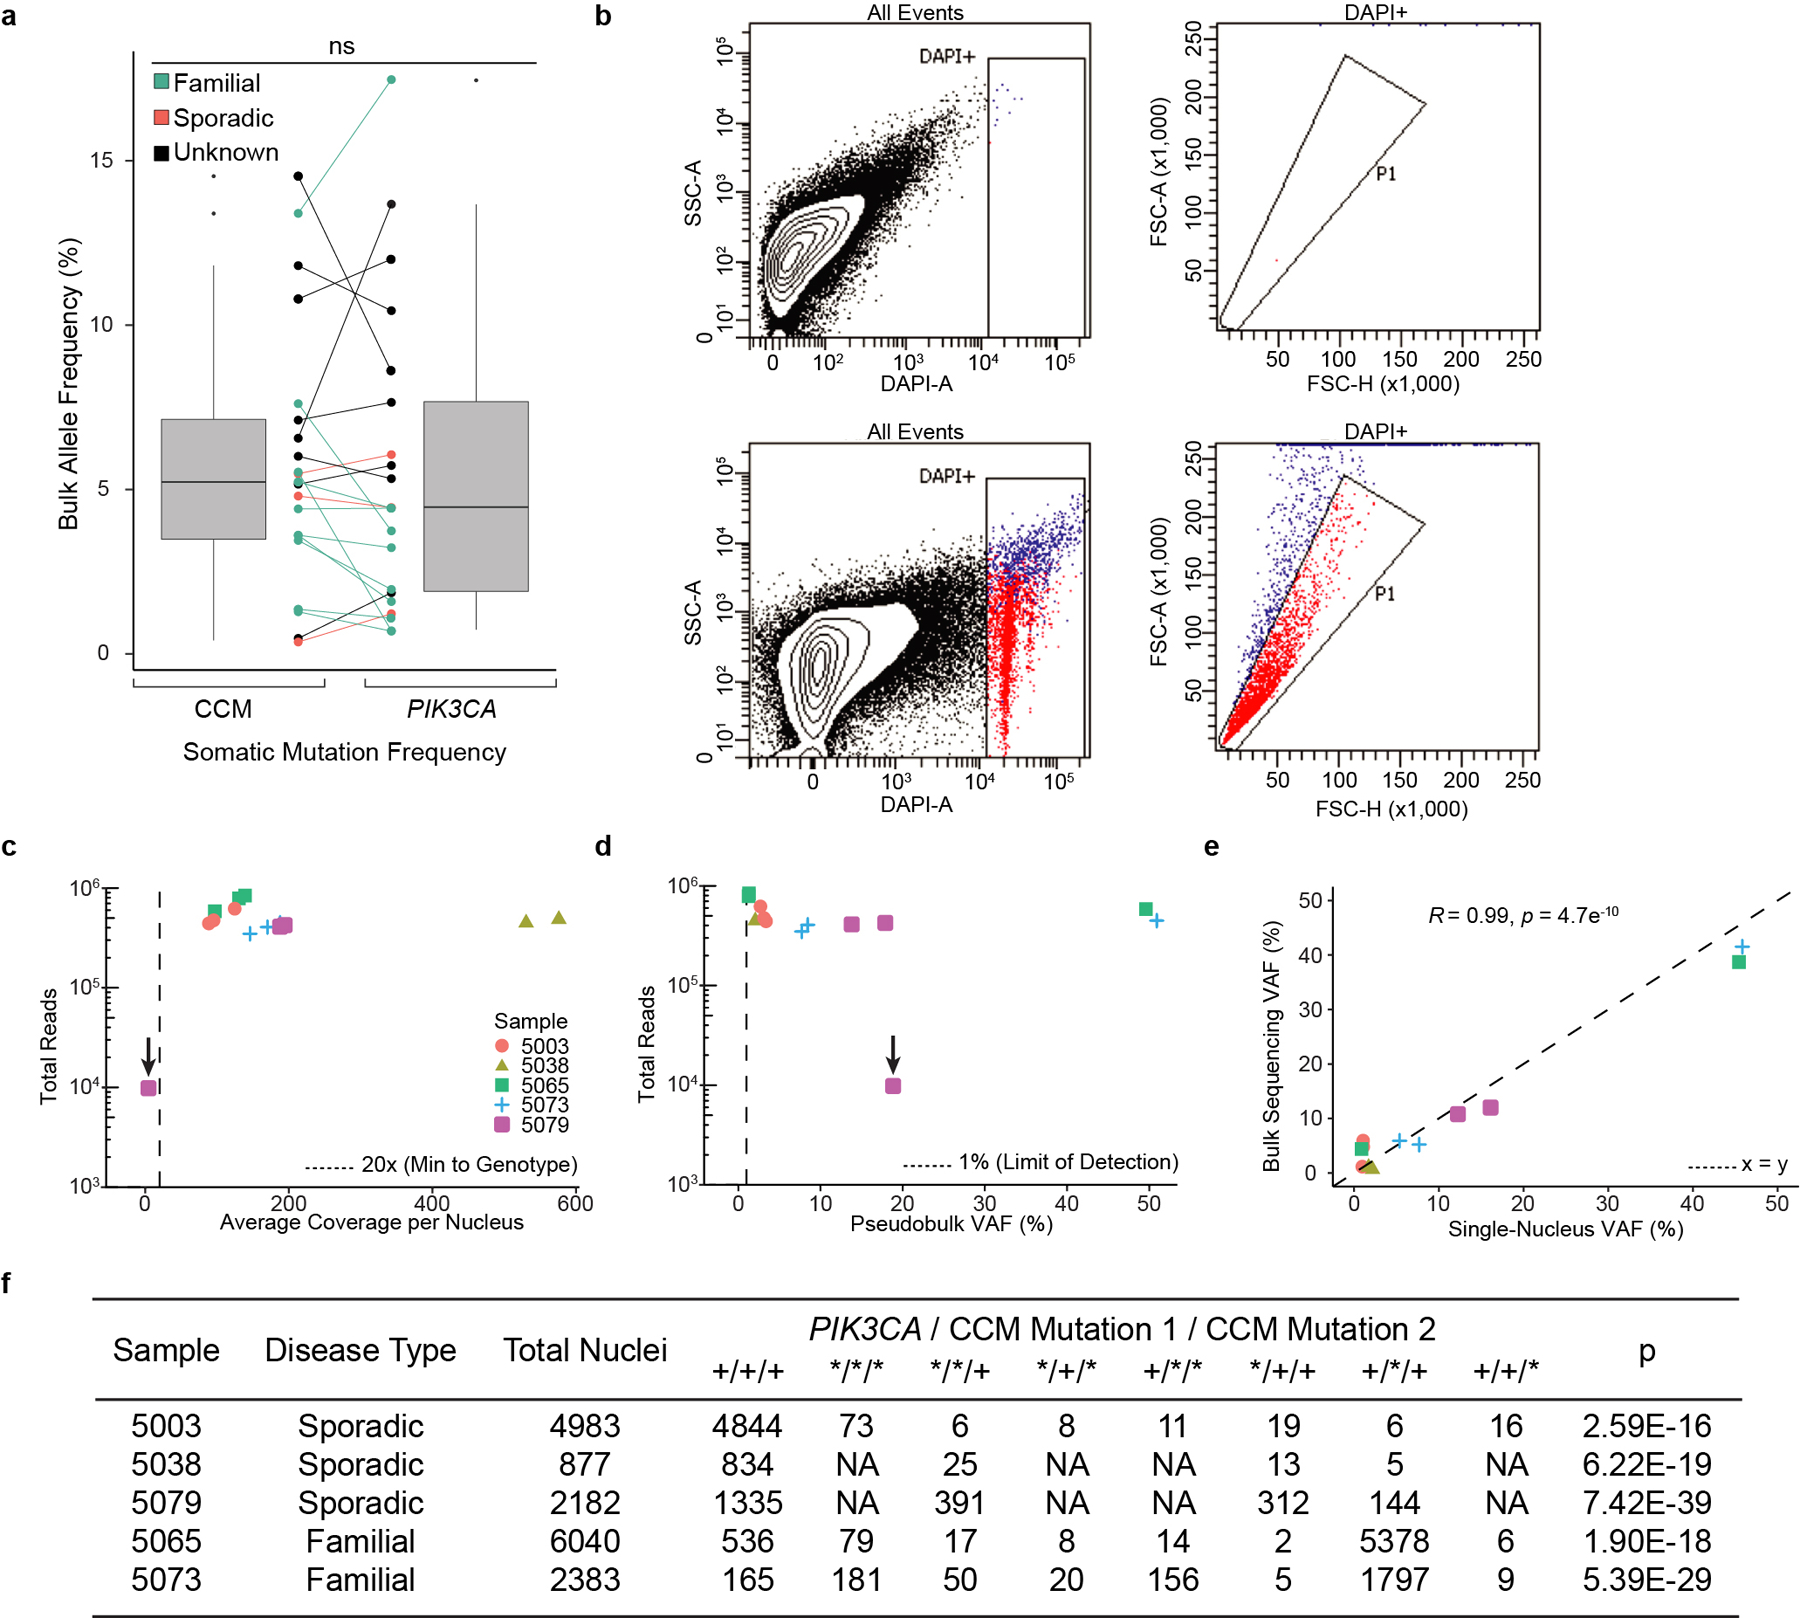
a, The relationship between somatic PIK3CA and CCM mutations detected in bulk sequencing is graphed. Points indicate individual mutations in either a CCM gene or PIK3CA. Lines connect the CCM gene and PIK3CA gene mutations present in a single sample. Box plots show the aggregate frequencies of PIK3CA and CCM mutations. Center lines show the medians; box limits indicate the 25th and 75th percentiles; whiskers extend 1.5 times the interquartile range from the 25th to 75th percentiles, outliers are represented by dots. n = 21 sample points for both plots. b, Representative FANS plots of unstained (top row) and DAPI stained (bottom row) CCM homogenate. Doublet discrimination by forward scatter profile for DAPI stained sample. Plots consist of 100,000 events. The unstained sample contains 1 event (0%) in the DAPI+ singlet gate. The DAPI stained samples contains 2,414 events (2.4%) in the DAPI+ singlet gate. c, Total reads and average coverage per nucleus from snDNAseq for each mutation detected by bulk sequencing. Dotted line shows 20x coverage, the minimum cutoff used for establishing genotype. d, Pseudobulk allele frequency from snDNA-seq for each mutation detected by bulk sequencing. Dotted line shows 1% allele frequency. Note the data point with the arrow in c-d shows a mutation in sample 5079 detected in bulk sequencing which, due to poor amplification during snDNA-seq, received insufficient coverage per nucleus (4.5x) to establish nuclear genotypes however is clearly present in pseudobulk reads (1849/9814). e, Comparison of mutation allele frequency as detected by bulk and snDNA-seq. As nuclei are diploid for the relevant autosomes, the x-axis is equal to the fraction of mutant nuclei divided by two. Dotted line shows perfect correlation at x=y. R and p were calculated by Pearson’s correlation coefficient. f, A summary of snDNA-seq results for 3 sporadic and 2 familial CCMs analyzed is shown. The number of nuclei with each possible genotype are listed. + indicates a wild-type allele; * indicates a mutant allele. Note that only 1 somatic CCM mutation was identified in samples 5038 and 5079. P values were determined by two-tailed chi-squared test between the observed and expected triple mutant nuclei (or double mutant for lesions 5038 and 5079) determined by Poisson distribution (see Methods).
Extended Data Figure 8. PI3K signaling does not augment MEKK3-KLF2/4 signaling.
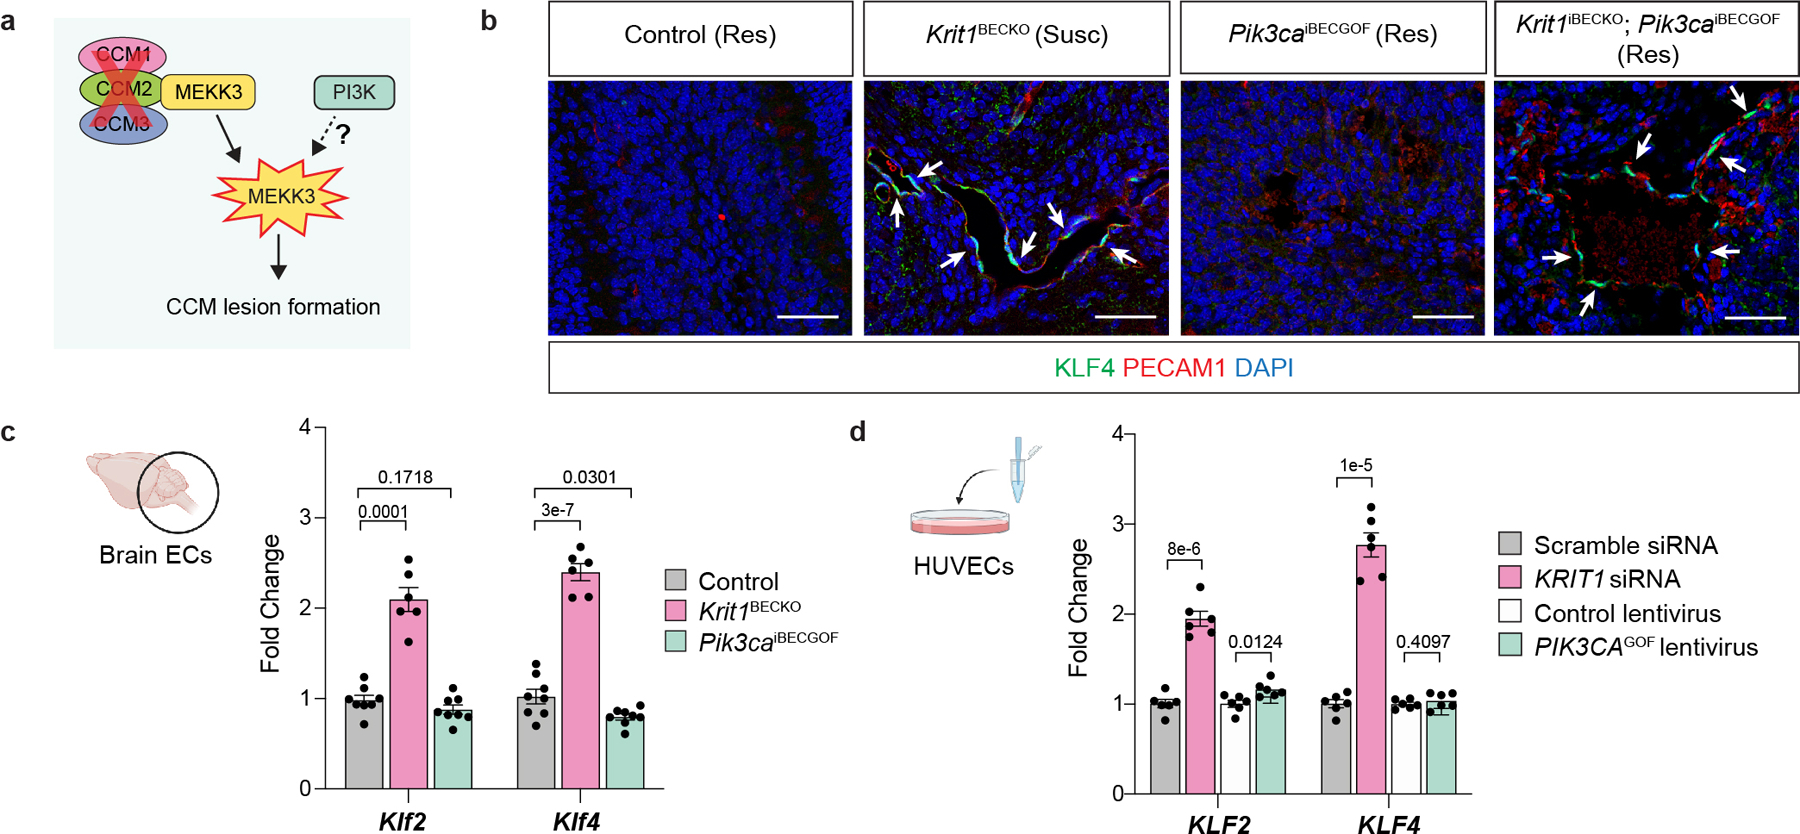
a, Diagram of how gain of PI3K signaling might augment CCM formation by acting upstream of MEKK3-KLF2/4 signaling in endothelial cells. b, Immunostaining for KLF4 and the endothelial cell marker PECAM1 in hindbrain sections from P6 control, Krit1BECKO, Pik3caiBECGOF, and Krit1iBECKO;Pik3caiBECGOF neonates with either a susceptible (Susc) or resistant (Res) gut microbiome is shown. White arrows indicate endothelial cell nuclear KLF4 staining. Immunofluorescence images representative of 10 tissue sections from n=4 individual animals/genotype. Control animals are either Slco1c1-Cre;Krit1fl/+ or Krit1fl/fl. Scale bars, 50 microns. c, Measurement of Klf2 and Klf4 mRNA in endothelial cells isolated from the hindbrains of P6 control, Krit1BECKO and Pik3caiBECGOF neonates. (Control, n=8; Krit1BECKO, n=6; Pik3caiBECGOF, n=8). d, Measurement of KLF2 and KLF4 mRNA in human umbilical vein endothelial cells (HUVECs) treated with the indicated siRNAs or lentiviral vectors. (n=6 individual wells/group over 2 independent experiments). Data are mean ± s.e.m. Unpaired, two-tailed Welch’s t-test.
Extended Data Figure 9. The CCM effector KLF4 augments endothelial cell PI3K-mTORC1 signaling.
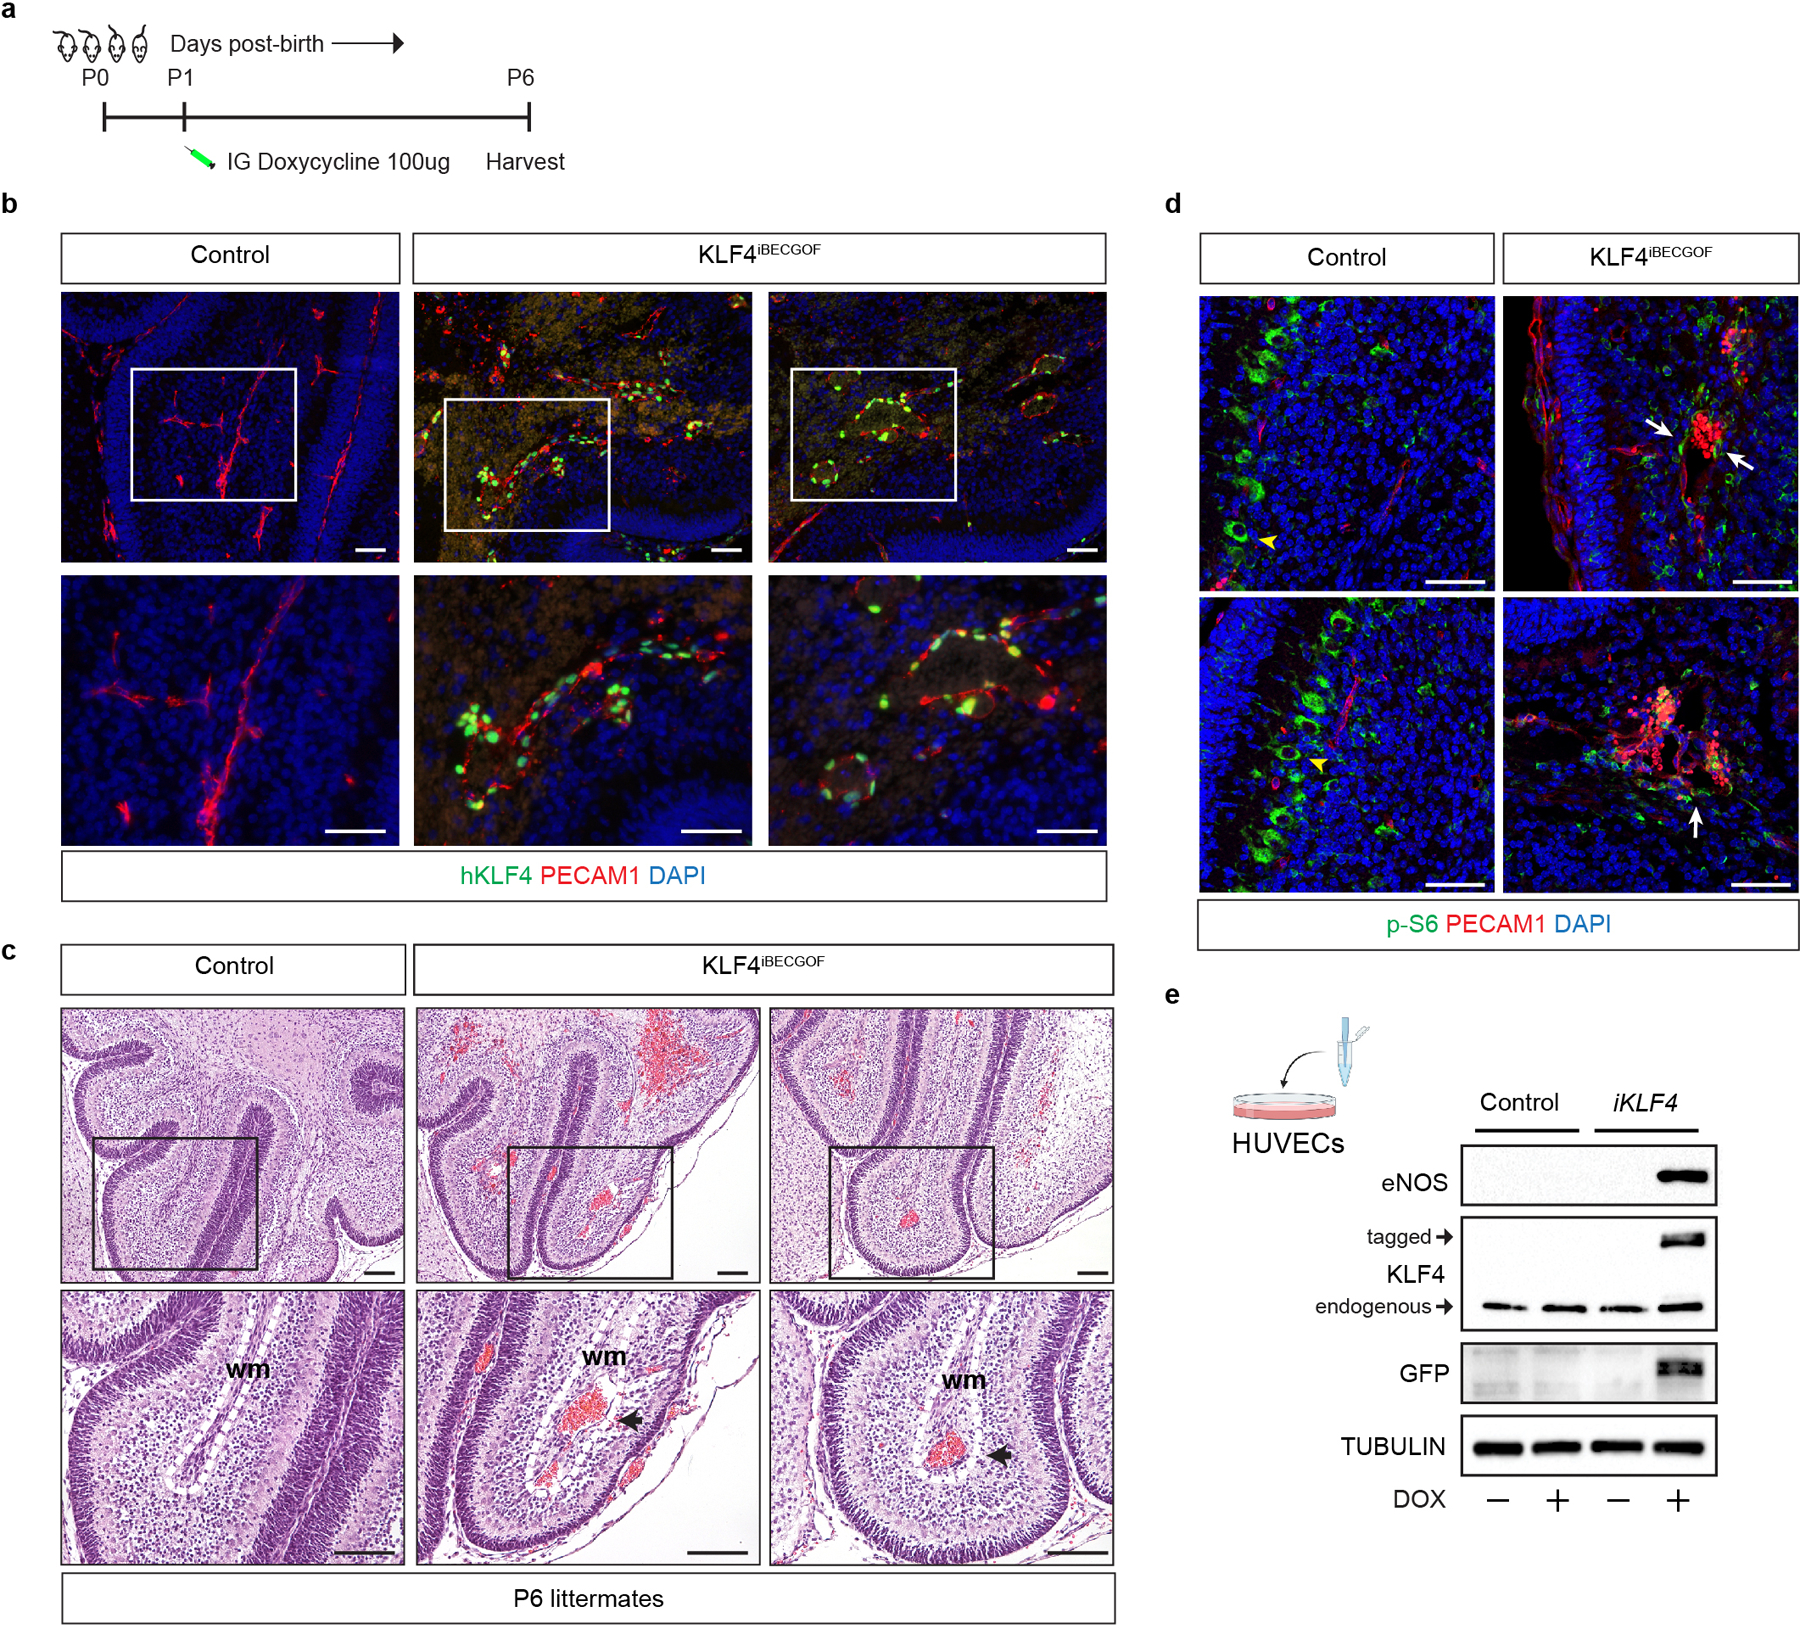
a, Schematic of neonatal endothelial induction of KLF4 expression in KLF4iBECGOF animals. b, Immunostaining for KLF4 and the endothelial cell marker PECAM1 in hindbrain sections from P6 control and KLF4iBECGOF animals is shown. Boxes in upper images denote area of magnified image immediately below. Immunofluorescence images representative of 6 tissue sections from n=4 individual animals/genotype. Scale bars, 50 microns. c, H-E stained sections of hindbrain from control and KLF4iBECGOF littermates. Boxes in upper images denote area of magnified image immediately below. Black arrows indicate lesions. Dotted lines outline the white matter of the cerebellum. wm, white matter. Note the dilated white matter venules similar to those observed with CCM loss of function and PIK3CA gain of function shown in Extended Data Figure 2. H-E histology representative of 6 tissue sections from n=4 animals/genotype. Scale bars, 0.1mm. d, Immunostaining for phospho-S6 ribosomal protein (p-S6) and the endothelial cell marker PECAM1 in hindbrain sections from P6 control and KLF4iBECGOF animals is shown. White arrows indicate p-S6 positive endothelial cells. Yellow arrowheads into non-endothelial p-S6 positive cells. Immunofluorescence images representative of 6 tissue sections from n=4 individual animals/genotype. Scale bars, 50 microns. e, Immunoblot detection of KLF4, KLF4-GFP, the KLF4 target gene eNOS in HUVECs without and with inducible lentiviral expression of KLF4-GFP (“iKLF4” cells) or control lentivirus. TUBULIN is shown as a loading control.
Extended Data Figure 10. Rapamycin rescue of CCM formation is independent of KLF4.
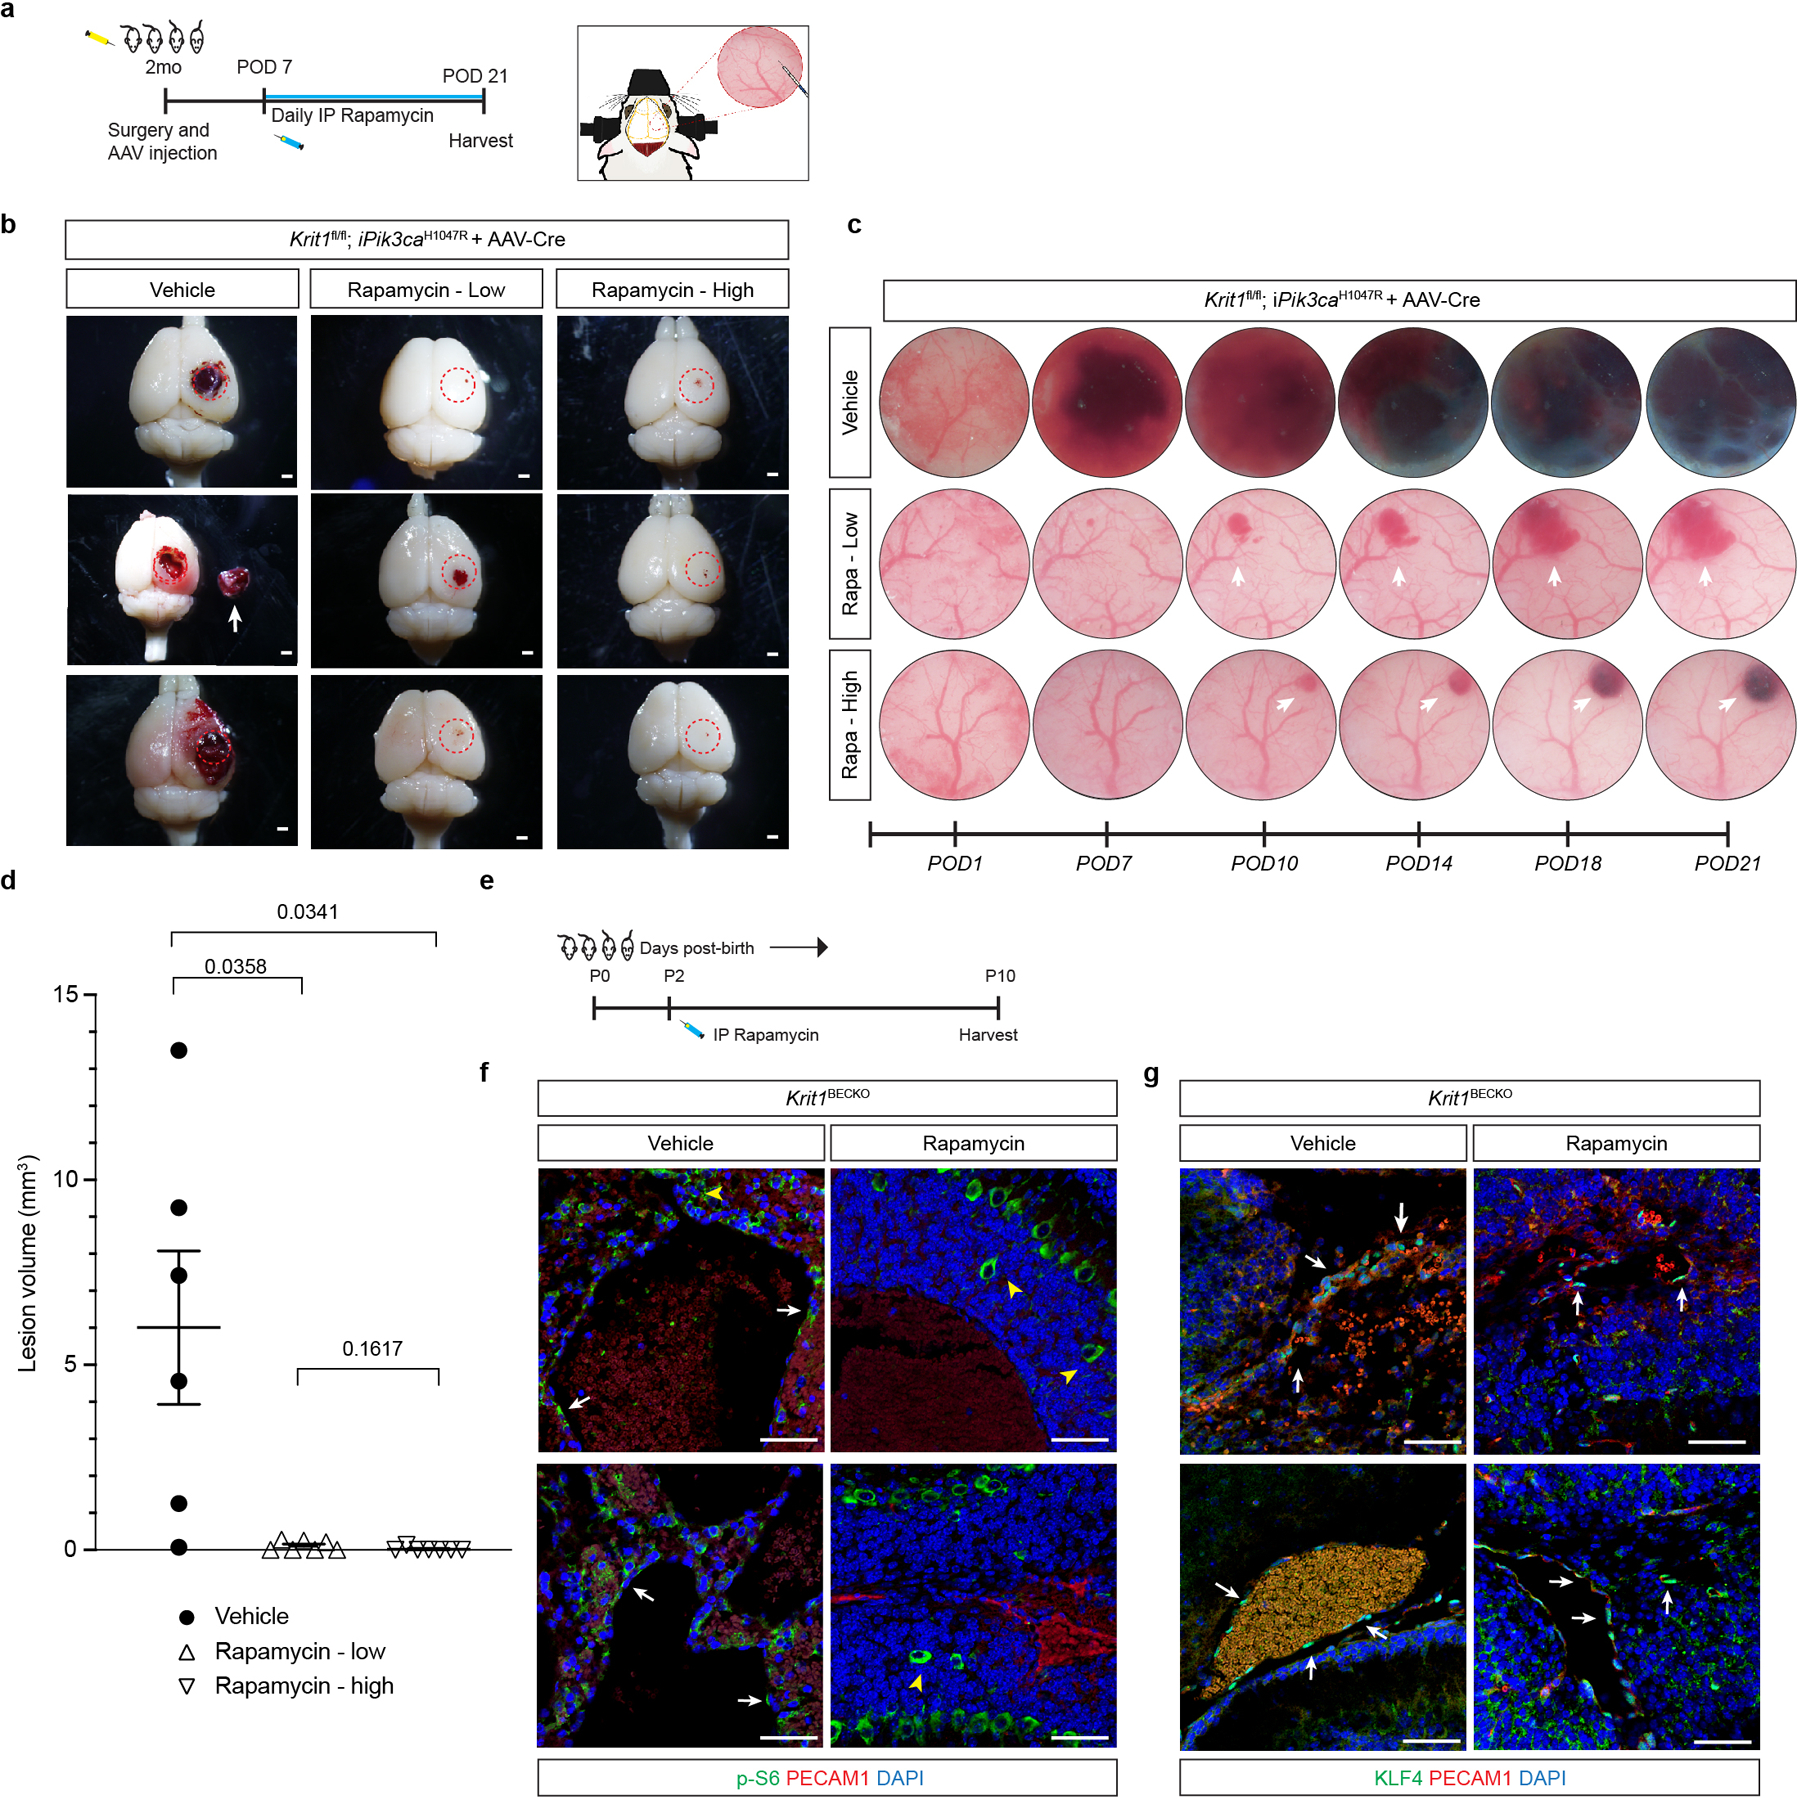
a, A schematic of the experimental approach in which a cranial window is created and AAV-Cre virus injected into the brains of 2 month old mice and along with daily injection of vehicle, 100ug of Rapamycin (Rapa-low), or 400ug of Rapamycin (Rapa-high) started at post-op day 7 continuing through post-op day 21 with serial imaging at post-op day 1, 7, 10, 14, 18, and 21. b, Representative visual images of brains harvested 21 days after injection of AAV-Cre and 2 weeks of daily vehicle or rapamycin (low dose/high dose) treatment in Krit1fl/fl;iPik3caH1047R mice. Dotted circles indicate the site of cranial window and AAV-Cre injection. Arrows indicate detached lesions. Scale bars, 1mm. c, Serial images obtained through the same cranial window of Krit1fl/fl;iPik3caH1047R mice following injection of AAV-Cre and subsequent treatment. Arrows indicate formation and growth of individual cavernous malformations. d, MicroCT quantitation of lesion volumes 21 days after creation of the cranial window and injection of AAV-Cre. Values include duplication of microCT values in Figure 4 (vehicle and low dose treatments). (Vehicle, n=6; Rapa-low, n=7; Rapa-high, n=7). Data are mean ± s.e.m. Unpaired, two-tailed Welch’s t-test. e, Schematic of neonatal endothelial induction of Krit1 deletion and treatment with Rapamyin or vehicle control at P2. f, Immunostaining of hindbrain sections from P6 Krit1iBECKO animals treated with vehicle or Rapamycin for PECAM1 and p-S6. White arrows indicate p-S6 positive endothelial cells in the control but not the Rapmycin treated animal. Yellow arrowheads indicate p-S6 positive neuronal cells. g, Immunostaining of hindbrain sections from P6 Krit1iBECKO animals treated with vehicle or Rapamycin for PECAM1 and KLF4. White arrows indicate KLF4-positive endothelial cells detected in the control and in the Rapmycin treated animal. Scale bars, 50 microns.
Supplementary Material
Acknowledgements:
We thank the members of the Kahn lab for their thoughtful comments and advice during this work. We thank Angioma Alliance for patient enrollment, and the University of Chicago PaleoCT core facility for its expertise in imaging and image quantitation. We thank the Penn CDB Microscopy Core for support with microscopy. Flow cytometry was performed in the Duke Human Vaccine Institute Research Flow Cytometry Shared Resource Facility. We thank Duke University School of Medicine for use of the Sequencing and Genomic Technologies Shared Resource for library preparation and sequencing. These studies were supported by National Institute of Health grants R01HL094326 and R01NS100949 (MK), P01NS092521 (MK, DM, IA) the Leducq Foundation (MK, MP), the AHA-Allen foundation (MK), T32 HL007150 (AR), F31HL152738 (DS), F31NS115256 (CH), F30NS100252 (AT), European Research Council (ERC) Synergy Grant-2019-WATCH-810331 (MS) and ERC Consolidator Grant EMERGE-773047 (MP).
Footnotes
Competing interests: The authors declare no competing financial interests. IAA is Chairman of the Scientific Advisory Board for Angioma Alliance and provides expert opinions related to clinical care of cerebral cavernous malformations.
Materials availability: Transgenic mouse lines not available through public repositories are available from Mark Kahn under a material transfer agreement with the University of Pennsylvania.
Code availability:
Variant calling software was implemented as part of Gonomics, an ongoing effort to develop an open-source genomics platform in the Go programming language. Gonomics can be accessed at github.com/vertgenlab/gonomics.
Data availability:
The data that support the findings of this study are available from the corresponding author upon reasonable request. DNA sequencing data are available on request from DM. The data are not publicly available due to them containing information that could compromise research participant privacy and consent. Public datasets used in this research are available at the following links: COSMIC (cancer.sanger.ac.uk/cosmic), dbSNP (ncbi.nlm.nih.gov/snp), 1000 Genomes Project (internationalgenome.org), ExAC (gnomad.broadinstitute.org)
References
- 1.Cuttano R et al. KLF4 is a key determinant in the development and progression of cerebral cavernous malformations. EMBO Mol Med, (2015). [DOI] [PMC free article] [PubMed]
- 2.Zhou Z et al. Cerebral cavernous malformations arise from endothelial gain of MEKK3-KLF2/4 signalling. Nature 532, 122–126, (2016). [DOI] [PMC free article] [PubMed] [Google Scholar]
- 3.Renz M et al. Regulation of beta1 integrin-Klf2-mediated angiogenesis by CCM proteins. Dev Cell 32, 181–190, (2015). [DOI] [PubMed] [Google Scholar]
- 4.Otten C et al. Systematic pharmacological screens uncover novel pathways involved in cerebral cavernous malformations. EMBO Mol Med 10, (2018). [DOI] [PMC free article] [PubMed] [Google Scholar]
- 5.Tang AT et al. Endothelial TLR4 and the microbiome drive cerebral cavernous malformations. Nature 545, 305–310, (2017). [DOI] [PMC free article] [PubMed] [Google Scholar]
- 6.Fischer A, Zalvide J, Faurobert E, Albiges-Rizo C & Tournier-Lasserve E Cerebral cavernous malformations: from CCM genes to endothelial cell homeostasis. Trends Mol Med 19, 302–308, (2013). [DOI] [PubMed] [Google Scholar]
- 7.Fisher OS & Boggon TJ Signaling pathways and the cerebral cavernous malformations proteins: lessons from structural biology. Cellular and molecular life sciences : CMLS 71, 1881–1892, (2014). [DOI] [PMC free article] [PubMed] [Google Scholar]
- 8.Plummer NW, Zawistowski JS & Marchuk DA Genetics of cerebral cavernous malformations. Curr Neurol Neurosci Rep 5, 391–396 (2005). [DOI] [PubMed] [Google Scholar]
- 9.Al-Shahi Salman R et al. Untreated clinical course of cerebral cavernous malformations: a prospective, population-based cohort study. Lancet Neurol 11, 217–224, (2012). [DOI] [PMC free article] [PubMed] [Google Scholar]
- 10.Awad IA & Polster SP Cavernous angiomas: deconstructing a neurosurgical disease. J Neurosurg 131, 1–13, (2019). [DOI] [PMC free article] [PubMed] [Google Scholar]
- 11.Porter PJ, Willinsky RA, Harper W & Wallace MC Cerebral cavernous malformations: natural history and prognosis after clinical deterioration with or without hemorrhage. J Neurosurg 87, 190–197, (1997). [DOI] [PubMed] [Google Scholar]
- 12.Boulday G et al. Developmental timing of CCM2 loss influences cerebral cavernous malformations in mice. J Exp Med, (2011). [DOI] [PMC free article] [PubMed]
- 13.Maddaluno L et al. EndMT contributes to the onset and progression of cerebral cavernous malformations. Nature 498, 492–496, (2013). [DOI] [PubMed] [Google Scholar]
- 14.Detter MR, Snellings DA & Marchuk DA Cerebral Cavernous Malformations Develop Through Clonal Expansion of Mutant Endothelial Cells. Circ Res 123, 1143–1151, (2018). [DOI] [PMC free article] [PubMed] [Google Scholar]
- 15.Malinverno M et al. Endothelial cell clonal expansion in the development of cerebral cavernous malformations. Nat Commun 10, 2761, (2019). [DOI] [PMC free article] [PubMed] [Google Scholar]
- 16.Ramirez-Zamora A & Biller J Brainstem cavernous malformations: a review with two case reports. Arq Neuropsiquiatr 67, 917–921, (2009). [DOI] [PubMed] [Google Scholar]
- 17.Castro M et al. CDC42 Deletion Elicits Cerebral Vascular Malformations via Increased MEKK3-Dependent KLF4 Expression. Circ Res 124, 1240–1252, (2019). [DOI] [PubMed] [Google Scholar]
- 18.Hong CC et al. Cerebral cavernous malformations are driven by ADAMTS5 proteolysis of versican. J Exp Med 217, (2020). [DOI] [PMC free article] [PubMed] [Google Scholar]
- 19.Lissbrant IF, Lissbrant E, Persson A, Damber JE & Bergh A Endothelial cell proliferation in male reproductive organs of adult rat is high and regulated by testicular factors. Biol Reprod 68, 1107–1111, (2003). [DOI] [PubMed] [Google Scholar]
- 20.Samuels Y et al. Mutant PIK3CA promotes cell growth and invasion of human cancer cells. Cancer Cell 7, 561–573, (2005). [DOI] [PubMed] [Google Scholar]
- 21.Rodriguez-Laguna L et al. Somatic activating mutations in PIK3CA cause generalized lymphatic anomaly. J Exp Med 216, 407–418, (2019). [DOI] [PMC free article] [PubMed] [Google Scholar]
- 22.Castillo SD et al. Somatic activating mutations in Pik3ca cause sporadic venous malformations in mice and humans. Sci Transl Med 8, 332ra343, (2016). [DOI] [PMC free article] [PubMed] [Google Scholar]
- 23.Castel P et al. Somatic PIK3CA mutations as a driver of sporadic venous malformations. Sci Transl Med 8, 332ra342, (2016). [DOI] [PMC free article] [PubMed] [Google Scholar]
- 24.Luks VL et al. Lymphatic and other vascular malformative/overgrowth disorders are caused by somatic mutations in PIK3CA. J Pediatr 166, 1048–1054 e1041–1045, (2015). [DOI] [PMC free article] [PubMed] [Google Scholar]
- 25.Limaye N et al. Somatic Activating PIK3CA Mutations Cause Venous Malformation. Am J Hum Genet 97, 914–921, (2015). [DOI] [PMC free article] [PubMed] [Google Scholar]
- 26.Storck SE et al. Endothelial LRP1 transports amyloid-beta(1–42) across the blood-brain barrier. J Clin Invest 126, 123–136, (2016). [DOI] [PMC free article] [PubMed] [Google Scholar]
- 27.Rigamonti D et al. Cerebral cavernous malformations. Incidence and familial occurrence. N Engl J Med 319, 343–347 (1988). [DOI] [PubMed] [Google Scholar]
- 28.Dogruluk T et al. Identification of Variant-Specific Functions of PIK3CA by Rapid Phenotyping of Rare Mutations. Cancer Res 75, 5341–5354, (2015). [DOI] [PMC free article] [PubMed] [Google Scholar]
- 29.Gault J, Shenkar R, Recksiek P & Awad IA Biallelic somatic and germ line CCM1 truncating mutations in a cerebral cavernous malformation lesion. Stroke 36, 872–874, (2005). [DOI] [PubMed] [Google Scholar]
- 30.Akers AL, Johnson E, Steinberg GK, Zabramski JM & Marchuk DA Biallelic somatic and germline mutations in cerebral cavernous malformations (CCMs): evidence for a two-hit mechanism of CCM pathogenesis. Hum Mol Genet 18, 919–930, (2009). [DOI] [PMC free article] [PubMed] [Google Scholar]
- 31.McDonald DA et al. Lesions from patients with sporadic cerebral cavernous malformations harbor somatic mutations in the CCM genes: evidence for a common biochemical pathway for CCM pathogenesis. Hum Mol Genet 23, 4357–4370, (2014). [DOI] [PMC free article] [PubMed] [Google Scholar]
- 32.Xu L et al. Clonal Evolution and Changes in Two AML Patients Detected with A Novel Single-Cell DNA Sequencing Platform. Sci Rep 9, 11119, (2019). [DOI] [PMC free article] [PubMed] [Google Scholar]
- 33.Lopez-Ramirez MA et al. Thrombospondin1 (TSP1) replacement prevents cerebral cavernous malformations. J Exp Med 214, 3331–3346, (2017). [DOI] [PMC free article] [PubMed] [Google Scholar]
- 34.Abdulrauf SI, Kaynar MY & Awad IA A comparison of the clinical profile of cavernous malformations with and without associated venous malformations. Neurosurgery 44, 41–46; discussion 46–47, (1999). [DOI] [PubMed] [Google Scholar]
- 35.Tan WH et al. The spectrum of vascular anomalies in patients with PTEN mutations: implications for diagnosis and management. J Med Genet 44, 594–602, (2007). [DOI] [PMC free article] [PubMed] [Google Scholar]
- 36.Adams DM et al. Efficacy and Safety of Sirolimus in the Treatment of Complicated Vascular Anomalies. Pediatrics 137, e20153257, (2016). [DOI] [PMC free article] [PubMed] [Google Scholar]
- 37.Ozeki M et al. The impact of sirolimus therapy on lesion size, clinical symptoms, and quality of life of patients with lymphatic anomalies. Orphanet J Rare Dis 14, 141, (2019). [DOI] [PMC free article] [PubMed] [Google Scholar]
- 38.Triana P et al. Sirolimus in the Treatment of Vascular Anomalies. Eur J Pediatr Surg 27, 86–90, (2017). [DOI] [PubMed] [Google Scholar]
- 39.Venot Q et al. Targeted therapy in patients with PIK3CA-related overgrowth syndrome. Nature 558, 540–546, (2018). [DOI] [PMC free article] [PubMed] [Google Scholar]
Methods References
- 40.Wang Y et al. Ephrin-B2 controls VEGF-induced angiogenesis and lymphangiogenesis. Nature 465, 483–486, (2010). [DOI] [PubMed] [Google Scholar]
- 41.Ridder DA et al. TAK1 in brain endothelial cells mediates fever and lethargy. J Exp Med 208, 2615–2623, (2011). [DOI] [PMC free article] [PubMed] [Google Scholar]
- 42.Claxton S et al. Efficient, inducible Cre-recombinase activation in vascular endothelium. Genesis 46, 74–80, (2008). [DOI] [PubMed] [Google Scholar]
- 43.Chan AC et al. Mutations in 2 distinct genetic pathways result in cerebral cavernous malformations in mice. J Clin Invest 121, 1871–1881, (2011). [DOI] [PMC free article] [PubMed] [Google Scholar]
- 44.Foster KW et al. Induction of KLF4 in basal keratinocytes blocks the proliferation-differentiation switch and initiates squamous epithelial dysplasia. Oncogene 24, 1491–1500, (2005). [DOI] [PMC free article] [PubMed] [Google Scholar]
- 45.Trotman LC et al. Pten dose dictates cancer progression in the prostate. PLoS Biol 1, E59, (2003). [DOI] [PMC free article] [PubMed] [Google Scholar]
- 46.Adams JR et al. Cooperation between Pik3ca and p53 mutations in mouse mammary tumor formation. Cancer Res 71, 2706–2717, (2011). [DOI] [PubMed] [Google Scholar]
- 47.Korbelin J et al. A brain microvasculature endothelial cell-specific viral vector with the potential to treat neurovascular and neurological diseases. EMBO Mol Med 8, 609–625, (2016). [DOI] [PMC free article] [PubMed] [Google Scholar]
- 48.Hurst CD, Zuiverloon TC, Hafner C, Zwarthoff EC & Knowles MA A SNaPshot assay for the rapid and simple detection of four common hotspot codon mutations in the PIK3CA gene. BMC Res Notes 2, 66, (2009). [DOI] [PMC free article] [PubMed] [Google Scholar]
- 49.Martelotto LG ‘Frankenstein’ protocol for nuclei isolation from fresh and frozen tissue for snRNAseq. protocols.io (2020).
Associated Data
This section collects any data citations, data availability statements, or supplementary materials included in this article.
Supplementary Materials
Data Availability Statement
The data that support the findings of this study are available from the corresponding author upon reasonable request. DNA sequencing data are available on request from DM. The data are not publicly available due to them containing information that could compromise research participant privacy and consent. Public datasets used in this research are available at the following links: COSMIC (cancer.sanger.ac.uk/cosmic), dbSNP (ncbi.nlm.nih.gov/snp), 1000 Genomes Project (internationalgenome.org), ExAC (gnomad.broadinstitute.org)


