

Summary
The Nutrition Transition model is presented with the nature and pace of change in key stages varying by location and subpopulations. At present, all high‐income and many low‐ and middle‐income countries are in a stage of the transition where nutrition‐related noncommunicable diseases including obesity, type 2 diabetes, and hypertension are dominating adult morbidity and mortality and are very high or growing rapidly in prevalence. Some countries still have key subpopulations facing hunger and undernutrition defined by stunting or extreme thinness among adults. We call these double burden of malnutrition countries. All low‐ and middle‐income countries face rapid growth in consumption of ultra‐processed food and beverages, but it is not inevitable that these countries will reach the same high levels of consumption seen in high‐income countries, with all the negative impacts of this diet on health. With great political and civil society commitment to adoption of policies shown in other countries to have improved dietary choices and social norms around foods, we can arrest and even reverse the rapid shift to diets dominated by a stage of high ultra‐processed food intake and increasing prevalence of nutrition‐related noncommunicable diseases.
Keywords: double burden of malnutrition, front‐of‐package labeling, Nutrition Transition, obesity, taxation, ultra‐processed food
Abbreviations
- UPFs
ultra‐processed foods
- NCDs
noncommunicable diseases
- LMICs
low‐ and middle‐income countries
- DBM
double burden of malnutrition
- BMI
body mass index
- NR‐NCDs
nutrition‐related noncommunicable diseases
- FOP
front‐of‐package
1. INTRODUCTION
Over the last three to four decades, many countries and regions have dramatically moved into the stage of the nutrition transition defined by high consumption of ultra‐processed foods (UPFs) and significant reductions in physical activity. Accompanying this stage are rapid increases in prevalence of overweight‐obesity and other nutrition‐related noncommunicable diseases (NCDs), such as diabetes, hypertension, other aspects of coronary heart disease, and 13 of the 15 major cancers. 1 , 2 , 3 , 4 We have learned much about the nutrition transition's implications for both diet and body composition and about the key drivers causing NCDs. Economic and related demographic changes have produced increased income, urbanization, mass media and marketing, technological advances, and global trade in services, goods, and technology. Moreover, during the last decade, we also accrued an understanding of national‐level policies that can significantly slow the dietary changes that contribute to increasing NCDs.
Today, almost every country in the world is experiencing these changes. Sub‐Saharan Africa (SSA), South Asia, and certain low‐ and middle‐income countries (LMICs), such as Indonesia, Haiti, and Myanmar, are rapidly entering this stage of high NCDs, including overweight/obesity. 5 Many countries, including India, Indonesia, and SSA countries, face high levels of the double burden of malnutrition (DBM), a prevalence of both individuals with undernutrition and overweight/obesity. 5 , 6 Add micronutrient malnutrition, and many countries face an enormous triple burden of malnutrition. 7 , 8 At the same time, we have found that in every country in the world, more than 20% of adults have overweight or obesity, 5 and in an increasing number of countries, 30–60% of adults have overweight or obesity. There are less than 20 countries below this 30% cutoff, including Myanmar and countries in South Asia and sub‐Saharan Africa. 5 , 6 , 9 For many, overweight status brings a significant increase in major NCDs, which we see globally especially among non‐White Hispanics, South Asians, Chinese, and others at body mass indexes (BMIs) > 25 kg/m2. 10 , 11 , 12 , 13
In much of the globe now, our food production and processing system increasingly focus on UPFs, highly processed hyperpalatable foods, 6 , 9 , 14 , 15 , 16 , 17 which we elaborate on below. These foods are characteristically high in added sodium, sugar, and saturated fats, use large proportions of highly refined grains, and represent the fastest growing segment of the food supply. 6 , 9 , 14 , 18 UPFs and food processing, itself, are key outcome at each stage of the nutrition transition. UPFs are linked with poor health rather than unique nutrients. 19 , 20 , 21 We should add that the high‐fat street foods found in so many LMICs also contribute significantly to poor dietary quality. 6 In many countries, such foods dominate the diet of lower‐income individuals or those middle‐ and higher‐income individuals who do not want to or are not able to cook. 22 , 23
As summarized in a recent paper 24 and dozens of individual studies noted below, we are learning how to slow this trend toward increased UPF consumption. UPFs represent a set of foods whose consumption is linked with a wide array of poor health outcomes ranging from increased weight to total mortality. 19 , 20 , 21 Scholars with the World Health Organization, the Food and Agriculture Organization of the United Nations, the United Nations Children's Fund, the World Bank, and most major health‐related foundations and societies have promoted policies to reduce UPF consumption. 6 , 14 , 25 , 26 , 27 , 28 , 29 , 30 , 31
This paper begins with a discussion of the nutrition transition, equity issues relating to populations or subpopulations with high or growing overweight/obesity incidence and prevalence, and the major drivers of higher rates of NCDs, including the modern processed food industry's prominence. We should note that the policies on which we focus can at best reduce health disparities, but they cannot lead to full health justice. 32 We then discuss the UPF revolution and the measures that have successfully slowed or even reversed the shift to high UPF consumption. We subsequently ask the question: Are the trends experienced to date inevitable? How can countries or regions who have yet to become overrun by UPFs learn lessons and leapfrog past the negative stages of the nutrition transition? We end with a discussion of policy options that, when undertaken appropriately, can help minimize or even avoid the negative stages. An important issue throughout is the problem of large disparities in health and designing policies that promote a reduction of health disparities.
2. THE NUTRITION TRANSITION
The nutrition transition model was proposed since the 1990s to describe the large shifts that have occurred in human diets and activity patterns. 33 These joint changes are reflected in nutritional outcomes, such as altered body size and body composition. 34 , 35 All countries seemed to be converging on diets high in saturated fat, sodium, sugar, and refined carbohydrates and low in fiber and other key natural components while retaining many aspects of their food preparation and dietary patterns. This phenomenon is often termed the “Western diet” because it is common among a large proportion of United States, United Kingdom, and European citizens. 36 , 37 At a global level, UPFs increasingly dominate this diet. 9 We have learned that the nature and pace of food pattern change vary significantly and show important differences according to location. Nevertheless, the net effects on nutritional status and health are similar. The model was developed using both global food availability data as well as within‐country, detailed, longitudinal data with great spatial variability. 38 , 39 , 40 , 41 , 42 , 43 , 44 , 45 It attempts to describe the internal variability and changes within countries as well as across countries over time. Thus, it gives us some sense of the complexity of changes within and between nations, by socioeconomic subpopulations, as well as the spatial dimension of urbanization. 46 , 47 , 48 , 49 One of the authors attempted to bring in biological issues as well, in more depth. 50
Concurrent changes in demographic, socioeconomic, spatial, and epidemiological outcomes are linked with those shifts in stages of the nutrition transition. Figure 1 presents the broad historical sweep of changes in demographic, health, and nutritional factors and shows how they are intertwined. Extant theories of change address the demographic and epidemiological transitions. One theory relates to the demographic transition or the shift from a pattern of high fertility and high mortality to one of low fertility and low mortality typical of modern industrialized nations. 51 The epidemiological transition theory, which A. R. Omran first described, is even more directly relevant. 52 The epidemiological transition describes the shift from a high prevalence of infectious diseases and malnutrition resulting from pestilence, famine, and poor environmental sanitation to a high prevalence of chronic and degenerative diseases. The concepts of demographic and epidemiological transitions focus on the ways populations move from one pattern to the next. The framework developed here mirrors these concepts with a wider sense of the complexity of spatial and temporal changes that decades of international health research have provided. 48
FIGURE 1.
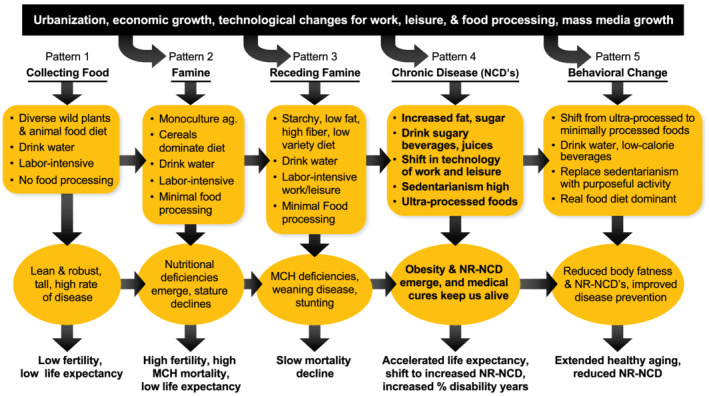
Stages of the nutrition transition
It is useful to briefly consider the nutrition transition in its detailed historical context. Five broad stages manifest the nutrition transition: (1) collecting food, (2) famine, (3) receding famine, (4) nutrition‐related chronic diseases, and (5) behavioral change. While most countries appear to have gone through all these states of the nutrition transition, there are some that by passed a stage, for example, jumping to quickly from the stage of famine to one of rising nutrition‐related NCDs. The major features of each are described below. These stages are neither restricted to periods of human history nor required to be of a specific span of time. Moreover, these shifts are far more complex than seen by a simple progression in linear fashion for a nation or even a region or major spatial and socioeconomic (or race‐ethnic) subpopulations. For convenience, we outline them in the past tense as historical developments. However, the “earlier” stages are not restricted to the periods in which they first arose but continue to characterize certain geographic and socioeconomic status (SES) subpopulations.
We do ascribe to this excellent quote:
Thus, understanding the transformations of the damage profile will require using less simplistic and reductive interpretations than the mere passage of time and the supposedly linear progress from one stage to another of economic development and carefully studying the causal constellations that give rise to it in each context. (Carolina and Gustavo, p. 347). 53
By this, we mean that these shifts are not simple, and the complexity of underlying determinants and the overall food environment vary so greatly within any country as well as across regions that change is much more complex as we lay out in a few regional case studies. 6 , 14
Stage 1—collecting food: All but a few remote groups have passed the Paleolithic period of collecting food. These hunters and gatherers had diets which were quite diverse and balanced and those reaching the age of 20 or older at full height were tall.
Stage 2—famine: Diets in this stage were quite simple with minimal variety in their diet and were subject to episodic periods of extreme food shortage. Scholars hypothesize that this stage was associated with nutritional stress and a reduction in stature, estimated by some at about 4 inches, from the earlier collecting food or hunter‐gatherer period. Over the past decade famine has been limited mainly to SSA, South Asia, North Korea, and refugees and migrant groups elsewhere. Even as we move into the period of receding famines (Stage 3) and even stage 4, it is important to note that famines can occur, related to conflicts (e.g., Kosovo, Yemen) or natural disasters (India, Sub‐Saharan Africa, droughts or floods) which may become more frequent and of longer duration with climate change.
Stage 3—receding famine: In areas facing high levels of the DBM (or triple burden of malnutrition) or we see slow continuous declines in stunting. In this stage consumption of fruits, vegetables, and animal protein increased, and starchy staples became less important in the diet. Many earlier civilizations made great progress in reducing chronic hunger and famines, but these changes became widespread and markedly impacted diets only in the last third of this stage. 5 , 6
Figure 2 and Tables S1 and S2 highlight the countries with significant DBMs. It is important to note few national surveys of micronutrient malnutrition exist. A joint document from the World Health Organization, United Nations Children's Fund, and World Bank identified countries with acute levels of stunting and defined the country‐level DBM as having a high prevalence of both individuals with undernutrition and overweight/obesity. We determined which countries had DBM: a prevalence of wasting >15%, or a prevalence of stunting >30% in children, or a prevalence of thinness in women >20%, and a prevalence of adult or child with overweight >20%, >30%, or >40%. (Note we use three overweight/obesity cutoffs as there is no global standard for what constitutes high overweight/obesity prevalence). The cutoffs for undernutrition are wasting at weight for height z‐score < −2 for children ages 0–4 and thinness at BMI < 18.5 for adult women. Overweight cutoffs are BMI z‐score > +2 in children under age 18 and BMI > 25 in adults 54 exceeding a prevalence of 20%, 30%, or 40% (Figure 2 and Tables S1 and S2).
FIGURE 2.
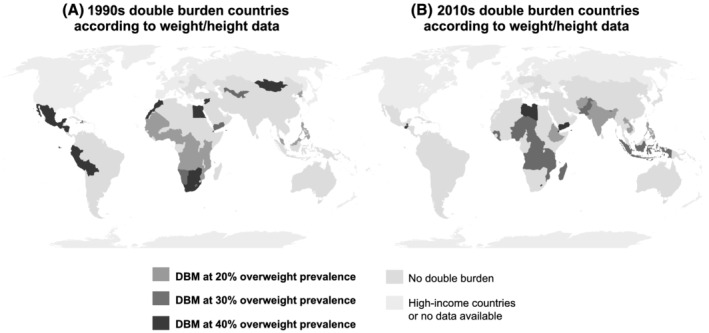
The global double burden of malnutrition in low‐ and middle‐income countries. Based on 1990s and 2010s weight and height data* (using UNICEF, WHO, World Bank, and NCD‐RisC estimates, supplemented with selected DHS and other country direct measures). Source: Popkin et al., lancet, 2020: 395 (10217): 65–74. 1 *double burden of malnutrition (DBM) = at least 1 child with stunting and 1 adult with overweight (at 20%, 30%, or 40% overweight prevalence)
Stage 4—Nutrition‐related noncommunicable diseases (NR‐NCDs): A diet high in total fat, cholesterol, sugar, and other refined carbohydrates and low in polyunsaturated fatty acids and fiber (e.g., a diet with a large proportion of UPFs), often accompanied by an increasingly sedentary life is the case in large proportions of the world today, even among subpopulations in countries with a high prevalence of the DBM. Figure 3 and Tables S1 and S2 present the global prevalence of individuals with overweight/obesity in the 1990s and 2010s. We use Demographic Health Survey data 55 when available and NCD Risk Factor Collaboration data when DHS data are not available. 4 , 56 We use a combination of overweight and obesity, because extensive epidemiological research associates a BMI of 25 or even lower with the risks of NCDs across a large proportion of LMICs. 11 , 12 , 13 , 50 , 57 , 58 , 59 , 60
FIGURE 3.
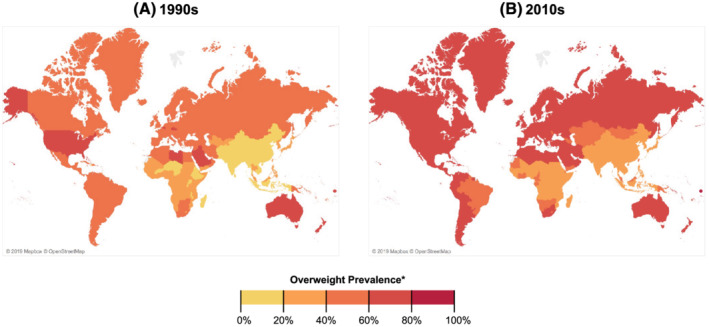
Prevalence of overweight and obesity based on 1990s and late 2010s weight and height data (using UNICEF, WHO, World Bank, and NCD‐RisC estimates, supplemented with selected DHS and other country direct measures). Countries colored according to highest overweight/obesity prevalence for either men or women
We have shown in one study of urbanization how communities can gain and lose infrastructure, factories, and other aspects of what constituted a modern society and shift backwards in the transition. 42 In other words, for natural or human‐made reasons (be it war or shifting investments in manufacturing and other infrastructure), there is potential to fall backwards in what is not a true inexorable shift toward a diet dominated by ultra‐processed foods, drinking less water and more high calorie beverages, and moving much less due to an array of technological changes. The degree of heterogeneity in just one component—food processing—is laid out in a detailed paper on the transition underway in SSA. 6
The transition into stage 4 represents a clash between our biology and modern food science and technology. For instance, we need to drink water at least every 2 to 3 days, but we can survive without food for 1 to 2 months. By evolving our metabolic system such that drinking water does not interfere with episodic food intake (and possibly gorging of food), humans were able to survive and thrive through early hunter‐gathers experienced periods with sporadic or seasonal hunger. However, consumption of the highly palatable beverages with added sugar or 100% fruit juice that have replaced a notable amount of the water previously consumed increases weight gain and the risks of NR‐NCDs, with little substitution away from solid foods. Figure 4 summarizes the conflicts between modern technology and our biology over millennia.
FIGURE 4.
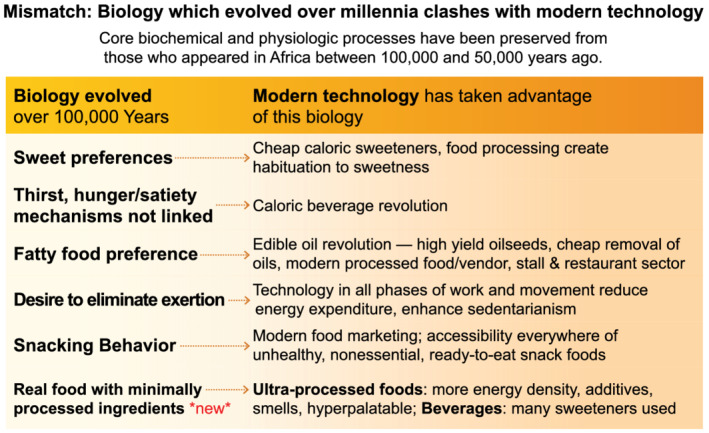
Role of our history: Biology which evolved over millennia clashes with modern technology (Core biochemical and physiologic processes have been preserved from those who appeared in Africa between 100,000 and 50,000 years ago)
Stage 5—behavioral change: In this stage, food consumption reverts towards whole and minimally processed foods that resembles dietary intakes in stage 1 with higher share of plant‐based foods and nutrients (e.g., fruits, vegetables, beans, and other complex carbohydrates and lower intakes of refined foods, meats, and UPFs. To progress to this stage sooner and to shorten/minimize Stage 4, large‐scale government programs and policies to promote a healthier food environment that better supports human and planetary health is critical. Increased physical activity and reducing sedentary time are also important for promoting better human health but dietary shifts are the central need to reduce the risk of NCDs across the lifecycle, improve healthy growth, maximize human.
2.1. Inequities in changes in subpopulations with undernutrition, overweight, or obesity
Most undernutrition has historically occurred among the poor. Nearly, all countries saw declines in child wasting or stunting, and a third experienced annualized declines of more than 1 percentage point per year from the 1990s to the most recent surveys, though we do not have data on the impact of COVID‐19 and all the related social and economic changes on hunger and stunting or on overweight/obesity discussed below (sample described in Table S3 and data provided in Tables S4 and S5).
As we present data on prevalence of individuals with overweight/obesity, we must remember that Hispanics, South and Southeast Asians, and most individuals in Arabic countries, among others, have more central body fat and are more likely to experience significant increases in the risks of hypertension, diabetes, and other NCDs at lower BMIs such as a BMI of 23–25 kg/m2. We consider a 25 kg/m2 BMI cut‐off because extensive epidemiological research associates BMI of 25 kg/m2 or even lower to the risks of NCDs across LMICs. 11 , 12 , 13 , 50 , 57 , 58 , 59 , 60 This is why we combined both overweight and obesity together.
Demographic and Health Survey individual data from the 1990s and the 2010s show an annualized growth in overweight in all countries. The prevalence of overweight and obesity among adults ages 18–49 shifted from those with a higher SES to those with a lower SES. A positive annualized difference in Figure 5 (Table S6) indicates that the poor face a greater overweight/obesity prevalence and suggests increasing disparities between the lowest and the highest wealth quintiles in most of Latin America and East, Southeast, and Central Asia, whereas in South Asia and most of SSA the prevalence of individuals with overweight/obesity is increasing more rapidly among higher SES subpopulations. In some large countries, such as China, Indonesia, Egypt, Brazil, and Mexico, the poor face increasingly higher prevalence of overweight/obesity than do higher SES adults. Yet in other large countries, especially in South Africa and SSA, the increase in individuals with overweight/obesity is currently still higher among higher SES adults. Regardless, to date, no country has produced a decline in overweight/obesity prevalence, partly because there is a huge time lag in weight change relative to a more rapid change in other NR‐NCDs.
FIGURE 5.
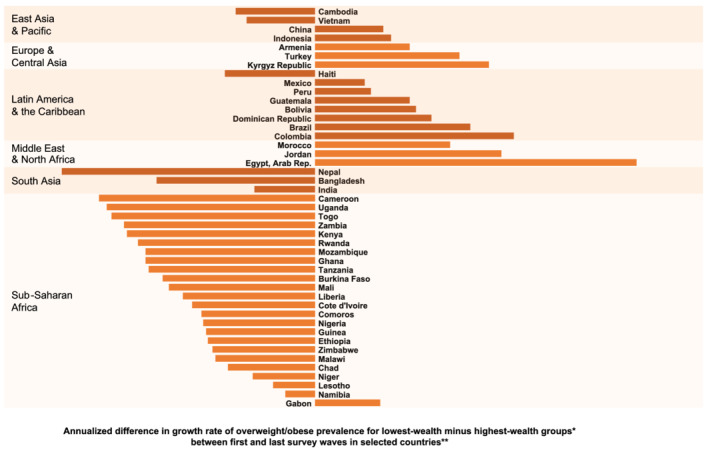
The shifting burden of overweight/obesity* from higher‐ to lower‐wealth populations in sample countries**. * positive difference indicates higher annualized growth in overweight/obesity prevalence for the lowest‐wealth quartile. ** countries presented here had earliest‐to‐latest‐year data spanning 10 or more years. The data presented is from years spanning 1988 to 2018, but exact years vary by country. The span of earliest‐to‐latest years collected ranges from 15 years to 27 years. All data are from the demographic and health surveys (DHS, https://dhsprogram.com/) with the exceptions of China (China health and nutrition survey), Indonesia (Indonesian family life survey), Mexico (Mexico National Survey of health and nutrition), Brazil (Brazil National Health Survey), and Vietnam (Vietnam living standards survey)
These statistics show that both across countries and within countries, there are differing stages of the nutrition transition by SES (or income). Such nuances are important to understand because efforts to curb or minimize populations or subpopulations being in Stage 4 of the nutrition transition will need to lower their prevalence overall while narrowing existing disparities.
2.2. Key underlying drivers of the nutrition transition
Dietary shifts remain the major drivers of both under‐ and overnutrition globally. The decline in physical activity in all domains occurred earlier than the major dietary changes 45 , 46 , 61 , 62 , 63 and is difficult to reverse, as most major declines in activity are positive in terms of reducing unnecessary work burdens. The shifts toward TVs, smart phones and other sedentary leisure time activities are different in that it did not reduce burdensome activities but did create increased sedentarianism. Enhancing activity is important for good health but is not the major driver of entry and persistence in stage 4. 45 , 64 , 65 A number of factors have fueled diet‐related transformations in the past half century, including urbanization, income growth, increased formal labor force participation, technological change, the shifts in food processing toward major promotion of ultra‐processed food and the food industry's control of food regulations. Many suggest corn subsidies allow corn to be cheaper while most economists agree and know this give corn‐based sugar sources such as corn syrup and high‐fructose corn syrup cheaper relative to other cane and beet sugar sources, which are also subsidized and protected by sugar import controls. 66 , 67
Urbanization has been and will remain a major driver of changes in activities and diets. 68 , 69 , 70 , 71 , 72 , 73 One notable aspect of urbanization the increasing spread of urban functions to smaller towns and rural areas. 42 , 74 In the 21st century, the prevalence of individuals with obesity has increased rapidly among rural populations worldwide, and in many countries rural obesity is now more prevalent than urban obesity. 4 , 75 Urbanization has not occurred independently of other drivers, such as income growth and changes in labor force participation. In fact, it may be wiser to consider all the dimensions of urbanization. With this approach we think of the many dimensions from physical infrastructure to services and more that define an urban environment. With this approach, you may find rural areas denoted by some demographic criteria that are more urbanized than many cities. 42 Increasingly, overweight and obesity are shifting to higher prevalence levels in rural areas in many continents, suggesting increased access to many of the dimensions of urban residence within rural areas. 4
Over the past century not all urbanization has led to migration of workers to cities to obtain employment. Many complex pushes (only one child inherits land; drought, hunger) and pulls (the attraction of higher salaries as well as all the amenities, myths about cities and better education opportunities have led to the rise of huge and complex but often quite organized informal settlements in cities of all sizes).
Incomes have on average grown globally at both the national and the individual levels, and the effects on diets have been profound, 6 , 14 , 15 , 75 , 76 , 77 revising what we eat, the proportions of our diets consumed away from home, and even our snacking habits. Overall economic growth and access to modern advertising have encouraged individuals of all ages to significantly refashion their diets. 78 , 79 Concurrently, income inequalities have risen across many countries and have been found to also be linked with the prevalence of individuals with obesity. 80 When it comes to the role of income, the relatively cheap cost per calorie of ultra‐processed foods is certainly one key aspect as are their ready‐to‐eat and ready‐to‐heat availability to save time costs for the urban worker. 81 , 82 , 83
Increased formal labor force participation among men and particularly women given preexisting gender roles has reduced time for food preparation. 6 , 14 As incomes rise, workers increasingly seek and consume time‐saving processed foods. This is particularly true for women working outside the home, who are still primarily responsible for childcare, reproduction, housekeeping, and food preparation. (Note that in some societies, men play larger home production roles, but the proportion of men undertaking these roles is small. 84 , 85 ) Increased income affects the family's diet. 6 , 14 In economic terms, as a woman's opportunity costs of food preparation increases, diets and food preparation changes. UPFs have become a key component of the food supply in all LMICs 9 . Studies in Latin America and SSA exemplify the restructuring of female labor participation in all regions. 6 , 14
Technological change has impacted all activities. Home production now includes gas, propane, or electric stoves; indoor water; washing machines; rice cookers; and many other appliances. Televisions, computers, note pads and smart phones are replacing active leisure. New transportation modes, from buses and subways to tractors, trucks, and cars, have replaced walking with heavy loads and biking. Irrigation, small‐ or medium‐sized tractors, tillers, millers, fork lifts, and chain saws have reduced rural workloads. 45 Technology has affected children as well as adults. 61 , 62 , 63 , 64 , 86 , 87 But it is important to note that some regions of the world are relatively late in acquiring these new technologies for the bulk of the population (e.g., South Asia, SSA). This suggests that as incomes rise and technologies reach these large areas with much greater penetration, we will see rapid increases in the risk of nutrition‐related NCDs.
Farm programs: Food supplies for many countries are impacted by various policies and subsidies. These usually support cash crops and have tended to subsidize sugar, key staples like rice, wheat, and corn at the expense of many coarse grains and traditional healthy sources of vegetable protein such as lentil, any a wide array of other bean products. The same is true for many animal source products in many countries.
The food industry has engineered two shifts in consumers' food choices. First, the industry has created affordable, convenient and hyperpalatable UPFs that are ready to eat or ready to heat, displacing traditional food preparation methods. A rapid increase in the proportion of food consumed away from home has accompanied this trend. In some countries the proportion of total kilocalories consumed from away‐from‐home sources is as high as 30–40% 6 , 88 , 89 , 90 or even higher (e.g., in Thailand's urban areas). Second, modern food retailers 91 , 92 , 93 have replaced family‐owned stores. Modern markets and department stores with food sections grow into domestic chains. As domestic chains proliferate, foreign chains are attracted to the market in large cities and push domestic chains into secondary and tertiary cities and towns. 14
Both modern food markets and traditional ones carry UPFs. 6 In many countries informal markets are being replaced, while in others they remain dominant. 94 While urban consumers have more access to supermarkets, small traditional retailers and market stalls in both urban and rural areas also sell substantial amounts of packaged UPFs. 6 Marketing through social media, movies, television, and radio, the food industry creates demand, builds brand preferences, and generates new eating behaviors, such as snacking. In Africa, urban consumers have twice the access to television, the internet, fuel, and electricity and thus to food advertisements compared with rural consumers. 6 , 73 , 78 , 79 , 95 , 96
Food packaging also influences behaviors. Food producers strategically include images of familiar characters on packages and pay to locate products at children's eye level and beside checkout counters. 97 , 98 , 99 The food industry has actively fought against food policies that can impact human diets in a healthful manner, including taxes, marketing controls, front‐of‐package (FOP) warning labels, and government procurement of healthy food, among others. 100 , 101 , 102 , 103 Resisting regulations that would benefit public health, except for issues like food fortification that they use to advertise to increase their market shares, food companies have been found to often distort and fund research, and place their consultants on government boards and multilateral organizations in order to influence health and nutrition policymaking and governance. 97 , 104 , 105 , 106
2.3. Food processing has led to UPF dominance in food marketing and represents the most rapidly growing foods and beverages
“Food processing” generally refers to any action that alters a food from its natural state, such as drying; freezing; milling; canning; or adding salt, sugar, fat, or other additives for flavor or preservation. 107 , 108 UPFs include not only foods modified by processing but also edible products formulated from food‐derived substances with additives that heighten their appeal and durability. UPFs are designed and manufactured for maximum profit. They contain low‐cost ingredients, have long shelf lives, are hyperpalatable, and are highly branded and marketed to consumers. They are typically calorie dense and high in sugars, refined starches, unhealthy fats, and sodium. 20 Scholars are increasingly recognizing and calling attention to the addictive qualities of UPFs. 109 , 110 , 111 , 112 , 113 , 114
While there is a long history in the development of food science and modern food processing, the key issue is these foods are very unhealthy, and they are rapidly growing. There is strong evidence from across the globe that they are impacting not only children and adults but also infants and preschoolers from across the LMICs. 6 , 9 , 14 , 16 , 115 , 116 , 117 , 118 , 119 , 120 UPFs have rapidly displaced unprocessed or minimally processed foods, freshly prepared meals, and traditional cooking in most countries, causing significant nutritional, social, economic, and environmental disruption worldwide. 17 , 121 , 122 , 123 UPFs now account for roughly half of the total calories consumed in the United States, 124 the United Kingdom, 125 and Canada 126 and about 20–40% in other high‐ and middle‐income countries 127 , 128 , 129 , 130 , 131 , 132 , 133 , 134 , 135 with sales growing rapidly every year. 17 Demand for these products are largely driven by extensive advertising, price promotions and other marketing techniques to generate loyalty. Children, who are highly impressionable, less able to recognize advertising intent, lack nutritional understanding and are motivated by immediate gratification are easy targets. Research also shows that minority and lower income groups have higher exposure to unhealthy food marketing and that children from ethnic minority and socioeconomically disadvantaged backgrounds are disproportionately exposed to unhealthy food advertising. 136 UPF companies in effect represent a new food colonialism that controls food markets in many countries and targets specific vulnerable subpopulations within countries. 137 , 138 , 139 This worldwide move toward greater consumption of UPFs coincided with global increases in prevalence of individuals with obesity and other nutrition‐related chronic diseases. Indeed, researchers have found connections between these trends. 9 , 20 In Figures 6 and 7, we highlight the rate of change in consumption of key unhealthy food categories experienced in LMICs in various regions.
FIGURE 6.
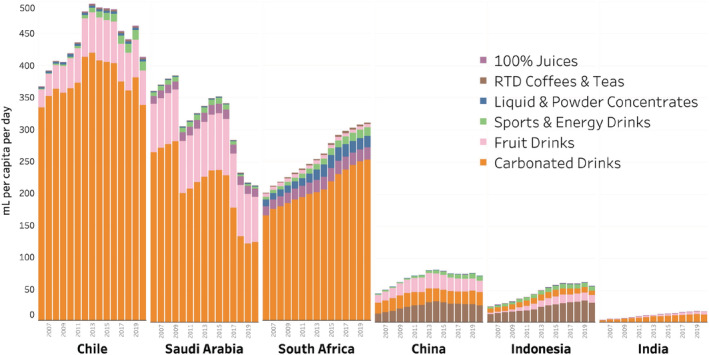
Trends in packaged soft drink sales by category (ml per capita per day, 2006–2020). Note that Euromonitor does not separate data by full‐sugar vs. “diet”/light or noncaloric brands, so these data slightly overestimate total SSB sales. Source: Euromonitor international limited 2021 © all rights reserved
FIGURE 7.
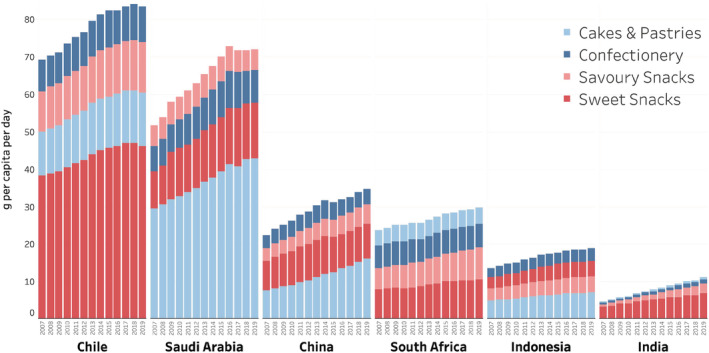
Trends in packaged junk food sales by category (grams per capita per day, 2007–2019). Note that these data approximate actual trends but significantly underestimate total junk food sales. Confectionery includes chocolate and sugar confectioneries and gum; savory snacks include nuts, seeds, trail mixes, salty snacks (e.g., chips), savory biscuits, popcorn, pretzels, and other savory snacks; sweet snacks include fruit snacks, snack bars, sweet biscuits, chilled and shelf‐stable desserts (Chile, South Africa, and Saudi Arabia only), frozen desserts, and ice cream. Source: Euromonitor international limited 2021 © all rights reserved
2.4. Is a prolonged and unhealthy Stage 4 due to high UPF consumption inevitable?
In the past 5 decades, across countries, and now especially in LMICs, we have seen large growth in consumption of UPFs. The big question is: Is it possible to slow or stop these trends and prevent very high levels of obesity and other NR‐NCDs from developing? The Nutrition Transition model was meant to be descriptive, not prescriptive. Moreover, each stage does not have to cover a specific span of time, nor is the staging unidirectional or linear. Thus, we posit that with political will/commitment and well‐designed integrated/multisectoral policies and programs, it is possible to slow or stop these trends. In other words, countries and populations suffering a prolonged and unhealthy Stage 4 is not inevitable.
The transitions discussed are based very much on moving populations from selected regions of the world forward at varying rates with many reasons for proceeding or falling back. But there are human actors playing key roles as individuals, families, and larger organizations or other groupings of individuals. The role of individuals, social groups, civil society organizations (CSOs), governments, or larger multilateral organizations can push a policy or sets of policies to attempt to arrest or turn back the effects of Stage 4 with the much higher nutrition‐related NCDs. Similarly, entities such as food company organizations can push forward policies to accelerate unhealthy change as they have done in most of the world while fighting as hard as they can to stopping impactful public health initiatives to stop the shifts and move us toward healthier eating.
We also posit that it would be critical to first focus policies aimed at curbing the harmful aspects of diets and then turn to also include policies that support healthful diets (without relenting on discouraging unhealthful options and diets). An analogy here is that to save a sinking boat, plugging the leak must be a first step otherwise any other efforts to bail out the water would not make meaningful impact.
2.5. Policies to limit ultra‐processed foods without widening disparities
Multipronged, mutually reinforcing polices: Until the 2010s, UPF consumption was increasing globally with no countries able to control it. 9 , 18 A decade later, we have hope. Chile's multipronged set of policies that mutually reenforce each other is apparently profoundly impacting purchases of UPFs. Building on a nutrient profile model to identify foods and beverages high in added sugar, sodium and saturated fat along with energy density, Chile introduced FOP warning labels, banned UPF products from schools, and instituted marketing controls on these products. 140
The Chilean government first created the nutrient profile model to delineate products with excessive nutrient content or that were high in added sugar, added saturated fat, or added sodium and whether any of those 3 was added to a food also high in energy. All the foods above a certain threshold for key nutrients are required to display a black warning label. 140 , 141 The country instituted the cutoffs in 3 phases over a 4‐year period with the cutoffs becoming increasingly stringent. Each product is categorized as “high in” or “not high in” according to its nutrient threshold, and high‐in products are subject to the warning labels, marketing restrictions, and school sale bans. The initial marketing restrictions restrained package design by eliminating characters and enticements for children, removed advertising of warning labeled food from children's television and established clear measures of what children's television is, and completely banned high‐in foods from schools. The second phase increased the advertising restrictions to include all media from 6 a.m. to 10 p.m. with warning messages outside those hours so it would cover UPF advertising as Chilean ads for UPFs shifted from “kids” to “adult” shows.
The impact of the first phase was strong. After the initial implementation of the law focus groups of low‐ and middle‐income mothers reported profound changes in attitudes toward food purchases driven both by the knowledge mothers gained from the labels and by children telling their mothers not to purchase products with warning labels. 141 , 142 Chile's warning labels have been associated with a roughly 24% drop in sugary drink purchases in the year following the initial implementation. 143 Importantly, households with lower educated heads show similar absolute reductions in sugary drinks with warning labels as households with higher educated heads, demonstrating the these warning labels were understood and did not widen disparities. 24 , 143
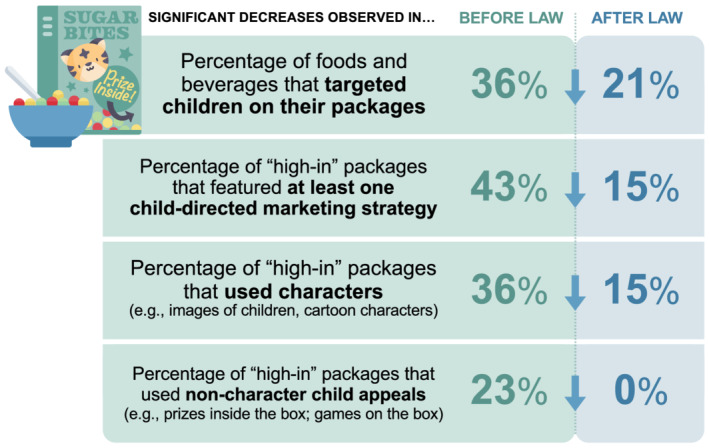
Monitoring of television advertising and surveys of children and their parents conducted annually show that the percentage of ads for foods high in energy, saturated fat, sugar, or sodium decreased from 41.9% before the regulations to 14.8% after the regulations' implementation, resulting in a 44.0% decrease in exposure to high‐in food advertisements for children and a 58.0% decrease for adolescents during the first year of the law. 144 In public schools in Santiago, foods and beverages exceeding any cutoffs decreased from 90.4% in 2014 to 15.0% in 2016. 145 Figures 8 and 9 summarize the key results. 146 , 147 , 148
FIGURE 8.
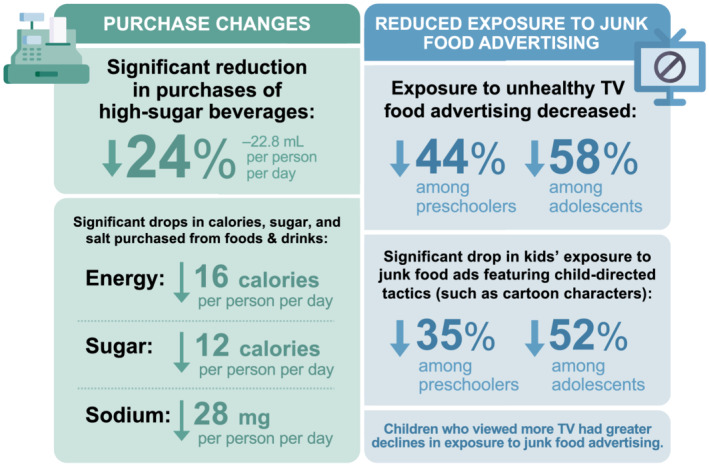
Impact of Chilean policies: Key findings after year 1 (during phase 1: Least‐restrictive nutrient and energy thresholds). Graphics created using resources from Flaticon.com
FIGURE 9.
Impact of Chilean policies after year 1: Child‐directed marketing on breakfast cereal packages. Graphics created using resources from Flaticon.com
Additionally, implementation of the policies did not impact labor market outcomes, such as employment and wages, of the related sectors likely to be affected by the regulations. 149 This shows that reformulation was important, particularly for sodium and added sugar and that consumers found other healthier options. 150 Future publications will elucidate the shift among formerly high‐in products toward nonnutritive sweeteners, a potential adverse effect on sweetness preference. 151
Evaluations of the second and third implementation phases are underway, but the initial results suggest large impacts on purchases and the nutritional profile of food available. Chile is not the only country innovating regulations. Israel has adopted many of the same policies, but they are not coordinated to be mutually reinforcing in the same way. 152 Many countries (e.g., Israel, Mexico, Brazil, and Peru) have adopted FOP warning labels similar to Chile's, but to date no others have linked marketing, and school food, and marketing within schools to label policies.
Food procurement policies: Brazil has established food procurement and feeding policies that will be impactful. While many countries have banned sugar‐sweetened beverages (SSBs) and food marketing from schools, Brazil is pushing a groundbreaking and transformative policy. This feeding program reaches over 150,000 schools and over 40 million children (80% of all Brazilian children). The Programa Nacional de Alimentação Escolar (National School Feeding Program) includes a 2009 law that requires that ≥30% of food procured for schools must come from local family farmers. This is the first national school food program in the world with a mandatory farm‐to‐school component to increase healthy food in schools and support local farmers and economies. This law was strengthened in 2013, but in 2020, a new regulation brought procurement guidelines closer to the revolutionary Dietary Guidelines for the Brazilian Population. 153 The regulation states that a minimum of 75% of school meal funds must be spent on unprocessed or minimally processed foods and sets a maximum of 20% on processed foods.
Marketing control policies: Over decades, we have learned that industry self‐regulation of marketing to children does not work. 154 , 155 The Chilean government introduced a marketing ban first on children‐focused marketing of warning labeled foods during children's television shows and subsequently a complete ban on all marketing of those foods from 6 a.m. to 10 p.m. 67 , 68 , 69 The United Kingdom plans to introduce a legislation as part of the 2021 Health and Care Bill to limit marketing of foods excessively high in fat, salt, and sugar in June 2021 156 but details on the specific policy design are pending. 157 , 158 , 159 At this time, that country has not implemented an FOP warning label that would facilitate such a ban.
Fiscal policies: Most fiscal policies have focused on SSBs. To date, over 45 countries and selected cities and regions have introduced SSB taxes ranging from miniscule taxes with minimum effect in the range of 3–5% 160 to impactful taxes of 50%–75%. This effort began with Mexico, 161 , 162 and subsequently, these taxes have had significant impacts across the globe on SSB purchases comparable with their taxation levels. Evaluations have shown that taxes focused on sugar content, such as the United Kingdom's tiered soft drink levy based on sugar content per 100 milliliters of beverage and the South African health promotion levy, have a larger impact on the sugar content available in beverages because they promote reformulation. 163 , 164 , 165 , 166 , 167 For example, the South African levy taxes 0.021 rand per gram of sugar, approximately 10% of the per liter price, for any beverage with more than 4 grams/100 ml of sugar. In contrast, volume‐based taxes are less likely to encourage reformulation but can provide greater tax revenues.
Several countries have implemented taxes on selected UPFs. Evaluations have shown that the Mexican taxes had impacts equivalent to their tax rates. 168 , 169 , 170 Hungary is the only other country whose tax on UPFs has been evaluated and its impact was also commensurate with the size of the tax. 171 Other countries are considering implementing taxes on all UPFs with warning labels, which would significantly impact the unhealthiest products.
Opponents of such taxes argue that they harm the poor who spend a larger share of their income on food. However, it has been shown time and time again that taxes on unhealthy items are progressive for health, as the poor in most countries consume more UPFs, often have high burden of diet‐related diseases, and are less likely to have access to healthcare or insurance. Given that lower‐income households and individuals are more likely to reduce their purchases in response to a tax, they thus stand to gain more long‐term health and monetary benefits. 172 , 173 , 174 , 175 This was the case in evaluations of the Mexican nonessential food and SSB taxes, 161 , 162 , 168 , 169 as well as South Africa's sugary drink levy. 165
To date, some jurisdictions have used the revenue from these taxes to fund childcare, health care, and other services focused on serving lower‐income subpopulations. 176 However, the revenue has not often been used to subsidize healthy food or to impact the diets of the poor. The examples that do include price shops, food stamps, and other income‐transfer programs for the poor, but few focus on promoting minimally processed foods.
2.6. Policies to enable healthy food purchases by all
The policies above are important as UPF consumption must be reduced to make space for healthier food purchases and intake. However, subsidies and other programs are needed to make these foods relatively cheaper and more accessible. That is healthier eating comprised of fruits, vegetables, water, legumes (beans, pulses), nuts and whole grains. The basis for these policies should be country specific food‐based dietary guidance (FBDG) that explicitly recommends reducing intakes of UPFs while recommending increasing intakes of whole and minimally processed foods and beverages, with additional support for less advantaged populations.
Incentivizing healthy foods: To counter concerns around the income regressivity of unhealthy food tax policies, it would be wise to consider directing some of those tax revenues towards households in need, particularly given heightened need related to longer‐term economic impacts from the COVID‐19 pandemic. The State of Food Security and Nutrition notes that 3 billion people cannot afford healthy diets in 2019; COVID‐19 is expected to make this figure even larger. 177 Many countries already have existing (conditional) cash or income transfer or food assistance programs that can serve as mechanisms to do this. To specifically support healthier diets, it is also possible to consider targeting incentives to lower‐income households for select whole and minimally processed foods. These have shown to improve purchases and some health outcomes. 178 , 179 , 180 Other ways to direct tax revenues derived from unhealthy food taxes include developing and launch mass media campaigns to make healthy foods appealing (fun, cool, interesting, tasty) while educating the public about the harms of UPFs.
Voluntary positive label with very high standards: Once a warning‐type FOP is well implemented, a voluntary fee‐based and monitored system for positive labels based on the FBDG noted above could be considered to help the public further distinguish the truly healthy options from the not “unhealthy” ones. This is essentially what Israel has done by introducing a green label indicating minimally processed healthy foods. 181 Early research on the use and influence of the positive “green” labels on consumer purchase intentions appear promising, particularly among respondents with higher BMI and lower education. 182 Such labels can serve as useful visuals and monitoring device for implementing food vending, procurement, and sponsorship policies in public institutions such as schools and hospitals. New policies requiring a minimum share of healthy whole foods could then be considered working in hand with the restrictions of unhealthy foods with warning labels already implemented earlier.
2.7. Coordinating policies and resources
Throughout, relevant stakeholder groups will need to coordinate and collaborate to ensure that the regulations are implementable and enforceable. Mechanisms for monitoring, reporting, and penalizing will need to be developed and tracked as transparently as possible. To do all of these, resources will be needed, and this presents another compelling and logical way to use this potential revenue. In fact, it would be wise to consider the creation of a national public health foundation, for example, which could get an established share of the health tax revenues from tobacco, alcohol, sweetened beverages, and unhealthy ultra‐processed foods, following the Thai Health example. Such foundations' remit would not supplant existing functions of Ministries of Health but rather supplement those functions by augmenting programs. Examples include providing funding for independent research, monitoring and evaluations and funding local community‐driven projects aimed at improving neighborhoods, such as what has been done in some localities. 176
3. DISCUSSION
At a time of high rates of the double burden of malnutrition, 5 when at least 20% of adults in every country in the world have overweight/obesity and prevalence is rapidly rising, and many infants and preschoolers face stunting and wasting (which were slowly declining before COVID‐19 but may have increased again), we must address the increased consumption of UPFs and the related prevalence of NCDs with serious policies. Implementation of policies may speed up the shift among countries in the high NCD stage of the nutrition transition towards a healthier diet and lifestyle in a way that progressive and does not widen existing disparities across subpopulations. To date, no country has successfully decreased the prevalence of overweight/obesity or the burden of diabetes and other NR‐NCDs. This study suggests that it may be possible to slow down or reverse this trend with the right mix and sequencing of long‐term national policies that explicitly consider equity issues.
UPF consumption is high in many high‐income countries and is rapidly increasing in most LMICs. An important randomized controlled trial at the US National Institutes of Health 21 and close to 40 longitudinal cohort studies suggest that without actions to reduce UPF consumption, all NR‐NCDs will increase. They also suggest that at some point the increase in NCDs may reduce life expectancy and reduce years of disability‐free living. A set of large focus group studies in Chile 142 suggests that appropriate policies can impact purchasing behaviors and potentially change children's eating norms. We have yet to see the level of change needed to reduce UPF consumption significantly and initiate healthy eating patterns for all. We must do much more to encourage substitutions towards the foods Israel's green labels promote. 181
This paper also attempts to clarify some of the misleading assumptions about this nutrition transition model. We note in this paper there are several natural and human‐made causes that can shift the transition backwards. At the same time, through the collective actions of individuals, small groups, civil society organizations, governments, and multi‐lateral organizations, it is possible to leapfrog along the transition to reach stage 5. But this is not simple. The food industry and other geopolitical groupings will put up obstacles, fight against, and delay such changes. 100 , 105 , 106 , 183
Nevertheless, this first decade of policies and evaluations suggests that it is not inevitable that LMICs following a pathway of increased urbanization and modernization and economic development overall will reach the UPF consumption levels of the United States and other high‐income countries. While this is the case for several countries, others such as Chile are fighting back with an array of policies that work together to reinforce each other. Moreover, high‐income countries like the United Kingdom must address the same issues to reduce UPF intake. A major lack currently is in fiscal policies that encourage healthy eating. Incentives and subsidies or special transfer programs targeted at the poor can potentially reduce health disparities. Combining evidence‐based, high‐impact policies and regulations can improve nutritional quality in consumption and consequently health outcomes of the entire population. 184 , 185 , 186
We must also consider the environmental aspects of healthy food policies, as those found in the Brazilian and Israeli dietary guidelines. Our global syndemic of overweight/obesity, stunting, and climate‐ and environment‐related sustainability necessitates triple‐duty actions. 153 , 187 , 188 Beyond shifting the public's food choices, this requires the food industry's cooperation to focus on reducing the water use and carbon emissions of UPF production all the way from the farm through to the fork. The evidence is clear that water use is quite high, particularly with water‐intensive crops like those producing sugar. 189 , 190 , 191 , 192 The impact of ruminant animals on carbon emissions may be overwhelming. 193 , 194 We are at an early stage in studying and focusing on reducing the environmental impacts of UPF diets and supporting healthier lifestyles that benefit both humans and our planet.
While we have limited our discussion to the packaged, processed food supply, the entire food system must change. It is not clear that multilateral agencies and ministries will join the efforts since agribusinesses and food companies have become considerable constituencies. Courageous and social purpose‐oriented leadership and commitments are required to stand up against Big Food interests. The prize will be lowered NR‐NCDs that will improve learning, increase productivity at work, more years of disability‐free living, and improved welfare for all, but particularly for those who have been historically disadvantaged. To date no policy or regulation focused on diets has shown harm, and those noted here show great promise. We must address roadblocks and adjust policies to continually improve on their design as we evaluate and learn more. The global food industry promotes ineffectual policies and obstructs impactful ones. We must continue to expose such actions. Public health rather than big food must lead government actions and generate hope for the future.
CONFLICT OF INTEREST
No conflict of interest statement' in the first proofs.
Supporting information
Table S1. Country burdens by age, sex, and region in 1990s UNICEF and NCD_RisC surveys with DHS for preschoolers where gaps existed
Table S2. Country burdens by age, sex, and region in 2010s UNICEF and NCD_RisC surveys with DHS for preschoolers where gaps existed
Table S3. Number of households with children and women, mean age for women, and GDP per capita (PPP) by country for earliest and latest survey years
Table S4. Prevalence of wasting, stunting, and overweight or obesity for children (ages 0–4 years) and annualized change in prevalence from earliest to latest survey years
Table S5. Prevalence of thinness and overweight for women (ages 15–49 years) and annualized change in prevalence from earliest to latest survey years
Table S6. Prevalence of overweight and obesity for lowest and highest wealth quintiles, differences in the earliest and latest years, and annualized changes in disparity
ACKNOWLEDGMENTS
We thank Bloomberg Philanthropies, the Arnold Ventures, and NIH grant to CPC P2C HD050924; R01DK108148 for support. We also wish to thank Emily Busey for graphics support and Melissa Lam‐McCarthy for administrative support. We also thank the two reviewers for important suggestions.
Popkin BM, Ng SW. The nutrition transition to a stage of high obesity and noncommunicable disease prevalence dominated by ultra‐processed foods is not inevitable. Obesity Reviews. 2022;23(1):e13366. doi: 10.1111/obr.13366
Funding information Arnold Ventures; Bloomberg Philanthropies; National Institutes of Health, Grant/Award Number: CPC P2C HD050924; R01DK108148
REFERENCES
- 1. Abarca‐Gómez L, Abdeen ZA, Hamid ZA, et al. Worldwide trends in body‐mass index, underweight, overweight, and obesity from 1975 to 2016: a pooled analysis of 2416 population‐based measurement studies in 128.9 million children, adolescents, and adults. Lancet. 2017;390(10113):2627‐2642. [DOI] [PMC free article] [PubMed] [Google Scholar]
- 2. Kwan GF, Mayosi BM, Mocumbi AO, et al. Endemic cardiovascular diseases of the poorest billion. Circulation. 2016;133:2561‐2575. [DOI] [PubMed] [Google Scholar]
- 3. World Cancer Research Fund, American Institute for Cancer Research . Diet, Nutrition, Physical Activity and Cancer: A Global Perspective. London: WCRF; 2018. https://www.wcrf.org/diet-and-cancer/ [Google Scholar]
- 4. NCD Risk Factor Collaboration . Rising rural body‐mass index is the main driver of the global obesity epidemic in adults. Nature. 2019;569:260‐264. [DOI] [PMC free article] [PubMed] [Google Scholar]
- 5. Popkin BM, Corvalan C, Grummer‐Strawn LM. Dynamics of the double burden of malnutrition and the changing nutrition reality. Lancet. 2020;395:65‐74. [DOI] [PMC free article] [PubMed] [Google Scholar]
- 6. Reardon T, Tschirley D, Liverpool‐Tasie LSO, et al. The processed food revolution in African food systems and the double burden of malnutrition. Global Food Secur. 2021;28:100466. [DOI] [PMC free article] [PubMed] [Google Scholar]
- 7. Gómez MI, Barrett CB, Raney T, et al. Post‐green revolution food systems and the triple burden of malnutrition. Food Policy. 2013;42:129‐138. https://www.sciencedirect.com/science/article/abs/pii/S0306919213000754 [Google Scholar]
- 8. Meenakshi J. Trends and patterns in the triple burden of malnutrition in India. Agr Econ. 2016;47(S1):115‐134. [Google Scholar]
- 9. Baker P, Machado P, Santos T, et al. Ultra‐processed foods and the nutrition transition: global, regional and national trends, food systems transformations and political economy drivers. Obes Rev. 2020;21(12):e13126. [DOI] [PubMed] [Google Scholar]
- 10. Caleyachetty R, Barber TM, Mohammed NI, et al. Ethnicity‐specific BMI cutoffs for obesity based on type 2 diabetes risk in England: a population‐based cohort study. Lancet Diabetes Endo. 2021;9(7):419‐426. [DOI] [PMC free article] [PubMed] [Google Scholar]
- 11. Wen CP, Cheng TYD, Tsai SP, et al. Are Asians at greater mortality risks for being overweight than Caucasians? Redefining obesity for Asians. Public Health Nutr. 2009;12:497‐506. [DOI] [PubMed] [Google Scholar]
- 12. Albrecht SS, Mayer‐Davis E, Popkin BM. Secular and race/ethnic trends in glycemic outcomes by BMI in US adults: the role of waist circumference. Diabetes Metab Res. 2017;33(5). 10.1002/dmrr.2889 [DOI] [PubMed] [Google Scholar]
- 13. Bell AC, Adair LS, Popkin BM. Ethnic differences in the association between body mass index and hypertension. Am J Epidemiol. 2002;155:346‐353. [DOI] [PubMed] [Google Scholar]
- 14. Popkin BM, Reardon T. Obesity and the food system transformation in Latin America. Obes Rev. 2018;19(8):1028‐1064. [DOI] [PMC free article] [PubMed] [Google Scholar]
- 15. Pingali P. Westernization of Asian diets and the transformation of food systems: implications for research and policy. Food Policy. 2007;32(3):281‐298. [Google Scholar]
- 16. Baker P, Friel S. Processed foods and the nutrition transition: evidence from Asia. Obes Rev. 2014;15:564‐577. [DOI] [PubMed] [Google Scholar]
- 17. Monteiro CA, Moubarac JC, Cannon G, Ng SW, Popkin B. Ultra‐processed products are becoming dominant in the global food system. Obes Rev. 2013;14:21‐28. [DOI] [PubMed] [Google Scholar]
- 18. Popkin BM, Hawkes C. Sweetening of the global diet, particularly beverages: patterns, trends, and policy responses. Lancet Diabetes Endocrinol. 2016;4(2):174‐186. [DOI] [PMC free article] [PubMed] [Google Scholar]
- 19. Monteiro CA, Cannon G, Lawrence M, Costa Louzada M, Pereira Machado P. Ultra‐processed foods, diet quality, and health using the NOVA classification system. Rome: FAO; 2019. http://www.fao.org/3/ca5644en/ca5644en.pdf [Google Scholar]
- 20. Monteiro CA, Cannon G, Moubarac J‐C, Levy RB, Louzada MLC, Jaime PC. The UN Decade of Nutrition, the NOVA food classification and the trouble with ultra‐processing. Public Health Nutr. 2018;21(1):5‐17. [DOI] [PMC free article] [PubMed] [Google Scholar]
- 21. Hall KD. Ultra‐processed diets cause excess calorie intake and weight gain: a one‐month inpatient randomized controlled trial of ad libitum food intake. Cell Metab. 2019;30(1):67‐77. [DOI] [PMC free article] [PubMed] [Google Scholar]
- 22. Diamanti C, Esposito F. Street food: authentic snacks from all over the world. Potsdam, Germany: H.F. Ullmann Publishing Gmbh; 2011;1‐192. [Google Scholar]
- 23. Muñoz de Chávez M, Chávez Villasana A, Chávez Muñoz M, Eichin Vuskovic I. Sale of street food in Latin America. The Mexican case: joy or jeopardy? World Rev Nutr Diet. 2000;86:138‐154. [DOI] [PubMed] [Google Scholar]
- 24. Popkin BM, Barquera S, Corvalan C, et al. Towards unified and impactful policies to reduce ultra‐processed food consumption and promote healthier eating. Lancet Diabetes Endo. 2021;9(7):462‐470. [DOI] [PMC free article] [PubMed] [Google Scholar]
- 25. Shekar M, Popkin BM. Obesity: Health and Economic Consequences of an Impending Global Challenge. Washington DC: the World Bank; 2020. [Google Scholar]
- 26. Food and Agriculture Organization of the United States, World Health Organization . The Nutrition Challenge and Food System Solutions. Rome: Food and Agricultural Organization of the UN; 2018:11. [Google Scholar]
- 27. World Health Organization . Taxes on sugary drinks: Why do it?. Geneva: World Health Organization; 2016:4. https://apps.who.int/iris/bitstream/handle/10665/260253/WHO-NMH-PND-16.5Rev.1-eng.pdf;sequence=1 [Google Scholar]
- 28. WHO Commission on Endling Childhood Obesity . In: Organization WH , ed. Report of the WHO Commission on Endling Childhood Obesity. Geneva Switzerland: World Health Organization; 2016:51. [Google Scholar]
- 29. UNICEF . Implementing Taxes on Sugar‐Sweetened Beverages: An Overview of Current Approaches and the Potential Benefits for Children. In: UNICEF . (ed.). UNICEF: Geneva: 2019; 10. [Google Scholar]
- 30. UNICEF . In: Division UP , ed. UNICEF Programming Guidance: Prevention of Overweight and Obesity in Children and Adolescents. New York City: UNICEF; 2019:47. [Google Scholar]
- 31. Food and Agriculture Organization of the United Nations (FAOUN) and the International Policy Centre for Inclusive Growth (IPC‐IG) . In: FAOUN , ed. Leveraging Food Systems for Poverty and Malnutrition Reduction. Rome: Policy in Focus Food and Agriculture Organization of the United Nations; 2020:53. [Google Scholar]
- 32. Braveman P. What are health disparities and health equity? We need to be clear. Public Health Rep. 2014;129(Suppl 2):5‐8. [DOI] [PMC free article] [PubMed] [Google Scholar]
- 33. Popkin BM. An overview on the nutrition transition and its health implications: the Bellagio meeting. Public Health Nutr. 2002;5:93‐103. [DOI] [PubMed] [Google Scholar]
- 34. Popkin BM, Slining MM. New dynamics in global obesity facing low‐ and middle‐income countries. Obes Rev. 2013;14:11‐20. [DOI] [PMC free article] [PubMed] [Google Scholar]
- 35. Popkin BM, Adair LS, Ng SW. Global nutrition transition and the pandemic of obesity in developing countries. Nutr Rev. 2012;70(1):3‐21. [DOI] [PMC free article] [PubMed] [Google Scholar]
- 36. Azzam A. Is the world converging to a ‘Western diet’? Public Health Nutr. 2021;24(2):309‐317. [DOI] [PMC free article] [PubMed] [Google Scholar]
- 37. Cordain L, Eaton SB, Sebastian A, et al. Origins and evolution of the Western diet: health implications for the 21st century. Am J Clin Nutr. 2005;81(2):341‐354. [DOI] [PubMed] [Google Scholar]
- 38. Popkin B. Nutritional patterns and transitions. Popul Devel Rev. 1993;19(1):138‐157. [Google Scholar]
- 39. Popkin BM, Keyou G, Zhai F, Guo X, Ma H, Zohoori N. The nutrition transition in China: a cross‐sectional analysis. Eur J Clin Nutr. 1993;47(5):333‐346. [PubMed] [Google Scholar]
- 40. Popkin BM. The nutrition transition in low‐income countries: an emerging crisis. Nutr Rev. 1994;52:285‐298. [DOI] [PubMed] [Google Scholar]
- 41. Monteiro CA, Mondini L, de Souza AL, Popkin BM. The nutrition transition in Brazil. Eur J Clin Nutr. 1995;49(2):105‐113. [PubMed] [Google Scholar]
- 42. Jones‐Smith JC, Popkin BM. Understanding community context and adult health changes in China: development of an urbanicity scale. Soc Sci Med. 2010;71:1436‐1446. [DOI] [PMC free article] [PubMed] [Google Scholar]
- 43. Jones‐Smith JC, Gordon‐Larsen P, Siddiqi A, Popkin BM. Is the burden of overweight shifting to the poor across the globe? Time trends among women in 39 low‐ and middle‐income countries (1991‐2008). Int J Obes (Lond). 2012;36(8):1114‐1120. [DOI] [PMC free article] [PubMed] [Google Scholar]
- 44. Jones‐Smith JC, Gordon‐Larsen P, Siddiqi A, Popkin BM. Emerging disparities in overweight by educational attainment in Chinese adults (1989‐2006). Int J Obes (Lond). 2012;36(6):866‐875. [DOI] [PMC free article] [PubMed] [Google Scholar]
- 45. Ng SW, Popkin BM. Time use and physical activity: a shift away from movement across the globe. Obes Rev. 2012;13(8):659‐680. [DOI] [PMC free article] [PubMed] [Google Scholar]
- 46. Ng SW, Norton EC, Popkin BM. Why have physical activity levels declined among Chinese adults? Findings from the 1991‐2006 China Health and Nutrition Surveys. Soc Sci Med. 2009;68(7):1305‐1314. [DOI] [PMC free article] [PubMed] [Google Scholar]
- 47. Ng SW, Norton EC, Guilkey DK, Popkin BM. Estimation of a dynamic model of weight. Empir Econ. 2012;42(2):413‐443. [Google Scholar]
- 48. Poulain J‐P. Food in transition: the place of food in the theories of transition. Sociol Rev. 2021;69(3):702‐724. [Google Scholar]
- 49. Caselli G, Meslé F, Vallin J. Epidemiologic transition theory exceptions. Genus. 2002;9‐51. [Google Scholar]
- 50. Wells JC, Pomeroy E, Walimbe SR, Popkin BM, Yajnik CS. The elevated susceptibility to diabetes in India: an evolutionary perspective. Front Public Health. 2016;4. 10.3389/fpubh.2016.00145 [DOI] [PMC free article] [PubMed] [Google Scholar]
- 51. Davis K. The world demographic transition. Ann Am Acad Polit SS. 1945;237(1):1‐11. [Google Scholar]
- 52. Omran AR. The epidemiologic transition. A theory of the epidemiology of population change. Milbank Meml Fund Q. 1971;49:509‐538. [PubMed] [Google Scholar]
- 53. Carolina Martínez S, Gustavo LF. Epidemiological transition: model or illusion? A look at the problem of health in Mexico. Soc Sci Med. 2003;57(3):539‐550. [DOI] [PubMed] [Google Scholar]
- 54. de Onis M, Borghi E, Arimond M, et al. Prevalence thresholds for wasting, overweight and stunting in children under 5 years. Public Health Nutr. 2018;22(1):175‐179. [DOI] [PMC free article] [PubMed] [Google Scholar]
- 55. Surveys MDDaH . In: Office TDP , ed. Demographic and Health Surveys. Rockville, Md: The DHS Program; 2019. [Google Scholar]
- 56. NCD Risk Factor Collaboration . Trends in adult body‐mass index in 200 countries from 1975 to 2014: a pooled analysis of 1698 population‐based measurement studies with 128.9 million participants. Lancet. 2016;387:1377‐1396. [DOI] [PMC free article] [PubMed] [Google Scholar]
- 57. WHO Expert Consultation . Appropriate body‐mass index for Asian populations and its implications for policy and intervention strategies. Lancet. 2004;363(9403):157‐163. [DOI] [PubMed] [Google Scholar]
- 58. Misra A. Ethnic‐specific criteria for classification of body mass index: a perspective for Asian Indians and American Diabetes Association position statement. Diabetes Technol Ther. 2015;17(9):667‐671. [DOI] [PMC free article] [PubMed] [Google Scholar]
- 59. Nair M, Prabhakaran D. Why do South Asians have high risk for CAD? Glob Heart. 2012;7:307‐314. [DOI] [PubMed] [Google Scholar]
- 60. Joshi P, Islam S, Pais P, et al. Risk factors for early myocardial infarction in South Asians compared with individuals in other countries. JAMA. 2007;297:286‐294. [DOI] [PubMed] [Google Scholar]
- 61. Bell AC, Ge K, Popkin BM. The road to obesity or the path to prevention: motorized transportation and obesity in China. Obes Res. 2002;10(4):277‐283. [DOI] [PubMed] [Google Scholar]
- 62. Bell AC, Ge K, Popkin BM. Weight gain and its predictors in Chinese adults. Int J Obes (Lond). 2001;25(7):1079‐1086. [DOI] [PubMed] [Google Scholar]
- 63. Monda KL, Gordon‐Larsen P, Stevens J, Popkin BM. China's transition: the effect of rapid urbanization on adult occupational physical activity. Soc Sci Med. 2007;64(4):858‐870. [DOI] [PMC free article] [PubMed] [Google Scholar]
- 64. Dearth‐Wesley T, Popkin BM, Ng SW. Estimated and forecasted trends in domain specific time‐use and energy expenditure among adults in Russia. Int J Behav Nutr Phys Act. 2014;11(1):11. 10.1186/1479-5868-11-11 [DOI] [PMC free article] [PubMed] [Google Scholar]
- 65. Simopoulos AP. In: Simopoulos AP, Pavlou KN, eds. Nutrition and Fitness: Metabolic and Behavioral Aspects in Health and Disease: 30 tables/vol. Karger Medical and Scientific Publishers; 1997. [Google Scholar]
- 66. Patel R. How society subsidizes big food and poor health. JAMA Intern Med. 2016;176(8):1132‐1133. [DOI] [PubMed] [Google Scholar]
- 67. Alston JM, Sumner DA, Vosti SA. Are agricultural policies making us fat? Likely links between agricultural policies and human nutrition and obesity, and their policy implications. Rev Agricult Econ. 2006;28(3):313‐322. [Google Scholar]
- 68. Popkin BM. Urbanization, lifestyle changes and the nutrition transition. World Dev. 1999;27(11):1905‐1916. [Google Scholar]
- 69. Van de Poel E, O'Donnell O, Van Doorslaer E. Urbanization and the spread of diseases of affluence in China. Health, Economic and Data Group, The University of York; 2008. [DOI] [PubMed] [Google Scholar]
- 70. Vlahov D, Galea S. Urbanization, urbanicity, and health. J Urban Health. 2002;79(90001):S1‐S12. [DOI] [PMC free article] [PubMed] [Google Scholar]
- 71. Satterthwaite D, McGranahan G, Tacoli C. Urbanization and its implications for food and farming. Philos T Roy Soc B. 2010;365(1554):2809‐2820. [DOI] [PMC free article] [PubMed] [Google Scholar]
- 72. Reardon T, Timmer CP. Five inter‐linked transformations in the Asian agrifood economy: food security implications. Global Food Secur. 2014;11(2):108‐117. [Google Scholar]
- 73. Cockx L, Colen L, De Weerdt J, Paloma GY. Urbanization as a driver of changing food demand in Africa: evidence from rural‐urban migration in Tanzania. 2019. [Google Scholar]
- 74. Rondinelli DA. Secondary Cities in Developing Countries: Policies for Diffusing Urbanization. Beverly Hills, CA: Sage Publications; 1983. [Google Scholar]
- 75. Aiyar A, Rahman A, Pingali P. India's rural transformation and rising obesity burden. World Dev. 2021;138:105258. [Google Scholar]
- 76. Bell W, Lividini K, Masters WA. Global dietary convergence from 1970 to 2010 altered inequality in agriculture, nutrition and health. Nature Food. 2021;2(3):156‐165. [DOI] [PMC free article] [PubMed] [Google Scholar]
- 77. Reardon T, Echeverria R, Berdegué J, et al. Rapid transformation of food systems in developing regions: highlighting the role of agricultural research & innovations. Agr Syst. 2019;172:47‐59. [Google Scholar]
- 78. World Health Organization . Set of recommendations on the marketing of foods and non‐alcoholic beverages to children. Geneva: World Health Organization; 2010:16. [Google Scholar]
- 79. Institute of Medicine . Food Marketing to Children and Youth: Threat or Opportunity?. The National Academies Press; 2006. [PubMed] [Google Scholar]
- 80. Pickett KE, Kelly S, Brunner E, Lobstein T, Wilkinson RG. Wider income gaps, wider waistbands? An ecological study of obesity and income inequality. J Epidemiol Commun H. 2005;59:670‐674. [DOI] [PMC free article] [PubMed] [Google Scholar]
- 81. Headey DD, Alderman HH. The relative caloric prices of healthy and unhealthy foods differ systematically across income levels and continents. J Nutr. 2019;149:2020‐2033. [DOI] [PMC free article] [PubMed] [Google Scholar]
- 82. Maia EG, dos Passos CM, Levy RB, Bortoletto Martins AP, Mais LA, Claro RM. What to expect from the price of healthy and unhealthy foods over time? The case from Brazil. Public Health Nutr. 2020;23(4):579‐588. [DOI] [PMC free article] [PubMed] [Google Scholar]
- 83. Vandevijvere S, Pedroni C, De Ridder K, Castetbon K. The cost of diets according to their caloric share of ultraprocessed and minimally processed foods in Belgium. Nutrients. 2020;12(9):2787. 10.3390/nu12092787 [DOI] [PMC free article] [PubMed] [Google Scholar]
- 84. McGuire J, Popkin BM. Beating the zero sum game: women and nutrition in the third world, Part I. Food Nutr Bull. 1989;11:38‐63. [Google Scholar]
- 85. Mcguire J, Popkin BM. Beating the zero‐sum game: women and nutrition in the third world, Part 2. Food Nutr Bull. 1990;12(1):1‐9. [Google Scholar]
- 86. Dearth‐Wesley T, Howard AG, Wang H, Zhang B, Popkin BM. Trends in domain‐specific physical activity and sedentary behaviors among Chinese school children, 2004–2011. Int J Behav Nutr Phys Act. 2017;14(1):141. 10.1186/s12966-017-0598-4 [DOI] [PMC free article] [PubMed] [Google Scholar]
- 87. Monda KL, Adair LS, Zhai F, Popkin BM. Longitudinal relationships between occupational and domestic physical activity patterns and body weight in China. Eur J Clin Nutr. 2008;62(11):1318‐1325. [DOI] [PubMed] [Google Scholar]
- 88. Dolislager M, Vargas C, Liverpool‐Tasie S, Reardon T. In: University MS , ed. Processed food and food away from home consumption in rural and urban Nigeria Working paper. East Lansing, MIchigan: Michigan State University; 2019. [Google Scholar]
- 89. Ogundari K, Aladejimokun AO, Arifalo SF. Household demand for food away from home (fafh) in Nigeria: the role of education. J Dev Areas. 2015;49(2):247‐262. [Google Scholar]
- 90. Obayelu A, Okoruwa V, Oni O. Analysis of rural and urban households' food consumption differential in the North‐Central, Nigeria: a microeconometric approach. J Dev Agric Econ. 2009;1:18‐26. [Google Scholar]
- 91. Reardon T, Berdegué J. The rapid rise of supermarkets in Latin America: challenges and opportunities for development. Dev Policy Rev. 2002;20:317‐334. [Google Scholar]
- 92. Reardon T, Timmer C, Barrett C, Berdegue J. The rise of supermarkets in Africa, Asia, and Latin America. Am J Agr Econ. 2003;85:1140‐1146. [Google Scholar]
- 93. Reardon T, Timmer C, Minten B. The supermarket revolution in Asia and emerging development strategies to include small farmers. P Natl Acad Sci USA. 2012;109(31):12332‐12337. [DOI] [PMC free article] [PubMed] [Google Scholar]
- 94. Zhang QF, Pan Z. The transformation of urban vegetable retail in China: wet markets, supermarkets and informal markets in Shanghai. J Contemp Asia. 2013;43:497‐518. [Google Scholar]
- 95. Blimpo MP, Cosgrove‐Davies M. Electricity access in Sub‐Saharan Africa: uptake, reliability, and complementary factors for economic impact. World Bank Publications; 2019. [Google Scholar]
- 96. Ncube M, Lufumpa CL. The Emerging Middle Class in Africa. Routledge; 2014. [Google Scholar]
- 97. Mialon M, Crosbie E, Sacks G. Mapping of food industry strategies to influence public health policy, research and practice in South Africa. Int J Public Health. 2020;65(7):1027‐1036. [DOI] [PubMed] [Google Scholar]
- 98. Ojeda E, Torres C, Carriedo Á, Mialon M, Parekh N, Orozco E. The influence of the sugar‐sweetened beverage industry on public policies in Mexico. Int J Public Health. 2020;65(7):1037‐1044. [DOI] [PubMed] [Google Scholar]
- 99. Schmidt L, Mialon M, Kearns C, Crosbie E. Transnational corporations, obesity and planetary health. Lancet Planet Health. 2020;4(7):e266‐e267. [DOI] [PubMed] [Google Scholar]
- 100. Nestle M. Food Politics: How the Food Industry Influences Nutrition and Health. 2nd ed. Berkeley: University of California press; 2007. [Google Scholar]
- 101. Stuckler D, Nestle M. Big food, food systems, and global health. PLoS Med. 2012;9(6):e1001242. [DOI] [PMC free article] [PubMed] [Google Scholar]
- 102. Nestle M. Soda Politics: Taking on Big Soda (and Winning). USA: Oxford University Press; 2015. [Google Scholar]
- 103. Nestle M. Food lobbies, the food pyramid, and U.S. nutrition policy. Int J Health Serv. 1993;23(3):483‐496. [DOI] [PubMed] [Google Scholar]
- 104. Sacks G, Riesenberg D, Mialon M, Dean S, Cameron AJ. The characteristics and extent of food industry involvement in peer‐reviewed research articles from 10 leading nutrition‐related journals in 2018. PLOS One. 2020;15(12):e0243144. [DOI] [PMC free article] [PubMed] [Google Scholar]
- 105. Nestle M. Food industry and health: mostly promises, little action. Lancet. 2006;368(9535):564‐565. [DOI] [PubMed] [Google Scholar]
- 106. Nestle M. Unsavory truth: how food companies skew the science of what we eat. Basic Books; 2018. [Google Scholar]
- 107. Dietary Guidelines Advisory Committee . Report of the Dietary Guidelines Advisory Committee on the Dietary Guidelines for Americans, 2010, to the Secretary of Agriculture and the Secretary of Health and Human Services. Washington, DC: US Department of Agriculture, Agricultural Research Service; 2010. [Google Scholar]
- 108. US Food and Drug Administration , Department of Health and Human Services . Title 21—Food and Drugs; Chapter 9—Federal Food, Drug, and Cosmetic Act. 21 U.S.C.: 2011.
- 109. Moss M. Hooked: Food, Free Will, and How the Food Giants Exploit Our Addictions. Random House: New York City; 2021. [Google Scholar]
- 110. Lieberman DE. The Science Behind Your Need for One More Potato Chip. New York City: New York Times. New York Times; 2021. [Google Scholar]
- 111. Garber AK, Lustig RH. Is fast food addictive? Curr Drug Abuse Rev. 2011;4(3):146‐162. [DOI] [PubMed] [Google Scholar]
- 112. Gearhardt AN, Hebebrand J. The concept of “food addiction” helps inform the understanding of overeating and obesity: YES. Am J Clin Nutr. 2021;113(2):263‐267. [DOI] [PubMed] [Google Scholar]
- 113. Schulte EM, Gearhardt AN. Attributes of the Food Addiction Phenotype Within Overweight and Obesity. Eat Weight Disord‐St; 2020. [DOI] [PubMed] [Google Scholar]
- 114. Schiestl ET, Rios JM, Parnarouskis L, Cummings JR, Gearhardt AN. A narrative review of highly processed food addiction across the lifespan. Prog Neuro‐Psychoph. 2021;106:110152. [DOI] [PMC free article] [PubMed] [Google Scholar]
- 115. Feeley AB, Ndeye Coly A, Sy Gueye NY, et al. Promotion and consumption of commercially produced foods among children: situation analysis in an urban setting in Senegal. Matern Child Nutr. 2016;12(S2):64‐76. [DOI] [PMC free article] [PubMed] [Google Scholar]
- 116. Nordhagen S, Pries AM, Dissieka R. Commercial snack food and beverage consumption prevalence among children 6–59 months in West Africa. Nutrients. 2019;11(11):2715. 10.3390/nu11112715 [DOI] [PMC free article] [PubMed] [Google Scholar]
- 117. Pries AM, Ferguson EL, Sharma N, Upadhyay A, Filteau S. Exploratory analysis of nutritional quality and metrics of snack consumption among Nepali children during the complementary feeding period. Nutrients. 2019;11(12):2962. 10.3390/nu11122962 [DOI] [PMC free article] [PubMed] [Google Scholar]
- 118. Pries AM, Filteau S, Ferguson EL. Snack food and beverage consumption and young child nutrition in low‐ and middle‐income countries: a systematic review. Matern Child Nutr. 2019;15(S4):e12729. [DOI] [PMC free article] [PubMed] [Google Scholar]
- 119. Pries AM, Huffman SL, Adhikary I, et al. High consumption of commercial food products among children less than 24 months of age and product promotion in Kathmandu Valley, Nepal. Matern Child Nutr. 2016;12(S2):22‐37. [DOI] [PMC free article] [PubMed] [Google Scholar]
- 120. Pries AM, Rehman AM, Filteau S, et al. Unhealthy snack food and beverage consumption is associated with lower dietary adequacy and length‐for‐age z‐scores among 12–23‐month‐olds in Kathmandu Valley, Nepal. J Nutr. 2019;149:1843‐1851. [DOI] [PMC free article] [PubMed] [Google Scholar]
- 121. Moubarac J‐C, Batal M, Martins APB, et al. Processed and ultra‐processed food products: consumption trends in Canada from 1938 to 2011. Can J Diet Pract Res. 2014;75(1):15‐21. [DOI] [PubMed] [Google Scholar]
- 122. Monteiro CA, Cannon G. The impact of transnational “big food” companies on the South: a view from Brazil. PLoS Med. 2012;9(7):e1001252. [DOI] [PMC free article] [PubMed] [Google Scholar]
- 123. Moodie R, Stuckler D, Monteiro C, et al. Profits and pandemics: prevention of harmful effects of tobacco, alcohol, and ultra‐processed food and drink industries. Lancet. 2013;381(9867):670‐679. [DOI] [PubMed] [Google Scholar]
- 124. Baraldi LG, Steele EM, Canella DS, Monteiro CA. Consumption of ultra‐processed foods and associated sociodemographic factors in the USA between 2007 and 2012: evidence from a nationally representative cross‐sectional study. BMJ Open. 2018;8(3):e020574. [DOI] [PMC free article] [PubMed] [Google Scholar]
- 125. Rauber F, Louzada MLC, Martinez Steele E, et al. Ultra‐processed foods and excessive free sugar intake in the UK: a nationally representative cross‐sectional study. BMJ Open. 2019;9:e027546. [DOI] [PMC free article] [PubMed] [Google Scholar]
- 126. Polsky JY, Moubarac JC, Garriguet D. Consumption of ultra‐processed foods in Canada. Health Rep. 2020;31(11):3‐15. [DOI] [PubMed] [Google Scholar]
- 127. Louzada MLC, Ricardo CZ, Steele EM, et al. The share of ultra‐processed foods determines the overall nutritional quality of diets in Brazil. Public Health Nutr. 2018;21(1):94‐102. [DOI] [PMC free article] [PubMed] [Google Scholar]
- 128. Sung H, Park JM, Oh SU, Ha K, Joung H. Consumption of ultra‐processed foods increases the likelihood of having obesity in Korean women. Nutrients. 2021;13(2):698. 10.3390/nu13020698 [DOI] [PMC free article] [PubMed] [Google Scholar]
- 129. Cediel G, Reyes M, da Costa Louzada ML, et al. Ultra‐processed foods and added sugars in the Chilean diet (2010). Public Health Nutr. 2018;21(1):125‐133. [DOI] [PMC free article] [PubMed] [Google Scholar]
- 130. Vandevijvere S, De Ridder K, Fiolet T, Bel S, Tafforeau J. Consumption of ultra‐processed food products and diet quality among children, adolescents and adults in Belgium. Eur J Nutr. 2019;58(8):3267‐3278. [DOI] [PubMed] [Google Scholar]
- 131. Machado PP, Steele EM, Levy RB, et al. Ultra‐processed foods and recommended intake levels of nutrients linked to non‐communicable diseases in Australia: evidence from a nationally representative cross‐sectional study. BMJ Open. 2019;9(8):e029544. [DOI] [PMC free article] [PubMed] [Google Scholar]
- 132. Marrón‐Ponce JA, Sánchez‐Pimienta TG, da Costa Louzada ML, Batis C. Energy contribution of NOVA food groups and sociodemographic determinants of ultra‐processed food consumption in the Mexican population. Public Health Nutr. 2018;21(1):87‐93. [DOI] [PMC free article] [PubMed] [Google Scholar]
- 133. Costa de Miranda R, Rauber F, de Moraes MM, et al. Consumption of ultra‐processed foods and non‐communicable disease‐related nutrient profile in Portuguese adults and elderly (2015–2016): the UPPER project. Brit J Nutr. 2020;1‐11. [DOI] [PubMed] [Google Scholar]
- 134. Julia C, Martinez L, Allès B, et al. Contribution of ultra‐processed foods in the diet of adults from the French NutriNet‐Santé study. Public Health Nutr. 2018;21(1):27‐37. [DOI] [PMC free article] [PubMed] [Google Scholar]
- 135. Koiwai K, Takemi Y, Hayashi F, et al. Consumption of ultra‐processed foods decreases the quality of the overall diet of middle‐aged Japanese adults. Public Health Nutr. 2019;22(16):2999‐3008. [DOI] [PMC free article] [PubMed] [Google Scholar]
- 136. Backholer K, Gupta A, Zorbas C, et al. Differential exposure to, and potential impact of, unhealthy advertising to children by socio‐economic and ethnic groups: a systematic review of the evidence. Obes Rev. 2020;22(3):e13144. [DOI] [PubMed] [Google Scholar]
- 137. Friedmann H. From colonialism to green capitalism: social movements and emergence of food regimes. In: Frederick HB, Philip M, eds. New Directions in the Sociology of Global Development. Emerald Group Publishing Limited; 2005:227‐264. [Google Scholar]
- 138. Dreher N. Food from nowhere: complicating cultural food colonialism to understand matcha as superfood. Grad J Food Stud. 2018;5. [Google Scholar]
- 139. Dietler M. Culinary encounters: food, identity, and colonialism. In: Twiss K, ed. In The Archaeology of Food and Identity. Southern Illinois Univ: Carbondale: Center for Archaeological Investigations Press; 2007:218‐242. [Google Scholar]
- 140. Reyes M, Garmendia ML, Olivares S, Aqueveque C, Zacarías I, Corvalán C. Development of the Chilean front‐of‐package food warning label. BMC Public Health. 2019;19(1):906. 10.1186/s12889-019-7118-1 [DOI] [PMC free article] [PubMed] [Google Scholar]
- 141. Corvalan C, Reyes M, Garmendia ML, Uauy R. Structural responses to the obesity and non‐communicable diseases epidemic: update on the Chilean Law of Food Labelling and Advertising. Obes Rev. 2019;20(3):367‐374. [DOI] [PubMed] [Google Scholar]
- 142. Correa T, Fierro C, Reyes M, et al. Responses to the Chilean law of food labeling and advertising: exploring knowledge, perceptions and behaviors of mothers of young children. Int J Behav Nutr Phys Act. 2019;16:21. 10.1186/s12966-019-0781-x [DOI] [PMC free article] [PubMed] [Google Scholar]
- 143. Taillie LS, Reyes M, Colchero MA, Popkin B, Corvalán C. An evaluation of Chile's law of food labeling and advertising on sugar‐sweetened beverage purchases from 2015 to 2017: a before‐and‐after study. PLoS Med. 2020;17(2):e1003015. [DOI] [PMC free article] [PubMed] [Google Scholar]
- 144. Correa T, Reyes M, Taillie LS, Corvalán C, Dillman Carpentier FR. Food advertising on television before and after a national unhealthy food marketing regulation in Chile, 2016‐2017. Am J Public Health. 2020;110(7):1054‐1059. [DOI] [PMC free article] [PubMed] [Google Scholar]
- 145. Massri C, Sutherland S, Källestål C, Peña S. Impact of the food‐labeling and advertising law banning competitive food and beverages in Chilean public schools, 2014–2016. Am J Public Health. 2019;109(9):1249‐1254. [DOI] [PMC free article] [PubMed] [Google Scholar]
- 146. Taillie LS, Bercholz M, Popkin BM, et al. Unhealthy food purchases decline after Chile's food labeling, marketing, and school sales policies. Lancet Planet Health. 2021;5(8):e526‐e533. [DOI] [PMC free article] [PubMed] [Google Scholar]
- 147. Carpentier FRD, Correa T, Reyes M, Taillie LS. Evaluating the impact of Chile's marketing regulation of unhealthy foods and beverages: pre‐school and adolescent children's changes in exposure to food advertising on television. Public Health Nutr. 2020;23(4):747‐755. [DOI] [PMC free article] [PubMed] [Google Scholar]
- 148. Mediano Stoltze F, Reyes M, Smith TL, Correa T, Corvalán C, Carpentier FRD. Prevalence of child‐directed marketing on breakfast cereal packages before and after Chile's food marketing law: a pre‐and post‐quantitative content analysis. Int J Env Res Pub he. 2019;16(22):4501. 10.3390/ijerph162245 [DOI] [PMC free article] [PubMed] [Google Scholar]
- 149. Paraje GWJM, Colchero A, Popkin BM. Employment and real wage changes associated with the warning label regulations in Chile. Food Policy. 2021. 10.1016/j.foodpol.2020.102016 [DOI] [Google Scholar]
- 150. Reyes M, Smith Taillie L, Popkin B, Kanter R, Vandevijvere S, Corvalán C. Changes in the amount of nutrient of packaged foods and beverages after the initial implementation of the Chilean Law of Food Labelling and Advertising: a nonexperimental prospective study. PLoS Med. 2020;17(7):e1003220. [DOI] [PMC free article] [PubMed] [Google Scholar]
- 151. Martínez X, Zapata Y, Pinto V, et al. Intake of non‐nutritive sweeteners in Chilean children after enforcement of a new food labeling law that regulates added sugar content in processed foods. Nutrients. 2020;12(6):1594. 10.3390/nu12061594 [DOI] [PMC free article] [PubMed] [Google Scholar]
- 152. Endevelt R, Grotto I, Sheffer R, Goldsmith R, Golan M, Mendlovic J. Moshe Bar‐Siman‐Tov policy and practice—regulatory measures to improve the built nutrition environment for prevention of obesity and related morbidity in Israel. Public Health Panorama. 2017;3:567‐575. [Google Scholar]
- 153. Ministry of Health Brazil . Dietary Guidelines for the Brazilian Population. 2nd ed. Ministry of Health Brazil: Brasilia; 2014:152. [Google Scholar]
- 154. Galbraith‐Emami S, Lobstein T. The impact of initiatives to limit the advertising of food and beverage products to children: a systematic review. Obes Rev. 2013;14:960‐974. [DOI] [PubMed] [Google Scholar]
- 155. Chambers SA, Freeman R, Anderson AS, MacGillivray S. Reducing the volume, exposure and negative impacts of advertising for foods high in fat, sugar and salt to children: a systematic review of the evidence from statutory and self‐regulatory actions and educational measures. Prev Med. 2015;75:32‐43. [DOI] [PubMed] [Google Scholar]
- 156. The Guardian . UK to ban all online junk food advertising to tackle obesity. London: The Guardian; 2020. [Google Scholar]
- 157. Sweney M. UK to ban all online junk food advertising to tackle obesity. The Guardian; 2020. [Google Scholar]
- 158. Ofcom . Television Advertising of Food and Drink Products to Children. London; 2006. [Google Scholar]
- 159. Silva A, Higgins LM, Hussein M. An evaluation of the effect of child‐directed television food advertising regulation in the United Kingdom. Can J Agr Econ. 2015;63:583‐600. [Google Scholar]
- 160. Caro JC, Corvalán C, Reyes M, Silva A, Popkin B, Taillie LS. Chile's 2014 sugar‐sweetened beverage tax and changes in prices and purchases of sugar‐sweetened beverages: an observational study in an urban environment. PLoS Med. 2018;15(7):e1002597. [DOI] [PMC free article] [PubMed] [Google Scholar]
- 161. Colchero MA, Popkin BM, Rivera JA, Ng SW. Beverage purchases from stores in Mexico under the excise tax on sugar sweetened beverages: observational study. Brit Med J. 2016;352:h6704. https://www.bmj.com/content/352/bmj.h6704 [DOI] [PMC free article] [PubMed] [Google Scholar]
- 162. Ng SW, Rivera JA, Popkin BM, Colchero MA. Did high sugar‐sweetened beverage purchasers respond differently to the excise tax on sugar‐sweetened beverages in Mexico? Public Health Nutr. 2018;22(4):750‐756. [DOI] [PMC free article] [PubMed] [Google Scholar]
- 163. Bandy L, Scarborough P, Harrington R, Rayner M, Jebb S. Reductions in sugar sales from soft drinks in the UK from 2015 to 2018. BMC Med. 2020;18(1):20. 10.1186/s12916-019-1477-4 [DOI] [PMC free article] [PubMed] [Google Scholar]
- 164. Scarborough P, Adhikari V, Harrington RA, et al. Impact of the announcement and implementation of the UK Soft Drinks Industry Levy on sugar content, price, product size and number of available soft drinks in the UK, 2015‐19: a controlled interrupted time series analysis. PLoS Med. 2020;17(2):e1003025. [DOI] [PMC free article] [PubMed] [Google Scholar]
- 165. Essman M, Taillie LS, Frank T, Ng SW, Popkin BM, Swart EC. Taxed and untaxed beverage intake by South African young adults after a national sugar‐sweetened beverage tax: a before‐and‐after study. PLoS Med. 2021;18(5):e1003574. [DOI] [PMC free article] [PubMed] [Google Scholar]
- 166. Stacey N, Edoka I, Hofman K, Swart EC, Popkin B, Ng SW. Changes in beverage purchases following the announcement and implementation of South Africa's Health Promotion Levy: an observational study. Lancet Planet Health. 2021;5(4):e200‐e208. [DOI] [PMC free article] [PubMed] [Google Scholar]
- 167. Allcott H, Lockwood BB, Taubinsky D. Should we tax sugar‐sweetened beverages? An overview of theory and evidence. J Econ Perspect. 2019;33:202‐227. [Google Scholar]
- 168. Batis C, Rivera JA, Popkin BM, Taillie LS. First‐year evaluation of Mexico's tax on nonessential energy‐dense foods: an observational study. PLoS Med. 2016;13:e1002057. [DOI] [PMC free article] [PubMed] [Google Scholar]
- 169. Hernández‐F M, Batis C, Rivera JA, Colchero MA. Reduction in purchases of energy‐dense nutrient‐poor foods in Mexico associated with the introduction of a tax in 2014. Prev Med. 2019;118:16‐22. [DOI] [PMC free article] [PubMed] [Google Scholar]
- 170. Taillie LS, Rivera JA, Popkin BM, Batis C. Do high vs. low purchasers respond differently to a nonessential energy‐dense food tax? Two‐year evaluation of Mexico's 8% nonessential food tax. Prev Med. 2017;105s:S37‐s42. [DOI] [PMC free article] [PubMed] [Google Scholar]
- 171. Bíró A. Did the junk food tax make the Hungarians eat healthier? Food Policy. 2015;54:107‐115. [Google Scholar]
- 172. Basto‐Abreu A, Braverman‐Bronstein A, Camacho‐García‐Formentí D, et al. Expected changes in obesity after reformulation to reduce added sugars in beverages: a modeling study. PLoS Med. 2018;15(10):e1002664. [DOI] [PMC free article] [PubMed] [Google Scholar]
- 173. Torres‐Álvarez R, Barrán‐Zubaran R, Canto‐Osorio F, et al. Body weight impact of the sugar‐sweetened beverages tax in Mexican children: a modeling study. Pediatr Obes. 2020;15(8):e12636. [DOI] [PubMed] [Google Scholar]
- 174. Barrientos‐Gutierrez T, Zepeda‐Tello R, Rodrigues ER, et al. Expected population weight and diabetes impact of the 1‐peso‐per‐litre tax to sugar sweetened beverages in Mexico. PLOS One. 2017;12(5):e0176336. [DOI] [PMC free article] [PubMed] [Google Scholar]
- 175. Sánchez‐Romero LM, Penko J, Coxson PG, et al. Projected impact of Mexico's sugar‐sweetened beverage tax policy on diabetes and cardiovascular disease: a modeling study. PLoS Med. 2016;13(11):e1002158. [DOI] [PMC free article] [PubMed] [Google Scholar]
- 176. Krieger J, Magee K, Hennings T, Schoof J, Madsen KA. How sugar‐sweetened beverage tax revenues are being used in the United States. Prev Med Rep. 2021;23:101388. [DOI] [PMC free article] [PubMed] [Google Scholar]
- 177. Herforth A, Bai Y, Venkat A , et al. Cost and affordability of healthy diets across and within countries: Background paper for The State of Food Security and Nutrition in the World 2020. FAO Agricultural Development Economics Technical Study No. 9: Food & Agriculture Org. 2020.
- 178. Berkowitz SA, Curran N, Hoeffler S, et al. Association of a fruit and vegetable subsidy program with food purchases by individuals with low income in the US. JAMA Netw Open. 2021;4:e2120377. [DOI] [PMC free article] [PubMed] [Google Scholar]
- 179. Xie J, Price A, Curran N, Østbye T. The impact of a produce prescription programme on healthy food purchasing and diabetes‐related health outcomes. Public Health Nutr. 2021;24(12):3945‐3955. [DOI] [PMC free article] [PubMed] [Google Scholar]
- 180. Center for Health Law and Policy Innovation . Mainstreaming Produce Prescriptions: A Policy Strategy Report. https://www.chlpi.org/wp‐content/uploads/2013/12/Produce‐RX‐March‐2021.pdf 2021.
- 181. Gillon‐Keren MK‐S, Kaufman‐Shriqui V, Goldsmith R, et al. Development of criteria for a positive front‐of‐package food labeling: the israeli case. Nutrients. 2020;12(6). 10.3390/nu12061875 [DOI] [PMC free article] [PubMed] [Google Scholar]
- 182. Bromberg M, Sinai T, Keinan‐Boker L, Endevelt R, Frankenthal D. Current use of nutrition facts tables and attitudes towards new red and green front‐of‐package labels among Israeli consumers. Int J Food Sci Nutr. 2021;1‐8. [DOI] [PubMed] [Google Scholar]
- 183. Nestle M. Food marketing and childhood obesity—a matter of policy. N Engl J Med. 2006;354(24):2527‐2529. [DOI] [PubMed] [Google Scholar]
- 184. Peñalvo JL, Cudhea F, Micha R, et al. The potential impact of food taxes and subsidies on cardiovascular disease and diabetes burden and disparities in the United States. BMC Med. 2017;15:208. https://doi/org/10.1186/s12916-017-0971-9 [DOI] [PMC free article] [PubMed] [Google Scholar]
- 185. Valizadeh P, Ng SW. Would a national sugar‐sweetened beverage tax in the United States be well targeted? Am J Agr Econ. 2021;103(3):961‐986. [DOI] [PMC free article] [PubMed] [Google Scholar]
- 186. Cobiac LJ, Tam K, Veerman L, Blakely T. Taxes and subsidies for improving diet and population health in Australia: a cost‐effectiveness modelling study. PLoS Med. 2017;14(2):e1002232. [DOI] [PMC free article] [PubMed] [Google Scholar]
- 187. Fardet A, Rock E. Ultra‐processed foods and food system sustainability: what are the links? Sustainability. 2020;12(15):6280. 10.3390/su12156280 [DOI] [Google Scholar]
- 188. Swinburn BA, Kraak VI, Allender S, et al. The global syndemic of obesity, undernutrition, and climate change: the Lancet Commission report. Lancet. 2019;393(10173):791‐846. [DOI] [PubMed] [Google Scholar]
- 189. Harris F, Moss C, Joy EJM, et al. The water footprint of diets: a global systematic review and meta‐analysis. Adv Nutr. 2020;11:375‐386. [DOI] [PMC free article] [PubMed] [Google Scholar]
- 190. Hoekstra AY, Chapagain AK. Water footprints of nations: water use by people as a function of their consumption pattern. Water Resour Manag. 2007;21:35‐48. [Google Scholar]
- 191. Ercin AE, Aldaya MM, Hoekstra AY. Corporate water footprint accounting and impact assessment: the case of the water footprint of a sugar‐containing carbonated beverage. Water Resour Manag. 2011;25(2):721‐741. [Google Scholar]
- 192. Hoekstra AY. The water footprint of modern consumer society. Routledge; 2019. [Google Scholar]
- 193. Springmann M, Clark M, Mason‐D'Croz D, et al. Options for keeping the food system within environmental limits. Nature. 2018;562(7728):519‐525. [DOI] [PubMed] [Google Scholar]
- 194. Willett W, Rockström J, Loken B, et al. Food in the anthropocene: the EAT–Lancet Commission on healthy diets from sustainable food systems. Lancet. 2019;393(10170):447‐492. [DOI] [PubMed] [Google Scholar]
Associated Data
This section collects any data citations, data availability statements, or supplementary materials included in this article.
Supplementary Materials
Table S1. Country burdens by age, sex, and region in 1990s UNICEF and NCD_RisC surveys with DHS for preschoolers where gaps existed
Table S2. Country burdens by age, sex, and region in 2010s UNICEF and NCD_RisC surveys with DHS for preschoolers where gaps existed
Table S3. Number of households with children and women, mean age for women, and GDP per capita (PPP) by country for earliest and latest survey years
Table S4. Prevalence of wasting, stunting, and overweight or obesity for children (ages 0–4 years) and annualized change in prevalence from earliest to latest survey years
Table S5. Prevalence of thinness and overweight for women (ages 15–49 years) and annualized change in prevalence from earliest to latest survey years
Table S6. Prevalence of overweight and obesity for lowest and highest wealth quintiles, differences in the earliest and latest years, and annualized changes in disparity