

Summary
The human placenta and its specialized cytotrophoblasts rapidly develop, have a compressed lifespan, govern pregnancy outcomes and program the offspring’s health. Understanding the molecular underpinnings of these behaviors informs development/disease. Profiling the extraembryonic epigenome and transcriptome during the 2nd and 3rd trimesters, revealed H3K9 trimethylation overlapping deeply DNA hypomethylated domains with reduced gene expression, and compartment-specific patterns that illuminated their functions. Cytotrophoblast DNA methylation increased and several key histone modifications decreased across the genome as pregnancy advanced. Cytotrophoblasts from severe preeclampsia had substantially increased H3K27 acetylation globally and at genes that are normally downregulated at term but upregulated in this syndrome. Additionally, some cases had an immature pattern of H3K27ac peaks and others showed evidence of accelerated aging, suggesting subtype-specific alterations in severe preeclampsia. Thus, the cytotrophoblast epigenome dramatically reprograms during pregnancy, placental disease is associated with failures in this process, and H3K27 hyperacetylation is a feature of severe preeclampsia.
Keywords: Human placenta, cytotrophoblast, DNA methylation, histone modification, gestational regulation, preeclampsia
eTOC blurb:
Zhang, Kim et al. show significant alterations in the cytotrophoblast epigenome over pregnancy, including increased DNA methylation and loss of modified histones. Throughout gestation H3K9 trimethylation overlapping DNA hypomethylated domains reduces gene expression. In placental disease, e.g., severe preeclampsia, cytotrophoblasts have global increases in H3K27 acetylation and at misexpressed genes.
Introduction
In eutherian embryos, the first fate decision separates cells of the extraembryonic tissue compartment from those of the embryo proper, allocating placental trophoblasts to the outer surface while cells confined to the interior form the offspring. In the 1st trimester of human pregnancy, trophoblasts differentiate into subpopulations. Near the uterine wall, cytotrophoblast (CTB) progenitors give rise to cells that invade the uterus and its vasculature (Figures S1A and S1C). Elsewhere, CTB fusion generates multinuclear syncytiotrophoblasts (STBs) that form the surface of the chorionic villi that transport substances between maternal blood and the embryo/fetus. The juxtaposed bilayers of the fetal membranes develop in parallel (Figures S1A and S1B). The inner surface, the amnion, encloses the fluid that buoys the offspring. The outer surface, the chorion, is formed from CTB remnants of chorionic villi that degenerate away from the placenta proper, which is anchored to the decidua. By mid-gestation, 2nd trimester, mature placental structure and functions are largely established. By late 3rd trimester, the villi, which have reached the end of their lifespan, have an expanded stromal compartment, fewer CTBs and STBs show signs of senescence (Sultana et al., 2018).
Preeclampsia, a serious pregnancy complication that occurs in 3–8% of first pregnancies in the early third trimester, is thought to occur when CTB invasion of the uterine wall and resident maternal vessels is shallow (Brosens et al., 1972; Fisher, 2015). This pathological feature reflects molecular defects in the CTB differentiation pathway that leads to invasion and vascular mimicry (Zhou et al., 1997). This incomplete invasion leads to an abnormal maternal inflammatory response and clinical signs, which are largely attributable to vascular damage.
The transcriptional programs that specify a trophoblast fate or regulate differentiation of these cells during normal pregnancy have been extensively studied (Maltepe and Fisher, 2015). Likewise, human placentas and CTBs of different gestational ages have been transcriptionally profiled in normal pregnancy (Buckberry et al., 2014; Kim et al., 2012; Winn et al., 2007) and preeclampsia (PE) (Gormley et al., 2017; Leavey et al., 2015; Sõber et al., 2015; Zhou et al., 2013). In rabbits (Manes and Menzel, 1981), mice (Chapman et al., 1984), and humans (Ehrlich et al., 1982; Santos et al., 2010; Schroeder et al., 2013), there is evidence of globally reduced DNA methylation of the placenta with increased methylation at term. Widespread hypomethylation is also a hallmark of cancer cells (Berman et al., 2011; Feinberg and Vogelstein, 1983; Gama-Sosa et al., 1983) that share some characteristics of CTBs (Piechowski, 2016). However, little is known about the multi-layered epigenome of CTBs and other extraembryonic regions and the impact of gestational age at this level. Thus, we undertook a comprehensive analysis of human CTB and extraembryonic epigenomes during normal pregnancy (2nd trimester and term) and in severe PE (sPE).
Results
DNA methylation patterns differed by anatomical compartment and gestational age
DNA methylation profiles were generated via bisulfite sequencing and Infinium 450K array from extraembryonic compartments (CTBs, smooth chorion, basal plate or maternal-fetal interface, and chorionic villi) at different gestational ages (2nd and 3rd trimester/term). These data were compared to the DNA methylation patterns of a human embryonic stem cell (hESC) line and fetal brain. We used hESCs as a proxy for progenitors of the intraembryonic lineages and brain to contrast our findings with another fetal organ. As aggressive cancers also exhibit aberrant DNA methylation, among other shared features with the placenta (e.g., invasion) (Smith et al., 2017), we included a colon cancer methylome and the adjacent normal mucosal tissue in our analysis (Berman et al., 2011).
Principal component analysis segregated the extraembryonic samples from all others (PC1; Figures 1A and S2A–S2C). Within the extraembryonic group, they were separated by gestational age (PC2 and PC3). The exception was the smooth chorion, perhaps because of its unique CTB progenitor population that is maintained throughout pregnancy (Genbacev et al., 2011). The colon tumor was distinct from the somatic and embryonic tissues, closer to the extraembryonic samples compared to other controls (PC1). The compartment- and gestational age-specific patterns of the extraembryonic samples discovered by bisulfite sequencing were corroborated by DNA methylation array analyses (Figure S2D). Chromosome-level resolution of DNA methylation showed a unique pattern of global hypomethylation punctuated by megabase domains of deeper hypomethylation across all extraembryonic cells/tissues as compared to most of non-extraembryonic samples (Figures 1B, Chr1, and S2E, all chromosomes). This data extended previous reports that the term chorionic villus and CTB genomes have partially methylated domains encompassing gene-poor regions (Nordor et al., 2017; Schroeder et al., 2013). Colon tumor DNA was similarly hypomethylated as extraembryonic compartments without deeper hypomethylated loci (Figure 1B), suggesting that placenta has its unique DNA demethylation pathways. In 2nd and 3rd trimester CTBs, a large portion of all the CpG sites had an intermediate level of methylation with term CTBs having a higher proportion of fully methylated CpG sites (Figure 1C) (Fuke et al., 2004; Nordor et al., 2017; Novakovic et al., 2011). At the local level, CTBs and colon tumor samples had reduced CpG methylation across genes and transposons as compared to hESCs and fetal brain (Figures 1D and 1E). ICRs—characterized by parent-of-origin-specific methylation in somatic cells—had methylation levels centered near 50% as in other cell/tissue types (Figure S2F), evidence that their methylation level is maintained despite global hypomethylation. These results suggest that the extraembryonic compartments have unique methylation patterns that varied by region and gestational age.
Figure 1. Extraembryonic DNA: Hypomethylation and Gestational Age Regulation.
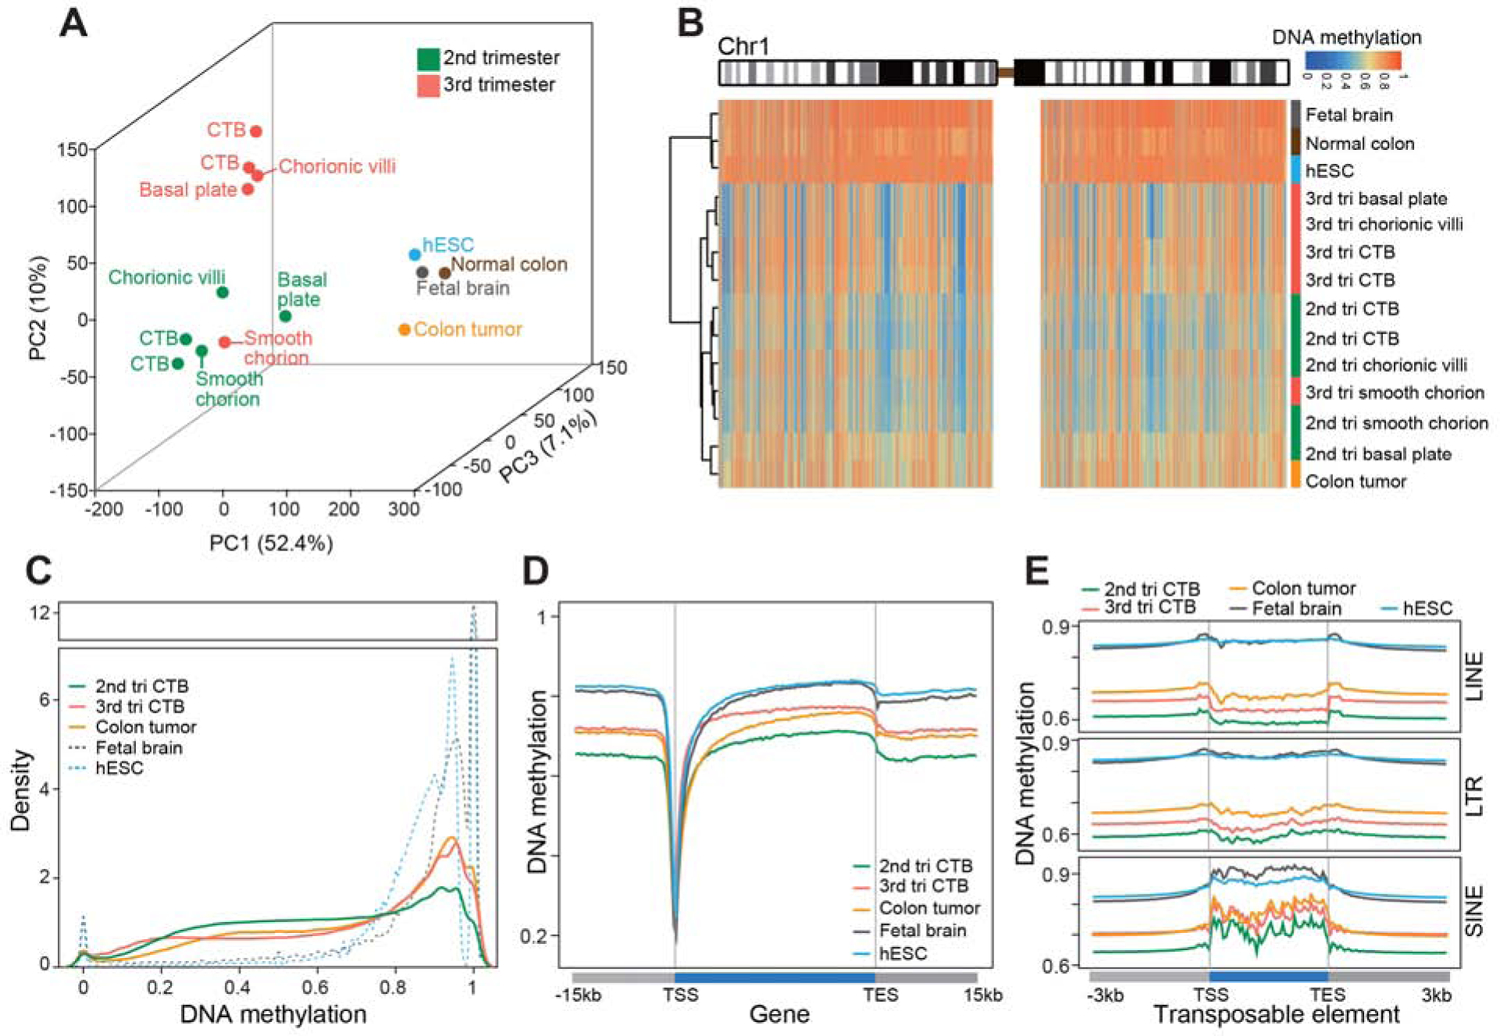
Whole genome bisulfite sequencing enabled quantitative single base-resolution DNA methylation profiling of the extraembryonic compartment. The data were compared to equivalent analyses of embryonic, fetal, and adult (normal and cancer) samples. (A) Principal component analysis segregated the extraembryonic samples from all others primarily along PC1. Within the extraembryonic group, the samples separated according to type and gestational age. The exception was the smooth chorion, which contains a cytotrophoblast progenitor population pregnancy. (B) Chromosome-level (Chr1) view of DNA methylation in the same samples as shown in (A). Compared to the other genomes, extraembryonic DNA showed a unique pattern of global hypomethylation interspersed among megabase domains of deeper hypomethylation. Similarly, colon tumor DNA was hypomethylated, but in a different pattern. (C) As compared to the other embryonic and fetal samples, 2nd trimester CTBs had an intermediate level of DNA methylation. At term, the cells acquired higher levels of methylation similar to the colon tumor. (D–E) Averaged DNA methylation levels over +/− 15 kb regions of gene bodies (RefSeq) and +/− 3 kb regions of transposable elements showed the same trends as in (C). 2nd/3rd trimester CTBs, n=2; 2nd/3rd chorionic villi, smooth chorion, and basal plate, n=1; tri., trimester; TSS, transcription/transposon start site; TES, transcription/transposon end site.
Between the 2nd and 3rd trimesters of pregnancy, we observed an increase in CTB DNA methylation both globally and locally. To investigate the potential mechanism, we compared 2nd and 3rd trimester CTB mRNA levels of relevant DNA methylation and chromatin modifying enzymes (Figure S2G). DNA methyltransferases, DNMT1, DNMT3A, and DNMT3B, are generally upregulated yet TET1 and TET3, enzymes promoting DNA demethylation, were lower at term. TET2, which lacks a DNA binding CXXC domain was also highly expressed by 3rd trimester CTBs. Its potential CXXC-containing co-factors (Ko et al., 2013; Xiong et al., 2019) were either not expressed (CXXC4) or downregulated in 3rd trimester CTBs (CXXC5) (Figure S2H). These results suggested that TET activities were reduced at term, which together with increased DNMT activity, partially explained the observed increase in CTB DNA methylation as gestational age advanced.
Deep DNA hypomethylation domains with increased H3K9me3 occupancy in cytotrophoblasts
Next, we identified deeply hypomethylated regions using 10kb windows based on comparisons between 2nd and 3rd trimester samples (Figure 2A). Despite a net increase in DNA methylation at term, the deeply hypomethylated regions consistently had low methylation levels at both gestational ages (Figure 2B). Also, these sites had strongly enriched signals for H3K9me3 (Figure 2C, left panel), which were not observed in hESCs or other regions of the CTB genome (middle and right panels). This finding was in contrast to reports that H3K9me3, an epigenetic mark of repressive heterochromatin, is often associated with DNA hypermethylation in hESCs and other tissues (Hawkins et al., 2010; Lehnertz et al., 2003) and in accord with the relationship between H3K9me2 and DNA hypomethylation in oocytes (Au Yeung et al., 2019). A higher resolution view of the CTB H3K9me3 chromatin immunoprecipitation sequencing (ChIP-seq) data illustrated the relationship between deep DNA hypomethylation and H3K9me3 occupancy of CTBs as compared to the same regions in hESCs and fetal brain (Figure 2D, Chr2). In CTBs as compared to hESCs, these domains had increased levels of H3K9me3 in relatively gene poor regions (Figure 2E). The chorionic villi, basal plate and smooth chorion samples had the same pattern of H3K9me3 occupancy of deeply DNA hypomethylated regions (Figure S2I). Additionally, we noted a relatively higher H3K27me3 enrichment in the deeply DNA hypomethylated regions of the term sample (Figure 2C).
Figure 2. The Cytotrophoblast Epigenome Gained DNA Methylation at Term While the Local Deeply Hypomethylated Domains Remained Occupied by H3K9me3, which Repressed Transcription.
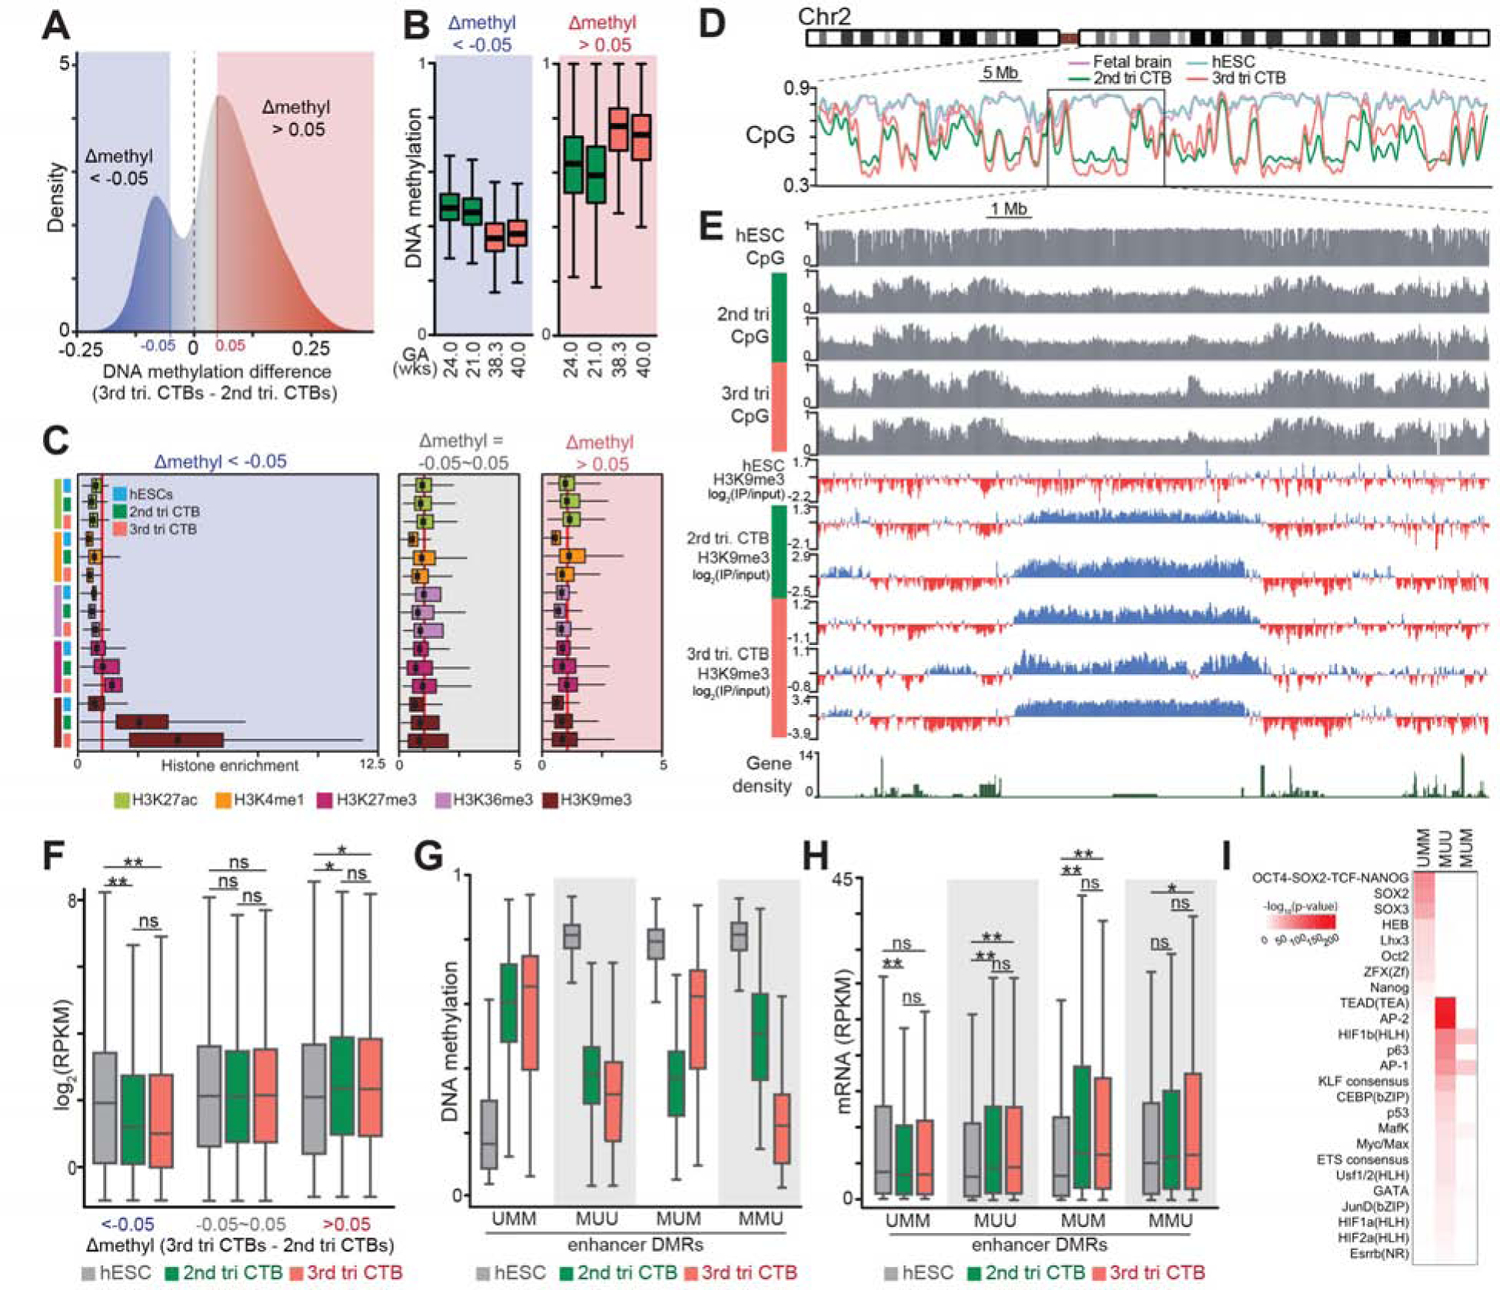
(A) Genome-wide cytotrophoblast (CTB) DNA methylation over 10 kb windows revealed increases as gestational age advanced. (B-C) Regions of the CTB genome that were deeply hypomethylated (B) had strongly enriched signals for H3K9me3 regardless of gestational age (C). (D–E) A chromosome-level (Chr2) view showed deeply hypomethylated domains of the 2nd and 3rd trimester CTB genomes (vs. human embryonic stem cells (hESCs) and fetal brain) had increased levels of H3K9me3 (vs. hESCs) in relatively gene poor regions. (F) Transcription of genes in the deeply hypomethylated valleys was repressed. *, P<0.01; **, P<0.001 (ANOVA); ns, not significant. (G-H) Enhancer DMRs (eDMRs, identified as described in Supplementary Materials) increased the transcription of nearby hESC or CTB genes. (I) eDMRs were significantly enriched for binding motifs of transcription factor with important cell type-specific functions. *, P<0.05; **, P<0.001 (ANOVA). tri, trimester; GA, gestational age; wks, weeks; U, unmethylated; M, methylated. The colored bodies of the box plots represent the first and third quartiles of loci, the middle line represents the median, and the whiskers extend to minimum and maximum data points.
Next, we examined the transcriptional consequences of coinciding H3K9me3 occupancy and deep DNA hypomethylation. In 2nd and 3rd trimester CTBs, transcription in these domains was repressed (Figure 2F, box plots on left), explained in part by the H3K9me3 occupancy (Figures S2J and S2K). Even though net DNA methylation levels increased at term, this relationship was still evident in 3rd trimester CTBs (Figure S2K). These data suggested that increased H3K9me3 occupancy of deeply hypomethylated DNA silences CTB genes. Taken together, the results described thus far suggest that the inverse relationship between deep DNA hypomethylation and H3K9me3 is a feature of the extraembryonic epigenome DNA.
Differentially methylated regions (DMRs) and enhancer DMRs (eDMRs) illuminate cell type-specific regulators
Given the unique nature of the CTB methylome and widespread changes in DNA methylation over pregnancy, we wanted to better understand the DMRs. These regions were identified between pairs of WGBS datasets using a sliding 200-bp window. Mean methylation values were compared between windows containing at least 4 CpGs with each CpG having at least 10x reads in both samples. The windows with the absolute difference in mean methylation greater than 0.25 were selected and overlapping differentially methylated windows were merged. The merged windows with at least 5 CpG sites and 10x reads, and an absolute mean methylation difference of 0.3 or greater were identified as DMRs (p <0.001, Fisher’s exact test).
On average, DMRs were 480 bps with differences of ≥30% methylation between samples (Table S1A). They were categorized according to whether they were methylated (M) or unmethylated (U) in hESCs vs. 2nd or 3rd trimester CTBs, e.g., MUU, methylated in hESCs but unmethylated in 2nd and 3rd trimester CTBs (Figure S3A). In this comparison, many more DMRs were hypomethylated in 2nd trimester and/or term CTBs (182,807 vs. 5,429) and there were more hypomethylated sites in the earlier gestation samples (6,059 MUM vs. 1,166 MMU DMRs). GO analyses of the sites that were uniquely hypomethylated in hESCs (UMM) revealed biological processes that are associated with embryonic morphogenesis (Figure S3B). In contrast, GO analyses of the sites that were uniquely hypomethylated in CTBs (MUU) yielded terms related to cell adhesion or migration, immune processes and signal transduction. GO analyses of sites that were uniquely hypomethylated in 2nd trimester CTBs (MUM), revealed cardiovascular development and cell adhesion or locomotion. In contrast to global methylation, hESCs and CTBs had relatively equivalent numbers of hypomethylated DMRs in the CpG islands of gene promoters (Figure S3C). GO analyses of these sites highlighted embryonic and reproductive processes, respectively (Figure S3D). As compared to hESCs, a larger percentage of CTB DMRs (MUU, MUM, MMU) were distant from the transcription start sites (Figure S3E) and localized in transcription factor binding sites (Figure S3F).
Next, we identified enhancer DMRs (eDMRs) that were hypomethylated and associated with H3K4me1 and/or H3K27ac (Figures 2G, S3G, and Table S1A) (King et al., 2016). Specifically, MUU and MUM DMRs were filtered with the union set of H3K4me1 and H3K27ac peaks to identify 2nd trimester enhancer-DMRs (eDMRs). The same methodology was used to filter MUU and MMU sets to identify 3rd trimester eDMRs. UMM eDMRs were defined by intersecting H3K4me1 and H3K27ac peaks in hESCs. Then we quantified their relationship with gene transcription in hESCs vs. 2nd and/or 3rd trimester CTBs (Figure 2H). Expression of genes in closest proximity to UMM eDMRs was higher in hESCs as compared to 2nd trimester CTBs. Likewise, the transcription of genes near eDMRs that were hypomethylated in CTB samples (MUU) was also higher. Gene expression related to CTB-specific eDMRs (MUM, MMU) likely depended on relative levels of DNA methylation, which correlates with gene silencing (compare Figures 2G and 2H). An additional analysis that used predicted enhancer-gene interaction (EnhancerAtlas, http://www.enhanceratlas.org/) revealed similar trends (Figure S3H, Table S1B).
We then sought to understand the relationship between eDMRs and genes in hESC and CTB contexts. We examined the DNA sequences for enrichment of transcription factor binding motifs in UMM, MUU, and MUM eDMRs as MMU results were not significant. In UMM eDMRs, we found significant enrichment of motifs for transcription factors with essential hESCs functions (e.g., OCT4, SOX2, NANOG; Figure 2I). Conversely, MUU eDMRs were enriched for motifs of transcription factors with important roles in trophoblast differentiation (e.g., TEAD, GATA and ESRBB) (Roberts and Fisher, 2011) and/or critical functions in these cells (e.g., O2 responses; HIF1a,b, HIF2a) (Figures 2I and S3I). MUM eDMRs highlighted the importance of HIF1b, AP-1 and MAFK in 2nd trimester CTBs (Figure 2I, S3J, and S3K). The CTB results revealed plausible links between the eDMRs, transcription factors and the pathways/networks they regulate. Thus, the eDMRs revealed known and potentially novel regulators of CTB fate and function.
Regulation of CTB histone modifications as a function of gestational age
Given the observed gestational age-associated net gains in DNA methylation, we used antibody-based methods (Table S2) to determine whether the relative abundances of the modified histones that occupied the CTB genome also changed over pregnancy. Additional CTB samples were isolated from 1st trimester (n = 5, 9–12.1 wks), 2nd trimester (n=5, 13.5–22.5 wks) and term placentas (n=4, 38.2–42.0 wks). Probing blots of these cell lysates with anti-H3K9me3 antibody revealed a robust signal throughout the 1st and 2nd trimesters with a steep downregulation at term (Figures 3A and 3B). Histone H3 levels, which were used as a loading control, did not change. A similarly steep decline in the relative abundance of H3K27me3 was observed earlier in gestation, starting at week 15 (Figures 3A and 3C). We also profiled histone modifications that are associated with transcriptionally permissive states. The H3K4me3 signal, which varied throughout the 1st and 2nd trimesters, was reduced at term (Figures 3D and 3F). The relative abundance of H3K4me1 fluctuated across gestation (Figure S4A and S4B). The H3K27ac signal was low and variably detected (Figures 3E and 3G).
Figure 3. Loss of a subset of cytotrophoblast histone modifications with advancing gestational age.
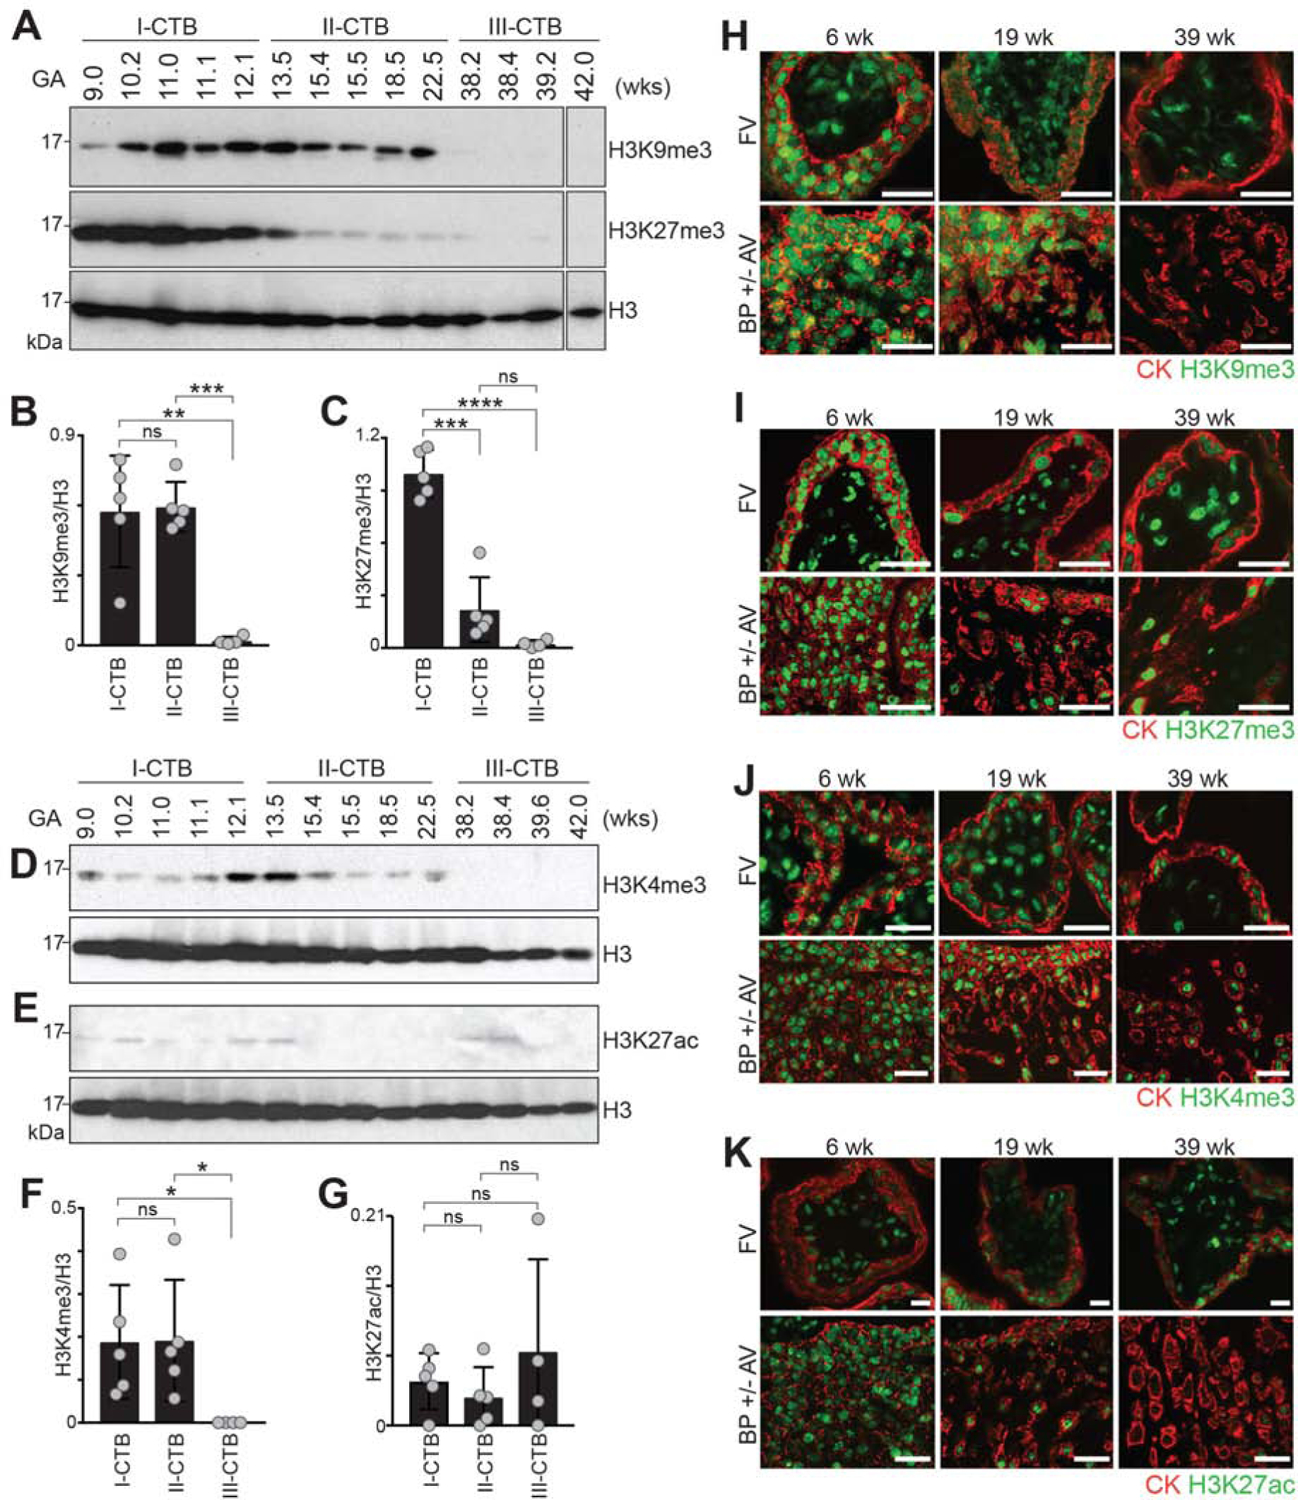
Immunoblotting (A-G) assessed the relative abundance of histone modifications in lysates of freshly isolated 1st (I), 2nd (II) or 3rd trimester (term, III) cytotrophoblasts (CTBs). An immunolocalization (H to K) approach was used to assess expression of the same histone modifications in tissue sections of floating villi (FV) and the basal plate (BP), which includes anchoring villi (AV) and their uterine attachments (diagrammed in Figure S1). (A) The strong signal for H3K9me3 in 1st and 2nd trimester samples were lost at term. H3K27me3 immunoreactivity followed the same pattern with loss beginning in early 2nd trimester. (B-C) quantification of the results relative to the H3 loading control (Welch’s t-test). (D–E) The H3K4me3 signal (D) varied from the 1st to the 2nd trimesters and was lost at term. The H3K27ac signal (E) was weak and fluctuated among the samples. (F-G) Quantification (Welch’s t-test) of H3K4me3 (F) and H3K27ac (G). (H) (upper panels), In FV, the nuclei of cytokeratin-positive villous CTBs and syncytiotrophoblasts (STBs) reacted with anti-H3K9me3 in the 1st to the 2nd trimester samples. Much of the immunoreactivity was lost at term. (lower panels), In AV, invasive CTBs showed a similar pattern of down-regulated H3K9me3 at term. (I-J) In FV and BP ± AV, CTB (and STB) signals for H3K27me3 and H3K4me3 were also diminished at term. (K) Compared to the immunoblot (Figure 3E), relatively strong H3K27ac signals were observed in association with trophoblasts in floating and anchoring villi and the staining was again reduced at term. The error bars represent the standard deviations. *, P<0.05; **, P<0.01; ***, P<0.001; ****, P<0.0001. GA, gestational age; wk, week. Bar = 50 μm.
To confirm and extend these results to specific trophoblast subpopulations, we immunolocalized the same histone modifications in tissue sections of placental chorionic villi (n=6 samples/gestational age). In floating villi (diagrammed in Figure S1C), the nuclei of cytokeratin-positive villous CTBs and STBs showed H3K9me3 signals in 1st and 2nd trimester samples (Figures 3H and S4C, upper panels). However, much of the immunoreactivity was lost at term. In anchoring villi (diagrammed in Figure S1C), invasive CTBs showed a similar pattern of down-regulated H3K9me3 at term (Figures 3H and S4C, lower panels). In floating and anchoring villi, CTB (and STB) signals for H3K27me3 and H3K4me3 were also diminished at term (Figures 3I, 3J, S4D, and S4E). Compared to the immunoblot (Figure 3E), relatively strong H3K27ac signals were observed in association with trophoblasts in floating and anchoring villi and the staining was again reduced at term (Figures 3K and S4F). We attributed this discrepancy to different performance or cross reactivity of the antibody in the two formats. Immunolocalization of the same histone marks together with anti-histone H3 immunoreactivity as a control (Figure S4G) confirmed alterations in the modifications rather than at the protein level. Thus, during normal pregnancy, certain CTB (and STB) histone modifications, both active and repressive, are dramatically altered as gestation advances.
Compartment and gestational age specific H3K27ac occupancy
H3K27ac is associated with the activation of enhancer elements and transcription. Over 80,000 ChIP-seq peaks for this histone modification, ranging from 5,141 (amnion) to 35,704 (CTBs), were specific to an individual compartment (Figures 4A, S5A, and Table S3). Principal component analysis of 10 kb H3K27ac windows clustered the samples that contained epithelial cells (CTBs, amnion, smooth chorion) away from the chorionic villi and basal plate, which were comprised of many varied cell types (PC2; Figure S5B). As to individual sample types, PCA separated CTBs and chorionic villi by gestational age (Figure S5C). GO analyses of the various sample types revealed, among multiple enrichments, a set of genes near CTB-specific H3K27ac peaks associated with the control of H3K9 methylation, suggesting a regulatory relationship with the latter histone modification (Figures 4B and S5D). However, mRNA levels of histone methylating and demethylation enzymes did not reveal clear patterns that could explain the observed gestational-age related differences (Figures S5E and S5F). Genes near villi-specific H3K27ac peaks were enriched for immune functions and erythrocyte differentiation (occurring in the villi (Bárcena et al., 2009)) (Figure 4B). Genes nearest amnion- and chorion-specific H3K27ac peaks showed strong enrichments for skin-related processes, which was in accord with the overall epidermis-like structure of the fetal membranes (Figure 4B).
Figure 4.
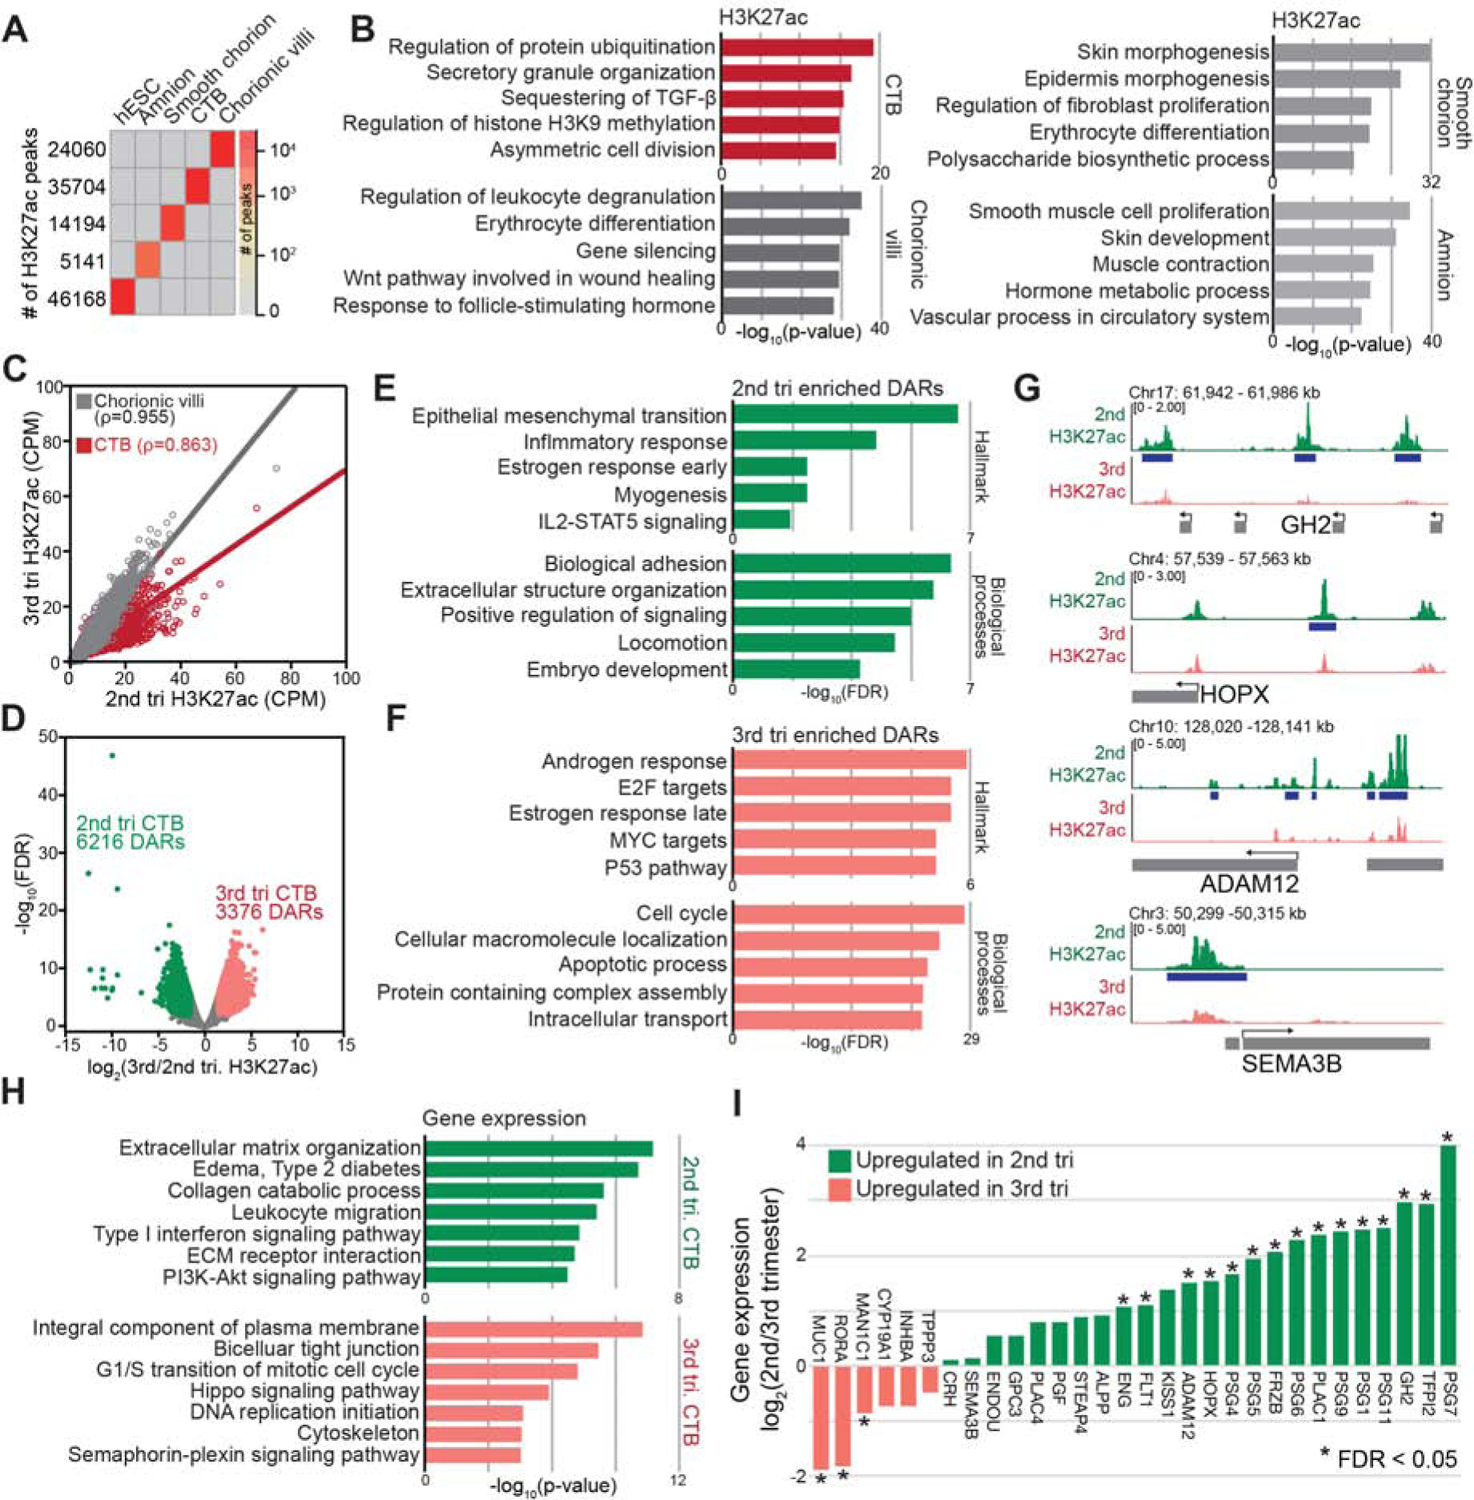
Changes in H3K27ac Occupancy and mRNA Expression (2nd to 3rd trimester) Involved Cytotrophoblast Genes Upregulated in Severe Preeclampsia. (A) H3K27ac peaks that were unique to cytotrophoblasts (CTBs) or other extraembryonic compartments. (B) GO enrichment analysis highlighted the distinct biological processes that were associated with each set of H3K27ac peaks and their relevance to sample-specific functions. (C) Comparison of H3K27ac levels (10 kb windows) in CTBs and chorionic villi (2nd trimester vs. 3rd trimester) showed gestational age-related changes were confined to CTBs. Gray and red linear regression lines and Pearson’s rho shows the H3K27ac correlation between 2nd and 3rd trimester. (D) In CTBs, as gestational age advanced, about twice as many peaks were lost as gained at term. (E) GO enrichment analysis showed 2nd trimester CTB differentially acetylated regions (DARs) were enriched for genes involved in processes integral to placental development. (F) Regions that gained H3K27ac at term were enriched for hormone responses and cell cycle or apoptotic regulators. (G) Sites that lost H3K27ac at term were associated with the promoters of CTB genes we previously showed were upregulated in severe preeclampsia (sPE) (Zhou et al., 2013). (H) GO enrichment (Biological processes and Disease ontology) of genes highly expressed in 2nd (upper panel) vs. 3rd trimester CTBs (lower panel). (I) Transcripts that were upregulated in sPE (Zhou et al., 2013) were overrepresented in the gene set with higher expression in 2nd vs. 3rd trimester CTBs. tri, trimester.
Super-enhancers, which are co-occupied by multiple master transcription factors, control cell identity (Crossley and Orkin, 1993; Whyte et al., 2013). Focusing on the placental samples (CTBs and villi), we performed a comparative analysis of their super-enhancers. By ranking the H3K27ac signal density, 216 and 306 super-enhancers were identified in 2nd trimester CTBs and villi, respectively (Lovén et al., 2013; Whyte et al., 2013) (Figures S5G, S5H, and Table S4). A large set of 2nd trimester CTB super-enhancers lost H3K27ac at term; gestational age-related shifts were not observed in villi likely due to obscuring by stromal components (Figure S5I). Many super-enhancers were shared between the sample types (148; gold); others were unique to villi (158; blue) or CTBs (68; red) (Figure S5J). The CTB-specific super-enhancers were associated with genes related to oxidative stress and placental development, and the villi-specific super-enhancers were associated with genes involved in TGF-beta-related functions and roles in wound healing, coagulation, and hemostasis (Figure S5K).
Beyond super-enhancers, we compared individual H3K27ac peaks in CTBs and chorionic villi during the 2nd trimester-to-term interval. This analysis confirmed that the gestational age regulation of H3K27ac occupancy was observed in CTBs but not villi (Figure 4C). This observation was validated with additional H3K27ac CTB datasets (Figure S5L), which were used for subsequent analyses. In CTBs, as gestational age advanced, 6216 peaks were lost and 3376 were gained at term (Figure 4D and Table S5). Second trimester CTB differentially acetylated regions (DARs) were enriched near genes involved in processes that are integral to placental development: epithelial-mesenchymal transition, adhesion, locomotion as well as early estrogen and inflammatory responses (Figure 4E). Regions that gained H3K27ac at term were near genes involved in androgen and late estrogen responses as well as cell cycle or apoptosis, among others (Figure 4F). This analysis revealed that several of the regions that exhibited gestational age-related regulation of H3K27ac occupancy were associated with the promoters of CTB genes we previously showed were upregulated in sPE (Zhou et al., 2013). Examples included GH2, HOPX, ADAM12 and SEMA3B (Figure 4G). Thus, the net decrease in super-enhancers and individual H3K27ac peaks at term is part of the global shifts in the CTB epigenome that occur as pregnancy advances and suggested misregulation in sPE.
Gene expression dynamics link gestational age regulated genes to severe preeclampsia
The transcriptomic data enabled comparative analyses among the extraembryonic compartments and CTBs. Each sample type had a distinct transcriptome with a high degree of similarity between the chorionic villi and basal plate samples due to their similar cellular composition (Figures S6A and S6B). The differentially expressed genes mapped to KEGG pathways and GO terms specific to each sample type (Figure S6C). In contrast, miRNA expression patterns differentiated CTBs from the other extraembryonic compartments, which did not cluster by type (Figure S6D).
The CTB transcriptomes showed clear separation by gestational age (Figure S6E); 935 and 862 genes were differentially expressed in 2nd and 3rd trimester, respectively. GO analyses highlighted the role of genes that were highly expressed at mid-gestation in pregnancy complications, immune processes, ECM interactions and PI3K-AKT signaling. At term, the differentially expressed genes were involved in DNA replication as well as semaphorin and Wnt signaling (Figure 4H). Genes that were normally down-regulated at term were over-expressed in our previously published sPE CTB dataset, including pregnancy specific glycoproteins (PSGs) (Zhou et al., 2013), and/or encoded the PE biomarkers PGF, ENG or FLT1 (Venkatesha et al., 2006) (Figure 4I). Thus, the gene expression data suggested a link between gestational age-related epigenetic and transcriptional changes and sPE-associated gene dysregulation.
Dysregulation of CTB histone modifications in placenta-associated pregnancy complications
We reasoned that the sPE-associated gene misregulation might occur via an epigenetic mechanism. To determine if histone modifications played a role, we probed immunoblots of CTBs that were isolated from placentas of sPE cases (n = 5 or 6; 30.2–33 wks) with the same antibodies that were used to profile the gestational age-related changes (Figure 3). In these experiments, placentas from preterm deliveries were the source of gestational age-matched control CTBs (n = 4 or 5; 30–34.5 wks). Our previous work showed that, in the absence of inflammation/infection, placentation is essentially normal in these cases (Zhou et al., 2013; 2007). The maternal and neonatal characteristics of these pregnancies are summarized in Table S2. In the majority (4/5), there was a stronger signal for H3K9me3 in CTBs isolated from sPE placentas than in CTBs that were isolated from placentas of uninfected cases of preterm birth (nPTB; Figures 5A and 5B). H3K27me3 was detected in both sets of samples, with higher relative abundances in the sPE cases (Figures 5A and 5C). H3K4me3 tended to be low in most of the samples (Figures 5D and 5E). The H3K27ac signal was significantly increased in sPE (Figures 5D, 5F, S4H, and S4I, which also included term CTB from normal pregnancy). In the nPTB set, we included a CTB sample from a case that was associated with infection. Higher levels of global H3K27ac were also observed, suggesting that alterations involving this histone modification may be a feature of pregnancy complications that are associated with placental pathologies. H3K9ac was variably detected (Figures S4J and S4K) as was H3K4me1 (Figures S4L and S4M). Thus, we found evidence that placental pathologies are associated with global increases in repressive, but most notably the activating histone modification, H3K27ac.
Figure 5.
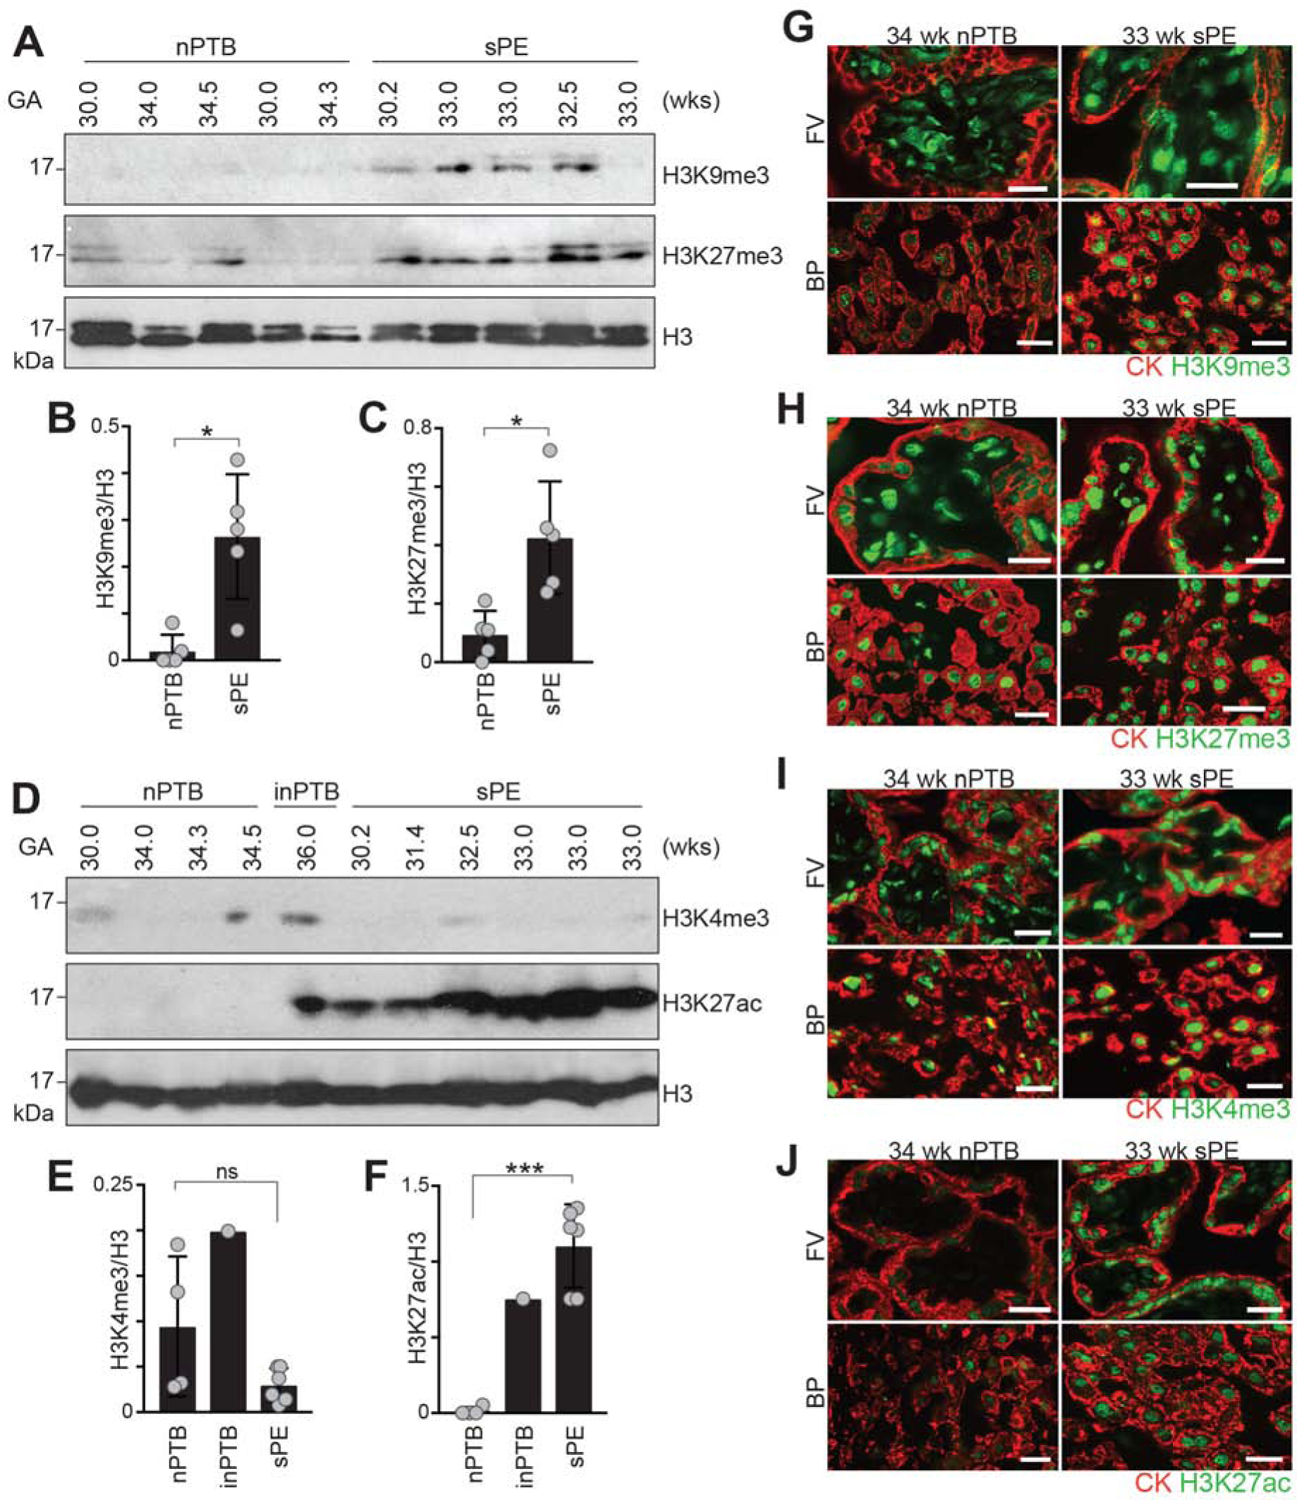
Dysregulation of Cytotrophoblast Histone Modifications in Placenta-associated Pregnancy Complications. Immunoblotting (A-F) or immunolocalization (G-J) enabled analyses of the relative abundance of histone modifications in cytotrophoblast (CTB) lysates from gestational age-matched placentas following delivery due to preterm birth with no signs of infection (nPTB), PTB with a documented infection (inPTB), or severe preeclampsia (sPE). (A) In the majority of samples, CTBs isolated from sPE placentas had a stronger signal for H3K9me3 and H3K27me3 than the equivalent population of cells isolated from nPTB placentas. (B and C) Quantification of H3K9me3 or H3K27me3, respectively, relative to H3 (Welch’s t-test). (D) anti-H3K4me3 reactivity was low-to-undetectable. The H3K27ac signal was significantly increased in sPE and in an inPTB sample relative to nPTB. (E-F) Quantification of H3K4me3 or H3K27ac signals, respectively, relative to H3 (Welch’s t-test). (G) In floating villi (FV) and within the basal plate (BP), sPE was associated with relatively more intense CTB and syncytiotrophoblast (STB) anti-H3K9me3 immunoreactivity than was observed in the nPTB samples. (H) The trophoblast-associated H3K27me3 signal also tended to be stronger in the sPE group. (I) H3K4me3 immunostaining gave a stronger signal than in the immunoblot format and showed similar patterns in the nPTB and sPE groups. (J) Expression of H3K27ac, which was nearly undetectable in the nPTB group, was strongly increased in association with CTBs and STBs in sPE. The error bars represent the standard deviations. *, P< 0.05; ***, P<0.001. Bar = 50 μm.
To confirm these results, we immunolocalized the same histone modifications in tissue sections of chorionic villi from sPE and control nPTB placentas. In floating villi and within the basal plate (Figure S1C), sPE was associated with more H3K9me3 signal than was observed in the nPTB samples (Figure 5G). The H3K27me3 signal also tended to be stronger in the sPE group (Figure 5H). H3K4me3 immunostaining gave a stronger signal than in the immunoblot and showed similar results in the nPTB and sPE groups (Figure 5I). The H3K27ac immunoreactivity, which was nearly undetectable in the nPTB group, was strongly increased in association with CTBs in sPE (Figure 5J). Together these results suggest that sPE (as compared to nPTB) is associated with significant alterations in global levels of histone modifications, particularly the activating mark H3K27ac. This could be one reason for the up-regulation of genes, such as PSGs, that are normally down-regulated as a function of gestational age.
To better understand, at genome scale, the consequences of enhanced H3K27ac in sPE, we performed ChIP-seq to identify the occupied sites in CTBs from affected pregnancies (Table S2) as compared to 2nd and 3rd trimester cells isolated from normal control placentas. Consistent with the immunoblot analyses, sPE samples had much higher levels of H3K27ac occupancy across the genome as compared to the controls (Figure 6A). Hierarchical clustering of the gestational age-specific DARs showed that 4/6 sPE samples were more similar to 2nd trimester CTBs; 2 sPE samples, including cells from the earliest gestational age (28 wks), clustered with 3rd trimester CTBs (Figure 6B). Statistical analyses of the DARs confirmed retention of a 2nd trimester-like pattern of H3K27ac in a subset of samples (Figure 6C, boxplots). Given that only 2 sPE samples clustered with term CTBs, a comparable analysis was not possible for these cases, but their distribution trended toward a later gestational-age phenotype. The sPE H3K27ac peaks that retained a 2nd trimester pattern (Figure 6C and Table S6) were associated with syndrome-relevant signatures as shown by our previous work: epithelial-mesenchymal transition (Zhou et al., 1997), inflammatory responses and angiogenesis (Zhou et al., 2002) (Figure 6D). Specific loci that retained a 2nd trimester pattern of H3K27ac peaks in all the sPE samples included the PSG cluster, a highly related family that is strongly downregulated at term and upregulated in sPE CTBs (Zhou et al., 2013) (Figures 6E). Additionally, sPE was associated with enhanced H3K27ac signals at numerous unique sites relative to control 2nd trimester or term CTBs (Figures 6F, 6G, and Table S7). sPE-specific enrichment (393 loci) was much more common that depletion (10 loci; Figure 6H and Table S7). The uniquely enhanced peaks (Figure 6I) were associated with signaling pathways (TNF-α, KRAS, and IL2-STAT5) as well as allograft rejection and apoptosis (Figure 6J). The genes that demonstrated this pattern included several that are involved in apoptosis such as the “initiator” CASP8, EMP1 and BMF (Figure 6K). CASP1 had a different pattern: higher levels of H3K27ac occupancy in sPE and at term vs. 2nd trimester. Thus, sPE-associated upregulation of H3K27ac was related to dysregulated gene expression in this pregnancy complication.
Figure 6.
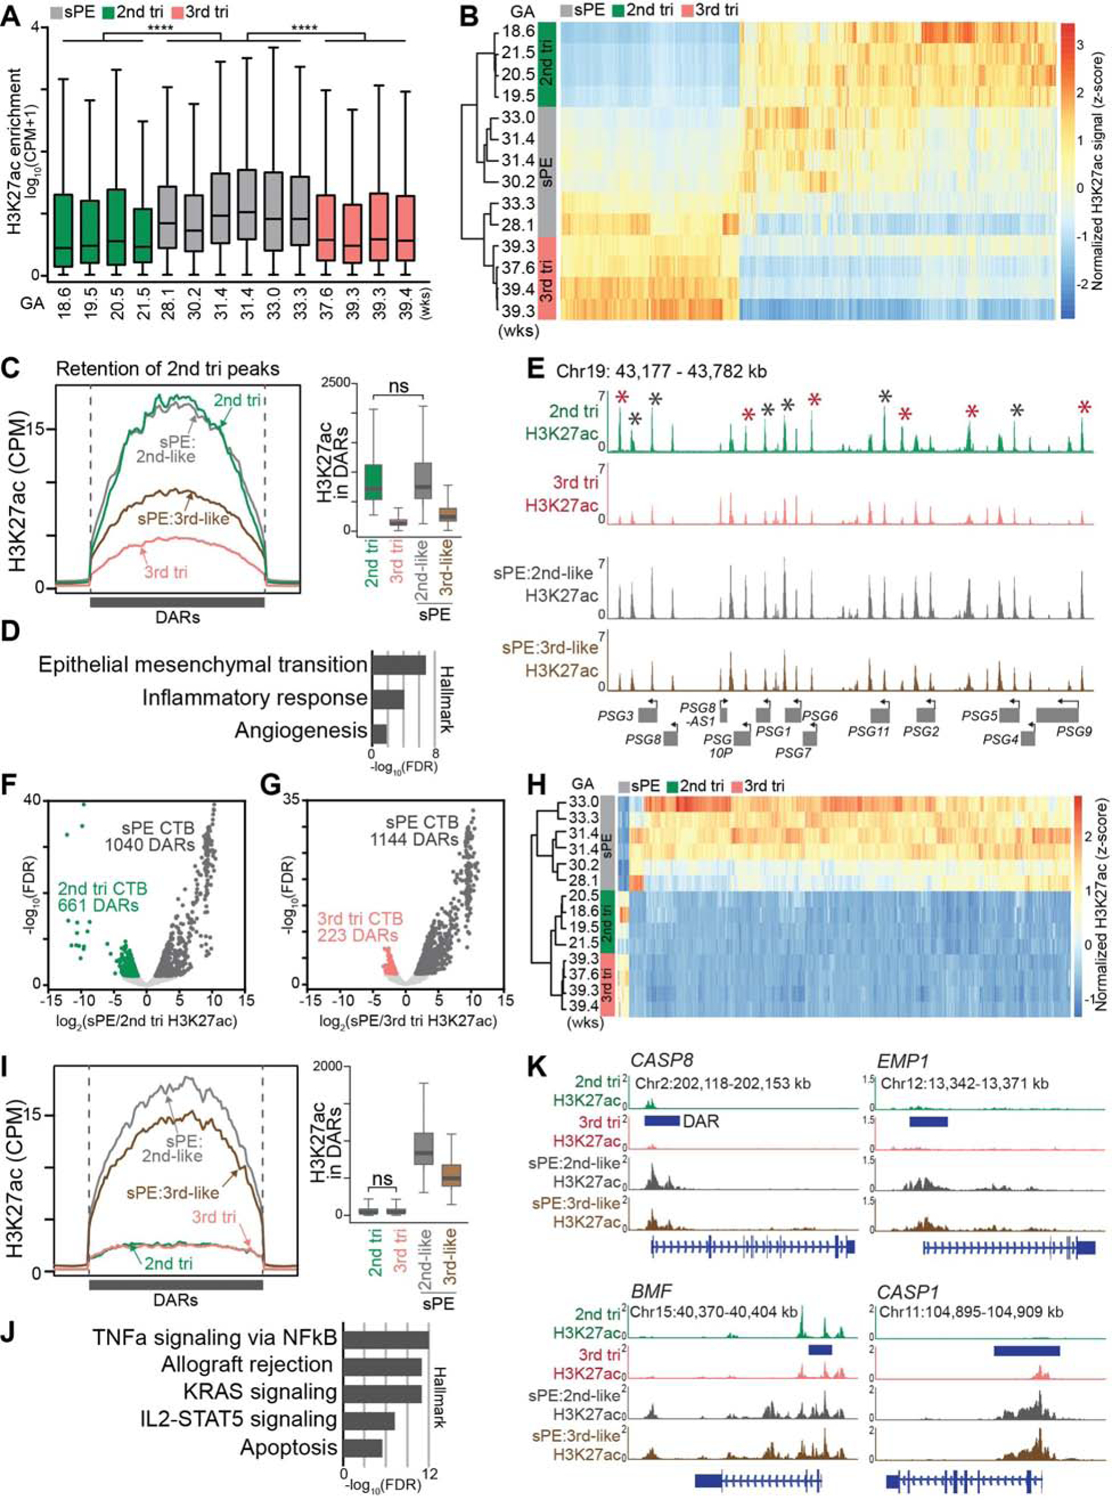
Enhanced H3K27ac Occupancy of Cytotrophoblast DNA in Severe Preeclampsia. (A) Box plots of H3K27ac genome-wide enrichment from ChIP-seq in merged MACS2 peaks across the samples. Consistent with the immunoblot analyses (Figure 5D), cytotrophoblasts (CTBs) from severe preeclampsia (sPE) pregnancies had significantly higher average H3K27ac levels compared to control 2nd or 3rd trimester samples (****, P<0.0001, Mann-Whitney test). (B) Hierarchical clustering based on 2nd vs 3rd trimester differentially acetylated regions (DARs; FDR <0.01, FC >1.5) showed that 4/6 severe preeclampsia (sPE) samples were more similar to 2nd trimester cytotrophoblasts (CTBs); 2 sPE samples, including cells from the earliest gestational age (GA) (28 wks), clustered with 3rd trimester CTBs. (C) sPE H3K27ac peaks with a 2nd trimester pattern. Unless marked ns (not significant), the values were significantly different from one another (Mann-Whitney test, P<0.0001). (D) The overlapping peaks between sPE and 2nd trimester CTBs were near genes with syndrome-relevant hallmarks. (E) Specific loci in all the sPE samples with a 2nd trimester-like H3K27ac peak pattern included the PSG cluster, a highly related family that is strongly downregulated at term and upregulated in sPE CTBs. Red asterisks: FDR <0.01, FC >1.5; Black asterisks: FDR <0.05. (F-G) Volcano plots of differentially acetylated regions (DARs; FDR <0.01, FC>1.5) between 2nd trimester and sPE (F) and 3rd trimester and sPE (G). (H) Hierarchical clustering of sPE-specific DARs, the overlapping sites identified in (F) and (G). (I) Unique sPE H3K27ac peaks. Unless marked ns (not significant), the values were significantly different from one another (Mann-Whitney test, P<0.0001). (J) The unique sPE peaks were near genes with hallmarks of signaling pathways, allograft rejection and apoptosis. (K) Genes associated with unique sPE H3K27ac peaks included several that are involved in apoptosis such as the “initiator” CASP8, EMP1, BMF and CASP1. tri, trimester; wks, weeks. The colored bodies of the box plots represent the first and third quartiles of loci, the middle line represents the median, and the whiskers extend to the last data point within 1.5 times the interquartile range.
Discussion
Early studies of DNA methylation provided a glimpse of the unusual epigenome of the human placenta (Ehrlich et al., 1982; Schroeder et al., 2013). Our multilayered epigenome, transcriptome and miRNA profiles of the functionally distinct extraembryonic compartments at different gestational ages illuminate the novel genome organization of these evolutionarily recent structures. We discovered dramatic age-related reprogramming in normal gestation and aberrations in maturation accompanying a common placental-driven pregnancy complication with high rates of morbidity and mortality. Further to its unusual nature, the deeply hypomethylated, gene-poor domains of extraembryonic DNA were associated with heterochromatic regions occupied by H3K9me3, which repressed gene expression, suggesting that condensed chromatin states are maintained through a DNA methylation-independent mechanism. A separate set of smaller hypomethylated regions coupled with enhancer-associated histone modifications (H3K4me1 and/or H3K27ac) revealed highly expressed genes with known roles in placental development while also highlighting a trove of new genes for follow up functional analysis. Binding motifs for transcription factors with known roles in the placenta were also highly enriched among putative active enhancers and enabled the reconstruction of regulatory relationships between transcription factors and the pathways that they regulate in CTBs. These results suggested that the transcriptional consequences of DNA hypomethylation in CTBs are dependent on co-occurring histone modifications. They also show how compartment and gestational age-specific functions are discoverable from the dynamics of the epigenome.
These findings have implications concerning the many singular aspects of placental and CTB biology. Upon fertilization, the zygotic genome is demethylated followed by rapid remethylation at the implantation stage of cells fated to form the embryo (Guo et al., 2014; Smith et al., 2014). Our data suggested that an extraembryonic fate could be associated with maintenance of hypomethylation coordinated with histone-regulated gene expression. Additionally, the striking alterations in the CTB histone code could have other functions. In mouse liver, there is a circadian rhythm to methylation and acetylation of histones H3K4me3, H3K9ac and H3K27ac, and therefore, transcription (Takahashi, 2017). It may be that similar changes in chromatin structure on a longer time scale might be part of a clock mechanism that specifies the lifespan of the placenta and/or the timing of birth. Also, the gestational age-related changes we observed could be evidence of aging. In this regard, the loss of H3K9me3 and H3K27me3 is consistent with alterations observed in Hutchinson-Gilford progeria syndrome, a genetic condition that causes premature aging (Scaffidi and Misteli, 2006). In mice, epigenetic silencing of uterine chemokine expression during pregnancy limits effector T-cell trafficking, contributing to fetomaternal tolerance (Nancy et al., 2012). Thus, regulation at an epigenetic level could be a more general feature of pregnancy biology.
Alterations in the CTB transcriptome and epigenome that occurred as a function of gestational age suggested that pregnancy complications involving faulty placentation might be associated with shifts in the normal expression patterns. To test this theory, we focused on sPE, which is diagnosed by the new onset of maternal hypertension and proteinuria. The placental manifestations include aberrant CTB differentiation and reduced invasion of the uterine wall, often resulting in shallow placentation (Fisher, 2015). Profiling the CTB transcriptome in sPE revealed the affected genes, which were almost entirely up-regulated (Zhou et al., 2013). To determine if the misexpressed genes were regulated as a function of gestational age, we used mRNA-seq datasets from 2nd and 3rd trimester CTBs to identify the subset of transcripts that were down-regulated at term. Intersecting this list with the sPE-associated genes showed that transcripts normally down-regulated near birth continued to be expressed in this pregnancy complication. Searching for an explanation led us to interrogate histone modification levels. Among other changes was a very significant upregulation of activation-associated H3K27ac. Altered global levels of this histone modification were not observed in the majority of gestational age-matched preterm birth samples. Nevertheless, a preterm delivery that was associated with prolonged rupture of the fetal membranes had the same pattern of elevated expression, suggesting a more general relationship to placental pathologies.
Maps of H3K27ac in CTBs showed reduced H3K27ac occupancy at term relative to 2nd trimester. A subset of CTBs from sPE samples (4/6) had features of a 2nd trimester H3K27ac pattern and all the cases had unique sites of H3K27ac occupancy that were distinct from that of 2nd trimester or term samples. Our findings agree with the identification of a PE subtype with a gene signature consistent with immaturity (Leavey et al., 2015), which is recognized by pathologists (Redline et al., 2004), and a previous report of alterations in placental H3K27ac playing a key role in fetal growth restriction, a pregnancy complication associated with sPE-like pathological changes in the placenta (Paauw et al., 2018). The two samples with term-like H3K27ac patterns were consistent with an ongoing pathological process that results in premature aging of the CTB epigenome (Cox and Redman, 2017; Mayne et al., 2017). Heterogeneity in the pattern of H3K27ac occupancy of CTB DNA in sPE hints at the potential utility of using the epigenome to classify different entities within this syndrome as has been done in cancer (Capper et al., 2018; Corces et al., 2018). In this regard, we would expect the different clinical presentations of PE to have different epigenetic signatures. Presumably, the epigenetic changes we discovered did not lie downstream of DNA sequence alterations as is the case in many cancer types. Thus, we suspect they are the primary effectors of aberrant CTB gene expression in sPE rather than the consequence of disease-associated mutations that directly or indirectly impact the epigenome, and consequently, the transcriptome.
Our results suggested that H3K27ac plays an important role in fundamental aspects of placental biology and pathology. Acetyl-CoA synthetase regulates histone acetylation and transcription (Mews et al., 2017). Our data suggest that elements of the placental epigenome might respond to the metabolic state of the mother. This link may explain why obesity is a strong risk factor for PE (Sween et al., 2015). Additionally, metabolic changes in the cells secondary to placental under perfusion and pathological hypoxia could also be playing a role in the observed alterations. Beyond this syndrome we theorize that a connection between the placental epigenome and its impact on the organ’s function could underlie the developmental origins of adult diseases in which maternal undernutrition during pregnancy leads to cardiovascular disorders (Barker et al., 1989) and other problems later on in life (Burton et al., 2016).
Limitation of the study
In many cases, our findings were first reports and oftentimes our sample numbers were relatively small due to the substantial resources the tissue collection/cell isolation efforts and analysis methods required. Given the heterogeneity inherent in human biology, it will be important to determine if additional nuances are evident as independent datasets are added and other genomic features are analyzed. Furthermore, PE is a notoriously heterogeneous pregnancy complication. Thus, it will be important to study the relationship between alterations in the cytotrophoblast epigenome and the major forms of this syndrome, including the most common form that manifests at term.
STAR METHODS
RESOURCE AVAILABILITY
Lead Contact.
Further information and requests for resources and reagents should be directed to and will be fulfilled by Susan Fisher (susan.fisher@ucsf.edu).
Materials Availability.
This study did not generate new unique reagents.
Data and Code Availability.
The Illumina 450K DNA methylation data are available under Gene Expression Omnibus (GEO) accession GSE98938. WGBS, ChIP-seq, RNA-seq, and miRNA-seq data are available under SRA280018 and EGAD00001006066. The codes used in the manuscript are available at https://github.com/Zhang-lab/Placenta_Epigenome.
EXPERIMENTAL MODEL AND SUBJECT DETAILS
Tissue collection.
This study was reviewed by the UCSF Institutional Review Board and samples were acquired after written informed consent was obtained. Placentas and/or fetal membranes were collected within 30 min of elective terminations (1st and 2nd trimesters) or deliveries (nPTB, sPE, and term). Placentas from sPE and nPTB cases were collected based on the diagnostic criteria we previously described (Gormley et al., 2017). The clinical characteristics and sample sizes of the sPE and nPTB pregnancies are summarized in Table S2.
Diagnostic Criteria.
The American College of Obstetrics and Gynecology (ACOG) criteria were used to identify PE patients (ACOG Committee on Practice Bulletins--Obstetrics, 2002; American College of Obstetricians and GynecologistsTask Force on Hypertension in Pregnancy, 2013). These included the new onset of hypertension measured on two occasions at least 4 h apart—blood pressure ≥ 140 mm Hg (systolic) or 90 mm Hg (diastolic) in a woman who was normotensive before 20 wks of pregnancy. We also included the appearance of proteinuria—excretion of ≥ 300 mg in a 24-h period or protein/creatinine ratio ≥ to 0.3 mg/dL. Severe preeclampsia (sPE) was also diagnosed using ACOG criteria (ACOG Committee on Practice Bulletins--Obstetrics, 2002; American College of Obstetricians and GynecologistsTask Force on Hypertension in Pregnancy, 2013), based on additional signs and symptoms including one or more of the following: 1) systolic blood pressure ≥ 160 mm Hg and/or diastolic pressure ≥ 110 mm Hg on two occasions at least four hours apart while the patient is on bed rest; 2) proteinuria of ≥ 5 g in a 24-h period; 3) hemolysis (peripheral blood smear and/or LDH ≥ 480); 4) elevated liver function (SGOT ≥ 64 or SGPT ≥ 80); 5) thrombocytopenia (platelets ≤ 100,000); 6) oliguria (≤ 500 cc in 24 h); 7) creatinine ≥ 1.1 mg/dL or a doubling of the serum creatinine concentration with no known renal dysfunction/disease; or 8) cerebral or visual disturbances and/or convulsions with no prior history of seizure disorders.
As controls, samples were obtained from women who delivered due to noninfected preterm birth (nPTB), diagnosed according to the criteria recommended by Herron and colleagues (Herron et al., 1982), including regular uterine contractions after 20 wks or before 37 wks of gestation, which are ≤ 5 to 8 min apart, and accompanied by one or more of the following: 1) progressive changes in the cervix; 2) cervical dilation ≥ 2 cm; and/or 3) cervical effacement ≥ 80 percent. Patients with evidence of inflammation were excluded on the basis of the following criteria: maternal fever > 100.4°F, uterine tenderness, fetal tachycardia (fetal heart rate > 160 beats per min) and/or (placental) histological criteria compatible with inflammation (Kim et al., 2015; Redline, 2015; Zhou et al., 2007). Women with pre-existing medical conditions were excluded from the case and the control groups. Other exclusion criteria included premature rupture of the membranes (except the case noted) and/or fetal anomaly.
METHOD DETAILS
Sample preparation.
Placentas and fetal membranes were collected within 30 min of delivery and immediately washed in cold PBS. The amnion and chorion were divided along their shared stromal plane. Samples of chorionic villi and the basal plate were prepared by dissection. As a final step, all the tissues were repeatedly washed in cold PBS. CTBs were isolated from 2nd and 3rd trimester placentas as previously described (Hunkapiller and Fisher, 2008). The cells and tissues were frozen in liquid nitrogen and pulverized by using a mortar and pestle. RNA or DNA was isolated as previously described (Mazor et al., 2015). The number of samples for each genomic analysis is summarized in Table S8.
Immunoblotting and immunolocalization.
The experiments were done using our published methods (Zhou et al., 2013). Relative quantification was by densitometry with normalization to histone 3 using ImageJ (Schneider et al., 2012). The antibodies, sources, working concentrations, and relevant Figures are shown in Table S2 and STAR Methods.
H3K27ac ChIP-seq of validation samples.
The frozen cells were washed in PBS supplemented with a protease inhibitor cocktail (Calbiochem 539134) and incubated in lysis buffer (10 mM Sodium butyrate, 0.1% Triton X-100, 0.1% deoxycholate, 1x proteinase inhibitor cocktail) on ice for 20 minutes. Chromatin fragmentation was accomplished by incubating the lysate with MNase I (9U/ul NEB M0247S) at 25°C for 6 min. The reaction was stopped using 250 mM EDTA (20 mM final concentration) and 1% Triton/1% DOC (final concentration 0.1% each). Fragmented chromatin (10% by volume) was used as an input control. The rest was subjected to chromatin immunoprecipitation (ChIP). The sample was precleared by incubating with a 50:50 (v:v) Protein A: Protein G Dynabead slurry (Invitrogen 100–02D and 100–04D, respectively) for 1 h on a rotator at 4°C. Then the precleared chromatin was incubated overnight on a rotator at 4°C with bead-bound anti-H3K27ac (CMA309, Hiroshi Kimura laboratory, 0.5 ug/reaction) (Kimura et al., 2008). The beads and immobilized chromatin were washed twice with low salt buffer (20 mM Tris-HCl pH8.0, 2 mM EDTA, 150 mM NaCl, 1% Triton X-100, 0.1% SDS) followed by two washes with high salt buffer (20 mM Tris-HCl pH8.0, 2 mM EDTA, 500 mM NaCl, 1% Triton X-100, 0.1% SDS). Then they were resuspended in elution buffer (100 mM NaHCO2, 1% SDS) for 1.5 h at 65°C. The input and ChIP samples were incubated with Proteinase K for 30 min at 50°C and DNA was purified using a SeraMag bead (Fisher Sci 09-981-123) slurry in 30% PEG-8000. Illumina libraries were constructed and sequenced on a HiSeq4000 (75 bp or 125 bp paired end).
QUANTIFICATION AND STATISTICAL ANALYSIS
Bisulfite-seq data processing.
Sequence reads were directionally aligned to the human genome (hg19) using Bismark (Krueger and Andrews, 2011) (v. 0.16.1) running Bowtie (Langmead et al., 2009) (v. 1.1.0), allowing up to two mismatches in the 50 bp seed region (using -n 2 -l 50 parameters). Methylation status for each aligned CpG was calculated using Bismark Methylation Extractor (v. 0.16.0) at a minimum of 5x coverage per site in a strand-specific manner (run-time parameters: -p, --no-overlap, --comprehensive, --bedGraph, --counts).
Identification of differentially methylated regions.
DMRs were identified between pairs of WGBS datasets using a sliding 200-bp window. Mean methylation values were compared between windows containing at least 4 CpGs with each CpG having at least 10x reads in both samples. The windows with the absolute difference in mean methylation greater than 0.25 were selected and overlapping differentially methylated windows were merged. The merged windows with at least 5 CpG sites and 10x reads, and an absolute mean methylation difference of 0.3 or greater were identified as DMRs (p <0.001, Fisher’s exact test).
Comparative analysis of DMRs between hESCs and CTBs.
DMRs were compared between hESCs (n = 1), 2nd trimester CTBs (n = 2), and 3rd trimester CTBs (n = 2). DMRs that were hypermethylated in hESCs as compared to each CTB sample (an intersection of four pairwise comparisons) were classified as MUU DMRs (where M refers to relatively higher methylation in hESCs, and each U refers to relatively lower methylation in 2nd and 3rd trimester CTBs, respectively). DMRs hypomethylated in hESCs compared to all CTBs were classified as UMM. A MUM profile was defined by taking the intersection of DMRs hypomethylated in the earliest 2nd trimester CTB sample (16 wk) compared to the two 3rd trimester CTBs (38 and 40 wk). hESC methylation status was not considered when defining the MUM profile. Nevertheless, the majority of these regions were highly methylated in hESCs. An MMU profile was defined by identifying DMRs that were hypermethylated in 16 wk CTBs as compared to the two 3rd trimester CTB samples.
Enhancer-DMR identification and gene assignment.
MUU and MUM DMRs were filtered with the union set of H3K4me1 and H3K27ac peaks to identify 2nd trimester enhancer-DMRs (eDMRs). The same methodology was used to filter MUU and MMU sets to identify 3rd trimester eDMRs. UMM eDMRs were defined by intersecting H3K4me1 and H3K27ac peaks in hESCs. To estimate the effect of eDMRs on expression, genes with a transcription start site (TSS) within 10kb of an eDMR were categorized as a putative target. Genes near multiple eDMRs were counted accordingly. For example, a gene with MUM and MUU eDMRs within 10kb of the TSS was included in both sets. Additionally, we associated eDMRs with their target genes based on EnhancerAtlas (http://www.enhanceratlas.org/), which integrates 6 different genomic features and ChIA-PET/HiC interaction data from various human tissues and cell lines. When an eDMR was assigned to multiple genes, the one with the highest significance was selected. eDMRs within 50kb of the transcription start site were used for the subsequent transcriptional analyses.
Transcription factor motif enrichment in eDMRs.
Enriched motifs for each eDMR profile were determined via the motif scanning function of HOMER (Heinz et al., 2010), findGenomeMotifs.pl, using the standard HOMER database with MEME/Jasper position weight matrix. Sequences obtained from hg19 were repeat masked before motif finding. Enrichment values were based on random human genome background sequences with the same CpG content as the eDMR sequences.
Associating transcription factor motifs with gene pathways.
Motif-containing eDMRs were associated with gene pathways using GREAT (McLean et al., 2010). Briefly, GREAT assigns regions of interest to the nearest gene within 1MB, then uses a binomial test to determine if the regions are significantly enriched near genes with a particular annotation. The significant association between GO biological process terms (p<0.01) and eDMR- (MUM and MUU) associated predicted transcription factors was determined by FIMO using default parameters. The protein-protein interaction network was built using Cytoscape (Shannon et al., 2003).
GO enrichment analysis.
GO enrichment analysis of genes that were differentially expressed was performed using DAVID (Huang et al., 2009). GO enrichment analysis of H3K27ac peaks and super-enhancers was performed using the GREAT web tool (v3.0) with default parameters (McLean et al., 2010). GO enrichment analysis of genes with H3K27ac peaks at their promoters was performed using the GSEA Molecular Signatures Database (Subramanian et al., 2005). Only categories below an FDR of 0.05 were reported.
RNA-seq data processing.
Reads were aligned to the human genome (hg19) with STAR (Dobin et al., 2013) version 2.4.2a81. Gene counts were derived from the number of uniquely aligned, unambiguous reads by featureCounts, version 1.4.6, with GENCODE gene annotation (V19). All gene-level transcript counts were imported into the R/Bioconductor package edgeR (Robinson et al., 2010) and TMM normalized to adjust for differences in library sizes. Genes not expressed in any sample were excluded from further analysis. Differentially expressed genes were filtered for absolute fold-changes ≥ 2 with a false-discovery rate of ≤ 0.01.
miRNA-seq data processing.
Reads were trimmed to 24nt and aligned to hg19 using BWA (Li and Durbin, 2010). featureCounts was used to calculate the miRNA reads against miRbase annotation. The miRNA expression of each annotation was normalized to 1 million reads. Compartment-specific miRNAs were identified by using edgeR with an FDR<=0.05 compared to the other tissues/cells. The highly-expressed, compartment-specific miRNAs were selected and normalized expression levels were plotted by using the gplots package.
ChIP-seq data processing.
The reads were aligned to the hg19 reference genome using BWA with samse (for single-end libraries) or mem (for paired-end libraries). For single-end sequencing, the reads were 5’ extended to 150 bp before aligning. For paired-ends sequencing, reads with a corresponding pair were retained for the subsequent analyses. Reads with mapping quality scores <10 were discarded and the reads that aligned to the same genomic coordinates were counted only once. For peak calling, MACS2 (Zhang et al., 2008) was used to compare a ChIP-seq signal to its corresponding input control to identify narrow regions of enrichment (peaks) that passed a FDR threshold of 0.01 and broad domains that passed a FDR of 0.01.
Identification of H3K27ac peaks.
For the extraembryonic cells and compartments (the data from Epigenome Roadmap Project), Bed and bedgraph files were generated using methylQA with default parameters for downstream analyses and visualization. H3K27ac narrow peaks were identified by MACS2 (Feng et al., 2012) using default parameters, and overlapping peaks were determined using BEDTools (bedtools intersect) (Quinlan and Hall, 2010) with a 1 bp overlapping cutoff. For the validation sets, H3K27ac peaks were identified using MACS2 (Feng et al., 2012) (narrow peak calling, -f BAMPE) using filtered BAM files. The identified peaks from all samples were merged using the BEDTools (bedtools merge) (Quinlan and Hall, 2010) and Tukey boxplots were generated for comparisons.
PCA plots.
PCA plots of 10kb H3K27ac windows were generated with deepTools2 using multiBigwigSummary and plotPCA (--transpose) tools (Ramírez et al., 2016).
Identification of super-enhancers.
Super-enhancers were identified as previously described (Lovén et al., 2013; Whyte et al., 2013). MACS2 (Feng et al., 2012) broad peak calling (--broad) was used to identify H3K27ac peaks. The ranked H3K27ac occupancy and H3K27ac counts in reads per million were plotted and the derivative calculated. Peaks with a derivative >2 and CPMs >200 were identified as super-enhancers. To generate scatter plots, the filtered peaks were merged using BEDTools (bedtools merge) (Quinlan and Hall, 2010).
Identification of H3K27ac differentiated acetylated regions.
MACS2 (Feng et al., 2012) peaks from the validation datasets were used as the input for the DiffBind (Ross-Innes et al., 2012) R package. The loci with less than an average of 250 reads across the comparative analyses (DiffBind parameters: filter=250, filterFun=mean) were removed to eliminate regions with low sequence coverage from the analysis. The differentially acetylated regions with FDR <0.01 and absolute fold change >1.5 were defined as significantly differentially acetylated loci. The average H3K27ac distribution of filtered differentially acetylated was generated using deepTools2 (Ramírez et al., 2016).
Identification of H3K27ac occupied regions in sPE CTB samples with a 2nd trimester-like pattern.
This analysis used only the differentially acetylated regions between 2nd and 3rd trimester CTBs. Within these sites, H3K27ac levels of sPE and 2nd trimester CTBs were compared using EdgeR. The loci with FDR <0.05 were defined as having a 2nd trimester-like sPE pattern.
Identification of sPE-specific H3K27ac peaks.
The overlapping DARs from 2nd trimester vs. sPE and 3rd trimester vs. sPE DiffBind results were defined as sPE-specific H3K27ac peaks.
Data visualization.
Sequencing data were visualized using IGV (Robinson et al., 2011) or the New WashU Epigenome Browser (Zhou et al., 2011).
Supplementary Material
Table S4 2nd Trimester CTB and villi super-enhancers. Related to Figure S5.
Table S5 Differentially H3K27 acetylated loci between 2nd and 3rd trimester CTBs. Related to Figure 4.
Table S6 2nd trimester-like H3K27ac peaks in sPE. Related to Figure 6.
Table S7 Differentially H3K27 acetylated loci between sPE and 2nd/3rd trimester CTBs. Related to Figure 6.
Table S8 Summary of samples and sequencing libraries. Related to Figures 1, 2, 4, 6, S2, S3, S5, and S6.
KEY RESOURCES TABLE
| REAGENT or RESOURCE | SOURCE | IDENTIFIER |
|---|---|---|
| Antibodies | ||
| CK7 | Damsky et al., 1992 | 7D3 |
| H3K4me1 | Millipore | 07-431 |
| H3K4me3 | Cell Signaling | C4208 |
| H3K9ac | Abcam | Ab10812; RRID: AB_297491 |
| H3K9me3 | Abcam | Ab8898; RRID: AB_306848 |
| H3K27me3 | Millipore | CS200603; RRID: AB_2616281 |
| H3K27ac | Abcam | Ab4729; RRID: AB_2118291 |
| Pan-H3 | Abcam | Ab1791; RRID: AB_302613 |
| TRITC | Jackson Immuno Research | 712-025-153; RRID: AB_2340636 |
| FITC | Jackson Immuno Research | 711-095-152; RRID: AB_2315776 |
| HRP | Jackson Immuno Research | 711-035-152; RRID: AB_10015282 |
| H3K27ac | Abcam | Ab4729; RRID: AB_2118291 |
| H3K27ac | Hiroshi Kimura lab | #2 |
| H3K9me3 | Diagenode | pAb-056-050; RRID: AB_2616051 |
| H3K27me3 | Diagenode | pAb-069-050; RRID: AB_2616049 |
| H3K36me3 | Abcam | ab9050; RRID: AB_306966 |
| H3K4me1 | Diagenode | pAb-037-050; RRID: AB_2561054 |
| Chemicals, Peptides, and Recombinant Proteins | ||
| Ultra Pure Water | Invitrogen | 10977-023 |
| Anhydrous Ethyl Alcohol | Commercial Alcohols | People Soft ID: 23873 |
| DNA away | Molecular Bioproducts | 7010 |
| 1M Tris solution, pH 8.0 | Ambion | AM9856 |
| Triton X-100, laboratory grade | Sigma | X100-100ML |
| 20% SDS Solution | Ambion | AM9820 |
| 5M NaCl | Ambion | AM9760G |
| 1M DTT | Invitrogen | P2325 |
| 1M Tris HCl pH 7.5 | Invitrogen | 15567-027 |
| 0.5M EDTA | Ambion | AM9260G |
| Deoxycholic Acid, Sodium Salt | Fisher Scientific | AC218590250 |
| Sodium Bicarbonate | Sigma Aldrich | S5761-500G |
| PCR Clean ChIPSeq Beads with 30% PEG | Aline Biosciences | C-1007 |
| Micrococcal Nuclease | NEB | M0247S |
| Dynabeads Protein G | Invitrogen | 100-04D |
| Dynabeads Protein A | Invitrogen | 100-02D |
| Protease Inhibitor Cocktail | Calbiochem | 539134 |
| Buffer G2 | Qiagen | 1014636 |
| Qiagen Protease | Qiagen | 19155 |
| EB buffer | Qiagen | 19570 |
| Sodium Butyrate | Millipore | 19-137 |
| Deposited Data | ||
| Infinium 450k data | This paper | GEO: GSE98938 |
| Bisulfite-seq, ChIP-seq, and RNA-seq data from Roadmap Epigenomics Program UCSF | This paper | ENA: SRP046944 |
| ChIP-seq and RNA-seq data | This paper | EGAD00001006066 |
| Codes, original/unprocessed, and processed data | This paper | https://github.com/Zhang-lab/Placenta_Epigenome |
| The browser containing all sequencing data tracks in an easily accessible format | This paper | https://urldefense.proofpoint.com/v2/url?u=https-3A__epigenomegateway.wustl.edu_browser_-3Fgenome-3Dhg19-26hub-3Dhttps-3A__remc.wustl.edu_dli_placenta-5Fhub_hub&d=DwIGaQ&c=iORugZls2LlYyCAZRB3XLg&r=5wrWvGv7RP_8tjyr12sx9_Bl0J4jdg2EScdfn8GA158&m=VWXeapLJmLvKGAMDKKXPlmo0t5yoFgMVBGpslGkfUf0&s=VElNqkL_fzdXrZSw4AjnGgGXzCx7XDo1EtOO12o2ark&e= |
| Software and Algorithms | ||
| Bismark (v. 0.16.1) | Krueger et al., 2011 | https://www.bioinformatics.babraham.ac.uk/projects/bismark/ |
| Bowtie (v. 1.1.0) | Langmead et al., 2009 | http://bowtie-bio.sourceforge.net/index.shtml |
| Bismark Methylation Extractor | Krueger et al., 2011 | https://www.bioinformatics.babraham.ac.uk/projects/bismark/ |
| STAR version 2.4.2a81 | Dobin et al., 2013 | https://github.com/alexdobin/STAR |
| featureCounts, version 1.4.6 | SuBread | http://subread.sourceforge.net/ |
| R/Bioconductor package edgeR | Robinson et al., 2010 | https://bioconductor.org/packages/release/bioc/html/edgeR.html |
| BWA (0.6.2-4126 or 0.7.6a-sb) | Durbin et al., 2010 | http://bio-bwa.sourceforge.net/ |
| Samtools | Li et al., 2009 | http://samtools.sourceforge.net/ |
| Sambamba (0.7.1) | Tarasov et al., 2015 | https://lomereiter.github.io/sambamba/ |
| MethylQA (0.1.5) | Li et al., 2015 | http://methylqa.sourceforge.net/ |
| MACS2 (2.0.10 or 2.1.1.20160309) | Zhang et al., 2008 | https://github.com/macs3-project/MACS |
| bedtools (v2.25.0) | Quinlan et al., 2010 | https://bedtools.readthedocs.io/en/latest/content/overview.html |
| deepTools (3.4.2) | Ramirez et al., 2014 | https://deeptools.readthedocs.io/en/develop/ |
| GREAT (3.0.0) | McLean et al., 2010 | http://great.stanford.edu/public/html/ |
| MSigDB (GSEA website; v7.0) | Liberzon et al., 2011 | https://www.gsea-msigdb.org/gsea/msigdb |
| DAVID (6.8) | Sherman et al., 2007 | https://david.ncifcrf.gov/ |
| HOMER | UCSD | http://homer.ucsd.edu/homer/motif/ |
| ImageJ | NIH | https://imagej.nih.gov/ij/ |
| Other | ||
Highlights:
The epigenome of human placental cytotrophoblasts rapidly evolves over gestation.
At genome scale, DNA methylation increases and modified histones are lost.
H3K9me3 occupancy of deeply hypomethylated DNA silences cytotrophoblast genes.
Global increases in H3K27ac occupancy typify placental disease e.g., severe preeclampsia.
Acknowledgements
This work was supported by the NIH Common Fund as part of the NIH Roadmap Epigenomics Program through U01ES017154 (to J.F.C.), R37HD076253 (to S.J.F.), R01HD092419 (to J.C. and S.J.F), 5R25DA027995 (to B.Z and T.W) and the Eunice Kennedy Shriver National Institute of Child Health & Human Development of the National Institutes of Health under Award P50HD055764 (Placenta Bank, to S.J.F.).
Footnotes
Publisher's Disclaimer: This is a PDF file of an unedited manuscript that has been accepted for publication. As a service to our customers we are providing this early version of the manuscript. The manuscript will undergo copyediting, typesetting, and review of the resulting proof before it is published in its final form. Please note that during the production process errors may be discovered which could affect the content, and all legal disclaimers that apply to the journal pertain.
Declaration of Interest
S.J.F. and M.M. are consultants for Novo Nordisk. The other authors declare no competing interests.
References
- ACOG Committee on Practice Bulletins--Obstetrics (2002). ACOG practice bulletin. Diagnosis and management of preeclampsia and eclampsia. Number 33, January 2002. Obstet. Gynecol 99, 159–167. [DOI] [PubMed] [Google Scholar]
- American College of Obstetricians and Gynecologists, Task Force on Hypertension in Pregnancy (2013). Hypertension in pregnancy. Report of the American College of Obstetricians and Gynecologists’ Task Force on Hypertension in Pregnancy. pp. 1122–1131. [DOI] [PubMed] [Google Scholar]
- Au Yeung WK, Brind’Amour J, Hatano Y, Yamagata K, Feil R, Lorincz MC, Tachibana M, Shinkai Y, and Sasaki H (2019). Histone H3K9 Methyltransferase G9a in Oocytes Is Essential for Preimplantation Development but Dispensable for CG Methylation Protection. Cell Rep 27, 282–293.e284. [DOI] [PubMed] [Google Scholar]
- Barker DJ, Winter PD, Osmond C, Margetts B, and Simmonds SJ (1989). Weight in infancy and death from ischaemic heart disease. Lancet 2, 577–580. [DOI] [PubMed] [Google Scholar]
- Bárcena A, Muench MO, Kapidzic M, and Fisher SJ (2009). A new role for the human placenta as a hematopoietic site throughout gestation. Reprod Sci 16, 178–187. [DOI] [PMC free article] [PubMed] [Google Scholar]
- Berman BP, Weisenberger DJ, Aman JF, Hinoue T, Ramjan Z, Liu Y, Noushmehr H, Lange CPE, van Dijk CM, Tollenaar RAEM, et al. (2011). Regions of focal DNA hypermethylation and long-range hypomethylation in colorectal cancer coincide with nuclear lamina-associated domains. Nat. Genet 44, 40–46. [DOI] [PMC free article] [PubMed] [Google Scholar]
- Brosens IA, Robertson WB, and Dixon HG (1972). The role of the spiral arteries in the pathogenesis of preeclampsia. Obstet. Gynecol. Annu 1, 177–191. [PubMed] [Google Scholar]
- Buckberry S, Bianco-Miotto T, Bent SJ, Dekker GA, and Roberts CT (2014). Integrative transcriptome meta-analysis reveals widespread sex-biased gene expression at the human fetal-maternal interface. Mol. Hum. Reprod 20, 810–819. [DOI] [PMC free article] [PubMed] [Google Scholar]
- Burton GJ, Fowden AL, and Thornburg KL (2016). Placental Origins of Chronic Disease. Physiol. Rev 96, 1509–1565. [DOI] [PMC free article] [PubMed] [Google Scholar]
- Capper D, Jones DTW, Sill M, Hovestadt V, Schrimpf D, Sturm D, Koelsche C, Sahm F, Chavez L, Reuss DE, et al. (2018). DNA methylation-based classification of central nervous system tumours. Nature 555, 469–474. [DOI] [PMC free article] [PubMed] [Google Scholar]
- Chapman V, Forrester L, Sanford J, Hastie N, and Rossant J (1984). Cell lineage-specific undermethylation of mouse repetitive DNA. Nature 307, 284–286. [DOI] [PubMed] [Google Scholar]
- Chatr-Aryamontri A, Breitkreutz B-J, Heinicke S, Boucher L, Winter A, Stark C, Nixon J, Ramage L, Kolas N, O’Donnell L, et al. (2013). The BioGRID interaction database: 2013 update. Nucleic Acids Res. 41, D816–D823. [DOI] [PMC free article] [PubMed] [Google Scholar]
- Corces MR, Granja JM, Shams S, Louie BH, Seoane JA, Zhou W, Silva TC, Groeneveld C, Wong CK, Cho SW, et al. (2018). The chromatin accessibility landscape of primary human cancers. Science 362. [DOI] [PMC free article] [PubMed] [Google Scholar]
- Cox LS, and Redman C (2017). The role of cellular senescence in ageing of the placenta. Placenta 52, 139–145. [DOI] [PubMed] [Google Scholar]
- Crossley M, and Orkin SH (1993). Regulation of the beta-globin locus. Curr. Opin. Genet. Dev 3, 232–237. [DOI] [PubMed] [Google Scholar]
- Dobin A, Davis CA, Schlesinger F, Drenkow J, Zaleski C, Jha S, Batut P, Chaisson M, and Gingeras TR (2013). STAR: ultrafast universal RNA-seq aligner. Bioinformatics 29, 15–21. [DOI] [PMC free article] [PubMed] [Google Scholar]
- Ehrlich M, Gama-Sosa MA, Huang LH, Midgett RM, Kuo KC, McCune RA, and Gehrke C (1982). Amount and distribution of 5-methylcytosine in human DNA from different types of tissues of cells. Nucleic Acids Res. 10, 2709–2721. [DOI] [PMC free article] [PubMed] [Google Scholar]
- Feinberg AP, and Vogelstein B (1983). Hypomethylation distinguishes genes of some human cancers from their normal counterparts. Nature 301, 89–92. [DOI] [PubMed] [Google Scholar]
- Feng J, Liu T, Qin B, Zhang Y, and Liu XS (2012). Identifying ChIP-seq enrichment using MACS. Nat. Protoc 7, 1728–1740. [DOI] [PMC free article] [PubMed] [Google Scholar]
- Fisher SJ (2015). Why is placentation abnormal in preeclampsia? Am. J. Obstet. Gynecol 213, S115–S122. [DOI] [PMC free article] [PubMed] [Google Scholar]
- Fuke C, Shimabukuro M, Petronis A, Sugimoto J, Oda T, Miura K, Miyazaki T, Ogura C, Okazaki Y, and Jinno Y (2004). Age related changes in 5-methylcytosine content in human peripheral leukocytes and placentas: an HPLC-based study. Ann. Hum. Genet 68, 196–204. [DOI] [PubMed] [Google Scholar]
- Gama-Sosa MA, Slagel VA, Trewyn RW, Oxenhandler R, Kuo KC, Gehrke CW, and Ehrlich M (1983). The 5-methylcytosine content of DNA from human tumors. Nucleic Acids Res. 11, 6883–6894. [DOI] [PMC free article] [PubMed] [Google Scholar]
- Genbacev O, Krtolica A, Kaelin W, and Fisher SJ (2001). Human cytotrophoblast expression of the von Hippel-Lindau protein is downregulated during uterine invasion in situ and upregulated by hypoxia in vitro. Dev. Biol 233, 526–536. [DOI] [PubMed] [Google Scholar]
- Genbacev O, Donne M, Kapidzic M, Gormley M, Lamb J, Gilmore J, Larocque N, Goldfien G, Zdravkovic T, McMaster MT, et al. (2011). Establishment of human trophoblast progenitor cell lines from the chorion. Stem Cells 29, 1427–1436. [DOI] [PMC free article] [PubMed] [Google Scholar]
- Gormley M, Ona K, Kapidzic M, Garrido-Gomez T, Zdravkovic T, and Fisher SJ (2017). Preeclampsia: novel insights from global RNA profiling of trophoblast subpopulations. Am. J. Obstet. Gynecol 217, 200.e1–200.e17. [DOI] [PubMed] [Google Scholar]
- Gossage L, Eisen T, and Maher ER (2015). VHL, the story of a tumour suppressor gene. Nat. Rev. Cancer 15, 55–64. [DOI] [PubMed] [Google Scholar]
- Guo H, Zhu P, Yan L, Li R, Hu B, Lian Y, Yan J, Ren X, Lin S, Li J, et al. (2014). The DNA methylation landscape of human early embryos. Nature 511, 606–610. [DOI] [PubMed] [Google Scholar]
- Hawkins RD, Hon GC, Lee LK, Ngo Q, Lister R, Pelizzola M, Edsall LE, Kuan S, Luu Y, Klugman S, et al. (2010). Distinct epigenomic landscapes of pluripotent and lineage-committed human cells. Cell Stem Cell 6, 479–491. [DOI] [PMC free article] [PubMed] [Google Scholar]
- Heinz S, Benner C, Spann N, Bertolino E, Lin YC, Laslo P, Cheng JX, Murre C, Singh H, and Glass CK (2010). Simple combinations of lineage-determining transcription factors prime cis-regulatory elements required for macrophage and B cell identities. Mol. Cell 38, 576–589. [DOI] [PMC free article] [PubMed] [Google Scholar]
- Herron MA, Katz M, and Creasy RK (1982). Evaluation of a preterm birth prevention program: preliminary report. Obstet. Gynecol 59, 452–456. [PubMed] [Google Scholar]
- Huang DW, Sherman BT, and Lempicki RA (2009). Systematic and integrative analysis of large gene lists using DAVID bioinformatics resources. Nat. Protoc 4, 44–57. [DOI] [PubMed] [Google Scholar]
- Hunkapiller NM, and Fisher SJ (2008). Chapter 12. Placental remodeling of the uterine vasculature. Meth. Enzymol 445, 281–302. [DOI] [PMC free article] [PubMed] [Google Scholar]
- Kim CJ, Romero R, Chaemsaithong P, and Kim J-S (2015). Chronic inflammation of the placenta: definition, classification, pathogenesis, and clinical significance. Am. J. Obstet. Gynecol 213, S53–S69. [DOI] [PMC free article] [PubMed] [Google Scholar]
- Kim J, Zhao K, Jiang P, Lu Z-X, Wang J, Murray JC, and Xing Y (2012). Transcriptome landscape of the human placenta. BMC Genomics 13, 115–121. [DOI] [PMC free article] [PubMed] [Google Scholar]
- Kimura H, Hayashi-Takanaka Y, Goto Y, Takizawa N, and Nozaki N (2008). The organization of histone H3 modifications as revealed by a panel of specific monoclonal antibodies. Cell Struct. Funct 33, 61–73. [DOI] [PubMed] [Google Scholar]
- King AD, Huang K, Rubbi L, Liu S, Wang C-Y, Wang Y, Pellegrini M, and Fan G (2016). Reversible Regulation of Promoter and Enhancer Histone Landscape by DNA Methylation in Mouse Embryonic Stem Cells. Cell Rep 17, 289–302. [DOI] [PMC free article] [PubMed] [Google Scholar]
- Ko M, An J, Bandukwala HS, Chavez L, Aijö T, Pastor WA, Segal MF, Li H, Koh KP, Lähdesmäki H, et al. (2013). Modulation of TET2 expression and 5-methylcytosine oxidation by the CXXC domain protein IDAX. Nature 497, 122–126. [DOI] [PMC free article] [PubMed] [Google Scholar]
- Krueger F, and Andrews SR (2011). Bismark: a flexible aligner and methylation caller for Bisulfite-Seq applications. Bioinformatics 27, 1571–1572. [DOI] [PMC free article] [PubMed] [Google Scholar]
- Langmead B, Trapnell C, Pop M, and Salzberg SL (2009). Ultrafast and memory-efficient alignment of short DNA sequences to the human genome. 10, R25–10. [DOI] [PMC free article] [PubMed] [Google Scholar]
- Leavey K, Bainbridge SA, and Cox BJ (2015). Large scale aggregate microarray analysis reveals three distinct molecular subclasses of human preeclampsia. PLoS ONE 10, e0116508. [DOI] [PMC free article] [PubMed] [Google Scholar]
- Lehnertz B, Ueda Y, Derijck AAHA, Braunschweig U, Perez-Burgos L, Kubicek S, Chen T, Li E, Jenuwein T, and Peters AHFM (2003). Suv39h-mediated histone H3 lysine 9 methylation directs DNA methylation to major satellite repeats at pericentric heterochromatin. Curr. Biol 13, 1192–1200. [DOI] [PubMed] [Google Scholar]
- Li H, and Durbin R (2010). Fast and accurate long-read alignment with Burrows-Wheeler transform. Bioinformatics 26, 589–595. [DOI] [PMC free article] [PubMed] [Google Scholar]
- Lovén J, Hoke HA, Lin CY, Lau A, Orlando DA, Vakoc CR, Bradner JE, Lee TI, and Young RA (2013). Selective inhibition of tumor oncogenes by disruption of super-enhancers. Cell 153, 320–334. [DOI] [PMC free article] [PubMed] [Google Scholar]
- Maltepe E, and Fisher SJ (2015). Placenta: the forgotten organ. Annu. Rev. Cell Dev. Biol 31, 523–552. [DOI] [PubMed] [Google Scholar]
- Manes C, and Menzel P (1981). Demethylation of CpG sites in DNA of early rabbit trophoblast. Nature 293, 589–590. [DOI] [PubMed] [Google Scholar]
- Mayne BT, Leemaqz SY, Smith AK, Breen J, Roberts CT, and Bianco-Miotto T (2017). Accelerated placental aging in early onset preeclampsia pregnancies identified by DNA methylation. Epigenomics 9, 279–289. [DOI] [PMC free article] [PubMed] [Google Scholar]
- Mazor T, Pankov A, Johnson BE, Hong C, Hamilton EG, Bell RJA, Smirnov IV, Reis GF, Phillips JJ, Barnes MJ, et al. (2015). DNA Methylation and Somatic Mutations Converge on the Cell Cycle and Define Similar Evolutionary Histories in Brain Tumors. Cancer Cell 28, 307–317. [DOI] [PMC free article] [PubMed] [Google Scholar]
- McLean CY, Bristor D, Hiller M, Clarke SL, Schaar BT, Lowe CB, Wenger AM, and Bejerano G (2010). GREAT improves functional interpretation of cis-regulatory regions. Nat. Biotechnol 28, 495–501. [DOI] [PMC free article] [PubMed] [Google Scholar]
- Mews P, Donahue G, Drake AM, Luczak V, Abel T, and Berger SL (2017). Acetyl-CoA synthetase regulates histone acetylation and hippocampal memory. Nature 546, 381–386. [DOI] [PMC free article] [PubMed] [Google Scholar]
- Nancy P, Tagliani E, Tay C-S, Asp P, Levy DE, and Erlebacher A (2012). Chemokine gene silencing in decidual stromal cells limits T cell access to the maternal-fetal interface. Science 336, 1317–1321. [DOI] [PMC free article] [PubMed] [Google Scholar]
- Nordor AV, Nehar-Belaid D, Richon S, Klatzmann D, Bellet D, Dangles-Marie V, Fournier T, and Aryee MJ (2017). The early pregnancy placenta foreshadows DNA methylation alterations of solid tumors. Epigenetics 12, 793–803. [DOI] [PMC free article] [PubMed] [Google Scholar]
- Novakovic B, Yuen RK, Gordon L, Penaherrera MS, Sharkey A, Moffett A, Craig JM, Robinson WP, and Saffery R (2011). Evidence for widespread changes in promoter methylation profile in human placenta in response to increasing gestational age and environmental/stochastic factors. BMC Genomics 12, 529. [DOI] [PMC free article] [PubMed] [Google Scholar]
- Paauw ND, Lely AT, Joles JA, Franx A, Nikkels PG, Mokry M, and van Rijn BB (2018). H3K27 acetylation and gene expression analysis reveals differences in placental chromatin activity in fetal growth restriction. Clin Epigenetics 10, 85. [DOI] [PMC free article] [PubMed] [Google Scholar]
- Piechowski J (2016). Trophoblastic-like transdifferentiation: A key to oncogenesis. Crit. Rev. Oncol. Hematol 101, 1–11. [DOI] [PubMed] [Google Scholar]
- Quinlan AR, and Hall IM (2010). BEDTools: a flexible suite of utilities for comparing genomic features. Bioinformatics 26, 841–842. [DOI] [PMC free article] [PubMed] [Google Scholar]
- Ramírez F, Ryan DP, Grüning B, Bhardwaj V, Kilpert F, Richter AS, Heyne S, Dündar F, and Manke T (2016). deepTools2: a next generation web server for deep-sequencing data analysis. Nucleic Acids Res. 44, W160–W165. [DOI] [PMC free article] [PubMed] [Google Scholar]
- Rankin EB, and Giaccia AJ (2016). Hypoxic control of metastasis. Science 352, 175–180. [DOI] [PMC free article] [PubMed] [Google Scholar]
- Redline RW (2015). Classification of placental lesions. Am. J. Obstet. Gynecol 213, S21–S28. [DOI] [PubMed] [Google Scholar]
- Redline RW, Boyd T, Campbell V, Hyde S, Kaplan C, Khong TY, Prashner HR, Waters BL, Society for Pediatric Pathology, Perinatal Section, Maternal Vascular Perfusion Nosology Committee (2004). Maternal vascular underperfusion: nosology and reproducibility of placental reaction patterns. Pediatr. Dev. Pathol 7, 237–249. [DOI] [PubMed] [Google Scholar]
- Roberts RM, and Fisher SJ (2011). Trophoblast stem cells. Biol. Reprod 84, 412–421. [DOI] [PMC free article] [PubMed] [Google Scholar]
- Robinson JT, Thorvaldsdóttir H, Winckler W, Guttman M, Lander ES, Getz G, and Mesirov JP (2011). Integrative genomics viewer. Nat. Biotechnol 29, 24–26. [DOI] [PMC free article] [PubMed] [Google Scholar]
- Robinson MD, McCarthy DJ, and Smyth GK (2010). edgeR: a Bioconductor package for differential expression analysis of digital gene expression data. Bioinformatics 26, 139–140. [DOI] [PMC free article] [PubMed] [Google Scholar]
- Ross-Innes CS, Stark R, Teschendorff AE, Holmes KA, Ali HR, Dunning MJ, Brown GD, Gojis O, Ellis IO, Green AR, et al. (2012). Differential oestrogen receptor binding is associated with clinical outcome in breast cancer. Nature 481, 389–393. [DOI] [PMC free article] [PubMed] [Google Scholar]
- Santos J, Pereira CF, Di-Gregorio A, Spruce T, Alder O, Rodriguez T, Azuara V, Merkenschlager M, and Fisher AG (2010). Differences in the epigenetic and reprogramming properties of pluripotent and extraembryonic stem cells implicate chromatin remodelling as an important early event in the developing mouse embryo. Epigenetics Chromatin 3, 1. [DOI] [PMC free article] [PubMed] [Google Scholar]
- Scaffidi P, and Misteli T (2006). Lamin A-dependent nuclear defects in human aging. Science 312, 1059–1063. [DOI] [PMC free article] [PubMed] [Google Scholar]
- Schneider CA, Rasband WS, and Eliceiri KW (2012). NIH Image to ImageJ: 25 years of image analysis. Nat. Methods 9, 671–675. [DOI] [PMC free article] [PubMed] [Google Scholar]
- Schroeder DI, Blair JD, Lott P, Yu HOK, Hong D, Crary F, Ashwood P, Walker C, Korf I, Robinson WP, et al. (2013). The human placenta methylome. Proc. Natl. Acad. Sci. U.S.a 110, 6037–6042. [DOI] [PMC free article] [PubMed] [Google Scholar]
- Shannon P, Markiel A, Ozier O, Baliga NS, Wang JT, Ramage D, Amin N, Schwikowski B, and Ideker T (2003). Cytoscape: a software environment for integrated models of biomolecular interaction networks. Genome Res. 13, 2498–2504. [DOI] [PMC free article] [PubMed] [Google Scholar]
- Smith ZD, Chan MM, Humm KC, Karnik R, Mekhoubad S, Regev A, Eggan K, and Meissner A (2014). DNA methylation dynamics of the human preimplantation embryo. Nature 511, 611–615. [DOI] [PMC free article] [PubMed] [Google Scholar]
- Smith ZD, Shi J, Gu H, Donaghey J, Clement K, Cacchiarelli D, Gnirke A, Michor F, and Meissner A (2017). Epigenetic restriction of extraembryonic lineages mirrors the somatic transition to cancer. Nature 549, 543–547. [DOI] [PMC free article] [PubMed] [Google Scholar]
- Sõber S, Reiman M, Kikas T, Rull K, Inno R, Vaas P, Teesalu P, Marti JML, Mattila P, and Laan M (2015). Extensive shift in placental transcriptome profile in preeclampsia and placental origin of adverse pregnancy outcomes. Sci Rep 5, 13336. [DOI] [PMC free article] [PubMed] [Google Scholar]
- Subramanian A, Tamayo P, Mootha VK, Mukherjee S, Ebert BL, Gillette MA, Paulovich A, Pomeroy SL, Golub TR, Lander ES, et al. (2005). Gene set enrichment analysis: a knowledge-based approach for interpreting genome-wide expression profiles. Proc. Natl. Acad. Sci. U.S.a 102, 15545–15550. [DOI] [PMC free article] [PubMed] [Google Scholar]
- Sultana Z, Maiti K, Dedman L, and Smith R (2018). Is there a role for placental senescence in the genesis of obstetric complications and fetal growth restriction? Am. J. Obstet. Gynecol 218, S762–S773. [DOI] [PubMed] [Google Scholar]
- Sween LK, Althouse AD, and Roberts JM (2015). Early-pregnancy percent body fat in relation to preeclampsia risk in obese women. Am. J. Obstet. Gynecol 212, 84.e1–.e7. [DOI] [PubMed] [Google Scholar]
- Takahashi JS (2017). Transcriptional architecture of the mammalian circadian clock. Nat. Rev. Genet 18, 164–179. [DOI] [PMC free article] [PubMed] [Google Scholar]
- Venkatesha S, Toporsian M, Lam C, Hanai J-I, Mammoto T, Kim YM, Bdolah Y, Lim K-H, Yuan H-T, Libermann TA, et al. (2006). Soluble endoglin contributes to the pathogenesis of preeclampsia. Nat. Med 12, 642–649. [DOI] [PubMed] [Google Scholar]
- Whyte WA, Orlando DA, Hnisz D, Abraham BJ, Lin CY, Kagey MH, Rahl PB, Lee TI, and Young RA (2013). Master transcription factors and mediator establish super-enhancers at key cell identity genes. Cell 153, 307–319. [DOI] [PMC free article] [PubMed] [Google Scholar]
- Winn VD, Haimov-Kochman R, Paquet AC, Yang YJ, Madhusudhan MS, Gormley M, Feng K-TV, Bernlohr DA, McDonagh S, Pereira L, et al. (2007). Gene expression profiling of the human maternal-fetal interface reveals dramatic changes between midgestation and term. Endocrinology 148, 1059–1079. [DOI] [PubMed] [Google Scholar]
- Xiong X, Tu S, Wang J, Luo S, and Yan X (2019). CXXC5: A novel regulator and coordinator of TGF-β, BMP and Wnt signaling. J. Cell. Mol. Med 23, 740–749. [DOI] [PMC free article] [PubMed] [Google Scholar]
- Zhang Y, Liu T, Meyer CA, Eeckhoute J, Johnson DS, Bernstein BE, Nusbaum C, Myers RM, Brown M, Li W, et al. (2008). Model-based analysis of ChIP-Seq (MACS). 9, R137. [DOI] [PMC free article] [PubMed] [Google Scholar]
- Zhou X, Maricque B, Xie M, Li D, Sundaram V, Martin EA, Koebbe BC, Nielsen C, Hirst M, Farnham P, et al. (2011). The Human Epigenome Browser at Washington University. Nat. Methods 8, 989–990. [DOI] [PMC free article] [PubMed] [Google Scholar]
- Zhou Y, Damsky CH, and Fisher SJ (1997). Preeclampsia is associated with failure of human cytotrophoblasts to mimic a vascular adhesion phenotype. One cause of defective endovascular invasion in this syndrome? J. Clin. Invest 99, 2152–2164. [DOI] [PMC free article] [PubMed] [Google Scholar]
- Zhou Y, Bianco K, Huang L, Nien JK, McMaster M, Romero R, and Fisher SJ (2007). Comparative analysis of maternal-fetal interface in preeclampsia and preterm labor. Cell Tissue Res. 329, 559–569. [DOI] [PubMed] [Google Scholar]
- Zhou Y, Gormley MJ, Hunkapiller NM, Kapidzic M, Stolyarov Y, Feng V, Nishida M, Drake PM, Bianco K, Wang F, et al. (2013). Reversal of gene dysregulation in cultured cytotrophoblasts reveals possible causes of preeclampsia. J. Clin. Invest 123, 2862–2872. [DOI] [PMC free article] [PubMed] [Google Scholar]
- Zhou Y, McMaster M, Woo K, Janatpour M, Perry J, Karpanen T, Alitalo K, Damsky C, and Fisher SJ (2002). Vascular endothelial growth factor ligands and receptors that regulate human cytotrophoblast survival are dysregulated in severe preeclampsia and hemolysis, elevated liver enzymes, and low platelets syndrome. Am. J. Clin. Pathol 160, 1405–1423. [DOI] [PMC free article] [PubMed] [Google Scholar]
Associated Data
This section collects any data citations, data availability statements, or supplementary materials included in this article.
Supplementary Materials
Table S4 2nd Trimester CTB and villi super-enhancers. Related to Figure S5.
Table S5 Differentially H3K27 acetylated loci between 2nd and 3rd trimester CTBs. Related to Figure 4.
Table S6 2nd trimester-like H3K27ac peaks in sPE. Related to Figure 6.
Table S7 Differentially H3K27 acetylated loci between sPE and 2nd/3rd trimester CTBs. Related to Figure 6.
Table S8 Summary of samples and sequencing libraries. Related to Figures 1, 2, 4, 6, S2, S3, S5, and S6.
Data Availability Statement
The Illumina 450K DNA methylation data are available under Gene Expression Omnibus (GEO) accession GSE98938. WGBS, ChIP-seq, RNA-seq, and miRNA-seq data are available under SRA280018 and EGAD00001006066. The codes used in the manuscript are available at https://github.com/Zhang-lab/Placenta_Epigenome.