Abstract
Transcription factors bind DNA sequence motif vocabularies in cis-regulatory elements (CREs) to modulate chromatin state and gene expression during cell state transitions. A quantitative understanding of how motif lexicons influence dynamic regulatory activity has been elusive due to the combinatorial nature of the cis-regulatory code. To address this, we undertook multiomic data profiling of chromatin and expression dynamics across epidermal differentiation to identify 40,103 dynamic CREs associated with 3,609 dynamically expressed genes, then applied an interpretable deep-learning framework to model the cis-regulatory logic of chromatin accessibility. This analysis framework identified cooperative DNA sequence rules in dynamic CREs regulating synchronous gene modules with diverse roles in skin differentiation. Massively parallel reporter assay analysis validated temporal dynamics and cooperative cis-regulatory logic. Variants linked to human polygenic skin disease were enriched in these time-dependent combinatorial motif rules. This integrative approach shows the combinatorial cis-regulatory lexicon of epidermal differentiation and represents a general framework for deciphering the organizational principles of the cis-regulatory code of dynamic gene regulation.
The outermost layer of the skin, the epidermis, is formed and maintained by a dynamic homeostatic process involving the conversion of metabolically active basal cells that adhere to the epithelial basement membrane into cells that undergo cell cycle arrest and migrate outwards, engaging a program of terminal differentiation to form cornified keratinocytes1 (Extended Data Fig. 1a). A host of human diseases are caused by disruption of epidermal differentiation2. Calcium-induced differentiation of primary human keratinocytes in vitro mimics key properties of in vivo epidermal differentiation, making it a simple, tractable and accurate in vitro system to study this medically relevant cellular differentiation process3.
Such differentiation processes involve dynamic cell state transitions accompanied by genome-wide changes in gene expression, chromatin state and three-dimensional genome organization4,5. Transcription factors (TFs) orchestrate these chromatin and expression dynamics by cooperatively binding cognate DNA sequence motifs residing in CREs, such as promoters and enhancers, and forming complexes with capacity to activate nearby genes6-8. The quantitative changes in chromatin state and expression are hence highly dependent on the cis-regulatory code of motif patterns encoded in CREs9-12. Previous studies have shown that the process of terminal differentiation alters the expression of thousands of genes, CREs, proteins and metabolites13. However, increased temporal resolution is required to map dynamic regulation of subtle cell state transitions. While some regulators of epidermal differentiation have been identified previously3,8,14-18, the combinatorial, dynamic cis-regulatory code of epidermal differentiation has remained elusive.
Recently, deep-learning models such as convolutional neural networks (CNNs) have emerged as state-of-the-art predictive models of regulatory DNA. CNNs learn nonlinear predictive functions that can map DNA sequence accurately to genome-wide profiles of regulatory activity by learning de novo predictive motif patterns and their higher-order combinatorial logic19-22. We and others have recently developed powerful interpretation methods to extract rules of cis-regulatory logic from these black-box models23-26. These interpretable deep-learning models have the potential to offer new insights into the cis-regulatory code of epidermal differentiation.
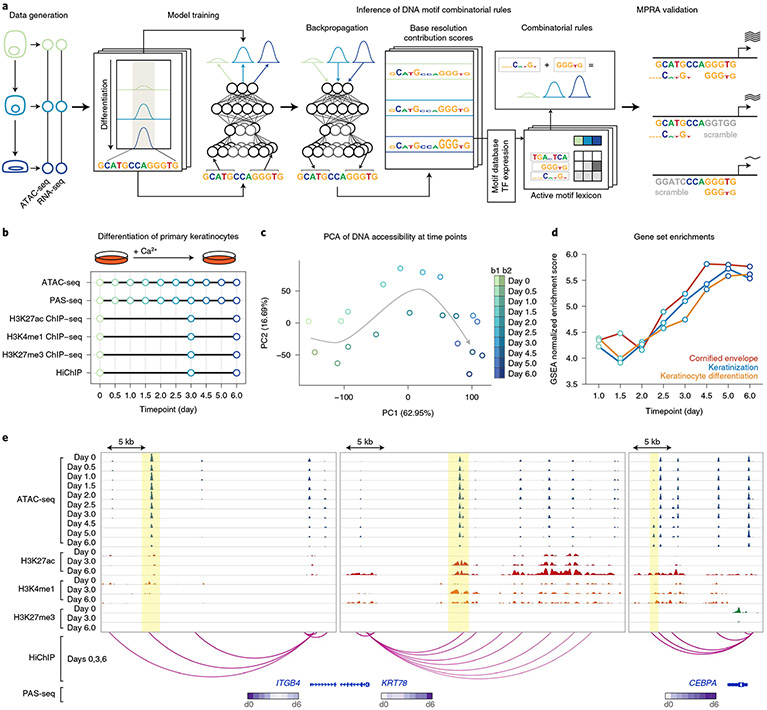
Here, we use a battery of assays to comprehensively profile the multimodal landscape of chromatin and expression dynamics across a densely sampled timecourse of epidermal differentiation. We train robust CNN models that can accurately predict quantitative changes in chromatin accessibility from DNA sequence across the entire timecourse (Fig. 1a). We interpret the models to annotate tens of thousands of dynamic CREs with homotypic and heterotypic combinations of active motif instances. We introduce an in silico combinatorial perturbation framework to decipher quantitative rules of higher-order cis-regulatory logic encoded in CREs. We identify multiplicative and supermultiplicative effects of co-occurring motif combinations on chromatin accessibility, predict putative TFs that cooperatively bind these combinatorial motif patterns, and link dynamic CREs to their putative target genes. Finally, we validate temporal dynamics and cis-regulatory logic of combinatorial motif rules on intrinsic regulatory activity across differentiation using massively parallel reporter assays (MPRAs). Genetic variants associated with diverse skin-related complex traits are found to be enriched in time-dependent combinatorial motif rules, supporting a potential disease-relevant role in mediating phenotypic effects. This integrative framework can be applied broadly to discover dynamic cis-regulatory logic across diverse cell states, cell types and conditions.
Fig. 1 ∣. A high-resolution integrated multiomic data resource in primary keratinocyte differentiation.
a, Schematic of the integrative framework for discovery of a dynamic, combinatorial cis-regulatory lexicon. CNNs are trained to predict quantitative ATAC-seq signal from DNA sequence across a timecourse, augmented with prediction tasks for active chromatin marks. After model training, base-resolution contribution scores are inferred for all sequences using backpropagation-based interpretation methods, followed by motif scanning to identify predictive motif instances. In silico combinatorial perturbation analyses are used to identify interaction effects between co-enriched combinatorial motif rules. Gene expression (PAS-seq) across the timecourse enables identification of TFs that may bind motif rules and downstream target gene modules. MPRAs validate predicted effects of combinatorial cis-regulatory logic. b, Schematic of multiomic data collected across the epidermal differentiation timecourse. c, PCA of ATAC-seq data highlight time as the primary axis of variation. PC, principal component. d, Gene set enrichments validate veridical activation of keratinocyte differentiation in the gene expression data. GSEA, gene set enrichment analysis. e, Representative loci around the ITGB4 (chr17:73690537–73721129), KRT78 (chr12:53237434–53276997) and CEBPA (chr19:33777249–33796123) genes exhibit different trajectories of chromatin and expression dynamics. Dynamic ranges across loci are as follows: ATAC-seq, 0–800; H3K27ac ChIP–seq, 0–200; H3K4me1 ChIP–seq, 0–100; H3K27me3 ChIP–seq, 0–150 (units, −log10 P value).
Results
Multimodal regulatory dynamics in epidermal differentiation.
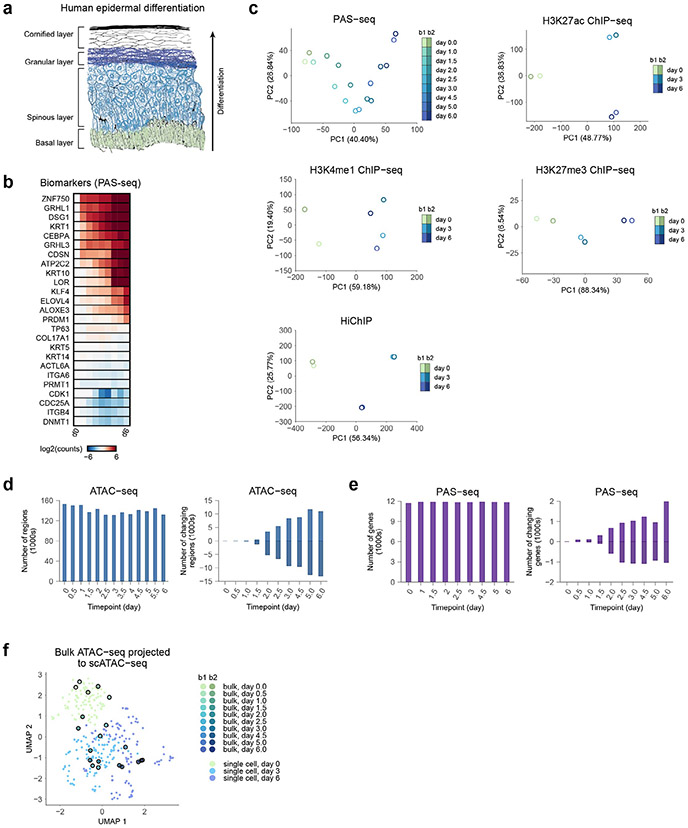
To characterize the multimodal regulatory landscapes of keratinocyte differentiation, transcriptional and chromatin state was profiled across several timepoints of calcium-induced in vitro differentiation (Fig. 1b) with high-quality, replicated poly(A) site sequencing (PAS-seq), assay for transposase-accessible chromatin with sequencing (ATAC-seq), H3K27ac chromatin immunoprecipitation sequencing (ChIP–seq), H3K4me1 ChIP–seq, H3K27me3 ChIP–seq and H3K27ac HiChIP experiments (Extended Data Fig. 1a-e and Supplementary Tables 1-6). Principal-component analysis (PCA) showed high consistency between biological replicates (Fig. 1c). Gene set enrichments validated veridical activation of keratinocyte differentiation in these data27 (Fig. 1d). Homogeneity and timepoint specificity of the cell cultures were verified by comparing the ATAC-seq replicates with single-cell ATAC-seq data from the same differentiation system28 (Extended Data Fig. 1f). Important epidermal gene loci showed complex dynamic regulatory landscapes (Fig. 1e).
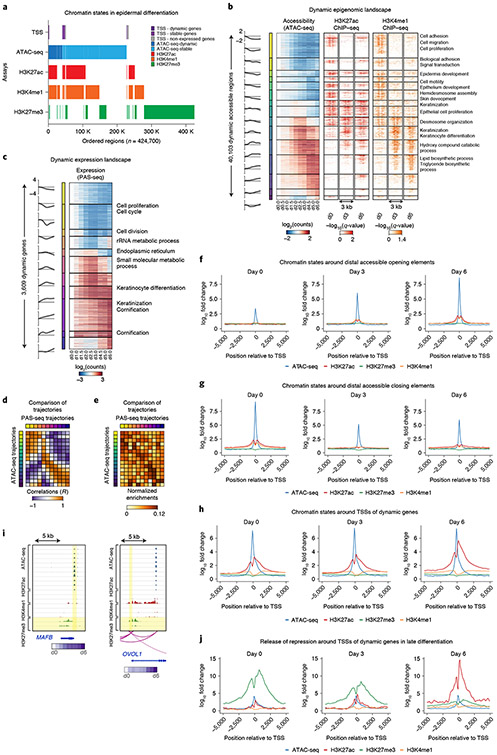
Using the epigenomic datasets, we identified 424,700 genomic regions enriched for chromatin accessibility or histone modifications across all timepoints (Fig. 2a). We used the ATAC-seq profiles to identify 225,996 high-confidence, reproducible CREs across all timepoints, of which 40,103 CREs exhibited significant variation of chromatin accessibility across the timecourse. Clustering these CREs on the basis of their ATAC-seq profiles resulted in 15 distinct trajectories across differentiation29,30 (Fig. 2b). Chromatin accessibility dynamics were correlated strongly with the dynamics of activating histone marks H3K27ac and H3K4me1. We associated the dynamic CREs to their putative target genes on the basis of proximity and H3K27ac HiChIP looping data. Functional enrichment analysis of the gene sets associated with each dynamic CRE cluster highlighted relevant and expected biological functions that were consistent with expression dynamics (Fig. 2b and Extended Data Fig. 2a,b). For example, CREs linked to hemidesmosome genes, whose expression characterizes progenitors31, decreased in accessibility during differentiation. In contrast, CREs linked to differentiation genes32 were enriched in trajectories activated during differentiation. Analysis of gene expression quantification from the PAS-seq experiments identified 3,069 dynamic transcripts that clustered into 11 dynamic trajectories (Fig. 2c). The dynamic CRE clusters and their associated target genes also exhibited synchronous concordance of gene expression and chromatin accessibility dynamics (Fig. 2d,e), consistent with a picture of coordinated waves of target gene activation driven by dynamically accessible CREs. These data map the dynamic regulatory landscape of keratinocyte differentiation and indicate a coordinated interplay of tens of thousands of CREs with thousands of genes.
Fig. 2 ∣. Epigenomic and transcriptomic landscapes in epidermal differentiation.
a, Segmentation of the epigenome into chromatin states by accessibility (ATAC-seq), assayed marks (H3K27ac, H3K4me1 and H3K27me3 ChIP–seq) and transcription start sites (TSSs) or distal regions. Accessibility is divided into dynamically accessible (dark blue) and stably accessible (light blue) regions. TSSs are divided into TSSs of dynamic (dark purple), stable (light purple) and nonexpressed (gray) genes. b, ATAC-seq and ChIP–seq (H3K27ac and H3K4me1) heatmaps of 40,103 dynamic cis-regulatory elements, ordered by 15 trajectories of dynamic accessibility; gene set enrichments of proximal genes of CREs in each trajectory (right). ATAC-seq signals are relative to day 0. c, Eleven trajectories of 3,609 dynamically expressed genes; gene set enrichments for each trajectory (right). RNA signals are relative to day 0. d, Accessibility trajectories mapped to gene expression trajectories on the basis of activity correlation across the timecourse. Correlation of mean activity of accessibility trajectories (rows) to mean activity of gene expression trajectories (columns). e, Normalized enrichment of CREs from each accessibility trajectory (rows) relative to CREs associated with each gene expression trajectory (columns) on the basis of proximity. f, Chromatin state (average ATAC-seq, H3K27ac, H3K27me3 and H3K4me1 profiles) in 10-kb windows around ATAC-seq peak summits of distal CREs exhibiting dynamically increasing chromatin accessibility. g, Chromatin state (average ATAC-seq, H3K27ac, H3K27me3 and H3K4me1 profiles) in 10-kb windows around ATAC-seq peak summits of distal CREs exhibiting dynamically decreasing chromatin accessibility. h, Chromatin state (average ATAC-seq, H3K27ac, H3K27me3 and H3K4me1 profiles) in 10-kb windows around TSSs of genes with dynamically increasing expression. i, MAFB (chr20:39306135–39321639) and OVOL1 (chr11:65551663–65562811) as examples of genes with release of repression at the TSS in terminal differentiation. Dynamic ranges of assays are as follows: ATAC-seq, 0–800; H3K27ac, 0–200; H3K4me1, 0–100; H3K27me3, 0–150 (units, −log10 P value). j, Chromatin states (average ATAC-seq, H3K27ac, H3K27me3 and H3K4me1 profiles) in 10-kb windows around TSSs showing release of repression in terminal differentiation.
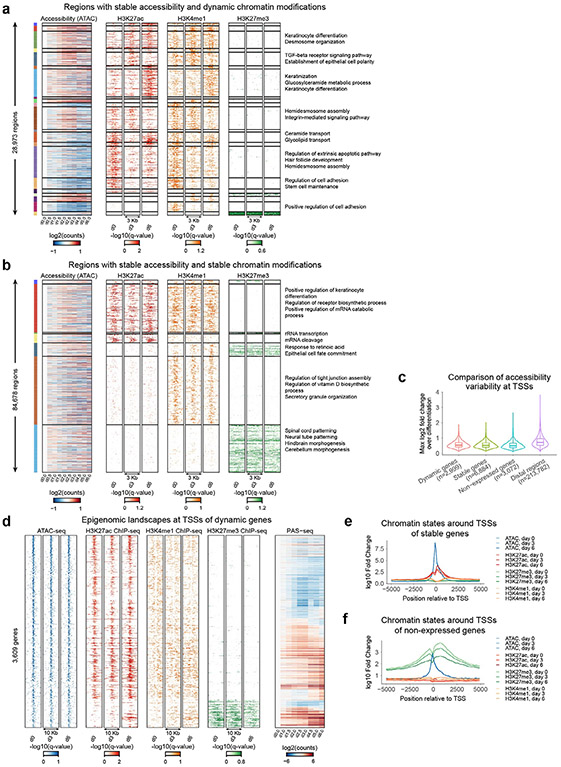
CREs overlapping gene promoters and distal CREs showed differing composition and dynamics of chromatin states across the timecourse (Fig. 2f-h). Distal CREs associated with increasing and decreasing chromatin accessibility also exhibited concordant dynamics of flanking active histone modification profiles but no discernable changes in the repressive H3K27me3 mark (Fig. 2f,g). In contrast, promoters of dynamically expressed genes were associated with temporally invariant chromatin accessibility despite being marked by dynamic active histone modifications (Extended Data Fig. 2c,d). Promoters of active genes with invariant temporal expression were associated with invariant accessibility and active histone marks (Extended Data Fig. 2e). Promoters of inactive genes were enriched for the repressive H3K27me3 histone mark (Extended Data Fig. 2f). We also noted a small set of dynamically expressed genes (n = 414) enriched for H3K27me3 at their promoters (Fig. 2i,j). These promoters lost H3K27me3 across the timecourse while simultaneously gaining H3K27ac. Prominent regulators of epidermal differentiation, such as MAFB and OVOL1, were among genes associated with H3K27me3 release of repression at their promoters (Fig. 2i). These observations are supported by previous studies that have found release of repression to be an important regulatory mechanism in terminal differentiation33-35.
Deep learning shows a dynamic DNA motif lexicon.
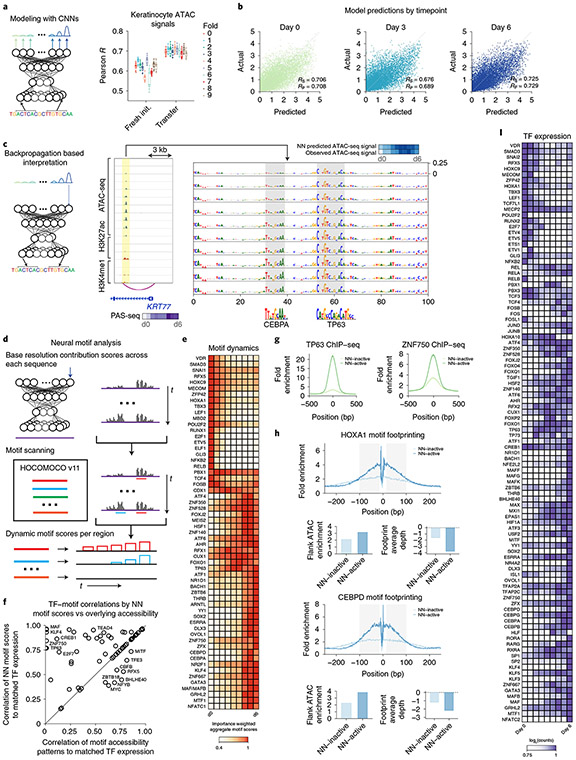
To learn predictive sequence models of chromatin dynamics, we trained multitask CNNs to map 1-kb DNA sequences tiled across the genome to associated quantitative measures of ATAC-seq signal at ten timepoints across the differentiation timecourse (Fig. 3a). We used a tenfold chromosome hold-out cross-validation scheme to train and evaluate the predictive performance of the model (Supplementary Table 7). We used a multistage transfer learning protocol. We first trained a reference model on a large compendium of DNase-seq data from 431 diverse cell types and tissues, then fine-tuned it on the ATAC-seq data from our timecourse, accounting for the cross-validation structure of the ten folds (Extended Data Fig. 3a and Supplementary Tables 8 and 9). The model’s predictions on all held-out test set chromosomes were correlated strongly with the observed ATAC-seq signal in each timepoint (Fig. 3a,b and Extended Data Fig. 3b,c). The model’s predictions for dynamic CREs were also correlated strongly with their measured ATAC-seq signal across the timecourse (Extended Data Fig. 3d). The transfer learning approach substantially improved the performance and stability of the model’s predictions across models and folds (Fig. 3a and Extended Data Fig. 3b,c). The predictions of the models from the ten folds for each CRE in each timepoint were subsequently calibrated and assembled for downstream inference and prediction.
Fig. 3 ∣. Deep-learning models of chromatin accessibility show dynamic predictive motif instances across the differentiation timecourse.
a, Left, schematic of a multitask CNN that maps 1-kb DNA sequences across the genome to quantitative chromatin accessibility signal across timepoints. Right, Pearson correlation (R) between predicted and observed accessibility across CREs of each timepoint for ten folds of held-out test set chromosomes for randomly initialized (Fresh init.) and pretrained (transfer) models. Box-and-whisker plots show all points, minimum to maximum, with 25th to 75th interquartile range. b, Scatter plots of predicted versus observed accessibility signal (units of log depth-normalized coverage) across CREs in test set chromosomes for three timepoints: (left to right) ATAC-seq at days 0, 3 and 6. c, Left, schematic of inference of base-resolution contribution scores for a sequence with respect to predicted output at specific timepoints using efficient backpropagation methods. Right, a CRE linked via H3K27ac HiChIP to the promoter of the KRT77 gene (chr12:53090924–53099998) shows progressively increasing contributions of nucleotides in CEBPA and TP63 motifs across the timecourse together with increasing accessibility. Assay ranges are as follows: ATAC-seq, 0–100; H3K27ac, 0–200; H3K4me1, 0–100 (units, −log10 P value). NN, neural network. d, Schematic for identification of predictive motif instances by scanning sequence weighted by contribution scores with known motifs. e, Dynamics of predictive contribution-weighted match scores of motifs across the timecourse averaged over all dynamic CREs. f, Comparison of correlation of TF expression across the timecourse to average contribution-weighted motif match scores of all predictive instances of 59 predictive motifs (y axis) versus correlation of TF expression to average ATAC-seq signal of CREs overlapping motif instances of the same 59 motifs identified solely on the basis of motif sequence match scores (x axis). g, Predictive motif instances of TP63 and ZNF750 motifs exhibit higher ChIP–seq signal than predicted inactive motif instances in CREs. h, ATAC-seq footprints are stronger at predictive motif instances of HOXA1 and CEBPD motifs relative to footprints at predicted inactive motif instances. i, Expression patterns of TFs with correlated dynamics of matched predictive motifs across the differentiation timecourse.
Next, we used the ensemble of trained models to infer sequence features in each CRE that are predictive of chromatin accessibility at each timepoint. Specifically, we used efficient backpropagation methods26,36 that can infer contribution scores of each individual nucleotide in each input sequence to the predicted output from the model at each timepoint (Fig. 3c). Although the sequence of a given CRE is the same across all timepoints, the base-resolution contribution scores are dynamic and reflect the timepoint-specific activating or repressive effect of predictive sequence features through the lens of the model. To evaluate the potential functional consequences of predictive nucleotides highlighted by the model, we estimated the allelic imbalance of ATAC-seq reads37 of 16,686 SNPs in CREs. SNPs overlapping bases with high contribution scores were associated with larger allelic effect sizes (Extended Data Fig. 3e). Furthermore, model-derived predicted allelic effects using an in silico mutagenesis approach were stronger for SNPs exhibiting statistically significant (false discovery rate (FDR) < 0.10) allelic imbalance than for SNPs that were allele-insensitive. These results indicate that the base-resolution contribution scores are enriched for nucleotides with putative functional effects on chromatin accessibility.
The base-resolution contribution scores highlighted short contiguous stretches of bases, reminiscent of TF binding motifs (Fig. 3c). Hence, we used a comprehensive compendium of known TF binding sequence motifs from the HOCOMOCO database38 to scan each CRE at each timepoint for predictive motif instances as subsequences with statistically significant (empirical P < 0.05) motif match scores to the sequence and to the sequence weighted by the base-resolution contribution scores (Fig. 3d and Supplementary Table 10). We identified 185 motifs with predictive motif instances across all timepoints, of which only 49 were identified by a conventional motif discovery method39 that estimates motif enrichments based solely on sequence match scores (Extended Data Fig. 3f). We identified a subset of 59 motifs whose predictive motif instances exhibited dynamic contribution-weighted motif match scores across the timecourse that were correlated strongly (Pearson R > 0.75) with RNA expression levels of TFs previously annotated to bind them (Fig. 3e). For most of these 59 motifs, the ATAC-seq signal of peaks containing motif instances identified solely on the basis of statistically significant sequence match scores showed significantly lower correlation with the TF expression dynamics of the corresponding TFs (Fig. 3f). Hence, the model-derived contribution scores of motif instances distilled from the ATAC-seq signal are critical to obtain improved estimators of the cis-regulatory activity of TFs. Predictive motif instances were also strongly supported by ChIP–seq experiments of matched TFs, indicating that they are probably capturing bound motif instances. For example, TP63, ZNF750 and KLF4 ChIP–seq40-42 profiles exhibited higher occupancy at their predictive motif instances as compared with inactive motif instances with low contribution scores in CREs (Fig. 3g and Extended Data Fig. 3g). Predictive motif instances had consistently higher overlaps with ChIP–seq peaks across the entire dynamic range of contribution-weighted match scores compared to motif instances ranked on the basis of sequence match scores (Extended Data Fig. 3h). Similarly, ATAC-seq footprinting analysis43 identified stronger TF footprints at predictive motif instances compared with all motif instances in peaks (Fig. 3h and Extended Data Fig. 3i). Genes linked to CREs containing predictive instances of each of the 59 motifs were also enriched strongly for epidermis-specific functions (Supplementary Fig. 1). These results support the utility of the model-derived contribution scores to decipher active motif instances in CREs and infer their dynamic regulatory activity across the timecourse.
We were able to confidently assign 59 predictive motifs to 100 TFs from among paralogous sets of candidate TFs with similar binding motifs, on the basis of high correlation of motif contribution scores and TF expression across the timecourse (Fig. 3i, Extended Data Fig. 3j,k and Supplementary Table 11). Several of these TFs are known to be essential in keratinocyte differentiation, such as p63, CEBPA, GRHL2, AHR, FOSB, DLX3, VDR, ZNF750, MAFB, RARG, JUNB, KLF4 and OVOL1 (refs. 3,18,40,44). We also identified sets of paralogous TFs with different patterns of concordant or discordant expression across the timecourse. For example, ETV1, ETV4, ETV5 and ETS1 are paralogs that recognize the same motif and concordantly decrease expression across differentiation. In contrast, the AP-1 family member FOSL1 is most active early in differentiation, while the other paralogs FOS, FOSB, JUNB and JUND are most active late in differentiation. These results indicate potential coordination among some TF family members, as well as possible regulatory transitions mediated by switching between TF family members.
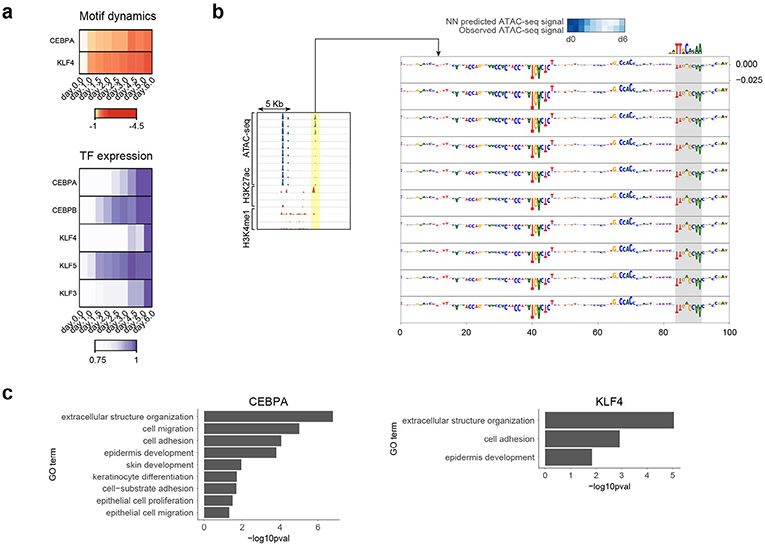
Next, we identified predictive motifs with strong negative contribution scores since these motifs could highlight potentially repressive TFs that are predicted to reduce chromatin accessibility. We focused specifically on dynamic CREs that decreased accessibility across differentiation as these are most likely to be bound by repressive TFs (Fig. 2g). Motifs of CEBPA and KLF4 showed significant negative contribution scores specifically in this set of dynamic CREs as well as strong negative correlation of motif activity with TF expression across the timecourse (Extended Data Fig. 4a,b). Genes linked to CREs containing these predictive motifs were enriched for epidermis-specific proliferation, migration and adhesion processes (Extended Data Fig. 4c), indicating a functional role for these TFs in decommissioning the progenitor maintenance program. This hypothesis is supported by previous studies in reprogramming systems that have noted important roles for both CEBPA and KLF4 in decommissioning enhancers by modifying chromatin state through interactions with LSD1, HDAC1 and BRD4 as well as by TF displacement45-47. Furthermore, CEBPA has been known to be an important reprogramming factor in at least two cell types, fibroblasts and B cells48. CEBPA and KLF4 were also identified as having predictive motifs with positive contribution scores in other CREs (Fig. 3e), indicating that CEBPA and KLF4 probably play both activating and repressing roles during chromatin remodeling in keratinocyte differentiation by activating terminal differentiation programs and decommissioning progenitor maintenance programs.
Model interpretation shows combinatorial regulatory logic.
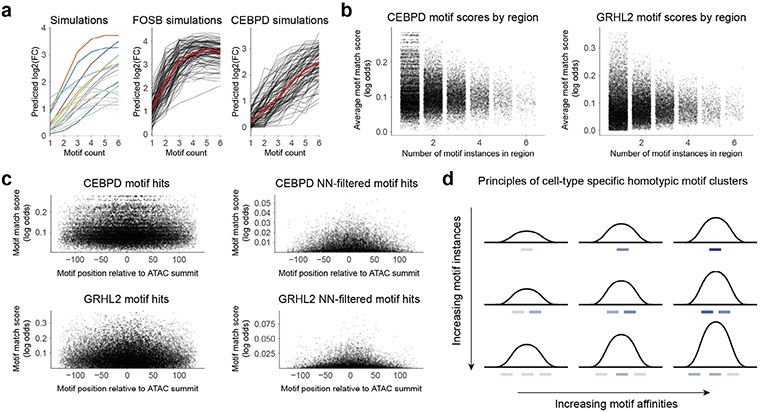
CREs are often composed of a multiplicity of motifs of one or more TFs in different syntactic configurations with variable motif density and affinity. However, the regulatory role of motif syntax has been difficult to resolve. Hence, we decided to infer the influence of motif syntax on chromatin accessibility of CREs across epidermal differentiation through the lens of our predictive models. First, we used the neural network models to predict the quantitative effect of homotypic motif density on chromatin accessibility using synthetic DNA sequence inputs composed of a systematically varying number of motif instances of each of the 59 predictive motifs. While most TFs (for example, CEBPD) showed monotonic increases in accessibility with increasing homotypic motif density, some TFs (for example, FOSB) showed saturation effects indicating nonlinear cooperative homotypic interactions (Extended Data Fig. 5a).
Next, we analyzed the relationship between the density and affinity (log odds of motif sequence match scores) of predictive motif instances of each motif across all CRE sequences in the genome (Extended Data Fig. 5b). For several key epidermal TFs (for example, CEBPD and GRHL2), we observed a systematic decrease in the upper limit of motif affinity as a function of increasing motif density. This striking tradeoff between motif density and affinity is supported by previous studies that have highlighted the critical role of suboptimal low-affinity motifs in preventing ectopic or ubiquitous regulatory activity of dynamic CREs, thereby allowing more fine-grained context-specific modulation by varying TF concentration49,50. We also analyzed the relationship between motif affinity and motif position relative to the local maxima of ATAC-seq signal in CREs. Higher-affinity sites were preferentially positioned closer to the maxima (Extended Data Fig. 5c). Altogether, our models show key principles of homotypic motif syntax encoded in dynamic CREs in epidermal differentiation (Extended Data Fig. 5d).
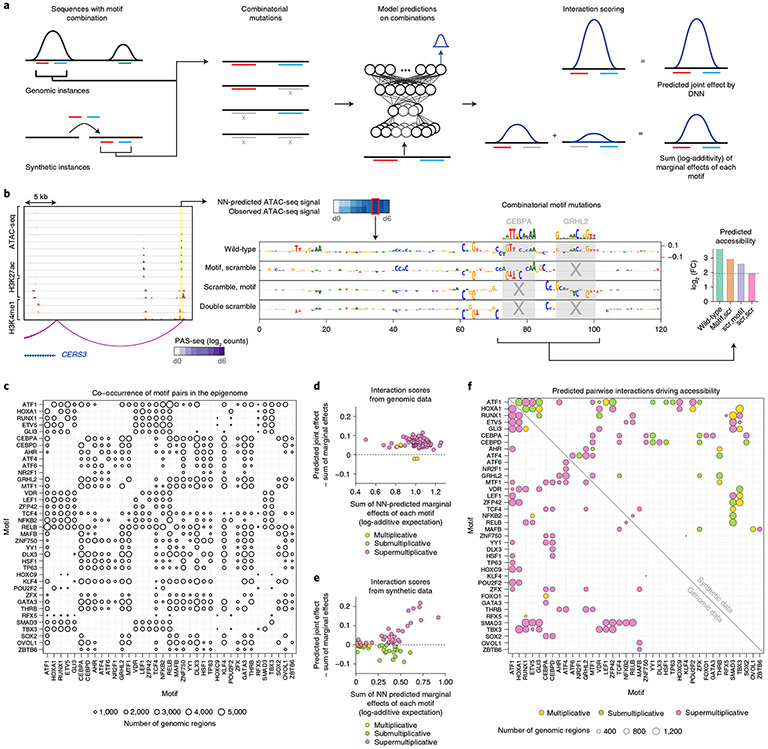
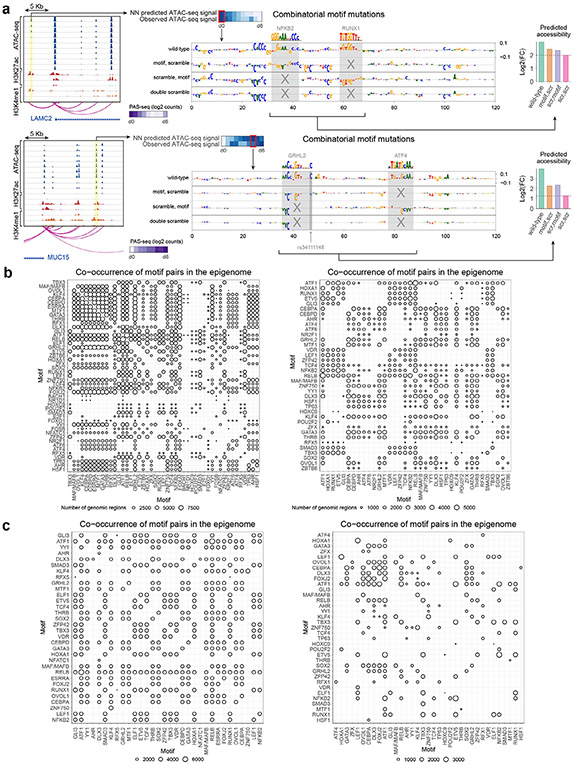
We then used two complementary in silico motif perturbation analysis methods to quantify the influence of heterotypic pairs of co-occurring motifs on chromatin accessibility dynamics. The first approach quantifies the impact of in silico disruption of one instance of a predictive motif on the contribution scores of a co-occurring predictive instance of a different motif25. The second approach compares the sum of the marginal effects of in silico disruption of each motif instance to the effect size of jointly disrupting both motif instances on predicted chromatin accessibility (Fig. 4a). The models predict chromatin accessibility signal as the depth of normalized read coverage on a log scale. Hence, additive effects on the log scale represent multiplicative effects on normalized read coverage. Motif pairs with joint effects larger than the sum of their marginal effects represent supermultiplicative interactions. Motif pairs whose joint effects are smaller than the sum of their marginal effects represent submultiplicative motif combinations that potentially act through independent, additive effects (Fig. 4b and Extended Data Fig. 6a). We restricted heterotypic motif interaction analysis to motif pairs with enriched co-occurrence of predictive motif instances in the dynamic CREs (Fig. 4c). Co-occurrence statistics using only predictive motif instances instead of all motif instances showed more specific and less promiscuous motif pairs (Extended Data Fig. 6b,c). For each heterotypic pair of motifs, we estimated in silico interaction effects for all dynamic CRE sequences containing predictive instances of both motifs. Most of the enriched co-occurring motif pairs exhibited multiplicative (log-additive) and supermultiplicative effects (Fig. 4d), indicating extensive cooperativity between co-binding TFs through heterotypic motif syntax.
Fig. 4 ∣. Combinatorial in silico perturbation analysis to infer heterotypic cis-regulatory logic.
a, Schematic for combinatorial in silico perturbation analysis. All genomic instances of CREs containing significantly co-occurring motif pairs were evaluated. Motif pairs were also embedded in synthetic background sequences for orthogonal evaluation. For each candidate sequence containing a motif pair, the NN is used to predict changes in chromatin accessibility due to marginal perturbation of each motif and joint perturbation of both motifs. The joint effects are compared with the sum of the marginal effects (log additivity) to test for supermultiplicative, multiplicative (log-additive) or submultiplicative joint effects. b, Example locus (chr15:101080467–101108623) where a CRE that loops to the CERS3 promoter contains active instances of CEBPA and GRHL2 motifs. Assay ranges are as follows: ATAC-seq, 0–600; H3K27ac, 0–50; H3K4me1, 0–50 (units, −log10 P value). The contribution score tracks from top to bottom are the wild-type (genomic) sequence, the sequence with the GRHL motif scrambled, the sequence with the CEBPA motif scrambled and the sequence with both motifs scrambled (double scramble). The right plot shows the predicted accessibility for the wild-type sequence, sequences with marginal perturbations of individual motifs and the sequence with joint perturbations (as the baseline). The motifs exhibit a multiplicative (log-additive) joint effect. FC, fold change; scr, scramble. c, Number of CREs supporting significantly co-occurring predictive pairs of motifs. d, Scatter plot comparing the difference between the joint effect on predicted accessibility and the sum of the predicted marginal effects (y axis: NN-predicted joint effect minus the sum of the marginal effects) to the sum of the marginal effects (x axis) of motif perturbations for all significantly co-occurring motif pairs using genomic sequences. Supermultiplicative pairs (pink) fall above the dashed line, multiplicative pairs (yellow) fall near and on the dashed line, and submultiplicative pairs (green) fall below the dashed line. e, Scatter plot comparing the difference between the joint effect on predicted accessibility and the sum of the predicted marginal effects (y axis) to the sum of the marginal effects (x axis) of motif perturbations for all significantly co-occurring motif pairs using synthetic sequences. f, Comparison of interaction effects of all significantly co-occurring motif pairs that exhibit skin-related functional enrichments using genomic sequences (below diagonal) and synthetic sequences (above diagonal).
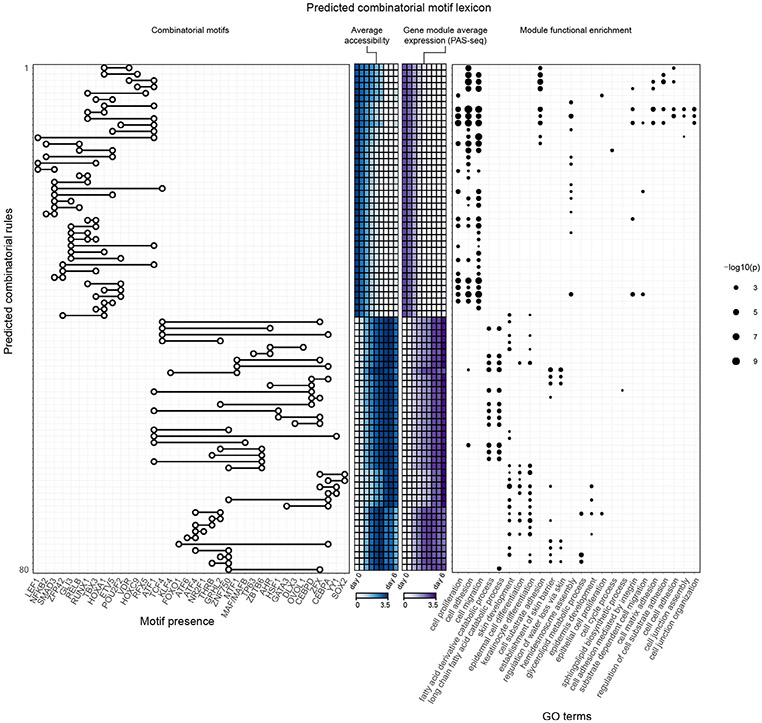
We also computed in silico interaction effects for motif pairs after embedding them in synthetic scrambled background sequences to avoid cryptic cooperative effects induced by other predictive motifs in the endogenous context (Fig. 4e). We observed more submultiplicative motif interactions in these synthetic backgrounds as compared to endogenous sequence context. These differences indicate that the native genomic context probably encodes higher-order cooperative interactions between the tested motif pairs and further motif partners. To winnow down the motif pairs to those with probable functional roles, we computed enrichments of functional terms using proximal gene sets associated with all CREs harboring predictive instances of each motif pair (Extended Data Fig. 7) and restricted to those that were enriched for skin-related functional terms (Fig. 4f). We thus obtained a core lexicon comprising 80 heterotypic pairs of significantly co-occurring TF motifs linked to distinct processes at different stages of epidermal differentiation.
This combinatorial lexicon implicates known and new cooperative partners (Extended Data Fig. 7). The ZNF750 motif was found to interact strongly with motifs for the CEBP family members CEBPA and CEBPD, both of which are known to be important in KRT10 regulation51. The ATF1 motif is present in stem cell maintenance rules, such as ATF1 with GLI1, as well as late differentiation rules, such as ATF1 with TP63. Notably, of the TFs that can bind to the ATF1 motif, CREB1 is most expressed at the beginning and end of differentiation while ATF1 increases in expression. NFKB/REL motifs are present only in stem cell maintenance rules, supporting a role for NFKB/REL motifs in progenitor state maintenance52. Notably, of the TFs that bind to the NFKB/REL motifs, RELB and NFKB2 decrease in expression while REL and RELA increase in expression. These rules, in conjunction with matched TF expression dynamics, demonstrate that precise targeting of gene modules and coordination of activation and deactivation relies on combinatorial motif syntax and expression of specific TF family members.
Regulatory activity in the combinatorial motif lexicon.
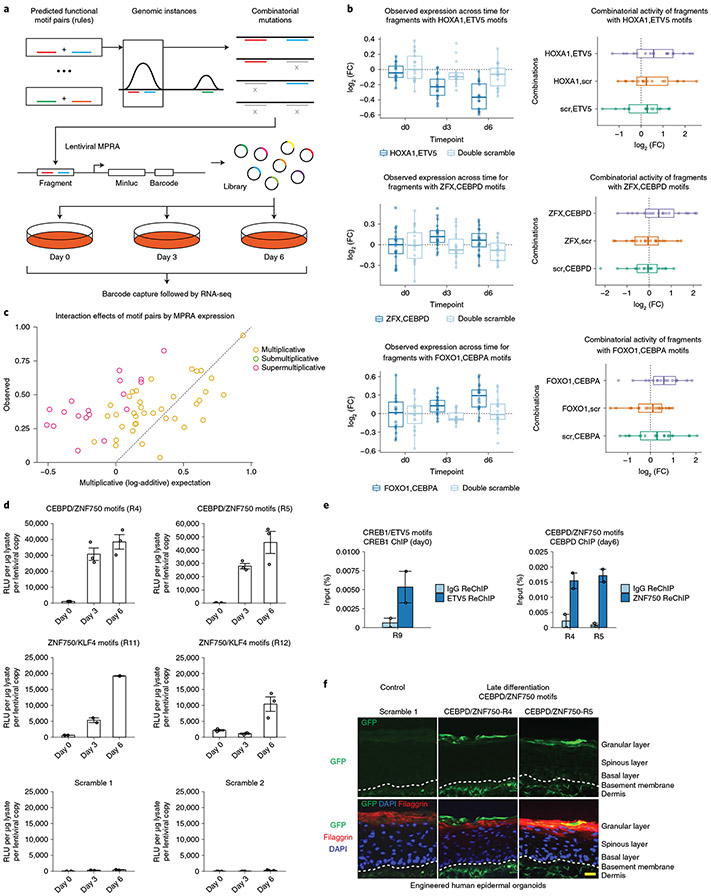
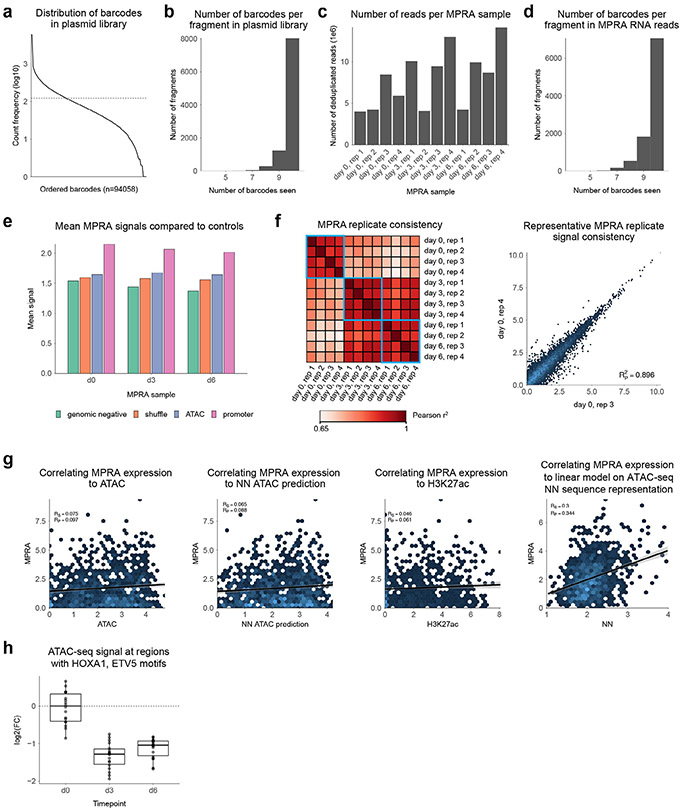
Next, we validated the temporal dynamics and the quantitative effects of the combinatorial motif lexicon on intrinsic regulatory potential using MPRA experiments at several timepoints of in vitro differentiation. We used the predictive motif annotations of all dynamic CREs to design libraries for the MPRA experiments. We designed 160-bp constructs for 19 randomly selected native human genomic CRE sequence examples from each of the 80 heterotypic motif pairs, mutants with combinatorially scrambled motif instances (individually and jointly) as well as corresponding positive and negative controls for the MPRA library—a total of 77,090 sequences (Fig. 5a, Extended Data Fig. 8a,b and Supplementary Table 12). The MPRA library was integrated with lentivirus into progenitor keratinocytes, then cells were induced to differentiate and harvested at appropriate timepoints. MPRA readouts for the entire library were obtained on days 0 (progenitor state), 3 (early differentiation) and 6 (late differentiation) of the differentiation timecourse (Extended Data Fig. 8c-e). Sample clustering and PCA demonstrated high reproducibility and clear separation between the progenitor state at day 0 and the differentiated state at days 3 and 6 (Extended Data Fig. 8f).
Fig. 5 ∣. Validation of combinatorial motif pairs using MPRAs.
a, MPRA design. For each of the derived combinatorial rules, genomic instances of each rule were selected randomly and the motif pair in the instance was scrambled combinatorially. All combinatorial versions of the sequence were added to the MPRA library, which was inserted lentivirally into primary keratinocytes. These cells were induced to differentiate, and reporter RNA was collected at days 0, 3 and 6. b, Examples of three combinatorial rules: the HOXA1–ETV5 motif pair (progenitors), the ZFX–CEBPD motif pair (early differentiation) and the FOXO1–CEBPA motif pair (late differentiation). Left column, plots showing observed expression across time for the wild-type (genomic) sequences as well as the sequences with both motifs mutated (double scramble), normalized to day 0. Right column, combinatorial dynamics of genomic instances of each rule, relative to joint motif-scrambled mutants. Box-and-whisker plots show all points, minimum to maximum, with 25th to 75th interquartile range. c, Summary of the combinatorial interaction effects of all temporally valid motif pairs. The scatter plot compares the joint effect (log fold change of reporter expression) of each motif pair (y axis) relative to the sum (log additivity) of the marginal effects of each motif (x axis). d, Luciferase reporter expression on combinatorial rule instances taken from the genome. R4 and R5 are instances of the CEBPD–ZNF750 rule, and R11 and R12 are instances of the KLF4–ZNF750 rule. Data shown summarize three independent experiments and are represented as mean ± s.e.m. RLU, relative luminescence units. e, ChIP–ReChIP experiments show TF occupancy on representative instances of combinatorial rules. Left, an instance of the CREB1–ETV5 rule on day 0. Right, an instance of the CEBPD–ZNF750 rule on day 6. Data shown summarize two independent experiments per reporter and are represented as mean ± s.e.m. f, GFP reporter expression (green) in representative human skin organoids with reporter expression engineered to be driven by R4 and R5 native genomic instances of the CEBPD–ZNF750 rule; note GFP reporter in outer epidermal layers that correspond to late differentiation. DAPI, 4',6-diamidino-2-phenylindole. Scale bar, 20 μm. This experiment was repeated three times with similar results.
First, we compared the MPRA-measured expression for the wild-type genomic regulatory sequences in our library to their corresponding measured and predicted ATAC-seq signal as well as H3K27ac signal in matched timepoints. We observed low correlation between MPRA expression and observed ATAC-seq signal (Pearson ρ = 0.097), predicted ATAC-seq signal (Pearson ρ = 0.088) and observed H3K27ac signal (Pearson ρ = 0.061) (Extended Data Fig. 8g), indicating fundamental differences between the MPRA-derived intrinsic measures of regulatory potential and endogenous chromatin state of regulatory sequences. However, we found that simple linear models that used the nonlinear sequence representation encoded in the final layer of the ATAC-seq CNN models as inputs were able to fit the MPRA expression levels with improved correlation (Pearson ρ = 0.344). These results indicate that the combinatorial sequence features that are predictive of ATAC-seq signal are also predictive of MPRA activity after a simple linear transformation. Hence, we postulated that the MPRAs could be used to validate the different combinatorial rules of cis-regulatory motif logic inferred from the models trained on the ATAC-seq data.
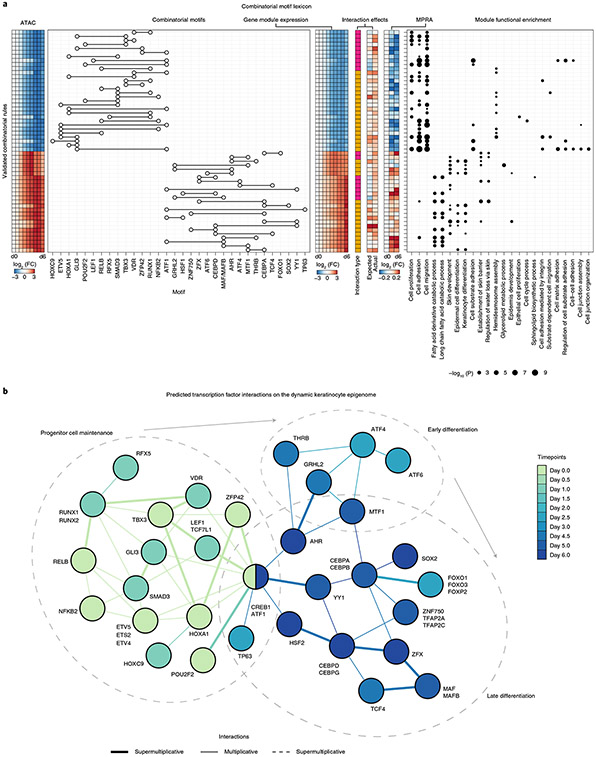
Since we observed concordance between chromatin dynamics and expression dynamics of associated putative target genes, we considered a heterotypic pair temporally valid if it produced a concordant effect in reporter expression compared with the measured and predicted chromatin accessibility dynamics of the CREs containing the pair. For example, for tested sequences containing the HOXA1–ETV5 motif pair, reporter activity decreased during differentiation, synchronous with the accessibility dynamics of the CREs containing this pair (Fig. 5b and Extended Data Fig. 8h). Using this criterion, 55 of the 80 heterotypic motif pairs (68%) were validated for temporal dynamics. Of these, 43 of the pairs (78%) showed significant differential activity relative to the mutated constructs in which both motifs were scrambled, indicating that these motif pairs are key drivers of regulatory potential for these CREs. Next, we used the combinatorially scrambled mutant sequences to determine whether the heterotypic motif pairs had multiplicative, supermultiplicative or submultiplicative effects on reporter expression. Of the 55 temporally valid motif pairs, we found that 18 pairs had supermultiplicative effects, 37 rules had multiplicative (log-additive effects) and none of the rules exhibited submultiplicative effects on reporter expression (Figs. 5c and 6a). Hence, the MPRA experiments support the multiplicative and supermultiplicative cooperative effects of motif pairs on chromatin accessibility as predicted by the model.
Fig. 6 ∣. A combinatorial motif lexicon in keratinocyte differentiation.
a, Summary of the validated combinatorial lexicon of motif pairs. Left to right, heatmap of ATAC-seq dynamics averaged over all CREs containing predictive motif instances of each motif pair; motif pairs (each row is a distinct motif pair); average expression dynamics over all putative downstream target genes associated with CREs containing predictive motif instances of each motif pair; type of interaction (pink, supermultiplicative; yellow, multiplicative), expected sum of marginal effects compared with joint effects in the MPRA; and enriched functional terms for downstream target gene sets associated with CREs containing predictive instances of each motif pair. b, Predicted cooperative TF interactions mediated by predictive motif pairs across the epidermal differentiation timecourse. Each node is a TF (or several TFs) matched to predictive motifs. The color of the node represents the timepoint at which the TF shows the highest expression across the timecourse. Each edge is a predicted cooperative interaction between a pair of TF motifs validated by MPRA experiments. Each edge is colored by the timepoint at which CREs containing predictive motif instances of the motif pair have the highest average accessibility. The thickness of the edges represents the type of cooperative logic for the motif pair: supermultiplicative (thick), multiplicative (thin) or submultiplicative (dashed).
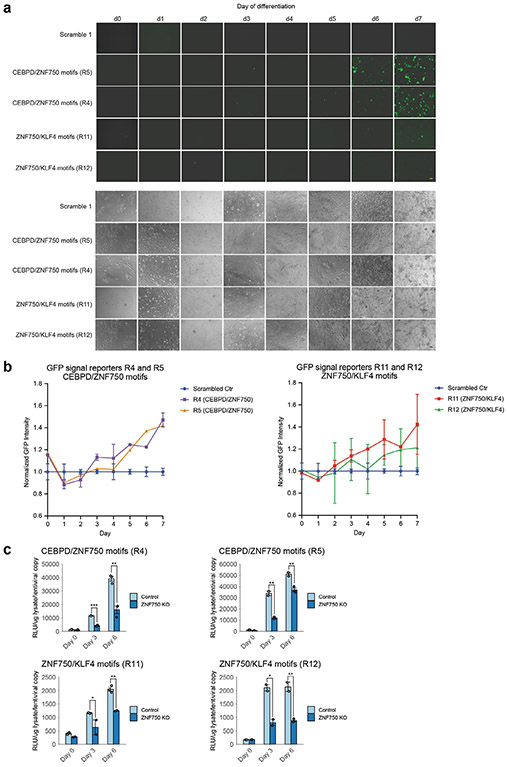
We performed further complementary experiments characterizing a few genomic instances of specific combinatorial motif rules validated by the MPRA experiments. First, we measured luciferase and green fluorescent protein (GFP) reporter expression for the genomic sequences of two CREs encoding the CEBPD–ZNF750 rule and two CREs encoding the ZNF750–KLF4 rule across three timepoints (Fig. 5d, Extended Data Fig. 9a,b and Supplementary Table 13), which demonstrated the predicted dynamic expression patterns. To determine whether these rules demonstrate expected TF occupancy, we analyzed representative genomic examples of the CREB1–ETV5 rule and the CEBPD–ZNF750 rule, which demonstrated co-occupancy of the expected TFs by sequential ChIP (ChIP–ReChIP) experiments (Fig. 5e and Supplementary Tables 13 and 14). To determine whether this occupancy was the driver of dynamic expression, we performed ZNF750 knockout followed by reporter luciferase assay on examples from two combinatorial rules containing ZNF750 (Extended Data Fig. 9c), which demonstrated the predicted decrease in expression due to ZNF750 loss. To determine whether these rules were also functional in intact, normally differentiating human epidermis, two examples of the CEBPD–ZNF750 rule were engineered into regenerated human epidermal organoid tissue. GFP reporter expression driven by this rule was observed in the outer epidermal layers, consistent with predicted action of this rule in late-stage differentiation (Fig. 5f). These analyses thus validate a combinatorial interaction between CEBPD and ZNF750 in keratinocyte differentiation. In summary, we find that these combinatorial rules are bound by TFs that modulate downstream activity and act with fidelity and stage specificity in human tissue models.
Disease-associated genetic variation in the motif lexicon.
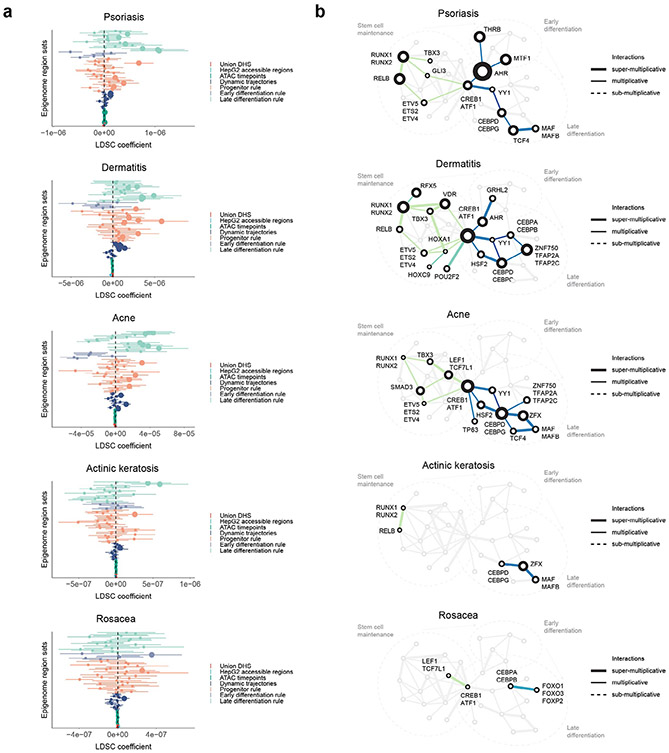
Using imputed genome-wide association study (GWAS) data from the UK Biobank database (http://www.nealelab.is/uk-biobank/), we observed that 493 genome-wide significant variants for a curated set of skin phenotypes were found in 295 CREs (from 2,092 total genome-wide significant variants across the phenotypes). These phenotypes included a variety of human skin diseases characterized by dysregulated epidermal differentiation, such as premalignant actinic keratosis, dermatitis, psoriasis, rosacea and acne vulgaris. To test whether the combinatorial motif lexicon was enriched for noncoding variants associated with these complex skin phenotypes, we used linkage disequilibrium (LD)-score regression53,54 in conjunction with the curated UK Biobank phenotypes and GWAS studies with summary statistics55,56. Genetic variants associated with skin-related diseases and traits were enriched in CREs containing specific motif rules with distinct temporal activity (Extended Data Fig. 10a), indicating that disruption of cooperative TF interactions that regulate epidermal differentiation may mediate disease risk in a manner consistent with pathological features of the corresponding skin disease. For example, motif pairs that influence the late stages of differentiation were enriched for heritability associated with acne, which is linked pathologically to abnormal terminal follicular keratinization. We further identified disease-specific networks of dysregulated TF lexicons by integrating all motif pairs enriched for disease-associated variation (Extended Data Fig. 10b). For example, the gene AHR has a known role in psoriasis as an immunomodulatory TF in keratinocytes57 and is highlighted in our analysis as a potential hub TF. In dermatitis, our analysis highlights the known prodifferentiation TFs ZNF750 and VDR58,59 and indicates roles for RUNX1, CREB1 and ATF1. Our results indicate that common noncoding genetic variants disrupting combinatorial cis-regulatory motif lexicons may pathologically dysregulate epidermal differentiation in polygenic skin disorders.
Discussion
Here, we present a resource for deciphering the cis-regulatory code of epidermal differentiation. Dense longitudinal profiling of the transcriptome and epigenome throughout the differentiation process enabled the identification of distinct dynamic trajectories of 40,103 dynamic CREs driving synchronous changes in gene expression of linked target genes. The depth and breadth of the data allowed training of deep-learning models to infer the combinatorial lexicon of cooperative TF binding sites encoded in the dynamic CREs at single-base resolution. MPRA experiments validated predicted temporal dynamics and cis-regulatory logic involving cooperative TF interactions explaining regulation of 9,726 dynamic CREs (24.2% of all dynamic CREs) linked to 1,004 dynamic transcripts (32.7% of the dynamic transcriptome) across the differentiation timecourse. The homotypic motif clusters explain another 5,426 more dynamic CREs (13.5% of all dynamic CREs) and 515 more dynamic transcripts (14.2% of the dynamic transcriptome).
This integrative resource serves as a repository of hypotheses about combinatorial cis-regulatory control of several key processes in epidermal differentiation (Fig. 6b). We find a progenitor maintenance lexicon including RELB, NFKB2, ETS1, SMAD3 and RUNX1 motifs that jointly orchestrate deactivation and disassembly of hemidesmosomes, which are structural proteins that anchor keratinocytes to the basement membrane. The associated TFs decrease in expression quickly, within the first 12 h of initiating differentiation. We also identified intricate interplay of motifs in an early differentiation lexicon involving ATF4, ATF6, GRHL2, MTF1 and NR2C1 motifs that associates with induction of early differentiation genes. In late differentiation, we discovered a lexicon comprising HSF2, CEBPD, ZFX, CEBPA and ZNF750 motifs that regulate a module of genes involved in fatty acid metabolism, an essential process for cornification and maintenance of skin barrier function. ZNF750 is one of the last TFs to sharply increase in expression around day 5.5, consistent with the observed essential role of ZNF750 in orchestrating terminal skin barrier formation18,58. We also found repressive motifs of CEPBPA and KLF4 in CREs marked by decreasing chromatin accessibility, indicating a role in decommissioning the progenitor maintenance program. Finally, the enrichment of skin disease-associated variants in specific rules of the cis-regulatory lexicon indicates that this approach could prove useful in future efforts aimed at fine mapping causal variants and genes as well as providing mechanistic insights into how these variants might disrupt key pathways in skin differentiation.
The cis-regulatory code is more than the sum of its parts. The interpretable, deep-learning framework presented here (https://github.com/kundajelab/tronn) provides a generalizable approach to move beyond static catalogs of cis-regulatory ‘parts lists’ (refs. 6,38,60-66) to predictive, quantitative models of higher-order cis-regulatory logic. Previous advances in deep-learning model interpretation methods have focused largely on discovering motif representations, active motif instances and their co-occurrence patterns20-22,67-70. The current in silico combinatorial perturbation framework extends this to enable discovery of quantitative rules of homotypic and heterotypic cis-regulatory logic such as the multiplicative and supermultiplicative effects of frequently co-occurring motif combinations on chromatin accessibility. Unlike previous studies that have investigated the critical regulatory role of cooperative TF binding in limited contexts, this approach allows comprehensive, genome-wide explanation of these effects, at the resolution of individual CREs, in dynamic processes such as cellular differentiation.
The present analyses also reconcile the influence of cis-regulatory logic on endogenous chromatin state and intrinsic regulatory potential. MPRAs offer a powerful experimental platform to test the effects of motif combinations on reporter gene expression activity71,72. However, interpretation of MPRAs designed to test endogenous properties of regulatory DNA is challenging since the sequences are tested outside their native genomic context. We found that chromatin accessibility and histone modification levels are poor predictors of absolute regulatory potential at each timepoint across CREs encoding different combinatorial rules. However, relative changes of these measures of chromatin state of CREs encoding specific combinatorial rules are highly consistent with relative changes in their regulatory potential across timepoints. The sequence features learned by the deep-learning models of chromatin accessibility are also predictive of MPRA activity, indicating a shared cis-regulatory sequence code underlying intrinsic regulatory potential and chromatin state. Consistent with this hypothesis, the cooperative cis-regulatory logic of combinatorial motif rules inferred from chromatin accessibility was strongly validated by the MPRA experiments. These observations indicate that the intrinsic regulatory potential and chromatin state of CRE sequences are both determined by the same underlying cis-regulatory motif syntax mediating cooperative TF binding despite the significant differences in transformations of different syntactical rules into quantitative readouts of regulatory activity measured by the different assays.
Methods
Experiments and data processing.
Primary human keratinocytes were isolated from fresh surgically discarded neonatal foreskin and cultured in Keratinocyte-SFM (Life Technologies, catalog no. 17005-142) and Medium 154 (Life Technologies, catalog no. M-154-500). Keratinocytes were induced to differentiate by addition of 1.2 mM calcium (added 12 h after seeding at confluence) for 6 days in full confluence. Cells were harvested every 12 h for a total of 13 timepoints and banked into cell pellets, viable batches (10% dimethylsulfoxide in media), or cross-linked with 1% formaldehyde and frozen at −80 °C. We performed ATAC-seq on all timepoints. We performed ChIP–seq for H3K27ac, H3K4me1 and H3K27me3 on three timepoints (days 0, 3 and 6). We performed PAS-seq on all timepoints. We performed HiChIP on three timepoints (days 0, 3 and 6). Further experimental details and data processing details can be found in the Supplementary Methods.
Epigenomic and transcriptomic landscapes.
To determine the landscape of accessible regulatory elements across keratinocyte differentiation, we took the union set of the ATAC-seq peaks across all timepoints to determine an atlas of CREs. We generated a signal coverage matrix using counts of corrected transposase cut sites in the sequencing reads, and we used DESeq2 on all pairs of timepoints to get all CREs that have differential signal between any pair of timepoints, using an FDR of 0.0005 to give us a postanalysis Bonferroni-corrected FDR of 0.05 across all tests. To group the dynamically accessible CREs into defined trajectories across time, we used Dirichlet process-Gaussian process (DP-GP) timeseries clustering with replicate reproducibility. This analysis framework extends DP-GP time series clustering30 to consider replicates and to determine which clusters are reproducible across replicates (Supplementary Methods).
To determine the landscape of transcripts across keratinocyte differentiation, we first determined the set of expressed genes at each timepoint. We did this by first normalizing the full matrix of protein-coding transcripts across timepoints using the rlog function from DESeq2 (ref. 29), and then setting an empirical threshold on the basis of the best separation of a Gaussian mixture model on the rlog normalized values (threshold = 4.0). We then took the union of all expressed genes across timepoints to determine the transcriptomic atlas. We then used DESeq2 on all pairs of timepoints to get all genes that have differential signal between any pair of timepoints, using an FDR of 0.0005 to give us a postanalysis Bonferroni-corrected FDR of 0.05 across all tests. To group the dynamic genes into defined trajectories across time, the same framework used for the dynamic CREs was also used for the dynamic genes.
Deep learning.
Convolutional neural networks.
We trained multitask CNNs to map 1-kb DNA sequence regions accurately across the genome to quantitative read outs of chromatin accessibility and several histone marks in each timepoint of keratinocyte differentiation. CNNs can learn complex sequence patterns that are predictive of genome-wide chromatin accessibility and histone mark profiles. We use a multistage, transfer learning training regimen to maximize prediction performance and model stability by leveraging large compendia of chromatin accessibility data across 100 s of diverse tissues.
Architecture, training and evaluation.
We used the previously optimized multitask Basset CNN architecture for predicting genome-wide chromatin accessibility from DNA sequence across several samples20. Full architecture parameters can be found in the Supplementary Methods. The inputs to the model are 1-kb long DNA sequences that are one-hot encoded. The final layer mapped to several outputs (multitask output) spanning the timepoints and each of the different types of molecular read out (chromatin accessibility or histone marks). We use binary or continuous output labels and associated loss functions in the multistage training. When training on binary labels, we use the binary cross-entropy loss function with logistic outputs. When training on continuous, quantitative measures of accessibility or histone marks, we use the mean squared error loss function with linear outputs. The multitask loss is the sum of the loss over all tasks.
We binned the genome into 1-kb windows with a stride of 50 bp. Each bin can serve as an example in a training, validation/tuning or test set. We divide chromosomes into ten folds. We use a cross-validation set up where we use eight folds for training, one for validation/tuning and one for testing. Further details on training, evaluation and calibration can be found in the Supplementary Methods.
Inference of predictive motif instances.
Overview.
The multitask CNNs map every candidate regulatory DNA sequence to quantitative measures of chromatin accessibility at each timepoint in the differentiation timecourse. We developed an interpretation framework to interrogate the model and decipher motif instances in each candidate element that are predictive of chromatin accessibility at each timepoint. First, we used gradient-based feature attribution methods to decompose the predicted output (at each timepoint) for an input sequence in terms of contribution scores of each nucleotide in the sequence. We developed methods to stabilize and normalize the scores. We developed stringent null models to identify statistically significant contribution scores. We then used a large compendium of precompiled TF motifs to scan and score the sequences as well as the contribution score profiles. We developed stringent null models to infer predictive motif instances that have statistically significant contribution scores and sequence match scores. Full details can be found in the Supplementary Methods, and key methods are briefly described here.
Contribution scores.
For each input sequence, we computed input-gated gradient score profiles from dinucleotide shuffled versions of the sequence. We used these scores to construct an empirical null distribution of contribution scores for that sequence. We used that empirical null distribution to derive empirical statistical significance of the observed contribution scores. We used a threshold of P < 0.01 to call statistically significant scores. The scores of all positions that did not pass the significance threshold were set to 0.
Dynamic predictive motif instances.
We identified dynamic predictive motif instances in each input sequence across timepoints, for each of the known motifs in the motif compendium, by scanning and scoring the sequence as well as the dynamic the contribution score profiles derived from the model. Full details can be found in Supplementary Methods. First, for each position weight matrix (PWM) motif, we computed sequence match scores at every position in each sequence. The scanning and scoring can be implemented as a convolution operation. Hence, we used the deep-learning framework to implement a single convolutional layer with filters corresponding to each of the PWMs in the deep-learning framework. We used the convolutional layer to scan and score all PWMs across the forward and reverse complement of each one-hot encoded sequence. We also used the same operation to scan and score dinucleotide shuffled versions of each of the genomic sequences. We thus obtained an empirical null distribution of match scores for each PWM for each sequence. We identified positions with significant sequence match scores as those that pass P < 0.05 on the basis of the empirical distributions. For any sequence, the significant positions on the basis of sequence match scores will be identical across all timepoints. Next, we used the PWMs to scan and score the dynamic contribution score profiles for each sequence in each timepoint. Essentially, we repeated the same convolution operation using PWM filters but using the contribution score profiles to weight the one-hot encoded sequences. Hence, we obtained contribution-weighted match scores to the PWMs. Our final set of predictive motif instances for each sequence in each timepoint corresponded to positions that have significant sequence match scores and significant contribution-weighted match scores. Since the contribution score profiles for each sequence can change across timepoints, the predictive motif instances were dynamic across timepoints.
Motif pair interactions.
Co-occurring pairs of predictive motifs in a regulatory sequence can have different types of quantitative joint effect on chromatin accessibility (depth-normalized ATAC-seq read coverage). We explore three types of joint effect. Lack of motif interactions would manifest as independent, additive effects on coverage. Interactions between motifs learned by the model would manifest as multiplicative (additive in log space) or supermultiplicative effects (multiplicative in log space) on coverage. For all pairs of functionally enriched pairs of co-occurring motifs, we identified all the sequences containing predictive instances of the pair. We then used two complementary approaches to test each instance of a pair of motifs for epistatic interactions.
First, we used the Deep Feature Interaction Map method25 to score epistatic interactions between pairs of candidate predictive motif instances (say A and B) in a sequence. Briefly, we inferred the positions in the sequence that exhibit statistically significant delta contribution scores due to in silico mutations to motif A. If motif instance B overlaps any positions with significant delta contribution scores then it is estimated to have an interaction effect with motif A on ATAC-seq read coverage.
Next, we corroborated the Deep Feature Interaction Map scores, with an explicit combinatorial in silico motif mutagenesis approach using both the ‘scramble’ and ‘point mutation’ approach (Supplementary Methods). Assume we have two motif instances A and B in a sequence that we would like to test for epistatic interactions using the model. We record the model’s output with both motif instances intact in the sequence = o. We record the output after ‘mutating’ only motif A, which is the sequence that contains only an intact motif B = b. We record the output after mutating only motif B, which is the sequence that contains an intact motif A = a. Finally, we record the output after mutating both motifs A and B, which is a baseline = n. We computed the marginal effect size of adding motif A relative to a null sequence that does not contain either of the motifs = (a − n). We computed the marginal effect size of adding motif B relative to a null sequence that does not contain either of the motifs = (b − n). We computed the joint effect of adding motif A and B relative to the sequence that does not contain either of the motifs = (o − n).
We then compared the joint effect size (o − n) to the sum of the marginal effect sizes (a − n) + (b − n) = (a + b − 2n). We ran a Wilcoxon signed rank test on the paired values (joint versus sum of marginals) across all instances of a motif pair to determine whether the joint effects on the motif pair instances is significantly greater or less than the sum of the marginal effects.
Since the output predictions are in units of log depth-normalized coverage, additivity in log units translates to multiplicative effects in units of coverage. If the joint effect is significantly larger than the sum of the marginal effects, motifs A and B have supermultiplicative effect on coverage. If the joint effect is significantly lower than the sum of the joint effects, motifs A and B exhibit a submultiplicative effect on coverage. A nonsignificant difference between the joint and sum of marginals indicates a multiplicative effect of motif A and B on coverage.
MPRA design.
We designed MPRA constructs guided by the combinatorial motif sets that have positive motif interaction scores using the motif perturbations. For each rule of interacting motif pairs, we randomly selected 19 genomic subsequences of length 160 bp within accessible peaks, containing predictive instances of both motifs in the rule and exhibiting positive interaction scores. We tested the wild-type (genomic) sequence and all versions of the sequences in which the motifs are mutated combinatorially.
This sampling design allow us to test the following hypotheses. (1) Trajectory: does the motif combination produce a reporter activation pattern across timepoints (days 0, 3 and 6 in the in vitro model) that was predicted by the trajectory it was derived from? (2) Interactions: do the motif pairs exhibit multiplicative or supermultiplicative interaction effects on intrinsic reporter activity?
We included the following positive and negative controls. As positive controls, we used 316 TSSs of the highest expressed genes. As negative controls, we generated dinucleotide shuffled versions of 50 randomly selected genomic test sequences selected above. We also selected 50 negative controls from the genome that are not found in the master list of accessible regions across keratinocyte differentiation.
Library cloning, cell culture and sequencing.
The MPRA oligonucleotide library was synthesized using Agilent’s oligonucleotide library synthesis platform. Full details can be found in Supplementary Methods. Briefly, the oligonucleotide library was cloned into plasmids containing pGreenFire1 lentivector backbone and amplified by transformation in Takara Stellar competent cells. The final plasmid library pool was sequenced on an Illumina MiSeq to ensure an oligonucleotide library coverage greater than 90%.
Lentivirus was made with the plasmid library pool and transduced into keratinocytes (Supplementary Methods), which were seeded for days 0, 3 and 6 timepoints of differentiation. At each timepoint, total RNA was isolated using an RNeasy Plus kit (Qiagen, catalog no. 74134) and then used to generate MPRA sequencing libraries (Supplementary Methods). We performed deep sequencing on an Illumina NovaSeq 6000.
MPRA analysis.
The DNA plasmid library was sequenced to capture the baseline fractions of each sequence in the library. The MPRA library reads were sequenced and analyzed in the same fashion as the DNA plasmid library. The counts were then renormalized using the plasmid fractions by multiplying the MPRA counts by the plasmid fractions, converting to fractions, and multiplying by the total count across the MPRA library. These counts were then run through regularized log transform from DESeq2 to get a normalized signal matrix. This normalized matrix was then used in downstream analyses.
To test trajectory patterns, the normalized MPRA signal for all sequences belonging to the pattern were collected for days 0, 3 and 6. Day 3 and 6 readouts were then compared with day 0 by a Wilcoxon signed rank test (P < 0.05) to determine differential signal between timepoints. If the measurements show differential signal for either of these days, the trajectory is considered to have dynamic activity across the timecourse. Thee mean (across all sequences) pattern of the MPRA signal across the three timepoints was then compared with the corresponding average ATAC trajectory to determine a correlative match (Spearman rank correlation P < 0.05) in terms of the dynamics.
To estimate interaction scores for motif pairs tested in the MPRAs, we compared the distribution of normalized MPRA signal (log scale) of wild-type sequences containing both motifs to the expected log-additive effect of each individual motif. When motif a is scrambled, we noted the MPRA signal = a. When motif b is scrambled, we noted the MPRA signal = b. When both motifs a and b are scrambled, we noted the MPRA signal = n. Then, the expected log-additive signal for the wild-type sequence containing both motifs = (a − n) + (b − n). We then used the Wilcoxon signed rank test (P < 0.10) to determine whether there is a significant difference between the observed wild-type signal and the log-additive expected signal. A significantly positive score indicates a supermultiplicative effect of the motif pair. A nonsignificant score indicates a multiplicative (log-additive) effect of the motif pair. A significant negative score indicates a submultiplicative effect of the motif pair.
Biochemical characterization of combinatorial rules.
To confirm MPRA reporter activity on an individual basis, a lentiviral reporter construct was designed that contains a minimal promoter driving the expression of destabilized copGFP (GFP 2 from the copepod Pontellina plumata) and luciferase separated by a T2A (self-cleaving peptide from thosea asigna virus 2A) sequence. Genomic sequences synthesized by IDT were inserted upstream of the minimal promoter. Lentivirus was made and transduced into primary keratinocytes, and cells were then seeded for days 0, 3 and 6. Luciferase assays were performed using a Tecan Infinite M1000 plate reader. Further details can be found in Supplementary Methods.
For ChIP, human keratinocytes were cross-linked with 1% formaldehyde and chromatin was sonicated to an average fragment length of 150–500 bp. Chromatin was immunoprecipitated overnight at 4 °C. Following cross-link reversal, samples were treated with RNase A and the DNA was purified using a ChIP DNA Purification Kit (Zymo Research, catalog no. D5205). The following antibodies were used: CREB1 (Millipore, catalog no. 06-863, 2 μg per 40 μg chromatin), ETV5 (Proteintech, catalog no. 13011-1-AP, 1 μg), KLF4 (Sigma, catalog no. SAB2701975, 2 μg per 40 μg chromatin), ZNF750 (Sigma HPA023012, 1 μg), CEBPD (Thermo Fisher PA5-30262, 2 μg per 40 μg chromatin). For ReChIP, samples were eluted in ChIP elution buffer (1% SDS, 50 mM NaHCO3) then diluted tenfold in modified RIPA buffer without SDS (1% NP-40, 1% sodium deoxycholate, 1 mM EDTA in PBS) for immunoprecipitation with second antibody.
For organoid modeling, primary human keratinocytes were isolated from fresh surgically discarded skin and cultured in Keratinocyte-SFM (Life Technologies, catalog no. 17005-142) and Medium 154 (Life Technologies, catalog no. M-154-500). We performed organotypic regeneration of human epidermis as previously described3. Briefly, cells were first transduced with lentivirus containing pGreenfire reporter constructs and selected with puromycin for 2 days posttransduction. After selection, 500,000 cells were seeded onto devitalized dermis, cultured for 7 days and harvested. Biologic replicates were performed in all cases.
For immunofluorescence staining, tissue sections (7 μm thick) were fixed using 4% paraformaldehyde. Primary antibodies GFP (Thermo Fisher, catalog no. A-11122) and filaggrin (Abcam, catalog no. 81468) were incubated overnight at 4 °C and secondary antibodies (Alexa Fluor 488 or 555, Thermo Fisher) were incubated at room temperature for 1 h. Tissue samples were mounted with Duolink In Situ mounting media with 4,6-diamidino-2-phenylindole (Sigma). Images were taken using a Zeiss Axio Observer Z1 fluorescence microscope and Zeiss Axiovision software.
Statistics.
Unless otherwise specified or tested, data distributions were assumed to be normal.
Reporting Summary.
Further information on research design is available in the Nature Research Reporting Summary linked to this article.
Extended Data
Extended Data Fig. 1 ∣. Data quality and other characteristics of the regulatory landscape.
(a) Morphology schematic of normal human epidermis. (b) Selected biomarker gene panel from PAS-seq, demonstrating proper differentiation across time in vitro. (c) Principal component analysis (PCA) of other datasets (signal type used for analysis in parenthesis): PAS-seq (log2 of counts), H3K27ac ChIP–seq (log2 of counts), H3K4me1 ChIP–seq (log2 of counts), H3K27me3 ChIP–seq (log2 of counts), HiChIP (normalized fragment counts). (d) Global statistics on ATAC-seq. Top plot shows the number of reproducible peaks across the timepoints. Bottom plot shows the number of up and down regulated differential peaks across time, using day 0 as the baseline. (e) Global statistics on PAS-seq. Top plot shows the number of expressed genes (> approximately 1TPM) at each timepoint. Bottom plot shows the number of up and down regulated differential genes across time, using day 0 as the baseline. (f) Comparison of bulk ATAC-seq in keratinocyte differentiation to scATAC-seq. Each of the bulk ATAC-seq samples was projected into a 2D UMAP of related scATAC-seq data.
Extended Data Fig. 2 ∣. Extended analysis of the keratinocyte epigenome.
(a) Analysis of regions with stable (invariant) accessibility and dynamic chromatin modifications surrounding them (28,973 regions). The regions are clustered according to their dynamic chromatin mark patterns and marked with enriched GO terms accordingly. (b) Analysis of regions with stable (invariant) accessibility and stable chromatin modifications (84,678 regions). The regions are clustered according to combinatorial chromatin states and marked with enriched GO terms accordingly. (c) Comparison of accessibility at TSSs, separated into TSSs of dynamic genes, stable genes, and nonexpressed genes, and additionally compared to distal regions. (d) Profile heatmaps for TSSs of dynamic genes. (e) Chromatin states around TSSs of stable genes. (f) Chromatin states around TSSs of nonexpressed genes.
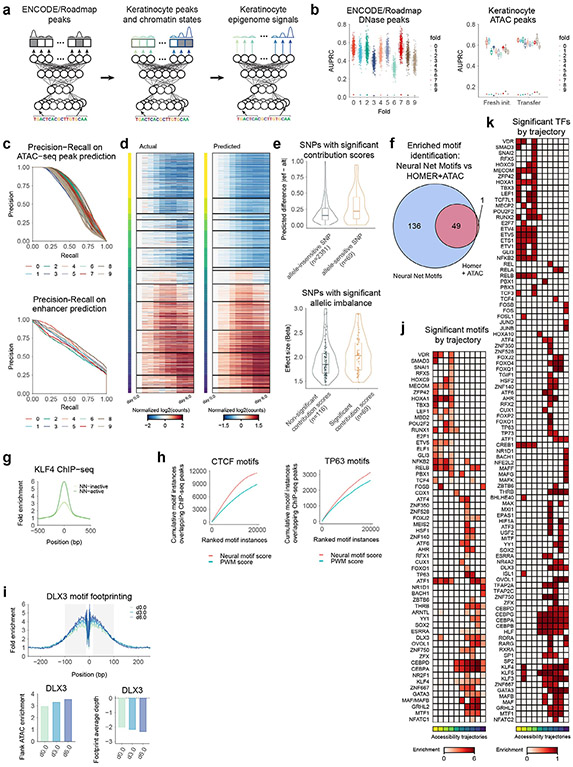
Extended Data Fig. 3 ∣. Extended analysis of deep neural net models.
(a) Schematic describing transfer learning. From left to right: first, models are trained on a large compendium of DNase-seq datasets from ENCODE and Roadmap; these weights are used to initialize training for a keratinocyte specific classification model; finally, these weights are used to initialize training for a regression model. (b) Model performance metrics. Left: area under the precision-recall curve (AUPRC) for the ENCODE/Roadmap pre-training classification tasks across 10 folds. Right: AUPRC for accessibility in keratinocyte timepoints across 10 folds, considering transfer learning or fresh initialization (random seeded weights). Box-and-whisker plots show all points, minimum to maximum, with 25th to 75th interquartile range. (c) Precision-recall curves for the classification stage. Top: Precision-recall for prediction of accessible peaks. Bottom: Precision-recall for prediction of strong enhancer state (presence of ATAC-seq, H3K27ac ChIP–seq, and H3K4me1 ChIP–seq). (d) Heatmaps of observed ATAC signal vs neural net predicted ATAC signal across dynamically accessible regions. (e) Validation of contribution scores by comparing to SNPs exhibiting significant allelic imbalance of ATAC-seq signal. Top: Comparison of effect sizes of allelic imbalance of ATAC-seq signal, between SNPs overlapping nonsignificant contribution scores and those overlapping significant contribution scores. Bottom: comparison of model-derived allelic effect predictions (reference allele - alternate allele) on SNPs overlapping significant contribution scores, separated by whether the SNP was considered allele-sensitive (FDR < 0.10) or not allele-sensitive. Box-and-whisker plots show all points, minimum to maximum, with 25th to 75th interquartile range box. (f) Comparison of neural network derived predictive motifs versus enriched motifs derived by HOMER motif discovery. (g) Predictive, active motif instances of KLF4 show higher ChIP–seq signal relative to inactive motifs in CREs. (h) Evaluation of motif instances identified by sequence-only position weight matrix motif match scores against contribution-weighted sequence motif match scores. (i) Predictive motifs show dynamic footprinting. DLX3 motif is shown. (j) Heatmap showing predictive motifs enriched in CREs corresponding to ATAC-seq trajectories. (k) Heatmap showing TFs whose expression was correlated (r > 0.8) with activity of their matched predictive motifs in CREs corresponding to ATAC-seq trajectories.
Extended Data Fig. 4 ∣. Repressive motifs in CREs exhibiting decreasing accessibility across keratinocyte differentiation.
(a) Top: dynamics of negative contribution scores of predictive motif instances of CEPBA and KLF4 across time averaged over all CREs exhibiting decreasing accessibility across the timecourse. Bottom: dynamic expression patterns of CEBP and KLF family TFs that exhibit strong anticorrelation with motif activity dynamics across the timecourse. (b) A closing CRE (chr10:60192514-60203992) shows progressively increasing negative contributions of nucleotides in CEBPA motif across the timecourse in concordance with an increasing negative effect on accessibility. Assay ranges are ATAC-seq: 0-500; H3K27ac: 0-20; H3K4me1: 0–50. (c) Functional enrichments for gene sets linked to CREs containing predictive instances of CEBPA and KLF4 motifs with strong negative contribution scores. Left: enrichments linked to closing CREs with negative CEBPA motif scores. Right: enrichments linked to closing CREs with negative KLF4 motif scores.
Extended Data Fig. 5 ∣. Analysis of homotypic motif clusters within the keratinocyte epigenome.
(a) Analysis of motif counts on chromatin accessibility using synthetic sequences. Synthetic scrambled background sequences were embedded with varying number of instances of each predictive motif. The neural network was used to predict chromatin accessibility for each synthetic sequence. Left: Each curve summarizes the predicted accessibility with increasing motif density for each motif averaged over 100 random synthetic backgrounds. Middle/right: Predicted chromatin accessibility for increasing density of FOSB, and CEBPD motifs. Each black curve represents a specific random synthetic background sequence, while the red curve is the average pattern across all backgrounds. (b) Relationship between motif affinity and motif density in CREs containing predictive motif instances. Motif affinity is estimated as the average motif PWM match log-odds scores of all predictive instances in a CRE. Motif density is the number of predictive motif instances in each CRE. We observe a striking tradeoff between motif density and the upper limit of average motif affinity. Right: CEBPD motif instances. Left: GRHL motif instances. (c) Motif PWM match scores as a function of distance from the ATAC-seq summit. Left: motif PWM match scores from all motif instances for CEBPD and GRHL motifs. Right: motif PWM match scores for predictive motif instances for CEBPD and GRHL motifs. (d) Proposed principles of cell-type specific homotypic motif clusters. As number of motif instances increases or as motif affinities in a region increase, accessibility increases. The suboptimization of motif sites, particularly when there are more motif instances within a region, acts as an upper limit to prevent ectopic accessibility. Motif affinities are strongest near the accessibility summit.
Extended Data Fig. 6 ∣. Examples of interacting pairs of predictive motifs and motif co-occurrence statistics.
(a) Example regions demonstrating interacting motifs. Top row: putative enhancer affecting LAMC2 gene expression with an interacting NFKB2 motif and RUNX1 motif (chr1:183147408-183170430). Assay ranges are ATAC-seq: 0–600; H3K27ac: 0-300; H3K4me1: 0–50. The highlighted region in the signal tracks (left) demonstrates correctly predicted ATAC signal by the neural net (top middle heatmap). Base-resolution contribution score tracks are shown for the wild-type (genomic) sequence and sequences with marginal and joint perturbation of both motifs (middle tracks). The model predicts a super-multiplicative effects of the motif pair on chromatin accessibility (right plot). Bottom row: Analogous plots for a putative enhancer affecting MUC15 gene expression with an interacting GRHL2 motif and ATF4 motif (chr11:26590539-26610606). Assay ranges are ATAC-seq: 0–800; H3K27ac: 0–150; H3K4me1: 0-70. (b) Co-occurrence statistics (size of circle represents number of instances) for motif pairs based on all motif instances identified solely using sequence match scores (left) and motif pairs based on predictive, active motif instances based on contribution-weighted sequence match scores (right). Predictive motif instances highlight less promiscuous, more specific co-occurrence statistics. (c) Analogous co-occurrence statistics for motif pairs using all motif instances (left) and predictive motif instances (right) after filtering for pairs that show significant GO term enrichments for associated target genes. Once again, more specific co-occurrence patterns are observed for the predictive motif instances.
Extended Data Fig. 7 ∣. Mapping co-occurring motif pairs to enriched Gene Ontology terms.
Map of combinatorial rules derived from in silico motif interaction analyses. Each row across plots represents a predicted interacting motif pair. From left to right: the motif presence plot demonstrates which motifs are part of the combinatorial rule; the ATAC heatmap demonstrates the average accessibility pattern over CREs containing each motif pair across all time points; the RNA heatmap displays the average gene expression over genes associated with CREs containing each motif pair across the time points; Gene Ontology terms are significantly enriched in the gene sets associated with CREs containing each motif pair.
Extended Data Fig. 8 ∣. MPRA data quality and comparisons to epigenomic landscapes.
(a) Distribution of barcodes in plasmid library, demonstrating the skew of barcode representation. (b) Number of barcodes per fragment in plasmid library, demonstrating on average 10 barcodes per fragment tested. (c) Number of reads per MPRA sample. (d) Number of barcodes per fragment in MPRA RNA reads, demonstrating on average 10 barcodes per fragment tested. (e) Average MPRA signal compared to controls, showing ATAC regions on average have activity in between negative controls (genomic negatives and shuffled sequences) and positive controls (promoter sequences). (f) MPRA replicate consistency. Left: Consistency by Pearson R across replicates and timepoints tested. Right: Consistency of MPRA replicate signal for two example replicates in timepoint day 0. (g) Correlation of MPRA signal to various genomic and/or modeling signals: ATAC signal, NN predictions of ATAC signal, H3K27ac, and regression predictions from linear model utilizing NN final layer activations as model inputs (results shown on held-out test data). (h) ATAC signal across timepoints day 0,3, and 6 for sequences containing HOXA1 motif and ETV5 motif. Box-and-whisker plots show all points, minimum to maximum, with 25th to 75th interquartile range.
Extended Data Fig. 9 ∣. Additional experimental validation of representative MPRA fragments.
(a) GFP expression of reporters drawn from MPRA fragments (endogenous examples of combinatorial rules) from day 0 to day 7. R4 and R5 are instances of CEBPD/ZNF750 rule. R11 and R12 are instances of KLF4/ZNF750 rule. Scr is a scrambled control fragment. Yellow and black scale bars are 20um. (b) GFP expression from the experiment in (A) quantified. (c) ZNF750 knockout followed by luciferase reporter timecourse expression, demonstrating ZNF750 influence on instances of rules involving ZNF750. Data summarizes three independent experiments and is represented as mean ± s.e.m. One-sided T test was used for comparisons, *P < 0.05, **P < 0.01, ***P < 0.001.
Extended Data Fig. 10 ∣. Combinatorial motif pairs are enriched for genetic variants associated with skin phenotypes.
(a) LD score regression analysis showing differential heritability enrichment of various skin-related diseases and traits in different sets of CRE. The skin phenotypes include: psoriasis, dermatitis, acne, actinic keratosis and rosacea. The sets of CREs include: ‘Progenitor’ rules are CREs containing motif pairs that demonstrate decreasing accessibility and activity across the epidermal differentiation timecourse. ‘Early differentiation’ rules are CREs containing motif pairs those that demonstrate maximal accessibility and activity in the middle of the epidermal differentiation timecourse. ‘Late differentiation’ rules are CREs contained motif pairs that demonstrate maximal accessibility and activity at the end of the epidermal differentiation timecourse. ‘Union DHS’ is the union of DNase peaks across all ENCODE DNase datasets. ‘HepG2’ are DNase peaks in the HepG2 liver carcinoma cell line. ‘Union ATAC’ is the union of CREs across all time points of the differentiation timecourse. ‘ATAC timepoints’ are the CREs that are accessible in each time point of the epidermal differentiation timecourse. ‘Dynamic trajectories’ are clusters of CREs that display specific concordant patterns of dynamic accessibility across the epidermal differentiation timecourse. Plots show LDSC score enrichment coefficients with confidence intervals. (b) Predicted dysregulated TF motif lexicon networks by phenotype. Combinatorial rules were overlaid onto the predicted TF network of combinatorial motif interactions to demonstrate dysregulated TF subnetworks. Node size is the sum of the LD score regression coefficients for the significant combinatorial rules involving that node TF motif. Edges and nodes in black represent significantly enriched combinatorial rules, edges and nodes in gray did not pass statistical significance. Edge thickness represents the validated interaction effect of the rule (supermultiplicative, multiplicative, submultiplicative).
Supplementary Material
Table 1: List of all experiments with metadata. Table 2: ATAC-seq quality control metrics for technical replicates. Table 3: ATAC-seq quality control metrics for biological replicates. Table 4: PAS-seq quality control metrics. Table 5: ChIP–seq quality control metrics. Table 6: HiChIP quality control metrics. Table 7: Cross-validation folds, split by chromosomes. Table 8: List of ENCODE/Roadmap DNase-seq datasets used in transfer learning. Table 9: List of ENCODE/Roadmap TF ChIP–seq datasets used in transfer learning. Table 10: HOCOMOCO reduced set of position weight matrices with associated transcription factors. Table 11: List of FANTOM5 transcription factors. Table 12: List of MPRA sequences. Table 13: List of individual reporter sequences used in validation experiments. Table 14: List of qPCR primers for ChIP–ReChIP.
Acknowledgements
The authors thank members of the Kundaje, Greenleaf and Khavari laboratories for discussions and Stanford Computing (Sherlock) and Pacific Computing Consortium (Nautilus) for computing resources. This work was supported by USVA Office of Research and Development I01BX00140908 (P.A.K.), NIH CA142635, AR45192, AR076965 and HG007919 (P.A.K.), 1DP2GM123485 (A.K.) and RM1-HG007735 (H.Y.C.). H.Y.C. is an Investigator of the Howard Hughes Medical Institute. V.I.R. was supported by the Walter V. and Idun Berry Postdoctoral Fellowship and the Katharine McCormick Advanced Postdoctoral Fellowship.
Footnotes
Code availability
Integrative analysis code and scripts78 can be found at https://github.com/vervacity/ggr-project and the deep-learning code79 can be found at https://github.com/kundajelab/tronn.
Competing interests
H.Y.C. is a cofounder of Accent Therapeutics and Boundless Bio and is an advisor to 10x Genomics, Arsenal Biosciences and Spring Discovery. M.P.S. is a cofounder and on the advisory board of Personalis, SensOmics, January, Filtricine, Qbio, Protos, Mirive and Nimo. M.P.S. is also on the advisory board of Genapsys and Tailai. W.J.G. is a consultant for 10x Genomics who has licensed intellectual property associated with ATAC-seq. W.J.G. has additional affiliations with Guardant Health (consultant) and Protillion Biosciences (cofounder and consultant). A. Kundaje has affiliations with Biogen (consultant), ImmuneAI (scientific advisory board) and RavelBio (scientific cofounder and scientific advisory board). The remaining authors declare no competing interests.
Extended data is available for this paper at https://doi.org/10.1038/s41588-021-00947-3.
Supplementary information The online version contains supplementary material available at https://doi.org/10.1038/s41588-021-00947-3.
Online content
Any methods, additional references, Nature Research reporting summaries, source data, extended data, supplementary information, acknowledgements, peer review information; details of author contributions and competing interests; and statements of data and code availability are available at https://doi.org/10.1038/s41588-021-00947-3.
Data availability
ATAC-seq, ChIP–seq, PAS-seq, HiChIP and MPRA data can all be found on the Gene Expression Omnibus: GSE181416. There are no restrictions to access of the datasets. Training datasets for machine learning can be found at Zenodo73,74 and trained models can also be found at Zenodo75,76. hg19 annotations can be found at https://hgdownload.soe.ucsc.edu/downloads.html and GENCODE annotations can be found at https://www.gencodegenes.org/human/release_19.html. FANTOM5 (ref. 77) transcription factors can be found at https://fantom.gsc.riken.jp/5/sstar/Browse_Transcription_Factors_hg19. The HOCOMOCO38 database can be found at https://hocomoco11.autosome.ru/.
References
- 1.Gray H & Lewis WH Anatomy of the Human Body (Bartleby, 1918). [Google Scholar]
- 2.Lopez-Pajares V, Yan K, Zarnegar BJ, Jameson KL & Khavari PA Genetic pathways in disorders of epidermal differentiation. Trends Genet. 29, 31–40 (2013). [DOI] [PMC free article] [PubMed] [Google Scholar]
- 3.Truong AB, Kretz M, Ridky TW, Kimmel R & Khavari PA p63 regulates proliferation and differentiation of developmentally mature keratinocytes. Genes Dev. 20, 3185–3197 (2006). [DOI] [PMC free article] [PubMed] [Google Scholar]
- 4.Levine M Transcriptional enhancers in animal development and evolution. Curr. Biol 20, R754–R763 (2010). [DOI] [PMC free article] [PubMed] [Google Scholar]
- 5.Spitz F & Furlong EEM Transcription factors: from enhancer binding to developmental control. Nat. Rev. Genet 13, 613–626 (2012). [DOI] [PubMed] [Google Scholar]
- 6.Kundaje A et al. Integrative analysis of 111 reference human epigenomes. Nature 518, 317–330 (2015). [DOI] [PMC free article] [PubMed] [Google Scholar]
- 7.Reiter F, Wienerroither S & Stark A Combinatorial function of transcription factors and cofactors. Curr. Opin. Genet. Dev 43, 73–81 (2017). [DOI] [PubMed] [Google Scholar]
- 8.Rubin AJ et al. Lineage-specific dynamic and pre-established enhancer-promoter contacts cooperate in terminal differentiation. Nat. Genet 49, 1522–1528 (2017). [DOI] [PMC free article] [PubMed] [Google Scholar]
- 9.Arnosti DN, Barolo S, Levine M & Small S The eve stripe 2 enhancer employs multiple modes of transcriptional synergy. Development 122, 205–214 (1996). [DOI] [PubMed] [Google Scholar]
- 10.Banerji J, Rusconi S & Schaffner W Expression of a beta-globin gene is enhanced by remote SV40 DNA sequences. Cell 27, 299–308 (1981). [DOI] [PubMed] [Google Scholar]
- 11.Levo M & Segal E In pursuit of design principles of regulatory sequences. Nat. Rev. Genet 15, 453–468 (2014). [DOI] [PubMed] [Google Scholar]
- 12.Thanos D & Maniatis T Virus induction of human IFN beta gene expression requires the assembly of an enhanceosome. Cell 83, 1091–1100 (1995). [DOI] [PubMed] [Google Scholar]
- 13.Michaletti A et al. Multi-omics profiling of calcium-induced human keratinocytes differentiation reveals modulation of unfolded protein response signaling pathways. Cell Cycle 18, 2124–2140 (2019). [DOI] [PMC free article] [PubMed] [Google Scholar]
- 14.Hopkin AS et al. GRHL3/GET1 and trithorax group members collaborate to activate the epidermal progenitor differentiation program. PLoS Genet. 8, e1002829 (2012). [DOI] [PMC free article] [PubMed] [Google Scholar]
- 15.Lopez RG et al. C/EBPalpha and beta couple interfollicular keratinocyte proliferation arrest to commitment and terminal differentiation. Nat. Cell Biol 11, 1181–1190 (2009). [DOI] [PubMed] [Google Scholar]
- 16.Lopez-Pajares V et al. A LncRNA-MAF:MAFB transcription factor network regulates epidermal differentiation. Dev. Cell 32, 693–706 (2015). [DOI] [PMC free article] [PubMed] [Google Scholar]
- 17.Segre JA, Bauer C & Fuchs E Klf4 is a transcription factor required for establishing the barrier function of the skin. Nat. Genet 22, 356–360 (1999). [DOI] [PubMed] [Google Scholar]
- 18.Sen GL et al. ZNF750 is a p63 target gene that induces KLF4 to drive terminal epidermal differentiation. Dev. Cell 22, 669–677 (2012). [DOI] [PMC free article] [PubMed] [Google Scholar]
- 19.Eraslan G, Avsec Ž, Gagneur J & Theis FJ Deep learning: new computational modelling techniques for genomics. Nat. Rev. Genet 20, 389–403 (2019). [DOI] [PubMed] [Google Scholar]
- 20.Kelley DR, Snoek J & Rinn J Basset: Learning the regulatory code of the accessible genome with deep convolutional neural networks. Genome Res. 26, 990–999 (2016). [DOI] [PMC free article] [PubMed] [Google Scholar]
- 21.Kelley DR et al. Sequential regulatory activity prediction across chromosomes with convolutional neural networks. Genome Res. 28, 739–750 (2018). [DOI] [PMC free article] [PubMed] [Google Scholar]
- 22.Zhou J & Troyanskaya OG Predicting effects of noncoding variants with deep learning-based sequence model. Nat. Methods 12, 931–934 (2015). [DOI] [PMC free article] [PubMed] [Google Scholar]
- 23.Avsec Ž et al. Base-resolution models of transcription factor binding reveal soft motif syntax. Nat. Genet 53, 354–366 (2021). [DOI] [PMC free article] [PubMed] [Google Scholar]
- 24.Ching T et al. Opportunities and obstacles for deep learning in biology and medicine. J. R. Soc. Interface 15, 20170387 (2018). [DOI] [PMC free article] [PubMed] [Google Scholar]
- 25.Greenside P, Shimko T, Fordyce P & Kundaje A Discovering epistatic feature interactions from neural network models of regulatory DNA sequences. Bioinformatics 34, i629–i637 (2018). [DOI] [PMC free article] [PubMed] [Google Scholar]
- 26.Shrikumar A, Greenside P & Kundaje A Learning important features through propagating activation differences. In Proc. 34th International Conference on Machine Learning (eds. Precup D & Teh WW) 3145–3153 (JMLR, 2017). [Google Scholar]
- 27.Subramanian A et al. Gene set enrichment analysis: a knowledge-based approach for interpreting genome-wide expression profiles. Proc. Natl Acad. Sci. USA 102, 15545–15550 (2005). [DOI] [PMC free article] [PubMed] [Google Scholar]
- 28.Rubin AJ et al. Coupled single-cell CRISPR screening and epigenomic profiling reveals causal gene regulatory networks. Cell 176, 361–376.e17 (2019). [DOI] [PMC free article] [PubMed] [Google Scholar]
- 29.Love MI, Huber W & Anders S Moderated estimation of fold change and dispersion for RNA-seq data with DESeq2. Genome Biol. 15, 550 (2014). [DOI] [PMC free article] [PubMed] [Google Scholar]
- 30.McDowell IC et al. Clustering gene expression time series data using an infinite Gaussian process mixture model. PLoS Comput. Biol 14, e1005896 (2018). [DOI] [PMC free article] [PubMed] [Google Scholar]
- 31.Simpson CL, Patel DM & Green KJ Deconstructing the skin: cytoarchitectural determinants of epidermal morphogenesis. Nat. Rev. Mol. Cell Biol 12, 565–580 (2011). [DOI] [PMC free article] [PubMed] [Google Scholar]
- 32.Candi E, Schmidt R & Melino G The cornified envelope: a model of cell death in the skin. Nat. Rev. Mol. Cell Biol 6, 328–340 (2005). [DOI] [PubMed] [Google Scholar]
- 33.Sen GL, Webster DE, Barragan DI, Chang HY & Khavari PA Control of differentiation in a self-renewing mammalian tissue by the histone demethylase JMJD3. Genes Dev. 22, 1865–1870 (2008). [DOI] [PMC free article] [PubMed] [Google Scholar]
- 34.Ezhkova E et al. Ezh2 orchestrates gene expression for the stepwise differentiation of tissue-specific stem cells. Cell 136, 1122–1135 (2009). [DOI] [PMC free article] [PubMed] [Google Scholar]
- 35.Ezhkova E et al. EZH1 and EZH2 cogovern histone H3K27 trimethylation and are essential for hair follicle homeostasis and wound repair. Genes Dev. 25, 485–498 (2011). [DOI] [PMC free article] [PubMed] [Google Scholar]
- 36.Simonyan K, Vedaldi A & Zisserman A Deep inside convolutional networks: visualising image classification models and saliency maps. Preprint at https://arxiv.org/abs/1312.6034 (2013). [Google Scholar]
- 37.Harvey CT et al. QuASAR: quantitative allele-specific analysis of reads. Bioinformatics 31, 1235–1242 (2015). [DOI] [PMC free article] [PubMed] [Google Scholar]
- 38.Kulakovskiy IV et al. HOCOMOCO: towards a complete collection of transcription factor binding models for human and mouse via large-scale ChIP–Seq analysis. Nucleic Acids Res. 46, D252–D259 (2018). [DOI] [PMC free article] [PubMed] [Google Scholar]
- 39.Heinz S et al. Simple combinations of lineage-determining transcription factors prime cis-regulatory elements required for macrophage and B cell identities. Mol. Cell 38, 576–589 (2010). [DOI] [PMC free article] [PubMed] [Google Scholar]
- 40.Boxer LD, Barajas B, Tao S, Zhang J & Khavari PA ZNF750 interacts with KLF4 and RCOR1, KDM1A, and CTBP1/2 chromatin regulators to repress epidermal progenitor genes and induce differentiation genes. Genes Dev. 28, 2013–2026 (2014). [DOI] [PMC free article] [PubMed] [Google Scholar]
- 41.Liu T et al. Cistrome: an integrative platform for transcriptional regulation studies. Genome Biol. 12, R83 (2011). [DOI] [PMC free article] [PubMed] [Google Scholar]
- 42.McDade SS et al. Genome-wide characterization reveals complex interplay between TP53 and TP63 in response to genotoxic stress. Nucleic Acids Res. 42, 6270–6285 (2014). [DOI] [PMC free article] [PubMed] [Google Scholar]
- 43.Li Z et al. Identification of transcription factor binding sites using ATAC-seq. Genome Biol. 20, 45 (2019). [DOI] [PMC free article] [PubMed] [Google Scholar]
- 44.Nair M et al. Ovol1 regulates the growth arrest of embryonic epidermal progenitor cells and represses c-myc transcription. J. Cell Biol 173, 253–264 (2006). [DOI] [PMC free article] [PubMed] [Google Scholar]
- 45.Chronis C et al. Cooperative binding of transcription factors orchestrates reprogramming. Cell 168, 442–459.e20 (2017). [DOI] [PMC free article] [PubMed] [Google Scholar]
- 46.Li D et al. Chromatin accessibility dynamics during iPSC reprogramming. Cell Stem Cell 21, 819–833.e6 (2017). [DOI] [PubMed] [Google Scholar]
- 47.Di Stefano B et al. C/EBPα creates elite cells for iPSC reprogramming by upregulating Klf4 and increasing the levels of Lsd1 and Brd4. Nat. Cell Biol 18, 371–381 (2016). [DOI] [PubMed] [Google Scholar]
- 48.Xu J, Du Y & Deng H Direct lineage reprogramming: strategies, mechanisms, and applications. Cell Stem Cell 16, 119–134 (2015). [DOI] [PubMed] [Google Scholar]
- 49.Farley EK et al. Suboptimization of developmental enhancers. Science 350, 325–328 (2015). [DOI] [PMC free article] [PubMed] [Google Scholar]
- 50.Farley EK, Olson KM, Zhang W, Rokhsar DS & Levine MS Syntax compensates for poor binding sites to encode tissue specificity of developmental enhancers. Proc. Natl Acad. Sci. USA 113, 6508–6513 (2016). [DOI] [PMC free article] [PubMed] [Google Scholar]
- 51.Maytin EV et al. Keratin 10 gene expression during differentiation of mouse epidermis requires transcription factors C/EBP and AP-2. Dev. Biol 216, 164–181 (1999). [DOI] [PubMed] [Google Scholar]
- 52.Li J-J, Cao Y, Young MR & Colburn NH Induced expression of dominant-negative c-jun downregulates NFκB and AP-1 target genes and suppresses tumor phenotype in human keratinocytes. Mol. Carcinogenesis 29, 159–169 (2000). [DOI] [PubMed] [Google Scholar]
- 53.Finucane HK et al. Partitioning heritability by functional annotation using genome-wide association summary statistics. Nat. Genet 47, 1228–1235 (2015). [DOI] [PMC free article] [PubMed] [Google Scholar]
- 54.Finucane HK et al. Heritability enrichment of specifically expressed genes identifies disease-relevant tissues and cell types. Nat. Genet 50, 621–629 (2018). [DOI] [PMC free article] [PubMed] [Google Scholar]
- 55.Hirata T et al. Japanese GWAS identifies variants for bust-size, dysmenorrhea, and menstrual fever that are eQTLs for relevant protein-coding or long non-coding RNAs. Sci. Rep 8, 8502 (2018). [DOI] [PMC free article] [PubMed] [Google Scholar]
- 56.Paternoster L et al. Multi-ancestry genome-wide association study of 21,000 cases and 95,000 controls identifies new risk loci for atopic dermatitis. Nat. Genet 47, 1449–1456 (2015). [DOI] [PMC free article] [PubMed] [Google Scholar]
- 57.Colonna M AHR: making the keratinocytes thick skinned. Immunity 40, 863–864 (2014). [DOI] [PubMed] [Google Scholar]
- 58.Birnbaum RY et al. Seborrhea-like dermatitis with psoriasiform elements caused by a mutation in ZNF750, encoding a putative C2H2 zinc finger protein. Nat. Genet 38, 749–751 (2006). [DOI] [PubMed] [Google Scholar]
- 59.Li M et al. Topical vitamin D3 and low-calcemic analogs induce thymic stromal lymphopoietin in mouse keratinocytes and trigger an atopic dermatitis. Proc. Natl Acad. Sci. USA 103, 11736–11741 (2006). [DOI] [PMC free article] [PubMed] [Google Scholar]
- 60.Bentsen M et al. ATAC-seq footprinting unravels kinetics of transcription factor binding during zygotic genome activation. Nat. Commun 11, 4267 (2020). [DOI] [PMC free article] [PubMed] [Google Scholar]
- 61.ENCODE Project Consortium. An integrated encyclopedia of DNA elements in the human genome. Nature 489, 57–74 (2012). [DOI] [PMC free article] [PubMed] [Google Scholar]
- 62.ENCODE Project Consortium. et al. Expanded encyclopaedias of DNA elements in the human and mouse genomes. Nature 583, 699–710 (2020). [DOI] [PMC free article] [PubMed] [Google Scholar]
- 63.Fornes O et al. JASPAR 2020: update of the open-access database of transcription factor binding profiles. Nucleic Acids Res. 48, D87–D92 (2020). [DOI] [PMC free article] [PubMed] [Google Scholar]
- 64.Luo K et al. Quantitative occupancy of myriad transcription factors from one DNase experiment enables efficient comparisons across conditions. Preprint at bioRxiv 10.1101/2020.06.28.171587 (2020). [DOI] [Google Scholar]
- 65.Vierstra J et al. Global reference mapping of human transcription factor footprints. Nature 583, 729–736 (2020). [DOI] [PMC free article] [PubMed] [Google Scholar]
- 66.Weirauch MT et al. Determination and inference of eukaryotic transcription factor sequence specificity. Cell 158, 1431–1443 (2014). [DOI] [PMC free article] [PubMed] [Google Scholar]
- 67.Alipanahi B, Delong A, Weirauch MT & Frey BJ Predicting the sequence specificities of DNA- and RNA-binding proteins by deep learning. Nat. Biotechnol 33, 831–838 (2015). [DOI] [PubMed] [Google Scholar]
- 68.Ghandi M, Lee D, Mohammad-Noori M & Beer MA Enhanced regulatory sequence prediction using gapped k-mer features. PLoS Comput. Biol 10, e1003711 (2014). [DOI] [PMC free article] [PubMed] [Google Scholar]
- 69.Maslova A et al. Deep learning of immune cell differentiation. Proc. Natl Acad. Sci. USA 117, 25655–25666 (2020). [DOI] [PMC free article] [PubMed] [Google Scholar]
- 70.Sanford EM et al. Gene regulation gravitates toward either addition or multiplication when combining the effects of two signals. eLife 9, e59388 (2020). [DOI] [PMC free article] [PubMed] [Google Scholar]
- 71.Sharon E et al. Inferring gene regulatory logic from high-throughput measurements of thousands of systematically designed promoters. Nat. Biotechnol 30, 521–530 (2012). [DOI] [PMC free article] [PubMed] [Google Scholar]
- 72.Smith RP et al. Massively parallel decoding of mammalian regulatory sequences supports a flexible organizational model. Nat. Genet 45, 1021–1028 (2013). [DOI] [PMC free article] [PubMed] [Google Scholar]
- 73.Kim DS & Kundaje A Classification dataset for ENCODE-Roadmap DNase-seq peaks and transcription factor ChIP–seq peaks. Zenodo; 10.5281/zenodo.4059038 (2020). [DOI] [Google Scholar]
- 74.Kim DS & Kundaje A Machine learning datasets for epigenomic landscapes in epidermal differentiation. Zenodo; 10.5281/zenodo.4062510 (2020). [DOI] [Google Scholar]
- 75.Kim DS & Kundaje A Convolutional neural net (CNN) models for ENCODE-Roadmap DNase-seq peaks and transcription factor ChIP–seq peaks—basset architecture. Zenodo; 10.5281/zenodo.4059060 (2020). [DOI] [Google Scholar]
- 76.Kim DS & Kundaje A Convolutional neural net (CNN) models for epigenomic landscapes in epidermal differentiation—basset architecture, classification and regression. Zenodo; 10.5281/zenodo.4062726 (2020). [DOI] [Google Scholar]
- 77.Lizio M et al. Update of the FANTOM web resource: high resolution transcriptome of diverse cell types in mammals. Nucleic Acids Res. 45, D737–D743 (2017). [DOI] [PMC free article] [PubMed] [Google Scholar]
- 78.Kim D vervacity/ggr-project: first release. Zenodo; 10.5281/zenodo.5161189 (2021). [DOI] [Google Scholar]
- 79.Kim D, Arivazhagan N, Wu K & Sharmin M kundajelab/tronn: v.1.0.0 Zenodo; 10.5281/zenodo.5160998 (2021). [DOI] [Google Scholar]
Associated Data
This section collects any data citations, data availability statements, or supplementary materials included in this article.
Supplementary Materials
Table 1: List of all experiments with metadata. Table 2: ATAC-seq quality control metrics for technical replicates. Table 3: ATAC-seq quality control metrics for biological replicates. Table 4: PAS-seq quality control metrics. Table 5: ChIP–seq quality control metrics. Table 6: HiChIP quality control metrics. Table 7: Cross-validation folds, split by chromosomes. Table 8: List of ENCODE/Roadmap DNase-seq datasets used in transfer learning. Table 9: List of ENCODE/Roadmap TF ChIP–seq datasets used in transfer learning. Table 10: HOCOMOCO reduced set of position weight matrices with associated transcription factors. Table 11: List of FANTOM5 transcription factors. Table 12: List of MPRA sequences. Table 13: List of individual reporter sequences used in validation experiments. Table 14: List of qPCR primers for ChIP–ReChIP.
Data Availability Statement
ATAC-seq, ChIP–seq, PAS-seq, HiChIP and MPRA data can all be found on the Gene Expression Omnibus: GSE181416. There are no restrictions to access of the datasets. Training datasets for machine learning can be found at Zenodo73,74 and trained models can also be found at Zenodo75,76. hg19 annotations can be found at https://hgdownload.soe.ucsc.edu/downloads.html and GENCODE annotations can be found at https://www.gencodegenes.org/human/release_19.html. FANTOM5 (ref. 77) transcription factors can be found at https://fantom.gsc.riken.jp/5/sstar/Browse_Transcription_Factors_hg19. The HOCOMOCO38 database can be found at https://hocomoco11.autosome.ru/.


