

Summary
Transcription factors (TFs) regulate gene expression by binding to DNA sequences and modulating transcriptional activity through their effector domains. Despite the central role of effector domains in TF function, there is a current lack of a comprehensive resource and characterization of effector domains. Here, we provide a catalog of 924 effector domains across 594 human TFs. Using this catalog, we characterized the amino acid composition of effector domains, their conservation across species and across the human population, and their roles in human diseases. Further, we provide a classification system for effector domains that constitutes a valuable resource and a blueprint for future experimental studies of TF effector domain function.
Introduction
Transcription factors (TFs) play a central role in the regulation of gene expression, and thereby affect diverse biological processes such as cell differentiation and de-differentiation (Takahashi et al., 2007; Tapscott et al., 1988), development (Davidson and Erwin, 2006), and immune regulation (Carrasco Pro et al., 2018; Santoso et al., 2020). Most TFs contain two main types of protein domains to accomplish their functions: DNA-binding domains (DBDs) and effector domains (Frankel and Kim, 1991; Lambert et al., 2018; Vaquerizas et al., 2009). DBDs direct TFs to their target genomic regulatory regions by recognizing specific DNA sequences. DBDs are well-conserved structural classes and are often used to classify TFs into families. For example, the current list of 1,639 human TFs is classified into 25 DBD families, the largest of which are zinc fingers Cys2His2 (ZF-C2H2) and homeodomains (Lambert et al., 2018). Alternatively, effector domains can activate or repress target gene expression through several mechanisms such as interactions with cofactors, enzymes, and mediator, leading to histone modifications, changes in DNA methylation states, and recruitment of RNA Pol II (Frietze and Farnham, 2011; Reiter et al., 2017) (Figure 1A). Broadly, we can classify these effector domains as activator domains (AD), also known as trans-activator domains, repressor domains (RD), and bifunctional (Bif) domains (i.e., those that can activate or repress gene expression depending on the cellular and chromatin contexts).
Figure 1. Effector domain identification, characterization, and function.
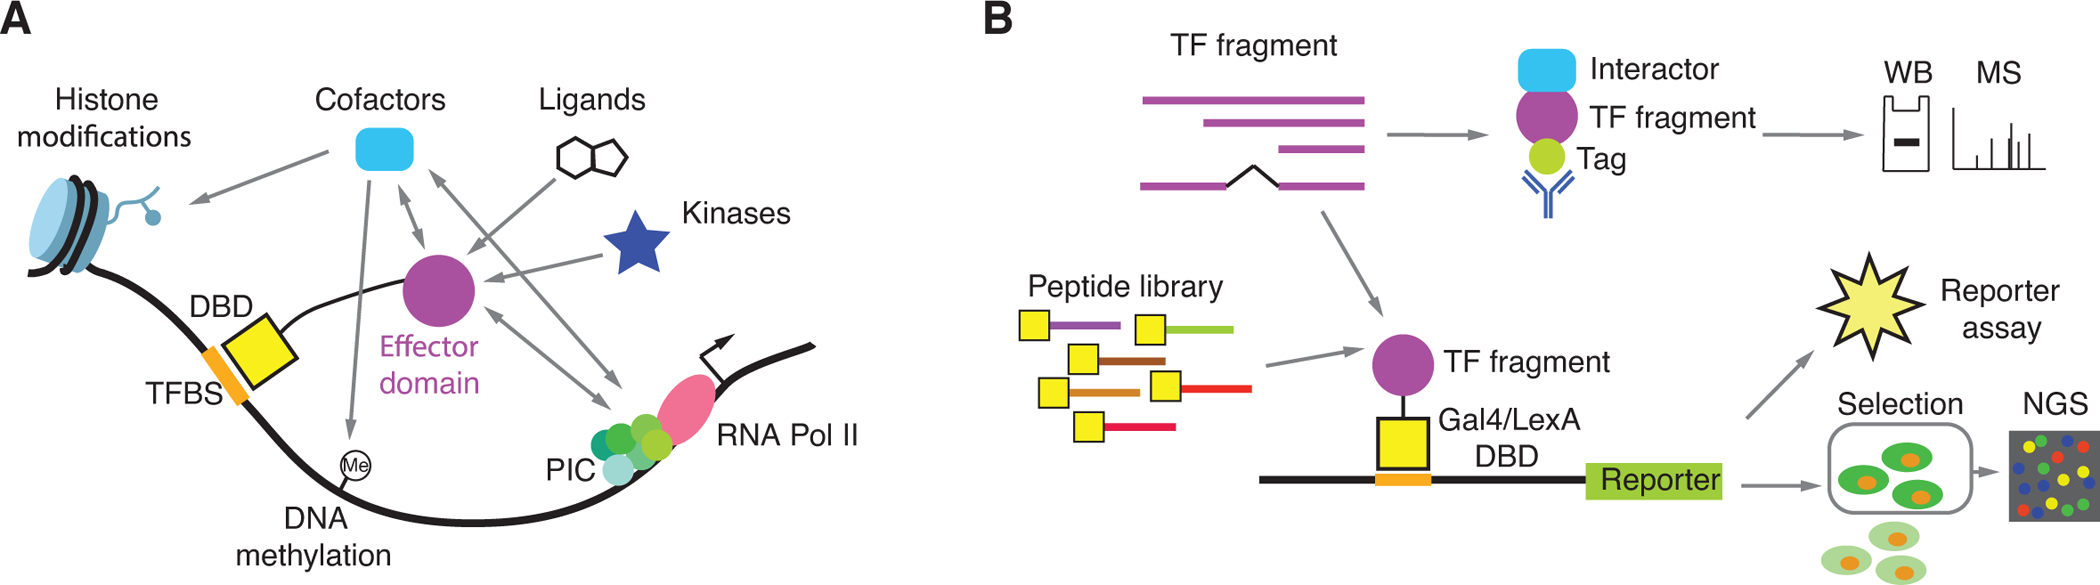
(A) Effector domains can affect gene expression by interacting with cofactors and the preinitiation complex, by directly modifying histone tails, and by leading to changes in DNA methylation states. The activity of some effector domains can be affected by interactions with ligands or by post-translational modifications.
(B) Experimental approaches to identify and characterize effector domains. TF fragments or pool peptide libraries comprised of tilling, random, or mutated peptides are fused to an exogenous DBD (e.g., Gal4, Gcn4, LexA, or rTetR DBDs). Transcriptional activity is often measure using a reporter gene. In the case of high-throughput peptide screens cells with different levels of reporter activity are sorted and the enrichment for sequence coding each peptide is determined by next generation sequencing (NGS).
While there are multiple resources and annotations of TF DBDs, there are currently no comprehensive annotations of TF effector domains. This is because effector domains are generally less conserved across paralogs and orthologs than DBDs and often do not have well-defined structures, rendering predictions based on sequence or structure largely ineffective (Staller et al., 2018). Therefore, effector domains have mostly been identified by deletion experiments, and their annotation is scattered across the literature.
The transcriptional regulation field has made substantial contributions to our understanding of the molecular mechanisms of gene expression and the role of effector domains in the recruitment of the preinitiation complex, chromatin organization, cofactor recruitment, RNA Pol II regulation, and DNA methylation (Roeder, 2019). Given the extensive and important research by thousands of scientists in this field, the goal of this manuscript is not to offer a historical perspective on these key contributions, but rather to synthesize the currently available information and provide a novel resource to obtain a big-picture comparative perspective on TF effector domains.
Here, we review more than three decades of literature to manually annotate 924 effector domains across 594 human TFs. We use this resource to characterize effector domains and their amino acid composition, sequence conservation, and roles in human diseases. In addition, we implement a web server annotating the known effector domains, as well as to predict effector domains across paralogs and within TF isoforms. Collectively, our data and analyses provide a novel and important resource for future studies of TF effector domains.
Methods to identify and characterize effector domains
The ability of effector domains to modulate transcriptional activity has been mapped and characterized using different experimental approaches (Figure 1B and Table S1). Most of these approaches require recruiting either a full-length TF or a TF fragment to a transcriptional control region, followed by quantifying the transcriptional activity of a downstream target gene. Recruitment of the TF can be achieved using the intrinsic DBD of the TF and a promoter region known to bind the TF (Han et al., 2020; Ma and Ptashne, 1987; Roose et al., 1998). The target gene can either be an endogenous target gene whose expression can be measured by RT-qPCR, or a reporter gene measured by enzymatic activity (e.g., luciferase, chloramphenicol acetyltransferase, or β-galactosidase) (Ma and Ptashne, 1987; Meijer et al., 1992; Roose et al., 1998). These experiments involve protein deletions to identify the amino acid sequences that are necessary for activating or repressing transcription (i.e., if the regions is removed the transcriptional effect is totally or partially lost). However, these assays rarely demonstrate that these sequences, on their own, are sufficient to elicit their transcriptional effect. To show sufficiency, complementary reporter assays are used in which TF fragments are fused to DBDs from heterologous TFs that have well-characterized DNA-binding sites, such as the yeast Gal4 and the bacterial LexA (Braun et al., 1990; Brent and Ptashne, 1985; Hope and Struhl, 1986). This allows for recruitment of TF fragments of any size to test their effect on reporter gene expression. Moreover, these experiments are not compromised by effects that deletions in the native TF may have on its ability to bind its natural DNA binding sites. To avoid mapping regions that affect the overall function of the TF (i.e., necessary but not sufficient) or regions that are active in a heterologous context but not within the TF sequence (i.e., sufficient but not necessary), both types of experiments showing necessity and sufficiency are recommended.
Most of the assays listed above are low-throughput, in particular protein deletion experiments, as they require custom-designed sequences for each TF tested. In addition, studies of different TFs may require different cell types expressing the appropriate cofactors, and varying experimental conditions such as different ligands and stimuli (Figure 1A). Recently, exogenous DBD or dCas9 fusion experiments have been adapted for high-throughput transcriptional activity screens using libraries coding for thousands of peptide sequences (Figure 1B). These peptide libraries can include fragments of protein-coding genes (including TFs), comprehensive mutagenesis of selected peptide sequences to identify key amino acids within the peptides involved in transcriptional activity, or random peptides to screen for activating and repressive functions (Alerasool N., 2021; Arnold et al., 2018; Erijman et al., 2020; Ravarani et al., 2018; Staller et al., 2018; Tycko et al., 2020). In these experiments, the reporter used allows for the separation of cells harboring a transcriptionally active (or repressive) DBD-peptide fusion within a pool (e.g., GFP reporter using fluorescence-activated cell sorting, or a surface marker using magnetic separation), followed by sequencing of the enriched peptide sequences.
Additionally, protein-protein interaction (PPI) studies have provided indirect evidence of transcriptional regulatory activity by identifying TF fragments that interact with cofactors or other proteins that modulate transcription (Figure 1B). For example, pull-down assays have been extensively used to identify interactions of effector domains with cofactors and chromatin remodeling complexes (Giraud et al., 2002; Neely et al., 1999; Xu et al., 2018). When integrated with reporter studies, these PPIs can provide a mechanism for observed transcriptional effects.
Few computational approaches have been developed to predict TF effector domains. This is mainly because there are no comprehensive databases annotating experimentally determined effector domains, and because effector domains are poorly conserved across species and paralogs. Effector domains are thus relatively difficult to predict from amino acid sequence compared to DBDs (Mistry et al., 2021). 9aaTAD is a predictor based on different experimentally determined 9-mer ADs; however, this tool is limited to short ADs (Piskacek et al., 2007). Since sequence alignment proved to be of limited use to predict ADs, novel machine learning predictors have been developed. For example, ADpred is a deep learning model that uses the amino acid composition and the secondary structure of known ADs to predict ADs between 9–30 residues (Erijman et al., 2020). PADDLE, a deep convolutional neural network model, uses 53 amino acid tiles and can predict the location of ADs within a TF sequence, its key residues, and its transactivation strength (Sanborn et al., 2021). However, most experimentally determined ADs are longer, as we found from our curation (median = 91 aa). Although this could be associated with unprecise boundary definition for some ADs, many carefully mapped ADs are indeed longer, somewhat limiting the applicability of current computational predictions. Furthermore, to our knowledge, with the exception of KRAB and POZ/BTB domains, there are currently no predictors developed for repression domains. Therefore, there is a need for improved computational approaches to predict effector domains which will be in part driven by new large-scale experimental datasets.
A census of human TF effector domains
To generate a large-scale resource of experimentally validated effector domains, we searched for effector domain evidence across the literature for the 1,639 annotated human TFs. We manually curated and extracted experimental evidence for 924 effector domains from 594 TFs (Figure 2A and Table S2). Of these, only 94 effector domains belonging to 79 TFs were reported in the Pfam domain database (mostly corresponding to KRAB and BTB/POZ domains), illustrating the lack of structural classification for most effector domains (Mistry et al., 2021). We implemented a webtool named TFRegDB (https://tfregdb.bu.edu/tfregdb/) annotating available information about human TF effector domains, including amino acid sequence, coordinates in different isoforms, experimental methods used to determine the effector domains, whether they are necessary or sufficient for transcriptional activity, a confidence score, and links to supporting evidence. We also implemented a BLAST search functionality where a query sequence can be submitted to detect effector domains in TF isoforms or to predict effector domains based on amino acid sequence similarity.
Figure 2. Distribution of effector domains.
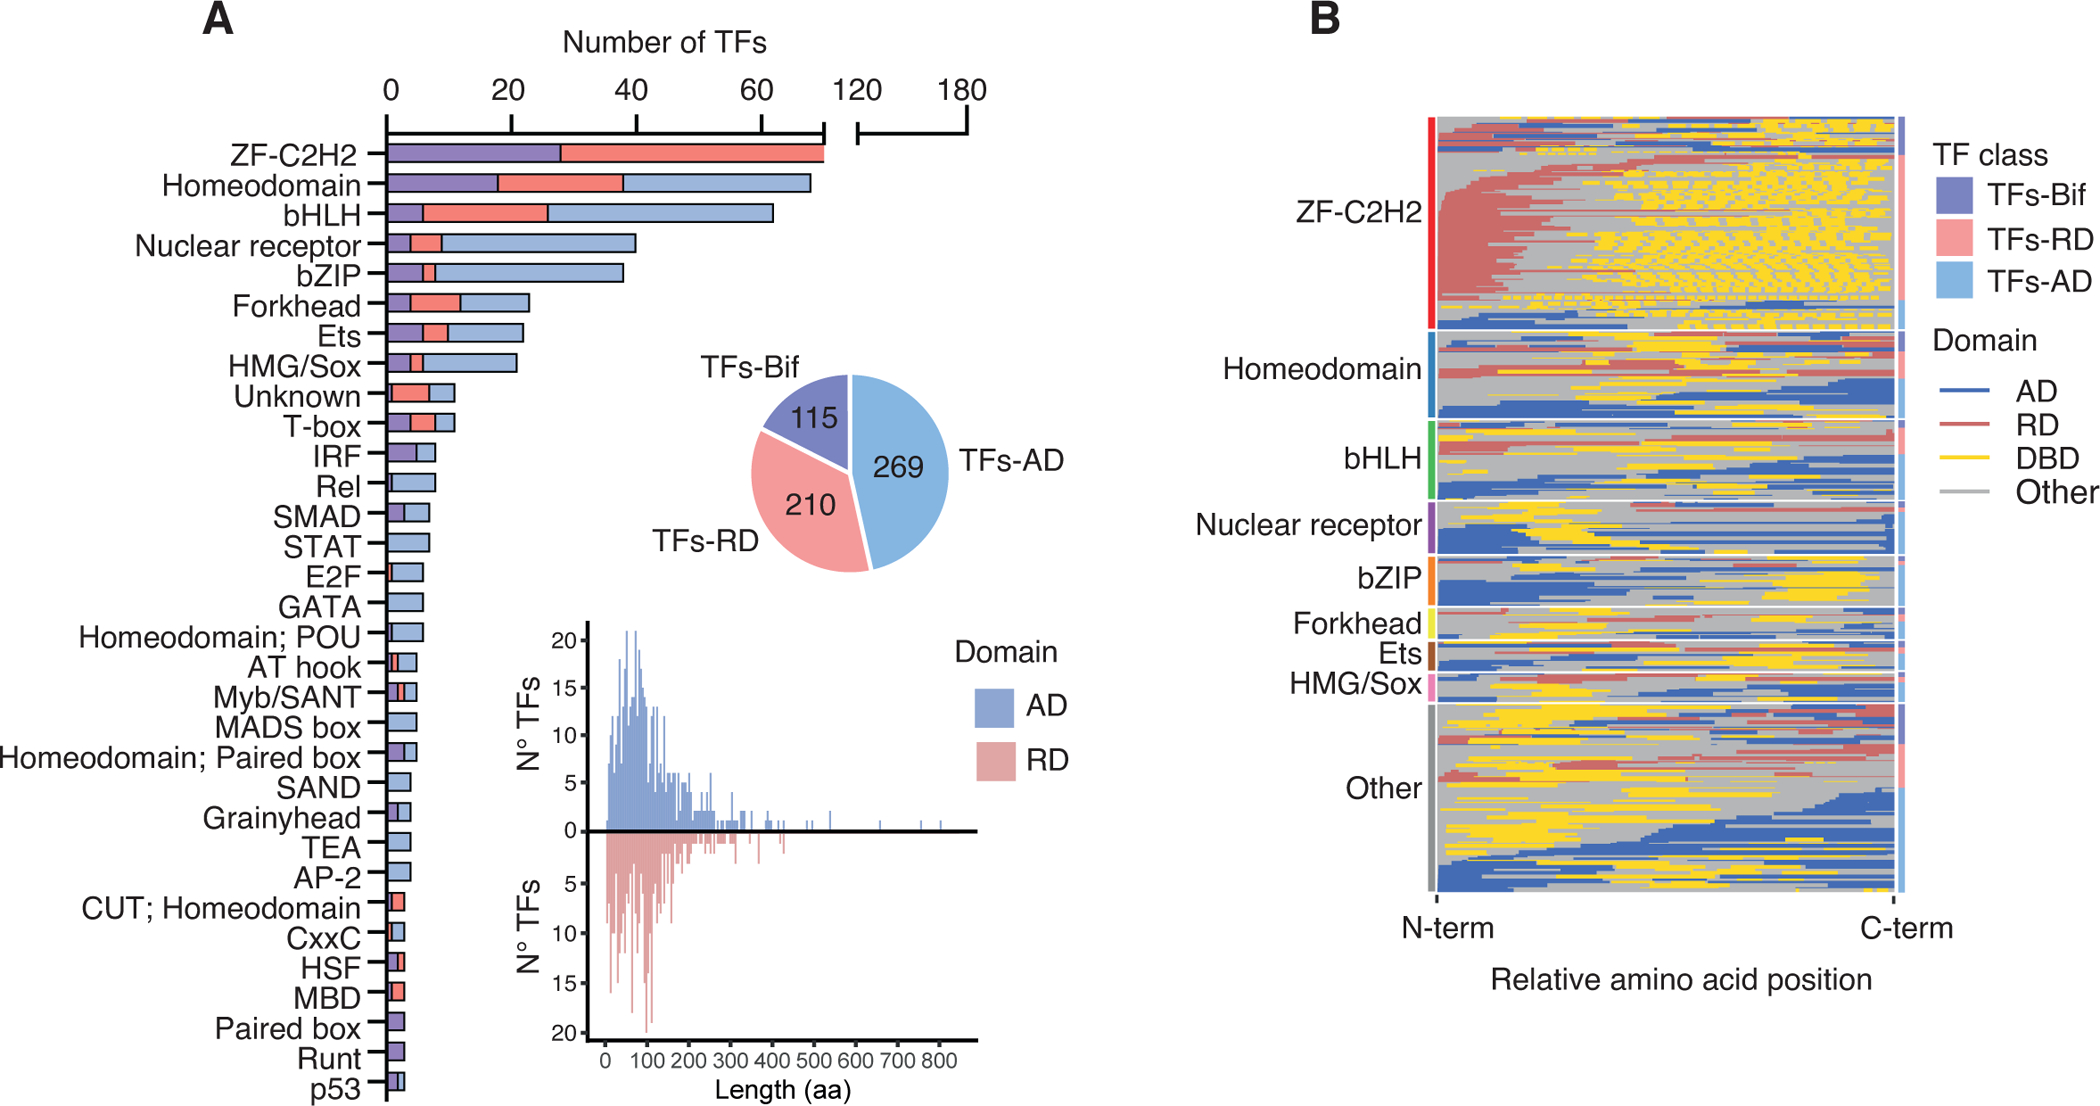
(A) Number of TFs per family with annotated effector domains classified as TFs-AD (if they only have ADs annotated), TFs-RD (if the only have RDs annotated), and TFs-Bif (if they have both ADs and RDs or bifunctional domains annotated). Only TF families with 3 or more annotated TFs are included. The pie chart indicates the number of TFs in each class. The histogram indicates the amino acid length distribution for ADs (blue) and RDs (red).
(B) Relative position of ADs, RDs and DBDs within the TF amino acid sequence (from N- to C-termini). TF families are indicated by the left bars. Within each family TFs are sorted based on whether they are classified as TFs-Bif, TFs-RD, or TFs-AD (indicated by the right bars). Within each class, TFs are sorted by the relative position of the effector domain in the TF sequence.
See also Figure S1.
We annotated effector domains in all major families of TFs including ZF-C2H2 (170 TFs), homeodomains (68 TFs), and bHLHs (62 TFs) (Figure 2A). Of the 594 TFs in our database, 40% have two or more effector domains annotated (Table S2). Based on the effector domain activity, TFs can be classified into three groups: those that contain only ADs (269 “TFs-AD”), those that have only RDs (210 “TFs-RD”), and those with both effector domain types (115 “TFs-Bif”). As expected, most ZF-C2H2 are TFs-RD as many of these TFs contain the well characterized KRAB and BTB/POZ domains involved in transcriptional repression (Collins et al., 2001). Conversely, most TFs in the bHLH, nuclear receptor and homeodomain families are classified as TFs-AD (Figures 2A and S1A). However, many of these TFs, such as nuclear receptors, may switch from repression to activation upon interaction with ligands, while the activities of others are affected by post-translational modifications. Indeed, the classification into TFs-AD, TFs-RD, and TFs-Bif is solely based on reported effector domain activity in the conditions tested. Therefore, many of these TFs could be bifunctional in other conditions, or if other amino acid regions of the TF are considered.
Reported effector domain sizes range from 4 to 1,248 amino acids, with a median of 91 amino acids (Figure 2A). Although some of these differences are likely due to varying mechanisms of action, in many cases size differences likely arise from variation in the stringency of the deletion experiments used to identify the effector domains. Overall, we found that 30% of the effector domains were located at the N-terminus, 28% at the C-terminus, and 42% in internal regions within the TF amino acid sequence (Figure 2B). However, the positioning of effector domains differs among TF families (Figures 2B and S1B). To illustrate, repressor domains in ZF-C2H2 predominantly reside at the N-termini, while activation domains in bZIP and HMG/Sox families mainly reside at the N- and C-termini, respectively. This suggests that alternative splicing, transcription starts, and polyadenylation sites may differentially affect ADs and RDs from different TF families.
Amino acid composition of effector domains
It has been broadly determined that DBDs are enriched in basic amino acids that increase TF affinity for the negatively charged DNA (Lambert et al., 2019) but less is known about the amino acid composition of effector domains from different TF families. Since Paul Sigler proposed in 1988 the “Acid Blob and Negative Model” positing that acidic ADs interact with RNA polymerase electrostatically (Sigler, 1988), significant progress has been made in characterizing the amino acid composition of the ADs of some TFs, as well as determining the rules for transcriptional activity (Erijman et al., 2020; Sanborn et al., 2021). Seminal studies on yeast TFs reported that ADs are acidic, disordered, and hydrophobic (Drysdale et al., 1995; Hope and Struhl, 1986; Ravarani et al., 2018; Staller et al., 2018). However, predictions suggest that ADs of human TFs are not as highly enriched in acidic amino acids as yeast ADs (Erijman et al., 2020). For example, HOXA13 and ONECUT1 have basic ADs enriched in lysine/arginine, and histidine, respectively (Table S2), consistent with the identification of basic ADs in high-throughput screens (Arnold et al., 2018). Further, although acidity may be important for some human ADs, acidity is not sufficient to predict AD function, as appropriate levels of hydrophobicity and disorder are also required (Staller et al., 2018; Tycko et al., 2020). A current model, known as the Exposure Model, indicates that acidic residues that surround hydrophobic motifs are necessary to repel each other, promoting interaction between exposed hydrophobic residues with positively charged cofactors (Ferreira et al., 2005; Hermann et al., 2001; Staller et al., 2018; Warfield et al., 2014). These contacts between hydrophobic residues may mediate high-affinity PPIs via the hydrophobic effect (Levy and Onuchic, 2006). This model was initially proposed based on ADs from yeast TFs, and recently supported by mutational studies in five human TFs (Staller et al., 2018; Staller MV, 2021). Whether these models extend to other human ADs and RDs remains to be determined.
To establish whether the reported sequence characteristics are present in most of the annotated effector domains, we evaluated the acidity, hydrophobicity, and disorder of ADs and RDs of TFs from different families. We confirmed that ADs and RDs are more acidic than DBDs and found that globally, ADs are statistically more acidic than RDs (p-value < 2.2 × 10⁻¹⁶, Wilcoxon test) (Figures 3A and 3B). Interestingly, not all TF families show the same level of acidity in their effector domains, which could be partially driven by sequence homology between paralogs. For example, homeodomain ADs are less acidic than ADs from other families, while RDs in ZF-C2H2 are the most acidic among the RDs. Further, there are marked differences even within families (e.g., the HES1–7 bHLH subfamily has more basic RDs than other bHLHs) (Figure 3B). We also found that both ADs and RDs are more hydrophobic than DBDs (Figures 3A and 3B). Although no specific hydrophobic enrichment was observed for any TF family, in bHLH, the RDs of the HES1–7 subfamily are more hydrophobic than RDs from other families. Most TF effector domains are highly acidic and hydrophobic; however, there are some TFs whose effector domains are basic and highly hydrophobic (HES TF subfamily) or acidic but lowly hydrophobic (e.g., HOXB7 and HMGA1).
Figure 3. Sequence features of effector domains.
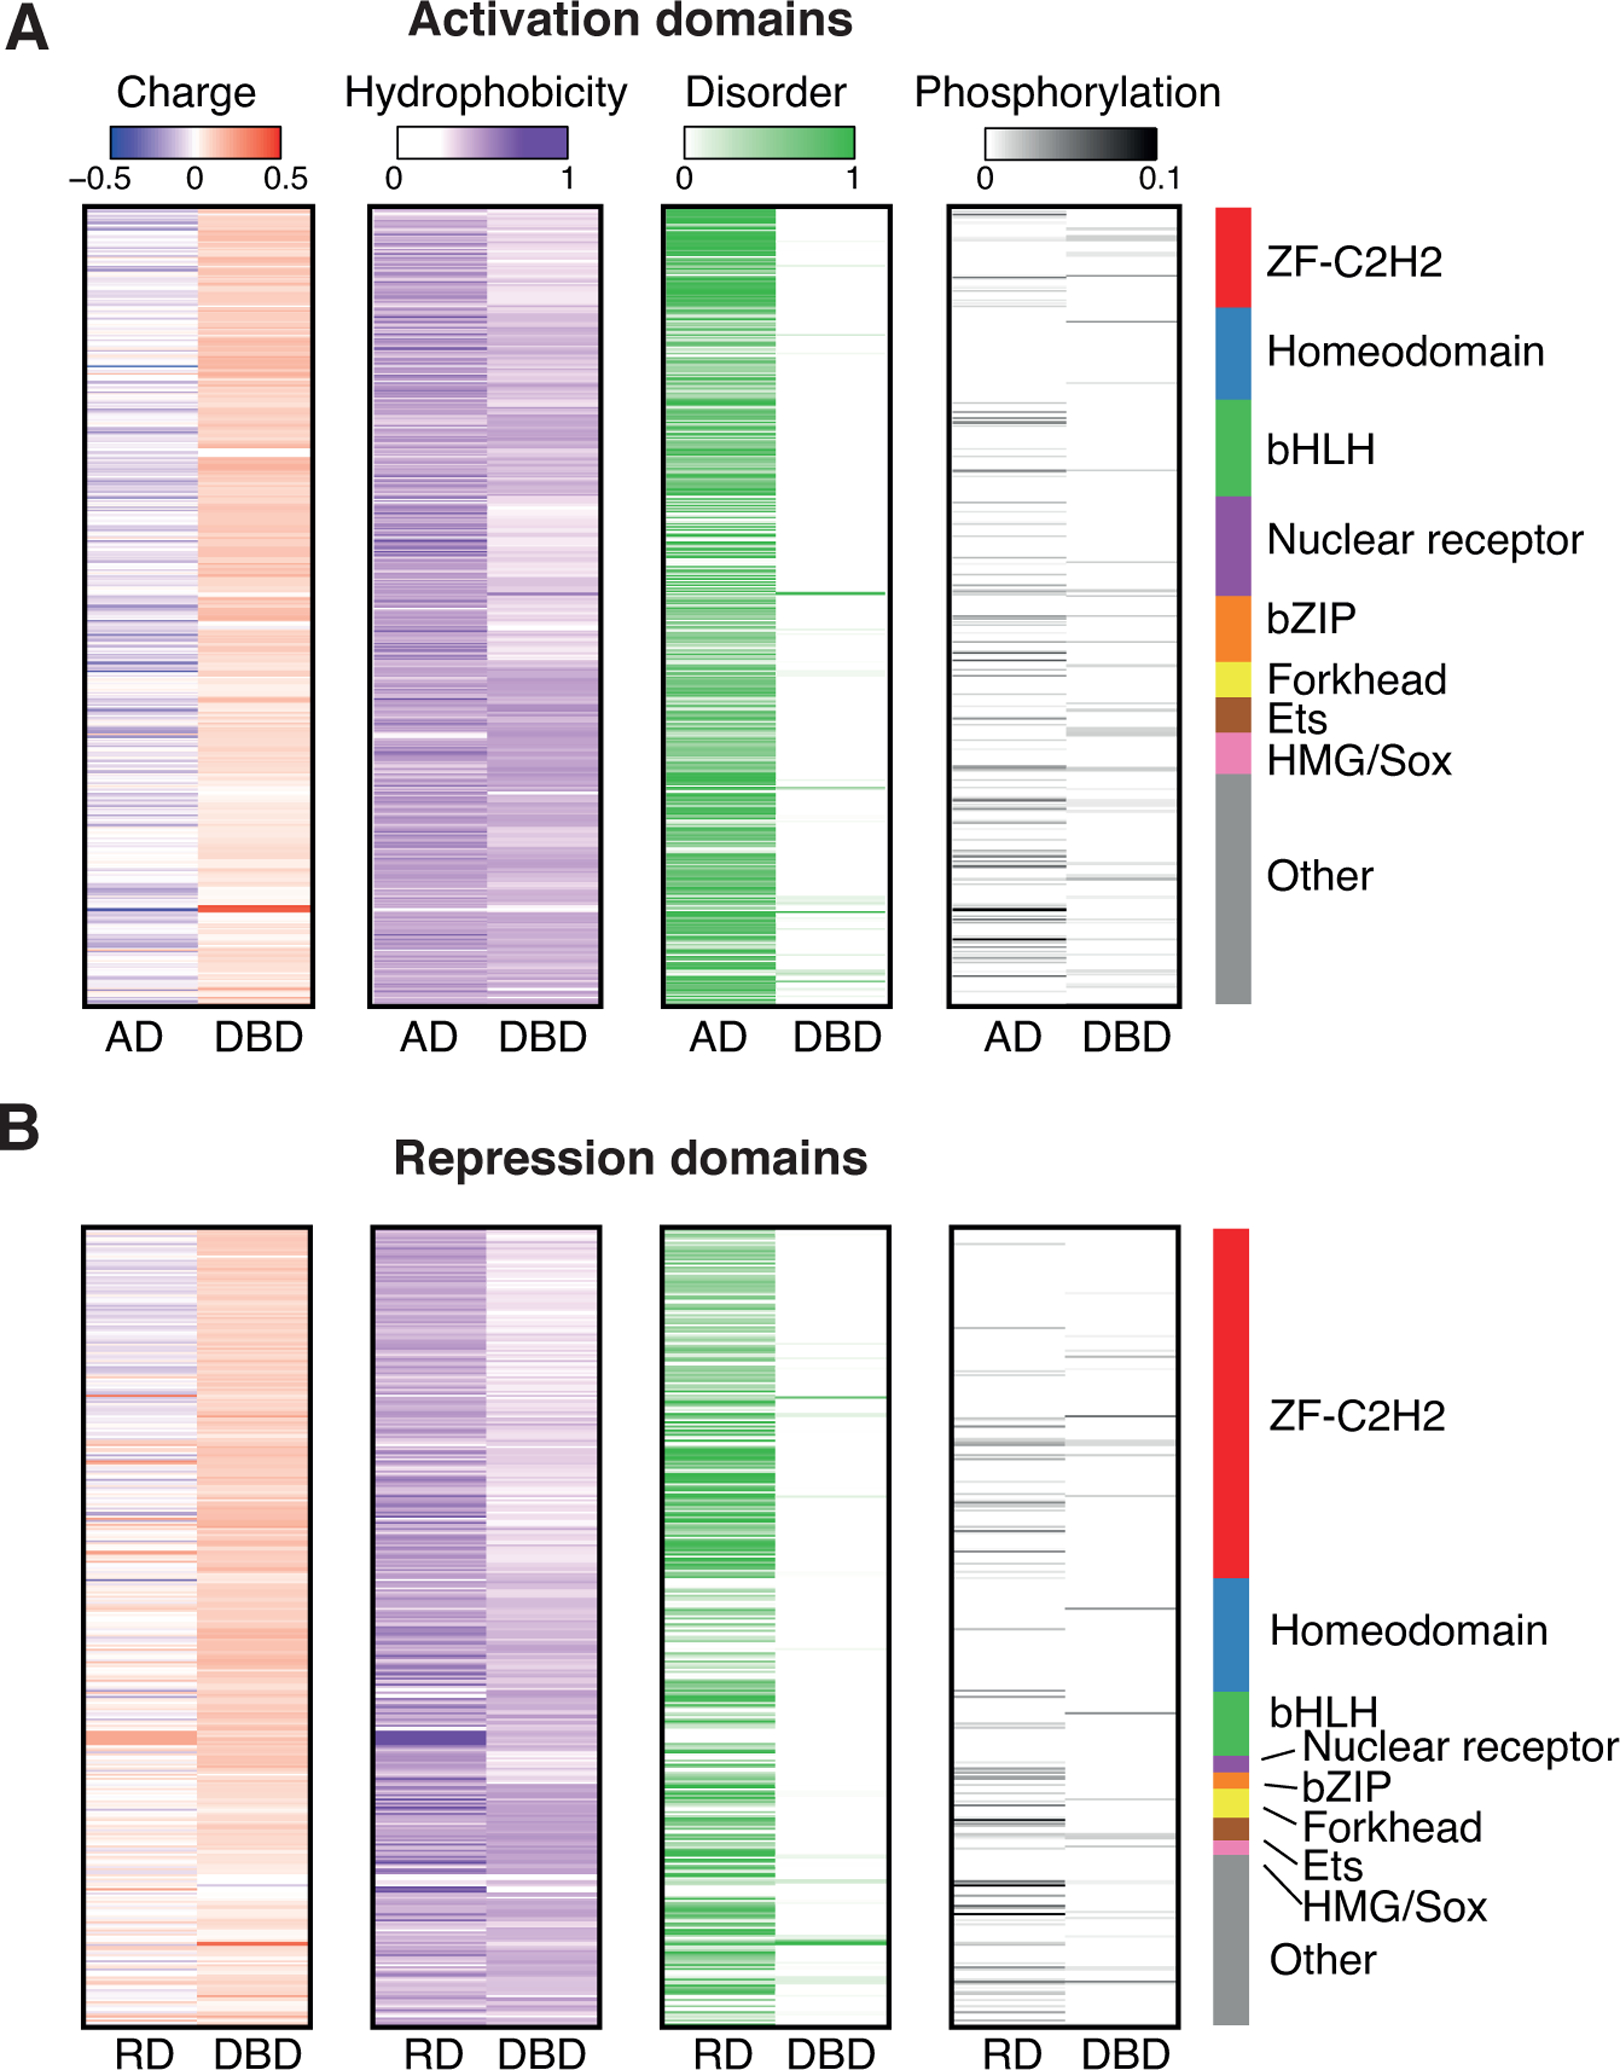
(A-B) For each activation domain (A) and repression domain (B) the charge density (charge / amino acid length), hydrophobicity, disorder (determined using AlphaFold), and phosphorylation density (number of phosphorylation events / amino acid length) are indicated.
See also Figures S2 and S3.
Several studies of individual TFs have shown that effector domains are enriched in disordered regions (Liu et al., 2006; Oldfield and Dunker, 2014). Disordered regions have been associated with the occurrence of PPIs, as their flexibility allows disordered regions to bind multiple structurally diverse protein partners (Oldfield and Dunker, 2014). This disorder allows effector domains to assume different conformations when bound to cofactors, facilitating the dynamic exposure of hydrophobic motifs (Dyson and Wright, 2016; Staby et al., 2017; Warfield et al., 2014). For example, the disordered ADs of TP53, HIF1A, REL, STAT, and other TFs interact with well-structured domains of co-activators, such as CREBBP and EP300 (Dyson and Wright, 2016). Using AlphaFold (Jumper et al., 2021), we found that disorder is a property shared by both ADs and RDs (Figures 3A and 3B). ADs are significantly more disordered than RDs (p value = 1.9 × 10⁻¹¹, Wilcoxon test), and both are more disordered than DBD across all major TF families (p value < 2.2 × 10⁻¹⁶, Wilcoxon test) (Figures 3A and 3B). This disorder in effector domains is a shared feature across all major TF families. Nevertheless, we observed a large variability within TF families, with some effector domains being 100% disordered (e.g., the ADs of SP1 and SP3), while others are highly ordered (e.g., the RDs of MXI1 and MNT which are alpha helixes).
Short linear motifs (SliMs), which are involved in PPIs and are generally enriched in hydrophobic amino acids, could be more important than overall high levels of hydrophobicity (Tompa et al., 2014). Many examples of SliMs have been reported in non-human effector domains, but few cases have been studied in human effector domains (Dinkel et al., 2014). Generally, it has been shown that disordered structures facilitate the interaction mediated by these SliMs (Staller et al., 2018), but more in-depth studies are needed to determine their role across TF families.
In addition to general charge, hydrophobicity, and disorder features, many effector domains, ADs in particular, have been shown to display amino acid compositional bias (Figure S2A). For example, many ADs across TF families are enriched in proline, serine, glutamine, glycine, and alanine, as has been previously described (Gerber et al., 1994; Husberg et al., 2001; Meijer et al., 1992; Paulsen et al., 1992; Pei and Shih, 1991; Raney et al., 1991). Although there is also a compositional bias for some RDs, in particular those enriched in proline and serine, these are less frequent than for ADs (Figure S2B). These enriched amino acids are generally present in the effector domains of TFs from many different families.
Post-translational modifications (PTMs) are known to regulate TF functions by affecting PPIs, cellular localization, and ultimately, their regulatory activity. Further, the dysregulation of TF PTMs has been associated with several pathological conditions (Filtz et al., 2014; Qian et al., 2020; Tootle and Rebay, 2005). In particular, phosphorylation is known to play a significant role in the activation of many TFs and their interaction with cofactors and other protein complexes (Filtz et al., 2014). Phosphorylation introduces negative charges, thus changing charge and solubility properties of effector domains. As negative charges spaced between hydrophobic residues help keep domains exposed to solvent, phosphorylation may act as a switch changing the ability of ADs and RDs to interact with other proteins and cofactors. This is the case of IRF5 and IRF3 whose phosphorylation stimulates dimerization and interaction with the co-activators CREBBP/EP300 (Chen et al., 2008), while phosphorylation of ELK1 promotes mediator recruitment to promoter sequences (Cantin et al., 2003). Similarly, phosphorylation in the ADs of TP53 were reported to increase the binding to different domains of EP300 and reduce binding to the negative regulator Mdm2 (Teufel et al., 2009). Since most of these studies were performed on specific TFs or functional domains, we used PhosphoSitePlus (Hornbeck et al., 2019), a curated phosphorylation site database, to analyze the frequency of phosphorylation events in effector domains and DBDs. Across most major TF families, we found that effector domains are more highly phosphorylated than DBDs (Figures 3A and 3B), even when normalizing by the frequency of serines, threonines, and tyrosines (Figures S2C and S2D). Our analysis suggests that 21% of effector domains may be regulated by phosphorylation. This is likely an underestimate as some effector domains may be phosphorylated in conditions not yet tested. Except for a few cases, the overall role of other PTMs in effector domain regulation remains to be determined.
Role of effector domains in liquid-liquid phase separation
Recent evidence suggests that TF effector domains contribute to gene regulation by facilitating liquid-liquid phase separation (LLPS), during which chromatin-bound TFs, coregulators, and other transcription machinery form dynamic condensates within the nucleus (Boija et al., 2018; Hnisz et al., 2017; Sabari et al., 2018; Shrinivas et al., 2019). Forming these distinct transcription “factories” is thought to enhance transcriptional efficiency by increasing the effective concentration of required proteins within the crowded milieu of the nucleus. LLPS can be driven by two main types of interactions: 1) specific interactions between folded molecular domains or between folded and unfolded domains, or 2) non-specific interactions between intrinsically disordered low-complexity domains (LCDs) (Chiesa et al., 2020). As many TF effector domains contain LCDs, it is hypothesized that the regulatory functions of these effector domains depend on their ability to participate in LLPS by forming LCD-LCD interactions with coregulators. Boija et al. (Boija et al., 2018) have shown that the TFs OCT4, GCN4, and estrogen receptor form phase-separated condensates with coregulatory protein Mediator, and that the processes of LLPS and transcriptional activation by these TFs require the same key AD residues.
It is important to note that while Boija et al. showed that LLPS induction by OCT4, GCN4, and estrogen receptor requires activation domain residues, others have shown that LCDs are not required for all LLPS events involving TFs (Chiesa et al., 2020). Li et al. (Li et al., 2020) showed that the DBD of mouse TF Sox2, and not the LCDs, are required for incorporation of Sox2 and coactivator Brd4 into transcriptional clusters, suggesting spatial clustering of cis-regulatory elements. Additionally, it has yet to be shown whether transcriptional activation or repression involving effector domains requires the formation of liquid droplets. Chong et al. (Chong et al., 2018) observed that, while TF overexpression resulted in LLPS, expression at physiological concentrations resulted in the formation of LCD-LCD interaction-dependent transcriptionally active protein “hubs” without observable phase separation. This suggests that TF effector domains can exert their transcriptional regulatory functions by forming transcription centers without the requirement for LLPS. However, given that effector domains and LCDs are not synonymous, more work is required to fully understand how activation and repression domains of TFs exert their functions and the involvement of LLPS.
To evaluate whether ADs and RDs are associated with a propensity for phase separation, we first compared the LLPS score between TFs classes using two different phase separation predictors (van Mierlo et al., 2021; Vernon et al., 2018). We found that TFs-AD and TFs-Bif have higher LLPS scores and probabilities than TFs-RD (Figures S3A and S3B), suggesting that ADs may play an important role in the LLPS. Moreover, we observed that 15.8% of ADs contain amino acid contexts predicted to promote LLPS (Vernon et al., 2018), versus 5.5% for RDs and 1.5% for DBDs (Figure S3C). Indeed, ADs with LLPS-promoting amino acid contexts were found in TFs well-known for promoting the formation of phase-separated condensates (e.g. SOX2, POU5F1 and NANOG). Although domains without effector function can also be involved in LLPS, our results suggest that many ADs likely promote LLPS.
Effector domains are preferentially affected in TF proteoforms
TF proteoforms produced by alternative promoters, splicing, and polyadenylation can differ in both DNA binding and effector activity, potentially leading to variation in gene regulatory networks across tissues or pathological conditions (Figure 4A) (Epstein et al., 1994; Foulkes et al., 1991; Kozmik et al., 1993; Lopez, 1995; Venkatanarayan et al., 2015). For example, in silico studies found that alternative splicing in murine TFs preferentially affects DBDs (Taneri et al., 2004). In regard to effector domains, experimental studies on individual TFs found that different proteoforms of mouse Pou2f2 (Stoykova et al., 1992), human PAX8 (Kozmik et al., 1993), and human RUNX1 (Tanaka et al., 1997) have reduced transcriptional activity due to AD loss. Beyond individual examples, how effector domains are affected in different TF proteoforms is not currently known on a TF-wide scale.
Figure 4. Effector domains affected in TF proteoforms.
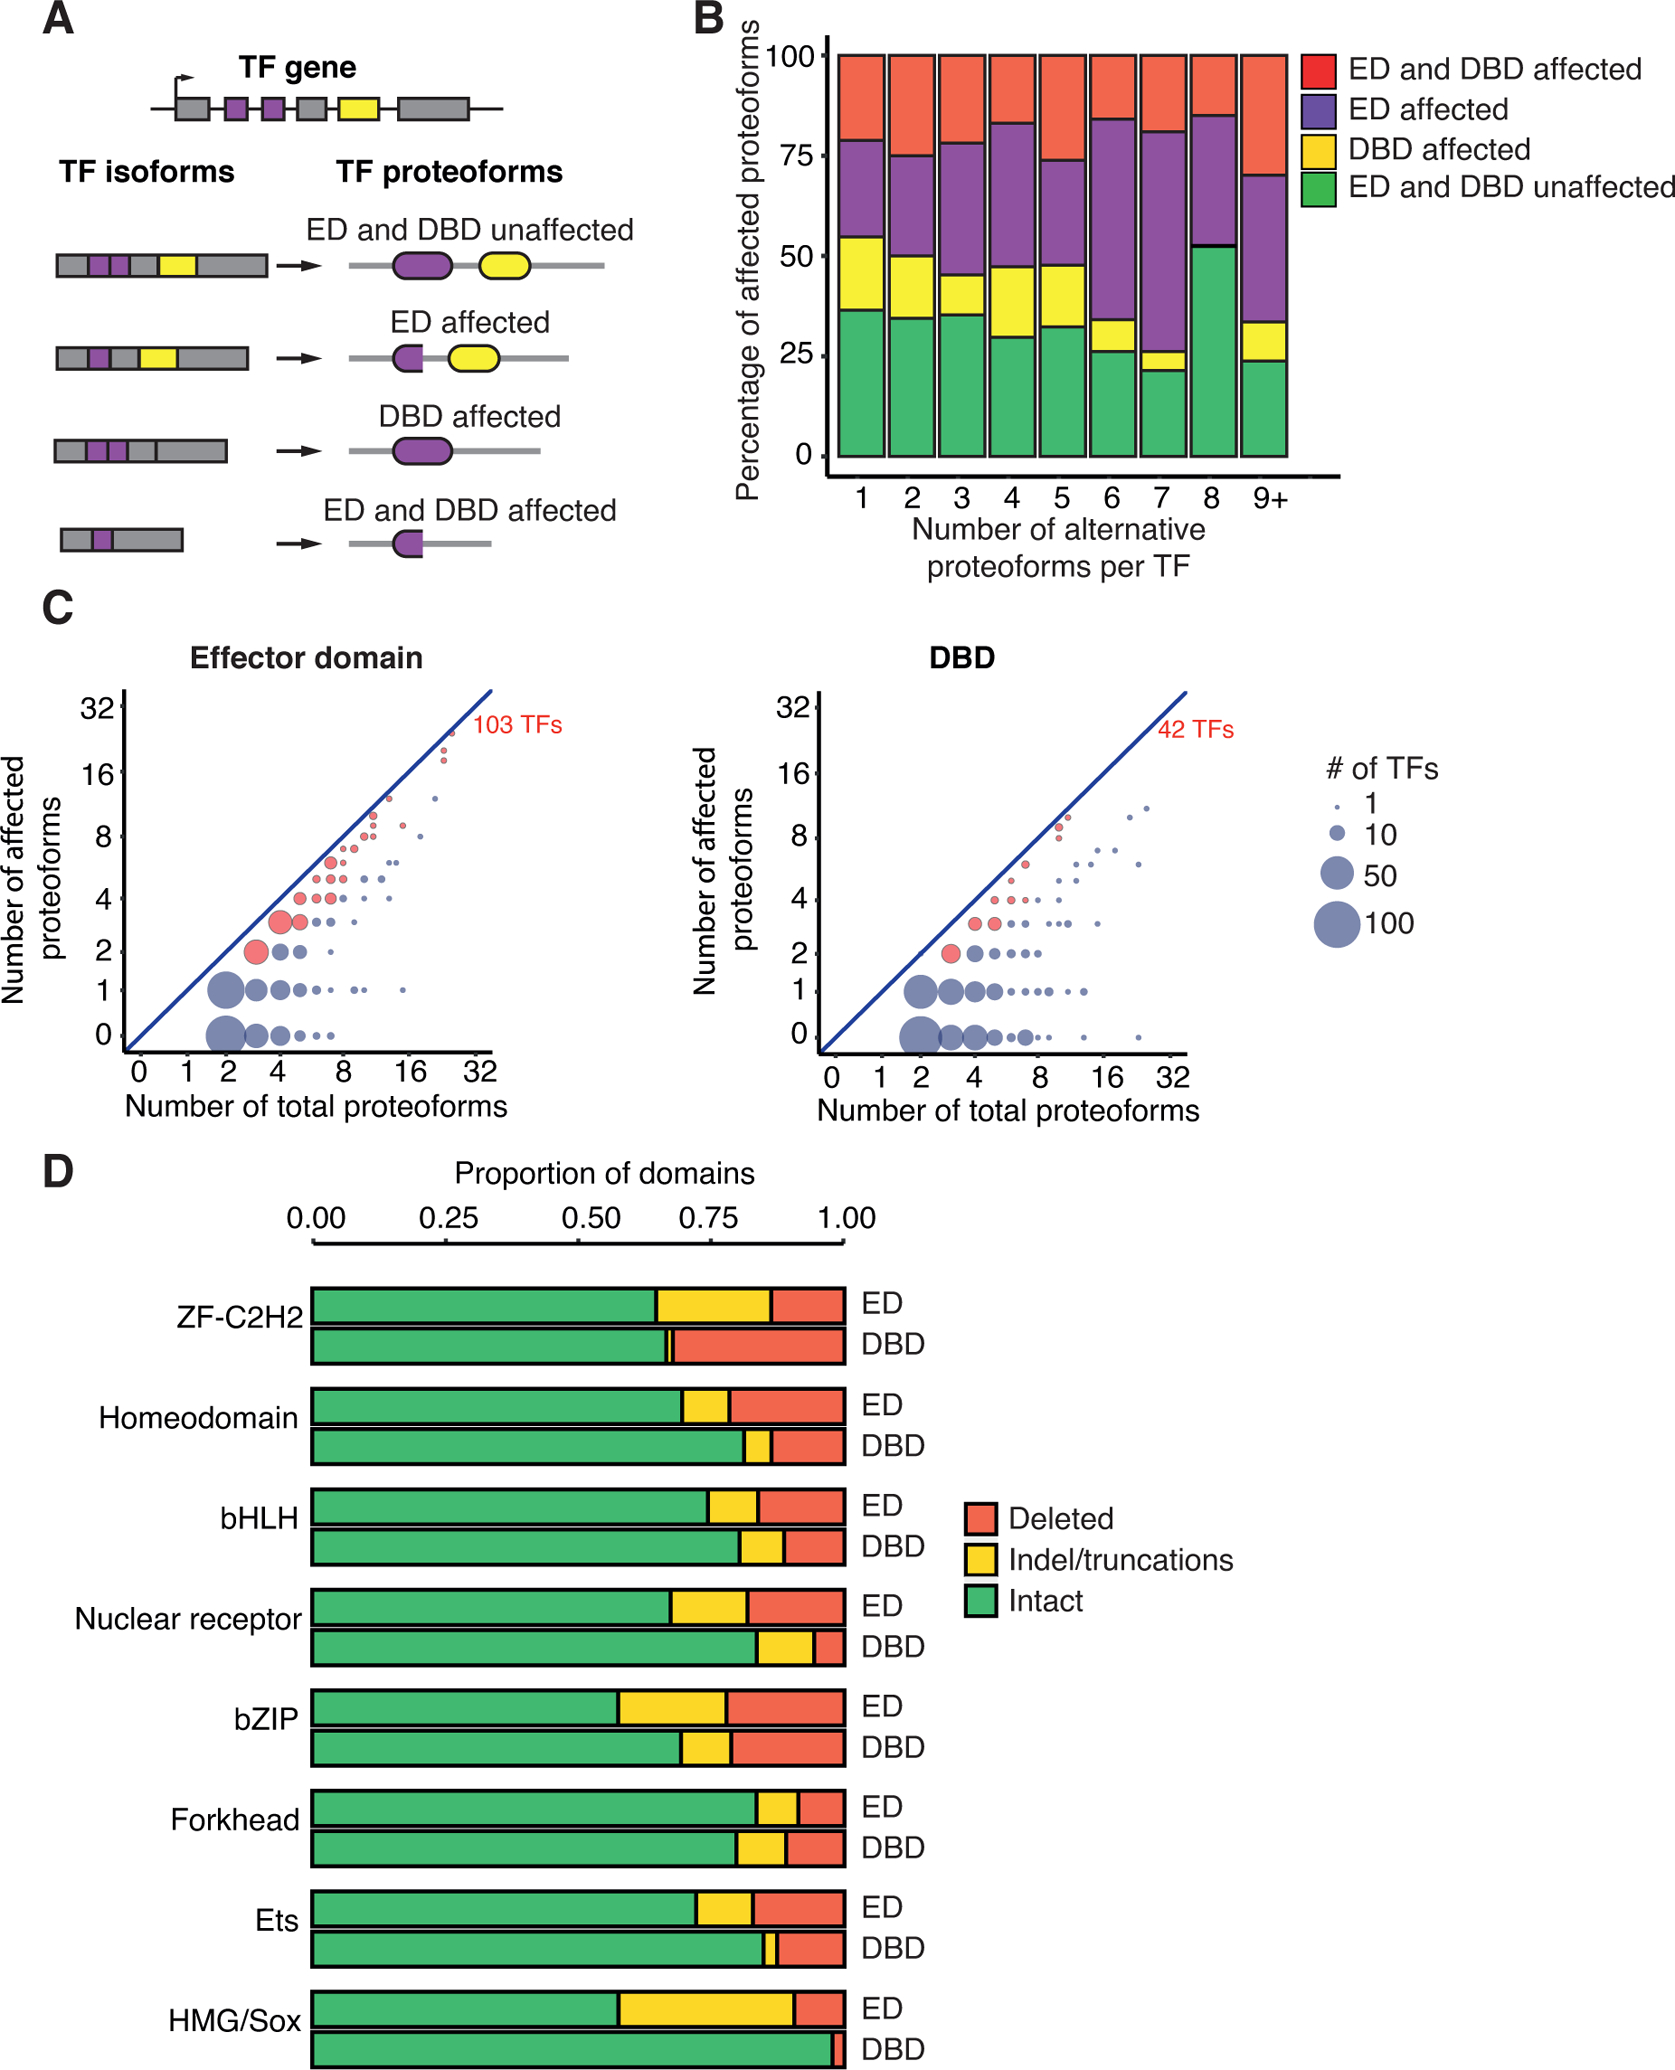
(A) Schematic of different proteoforms with effector domain (ED) affected, DBD affected, or with both domains affected o unaffected. Purple rectangles indicate ED coding exons; yellow rectangles indicate DBD coding exon; purple and yellow ovals indicate the ED and DBD, respectively.
(B) Fraction of proteoforms with effector domain (ED), DBD, or both domains affected. TFs are binned based on the number of alternative proteoforms.
(C) Comparison between the number of proteoforms where the effector domain (left) or the DBD (right) are affected versus the total number of proteoforms of a TF. The size of the circles indicates the number of TFs. Red circles indicate TFs with more that 50% of proteoforms with domain affected domain.
(D) Proportion of effector domains (ED) and DBDs where the domains are intact, have indels, or are deleted across proteofoms for each TF family.
See also Figure S4.
To gain more insight into how effector domains and DBDs are affected in different TF proteoforms, we used a curated TF proteoform database derived from GENCODE v.30 (Frankish et al., 2019). We considered a TF proteoform to be affected if its functional domain (either DBD or effector domain) was fully deleted, had truncations, or had insertions/deletions (indels). We found that effector domains were affected in a higher proportion of proteoforms than DBDs, regardless of the number of proteoforms per TF (Figure 4B) and regardless of domain length (Figure S4). Among the TFs with more than two proteoforms, there were only 42 (10.8 %) TFs with affected DBDs in most of their proteoforms, while for effector domains this was the case for 103 TFs (26.6 %) (p = 1.9 × 10⁻⁸ by proportion comparison test) (Figure 4C). This suggests that transcriptional activity is more frequently affected across proteoforms than DNA binding. Effector domains were more affected by indels, truncations, and full domain deletions than DBDs (p-value = 7.7 10−16, Kolmogorov–Smirnov test) across most major TF families, except for Forkhead and ZF-C2H2 (Figure 4D). In the case of ZF-C2H2, this could be related with the loss of individual zinc fingers in multiple proteoforms. Interestingly, the effector domains of the Forkhead family were the least affected by indels or deletions, while effector domains of bZIP and HMG/Sox TFs were the most affected (Figure 4D). Altogether, we detected widespread variability in effector domains that may contribute to differences in transcriptional activities between proteoforms as shown in multiple examples in the literature. Alternatively, these results may derive from a lower impact of deletions and truncations in effector domains on overall transcriptional activity.
Evolutionary and population-wide divergence of effector domains
While DBDs are highly conserved across multiple species and TF families, anecdotal examples have suggested that effector domains are lowly conserved (Staller et al., 2018). To evaluate effector domain conservation in our resource, we aligned human effector domains across TF orthologs in 27 vertebrate species and found a lower amino acid sequence conservation compared to DBDs across all families (Figure 5A). As expected, both DBDs and effector domains are less conserved as the divergence time increases; however, effector domain conservation diminished more drastically (Figure S5). Although this low conservation can be partially explained by effector domain boundaries being less well determined than DBDs (e.g., we observed that short effector domains are more conserved than long effector domains), it is also likely that effector domains are more plastic than DBDs. Indeed, it has been reported that effector domains can evolve rapidly conferring greater evolutionary, structural, and functional plasticity on the interactome (Sanborn et al., 2021; Tompa et al., 2014; Wang et al., 2012).
Figure 5. Effector domain conservation and association with disease.
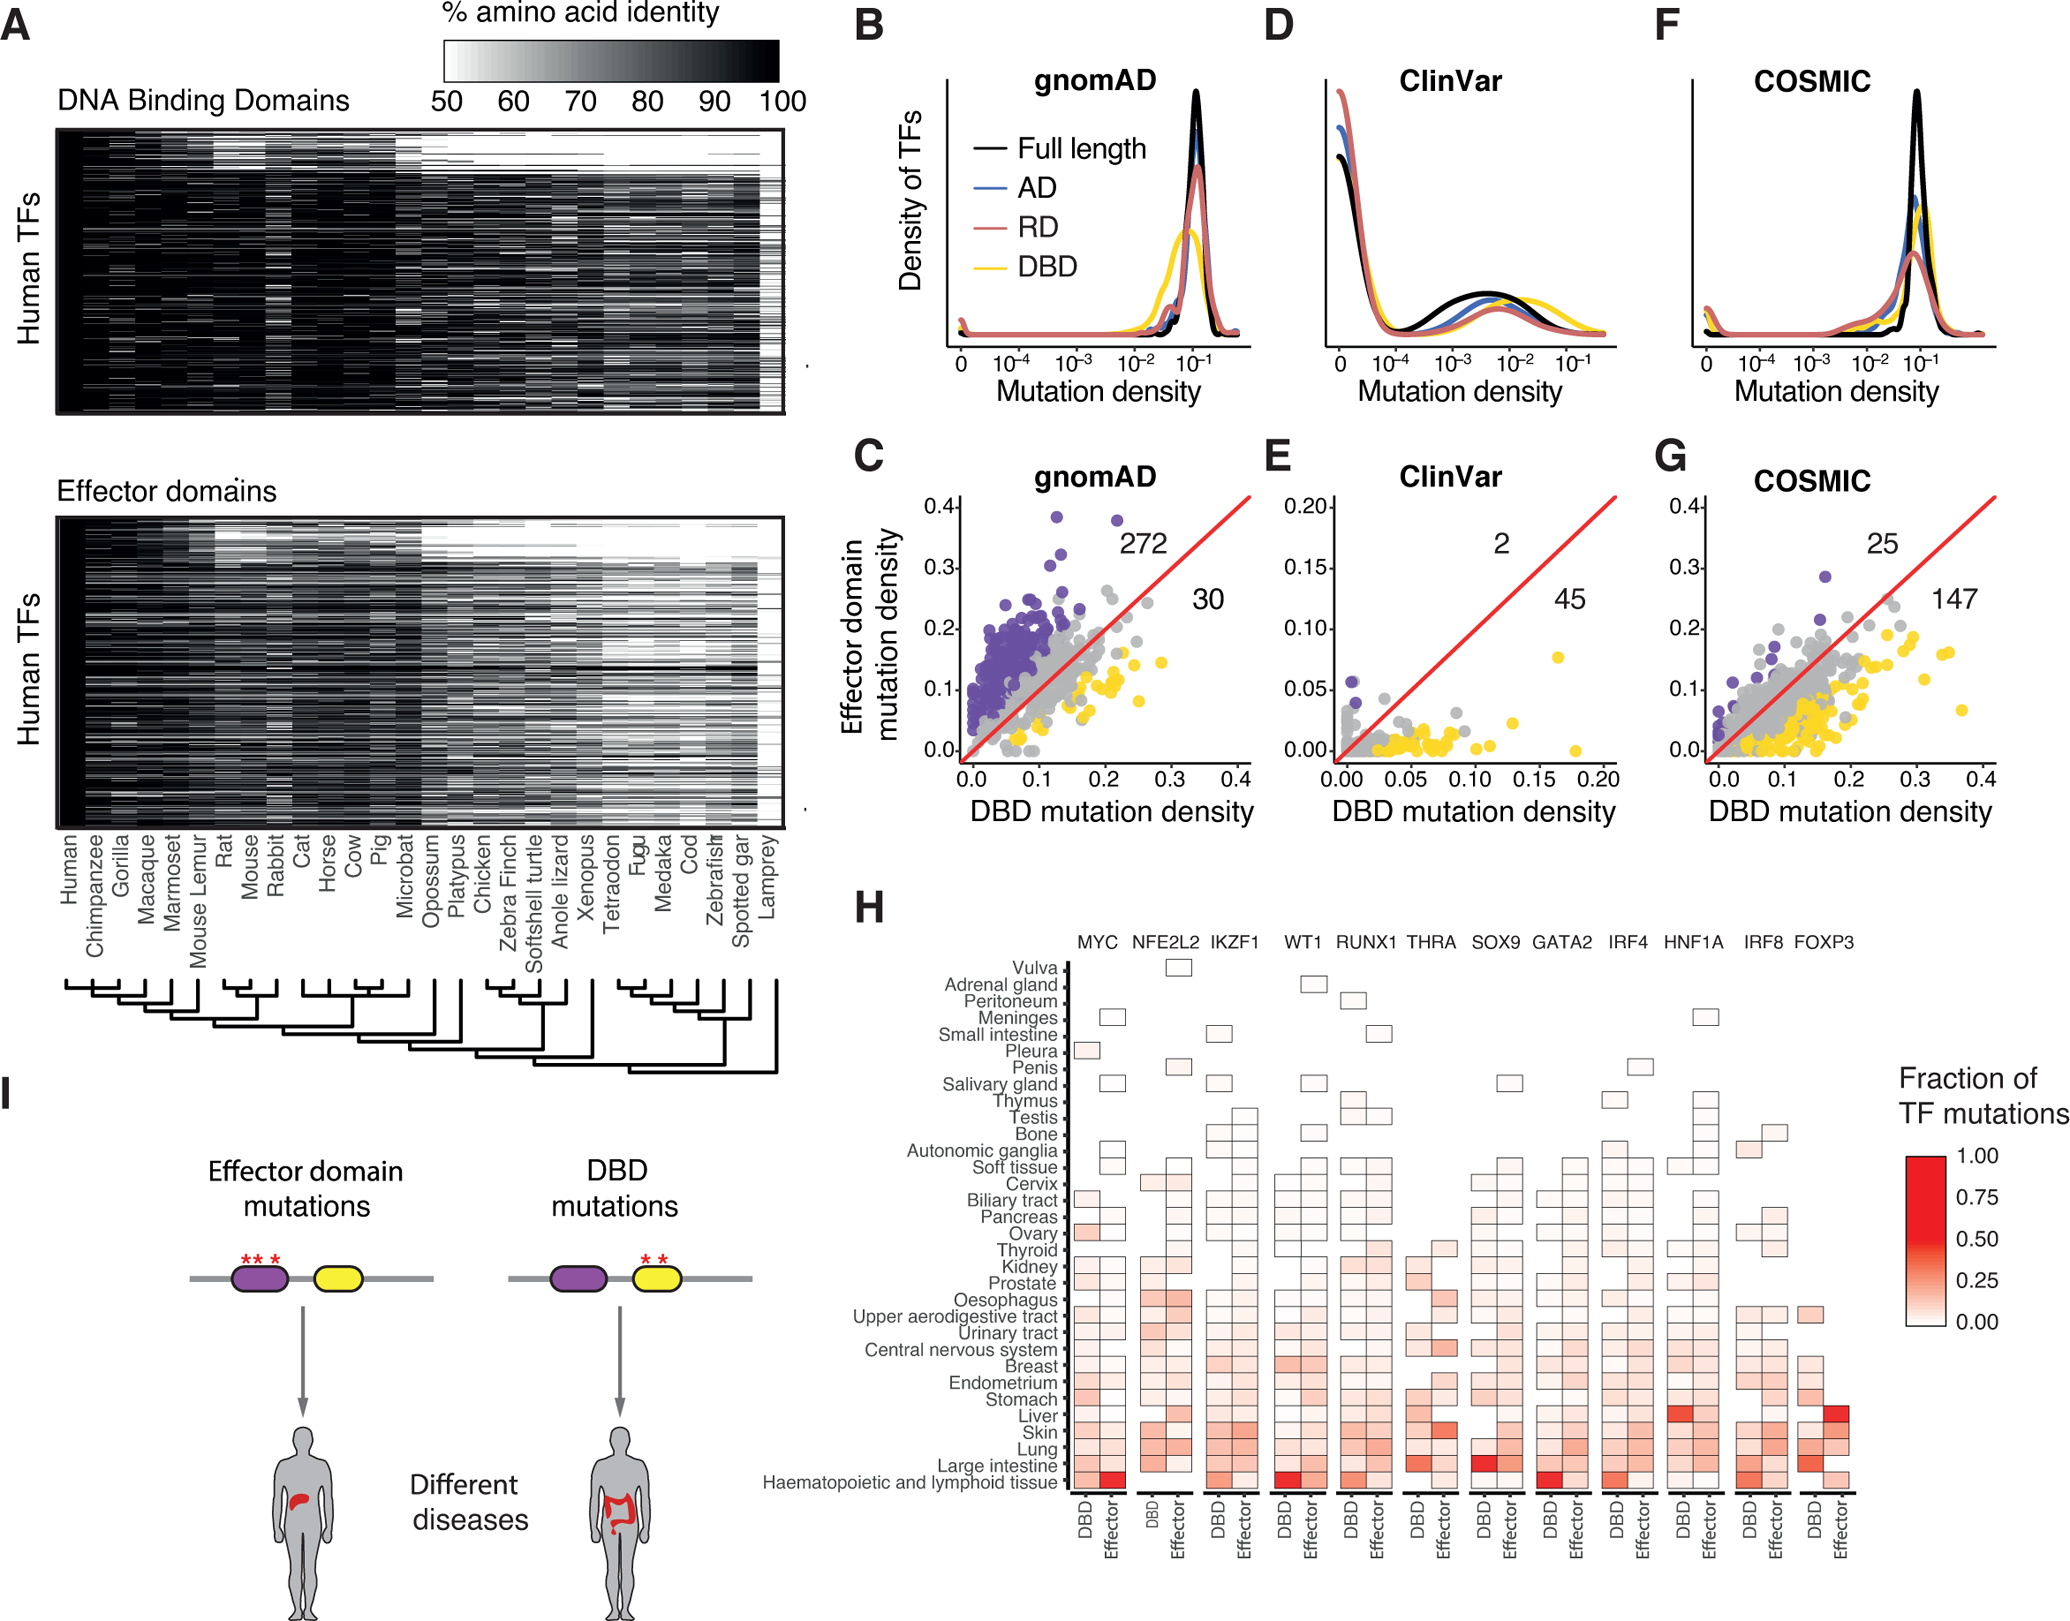
(A) Conservation of DBDs and effector domains between human and 27 vertebrate species. The percentage amino acid identity of the corresponding domains between the human sequence and the sequence in the indicated species is shown in shades of gray. The evolutionary relation among species is indicated as a phylogenetic tree.
(B, D, F) Density distributions of the number of mutations in the indicated domains per coding sequence length for variants reported in gnomAD (B), and mutations reported in ClinVar (D) and COSMIC (F).
(C, E, G) Correlation between the density of mutations in DBDs and effector domains in gnomAD (C), ClinVar (E), and COSMIC (G). Purple and yellow dots indicate TFs with significant enrichment of mutations in effector domains and DBDs, respectively. Significant TFs were identified by a Fisher’s exact test followed by BH correction and q-value < 0.1 as a cutoff. The numbers above and below the diagonal indicate the number of purple and yellow dots, respectively.
(H) Fraction of mutations in the DBD and effector domain for each indicated TF that have been detected in the indicated cancer types. Each column sums one.
(I) Schematic showing that mutations in effector domains and DBDs could lead to different diseases.
See also Figure S5.
Previous studies reported that the DBDs of most human TFs are depleted of common genetic variation (Barrera et al., 2016), likely because small changes in DBDs can lead to marked changes in affinity or specificity which could have detrimental effects. Mutagenesis studies in a few TFs have suggested that ADs more readily tolerate amino acid substitutions than DBDs (Ravarani et al., 2018; Sainz et al., 1997; Staller et al., 2018). To explore the presence of common variants in effector domains, we used the gnomAD database (Karczewski et al., 2020) to compare the proportion of missense variants within effector domains and DBDs for each TF. In general, we observed a higher proportion of missense variants in effector domains (both ADs and RDs) than in DBDs (12.3 variants/100 nts vs 8.4 variants/100nts, p value < 2.2 × 10⁻¹⁶ by Wilcoxon test) (Figure 5B). In particular, we found 272 TFs with a significantly higher proportion of variants in effector domains than in DBDs, while 30 TFs had a significantly higher proportion of variants in DBDs than in effector domains (Figure 5C). This higher proportion of variants in effector domains was not dependent on minor allele frequencies and was not observed for synonymous variants (not shown). We observed similar results when analyzing genetic variants from the 1000 Genomes Project (1000 Genomes Project Consortium et al., 2015). Taken together, these results suggest that there is a stronger negative selection for mutations in DBDs than effector domains. Among the TFs whose effector domains are more tolerable to mutations, DUX4 and ZNF595 showed the greatest proportion of missense variants in their AD and RD (58.6% and 37.9% of missense variants, respectively). Although most effector domains are found to tolerate missense variants, there are several highly conserved effector domains. For example, RARB and RBPJ showed the lowest proportion of missense variants in their AD and RD, respectively (1.9 variants/100 nts and 3.4 variants /100 nts), although their DBDs are highly mutated.
Mutations in effector domains and association with disease
Mutations in TF effector domains have long been associated with many genetic diseases and cancers (Bradner et al., 2017). While mutations in DBDs can alter the targets of a TF by modifying its DNA-binding affinity and specificity (Barrera et al., 2016; Sahni et al., 2015), mutations in effector domains can alter the ability of a TF to activate or repress gene expression by affecting its interactions with cofactors, mediator, or chromatin modifying enzymes (Frietze and Farnham, 2011; Lambert et al., 2018). However, the extent to which mutations affect effector domains has not been comprehensively determined.
To determine the prevalence of germline mutations associated with disease within effector domains, we considered pathogenic and likely pathogenic mutations from the ClinVar database (Landrum et al., 2020). We found disease-associated variants both in effector domains and DBDs, although DBDs were preferentially mutated in disease (Figure 5D). Indeed, we found 44 TFs significantly enriched in DBD mutations (q-value < 0.1, Fisher’s exact test) and only two TFs (SMAD3 and SMAD4) enriched in effector domain mutations (Figure 5E). This suggests that either fewer mutations in effector domains are pathogenic, or that multiple mutations may be concurrently needed to produce a phenotype, consistent with the high tolerance for variants observed in effector domains in the human population (Figures 5B and 5C).
Mutations in DBDs and effector domains of different TFs (e.g., MYC, TP53, ESR1) have been identified or predicted as cancer drivers (ICGC/TCGA Pan-Cancer Analysis of Whole Genomes Consortium, 2020; Martinez-Jimenez et al., 2020). However, the prevalence of these effector domain mutations in relation to DBD mutations has not been comprehensively determined. By exploring the COSMIC database (Tate et al., 2019), we found that the proportion of cancer-associated somatic mutations in effector domains is lower than in DBDs (p < 2.2 × 10⁻¹⁶, by Wilcoxon test) (Figure 5F). Indeed, we found 25 and 147 TFs with statistically enriched somatic mutations in effector domains and DBDs, respectively (Figure 5G). However, many effector domains have a density of somatic mutations comparable to or higher than that of many DBDs (Figure 5F). For example, the effector domains of MYC, SMAD4, SMAD3, AR, and SIM1 are enriched in cancer-associated mutations. Interestingly, we identified 12 TFs for which mutations in their respective effector domains and DBDs are associated with different types of cancer (q-value < 0.1, by Fisher’s exact test) (Figure 5H). For example, somatic mutations in the AD of MYC are preferentially associated with hematopoietic and lymphoid cancers, whereas mutations in the DBD of MYC are associated with many different cancer types such as hematopoietic, lymphoid, large intestine, stomach cancers. Similarly, while mutations in the DBD of FOXP3 are enriched in large intestine cancer, mutations in its effector domain are associated with liver cancers. This suggests that, at least for some TFs, mutations in different functional domains can lead to different diseases (Figure 5I).
Altogether, these results show that effector domains are more tolerable to common genetic variation, and that they are less frequently associated with disease mutations than DBDs. Nevertheless, there are still numerous examples of disease-associated mutations in effector domains.
Classification of effector domains
Effector domains have traditionally been identified based on regulatory activity (activation versus repression), biophysical features (e.g., charge, hydrophobicity, and disorder), the enrichment of certain amino acids (e.g., proline, serine, and glutamine), and sequence conservation. To provide a functional classification of effector domains, we leveraged these features to calculate pairwise similarities between effector domains (see Document S1) which we then used to identify clusters of effector domains with similar features. After an initial clustering into 63 clusters, we retained 20 containing at least 10 effector domains, which comprise 77% of the effector domains we annotated (Figure 6 and Table S3).
Figure 6. Classification of effector domains.
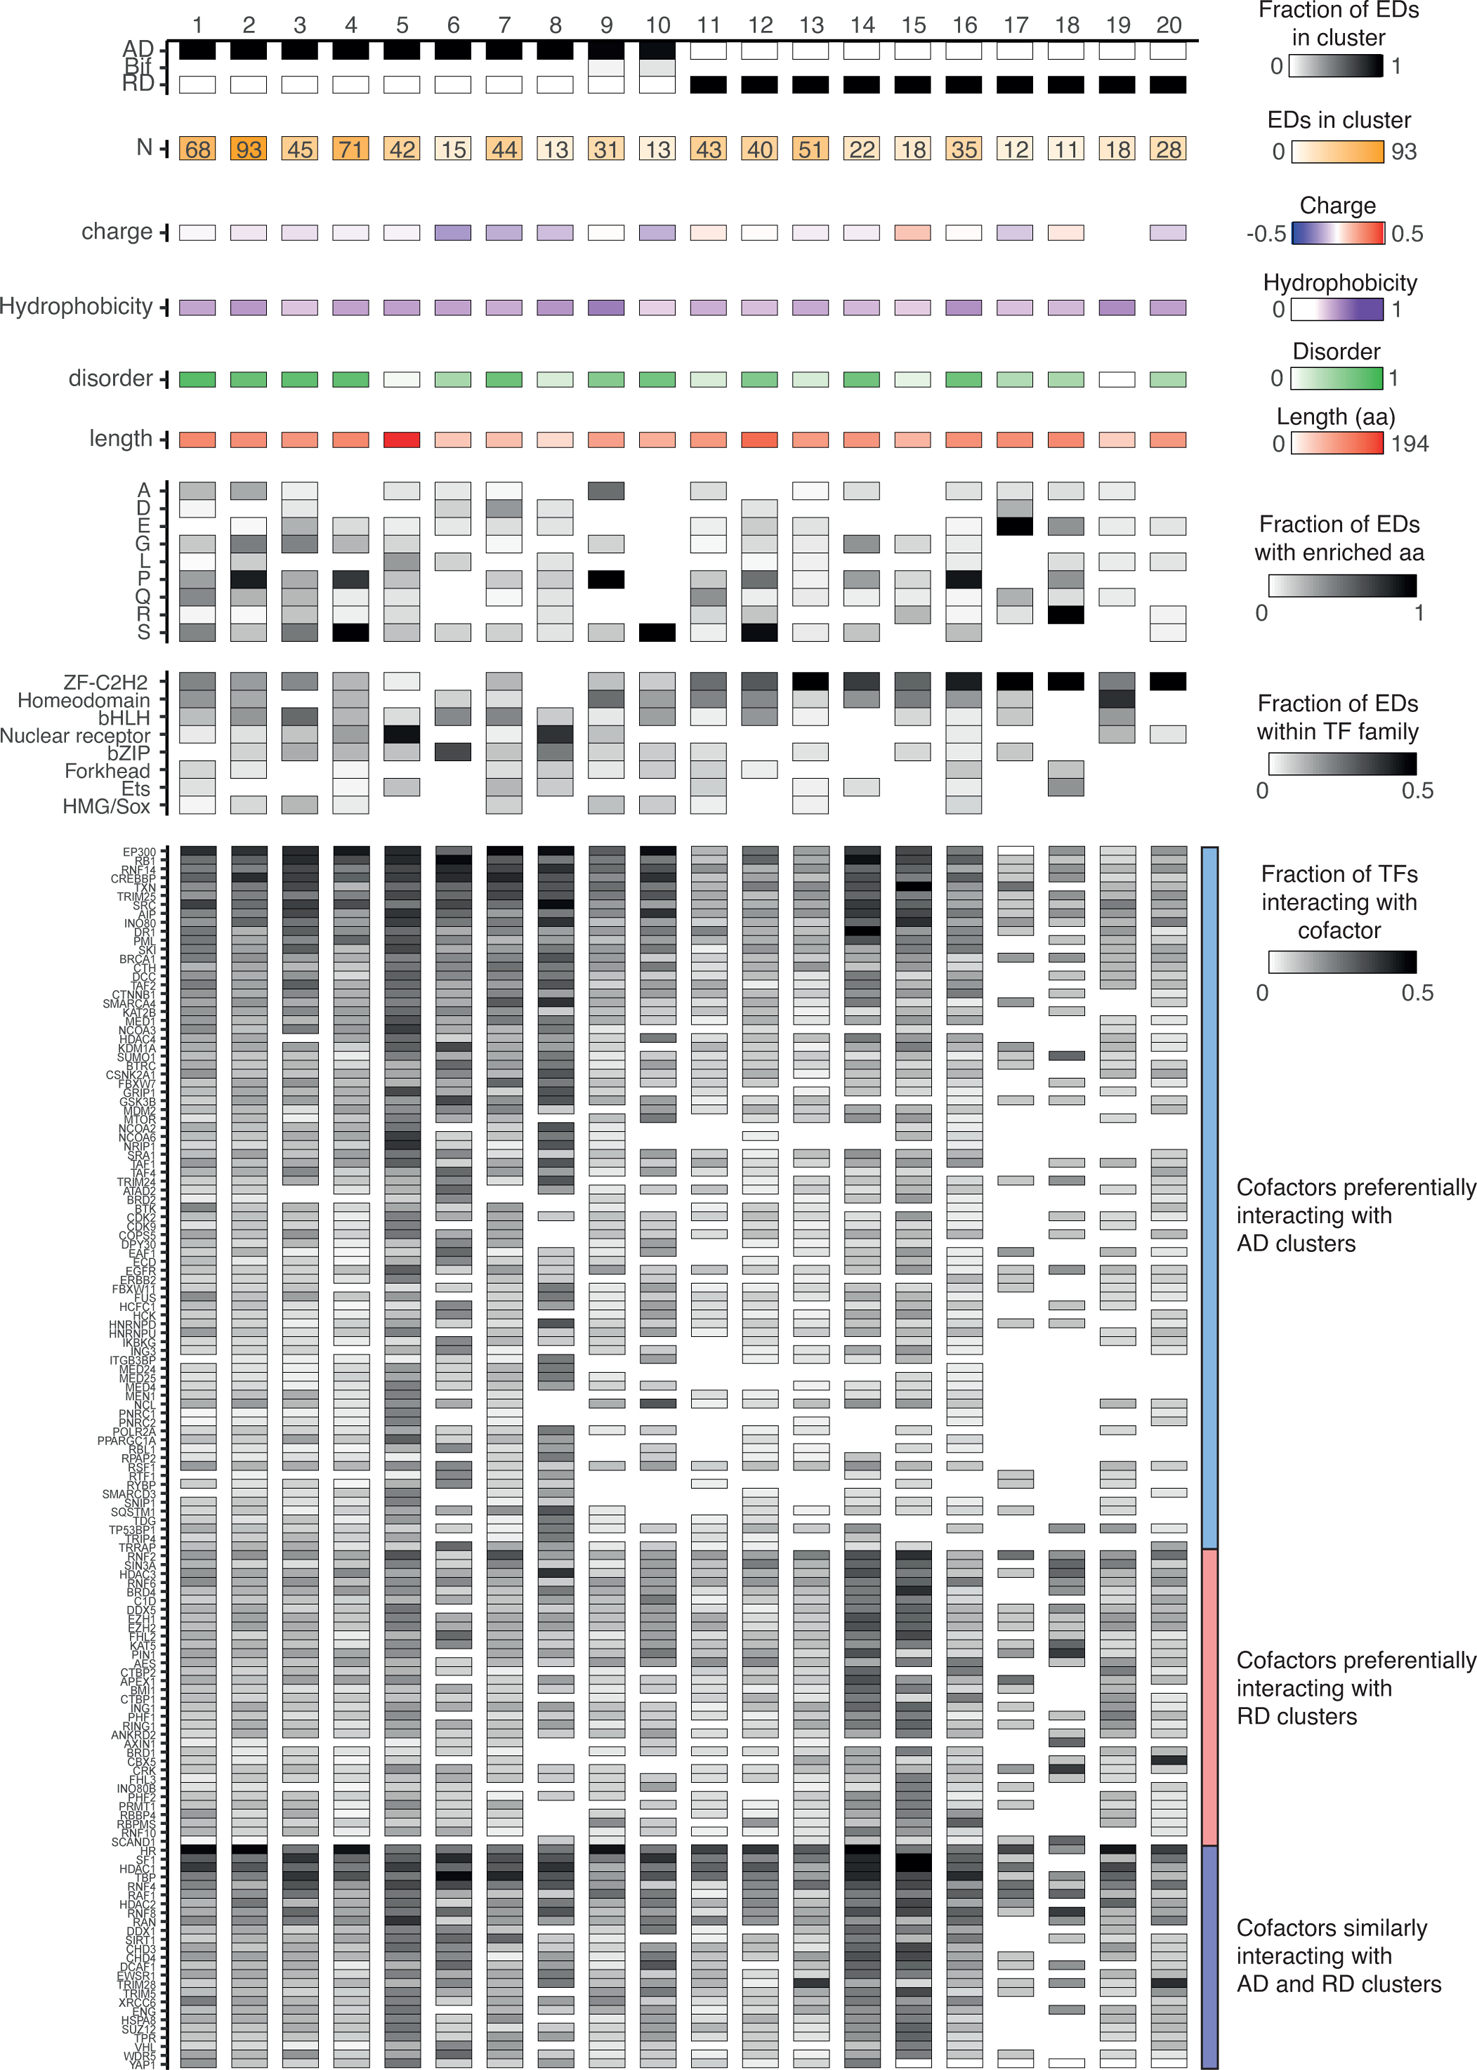
Effector domains were classified into 20 clusters based on biophysical features, amino acid enrichment, and sequence similarity. The number of effector domains per cluster is indicated in shades of orange. The charge density, hydrophobicity, and disorder were determined as in Figure 2. The length in amino acids is indicated in shades of red. The fractions of effector domains per cluster enriched in each amino acid, TF family, or interacting with a cofactor are indicated in shades of gray. Cofactors interacting with at least 20% of TFs in at least one cluster are shown.
See also Figure S6.
We identified 10 clusters of ADs and 10 clusters of RDs (Figure 6). These clusters differ in the biophysical features and the enrichment of certain amino acids within their sequences. For example, clusters 15 and 18 are comprised of basic RDs, enriched in arginine residues, whereas cluster 4 is comprised of mildly acidic and disordered ADs enriched in serine and proline residues (Figure 6). Some clusters are enriched in TFs from certain families, such as clusters 5 (nuclear receptor), 6 (bZIP), 8 (nuclear receptor), 13 (ZF-C2H2), 17 (ZF-C2H2), 18 (ZF-C2H2), 19 (homeodomain), and 20 (ZF-C2H2). However, many clusters contain effector domains from different TF families without a clear TF family enrichment, suggesting that the effector domain classification does not directly match TF classifications based on DBDs. This is consistent with the high variability in effector domain regulatory activity, localization within the TF amino acid sequence, biophysical features observed even within TF families (Figures 2 and 3), and the modular organization of TF protein domains.
Next, we evaluated whether effector domains from different clusters preferentially interacted with specific cofactors, and thus may share mechanisms of action. Although interactions between effector domains and cofactors have not been comprehensively determined, we leveraged protein-protein interactions from BioGRID, HuRI, and Lit-BM (Luck et al., 2020; Oughtred et al., 2021; Rolland et al., 2014) between cofactors and the TFs containing the effector domains. As expected, some coactivator “hubs” such as CREBBP, EP300, and RB1, as well as general TFs such as TAF1 and TAF2, preferentially interact with AD-containing clusters, while co-repressor “hubs” such as RNF2 and SIN3A preferentially interact with RD-containing clusters (Figures 6 and S6). Other cofactors are more specific to certain effector domain clusters. For example, mediator complex subunits and nuclear receptor coactivators preferentially interact with clusters 5 and 8 which are enriched in nuclear receptors (Figure 6). Similarly, co-repressor TRIM28 interacts with TFs from clusters 13 and 20 which are highly enriched in KRAB-domain-containing ZF-C2H2, as has been previously reported (Friedman et al., 1996), whereas heterochromatin protein CBX5 preferentially interacts with TFs from cluster 20 (Figure 6). Several cofactors are shared between activation and repression domain clusters (e.g., HR, SF1, and HDAC1) (Figures 6 and S6). This may be because several effector domains can interact with both coactivators and corepressors which modulate transcriptional activity under different conditions. However, some of these cases may be related to the fact that PPIs are considered at the whole protein levels and 115 TFs contain both activation and repression domains.
Perspective and future directions
Most studies of effector domains have been conducted on individual TFs showing effector domains are generally acidic, disordered, and hydrophobic. However, many effector domains are not defined by these general rules making it difficult to predict, identify, and classify effector domains and elucidate their functions. Recently, high-throughput studies have been used to identify effector domains by tiling through protein sequences genome-wide and to determine the amino acid features responsible for transcriptional activity. However, effector domains that belong to different clusters and that interact with different cofactors may be governed by different sequence features, without a one-rule-fits-all. Further, since effector domain activity may differ between cell types or may be influenced by ligands and post-translational modifications, many effector domains cannot be determined or characterized in single screens. Although our resource is the most comprehensive to date, this only represents ~35% of all human TFs. Further studies, using high-throughput approaches in different cell types and conditions, are needed to identify and characterize effector domains for the remaining ~1,000 human TFs. It is yet unclear how many of these TFs will contain effector domains, as several TFs are known to lack effector domains and affect transcriptional activity through dimerization or interactions with other TFs.
TFs often have more than one effector domain. In most cases, how they functionally interact with each other, cofactors, or the mediator complex remains to be determined. Indeed, most PPIs between TFs and cofactors have been determined for full length TFs, rather than effector domains, limiting our understanding of the molecular mechanisms by which individual or sets of effector domains in a TF function. Systematic interaction mapping assays such as yeast two-hybrid, proximity ligation, and affinity-purification followed by mass spectrometry are needed to identify cofactor-effector domain interactions in order to increase our understanding of the mechanisms of action of effector domains. This, coupled with high-density mutational screens and structure-based modeling, will also provide insights into the molecular consequences of disease mutations in effector domains.
Supplementary Material
Acknowledgments
This work was funded by the National Institutes of Health grants R35 GM128625 and U01 CA232161 awarded to J.I.F.B. We thank Drs. Trevor Siggers, Martha Bulyk, Thomas Gilmore, Matthew Weirauch, and Ana Fiszbein for critically reading and commenting on the manuscript.
Footnotes
Publisher's Disclaimer: This is a PDF file of an unedited manuscript that has been accepted for publication. As a service to our customers we are providing this early version of the manuscript. The manuscript will undergo copyediting, typesetting, and review of the resulting proof before it is published in its final form. Please note that during the production process errors may be discovered which could affect the content, and all legal disclaimers that apply to the journal pertain.
References
- 1000 Genomes Project Consortium, Auton A, Brooks LD, Durbin RM, Garrison EP, Kang HM, Korbel JO, Marchini JL, McCarthy S, McVean GA, et al. (2015). A global reference for human genetic variation. Nature 526, 68–74. [DOI] [PMC free article] [PubMed] [Google Scholar]
- Alerasool N, Lin ZY, Gingras AC, Taipale M (2021). Identification and functional characterization of transcriptional activators in human cells. BioRxiv. 10.1101/2021.07.30.454360 [DOI] [PubMed] [Google Scholar]
- Arnold CD, Nemcko F, Woodfin AR, Wienerroither S, Vlasova A, Schleiffer A, Pagani M, Rath M, and Stark A (2018). A high-throughput method to identify trans-activation domains within transcription factor sequences. EMBO J 37. [DOI] [PMC free article] [PubMed] [Google Scholar]
- Barrera LA, Vedenko A, Kurland JV, Rogers JM, Gisselbrecht SS, Rossin EJ, Woodard J, Mariani L, Kock KH, Inukai S, et al. (2016). Survey of variation in human transcription factors reveals prevalent DNA binding changes. Science 351, 1450–1454. [DOI] [PMC free article] [PubMed] [Google Scholar]
- Boija A, Klein IA, Sabari BR, Dall’Agnese A, Coffey EL, Zamudio AV, Li CH, Shrinivas K, Manteiga JC, Hannett NM, et al. (2018). Transcription Factors Activate Genes through the Phase-Separation Capacity of Their Activation Domains. Cell 175, 1842–1855 e1816. [DOI] [PMC free article] [PubMed] [Google Scholar]
- Bradner JE, Hnisz D, and Young RA (2017). Transcriptional Addiction in Cancer. Cell 168, 629–643. [DOI] [PMC free article] [PubMed] [Google Scholar]
- Braun T, Winter B, Bober E, and Arnold HH (1990). Transcriptional activation domain of the muscle-specific gene-regulatory protein myf5. Nature 346, 663–665. [DOI] [PubMed] [Google Scholar]
- Brent R, and Ptashne M (1985). A eukaryotic transcriptional activator bearing the DNA specificity of a prokaryotic repressor. Cell 43, 729–736. [DOI] [PubMed] [Google Scholar]
- Cantin GT, Stevens JL, and Berk AJ (2003). Activation domain-mediator interactions promote transcription preinitiation complex assembly on promoter DNA. Proc Natl Acad Sci U S A 100, 12003–12008. [DOI] [PMC free article] [PubMed] [Google Scholar]
- Carrasco Pro S, Dafonte Imedio A, Santoso CS, Gan KA, Sewell JA, Martinez M, Sereda R, Mehta S, and Fuxman Bass JI (2018). Global landscape of mouse and human cytokine transcriptional regulation. Nucleic Acids Res. [DOI] [PMC free article] [PubMed] [Google Scholar]
- Chen W, Lam SS, Srinath H, Jiang Z, Correia JJ, Schiffer CA, Fitzgerald KA, Lin K, and Royer WE Jr. (2008). Insights into interferon regulatory factor activation from the crystal structure of dimeric IRF5. Nat Struct Mol Biol 15, 1213–1220. [DOI] [PMC free article] [PubMed] [Google Scholar]
- Chiesa G, Kiriakov S, and Khalil AS (2020). Protein assembly systems in natural and synthetic biology. BMC Biol 18, 35. [DOI] [PMC free article] [PubMed] [Google Scholar]
- Chong S, Dugast-Darzacq C, Liu Z, Dong P, Dailey GM, Cattoglio C, Heckert A, Banala S, Lavis L, Darzacq X, et al. (2018). Imaging dynamic and selective low-complexity domain interactions that control gene transcription. Science 361. [DOI] [PMC free article] [PubMed] [Google Scholar]
- Collins T, Stone JR, and Williams AJ (2001). All in the family: the BTB/POZ, KRAB, and SCAN domains. Mol Cell Biol 21, 3609–3615. [DOI] [PMC free article] [PubMed] [Google Scholar]
- ICGC/TCGA Pan-Cancer Analysis of Whole Genomes Consortium. (2020). Pan-cancer analysis of whole genomes. Nature 578, 82–93. [DOI] [PMC free article] [PubMed] [Google Scholar]
- Davidson EH, and Erwin DH (2006). Gene regulatory networks and the evolution of animal body plans. Science 311, 796–800. [DOI] [PubMed] [Google Scholar]
- Dinkel H, Van Roey K, Michael S, Davey NE, Weatheritt RJ, Born D, Speck T, Kruger D, Grebnev G, Kuban M, et al. (2014). The eukaryotic linear motif resource ELM: 10 years and counting. Nucleic Acids Res 42, D259–266. [DOI] [PMC free article] [PubMed] [Google Scholar]
- Drysdale CM, Duenas E, Jackson BM, Reusser U, Braus GH, and Hinnebusch AG (1995). The transcriptional activator GCN4 contains multiple activation domains that are critically dependent on hydrophobic amino acids. Mol Cell Biol 15, 1220–1233. [DOI] [PMC free article] [PubMed] [Google Scholar]
- Dyson HJ, and Wright PE (2016). Role of Intrinsic Protein Disorder in the Function and Interactions of the Transcriptional Coactivators CREB-binding Protein (CBP) and p300. J Biol Chem 291, 6714–6722. [DOI] [PMC free article] [PubMed] [Google Scholar]
- Epstein JA, Glaser T, Cai J, Jepeal L, Walton DS, and Maas RL (1994). Two independent and interactive DNA-binding subdomains of the Pax6 paired domain are regulated by alternative splicing. Genes Dev 8, 2022–2034. [DOI] [PubMed] [Google Scholar]
- Erijman A, Kozlowski L, Sohrabi-Jahromi S, Fishburn J, Warfield L, Schreiber J, Noble WS, Soding J, and Hahn S (2020). A High-Throughput Screen for Transcription Activation Domains Reveals Their Sequence Features and Permits Prediction by Deep Learning. Mol Cell 78, 890–902 e896. [DOI] [PMC free article] [PubMed] [Google Scholar]
- Ferreira ME, Hermann S, Prochasson P, Workman JL, Berndt KD, and Wright AP (2005). Mechanism of transcription factor recruitment by acidic activators. J Biol Chem 280, 21779–21784. [DOI] [PubMed] [Google Scholar]
- Filtz TM, Vogel WK, and Leid M (2014). Regulation of transcription factor activity by interconnected post-translational modifications. Trends Pharmacol Sci 35, 76–85. [DOI] [PMC free article] [PubMed] [Google Scholar]
- Foulkes NS, Borrelli E, and Sassone-Corsi P (1991). CREM gene: use of alternative DNA-binding domains generates multiple antagonists of cAMP-induced transcription. Cell 64, 739–749. [DOI] [PubMed] [Google Scholar]
- Frankel AD, and Kim PS (1991). Modular structure of transcription factors: implications for gene regulation. Cell 65, 717–719. [DOI] [PubMed] [Google Scholar]
- Frankish A, Diekhans M, Ferreira AM, Johnson R, Jungreis I, Loveland J, Mudge JM, Sisu C, Wright J, Armstrong J, et al. (2019). GENCODE reference annotation for the human and mouse genomes. Nucleic Acids Res 47, D766–D773. [DOI] [PMC free article] [PubMed] [Google Scholar]
- Friedman JR, Fredericks WJ, Jensen DE, Speicher DW, Huang XP, Neilson EG, and Rauscher FJ 3rd (1996). KAP-1, a novel corepressor for the highly conserved KRAB repression domain. Genes Dev 10, 2067–2078. [DOI] [PubMed] [Google Scholar]
- Frietze S, and Farnham PJ (2011). Transcription factor effector domains. Subcell Biochem 52, 261–277. [DOI] [PMC free article] [PubMed] [Google Scholar]
- Gerber HP, Seipel K, Georgiev O, Hofferer M, Hug M, Rusconi S, and Schaffner W (1994). Transcriptional activation modulated by homopolymeric glutamine and proline stretches. Science 263, 808–811. [DOI] [PubMed] [Google Scholar]
- Giraud S, Bienvenu F, Avril S, Gascan H, Heery DM, and Coqueret O (2002). Functional interaction of STAT3 transcription factor with the coactivator NcoA/SRC1a. J Biol Chem 277, 8004–8011. [DOI] [PubMed] [Google Scholar]
- Han BY, Seah MKY, Brooks IR, Quek DHP, Huxley DR, Foo CS, Lee LT, Wollmann H, Guo H, Messerschmidt DM, et al. (2020). Global translation during early development depends on the essential transcription factor PRDM10. Nat Commun 11, 3603. [DOI] [PMC free article] [PubMed] [Google Scholar]
- Hermann S, Berndt KD, and Wright AP (2001). How transcriptional activators bind target proteins. J Biol Chem 276, 40127–40132. [DOI] [PubMed] [Google Scholar]
- Hnisz D, Shrinivas K, Young RA, Chakraborty AK, and Sharp PA (2017). A Phase Separation Model for Transcriptional Control. Cell 169, 13–23. [DOI] [PMC free article] [PubMed] [Google Scholar]
- Hope IA, and Struhl K (1986). Functional dissection of a eukaryotic transcriptional activator protein, GCN4 of yeast. Cell 46, 885–894. [DOI] [PubMed] [Google Scholar]
- Hornbeck PV, Kornhauser JM, Latham V, Murray B, Nandhikonda V, Nord A, Skrzypek E, Wheeler T, Zhang B, and Gnad F (2019). 15 years of PhosphoSitePlus(R): integrating post-translationally modified sites, disease variants and isoforms. Nucleic Acids Res 47, D433–D441. [DOI] [PMC free article] [PubMed] [Google Scholar]
- Husberg C, Murphy P, Martin E, and Kolsto AB (2001). Two domains of the human bZIP transcription factor TCF11 are necessary for transactivation. J Biol Chem 276, 17641–17652. [DOI] [PubMed] [Google Scholar]
- Jumper J, Evans R, Pritzel A, Green T, Figurnov M, Ronneberger O, Tunyasuvunakool K, Bates R, Zidek A, Potapenko A, et al. (2021). Highly accurate protein structure prediction with AlphaFold. Nature. [DOI] [PMC free article] [PubMed] [Google Scholar]
- Karczewski KJ, Francioli LC, Tiao G, Cummings BB, Alfoldi J, Wang Q, Collins RL, Laricchia KM, Ganna A, Birnbaum DP, et al. (2020). The mutational constraint spectrum quantified from variation in 141,456 humans. Nature 581, 434–443. [DOI] [PMC free article] [PubMed] [Google Scholar]
- Kozmik Z, Kurzbauer R, Dorfler P, and Busslinger M (1993). Alternative splicing of Pax-8 gene transcripts is developmentally regulated and generates isoforms with different transactivation properties. Mol Cell Biol 13, 6024–6035. [DOI] [PMC free article] [PubMed] [Google Scholar]
- Lambert SA, Jolma A, Campitelli LF, Das PK, Yin Y, Albu M, Chen X, Taipale J, Hughes TR, and Weirauch MT (2018). The Human Transcription Factors. Cell 172, 650–665. [DOI] [PubMed] [Google Scholar]
- Lambert SA, Yang AWH, Sasse A, Cowley G, Albu M, Caddick MX, Morris QD, Weirauch MT, and Hughes TR (2019). Similarity regression predicts evolution of transcription factor sequence specificity. Nat Genet 51, 981–989. [DOI] [PubMed] [Google Scholar]
- Landrum MJ, Chitipiralla S, Brown GR, Chen C, Gu B, Hart J, Hoffman D, Jang W, Kaur K, Liu C, et al. (2020). ClinVar: improvements to accessing data. Nucleic Acids Res 48, D835–D844. [DOI] [PMC free article] [PubMed] [Google Scholar]
- Levy Y, and Onuchic JN (2006). Water mediation in protein folding and molecular recognition. Annu Rev Biophys Biomol Struct 35, 389–415. [DOI] [PubMed] [Google Scholar]
- Li J, Hsu A, Hua Y, Wang G, Cheng L, Ochiai H, Yamamoto T, and Pertsinidis A (2020). Single-gene imaging links genome topology, promoter-enhancer communication and transcription control. Nat Struct Mol Biol 27, 1032–1040. [DOI] [PMC free article] [PubMed] [Google Scholar]
- Liu J, Perumal NB, Oldfield CJ, Su EW, Uversky VN, and Dunker AK (2006). Intrinsic disorder in transcription factors. Biochemistry 45, 6873–6888. [DOI] [PMC free article] [PubMed] [Google Scholar]
- Lopez AJ (1995). Developmental role of transcription factor isoforms generated by alternative splicing. Dev Biol 172, 396–411. [DOI] [PubMed] [Google Scholar]
- Luck K, Kim DK, Lambourne L, Spirohn K, Begg BE, Bian W, Brignall R, Cafarelli T, Campos-Laborie FJ, Charloteaux B, et al. (2020). A reference map of the human binary protein interactome. Nature 580, 402–408. [DOI] [PMC free article] [PubMed] [Google Scholar]
- Ma J, and Ptashne M (1987). Deletion analysis of GAL4 defines two transcriptional activating segments. Cell 48, 847–853. [DOI] [PubMed] [Google Scholar]
- Martinez-Jimenez F, Muinos F, Sentis I, Deu-Pons J, Reyes-Salazar I, Arnedo-Pac C, Mularoni L, Pich O, Bonet J, Kranas H, et al. (2020). A compendium of mutational cancer driver genes. Nat Rev Cancer 20, 555–572. [DOI] [PubMed] [Google Scholar]
- Meijer D, Graus A, and Grosveld G (1992). Mapping the transactivation domain of the Oct-6 POU transcription factor. Nucleic Acids Res 20, 2241–2247. [DOI] [PMC free article] [PubMed] [Google Scholar]
- Mistry J, Chuguransky S, Williams L, Qureshi M, Salazar GA, Sonnhammer ELL, Tosatto SCE, Paladin L, Raj S, Richardson LJ, et al. (2021). Pfam: The protein families database in 2021. Nucleic Acids Res 49, D412–D419. [DOI] [PMC free article] [PubMed] [Google Scholar]
- Neely KE, Hassan AH, Wallberg AE, Steger DJ, Cairns BR, Wright AP, and Workman JL (1999). Activation domain-mediated targeting of the SWI/SNF complex to promoters stimulates transcription from nucleosome arrays. Mol Cell 4, 649–655. [DOI] [PubMed] [Google Scholar]
- Oldfield CJ, and Dunker AK (2014). Intrinsically disordered proteins and intrinsically disordered protein regions. Annu Rev Biochem 83, 553–584. [DOI] [PubMed] [Google Scholar]
- Oughtred R, Rust J, Chang C, Breitkreutz BJ, Stark C, Willems A, Boucher L, Leung G, Kolas N, Zhang F, et al. (2021). The BioGRID database: A comprehensive biomedical resource of curated protein, genetic, and chemical interactions. Protein Sci 30, 187–200. [DOI] [PMC free article] [PubMed] [Google Scholar]
- Paulsen RE, Weaver CA, Fahrner TJ, and Milbrandt J (1992). Domains regulating transcriptional activity of the inducible orphan receptor NGFI-B. J Biol Chem 267, 16491–16496. [PubMed] [Google Scholar]
- Pei DQ, and Shih CH (1991). An “attenuator domain” is sandwiched by two distinct transactivation domains in the transcription factor C/EBP. Mol Cell Biol 11, 1480–1487. [DOI] [PMC free article] [PubMed] [Google Scholar]
- Piskacek S, Gregor M, Nemethova M, Grabner M, Kovarik P, and Piskacek M (2007). Nine-amino-acid transactivation domain: establishment and prediction utilities. Genomics 89, 756–768. [DOI] [PubMed] [Google Scholar]
- Qian M, Yan F, Yuan T, Yang B, He Q, and Zhu H (2020). Targeting post-translational modification of transcription factors as cancer therapy. Drug Discov Today 25, 1502–1512. [DOI] [PubMed] [Google Scholar]
- Raney AK, Easton AJ, Milich DR, and McLachlan A (1991). Promoter-specific transactivation of hepatitis B virus transcription by a glutamine- and proline-rich domain of hepatocyte nuclear factor 1. J Virol 65, 5774–5781. [DOI] [PMC free article] [PubMed] [Google Scholar]
- Ravarani CN, Erkina TY, De Baets G, Dudman DC, Erkine AM, and Babu MM (2018). High-throughput discovery of functional disordered regions: investigation of transactivation domains. Mol Syst Biol 14, e8190. [DOI] [PMC free article] [PubMed] [Google Scholar]
- Reiter F, Wienerroither S, and Stark A (2017). Combinatorial function of transcription factors and cofactors. Curr Opin Genet Dev 43, 73–81. [DOI] [PubMed] [Google Scholar]
- Roeder RG (2019). 50+ years of eukaryotic transcription: an expanding universe of factors and mechanisms. Nat Struct Mol Biol 26, 783–791. [DOI] [PMC free article] [PubMed] [Google Scholar]
- Rolland T, Tasan M, Charloteaux B, Pevzner SJ, Zhong Q, Sahni N, Yi S, Lemmens I, Fontanillo C, Mosca R, et al. (2014). A proteome-scale map of the human interactome network. Cell 159, 1212–1226. [DOI] [PMC free article] [PubMed] [Google Scholar]
- Roose J, Molenaar M, Peterson J, Hurenkamp J, Brantjes H, Moerer P, van de Wetering M, Destree O, and Clevers H (1998). The Xenopus Wnt effector XTcf-3 interacts with Groucho-related transcriptional repressors. Nature 395, 608–612. [DOI] [PubMed] [Google Scholar]
- Sabari BR, Dall’Agnese A, Boija A, Klein IA, Coffey EL, Shrinivas K, Abraham BJ, Hannett NM, Zamudio AV, Manteiga JC, et al. (2018). Coactivator condensation at super-enhancers links phase separation and gene control. Science 361. [DOI] [PMC free article] [PubMed] [Google Scholar]
- Sahni N, Yi S, Taipale M, Fuxman Bass JI, Coulombe-Huntington J, Yang F, Peng J, Weile J, Karras GI, Wang Y, et al. (2015). Widespread macromolecular interaction perturbations in human genetic disorders. Cell 161, 647–660. [DOI] [PMC free article] [PubMed] [Google Scholar]
- Sainz MB, Goff SA, and Chandler VL (1997). Extensive mutagenesis of a transcriptional activation domain identifies single hydrophobic and acidic amino acids important for activation in vivo. Mol Cell Biol 17, 115–122. [DOI] [PMC free article] [PubMed] [Google Scholar]
- Sanborn AL, Yeh BT, Feigerle JT, Hao CV, Townshend RJ, Lieberman Aiden E, Dror RO, and Kornberg RD (2021). Simple biochemical features underlie transcriptional activation domain diversity and dynamic, fuzzy binding to Mediator. Elife 10. [DOI] [PMC free article] [PubMed] [Google Scholar]
- Santoso CS, Li Z, Lal S, Yuan S, Gan KA, Agosto LM, Liu X, Pro SC, Sewell JA, Henderson A, et al. (2020). Comprehensive mapping of the human cytokine gene regulatory network. Nucleic Acids Res 48, 12055–12073. [DOI] [PMC free article] [PubMed] [Google Scholar]
- Shrinivas K, Sabari BR, Coffey EL, Klein IA, Boija A, Zamudio AV, Schuijers J, Hannett NM, Sharp PA, Young RA, et al. (2019). Enhancer Features that Drive Formation of Transcriptional Condensates. Mol Cell 75, 549–561 e547. [DOI] [PMC free article] [PubMed] [Google Scholar]
- Sigler PB (1988). Transcriptional activation. Acid blobs and negative noodles. Nature 333, 210–212. [DOI] [PubMed] [Google Scholar]
- Staby L, O’Shea C, Willemoes M, Theisen F, Kragelund BB, and Skriver K (2017). Eukaryotic transcription factors: paradigms of protein intrinsic disorder. Biochem J 474, 2509–2532. [DOI] [PubMed] [Google Scholar]
- Staller MV, Holehouse AS, Swain-Lenz D, Das RK, Pappu RV, and Cohen BA (2018). A High-Throughput Mutational Scan of an Intrinsically Disordered Acidic Transcriptional Activation Domain. Cell Syst 6, 444–455 e446. [DOI] [PMC free article] [PubMed] [Google Scholar]
- Staller MV, R. E, Holehouse AS, Pappu RV, Cohen BA. (2021). Design principles of acidic transcriptional activation domains. bioRxiv. [Google Scholar]
- Stoykova AS, Sterrer S, Erselius JR, Hatzopoulos AK, and Gruss P (1992). Mini-Oct and Oct-2c: two novel, functionally diverse murine Oct-2 gene products are differentially expressed in the CNS. Neuron 8, 541–558. [DOI] [PubMed] [Google Scholar]
- Takahashi K, Tanabe K, Ohnuki M, Narita M, Ichisaka T, Tomoda K, and Yamanaka S (2007). Induction of pluripotent stem cells from adult human fibroblasts by defined factors. Cell 131, 861–872. [DOI] [PubMed] [Google Scholar]
- Tanaka T, Tanaka K, Ogawa S, Kurokawa M, Mitani K, Yazaki Y, Shibata Y, and Hirai H (1997). An acute myeloid leukemia gene, AML1, regulates transcriptional activation and hemopoietic myeloid cell differentiation antagonistically by two alternative spliced forms. Leukemia 11 Suppl 3, 299–302. [PubMed] [Google Scholar]
- Taneri B, Snyder B, Novoradovsky A, and Gaasterland T (2004). Alternative splicing of mouse transcription factors affects their DNA-binding domain architecture and is tissue specific. Genome Biol 5, R75. [DOI] [PMC free article] [PubMed] [Google Scholar]
- Tapscott SJ, Davis RL, Thayer MJ, Cheng PF, Weintraub H, and Lassar AB (1988). MyoD1: a nuclear phosphoprotein requiring a Myc homology region to convert fibroblasts to myoblasts. Science 242, 405–411. [DOI] [PubMed] [Google Scholar]
- Tate JG, Bamford S, Jubb HC, Sondka Z, Beare DM, Bindal N, Boutselakis H, Cole CG, Creatore C, Dawson E, et al. (2019). COSMIC: the Catalogue Of Somatic Mutations In Cancer. Nucleic Acids Res 47, D941–D947. [DOI] [PMC free article] [PubMed] [Google Scholar]
- Teufel DP, Bycroft M, and Fersht AR (2009). Regulation by phosphorylation of the relative affinities of the N-terminal transactivation domains of p53 for p300 domains and Mdm2. Oncogene 28, 2112–2118. [DOI] [PMC free article] [PubMed] [Google Scholar]
- Tompa P, Davey NE, Gibson TJ, and Babu MM (2014). A million peptide motifs for the molecular biologist. Mol Cell 55, 161–169. [DOI] [PubMed] [Google Scholar]
- Tootle TL, and Rebay I (2005). Post-translational modifications influence transcription factor activity: a view from the ETS superfamily. Bioessays 27, 285–298. [DOI] [PubMed] [Google Scholar]
- Tycko J, DelRosso N, Hess GT, Aradhana, Banerjee A, Mukund A, Van MV, Ego BK, Yao D, Spees K, et al. (2020). High-Throughput Discovery and Characterization of Human Transcriptional Effectors. Cell 183, 2020–2035 e2016. [DOI] [PMC free article] [PubMed] [Google Scholar]
- van Mierlo G, Jansen JRG, Wang J, Poser I, van Heeringen SJ, and Vermeulen M (2021). Predicting protein condensate formation using machine learning. Cell Rep 34, 108705. [DOI] [PubMed] [Google Scholar]
- Vaquerizas JM, Kummerfeld SK, Teichmann SA, and Luscombe NM (2009). A census of human transcription factors: function, expression and evolution. Nat Rev Genet 10, 252–263. [DOI] [PubMed] [Google Scholar]
- Venkatanarayan A, Raulji P, Norton W, Chakravarti D, Coarfa C, Su X, Sandur SK, Ramirez MS, Lee J, Kingsley CV, et al. (2015). IAPP-driven metabolic reprogramming induces regression of p53-deficient tumours in vivo. Nature 517, 626–630. [DOI] [PMC free article] [PubMed] [Google Scholar]
- Vernon RM, Chong PA, Tsang B, Kim TH, Bah A, Farber P, Lin H, and Forman-Kay JD (2018). Pi-Pi contacts are an overlooked protein feature relevant to phase separation. Elife 7. [DOI] [PMC free article] [PubMed] [Google Scholar]
- Wang F, Marshall CB, Yamamoto K, Li GY, Gasmi-Seabrook GM, Okada H, Mak TW, and Ikura M (2012). Structures of KIX domain of CBP in complex with two FOXO3a transactivation domains reveal promiscuity and plasticity in coactivator recruitment. Proc Natl Acad Sci U S A 109, 6078–6083. [DOI] [PMC free article] [PubMed] [Google Scholar]
- Warfield L, Tuttle LM, Pacheco D, Klevit RE, and Hahn S (2014). A sequence-specific transcription activator motif and powerful synthetic variants that bind Mediator using a fuzzy protein interface. Proc Natl Acad Sci U S A 111, E3506–3513. [DOI] [PMC free article] [PubMed] [Google Scholar]
- Xu Y, Milazzo JP, Somerville TDD, Tarumoto Y, Huang YH, Ostrander EL, Wilkinson JE, Challen GA, and Vakoc CR (2018). A TFIID-SAGA Perturbation that Targets MYB and Suppresses Acute Myeloid Leukemia. Cancer Cell 33, 13–28 e18. [DOI] [PMC free article] [PubMed] [Google Scholar]
Associated Data
This section collects any data citations, data availability statements, or supplementary materials included in this article.