

Abstract
Introduction
Projected dementia incidence in Latin America and the Caribbean for the next decades is overwhelming. Access to local data, stratified by sex, is imperative for planning precise dementia‐prevention strategies.
Methods
We analyzed the individual and overall weighted population attributable fraction (PAF) of nine modifiable risk factors for dementia, in dementia‐free subjects ≥45‐years‐old, using the 2016‐2017 Chilean National Health Survey.
Results
The overall weighted PAF for modifiable risk factors was 45.8% (42.2% to 49.3%). Variables with the highest PAF were lower education, high blood pressure, hearing loss, and obesity. Women showed a greater overall weighted PAF: 50.7% (45.3% to ‐56.1%), compared to men: 40.2% (35.4% to 45.0%), driven by a higher PAF for physical inactivity and depression in women.
Discussion
The PAF for modifiable risk factors for dementia in Chile is higher than in previous world reports, due to a greater prevalence of cardiovascular risk factors. Women have a higher potential for dementia prevention.
HIGHLIGHTS
The proportion of dementia associated to modifiable risk factors in Chile is 45.8%.
The main modifiable risk factors are high blood pressure, obesity, and hearing loss.
Women had a greater prevalence of physical inactivity and depression than men.
Chile had a greater prevalence of metabolic risk factors than other world regions.
Keywords: cardiovascular, dementia, depression, hypertension, Latin America and the Caribbean, midlife, modifiable risk factors, obesity, physical inactivity, population attributable fraction, prevention
1. INTRODUCTION
Latin America and the Caribbean (LAC) is one of the world's regions with the highest dementia prevalence in individuals ≥60 years of age. 1 Even more alarmingly, the number of people living with dementia is projected to increase 4‐fold from 2015 to 2050, 2 due to the accelerated aging of the population. 1 Preventive strategies targeting modifiable risk factors for dementia might moderate this increment. 3 , 4 , 5 For instance, in some high‐income countries (HICs) of North America and Europe, age‐adjusted dementia incidence had been declining over the last decades. 6 , 7 , 8 This reduction could be attributed to overall higher educational levels and better control of cardiovascular morbidity. 6 , 7 Unfortunately, less than 5% of the research associated with dementia prevention has been carried out in LAC. 9 , 10 LAC is a very diverse region, both ethnically and culturally, 11 and according to the World Bank income classification, 11 , 12 it comprises low and middle‐income countries (LMICs), upper middle‐income countries, and HICs.
Previous reports on dementia prevention opportunities have focused on population attributable fractions (PAFs), which estimate the proportion of disease cases that would not occur in a population if an individual risk factor were eliminated. 10 In 2019, Mukadan et al. determined the PAF of nine potentially modifiable risk factors for dementia (lower education, hearing loss, hypertension, obesity, smoking, depression, physical inactivity, social isolation, and diabetes) in a representative population of LMICs 10 : China, India, and six LAC countries, with cross‐sectional data from participants ≥65 years of age who were evaluated between 2004 and 2006. 13 This study reported that the overall weighted PAF in LAC was 55.8% (54.9 to 56.7), compared to 39.5% (95% confidence interval [CI] 37.5 to 41.6) in China and 41.2% (39.1 to 43.4) in India. 10 The overall weighted PAF in LAC was also higher than previous world estimations of 35% (34.1 to 35.9) using the same variables. 14 A lower estimation had been reported recently in Brazil of 32.3% (15.8 to 46.3); however, that report included only seven modifiable risk factors; hearing loss, one of the most important risk factors for dementia, was not included. 15
Updating the analysis of the PAF for nine modifiable risk factors for dementia (lower education, hearing loss, high blood pressure, obesity, smoking, depression, physical inactivity, alcohol excess, and diabetes) 14 in an LAC country is highly relevant, given that previous study in this region was performed using data obtained more than 15 years ago. 10 , 13 It is important to note that the most relevant epidemiological changes regarding dementia incidence have occurred during the last 20 years. 7 , 16 Moreover, no previous study carried out in LAC has analyzed the PAF of modifiable risk factors for dementia during midlife and later‐life stages 10 , 17 ; this is especially important given that some risk factors related with dementia occur mainly in midlife. 6 , 14 In addition, there are no other reports of the PAF for multiple dementia risk factors stratified by sex, despite the relevance of sex regarding precise strategies for dementia prevention. 18
Our aim is to estimate the individual and overall weighted PAFs of nine modifiable risk factors for dementia in Chile, and to compare them between sexes and between midlife and later‐life stages.
RESEARCH IN CONTEXT
Systematic review: We reviewed the literature (PubMed) for research studies investigating the “Population attributable fraction (PAF) of risk factors for dementia.” We found nine studies, most of them carried out in Europe, the United States, and Asia, analyzing only seven risk factors, without including hearing loss. When comparing between world regions, Latin America and the Caribbean (LAC) had the highest overall PAF of nine risk factors for dementia, but it used data from 2006.
Interpretation: We updated the LAC data by using the 2017 Chilean National Health Survey. The weighted PAF of nine modifiable risk factors for dementia was 45.8 (42.2 to 49.3); women presented a higher PAF than men, with depression and physical inactivity being the main drivers of the difference.
Future directions: For more precise prevention strategies, future analysis should include local updated data about the relative risk of dementia risk factors, and must be stratified by sex.
2. METHODS
2.1. Study design
We analyzed the data from the third Chilean National Health Survey (Ch‐NHS) carried out between October 2016 and March 2017, which collected health information from a representative sample of Chileans over 15 years of age. This survey was commanded by the Chilean Ministry of Health and carried out by the Pontificia Universidad Católica de Chile. The sample design was probabilistic, geographically stratified, and multi‐staged. It included 6233 participants (household response rate 66%, rejection rate 9.8%) who were interviewed during a first visit using structured questionnaires. In a second visit, anthropometric and laboratory measurements were obtained by trained personnel. All participants provided written informed consent. 19
2.1.1. Subject selection
Our analysis included subjects ≥45 years of age, as this group presents the highest risk of developing dementia within the next 20 years. We excluded from the total sample those participants with suspected cognitive impairment by using the shortened Chilean version of the Mini‐Mental State Examination (SCh‐MMSE) (cutoff score <13/19). 20
2.1.2. Health problems associated with dementia
We selected the nine risk factors listed below, which have been associated with dementia in recent meta‐analysis. 10 , 14 For a prevalence estimate, whenever possible, we used the same dichotomic definition of the studies where the relative risk for the association with dementia was obtained. 4 , 5 , 10 , 14
2.2. Data analyses
All analyses were performed using the statistical software R project (packages survey, psych), considering the weights of the sample design and the maximum complete cases available. No imputation procedure was used for missing data. The prevalence of the dementia risk factors was estimated using criteria described in Table 1. We used the relative risk (RR) attributed to each risk factor reported in previous cohort studies that compared the risk of developing dementia between people with and without the presence of the corresponding risk factor. 4 , 5 , 10 , 14 Further on, by using the prevalence and the RR of each risk factor, we estimated each individual PAF. 10 , 14
TABLE 1.
Definitions of the nine dementia risk factors used for the analysis
| Lower education: When not receiving more than primary education in early life (<7 years of scholarship) |
| Hearing loss: Self‐reported by the negative response to any of these questions: Do you think you hear normally by both ears? Are you able to follow a TV program at a volume acceptable to others? Are you able to follow a conversation of three or more people? 19 |
| High Blood Pressure: If systolic blood pressure (SBP) >140 mm Hg (the average of three measurements with the participant in a sitting position after 20 min rest), independently if subjects had the diagnosis of hypertension or where in treatment for it. |
| Obesity: Body mass index (BMI) ≥ 30 was calculated by dividing weight (kilograms) by height (meters squared) |
| Smoking: Self‐reported by the affirmative response to: Do you currently smoke cigarettes? |
| Depression: Suspected major depression in the last 12 months according to the fourth edition of the Diagnostic and Statistical Manual of Mental Disorders (DSM‐IV), was assessed with the Composite International Diagnostic Interview Short Form for depression (CIDI‐SF) by a trained interviewer. |
| Physical inactivity: Defined when scored as low physical activity according to the Global Physical Activity Questionnaire version 2 (GPAQ), 21 previously validated in Latin America and the Caribbean (LAC). |
| Diabetes: Self‐report and/or medical treatment for diabetes, or fasting blood glucose ≥126 mg/dL (≥7.0 mmol/L). |
| Alcohol excess: (>21 units/week) was measured using two questions of the validated Chilean version 22 of the Audit questionnaire: When you drink alcohol, how many drinks (units) do you usually have on average per day? How often do you drink any alcoholic beverage? The results were shifted‐up 20.3% to match results from the apparent per‐capita alcohol consumption. |
Eq. 1. Population Attributable Fraction (PAF)
| (1) |
P = Prevalence, RR = relative risk of each risk factor.
To include uncertainty around the PAF's estimation, we used Monte Carlo simulations (n = 10,000) according to distributional assumptions (beta distributions for prevalence and normal distributions for the logarithm of relative risks). The mean and the 2.5% and 97.5% quantiles obtained from PAF distributions were reported.
Because the PAFs from different risk factors share similar causal mechanisms, each individual PAF was weighted using the communalities, which are the proportion of common variance between them, extracted from a principal component analysis based on a tetrachoric correlation matrix. To decide how many components would be used to obtain communalities, we used a parallel analysis method. 23 The retained components were then used to calculate the communalities.
Eq. 2 Contribution of each risk factor to the overall PAF.
| (2) |
Then weights were applied to produce the weighted PAFs. The weighted PAFs allow the estimation of a global PAF combining all nine risk factors as shown in Equation 3.
| (3) |
Finally, individual weighted PAFs were re‐calculated to add the overall PAF.
| (4) |
We stratified the analyses by sex and two age groups: 45‐ 64‐years‐old or “midlife,” and older than 65 years or “later‐life.” A secondary analysis was carried out in the later‐life group excluding obesity and high blood pressure. 6 The overall PAF for the total Chilean population ≥45‐years‐old was obtained as averages of each overall PAF stratified by age and sex (reported in Table 4) weighted by the population distributions informed by the Chilean National Statistics Institute for 2017 24 reported in Table 2. The same procedure was done to obtain the overall PAF in ≥45‐years‐old stratified by sex (weighted by population proportion of each age group).
TABLE 4.
Prevalence of dementia risk factors, communalities, individual, and total weighted PAF in midlife and later life separated by sex
| MIDLIFE | Women Midlife | Men Midlife | |||||||
|---|---|---|---|---|---|---|---|---|---|
|
RR (95% CI) |
Prevalence % | Communality | PAF % | Weighted PAF % | Prevalence % | Communality | PAF % | Weighted PAF % | |
| Low Education | 1.6 (1.3‐2.0) | 19.7 (15.5‐23.9) | 0.69 | 10.6 (5.2‐16.8) | 2.7 (1.2‐4.3) | 13.0 (9.2‐16.8) | 0.47 | 7.3 (3.3‐12.1) | 3.3 (1.4‐5.38) |
| High blood pressure | 1.6 (1.2‐2.2) | 20.7 (15.5‐25.9) | 0.83 | 11.2 (3.5‐20.0) | 1.5 (0.4‐2.7) | 26.6 (21.1‐32.0) | 0.70 | 13.8 (4.6‐24.2) | 3.52 (1.08‐5.98) |
| Obesity | 1.6 (1.3‐1.9) | 48.7 (41.4‐56.0) | 0.26 | 22.6 (13.3‐31.9) | 13.5 (8.5‐18.6) | 36.4 (29.1‐43.7) | 0.49 | 17.9 (10.2‐26.1) | 7.73 (4.49‐11.2) |
| Hearing Loss | 1.9 (1.4‐2.7) | 24.1 (18.9‐29.2) | 0.63 | 17.9 (8‐29.2) | 5.3 (2.3‐8.6) | 22.7 (17.1‐28.2) | 0.82 | 17.0 (7.6‐27.7) | 2.53 (1‐4.2) |
| Smoking | 1.6 (1.2‐2.2) | 29.8 (24.5‐35.1) | 0.42 | 15.1 (4.9‐26.0) | 7 (2.5‐11.6) | 31.2 (24.7‐37.7) | 0.64 | 15.8 (5.1‐27.2) | 4.75 (1.58‐7.91) |
| Depression | 1.9 (1.6‐2.3) | 27.5 (20.8‐34.1) | 0.65 | 19.8 (13.2‐27.3) | 5.7 (3.5‐8.2) | 11.7 (7.0‐16.5) | 0.46 | 9.6 (5.2‐14.7) | 4.4 (2.29‐6.72) |
| Physical inactivity | 1.4 (1.2‐1.7) | 39.7 (33.6‐45.9) | 0.59 | 13.7 (6.3‐21.2) | 4.5 (2.1‐7.2) | 27.1 (21.1‐33) | 0.70 | 9.8 (4.4‐15.8) | 2.44 (0.96‐4.02) |
| Diabetes | 1.5 (1.3‐1.8) | 22.0 (17.2‐26.9) | 0.63 | 9.9 (5.5‐15.0) | 2.9 (1.5‐4.5) | 18.0 (12.5‐23.5) | 0.31 | 8.2 (4.4‐12.9) | 4.73 (2.32‐7.33) |
| Alcohol excess | 1.2 (1.1‐1.3) | 1.1 (0‐2.5) | 0.30 | 0.2 (0‐0.6) | 0.2 (0‐0.3) | 10.4 (5.7‐15.1) | 0.42 | 2.0 (0.9‐3.6) | 1.02 (0.33‐1.79) |
| Overall PAF | 43.2 (36.2‐50.4) | 34.42 (28.6‐40.19) | |||||||
| LATER LIFE | Women Later life | Men Later life | |||||||
|---|---|---|---|---|---|---|---|---|---|
| Low Education | 1.6 (1.3‐2.0) | 52.4 (45.7‐59) | 0.30 | 23.8 (12.8‐34.3) | 11.2 (6.4‐16.2) | 46.9 (35.6‐58.2) | 0.32 | 21.9 (11.5‐32.6) | 10.9 (6‐16) |
| High blood pressure | 1.6 (1.2‐2.2) | 50.7 (43.3‐58.2) | 0.30 | 23.3 (8.9‐37.5) | 10.8 (4.6‐16.9) | 60.6 (46.7‐74.4) | 0.47 | 26.4 (9.9‐41.8) | 10.4 (4.5‐16) |
| Obesity | 1.6 (1.3‐1.9) | 43.6 (36.2‐50.9) | 0.29 | 20.7 (12‐29.4) | 9.9 (5.9‐14.3) | 30.0 (20.5‐39.5) | 0.47 | 15.2 (7.9‐23.4) | 6 (3‐9.5) |
| Hearing Loss | 1.9 (1.4‐2.7) | 41.4 (34.2‐48.5) | 0.37 | 27 (12.9‐40.7) | 11.4 (5.9‐17) | 45.8 (34.8‐56.8) | 0.44 | 29.1 (14.0‐44.0) | 12 (6.4‐17.8) |
| Smoking | 1.6 (1.2‐2.2) | 9.8 (6.3‐13.3) | 0.43 | 5.7 (1.7‐10.9) | 2.2 (0.5‐4) | 16.9 (9.8‐23.9) | 0.39 | 9.2 (2.6‐17.9) | 4.2 (0.8‐7.6) |
| Depression | 1.9 (1.6‐2.3) | 14.3 (10.2‐18.3) | 0.48 | 11.4 (7.0‐16.6) | 4 (2.3‐5.9) | 4.0 (2.2‐5.8) | 0.42 | 3.5 (1.9‐5.8) | 1.5 (0.7‐2.5) |
| Physical inactivity | 1.4 (1.2‐1.7) | 51.5 (44.6‐58.5) | 0.16 | 17 (8.2‐25.9) | 9.5 (4.8‐14.4) | 40.1 (31.3‐49.0) | 0.64 | 13.7 (6.4‐21.6) | 3.7 (1.7‐6) |
| Diabetes | 1.5 (1.3‐1.8) | 34.9 (28.3‐41.6) | 0.39 | 14.9 (8.4‐21.9) | 6.1 (3.3‐9.1) | 29.3 (22.2‐36.5) | 0.43 | 12.8 (7.1‐19.3) | 5.4 (2.8‐8.4) |
| Alcohol excess | 1.2 (1.1‐1.3) | 0.4 (0‐1.1) | 0.29 | 0.1 (0‐0.3) | 0.1 (0‐0.1) | 2.7 (0.5‐4.9) | 0.42 | 0.5 (0.2‐1.2) | 0.2 (0‐0.5) |
| Overall PAF | 65.1 (57.3‐73) | 54.3 (45.8‐62.6) | |||||||
RR = relative risk. PAF = population attributable fraction. Data are means (2.5%‐97.5% uncertainty intervals).
TABLE 2.
Demographic characteristics of the selected sample from the 2017 Ch‐NHS and of the 2017 Chilean population
| Variables | Number* | Survey proportion* | Chilean Population proportion 2017** | ||
|---|---|---|---|---|---|
| Sex | Women | 45‐64 | 1301 | 13% | 12% |
| ≥65 | 869 | 6% | 6% | ||
| Men | 45‐64 | 736 | 12% | 12% | |
| ≥65 | 473 | 4% | 5% | ||
| Age Groups | Midlife (45‐64) | 2037 | 25% | 24% | |
| Later life (≥65) | 1342 | 10% | 11% | ||
| Total | ≥45 | 3379 | 35% | 35% | |
Without cognitive impaired subjects.
According to Chilean census 2017 24 .
3. RESULTS
Of the 3579 participants who were ≥45‐years‐old, 247 had suspected cognitive impairment and were further excluded from the analysis. The description of the sample stratified by sex and age groups is detailed in Table 2. Missing data details are in Table A1.
3.1. Dementia risk factors characteristics
Risk factor prevalence, relative risk, individual unweighted and weighted PAFs, and communalities are shown stratified by age in Table 3, and by sex and age in Table 4.
TABLE 3.
Prevalence of dementia risk factors, communalities, individual, and total weighted PAF in midlife and later life
| Midlife (45‐64 years old) | Later life (≥65‐years‐old). | ||||||||
|---|---|---|---|---|---|---|---|---|---|
| Risk Factor |
RR (95% CI) |
Prevalence % | Communality | PAF % | Weighted PAF % | Prevalence % | Communality | PAF % | Weighted PAF % |
| Low Education | 1.6 (1.3‐2.0) | 16.4 (13.6‐19.3) | 0.69 | 9.1 (4.5‐14.4) | 3.3 (1.6‐5.3) | 50.0 (43.9‐56.2) | 0.308 | 23.0 (12.5‐33.4) | 11.6 (6.8‐16.7) |
| High blood pressure | 1.6 (1.2‐2.2) | 23.5 (19.7‐27.3) | 0.83 | 12.5 (4.2‐22.0) | 4.6 (1.3‐7.9) | 55.0 (47.6‐62.4) | 0.4 | 24.5 (9.0‐39.2) | 10.5 (4.5‐16.3) |
| Obesity | 1.6 (1.3‐1.9) | 42.9 (37.7‐48.0) | 0.26 | 20.4 (12.1‐29) | 9.5 (5.8‐13.7) | 37.6 (31.8‐43.5) | 0.37 | 18.4 (10.7‐26.5) | 8.5 (4.9‐12.4) |
| Hearing Loss | 1.9 (1.4‐2.7) | 23.4 (19.6‐27.2) | 0.63 | 17.5 (7.9‐27.9) | 4.9 (2.2‐7.9) | 43.3 (37.0‐49.5) | 0.56 | 27.8 (13.5‐41.8) | 9 (4.6‐13.6) |
| Smoking | 1.6 (1.2‐2.2) | 30.5 (26.3‐34.7) | 0.42 | 15.5 (5.4‐26.6) | 6.7 (2.4‐10.8) | 12.8 (9.2‐16.5) | 0.42 | 7.3 (2.2‐13.5) | 3.1 (0.7‐5.7) |
| Depression | 1.9 (1.6‐2.3) | 19.8 (15.7‐23.9) | 0.65 | 15.1 (9.9‐20.9) | 1.1 (0.7‐1.6) | 9.8 (7.4‐12.3) | 0.39 | 8.2 (5.1‐11.9) | 3.7 (2.1‐5.5) |
| Physical inactivity | 1.4 (1.2‐1.7) | 33.6 (29.3‐37.8) | 0.59 | 11.9 (5.6‐18.4) | 3.3 (1.6‐5.3) | 46.7 (41.2‐52.1) | 0.28 | 15.6 (7.2‐23.7) | 8.2 (4‐12.6) |
| Diabetes | 1.5 (1.3‐1.8) | 20.1 (16.5‐23.8) | 0.63 | 9.2 (5.0‐13.6) | 4.9 (2.6‐7.5) | 32.5 (27.6‐37.4) | 0.87 | 14.0 (8.0‐20.3) | 1.3 (0.7‐2.1) |
| Alcohol excess | 1.2 (1.1‐1.3) | 5.4 (3.1‐7.7) | 0.3 | 1.1 (0.5‐1.9) | 0.6 (0.2‐1) | 1.4 (0.3‐2.5) | 0.41 | 0.3 (0.1‐0.6) | 0.1 (0‐0.3) |
| Overall PAF | 38.8 (32.2‐45.4) | 56 (48.1‐64) | |||||||
RR , relative risk; PAF, population attributable fraction. Data are means (2.5%‐97.5% uncertainty intervals).
After adjusting each individual PAF for communalities, the individual weighted PAF was significantly reduced (Tables 3 and 4).
3.1.1. Comparison between age groups
The prevalence of the majority of the risk factors was greater in the later‐life group (lower education, high blood pressure, physical inactivity, and diabetes). Meanwhile, smoking and depression were more prevalent in the midlife group; prevalence of obesity and alcohol excess presented no significant differences (Table 3, Figure 1). The communalities between risk factors were greater in the midlife group than in the later‐life group, with six of nine risk factors presenting communalities > 0.5, versus two of nine in the later‐life group. The overall PAF was higher in the later‐life than in the midlife group: 56.0% (48.1 to 64.0) versus 38.8% (32.2 to 45.4), respectively (Table 3). The sensitivity analysis, excluding high blood pressure and obesity, from the overall PAF for subjects ≥65‐years‐old resulted in a significant drop in the total PAF to 32.8% (26.1 to 39.4) (Table A2).
FIGURE 1.
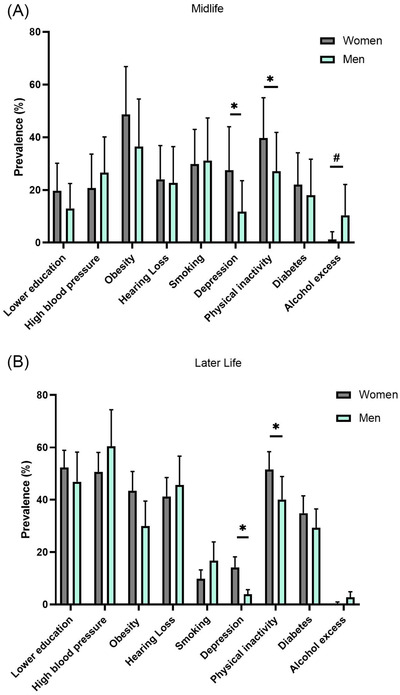
Sex comparison of dementia risk factors prevalence. (A) Midlife, (B) Later life. *Women had larger prevalence than men; #men had larger prevalence than women
3.1.2. Comparison between sexes
Women showed a higher prevalence of depression and physical inactivity than men at both age groups, whereas alcohol excess was more prevalent in midlife men than in women (Table 4, Figure 1). Women tend to show a higher overall PAF than men at both age groups (Table 4 and Figure 2).
FIGURE 2.
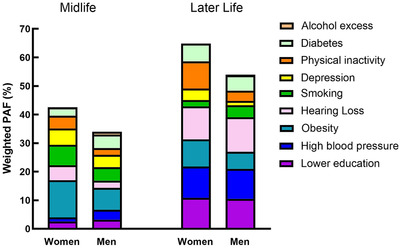
Individual and overall weighted population attributable fraction (PAF) for dementia risk factors stratified by sex and age groups
3.2. The total overall PAF in subjects ≥45‐years‐old
The total overall PAF in subjects ≥45‐years‐old was 45.8% (42.2 to 49.3). Although it resulted in a higher overall PAF in women (50.7%, 45.3 to 56.1) than in men (40.2%, 35.4 to 45.0).
4. DISCUSSION
This is the first study of the population attributable fraction of risk factors for dementia in Chile, and the first one that compares multiple dementia risk factors by sex. We found that 45.8% of dementia cases could be attributed to nine modifiable dementia risk factors. Women presented a higher overall PAF of dementia risk factors than men; likewise, the PAF was higher in later‐life than in midlife.
The greater overall PAF in later‐life than in midlife is related to the higher prevalence of the majority of the risk factors in the later‐life group. The risk factors with the highest individual weighted PAF for dementia in the later‐life group were lower education, high blood pressure, and hearing loss, whereas in the midlife group, the variables with the highest individual weighted PAF were obesity, smoking, and hearing loss. To compare our results with other studies of PAFs for dementia risk factors, differences in methodology must be taken into account (considering the evaluation of communalities between risk factors, risk factor definition, and type and number of risk factors included), as well as the source of the risk factors used in the analysis. Because PAFs from different risk factors share similar causal mechanisms, we adjusted each individual PAF by communalities; therefore, we discuss only studies that weighted their PAFs between risk factors. The overall weighted PAF in the later‐life group of our study was similar to the results of the previous largest LAC study that analyzed a pooled PAF of six other LAC countries: 55.8% (54.9 to 56.7), using similar nine risk factors (we used alcohol excess instead of social isolation), for a population ≥65‐years‐old. 10 Accordingly, they found the same risk factors with the highest individual PAF, 10 conferring important reliability to our results. When comparing with the global PAF of the 2017 world report, 35.0% (34.1‐35.9), 14 which analyzed similar nine risk factors in the population ≥45‐years‐old, our overall weighted PAF of 45.8% (42.2 to 49.3) was greater. These differences are driven by the higher prevalence of metabolic risk factors in Chile (high blood pressure, obesity, and diabetes), which doubles or triples the world estimations. 4 , 5 , 14 , 25 Consequently, after excluding high blood pressure and obesity from the overall PAF in subjects ≥65‐years‐old, this value would drop significantly (Table S2) resulting in an overall PAF in subjects ≥45‐years‐old similar to the world proportion. A recent meta‐analysis incorporated three additional risk factors compared to the previous world report, encompassing a total of 11 risk factors for dementia (including alcohol excess, traumatic brain injury, and air pollution), increasing the overall PAF of the 2020 world report to 40%. 25 Other studies analyzed only seven risk factors (lower education, hypertension, obesity, smoking, depression, physical inactivity, and diabetes), excluding hearing loss and social isolation. 4 , 5 , 15 , 26 , 27 , 28 These studies showed an important variability in the overall PAF for dementia risk factors, from 24% in Mozambique 15 to 48% in Australia, 26 with the great majority presenting an overall PAF near 30%. 15 , 27 , 28 This would leave our overall weighted PAF in subjects ≥45‐years‐old in the highest range. 26 This variability is determined largely by the different prevalence of some risk factors. 26
In summary, in Chile the overall PAF is similar to previous LAC reports, and to other HICs that presented a high prevalence of metabolic risk factors, such as Australia and Portugal. 4 , 10 , 14 , 15 , 26 These results suggest that the advanced epidemiological transition in Chile has been associated with a rapidly increased incidence of metabolic risk factors, especially obesity and diabetes. 29 Indeed, obesity accounted for the highest PAF for dementia during midlife for both sexes. In Chile, both obesity and underweight had been associated with cognitive impairment in subjects older than 60. 30 The proportion of subjects with obesity has increased significantly during the last decade in Chile and worldwide, 19 with a higher proportion in women than in men. 19 , 31 Worryingly, Chile, Mexico, and Costa Rica are the countries with the highest prevalence of child obesity (2‐ to 19‐years‐old) worldwide 31 . In fact, in LAC, high body mass index is the main risk factor for age‐adjusted disability‐adjusted life‐years (DALYs) of all causes. 12 Closely associated with overweight and obesity 12 , diabetes has been increasing during the last decades in Chile 19 and worldwide, 12 being especially significant in the midlife group. In relation to high blood pressure in Chile, 55% of persons ≥65‐years‐old have a systolic blood pressure (SBP) >140 mm Hg, which is similar to the prevalence of high blood pressure in other LAC countries 12 and the United States, 5 but is much higher than that reported in other parts of the world. 12 Although most epidemiological studies 4 , 5 , 6 , 10 , 14 suggest that midlife, but not late‐life, high blood pressure is associated with an increased risk of dementia, 4 , 6 longitudinal cohorts demonstrate that the persistence of high SBP into later‐life also increases the risk of dementia. 32 Furthermore, there is increasing evidence for the benefits of reducing SBP in older people, 33 as high blood pressure. is the leading cause for attributable DALYs in persons >50‐years‐old worldwide. 12 In accordance with the greater prevalence of metabolic risk factors for dementia in Chile, high cardiovascular risk factors are the main risk factors for mild cognitive impairment in “Latinos” living in the United States. 34 Similarly, an anatomopathological study in Brazil 35 showed a greater prevalence of vascular dementia than in other parts of the world.
Comparable to other reports, 10 , 14 , 25 hearing loss was one of the most significant risk factors for dementia in our study, both in midlife and later‐life. 14 The association between hearing loss and dementia has been established for subjects ≥45‐years‐old with a hearing threshold >25 dB. 36 One of the limitations of our study is that we do not have an objective measurement of hearing loss, and self‐report probably underestimates the real prevalence of hearing impairment compared with audiometry in subjects >50‐years‐old who tend to underreport hearing loss. 37 Despite this limitation, self‐perceived hearing loss is also associated with an accelerated cognitive decline. 38 Because it is closely related with the aging process, the number of subjects with disabling hearing loss is expected to increase, and 80% of the population with this condition live in LMICs. 39 Another prevalent risk factor was current smoking, mostly present in the midlife group in our study. In fact, smoking is one of the modifiable risk factors with the highest PAF for dementia 4 worldwide. Fortunately, its prevalence is descending globally. 12
Lower education was mostly significant in the older group, where more than 50% of the population have fewer than 7 years of formal education. This risk factor has been described as presenting the highest PAF for dementia worldwide, given its great estimated prevalence. 4 , 8 , 10 , 25 It is associated with a lower cognitive reserve, a greater proportion of risk factors, and an increased risk of brain injury. 40 Fortunately, Chile has established 12 years of compulsory and free schooling, similarly to many other LAC countries, 11 and consequently this risk factor is declining in LAC.
Our most novel result was the sex differences in dementia risk factors. We found that women had a higher overall PAF for dementia risk factors than men. This was driven by the greater prevalence of physical inactivity and depression, and a tendency for obesity in women compared to men (Table 4, Figures 1 and 2). The prevalence of depression was almost 3‐fold higher in women than in men, at each age group, reflecting a higher burden of depression in Chile, similar to worldwide reports. 41 Multiple meta‐analyses have corroborated that a history of depression throughout the life course confers an increased risk for later developing Alzheimer's disease and other dementias. 4 , 5 , 14 Our study's reported prevalence of depression in the last 12 months was similar to previous Chilean reports of lifetime prevalence of affective disorders, showing 16.7% to 18.4% in midlife and 10% in subjects ≥65‐years‐old, conferring consistency to our data. 42
Our study revealed physical inactivity as one of the main drivers of a higher PAF in women than in men, being more prevalent in women than in men worldwide, especially in low socioeconomic backgrounds. 43 This finding matches other studies, which estimate that physical inactivity is one the most important risk factors for dementia in women in LMIC. 44 In Chile, physical inactivity had been associated previously with cognitive impairment in persons >60‐years‐old, 45 most probably given its relation to the majority of metabolic risk factors and cardiovascular disease, as it is one of the main modifiable factors for non‐communicable diseases. 43
Our findings most likely reflect global differences in sociocultural status between sexes, as women have less access to a complete education, 11 , coupled with more familiar responsibilities such as child and parent care, 46 which is associated with a lower income and a higher burden of mental morbidity. 41 These findings are of special relevance for health policies in dementia prevention, because women present a higher prevalence of Alzheimer's disease and other dementias than men. 18 In addition, women live longer, thus contributing a greater proportion to dementia burden. 18
4.1. Study strengths and limitations
We employed data from the 2017 Ch‐NHS, a nationally representative sample of the Chilean population. Furthermore, the Ch‐NHS allows us to assess several risk factors in an objective and reliable manner (SBP, anthropometrics, fasting glucose) instead of using self‐reported data. 17 Unlike other studies, 4 , 5 , 14 , 15 , 26 all of our analyses (prevalence, communalities, and overall PAF) come from the same information source, assuring a high internal consistency. In addition, the overall PAF was adjusted considering the communalities between risk factors. Unfortunately, the Ch‐NHS did not have reliable data for some risk factors that have been related with dementia; however, said variables present a lower effect size: social isolation (individual weighted PAF <1% in a previous LAC study 17 ), traumatic brain injury (PAF = 3%), and air pollution (PAF = 2%). 17
A limitation that is common to all studies regarding PAFs for modifiable risk factors for dementia, is related to the relative risk data, as it has been obtained from other populations, 4 , 5 , 14 with data obtained more than 15 years ago for many variables, 4 , 5 and it is presented as dichotomic variables instead of as a continuous relation between the risk factor magnitude and dementia risk. Another limitation is related with the use of the SCh‐MMSE for excluding subjects with cognitive impairment, as there is evidence of it being unsensitive for detecting subjects with mild cognitive impairment and dementia. 47
5. CONCLUSIONS
A very large proportion of the dementia burden in Chile could be attributed to modifiable risk factors. This overall PAF is similar to other LAC countries, but it is higher than in other world regions, a difference that was associated with the higher prevalence of metabolic risk factors in our population. 12 Women showed a higher overall weighted PAF than men, driven by a higher prevalence of physical inactivity and depression, demonstrating the importance of future analyses stratified by sex for precise preventive strategies.
Evaluating the best action plans for reducing the prevalence of non‐communicable diseases in LAC, especially obesity, diabetes, and hypertension, is urgent. 2 , 29 Possibly the most cost‐effective approach would be population based, including the promotion of a healthy lifestyle from early life, 48 with special emphasis on physical activity in women, 44 and involving multiple levels of society (education, transportation, urbanization, and health services), including strategies to prevent hearing loss, such as the reduction to noise exposition. 14 , 39 In older adults who already present cardiovascular risk factors, multi‐domain interventions promoting a healthy lifestyle and a strict control of SBP levels has demonstrated effectiveness in reducing chronic diseases and cognitive decline. 6 , 25 Thus evaluating the feasibility of multi‐intervention trials for dementia prevention in LAC will be an opportunity for policymakers in this region. 49
RV had nothing to disclose.
PZ had nothing to disclose.
CSM was partially supported by a grant from ANID [Postdoctoral Fondecyt/3200153].
AS was partially supported by grants from ANID [FONDAP/ 15150012], ANID [ Fondecyt Regular / 1191726], and National Institute on Aging of the National Institutes of Health (NIA‐NIH) [The Multi‐partner consortium to expand dementia research in Latin America (ReDLat), award number R01AG057234], an Alzheimer's Association grant [SG‐20‐725707‐ReDLat], the Rainwater Foundation, and the Global Brain Health Institute (GBHI).
In the last 36 months:
CD was partially supported by the grant from ANID [ACT/ACP1403].
RV had nothing to disclose.
PZ had a grant for PhD studies. The grant pays the university fees and a salary. He is member of a research team about the assessment of folic acid and Iodine supplementation policies. The payment was made to the Institution. The King's College London gave him support for attending to a scientific congress about Health Services Research.
AS was partially supported by grants from ANID [FONDAP/ 15150012], ANID [ Fondecyt Regular / 1191726] and NIA‐NIH [The Multi‐partner consortium to expand dementia research in Latin America (ReDLat), award number R01AG057234], an Alzheimer's Association grant [SG‐20‐725707‐ReDLat], the Rainwater Foundation, and the GBHI.
AS is the Vice President of Coprad (Corporacion Profesional de Alzheimer y Otras demencia), a non‐profit organization.
CSM was partially supported by a grant from ANID [ Postdoctoral Fondecyt/3200153].
CONFLICTS OF INTEREST
None of the authors have any conflict of interest to declare. The funding sources do not have any competing interest in the elaboration of this manuscript.
ACKNOWLEDGEMENTS
We specially thank Dr. Paul H Délano from the University of Chile for his critical review of the manuscript.
CD was partially supported by a grant from the Alzheimer Association International [SG‐21‐815077‐LatAm FINGERS – Chile], and a grant from the National Research and Development Agency (ANID) [FONDEF/20I10371].
1.
TABLE A1.
Missing data
| Age group | Diabetes | Alcohol Excess | Obesity | High Blood Pressure | Physical Inactivity | Low Education | |
|---|---|---|---|---|---|---|---|
| Women | 45‐64 | 165 (13%) | 138 (11%) | 115 (9%) | 112 (9%) | 42 (3%) | 17 (1%) |
| ≥65 | 116 (13%) | 114 (13%) | 96 (11%) | 91 (10%) | 27 (3%) | 8 (1%) | |
| Total | 281 (13%) | 168 (12%) | 211 (10%) | 203 (9%) | 69 (3%) | 25 (1%) | |
| Men | 45‐64 | 120 (16%) | 113 (15%) | 92 (12%) | 90 (12%) | 34 (5%) | 7 (1%) |
| ≥65 | 57 (12%) | 55 (12%) | 46 (10%) | 42 (9%) | 15 (3%) | 4 (1%) | |
| Total | 177 (15%) | 168 (14%) | 138 (11%) | 132 (11%) | 49 (4%) | 11 (1%) | |
| Total | 45‐64 | 285 (14%) | 251 (12%) | 207 (10%) | 202 (10%) | 76 (4%) | 24 (1%) |
| ≥65 | 173 (13%) | 169 (13%) | 142 (11%) | 133 (10%) | 42 (3%) | 12 (1%) | |
| Total | 458 (14%) | 420 (12%) | 349 (10%) | 335 (10%) | 118 (3%) | 36 (3%) |
The number (percentage) of subjects with missing data at each variable is shown.
TABLE A2.
Individual and overall weighted PAF for dementia risk factors in later life group after excluding high blood pressure and obesity
| Total ≥65‐years‐old | Women ≥65‐years‐old | Men ≥65‐years‐old | |
|---|---|---|---|
| Risk Factor | Weighted PAF % | Weighted PAF % | Weighted PAF % |
| Low Education | 7.6 (4.3‐11.2) | 11.1 (6.4‐16.1) | 7.6 (4.1‐11.7) |
| Hearing Loss | 10.2 (5.7‐14.9) | 12.2 (6.7‐17.8) | 13.5 (7.8‐19.1) |
| Smoking | 3.4 (0.8‐6.3) | 2.3 (0.4‐4.4) | 2.7 (0.6‐5.2) |
| Depression | 2.9 (1.6‐4.5) | 4.1 (2.3‐6.2) | 1.9 (0.8‐3.3) |
| Physical Inactivity | 6.3 (3.2‐9.8) | 9 (4.7‐13.6) | 4.2 (1.9‐7.1) |
| Diabetes | 2.2 (1.1‐3.4) | 6.5 (3.6‐9.8) | 2.8 (1.4‐4.6) |
| Alcohol Excess | 0.2 (0.1‐0.3) | 0.1 (0‐0.2) | 0.2 (0‐0.4) |
| Overall PAF | 32.8 (26.1‐39.4) | 45.2 (37.2‐53.3) | 32.9 (26.3‐39.6) |
PAF, population attributable fraction. Data are means (2.5%‐97.5% uncertainty intervals).
Vergara RC, Zitko P, Slachevsky A, et al. Population attributable fraction of modifiable risk factors for dementia in Chile. Alzheimer's Dement. 2022;14:e12273. 10.1002/dad2.12273
REFERENCES
- 1. Prince M, Bryce R, Albanese E, Wimo A, Ribeiro W, Ferri CP. The global prevalence of dementia: a systematic review and metaanalysis. Alzheimer's Dement. 2013;9(1):63‐75.e2. 10.1016/j.jalz.2012.11.007. [DOI] [PubMed] [Google Scholar]
- 2. Nitrini R, Barbosa MT, Brucki SMD, Yassuda MS, Caramelli P. Current trends and challenges on dementia management and research in Latin America. J Glob Health. 2020;10(1). 10.7189/JOGH.10.010362. [DOI] [PMC free article] [PubMed] [Google Scholar]
- 3. Brookmeyer R, Johnson E, Ziegler‐Graham K, Arrighi HM. Forecasting the global burden of Alzheimer's disease. Alzheimer's Dement. 2007;3(3):186‐191. 10.1016/j.jalz.2007.04.381. [DOI] [PubMed] [Google Scholar]
- 4. Norton S, Matthews FE, Barnes DE, Yaffe K, Brayne C. Potential for primary prevention of Alzheimer's disease: an analysis of population‐based data. Lancet Neurol. 2014;13(8):788‐794. 10.1016/S1474-4422(14)70136-X. [DOI] [PubMed] [Google Scholar]
- 5. Barnes DE, Yaffe K. The projected effect of risk factor reduction on Alzheimer's disease prevalence. Lancet Neurol. 2011;10(9):819‐828. 10.1016/S1474-4422(11)70072-2. [DOI] [PMC free article] [PubMed] [Google Scholar]
- 6. Kivipelto M, Mangialasche F, Ngandu T. Lifestyle interventions to prevent cognitive impairment, dementia and Alzheimer disease. Nat Rev Neurol. 2018;14(11):653‐666. 10.1038/s41582-018-0070-3. [DOI] [PubMed] [Google Scholar]
- 7. Wolters FJ, Chibnik LB, Waziry R, et al. Twenty‐seven‐year time trends in dementia incidence in Europe and the United States: the Alzheimer Cohorts Consortium. Neurology. 2020;95(5):e519‐e531. 10.1212/WNL.0000000000010022. [DOI] [PMC free article] [PubMed] [Google Scholar]
- 8. Wu YT, Beiser AS, Breteler MMB, et al. The changing prevalence and incidence of dementia over time‐current evidence. Nat Rev Neurol. 2017;13(6):327‐339. 10.1038/nrneurol.2017.63. [DOI] [PubMed] [Google Scholar]
- 9. Anstey KJ, Ee N, Eramudugolla R, Jagger C, Peters R. A Systematic Review of Meta‐Analyses that Evaluate Risk Factors for Dementia to Evaluate the Quantity, Quality, and Global Representativeness of Evidence. J Alzheimer's Dis. 2019;70(s1):S165‐S186. 10.3233/JAD-190181. [DOI] [PMC free article] [PubMed] [Google Scholar]
- 10. Mukadam N, Sommerlad A, Huntley J, Livingston G. Population attributable fractions for risk factors for dementia in low‐income and middle‐income countries: an analysis using cross‐sectional survey data. Lancet Glob Heal. 2019;7(5):e596‐e603.. 10.1016/S2214-109X(19)30074-9. [DOI] [PMC free article] [PubMed] [Google Scholar]
- 11. Subnational HDI Maps ‐ Global Data Lab. https://globaldatalab.org/shdi/maps/shdi/ Accessed April 20, 2021.
- 12. GBD Compare | IHME Viz Hub. https://vizhub.healthdata.org/gbd‐compare/ Accessed March 18, 2021.
- 13. Rodriguez JJL, Ferri CP, Acosta D, et al. Prevalence of dementia in Latin America, India, and China: a population‐based cross‐sectional survey. Lancet. 2008;372(9637):464‐474. 10.1016/S0140-6736(08)61002-8. [DOI] [PMC free article] [PubMed] [Google Scholar]
- 14. Livingston G, Sommerlad A, Orgeta V, et al. Dementia prevention, intervention, and care. Lancet. 2017;390(10113):2673‐2734. 10.1016/S0140-6736(17)31363-6. [DOI] [PubMed] [Google Scholar]
- 15. Oliveira D, Mabunda D, et al. Reducing the Number of People with Dementia Through Primary Prevention in Mozambique, Brazil, and Portugal: an Analysis of Population‐Based Data. J Alzheimer's Dis. 2019;70(s1):S283‐S291. 10.3233/JAD-180636. [DOI] [PMC free article] [PubMed] [Google Scholar]
- 16. Wu C, Zhou D, Wen C, Zhang L, Como P, Qiao Y. Relationship between blood pressure and Alzheimer's disease in Linxian County, China. Life Sci. 2003;72(10):1125‐1133. 10.1016/S0024-3205(02)02367-6. [DOI] [PubMed] [Google Scholar]
- 17. Walker R, Paddick SM. Dementia prevention in low‐income and middle‐income countries: a cautious step forward. Lancet Glob Heal. 2019;7(5):e538‐e539. 10.1016/S2214-109X(19)30169-X. [DOI] [PubMed] [Google Scholar]
- 18. Ferretti MT, Iulita MF, Cavedo E, et al. Sex differences in Alzheimer disease — The gateway to precision medicine. Nat Rev Neurol. 2018;14(8):457‐469. 10.1038/s41582-018-0032-9. [DOI] [PubMed] [Google Scholar]
- 19. ENCUESTA NACIONAL DESALUD 2016‐2017 Primeros Resultados.
- 20. Icaza MG, Albala C, Minimental State Examinations (MMSE) del estudio de demencia en Chile : análisis estadístico. 1999:18‐18. http://www.paho.org/spanish/hdp/hdr/serie07composite.pdf. Accessed March 18, 2021.
- 21. Hoos T, Espinoza N, Marshall S, Arredondo EM. Validity of the global physical activity questionnaire (GPAQ) in adult latinas. J Phys Act Heal. 2012;9(5):698‐705. 10.1123/jpah.9.5.698. [DOI] [PMC free article] [PubMed] [Google Scholar]
- 22. Alvarado ME, Garmendia ML, Acuña G, Santis R, Arteaga O. Validez y confiabilidad de la versión chilena del alcohol use disorders identification test (AUDIT). Rev Med Chil. 2009;137(11):1463‐1468. 10.4067/s0034-98872009001100008. [DOI] [PubMed] [Google Scholar]
- 23. Raîche G, Walls TA, Magis D, Riopel M, Blais JG. Non‐graphical solutions for Cattell's scree test. Methodology. 2013;9(1):23‐29. 10.1027/1614-2241/a000051. [DOI] [Google Scholar]
- 24. WEB DISEMINACIÓN CENSO 2017. http://resultados.censo2017.cl/Home/Download. Accessed May 31, 2021.
- 25. Livingston G, Huntley J, Sommerlad A, et al. Dementia prevention, intervention, and care: 2020 report of the Lancet Commission. Lancet. 2020;396(10248):413‐446. 10.1016/S0140-6736(20)30367-6. [DOI] [PMC free article] [PubMed] [Google Scholar]
- 26. Ashby‐Mitchell K, Burns R, Shaw J, Anstey KJ. Proportion of dementia in Australia explained by common modifiable risk factors. Alzheimer's Res Ther. 2017;9(1):1‐8. 10.1186/s13195-017-0238-x. [DOI] [PMC free article] [PubMed] [Google Scholar]
- 27. Kotaki Y, Tomata Y, Tanji F, Zhang S, Sugawara Y, Tsuji I. Joint impact of seven risk factors on incident dementia in elderly Japanese: the Ohsaki Cohort 2006 Study. J Neurol. 2019;266(5):1222‐1229. 10.1007/s00415-019-09252-w. [DOI] [PubMed] [Google Scholar]
- 28. Liu Y, Zhang S, Tomata Y, Nurrika D, Sugawara Y, Tsuji I. The impact of risk factors for dementia in China. Age Ageing. 2020;49(5):850‐855. 10.1093/ageing/afaa048. [DOI] [PubMed] [Google Scholar]
- 29. Kain J, Vio F, Albala C. Obesity trends and determinant factors in Latin America. Cad Saude Publica. 2003;19(suppl 1):S77‐S86. 10.1590/s0102-311X2003000700009. [DOI] [PubMed] [Google Scholar]
- 30. Concha‐Cisternas Y, Lanuza F, Waddell H, et al. Association between adiposity levels and cognitive impairment in the Chilean older adult population. J Nutr Sci. 2019;8:1‐8. 10.1017/jns.2019.24. [DOI] [PMC free article] [PubMed] [Google Scholar]
- 31. Ng M, Fleming T, Robinson M, et al. Global, regional, and national prevalence of overweight and obesity in children and adults during 1980‐2013: a systematic analysis for the Global Burden of Disease Study 2013. Lancet. 2014;384(9945):766‐781. 10.1016/S0140-6736(14)60460-8. [DOI] [PMC free article] [PubMed] [Google Scholar]
- 32. McGrath ER, Beiser AS, DeCarli C, et al. Blood pressure from mid‐to late life and risk of incident dementia. Neurology. 2017;89(24):2447‐2454. 10.1212/WNL.0000000000004741. [DOI] [PMC free article] [PubMed] [Google Scholar]
- 33. Hughes D, Judge C, Murphy R, et al. Association of Blood Pressure Lowering with Incident Dementia or Cognitive Impairment: a Systematic Review and Meta‐analysis. JAMA ‐ J Am Med Assoc. 2020;323(19):1934‐1944. 10.1001/jama.2020.4249. [DOI] [PMC free article] [PubMed] [Google Scholar]
- 34. González G, Vives A. Work Status, Financial Stress, Family Problems, and Gender Differences in the Prevalence of Depression in Chile. Ann Work Expo Heal. 2019;63(3):359‐370. 10.1093/annweh/wxy107. [DOI] [PubMed] [Google Scholar]
- 35. Grinberg LT, Nitrini R, Suemoto CK, et al. Prevalence of dementia subtypes in a developing country: a clinicopathological study. Clinics. 2013;68(8):1140‐1145. 10.6061/clinics/2013(08)13. [DOI] [PMC free article] [PubMed] [Google Scholar]
- 36. Lin FR, Metter EJ, O'Brien RJ, Resnick SM, Zonderman AB, Ferrucci L. Hearing loss and incident dementia. Arch Neurol. 2011;68(2):214‐220. 10.1001/archneurol.2010.362. [DOI] [PMC free article] [PubMed] [Google Scholar]
- 37. Rawool VW, Kiehl JM. Perception of hearing status, communication, and hearing aids among socially active older individuals. J Otolaryngol. 2008;37:27‐42. https://www.google.com/search?sxsrf=ALeKk02A0XZZVwJW7HOHyenyP0yom39p_A:1616082177619&q=Rawool+VW,+Kiehl+JM.+Perception+of+hearing+status,+communication,+and+hearing+aids+among+socially+active+older+individuals.+J+Otolaryngol+2008%3B+37:+27‐42.&sa=X&ved=2ahUKEwjls_‐gl7rvAhXfILkGHfNMAc0Q7xYoAHoECAMQNQ&biw=1280&bih=610. Accessed March 18, 2021. [PubMed] [Google Scholar]
- 38. Amieva H, Ouvrard C, Giulioli C, Meillon C, Rullier L, Dartigues JF. Self‐reported hearing loss, hearing AIDS, and cognitive decline in elderly adults: a 25‐year study. J Am Geriatr Soc. 2015;63(10):2099‐2104. 10.1111/jgs.13649. [DOI] [PubMed] [Google Scholar]
- 39. Wilson BS, Tucci DL, Merson MH, O'Donoghue GM. Global hearing health care: new findings and perspectives. Lancet. 2017;390(10111):2503‐2515. 10.1016/S0140-6736(17)31073-5. [DOI] [PubMed] [Google Scholar]
- 40. Valenzuela MJ, Sachdev P. Brain reserve and dementia: a systematic review. Psychol Med. 2006;36(4):441‐454. 10.1017/S0033291705006264. [DOI] [PubMed] [Google Scholar]
- 41. Salk RH, Hyde JS, Abramson LY. Gender differences in depression in representative national samples: meta‐analyses of diagnoses and symptoms. Psychol Bull. 2017;143(8):783‐822. 10.1037/bul0000102. [DOI] [PMC free article] [PubMed] [Google Scholar]
- 42. Vicente B, Kohn R, Rioseco P, Saldivia S, Levav I, Torres S. Lifetime and 12‐month prevalence of DSM‐III‐R disorders in the Chile psychiatric prevalence study. Am J Psychiatry. 2006;163(8):1362‐1370. 10.1176/ajp.2006.163.8.1362. [DOI] [PubMed] [Google Scholar]
- 43. Hallal PC, Andersen LB, Bull FC, et al. Global physical activity levels: surveillance progress, pitfalls, and prospects. Lancet. 2012;380(9838):247‐257. 10.1016/S0140-6736(12)60646-1. [DOI] [PubMed] [Google Scholar]
- 44. Feter N, Leite JS, Cassuriaga J, et al. Are gender differences in physical inactivity associated with the burden of dementia in low‐ and lower‐middle income countries?. Glob Public Health. 2021. 10.1080/17441692.2020.1871497. [DOI] [PubMed] [Google Scholar]
- 45. Poblete‐Valderrama F, Rivera CF, Petermann‐Rocha F, et al. Physical activity and sedentary behaviours are associated with cognitive impairment in Chilean older adults. Rev Med Chil. 2019;147(10):1247‐1255. 10.4067/s0034-98872019001001247. [DOI] [PubMed] [Google Scholar]
- 46. Sharma N, Chakrabarti S, Grover S. Gender differences in caregiving among family ‐ caregivers of people with mental illnesses. World J Psychiatry. 2016;6(1):7. 10.5498/wjp.v6.i1.7. [DOI] [PMC free article] [PubMed] [Google Scholar]
- 47. Jiménez D, Lavados M, Rojas P, Henríquez C, Silva F, Guillón M. Evaluación del minimental abreviado de la evaluación funcional del adulto mayor (EFAM) como screening para la detección de demencia en la atención primaria. Rev Med Chil. 2017;145(7):862‐868. 10.4067/S0034-98872017000700862. [DOI] [PubMed] [Google Scholar]
- 48. Li Y, Schoufour J, Wang DD, et al. Healthy lifestyle and life expectancy free of cancer, cardiovascular disease, and type 2 diabetes: prospective cohort study. BMJ. 2020;368. 10.1136/bmj.l6669. [DOI] [PMC free article] [PubMed] [Google Scholar]
- 49. The Lancet Neurology . Latin America takes centre stage in dementia prevention. Lancet Neurol. 2020;19(9):711. 10.1016/S1474-4422(20)30260-X [DOI] [PubMed] [Google Scholar]