Abstract
High-throughput metabolomics using liquid chromatography and mass spectrometry (LC/MS) provide a useful method to identify biomarkers of disease and explore biological systems. However, the majority of metabolic features detected from untargeted metabolomics experiments have unknown ion signatures, making it critical that data should be thoroughly quality controlled to avoid analyzing false signals. Here we present a post-alignment method relying on intermittent pooled study samples to separate genuine metabolic features from potential measurement artifacts. We apply the method to lipid metabolite data from the PREDIMED (PREvención con DIeta MEDi-terránea) study to demonstrate clear removal of measurement artifacts. The method is publicly available as the R package MetProc, available on CRAN under the GPL-v2 license.
Keywords: Untargeted metabolomics, measurement artifact, missing pattern, pooled QC sample
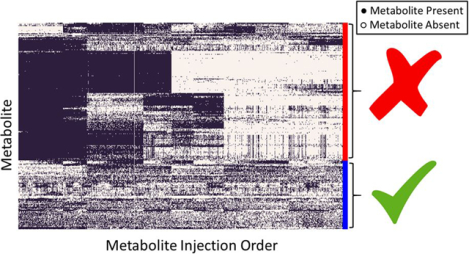
Graphical Abstract

INTRODUCTION
Generating metabolite profiles has been a useful strategy for identifying altered metabolic pathways associated with diseases, determining gene and protein function, and understanding biological systems.1 Generally, metabolomics experiments are divided into two main categories: targeted metabolomics and untargeted metabolomics.2 While targeted metabolomics generally produce higher quality signals, mass spectrometry-based untargeted metabolomics studies provide a mechanism to capture comprehensive metabolite profiles without being constrained to those with known ion signals.2–3 Given the lack of reference ion signal for the majority of untargeted metabolic features, quality control procedures are critical to avoid analyzing measurement artifacts.
Many computational approaches and tools have been developed to improve the reproducibility of LC/MS methods and the quality of metabolite profiles. XCMS implements second derivative Gaussian filter for metabolic feature detection and noise removal, and aligns peaks across samples by feature binning in mass domain and kernel density estimator in chromatographic time domain.4 It also implements the centWave algorithm using wavelet transformation to better detect close-by and partially overlapping features to increase precision and recall rate.5 apLCMS makes several technical improvements like adaptive tolerance level searching and non-parametric intensity grouping.6 Based on previous algorithms, xMSanalyzer shows that variation of parameter settings for peak detection allows the detection of more features, and it provides a set of utilities to for sample quality and feature consistency evaluation.7 QCscreen offers many useful visualization tools to inspect basic quality-related parameters of predefined analytical features and evaluate multiple sample types.8 For large scale untargeted metabolomics studies, quality control (QC) samples are usually incorporated for quality assurance and quality control.9 However, these tools either neglect sample types or only calculate simple summary statistics for replicate samples or QC samples and did not fully utilize feature missingness pattern after feature alignment. In this paper, we propose a new method aiming to employ missingness pattern information to remove metabolomic feature artifact after feature detection and alignment.
Two types of quality control samples are typically available in untargeted metabolomics studies: pooled study samples consisting of same amounts of each study biological sample (PP samples in Figure 1a and Figure 1b and industry standard biofluids consisting of biological samples not in the study.10 These quality control samples are intermittently processed between blocks of biological samples and serve 3 main purposes: 1. Equilibrate the analytical platform, 2. Provide a quality assurance measure for each block of biological samples, and 3. Provide data for a signal correction between analytical blocks.10 We implement our new method in the R package MetProc and demonstrate the utility of our method using plasma metabolite data from the PREDIMED (PREvención con DIeta MEDi-terránea) study (www.predimed.es). In the rest of the paper we use plasma samples as a demonstration, but our method is applicable to other types of biological samples with pooled study samples as QC reference.
Figure 1.

Block designation for (a) the missing rate correlation metric and (b) the longest consecutive run metric. PPi indicates a pooled plasma sample and Biological Samplesi indicates a block of biological samples.
EXPERIMENTAL SECTION
Study samples and metabolite profiling
Fasting blood samples were collected at baseline and yearly follow-up from PREDIMED participants by trained nurses. Plasma EDTA tubes were collected and aliquots were coded and kept refrigerated until they were stored at −80° after an overnight fast. All the samples were first randomly ordered and shipped on dry ice to the Broad Institute of Harvard and MIT for the metabolomics analyses.
Liquid chromatography tandem mass spectrometry on a system comprised of Shimadzu Nexera X2 U-HPLC (Shimadzu Corp.; Marlborough, MA) coupled to a Q Exactive hybrid quadrupole orbitrap mass spectrometer (Thermo Fisher Scientific; Waltham, MA) were used to profile lipidomics data. Pooled plasma samples and industry standard biofluids were incorporated in the analytical queue for every 20 biological samples. The raw data were processed using TraceFinder software (Thermo Fisher Scientific; Waltham, MA) and Progenesis QI (Nonlinear Dynamics; Newcastle upon Tyne, UK). Details about study samples and mass spectrometry settings are available in a previous study.11
Statistical method
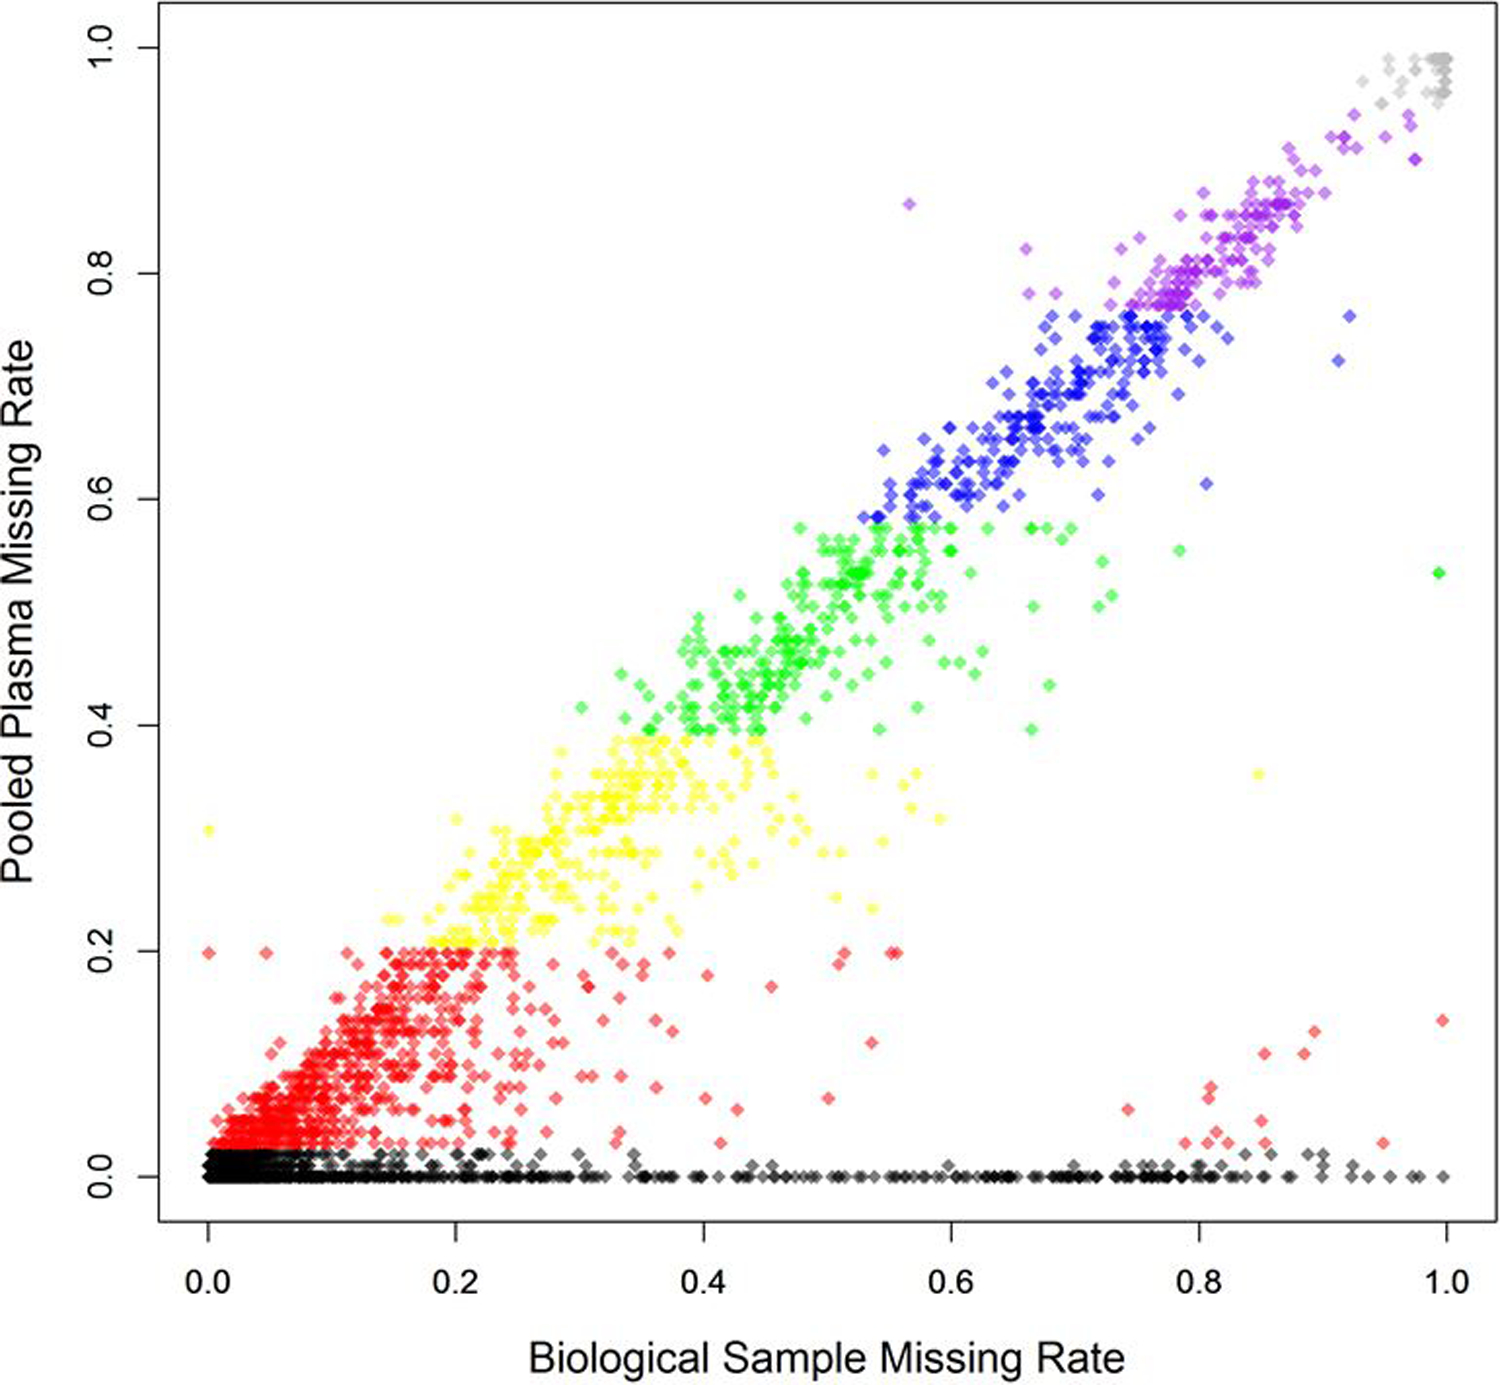
Our proposed method, MetProc, employs three metrics in a stepwise process to determine if a metabolic feature is a potential artifact. First, the missing rate of pooled plasma samples for each metabolic feature is computed. This value should be low for true metabolic feature as a metabolic feature present in biological samples is likely to be present in the pooled plasma and in all repeated replications (PP samples in Figure 1a and Figure 1b). Metabolic feature with high pooled plasma missing rates (default > 95%) are considered artifacts and removed. Metabolic feature with low pooled plasma missing rates (default ≤ 5%) are considered likely true metabolic feature and retained. While pooled plasma missing rates generally align with biological sample missing rates, some true metabolic feature may have low pooled plasma missing rates and high biological sample missing rates (Figure 2).
Figure 2.

Correspondence of pooled plasma missing rate and biological sample missing rate across 6,359 lipid metabolites from the PREDIMED study. Colored sections correspond to the 5 splits of metabolites based on pooled plasma missing rate. Grey metabolites are above the top threshold of pooled plasma missing rates and removed and black samples are below the bottom threshold for pooled plasma missing rates and retained. Additional criteria are applied to the remaining 5 groups of metabolites to detect structure in their missing data.
Metabolic features with pooled plasma missing rates between the two thresholds are separated into a designated number of groups (5 groups by default) based on evenly spaced pooled plasma missing rate categories (colored groups in Figure 2). For each group, two additional metrics are computed to identify metabolic features with structured missing data using a flexible threshold for each group. Structured patterns in missing data indicate that those metabolic features were present in only a few segments of the injection order. This phenomenon would have no biological interpretation because the study samples were randomly ordered before injection per standard lab practice. While a real metabolite should appear in most pooled plasma samples, it may only appear in a subset of the biological study samples across a random injection order. On the other hand, a technical batch effect producing metabolic artifacts should affect both the pooled plasma samples and their nearby study samples such that their missing pattern would have a high correlation or concordance rate.
For the first additional metric, the injection order of a metabolomics experiment can be broken into blocks as shown in Figure 1a. For each metabolic feature, a pooled plasma missing rate (0, 0.5 or 1) and biological sample missing rate (0 to 1) are computed in each block. We used the Pearson’s correlation of these missing rates across blocks to quantify the degree to which missing data is structured along the injection order. When the correlation metric is high, missing data appear in blocks across injection order. These metabolites should be removed as they are likely measurement artifacts. The default thresholds for each of the five groups of metabolites, respectively, are ≥0.6, ≥0.65, ≥0.65, ≥0.65, and ≥0.6.
For the second additional metric, the injection order can be separated into blocks as shown in Figure 1b. When the leading pooled plasma sample of a block is non-missing and the following biological samples have a small missing rate (default of < 0.5), the block is considered to have data present. The longest consecutive run of blocks with data present can be calculated for each metabolic feature. Metabolic features displaying structure in their missing data across injection order generally have long runs. The default thresholds for each of the five groups of metabolic features, respectively, are no cutoff, ≥15, ≥15, ≥15, and no cutoff. The longest run metric is ineffective when most data are present or missing and therefore it is not applied to all groups of metabolic features.
RESULTS AND DISCUSSION
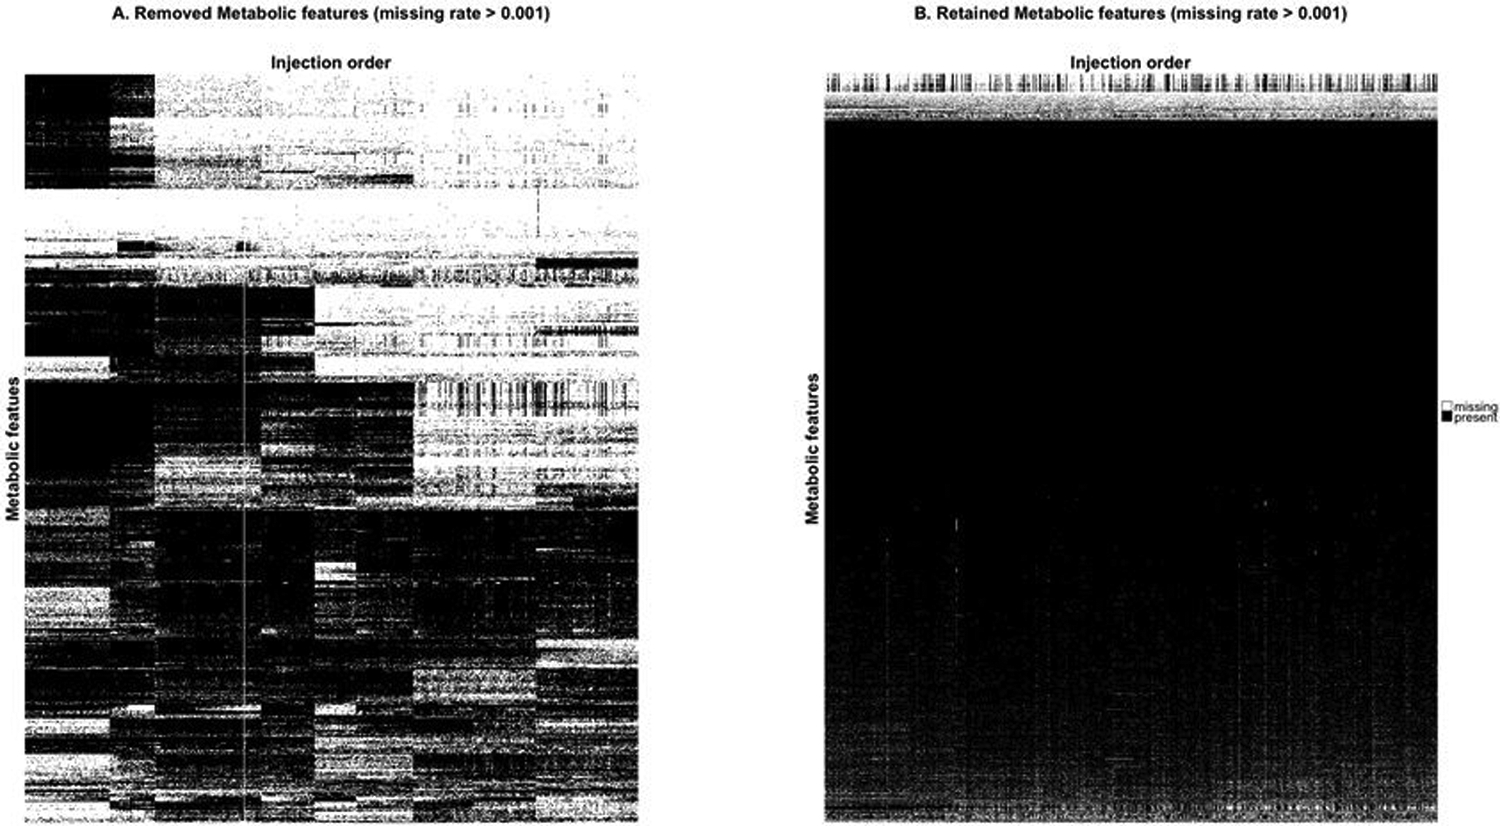
To illustrate this method, we use data generated for the PREDIMED study (www.predimed.es)12 for analyses of lipid metabolites.11, 13 The data consists of 6,359 lipid metabolic features from 1,989 biological samples (with repeated measures of most participants at base-line and after 1 year follow-up) and 101 pooled plasma samples. Applying the MetProc process with default settings removes 1,074 of 6,359 metabolic features. Additionally, MetProc provides a variety of graphical tools for plotting patterns of missing data for removed and retained metabolites (see Figure 3a and Figure. 3b). Removed metabolic features demonstrate clear patterns in data missingness across the injection order, suggesting that they may be measurement artifacts due to technical batch effect. Conversely, retained metabolic features tend to contain data across the majority of samples, have random dispersion of missing data across the injection order, or have largely missing data for biological samples, but low missing rates in pooled plasma samples.
Figure 3.

Missing data patterns of metabolites across injection order are visualized in (a) the removed metabolites and (b) the retained metabolites using lipid data from the PREDIMED study. Each row represents a metabolite and each column is a sample, sorted by injection order. Black marks represent present data and white marks represent missing data. Metabolites are clustered using hierarchical clustering to better illustrate block structure. In both cases only metabolic features with overall missing rates greater than 0.001 are included to avoid plotting metabolic features with completely present data.
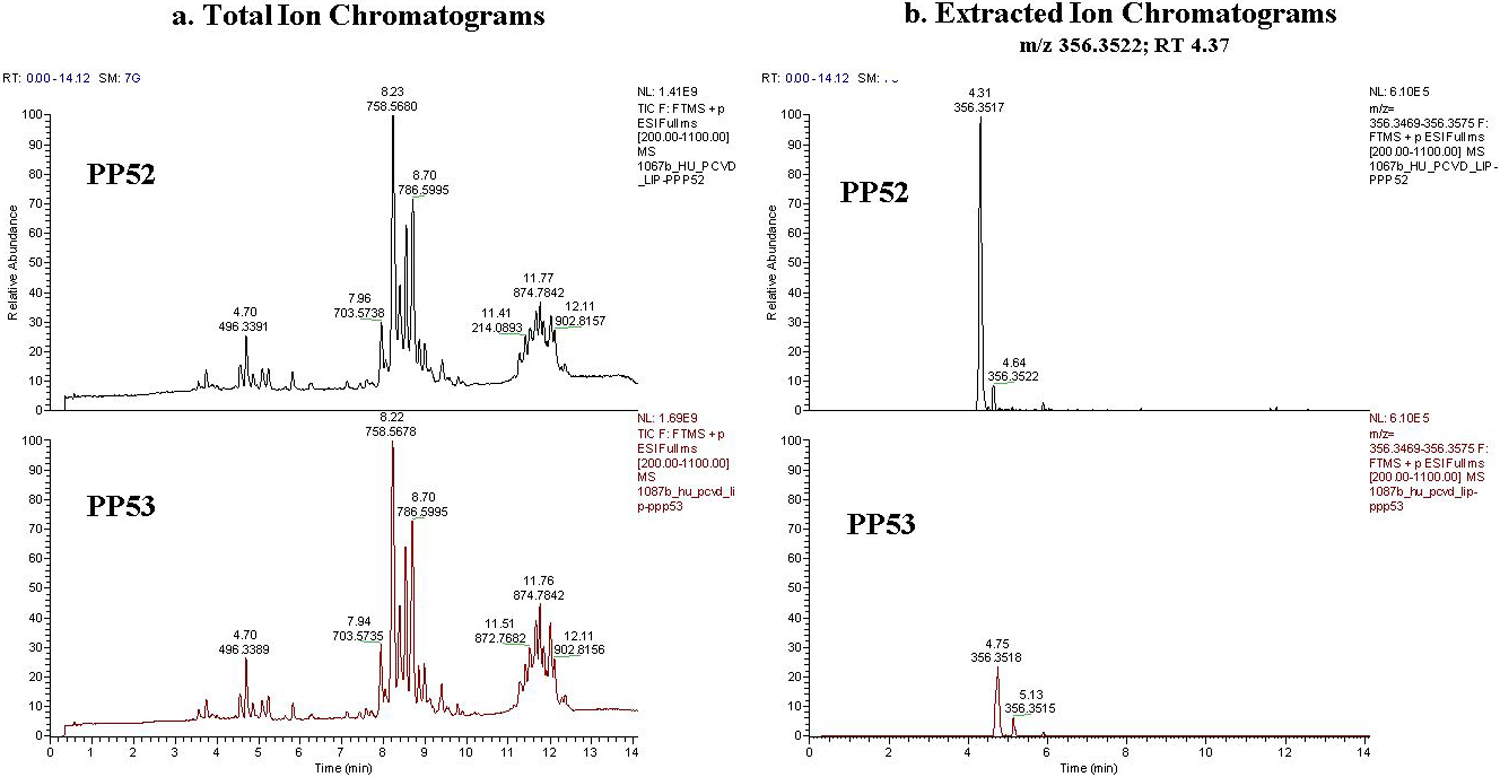
With additional experimental data, we confirmed the removed features are indeed measurement artifacts. Figure 4 shows the extracted ion chromatograms for an example metabolic feature removed by MetProc and supports that the measurement artifact was due to technical reasons.
Figure 4.

Example of a removed metabolic feature. (a) Total ion chromatograms and (b) extracted ion chromatograms of a metabolite removed by MetProc at pooled plasma run 52 and pooled plasma run 53. These pooled plasma samples are found on the boundary of a column switch in the metabolomics platform. While the total ion chromatogram looks similar at both pooled plasma run 52 and pooled plasma run 53, there is a clear removal of the peak at m/z 356.3522 and RT 4.37 corresponding directly with the column switch.
In order to further validate MetProc’s accuracy, we randomly took twenty metabolites MetProc had determined to reject, and inserted those m/z and retention times into a targeted software program called Trace Finder (Thermo Fisher Scientific; Waltham, MA). We were able to visually inspect every PREDIMED sample and confirm the abundance of each rejected metabolite, in comparison to MetProc (Figures S1, panel 1–20, Table S1). We observed presence and absence calls that aligned with what MetProc had determined. In three instances (QI975, QI1869, QI2502), we could correlate the absence of a metabolite due to poor retention time alignment between 2 columns, by the non-targeted software, Progenesis, QI (Nonlinear Dynamics; Newcastle upon Tyne, UK). In four instances (QI6050, QI3827, QI2543, QI2675), we observed background values which visual inspection would have rejected, so MetProc chose correctly to remove those putative metabolites as well. In one instance (QI2116), QI was not able to detect a peak but visual inspection using TraceFinder showed a peak. The remaining 12 features showed the same missingness pattern as discovered by MetProc and visual inspection confirmed that the peak area was not sufficient to be called a real peak in one of the sample being compared. Manual inspections confirmed that all 20 features should have been removed and MetProc correctly identified them.
CONCLUSION
Pooled QC samples in large scale untargeted metabolomics studies make it possible to detect batch effect and further remove unreliable metabolic features after feature detection and alignment. The application of MetProc to the PREDIMED metabolomics data demonstrates its ability to isolate metabolic features with structured missingness that is likely due to technical batch effects. It is important to note that randomization of injection order is a key assumption of the proposed method and critical for all real large scale study to avoid batch effects confounding the biological effect of interest. While the default parameters for separating metabolites were developed based on this specific data, the MetProc package provides flexible functions that can be adjusted to reflect a user’s particular situation and should have wide application. For application to other untargeted metabolomics data sets with pooled plasma samples, users can either use the default parameters of MetProc or tune the parameters based on the default values and visually inspect the missing data patterns with the tools provided in MetProc so that only removed metabolic features show similar structured missing data pattern as is illustrated in Figure 3a. Users could also select a handful of typical features being removed to manually validate that they are problematic by visualization in targeted software such as TraceFinder.
Supplementary Material
Table S1. Summary of manual examination of the 20 randomly selected features rejected by MetProc.
Figure S1. 20 random metabolic features rejected by MetProc were visually inspected with Trace Finder and compared to MetProc.
ACKNOWLEDGMENT
The authors thank all the participants for their collaboration, all the PREDIMED personnel for their assistance and all the personnel of affiliated primary care centers for making the study possible.
Funding Sources
This work was supported by NIH research grant HL118264. The PREDIMED trial was supported by the official funding agency for biomedical research of the Spanish government, Instituto de Salud Carlos III (ISCIII), through grants provided to research networks specifically developed for the trial (RTIC G03/140, to Ramón Estruch; RTIC RD 06/0045, to Miguel A. Martínez-González and through Centro de Investigación Biomédica en Red de Fisiopatología de la Obesidad y Nutrición [CIBEROBN]), and by grants from Centro Nacional de Investigaciones Cardiovasculares (CNIC 06/2007), Fondo de Investigación Sanitaria-Fondo Europeo de Desarrollo Regional (PI04-2239, PI 05/2584, CP06/00100, PI07/0240, PI07/1138, PI07/0954, PI 07/0473, PI10/01407, PI10/02658, PI11/01647, P11/02505, PI13/00462 and PI13/01090), Ministerio de Ciencia e Innovación (AGL-2009-13906-C02 and AGL2010-22319-C03), Fundación Mapfre 2010, Consejería de Salud de la Junta de Andalucía (PI0105/2007), Public Health Division of the Department of Health of the Autonomous Government of Catalonia, Generalitat Valenciana (ACOMP06109, GVA-COMP2010-181, GVACOMP2011-151, CS2010-AP-111, and CS2011-AP-042), and Regional Government of Navarra (P27/2011).
ABBREVIATIONS
- QC
quality control
Footnotes
SUPPORTING INFORMATION:
The following supporting information is available free of charge at ACS website http://pubs.acs.org
The authors declare no competing financial interest.
REFERENCES
- 1.Patti GJ; Yanes O; Siuzdak G, Innovation: Metabolomics: the apogee of the omics trilogy. Nat Rev Mol Cell Biol 2012, 13 (4), 263–9. [DOI] [PMC free article] [PubMed] [Google Scholar]
- 2.Johnson CH; Ivanisevic J; Siuzdak G, Metabolomics: beyond biomarkers and towards mechanisms. Nat Rev Mol Cell Biol 2016, 17 (7), 451–9. [DOI] [PMC free article] [PubMed] [Google Scholar]
- 3.Vinayavekhin N; Saghatelian A, Untargeted metabolomics. Curr Protoc Mol Biol 2010, Chapter 30, Unit 30 1 1–24. [DOI] [PubMed] [Google Scholar]
- 4.Smith CA; Want EJ; O’Maille G; Abagyan R; Siuzdak G, XCMS: processing mass spectrometry data for metabolite profiling using nonlinear peak alignment, matching, and identification. Anal Chem 2006, 78 (3), 779–87. [DOI] [PubMed] [Google Scholar]
- 5.Tautenhahn R; Bottcher C; Neumann S, Highly sensitive feature detection for high resolution LC/MS. BMC Bioinformatics 2008, 9, 504. [DOI] [PMC free article] [PubMed] [Google Scholar]
- 6.Yu T; Park Y; Johnson JM; Jones DP, apLCMS--adaptive processing of high-resolution LC/MS data. Bioinformatics 2009, 25 (15), 1930–6. [DOI] [PMC free article] [PubMed] [Google Scholar]
- 7.Uppal K; Soltow QA; Strobel FH; Pittard WS; Gernert KM; Yu T; Jones DP, xMSanalyzer: automated pipeline for improved feature detection and downstream analysis of large-scale, non-targeted metabolomics data. BMC Bioinformatics 2013, 14, 15. [DOI] [PMC free article] [PubMed] [Google Scholar]
- 8.Simader AM; Kluger B; Neumann NK; Bueschl C; Lemmens M; Lirk G; Krska R; Schuhmacher R, QCScreen: a software tool for data quality control in LC-HRMS based metabolomics. BMC Bioinformatics 2015, 16, 341. [DOI] [PMC free article] [PubMed] [Google Scholar]
- 9.Dunn WB; Wilson ID; Nicholls AW; Broadhurst D, The importance of experimental design and QC samples in large-scale and MS-driven untargeted metabolomic studies of humans. Bioanalysis 2012, 4 (18), 2249–64. [DOI] [PubMed] [Google Scholar]
- 10.Dunn WB; Broadhurst D; Begley P; Zelena E; Francis-McIntyre S; Anderson N; Brown M; Knowles JD; Halsall A; Haselden JN; Nicholls AW; Wilson ID; Kell DB; Goodacre R; Human Serum Metabolome, C., Procedures for large-scale metabolic profiling of serum and plasma using gas chromatography and liquid chromatography coupled to mass spectrometry. Nat Protoc 2011, 6 (7), 1060–83. [DOI] [PubMed] [Google Scholar]
- 11.Guasch-Ferre M; Zheng Y; Ruiz-Canela M; Hruby A; Martinez-Gonzalez MA; Clish CB; Corella D; Estruch R; Ros E; Fito M; Dennis C; Morales-Gil IM; Aros F; Fiol M; Lapetra J; Serra-Majem L; Hu FB; Salas-Salvado J, Plasma acylcarnitines and risk of cardiovascular disease: effect of Mediterranean diet interventions. Am J Clin Nutr 2016, 103 (6), 1408–16. [DOI] [PMC free article] [PubMed] [Google Scholar]
- 12.Martinez-Gonzalez MA; Corella D; Salas-Salvado J; Ros E; Covas MI; Fiol M; Warnberg J; Aros F; Ruiz-Gutierrez V; Lamuela-Raventos RM; Lapetra J; Munoz MA; Martinez JA; Saez G; Serra-Majem L; Pinto X; Mitjavila MT; Tur JA; Portillo MP; Estruch R; Investigators PS, Cohort profile: design and methods of the PREDIMED study. Int J Epidemiol 2012, 41 (2), 377–85. [DOI] [PubMed] [Google Scholar]
- 13.Ruiz-Canela M; Toledo E; Clish CB; Hruby A; Liang L; Salas-Salvado J; Razquin C; Corella D; Estruch R; Ros E; Fito M; Gomez-Gracia E; Aros F; Fiol M; Lapetra J; Serra-Majem L; Martinez-Gonzalez MA; Hu FB, Plasma Branched-Chain Amino Acids and Incident Cardiovascular Disease in the PREDIMED Trial. Clin Chem 2016, 62 (4), 582–92. [DOI] [PMC free article] [PubMed] [Google Scholar]
Associated Data
This section collects any data citations, data availability statements, or supplementary materials included in this article.
Supplementary Materials
Table S1. Summary of manual examination of the 20 randomly selected features rejected by MetProc.
Figure S1. 20 random metabolic features rejected by MetProc were visually inspected with Trace Finder and compared to MetProc.


