Abstract
Vertebrates utilize the mannose 6-phosphate (M6P) recognition system to deliver lysosomal hydrolases to lysosomes. Key to this pathway is GlcNAc-1-phosphotransferase (PTase) that selectively adds GlcNAc-P to mannose residues of the hydrolases. Human PTase is an α2β2γ2 heterohexamer with a catalytic core and several peripheral domains that recognize and bind substrates. Here we report a cryo-EM structure of the catalytic core of human PTase and identification of a hockey-stick-like motif that controls the activation of the enzyme. Movement of this motif out of the catalytic pocket is associated with a rearrangement of part of the peripheral domains that unblocks hydrolase glycan access to the catalytic site, thereby activating PTase. We propose that PTase fluctuates between inactive and active states in solution, and the selective substrate binding of a lysosomal hydrolase through its protein binding determinant to PTase locks the enzyme in the active state to permit glycan phosphorylation. This mechanism would help ensure that only N-linked glycans of lysosomal enzymes are phosphorylated.
INTRODUCTION
In vertebrates, lysosomal hydrolases are delivered to lysosomes via the mannose 6-phosphate (M6P) trafficking pathway1 (Fig. 1a). Lysosomal hydrolases are synthesized in the endoplasmic reticulum (ER) where they initially acquire N-linked 14-sugar high mannose glycans2,3. The N-glycosylated lysosomal hydrolases are then transported to the Golgi, where the oligosaccharides are modified to display mannose 6-phosphate (M6P) in two sequential steps (Fig. 1b). First, UDP-GlcNAc:lysosomal enzyme N-acetylglucosamine-1-phosphotransferase (PTase) transfers GlcNAc-1-phosphate to specific mannose residues, followed by GlcNAc removal by the uncovering enzyme (UCE) N-acetyglucosamine-1-phosphodiester α-N-acetylglucosaminidase. The M6P monoesters are recognized by two M6P-specific receptors (MPRs) in the trans Golgi network that escort the lysosomal hydrolases to the lysosomes.
Figure 1. Structure of the catalytic core of human PTase α2β2.
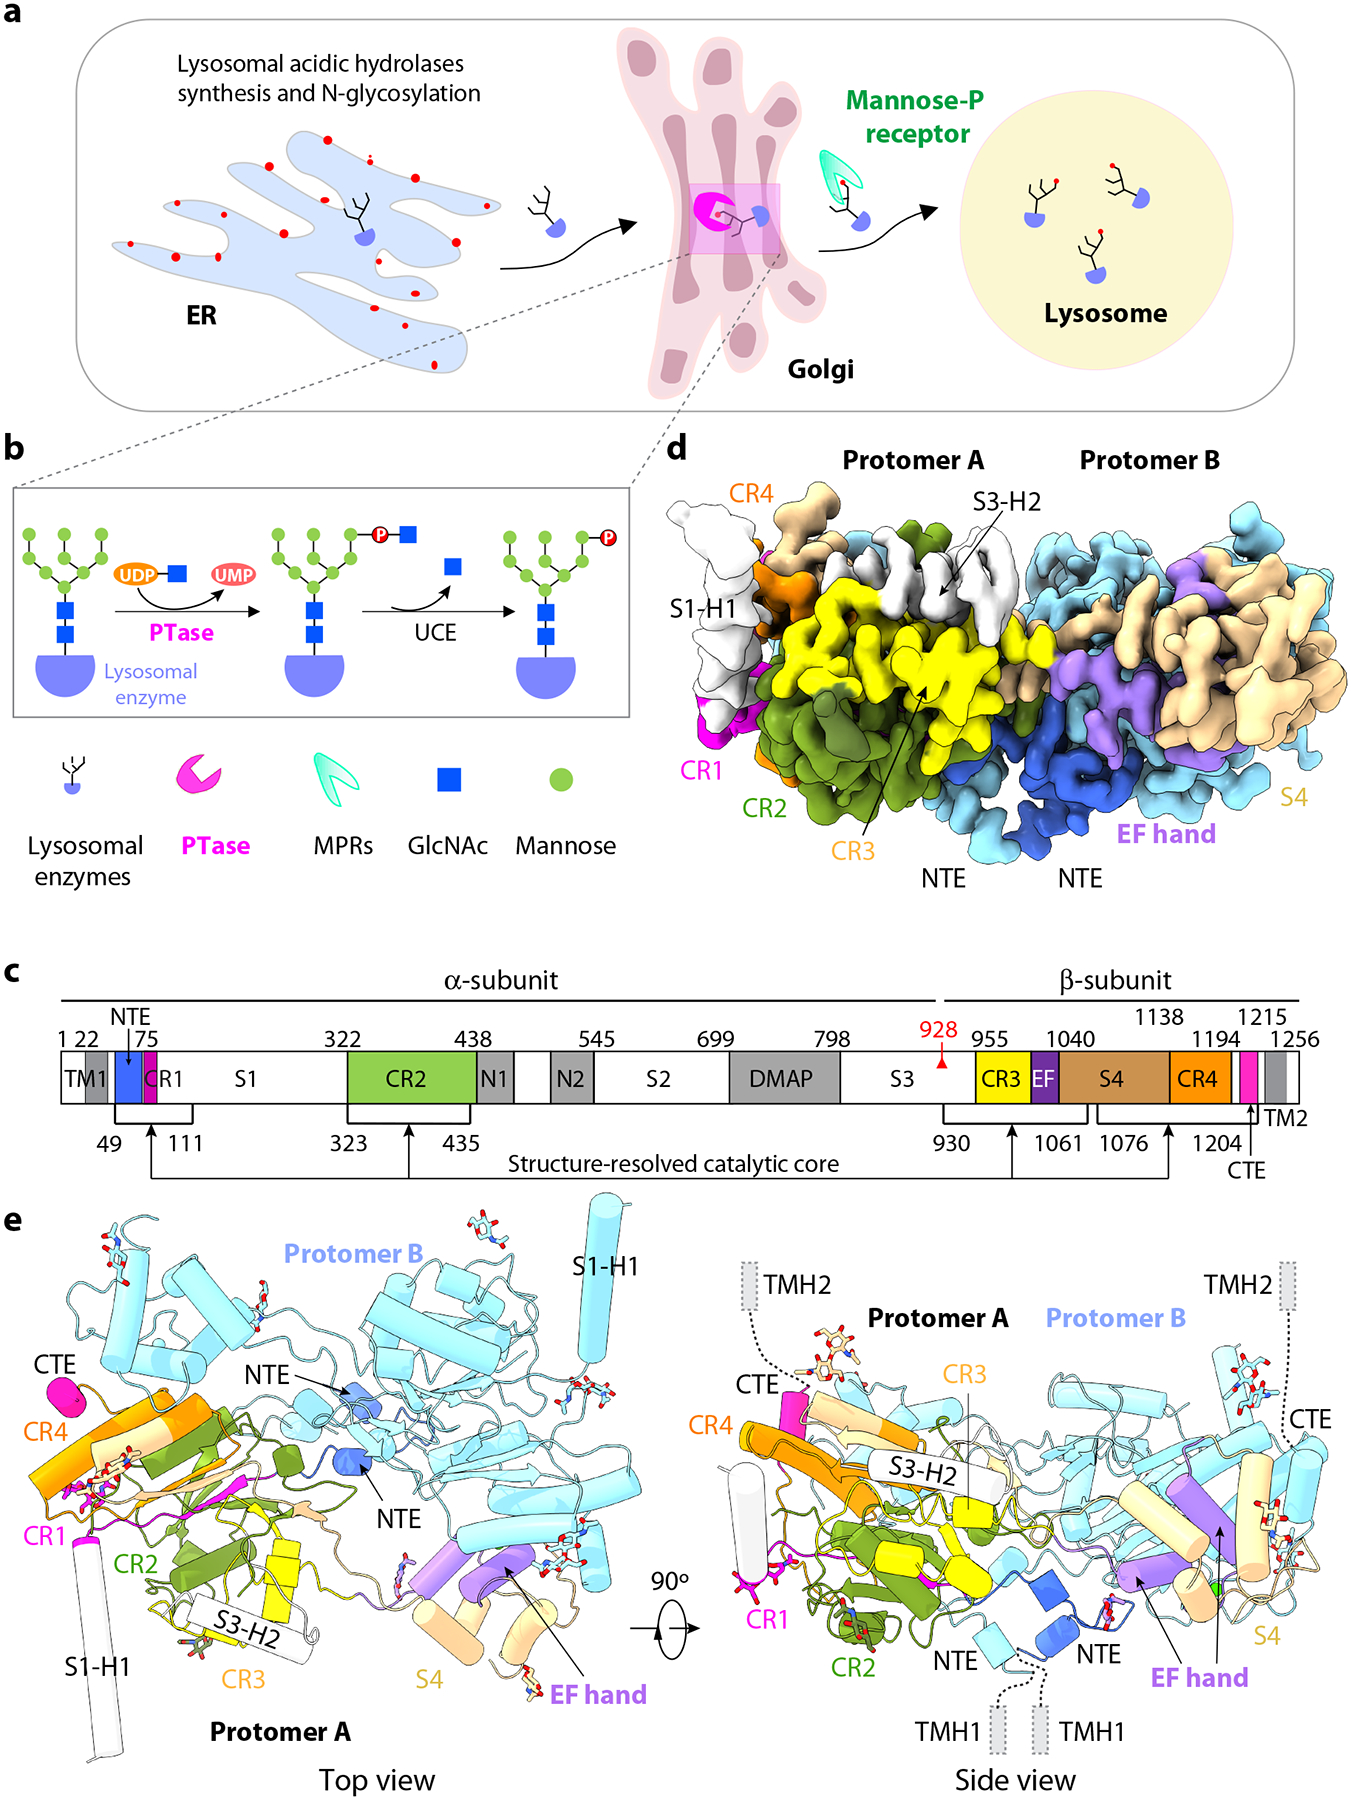
a) Schematic of the M6P-dependent targeting pathway of lysosomal hydrolases. Lysosomal hydrolases are synthesized in the ER, then transported to the Golgi where they are tagged with the M6P moiety in two steps. b) First, PTase transfers GlcNAc-1-P from UDP-GlcNAc to mannose residues of the glycan chains, then GlcNAc is removed by UCE. Lysosomal hydrolases with the M6P modification are recognized by the MPRs and transported to lysosome. c) Domain organization of human PTase. TM, transmembrane domain; CR1-4, Conserved Stealth region 1–4; S1–4, spacer regions 1–4, N1–2, Notch repeat domains 1 and 2; DMAP, DNA methyltransferase-associated protein interaction domain; EF, EF hand domain; red triangle, S1P cleavage site; Black lines, regions within atomic model. d) Cryo-EM 3D map in a side view. e) Cartoon of the atomic model of PTase core. Subunit A domains are shown in colors that match 1c. NTE, CR1-4, EF hand, S4 and C-terminus of subunit A are shown in color. Two α-helices from S1 and S3 regions are in gray. Subunit B is shown in pale cyan. The 14 resolved GlcNAc moieties at 10 glycosylation sites (5 in each subunit) are shown as sticks.
PTase is composed of three subunits (α, β, γ) that assemble into an α2β2γ2 heterohexamer, and is highly conserved in vertebrates4. These subunits are encoded by two genes: GNPTAB encoding the α/β subunit precursor4, and GNPTG the γ-subunit5. The human α/β precursor is a 1256-residue long polypeptide chain that contains four conserved regions (CR1-4) which assemble into a Stealth domain that was initially identified in bacterial sugar phosphate transferases6. In addition, there are two Notch repeats (N1, N2), a DNA methyltransferase-associated protein interaction (DMAP) domain, an EF hand domain (EF), four spacer regions (S1–4), and single-pass transmembrane helices at both the amino and carboxy termini (Fig. 1c). The γ-subunit is 305 residues long, contains a M6P receptor homology (MRH) domain and another DMAP domain that contributes to the recognition of a subset of lysosomal hydrolases7. The αβ precursors dimerize and undergo proteolytic cleavage between Lys-928 and Asp-929 catalyzed by the Golgi-localized Site-1-protease (S1P)8. The Stealth domain comprised of CR1-4 is believed to constitute the catalytic core of the enzyme9,10. The S1 domain contains two tandem α/β roll motifs (PDB ID 2N6D) and has been shown to regulate PTase activity by modulating the site of the S1P-mediated cleavage of the precursor11. The Notch repeats and the DMAP domain mediate recognition and binding to lysosomal hydrolases12,13. The S2 domain interacts with the γ-subunit to facilitate the formation of the holoenzyme13–15, while the S3 domain is thought to partially inhibit the enzyme complex16.
Mutations in the genes encoding PTase cause the lysosomal storage disorders mucolipidosis II (MLII) and mucolipidosis III (MLIII)17. In fact, 258 mutations in GNPTAB and 50 mutations in GNPTG have been reported in patients with MLII or MLIII18. Since lysosomes participate in the regulation of many cellular processes including endocytosis, macroautophagy, cell death, and plasma membrane repair19, lysosomal dysfunction is associated with other common diseases as well, such as diabetes, cancer, neurodegenerative disorders, and cardiovascular diseases19,20.
Despite the biological importance and the disease associations of vertebrate PTase, its structure has not been established. Therefore, it is unclear how PTase phosphorylates lysosomal hydrolases but not other N-glycosylated proteins that also transit through the ER-Golgi system. In this report, we describe the high-resolution cryo-EM structure of the catalytic core of human PTase α2β2 subcomplex. These studies reveal large scale conformational changes associated with enzyme autoinhibition and activation mechanism. Using the structure as a guide, we show how the selective deletion of spacer region 3 (S3) releases the inhibition resulting in a hyper-activated enzyme.
RESULTS
PTase has an ordered core and a flexible peripheral region
The human PTase α2β2 subcomplex was expressed in CHO cells transfected with a plasmid encoding the αβ subunits lacking the transmembrane domains and purified from culture media as described21. A furin cleavage site was engineered into the secreted αβ cDNA construct to replace the endogenous S1P site since the latter displayed poor cleavage with the soluble form of the expressed protein. The purified sample was subjected to single particle cryo-EM analysis. After extensive 2D and 3D classification, we selected some 365,000 raw particle images for 3D reconstruction and obtained a 3D map at an average resolution of 3.1 Å (Extended Data Figs. 1–2). The 2D class averages show a 2-fold symmetrical structure with a well-defined core region and several cloudy peripheral domains. In the final 3D map, the core region is resolved to better than 3 Å resolution, which allowed for de novo model building (Table 1, Extended Data Fig. 3a). However, the densities of the peripheral domains are very weak and noisy; these regions are at a much lower resolution and will be discussed below.
Table 1.
Cryo-EM data collection, refinement, and validations
| Active state (EMBD-24784) (PDB 7S05) |
Autoinhibited state (EMBD-24785) (PDB 7S06) |
|
|---|---|---|
| Data collection and processing | ||
| Magnification | 130,000 | |
| Voltage (kV) | 300 | |
| Electron exposure (e−/Å2) | 66 | |
| Defocus rang (μm) | 1.0–2.3 | |
| Pixel size (Å) | 0.828 | |
| Symmetry imposed | C2 | |
| Initial particle images (No.) | 5,186,047 | |
| Final particle images (No.) | 365,927 | 66,173 |
| Map resolution (Å) | 3.1 | 3.3 |
| FSC threshold | 0.143 | 0.143 |
| Map resolution range (Å) | 2.0 – 5.0 | 2.0 – 5.0 |
| Refinement | ||
| Initial model used (PDB code) | -- | -- |
| Model resolution (Å) | 3.2 | 3.5 |
| FSC threshold | 0.5 | 0.5 |
| Model resolution range (Å) | 2–5 | 2–5 |
| Map sharpening B factor (Å2) | −150.5 | −141 |
| Model composition | ||
| Non-hydrogen atoms | 7504 | 7850 |
| Protein residues | 874 | 918 |
| Ligands | 16 | 14 |
| B factors (Å2) | ||
| Protein | 58.4 | 90.2 |
| Ligand | 81.7 | 123.2 |
| R.m.s. deviations | ||
| Bond lengths (Å) | 0.003 | 0.003 |
| Bond angles (°) | 0.653 | 0.620 |
| Validation | ||
| Molprobity score | 1.79 | 1.82 |
| Clashscore | 7.23 | 7.56 |
| Poor rotamers (%) | 0 | 0 |
| Ramachandran plot | ||
| Favored (%) | 94.17 | 93.99 |
| Allowed (%) | 5.83 | 6.01 |
| Disallowed (%) | 0 | 0 |
The ordered core of the human PTase α2β2 forms a homodimer (Fig. 1d–e). This core region is composed of an N-terminal extension (NTE) of two short α-helices, CR1-4 that assemble into a typical GT-A fold of glycosyltransferases, the first α -helix of the S1 domain, the last α-helix of the S3 domain, the EF hand, the entire S4 domain, and a C-terminal extension (CTE) of a single α-helix (Fig. 1d–e). Therefore, the unresolved and flexible peripheral region must contain most of S1, the two Notch repeats N1 and N2, S2, the DMAP domain and most of S3 (Fig. 1c). Interestingly, the resolved core region is essentially the same as our previously identified ΔS1-S3 deletion construct that is significantly more active in vitro than the WT enzyme towards the model acceptor α-methylmannoside16. Therefore, we call this structure-resolved region the catalytic core from here on. The catalytic core is highly conserved among the five vertebrates we analyzed (human, bovine, mouse, chicken, and zebra fish), with a sequence identity of 86% and similarity of 97% (Supplementary Fig. 1). In contrast, the unresolved flexible peripheral region has a lower sequence identity of 52% and a lower similarity of 76%. There are five predicted N-glycosylation sites in the core region (Asn-83, Asn-376, Asn-1009, Asn-1056, and Asn-1129)22, and all five sites display one or two GlcNAc residues of the chitobiose core (Fig. 1e, Extended Data Fig. 3a–b). The first resolved N-terminal residue (Tyr-49) is observed on one side of the catalytic core, whereas the last resolved C-terminal residue (Tyr-1204) extends out in the opposite direction (Fig. 1d), raising the possibility that the N-terminal transmembrane helix 1 (TMH1) and the C-terminal TMH2 may be anchored to opposing membranes closely juxtaposed across a Golgi cisterna. However, the unresolved N- or C-terminal peptide sequences are long enough to loop around so that the two transmembrane domains could point in the same direction.
The catalytic core of the human PTase
Each subunit core contains three distinct regions: an N-terminal extension (NTE), a large lobe, and a small lobe (Figs. 1d–e, 2a, Extended Data Fig. 4a–b). The large lobe is the Rossmann-like GT-A fold consisting of the Stealth domain. The small lobe is a helical domain composed of the EF hand and three α-helices of the S4 domain. These two lobes are far apart in the monomer and connected via long loops. However, the large lobe of one subunit binds to the small lobe of the other subunit and vice versa, forming a tightly packed dimer structure. The two NTEs located near the catalytic sites also interact with each other, contributing to a large overall dimer interface of 3,100 Å2 (Fig. 2a). Within the NTE, Cys-70 forms a disulfide bond by crosslinking Cys-70 of one subunit with Cys-70 of the other subunit (Fig. 2b). Based on immunoblot analysis performed under reducing versus non-reducing conditions, the Cys-70-mediated disulfide linkage is reported to be the only covalent bond involved in the homodimerization of the α subunit of PTase14. We examined whether this disulfide was important for PTase non-covalent dimer formation by coexpressing either myc-tagged WT or the C70S mutant PTase along with WT V5-tagged PTase. Coimmunoprecipitation with an anti V5 antibody followed by immunoblotting of the pellet fractions with an anti-myc antibody showed that the C70S mutation did not prevent the mutant PTase from forming a non-covalent dimer (Fig. 2c). Moreover, the C70S mutant exited the ER and showed Golgi localization similar to the WT enzyme (Extended Data Fig. 5a). However, the mutation decreased the activity of the full-length enzyme by 61% (Fig. 2d). Similar findings were obtained when coimmunoprecipitation experiments were performed using differentially tagged ΔS1-S3 (Extended Data Fig. 5b). As with the full-length C70S mutant, ΔS1-S3(C70S) also showed reduced activity (53%) relative to ΔS1-S3 (Extended Data Fig. 5c). These findings indicate that the disulfide bond contributes to the activity of the enzyme.
Figure 2. The catalytic core structure of PTase.
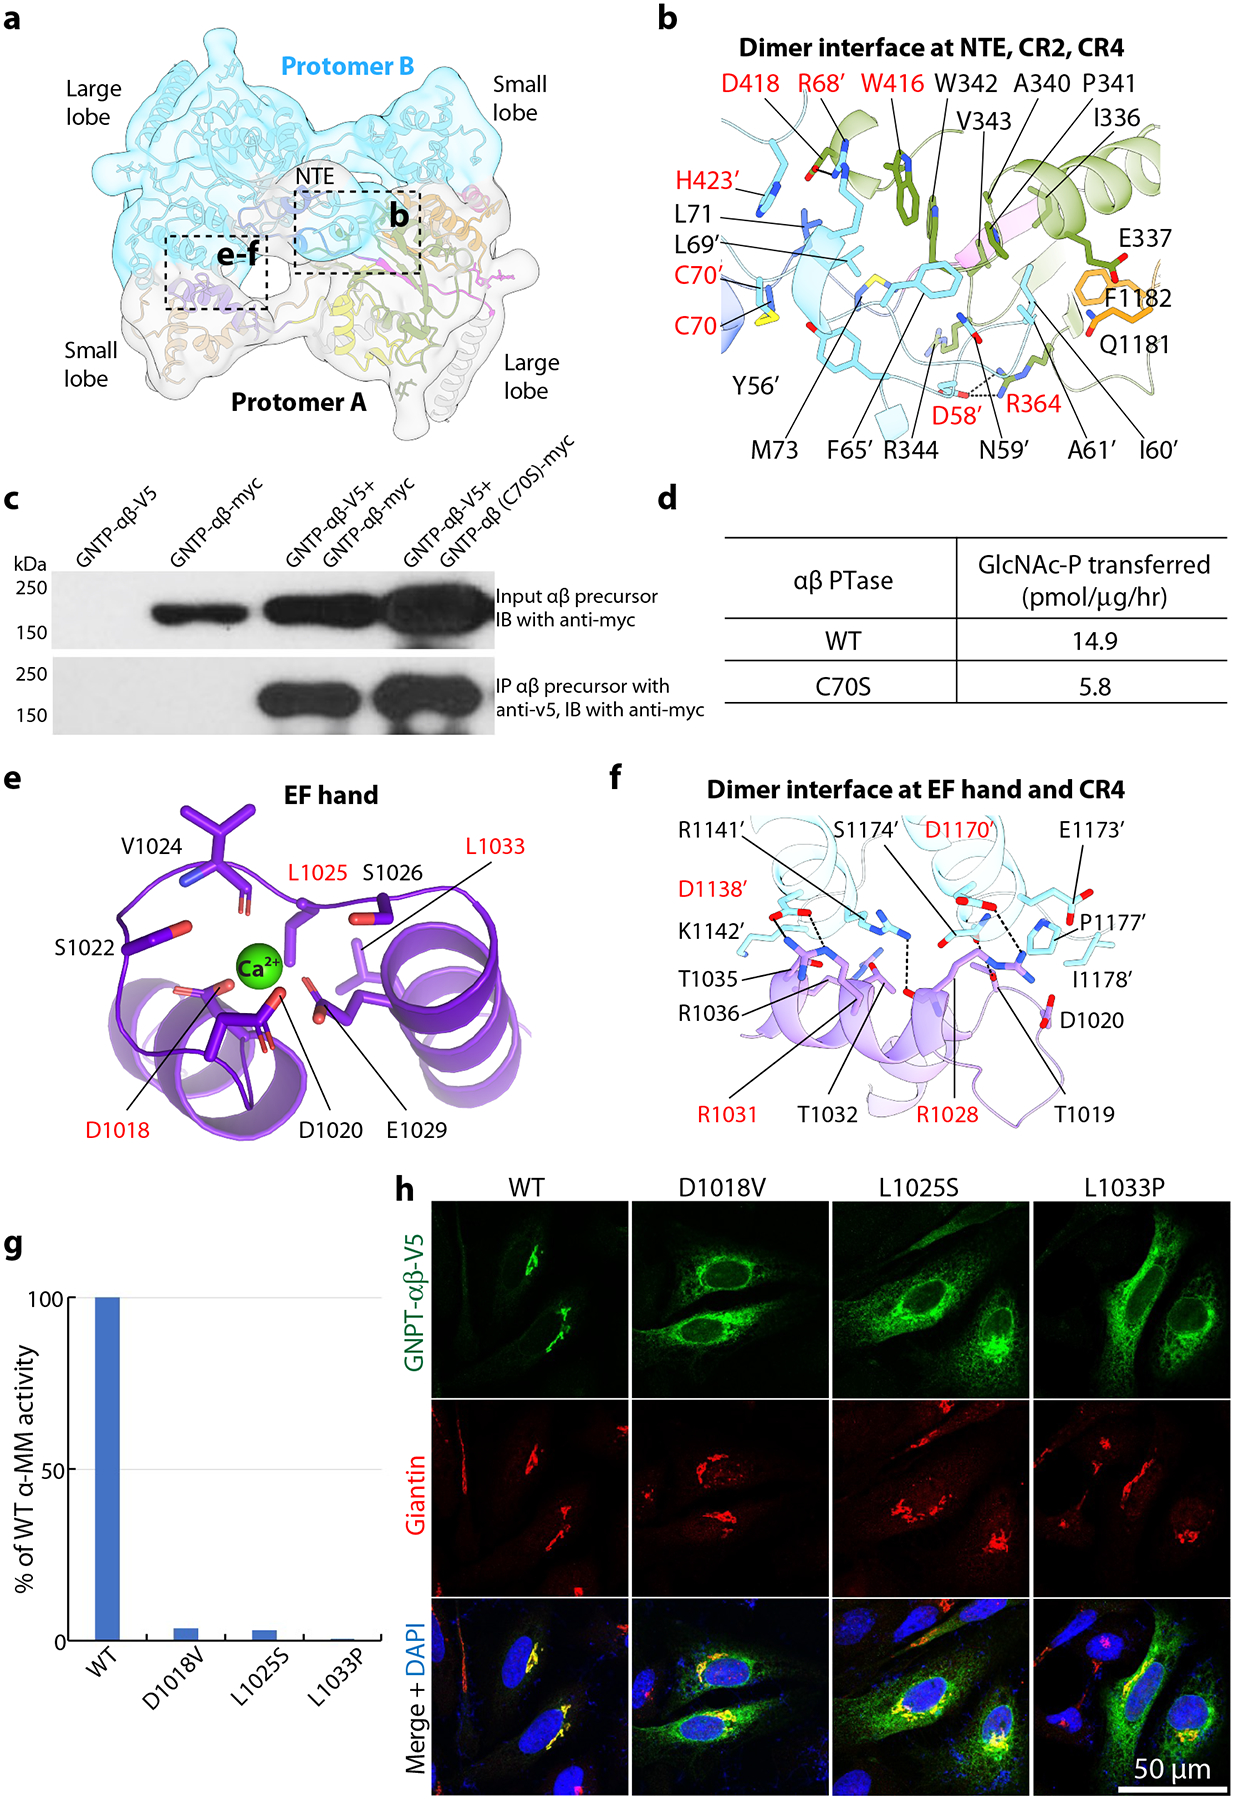
a) Dimer interface of human PTase core. The two subunits are colored individually and shown cartoon diagram, superimposed with a low-pass filtered EM map in transparent view. The dimer interface is mediated by the two NTEs in the middle and the interactions between the small lobe of one subunit with the large lobe of the other. b) Close-up views of the dimer interface mediated by the N-terminal region, CR2, CR4, and the disulfide bridge (solid yellow line). The subunit A cartoon view is semi-transparent. c) Effect of C70S on the ability of PTase to form a non-covalent dimer, as assessed by co-immunoprecipitation. Cell lysates from HEK 293 cells transfected with the indicated plasmids were immunoprecipitated with an anti-V5 rabbit monoclonal antibody, and the pellet fractions (10% loaded) were immunoblotted with an anti-myc mouse monoclonal antibody. For the input, only the immunoblot probed with the anti-myc antibody is shown here. The data presented represents one of two experiments. d) Effect of C70S on the α-methylmannoside activity of PTase. For the activity assay, WT PTase and the C70S mutant were expressed in HEK 293 cells. The data shown are the mean of 2 independent experiments. e) EF hand coordinating one calcium ion. Key residues are labeled. Residues whose mutations cause diseases are labeled in red. f) Close-up view of dimer interface mediated by EF hand and CR4. g) EF hand mutants exhibit almost complete loss of α-methylmannoside activity compared to WT when expressed in GNPTAB−/− HeLa cells. The data presented are the mean of 2 independent experiments. h) Immunofluorescence microscopy of transfected HeLa cells show that EF hand mutations cause accumulation of the mutants (green) in the ER and decrease localization in the Golgi. The Golgi marker Giantin is stained red while the nucleus is marked by DAPI (blue). Residues with a primer indicate they are from subunit B. All residues labeled in red are mutated and tested experimentally in the current study. Uncropped images for c and data for graphs in d,g are available as source data.
The NTE of one subunit contacts CR2 and CR4 of the other subunit with a mix of hydrophobic and electrostatic interactions, including two salt bridges between Asp-58 and Arg-364 and between Arg-68 and Asp-418. And there is a cascade of π-π stacking interactions among Trp-416 as the first plane, Arg-68 and Asp-418 as the second plane, and His-423 as the third plane (Fig. 2b). We postulated that these residues contribute to the non-covalent interaction of the two subunits. Mutation of these residues individually to alanine or the R68A/D418A combination did not affect the Golgi localization of the mutant proteins (Extended Data Fig. 5d). Except for R364A whose cleavage was partially impaired, the remainder of the alanine mutants showed normal proteolytic cleavage (Extended Data Fig. 5e). However, the activity of the alanine mutants was impacted to varying degrees and ranged from 10% to 54% of WT activity (Extended Data Fig. 5f). These results show that in addition to Cys-70, the amino acids of the N-terminal interface identified in our structure also play an important role in enzyme activity, possibly by impacting the stability of the dimer.
Disease mutations in the EF hand abolishes PTase activity
The EF hand of human PTase adopts a canonical helix-loop-helix fold and coordinates a Ca2+ ion (Fig. 2e). The Ca2+ ion is coordinated by six residues: the side chains of Asp-1018, Asp-1020, and Ser-1022, the carbonyl oxygen of Val-1024, the hydroxyl group of Ser-1026, and the carboxylate of Glu-1029. Three mutations in the EF hand were recently identified among Eastern Chinese patients with MLII/III: D1018V, L1025S, and L1033P23. In addition to calcium binding, the EF hand contributes to a second interface with CR4 between subunit A and B (Fig. 1d, 2a). In particular, Arg-1028 and Arg-1031 appear to be key residues involved in this interaction (Fig. 2f).
We first examined how these disease-causing mutations affected PTase activity in vitro and found that all three abolished PTase activity towards α-methylmannoside (Fig. 2g). Because Asp-1018 directly coordinates the Ca2+ ion, D1018V likely abolished calcium binding or the EF hand structure. However, Leu-1025 and Leu-1033 do not coordinate the Ca2+ ion; the L1025S and L1033P mutations likely affect the hydrophobic interaction of the EF hand with the S4 helices in the small lobe. Furthermore, Leu-1025 is a key residue in EF hand fold, so L1025S mutation may also disrupt folding. The L1033P mutation most likely disrupts the second α-helix of the EF hand fold. Consistent with impaired folding, these mutations partially impaired Golgi localization of PTase with significant accumulation in the ER (Fig. 2h). Immunoblot analysis revealed that even though a fraction of the three mutants exited the ER and localized to the Golgi, all three mutants exhibited aberrant proteolytic cleavage in the Golgi (Extended Data Fig. 6a), in agreement with the total loss of activity. The basis for this abnormal cleavage is not clear at this time. Therefore, we conclude that the EF hand fold and its interaction with the S4 domain is essential to PTase function. The three EF hand patient mutations likely cause MLII/III through enzyme misfolding, partial ER retention, abnormal cleavage and loss of enzyme activity.
In addition to calcium binding, the EF hand contributes to a second interface with CR4 between subunit A and B (Fig. 1d, 2a). In particular, Arg-1028 and Arg-1031 appear to be key residues involved in this interaction (Fig. 2f). We mutated these two residues either individually or in combination, and determined the localization, cleavage and activity of the mutant proteins. Unlike the mutants of the calcium binding residues, R1028A, R1031A and R1028A/R1031A all exited the ER and localized correctly to the Golgi (Extended Data Fig. 6b). Moreover, these mutants showed normal proteolytic cleavage (Extended Data Fig. 6c) and retained between 48–86% of WT catalytic activity (Extended Data Fig. 6d), similar to the N-terminal interface mutations. These results indicate that the disulfide bridge mediated by Cys-70, together with the N-terminal and the EF hand interfaces, contribute to the most active form of the dimer comprising subunit A and B. We conclude that the EF hand fold and its interaction with the S4 region is essential to PTase function.
The catalytic pocket of the human PTase
A protein fold analysis by the DALI online server shows that the PTase GT-A domain resembles the structure of the mouse EXTL2 (PDB ID 1ON8), an α−1,4-N-Acetylhexosaminyltransferase that also uses UDP-GlcNAc as donor substrate24 25 (Fig. 3a). The first GT-A sub-domain of PTase formed by CR1 and CR2 highly resembles the EXTL2 UDP-GlcNAc binding sub-domain, suggesting that UDP-GlcNAc binds to this region of human PTase. The GT-A fold glycosyltransferases usually feature a DXD motif at their catalytical sites. Correspondingly, EXTL2 has a DDD motif and human PTase has a conserved 406NDD408 motif (Fig. 3b). Therefore, human PTase contains the conserved UDP-GlcNAc binding pocket and the expected catalytic motif, with the exception of an asparagine residue replacing the first aspartate in all PTase species that have been examined (Supplementary Fig. 1). It is worth noting that while the Golgi glycosyltransferases transfer GlcNAc/GalNAc, PTase instead transfers GlcNAc-1-P. The question of whether an asparagine instead of an aspartate within this motif might be responsible for the unique activity of PTase is an interesting one. Curiously, a D407A mutation within the 406NDD408 motif has been reported in a patient with MLIII26. We have shown that this mutation within the catalytic pocket, as expected, resulted in loss of enzyme activity despite normal localization of the D407A mutant in the Golgi10. In order to ascertain if Asn-406 and Asp-408 are also critical for enzyme activity, the corresponding alanine mutations were analyzed. The N406A and D408A mutants both correctly localized to the Golgi (Extended Data Fig. 7a) and were cleaved normally by S1P (Extended Data Fig. 7b), but showed no enzyme activity toward the acceptor α-methylmannoside (Extended Data Fig. 7c), demonstrating that the 406NDD408 motif is a critical component of the catalytic core. Further, many residues lining the active pocket are highly conserved in vertebrates, including Thr-80 in CR1, Asp-325, Asn-351, Ser-385, Asn-406, Asp-407, and Asp-408 in CR2, His-959, Asp-990, Gln-992 in CR3, and Asn-1151 and Asn-1153 in CR4 (Supplementary Fig. 1).
Figure 3. The catalytic pocket and the autoinhibited motif of PTase.
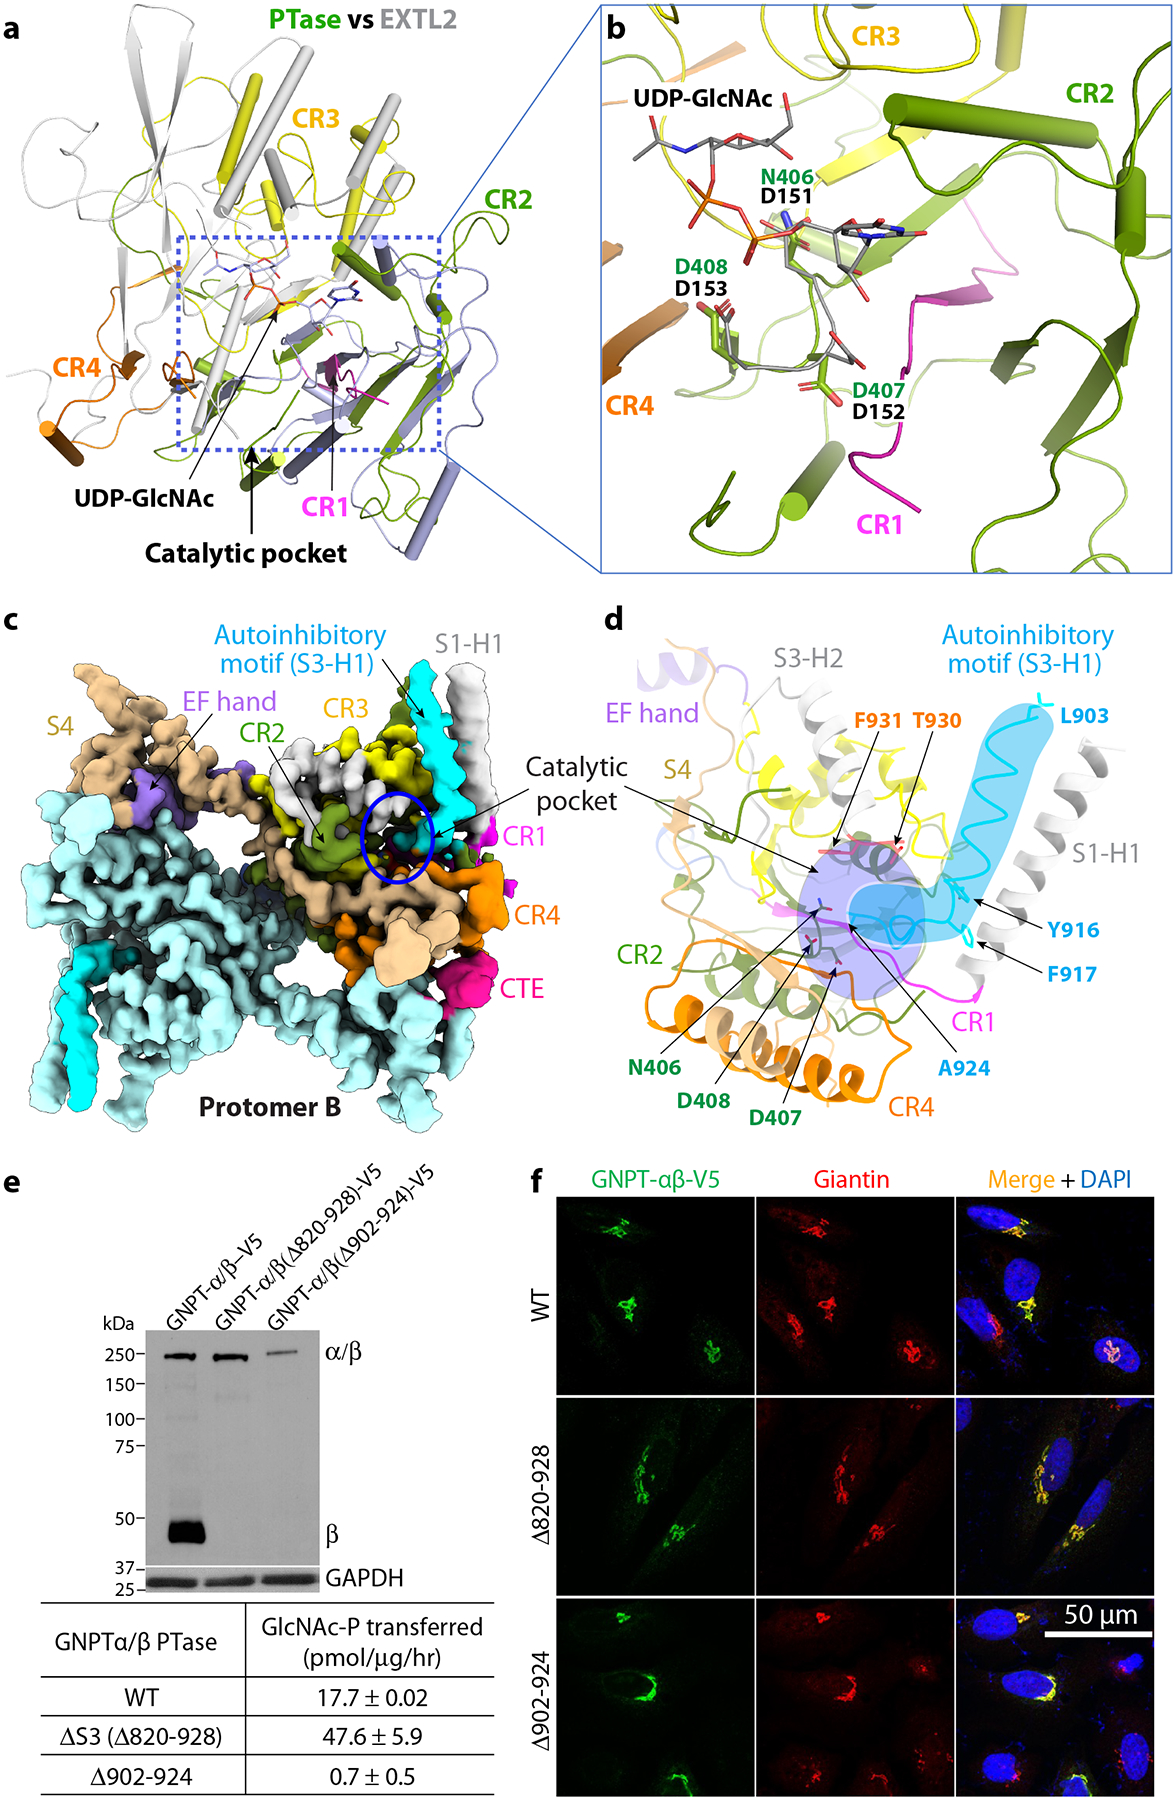
a) Superimposition of PTase and mEXTL2. The catalytic core of PTase is colored as in Fig. 1, with CR1-4 in magenta, olive drab, yellow, and orange, respectively. mEXTL2 structure (PDB ID 1ON6) is in gray. b) Close-up view of the UDP-sugar binding subdomain. The DDD motif and UDP-GlcNAc in mEXTL2 and the NDD motif in PTase are showed as sticks. c) Cryo-EM 3D map of human PTase in the autoinhibited state at 3.3 Å resolution. Domains are colored using the same color scheme as Fig. 1. For subunit A, CR1-4 are in magenta, olive drab, yellow and orange, respectively. EF hand in purple, S4 in wheat and CTE in pink. Subunit B is in pale cyan. The autoinhibitory motif (903–924) is in cyan. d) Close-up view of the autoinhibitory motif in the active pocket. The catalytic motif N406-D407-D408 and residues lining the pocket (T930 and F931) are shown in sticks. The cyan shape highlights the autoinhibitory motif, and the purple oval highlights the catalytic pocket. e) Upper panel: Immunoblot of the mock, WT, Δ820–928 and Δ902–924 constructs transfected into HEK 293 cells and probed with a monoclonal antibody against the V5 tag. 5 μg of each cell lysate was loaded. Lower panel: PTase activity of the WT and mutants expressed in HEK 293 and assayed using the model acceptor α-methylmannoside. The data shown are the mean ± SD for 4 independent experiments. f) Immunofluorescence microscopy of transfected HeLa cells showing Golgi localization of WT PTase and the deletion mutants. Uncropped images and data for graph in e are available as source data.
A hockey-stick-like inhibitory motif in the catalytic pocket
By 3D classification focusing on the core region, we obtained another 3D map of the PTase core at 3.3-Å resolution (Fig. 3c, Table 1, Extended Data Figs. 1 and 3c). This new map contains an extra hockey-stick-like density, which is a 22-residue motif in the S3 domain just upstream of the furin cleavage site (replacing the S1P site) from Leu-903 to Ala-924, corresponding to the C-terminal end of the α-subunit. The stick shaft forms an α-helix from Leu-903 to Ala-915 that packs against the long S1-H1 helix (Fig. 3d). The two large hydrophobic residues Tyr-916 and Phe-917 form the stick heel that turns into the blade of a short loop (Thr-918 to Ala-924), which occupies the UDP-GlcNAc binding pocket (Fig. 3d). The following four residues contain the furin recognition residues (925RYKR928) necessary for cleavage between Arg-928 and Asp-9298. This motif was disordered in the EM map; however, it likely extends near the catalytic NDD motif in the center of catalytic pocket. Therefore, the hockey-stick-like motif blocks the catalytic site and prevents substrate binding. For this reason, we call this 3.3-Å structure the autoinhibited state. Accordingly, the first structure at 3.1 Å in which the inhibitory motif is disordered is referred to as the active state. Except for the hockey-stick-like motif, no significant conformational change is observed between the autoinhibited and the active state. The discovery of the autoinhibitory motif within the S3 domain is consistent with our previous report in which truncation of the S3 domain up to the Arg-928 cleavage site, along with the N1, N2, S2 and DMAP domains, strongly enhanced enzyme activity relative to a truncated enzyme lacking only the latter four domains (N1-D), suggesting that S3 contains an inhibitory motif16.
To examine the function of the autoinhibitory motif, we generated two constructs, one deleting the observed ordered region (Δ902–924) and the other the entire S3 domain up to the cleavage site (Δ820–928). While the constructs were expressed at much lower levels than the WT enzyme, both localized to the Golgi (Fig. 3e–f). Importantly, the Δ820–928 was 2.7-fold more active toward α-methylmannose than the WT enzyme even though its expression was considerably lower. This indicates that the hockey-stick motif indeed functions as an autoinhibitory sequence. It is not clear why the shorter deletion (Δ902–924) construct lacked activity despite being localized to the Golgi. Nevertheless, because both active and autoinhibited states are captured in one dataset from the same sample, we suggest that the PTase in solution fluctuates between these two states and that lysosomal enzymes preferentially bind to the active state for their modification by the PTase.
The PTase architecture and movement of peripheral domains
As described above, the peripheral domains (S1 and N1-S3) had weak densities in the 2D class averages and were largely averaged out in the 3D reconstruction (Extended Data Fig. 1). We went on to carry out a 3D variability analysis (3DVA), a program developed recently to reveal of the continuous variability and discrete heterogeneity in a protein structure27. We first analyzed the better-understood catalytic core region and found that the above-described static states of the hockey-stick motif (e.g., active versus inhibited) are merely two extremes, with several intermediate states present in the dataset. This suggests that the hockey-stick motif continuously moves in and out of the active pocket (Supplementary Video 1, Fig. 4a). We also observed an extra density juxtapositioned to the hockey stick that must belong to the peripheral N1-S3 region. Nearly half of that N1-S3 density becomes disordered when the hockey-stick density disappears. This could only mean that the hockey-stick movement – the conversion between the autoinhibited to the active form, and vice versa – is correlated to movement domain.
Figure 4. Proposed catalytical model.
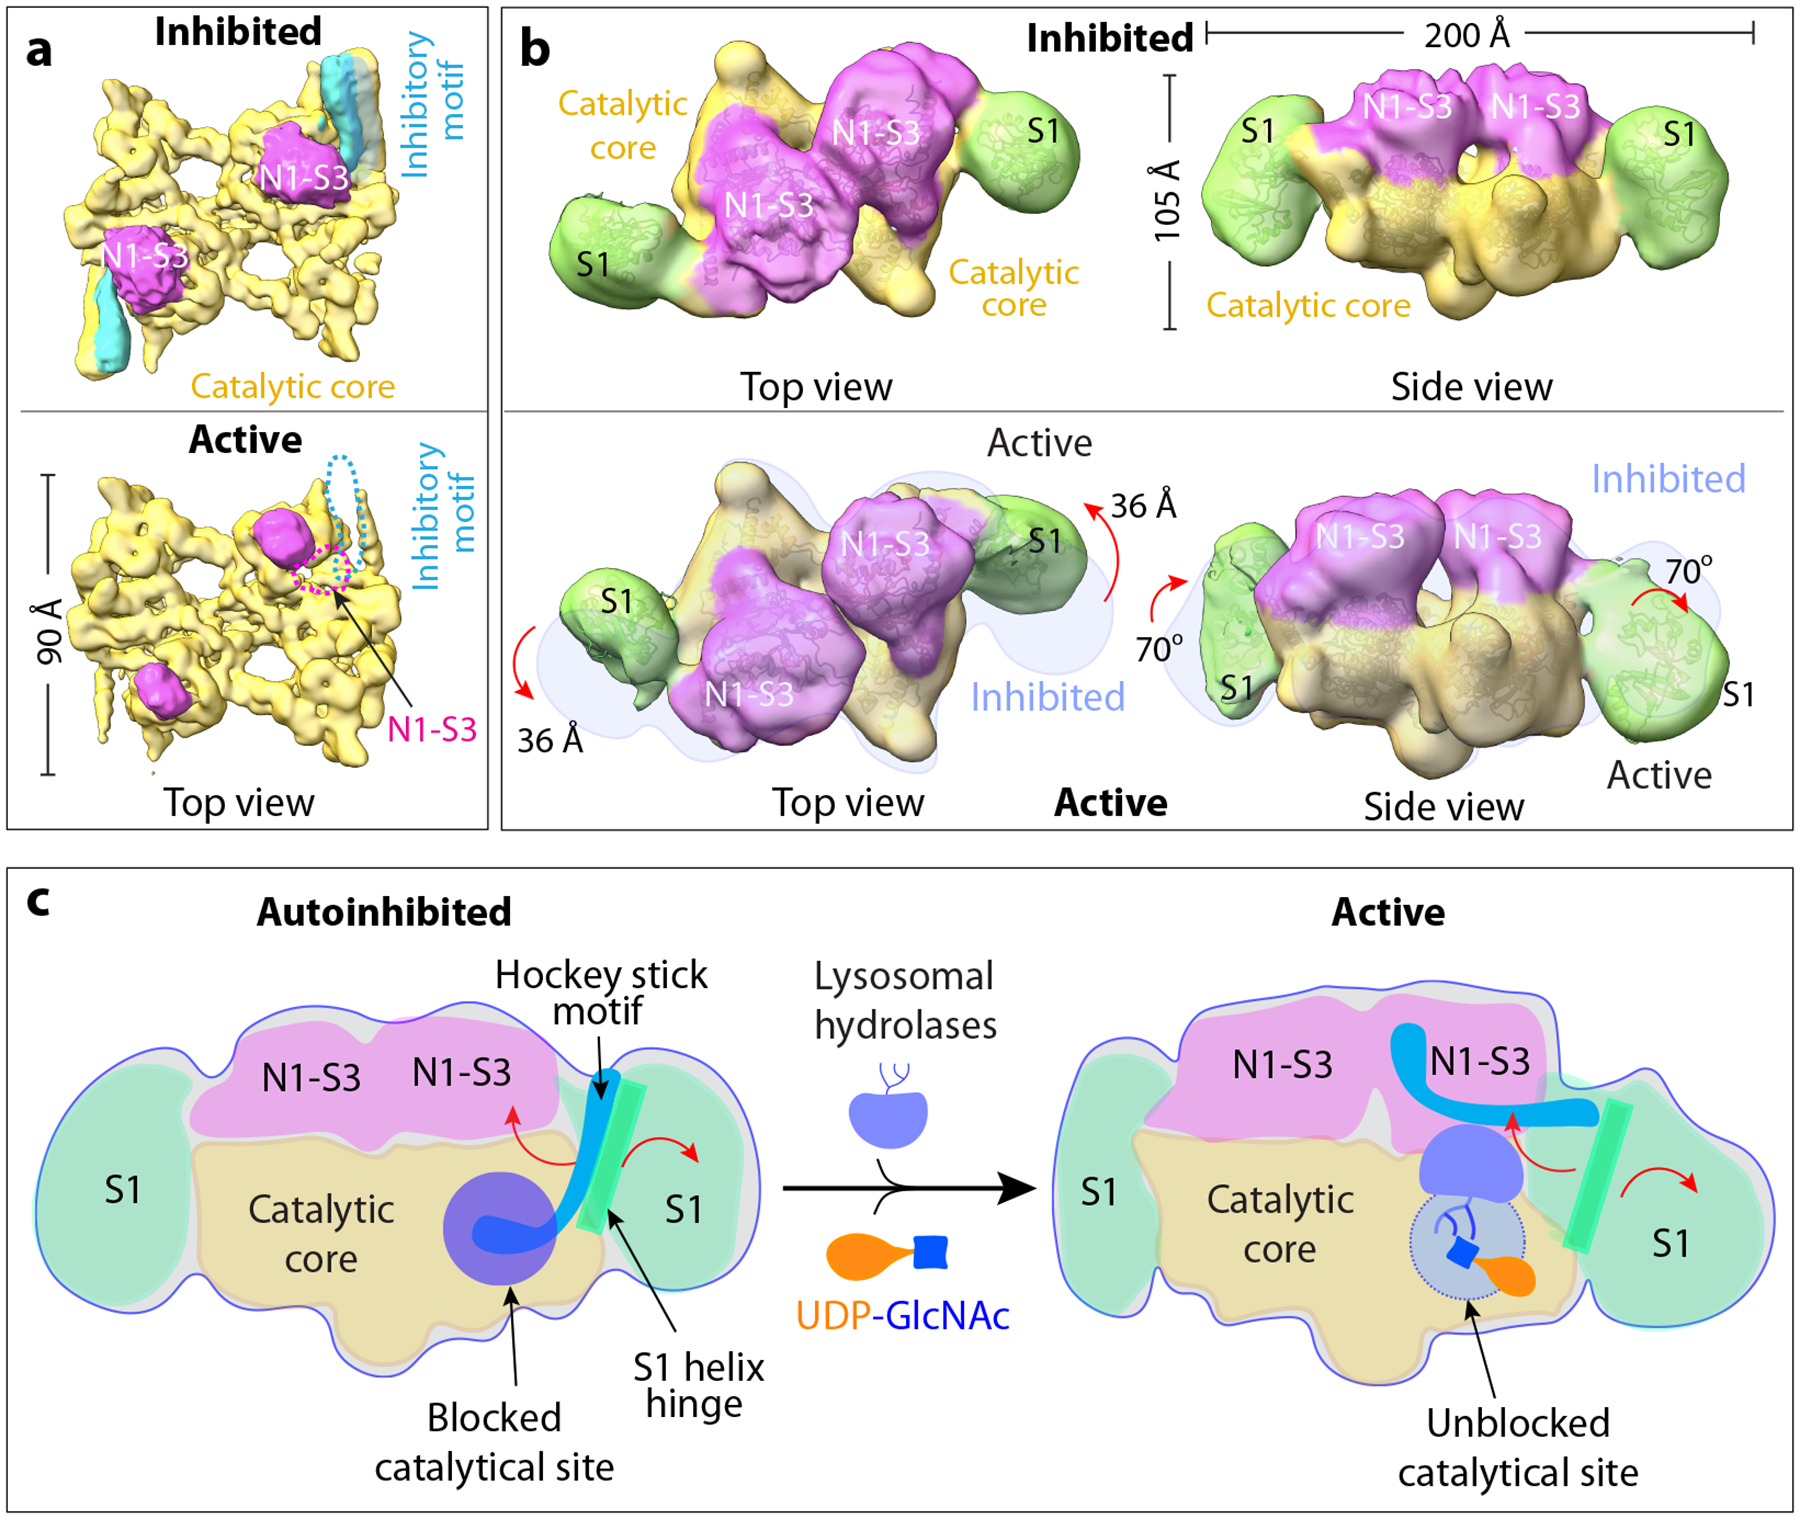
a) The most distinct conformations determined by 3DVA of the core region show the correlated presence and absence of the autoinhibitory motif (light blue) and a small density of the N1-S3 region (magenta). b) 3D variance analysis of the whole enzyme complex shows the S1 movement. S1 is close to the UDP-GlcNAc binding pocket in auto inhibitory conformer (top panel) but has moved away in the active state (bottom panel). The position of the inhibited state is shown as light blue shadow and superimposed on the active map. c) The working model for the human PTase. The autoinhibitory motif shown in blue cartoon can move in and out of the catalytic pocket, which is shown as a purple circle. The S1 domain functions like a door that can open up for donor and acceptor substrate binding.
We next performed 3DVA on the whole particles of human PTase α2β2 but at a lower resolution of around 1.5 nm (Supplementary Video 2). As expected, the catalytic core was largely invariant. However, two large pieces of densities flanking the dimeric core region showed significant variability, consistent with a large-scale movement; in the two extreme states of inhibited and active states, the domain rotates by 70° and shifts by 36 Å (Fig. 4b). The density occurs where the S1-H1 helix ends and where the CR2 starts, and therefore, should belong to the S1 domain. The structure of S1 core region was previously determined by NMR (PDB ID 2N6D) by the Kurt Wuthrich lab, revealing a saddle-like shape with two similar subdomains each composed of three α-helices and four β-strands (Extended Data Fig. 8a–b). Indeed, the S1 core fits well with the EM density (Extended Data Fig. 8c). After assignment of the core and S1, the remaining region of the 3D map can be confidently assigned to the contiguous N1-S3 region (438–955, including N1, N2, S2, DMAP, and S3). Indeed, the S3 region hockey-stick density resolved in the 3.3- Å resolution inhibited 3D map of the catalytic core is S3-H1 which coincides with the assigned N1-S3 region in the low-resolution whole-particle map (Fig. 4a–b). Since the first sub-domain composed of CR1-CR2 contains the UDP-GlcNAc binding pocket, the largescale movement of the S1 domain away from the catalytic pocket can be likened to opening of a door to the catalytic pocket. The smaller scale changes in the N1-S3 region observed in the higher resolution map are not easily discernible in the lower-resolution full map. In other words, the N1-S3 region does not undergo largescale movement in solution; however, it’s possible that N1-S3 may undergo more significant changes upon binding to lysosomal hydrolases which were not used in the present study.
DISCUSSION
Based on structural and functional insights obtained from the current work, we propose the following substrate-dependent activation mechanism of human PTase (Fig. 4c). We suggest that PTase in solution is in flux between an autoinhibited state and an active state. In the autoinhibited form, the S1 domain blocks entry to the UDP-GlcNAc binding pocket, and the hockey-stick motif within the S3 domain resides in the catalytic pocket and blocks the acceptor substrate. Presumably, a cognate N-glycosylated lysosomal hydrolase would preferentially bind to the active state, via interaction with the partially flexible N1-S3 region. Binding by the lysosomal enzyme would lock PTase in the active state and prevent the latter from reverting to the inactive state. Lysosomal enzyme binding may also induce further conformational changes in PTase to align the N-glycan on the substrate protein into the catalytic pocket. Once the donor UDP-GlcNAc and the acceptor are in place and the catalytic pose is set up with the help of the acceptor protein, UDP-GlcNAc hydrolysis occurs and the resulting GlcNAc-P is transferred onto a mannose of the N-glycan, completing the phosphorylation reaction. This mechanism is somewhat simplified because the atomic structure of the N1-S3 is still unknown, and our analysis included neither a lysosomal enzyme nor the PTase γ subunit, which is required for the modification of some, but not all, lysosomal enzymes. Nevertheless, our model is consistent with published work documenting lysosomal hydrolase recognition by the Notch repeats and the DMAP domain12,13. Our structure-based proposal is also consistent with a previous report demonstrating a regulatory function of the S1 domain11. The autoinhibitory hockey-stick motif we have identified inside the catalytic pocket is near the end of the S3 domain (S3-H2), and we have shown here that deleting this motif indeed enhanced PTase activity. This is again consistent with the previous finding that the S3 domain is inhibitory to PTase activity and removal of the entire region increases the enzyme activity16.
Historically, the M6P signal mediated lysosomal hydrolase trafficking was the first confirmed biological function for glycans on mammalian proteins, and it was also the first established link between glycoprotein synthesis and human disease. Indeed, many disease mutations are at key functional sites of the PTase structure (Extended Data Fig. 9). Our structural study and the associated functional studies of selected disease mutations have shed light into the M6P system and will serve as a solid foundation for further investigation into this key system.
MATERIALS AND METHODS
Purification of PTase.
We used a previously reported construct for expressing the soluble human PTase in which both the N- and C-terminal transmembrane domains and cytosolic tail were truncated and the S1P cleavage site (923TGRQLK928) was replaced by furin cleavage site (923RARYKR928)21. The initial purification of the soluble PTase was achieved using a HPC4-Sepharose affinity matrix. Briefly, the conditioned medium from a CHO-K1 cell line stably expressing the soluble PTase with the HPC4 epitope was loaded onto the HPC4-Sepharose column equilibrated with buffer A (1 M NaCl, 50 mM Tris-HCl, pH 7.2, 1 mM CaCl2, 15 mM MgCl2). Unbound material was removed by first washing with buffer A, and then with buffer B (100 mM NaCl, 50 mM Tris, pH 7.2, 1 mM CaCl2, 15 mM MgCl2). The soluble PTase was eluted with buffer C (100 mM NaCl, 50 mM Tris-HCl, pH 7.2, 15 mM MgCl2, 5 mM EGTA), and the fractions containing PTase were pooled, diluted six-fold with buffer D (50 mM HEPES, pH 7.2, 15 mM MgCl2) and loaded onto a DEAE-Sepharose column. Following a wash with buffer E (20 mM NaCl, 50 mM sodium acetate, pH 6.5, 15 mM MgCl2), the soluble PTase was eluted with buffer F (150 mM NaCl, 50 mM sodium acetate, pH 6.5, 15 mM MgCl2) and stored in aliquots at −80 °C until use. Thawed samples were subsequently loaded on a Superose 6 Increase 10/300 gel filtration column equilibrated with buffer G (20 mM HEPES, pH 7.8, 75 mM KCl, 10 mM 2-mercaptoethonal, 1 mM EDTA). The peak fractions were collected and characterized by SDS-PAGE with Coomassie blue staining, then concentrated to 0.2 mg/ml.
Cryo-EM grids preparation and data collection.
Cryo-EM grids were prepared using an FEI Vitrobot Mark IV with the chamber temperature set to 6°C and humidity set to 95%. First, Quantifoil R2/1 300 mesh copper grids were glow-discharged for 30 s. Then, droplets of 3 μl of sample at 0.15 mg/mL were applied to the freshly treated grids. The grids were blotted with Whatman 595 filter paper with the blot force set to 2 and blot time set to 3 s. Finally, the EM grids were plunge-frozen into liquid ethane and stored in liquid nitrogen. Cryo-EM data sets were automatically collected using SerialEM software on a Titan Krios operated at 300 kV and at a nominal magnification of 130,000X. A Gatan K3 direct detector recorded micrographs with a pixel size equivalent to 0.414 Å per pixel at the specimen level. The defocus values were set in the range from −1.0 to −2.3 μm. 75-frame movies were recorded with a dose rate of 44 electrons per Å per second with an exposure time of 1.5 s.
Cryo-EM image processing.
A total of 13,320 movies were recorded. Program MotionCor228 was used for motion correction, and CtfFind-4.129 was used for the contrast transfer function estimation and correction. Of the initial lot, 13,201 images were kept after manual inspection. Particle picking was done using Relion-3.130. Around 1,000 particles were manually picked and subjected to 2D classification to generate templates for subsequent automatic particle picking. 5,186,047 were automatically picked and imported into cryoSPARC3.131 for further processing. A total of 1,166,625 particles in those classes with clear features after 2D classification were retained and subjected to 3D classification with C1 symmetry. According to the quality of the four 3D classes, 436,166 particles were selected for further 3D reconstruction and refinement with C2 symmetry. To get a higher resolution map, these particles were subjected to 3D classification with C2 symmetry, after which 365,927 particles in three 3D classes were selected for 3D Non-uniform refinement with C2 symmetry, resulting in a 3D map with 3.1-Å overall resolution. Meanwhile, in order to explore the potential heterogeneity of the core, focused 3D classification followed by signal subtraction with a soft mask containing the core was performed in Relion-3.1. 66,173 particles in one class with an obvious extra hockey stick-like density were selected for 3D Non-uniform refinement with C2 symmetry, which resulted in a 3D map with 3.3-Å overall resolution. The resolution of the 3D map was estimated by gold-standard Fourier shell correlation at the standard threshold of 0.143.
3D variability analysis (3DVA) was carried out to solve for 3 conformational modes in cryoSPARC-3.127. For the whole protein, the final 365,927 particles were down sampled by a factor of 4 and subjected to Non-uniform refinement followed by 3DVA analysis. For the catalytic core region, signal subtraction focused on the core first, after which 3DVA analysis was performed following 3D Non-uniform refinement.
Model building, refinement, and validation.
The atomic model of PTase core was built de novo using COOT32. Bulky residues and N-glycosylation sites were used as landmarks during model building, and the secondary structure predicted by PSIPRED server33. The completed model was refined by real-space refinement using PHENIX34 and manually adjusted in COOT, iteratively. Finally, the model was validated using MolProbity35. To avoid overfitting, cross-validation was performed. Three Fourier shell correlation curves, model vs. final map, model vs. half1 map, and model vs. half2 map, were produced. Figures were prepared using ESPript36, UCSF ChimeraX37, and PyMol (https://pymol.org/2/).
Cell lines.
Generation of the GNPTAB−/− HeLa cell line has been described in detail previously13. GNPTAB−/− HeLa, parental HeLa and HEK 293 cells were maintained in Dulbecco’s Modified Eagle Medium (Corning Mediatech., Manassas, VA) supplemented with 10% (vol/vol) FBS (GenClone, El Cajon, CA), 100 000 U/L penicillin, and 100 mg/L streptomycin (Life Technologies).
DNA constructs.
The full-length human GlcNAc-1-phosphotransferase-V5/His and the truncated ΔS1-S3 deletion constructs in pcDNA6 have been described10,16. Exchange of the V5/His epitope with either the myc or the FLAG tag was achieved by swapping of the 3’ end of the cDNA with a PCR fragment encoding the appropriate epitope. The expression construct for production of soluble PTase in CHO cells has been described in detail21.
The various point mutation constructs, and the ΔS3 deletion construct were generated using the QuikChange site-directed mutagenesis protocol (Stratagene), with either the WT PTase or the S1-S3 construct serving as a template. All primers used in this study are listed in Supplementary Table 1.
GlcNAc-1-phosphotransferase Assay.
Constructs encoding WT and mutant proteins were expressed in GNPTAB−/− HeLa cells or HEK 293 cells by transfection with jetOPTIMUS transfection reagent from Polyplus (Illkirch, France) according to the manufacturer’s protocol. Cells in 6-well plates were harvested 24 h post-transfection and lysed in 250 μl of buffer A (25 mM Tris-Cl, pH 7.2, 150 mM NaCl, 1% Triton-X 100 and protease inhibitor cocktail). 50 μg of cell lysate (5 μg in the case of cells expressing ΔS1-S3) in a final volume of 50 μl was incubated for 1 h at 37°C in buffer containing 100 mM α-methyl mannoside, 50 mM Tris-HCl, pH 7.4, 10 mM MgCl2, 2 mM ATP, 75 μM UDP-[3H]GlcNAc (1 μCi), and 2 mg/mL bovine serum. The reactions were terminated by addition of 950 μl of 2 mM EDTA, pH 8.0. The sample was applied to a 1 mL column of QAE-Sephadex (GE Healthcare, Chicago, IL) equilibrated with 2 mM Tris base, pH 8.0. The column was washed with 5 mL of 2 mM Tris base and phosphorylated products were eluted with 5 mL of 2 mM Tris base containing 30 mM NaCl. The incorporated [3H]GlcNAc-P was determined by addition of 8.5 mL of EcoLite scintillation fluid (MP Biomedicals Inc., Irvine, CA). The background activity in non-transfected cells was less than 1% of that obtained with cells transfected with WT human GNPTAB cDNA.
Immunoblotting.
Proteins resolved by 10% sodium dodecyl sulfate (SDS) polyacrylamide gel under reducing conditions were transferred to nitrocellulose membrane and detected with antibodies as described in the figure legends. The indicated amounts of whole-cell extract were loaded. For immunoblotting, the following dilutions were used for the various antibodies: anti-V5 mouse monoclonal antibody (Invitrogen), 1:1000; anti-myc mouse monoclonal antibody (Development Studies Hybridoma Bank), 1:200 dilution; anti-FLAG mouse monoclonal antibody (Sigma-Aldrich), 1:1000; anti-GAPDH mouse monoclonal antibody (Sigma-Aldrich), 1:5000.
Immunoprecipitation.
HEK 293 cells were transfected individually with either WT αβ-V5 or WT αβ-myc, or co-transfected with WT αβ-V5 and WT αβ-myc, or WT αβ-V5 and αβ(C70S)-myc. Similarly, HEK 293 cells were transfected individually with either the ΔS1-S3-V5 or ΔS1-S3-FLAG cDNAs, or co-transfected with ΔS1-S3-V5 and ΔS1-S3-FLAG, or ΔS1-S3(C70S)-V5 and ΔS1-S3-FLAG. 300 μg of cell lysate in buffer (50 mM Tris-Cl buffer, pH 8.0 containing 0.15 M NaCl, 1% Triton X-100, 2 mM EDTA, 0.5% BSA, and protease inhibitor cocktail) was mixed with 3 μl rabbit monoclonal anti-V5 antibody (Cell Signaling, D3H8Q) pre-bound on Protein A agarose beads (Santa Cruz, sc-2001) at 4 °C overnight. The beads were eluted with 100 μl of SDS sample buffer containing β-mercaptoethanol, and 10 μL of each eluate loaded on to 10% SDS-gel.
Immunofluorescence microscopy.
To determine the subcellular localization of either WT or mutant PTase, the various constructs were transfected into HeLa cells on sterile glass coverslips using jetOPTIMUS transfection reagent. Cells were fixed the following day with 4% formaldehyde (Sigma-Aldrich) for 10 min, then permeabilized and blocked with PBS containing 0.4% (v/v) Triton X-100% and 2% immunoglobulin G-free BSA (Jackson ImmunoResearch) for 1 hr. Cells were probed with the indicated antibodies in PBS containing 0.1% Triton X-100% and 0.5% BSA. For primary antibodies, the anti-V5 mouse monoclonal antibody (Invitrogen) was used at a dilution of 1:1000 while the anti-giantin rabbit polyclonal antibody (BioLegends) was used at a dilution of 1:2000. For secondary antibodies, the goat anti-mouse Alexa 488+ antibody (Invitrogen) and the goat anti-rabbit Alexa 555 antibody (Invitrogen) were both used at a dilution of 1:750. Following fluorophore-conjugated secondary antibody treatment and washing, the processed cells were mounted in ProLong® Glass antifade mounting medium (Life Technologies), and the images were acquired with an LSM880 confocal microscope (Carl Zeiss Inc., Peabody, MA). Images were analyzed by ImageJ software (Fiji, version 1.53n).
Data availability.
The 3D cryo-EM maps of human PTase catalytic core in the active state (3.1 Å) and autoinhibited state (3.3 Å) have been deposited in the Electron Microscopy Data Bank under accession code EMD-24784 and EMD-24785, respectively. The atomic model based on the two 3D maps has been deposited in the Protein Data Bank under accession code PDB ID 7S05 and 7S06, respectively. Source data are provided with this paper.
Extended Data
Extended Data Fig. 1. Workflow for cryo-EM structure determination.
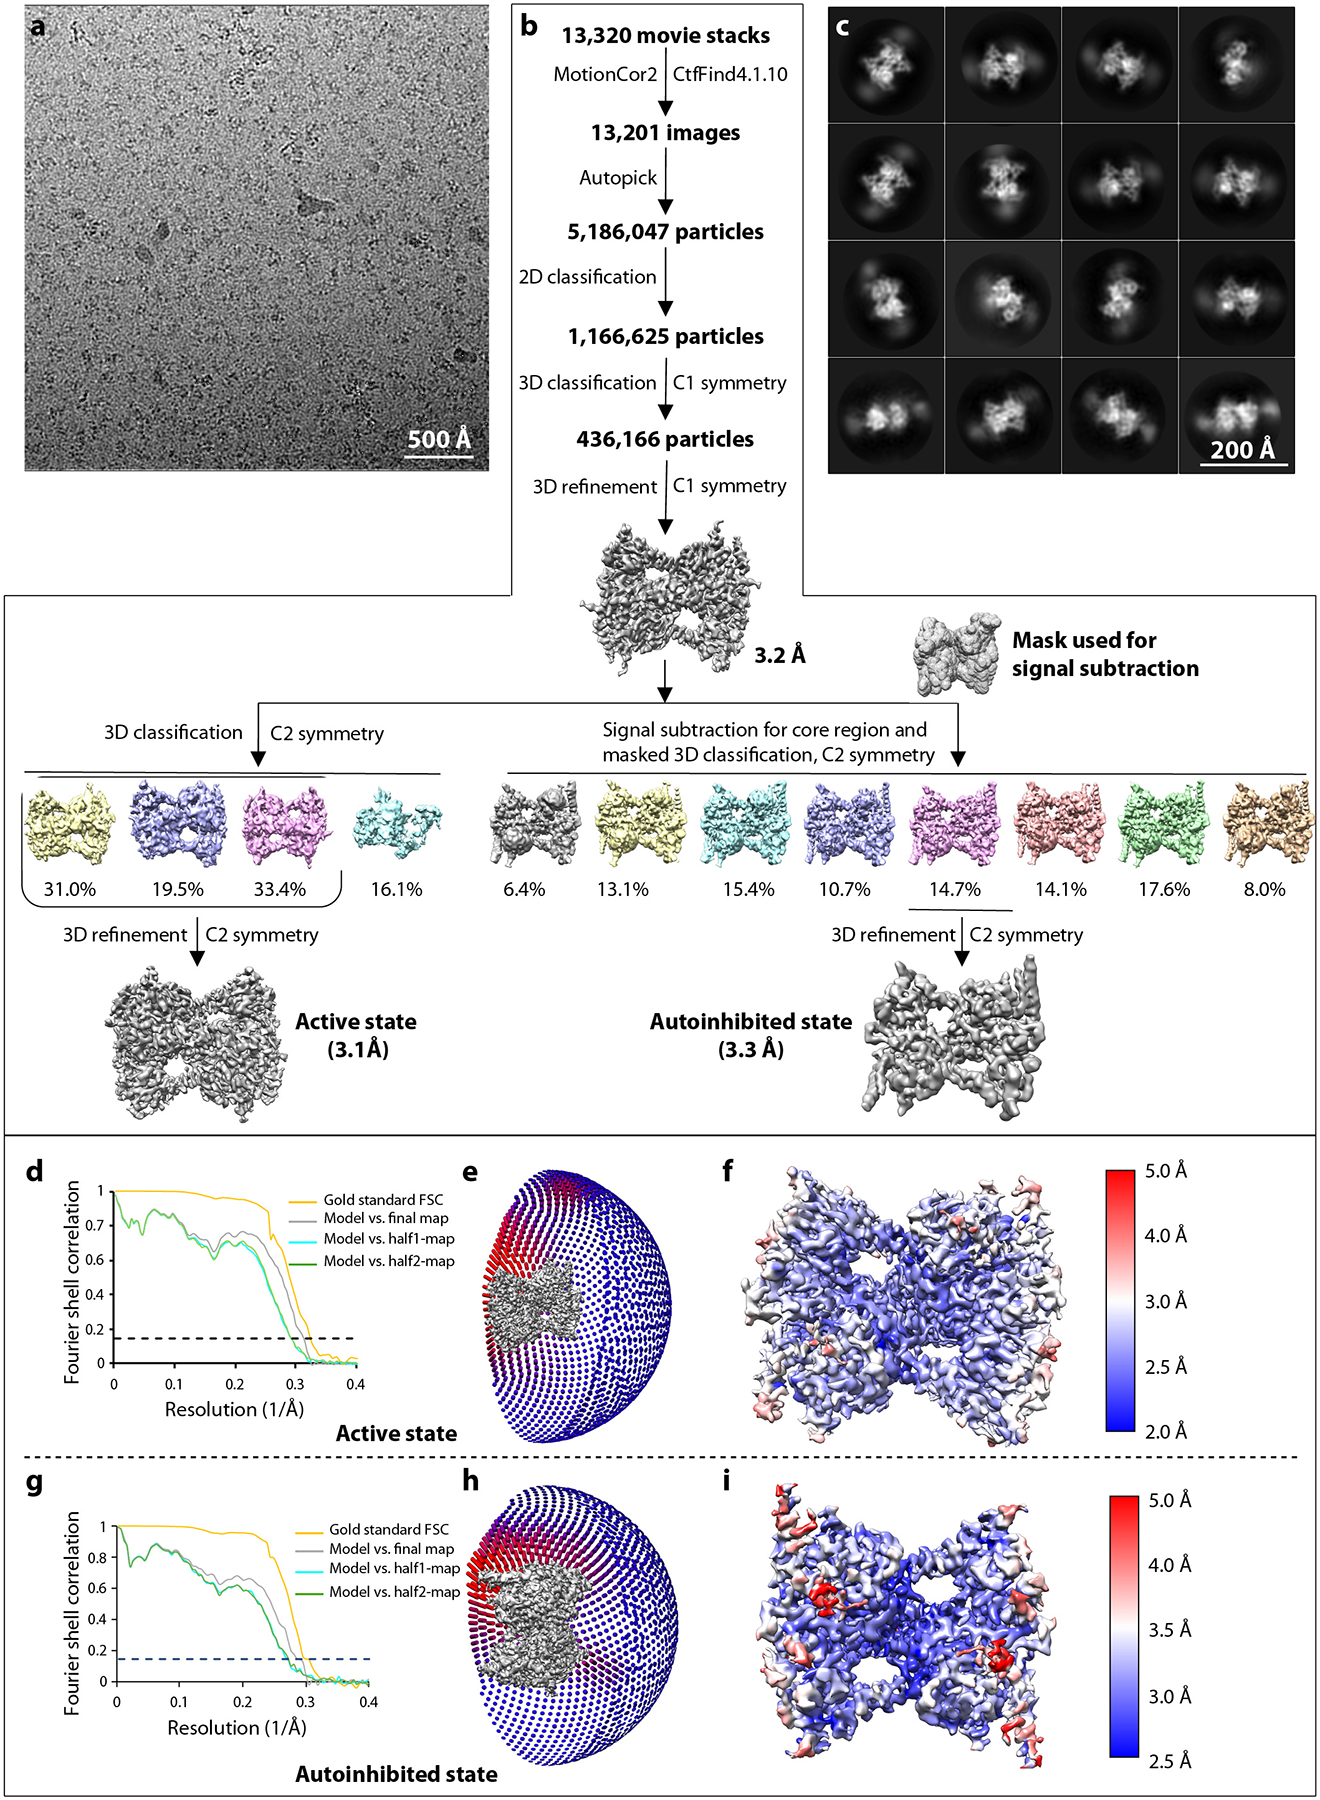
a) A typical raw micrograph. A total of 13,201 micrographs were recorded. b) Workflow of cryo-EM data processing. c) Selected 2D averages out of a total of 34 class averages. d, g) Gold-standard Fourier shell correlations; e, h) Eulerian angle distribution of particles used for 3D reconstruction. f, i) Local resolution maps in the active and autoinhibited states.
Extended Data Fig. 2. Cryo-EM 3D map of the core region of the human PTase.
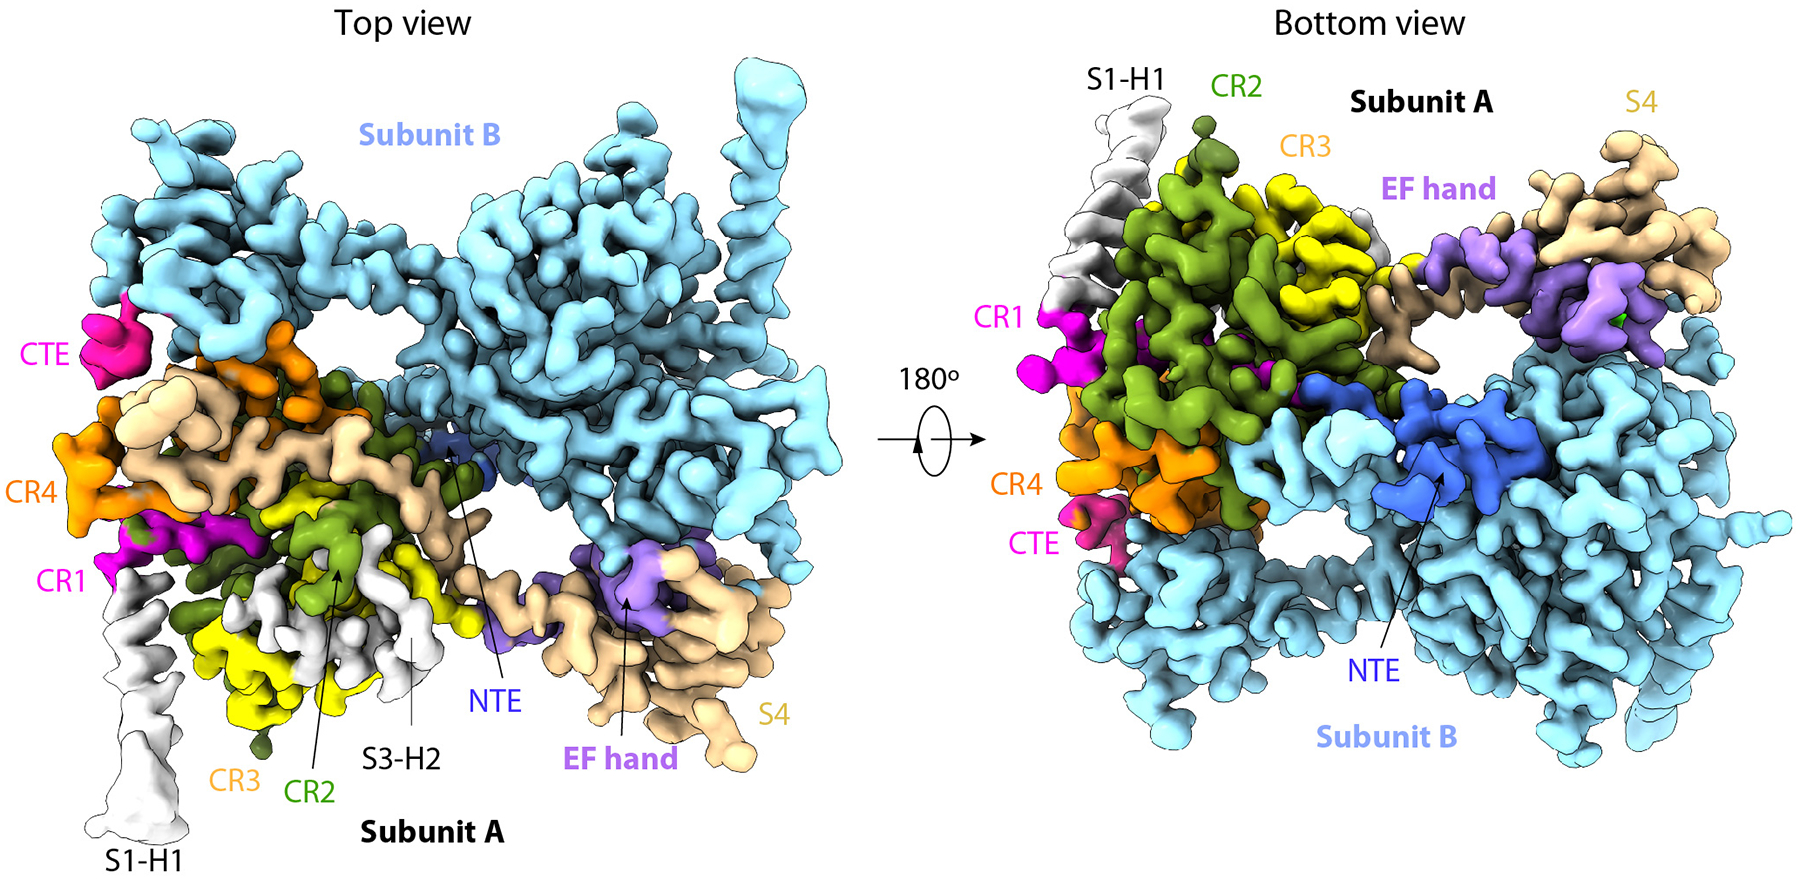
Top and bottom views of the density map with the NTE, CR1-4, EF hand, S4, CTE, and the two resolved helices in S1 and S3 in subunit A colored in blue, magenta, olive drab, yellow, dark orange, purple, wheat, pink, and gray, respectively. Subunit B is in cyan.
Extended Data Fig. 3. EM density superimposed with the atomic model.
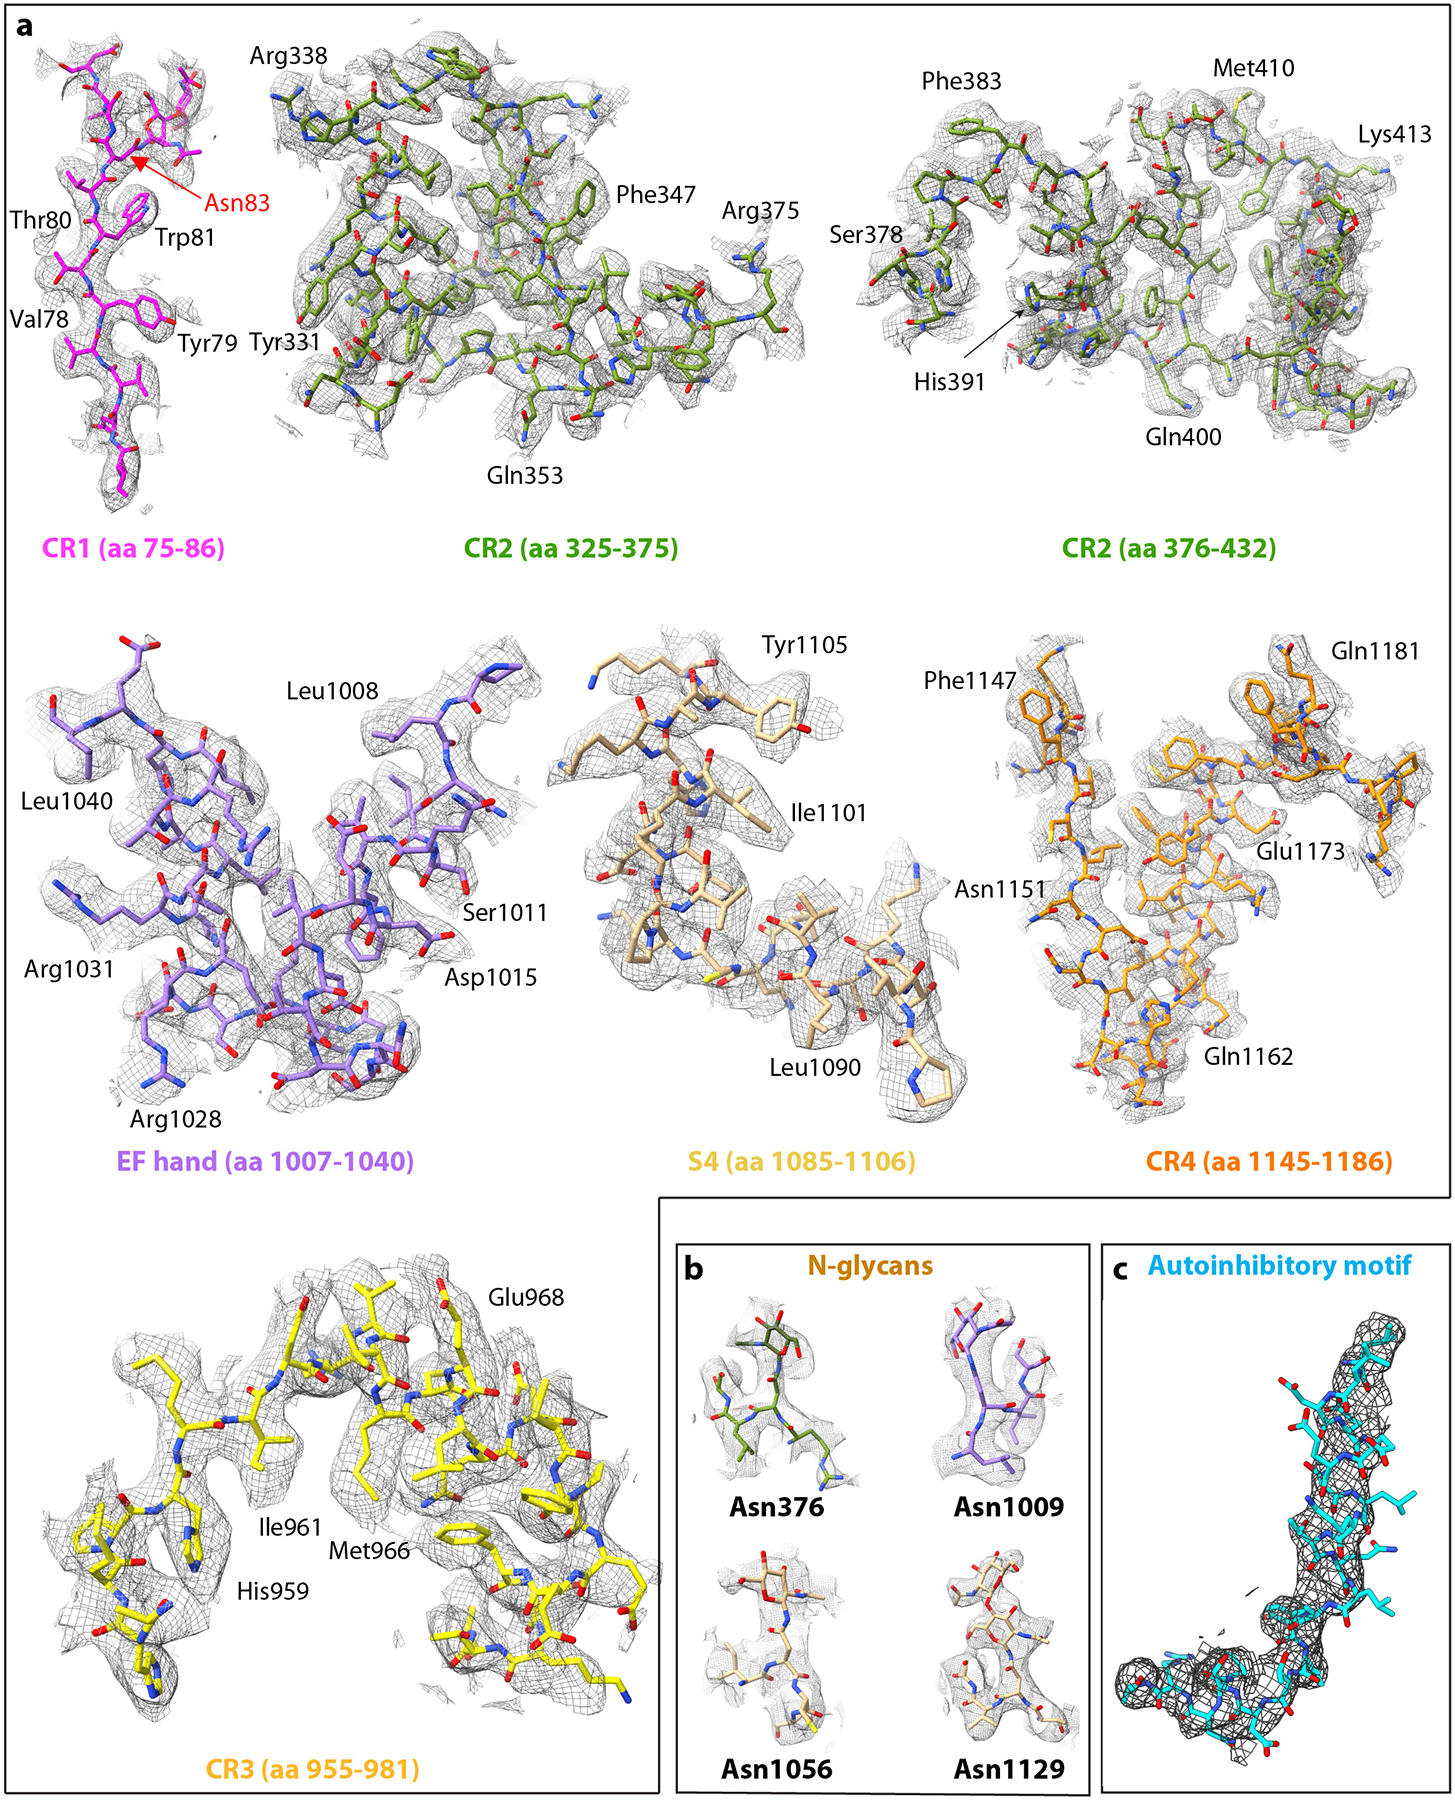
a) EM density selected from each main region. b) EM densities for four of the five identified N-glycans. The density for other N-glycan on Asn-83 is shown in the first panel of (a). c) EM density of the autoinhibitory hockey-stick motif, which is the first α-helix of S3 domain (S3-H1).
Extended Data Fig. 4. Topology of PTase αβ monomer.
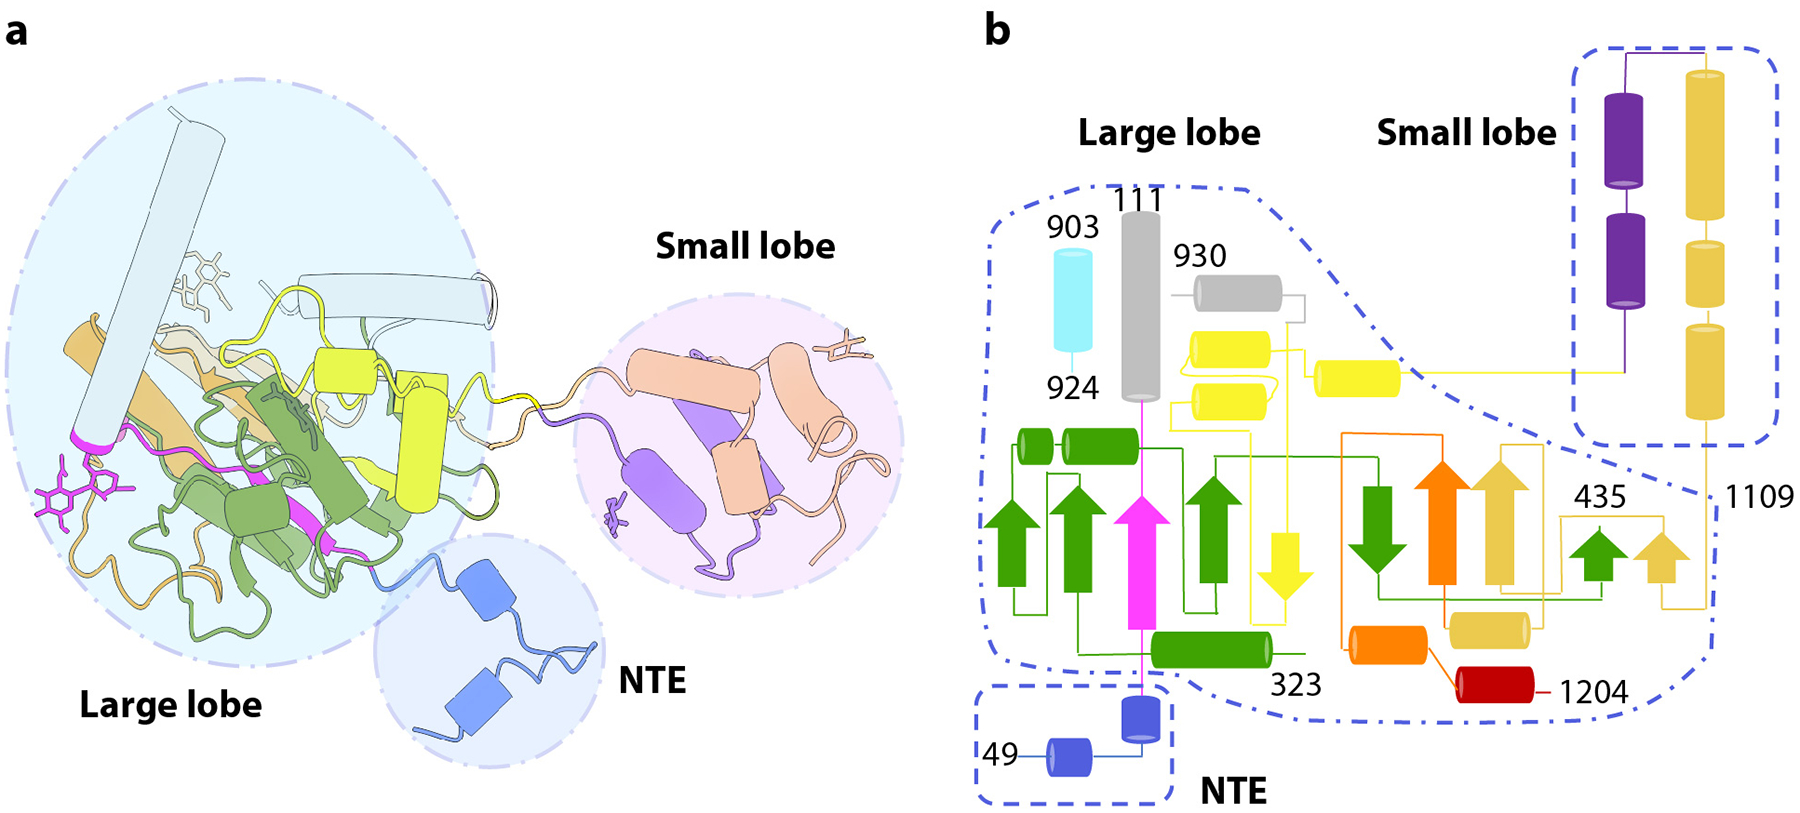
a) Monomer structure in cartoon with the three main regions highlighted in circles. b) Topological plot of the secondary structures. The three main regions are included in dashed shapes. Shown are the NTE, the large lobe, and the small lobe of a PTase monomer. NTE, CR1-4, EF hand, S4, and CTE are colored in blue, magenta, olive drab, yellow, dark orange, and purple, wheat, pink, respectively.
Extended Data Fig. 5. Effect of dimerization and interface mutations on PTase activity.
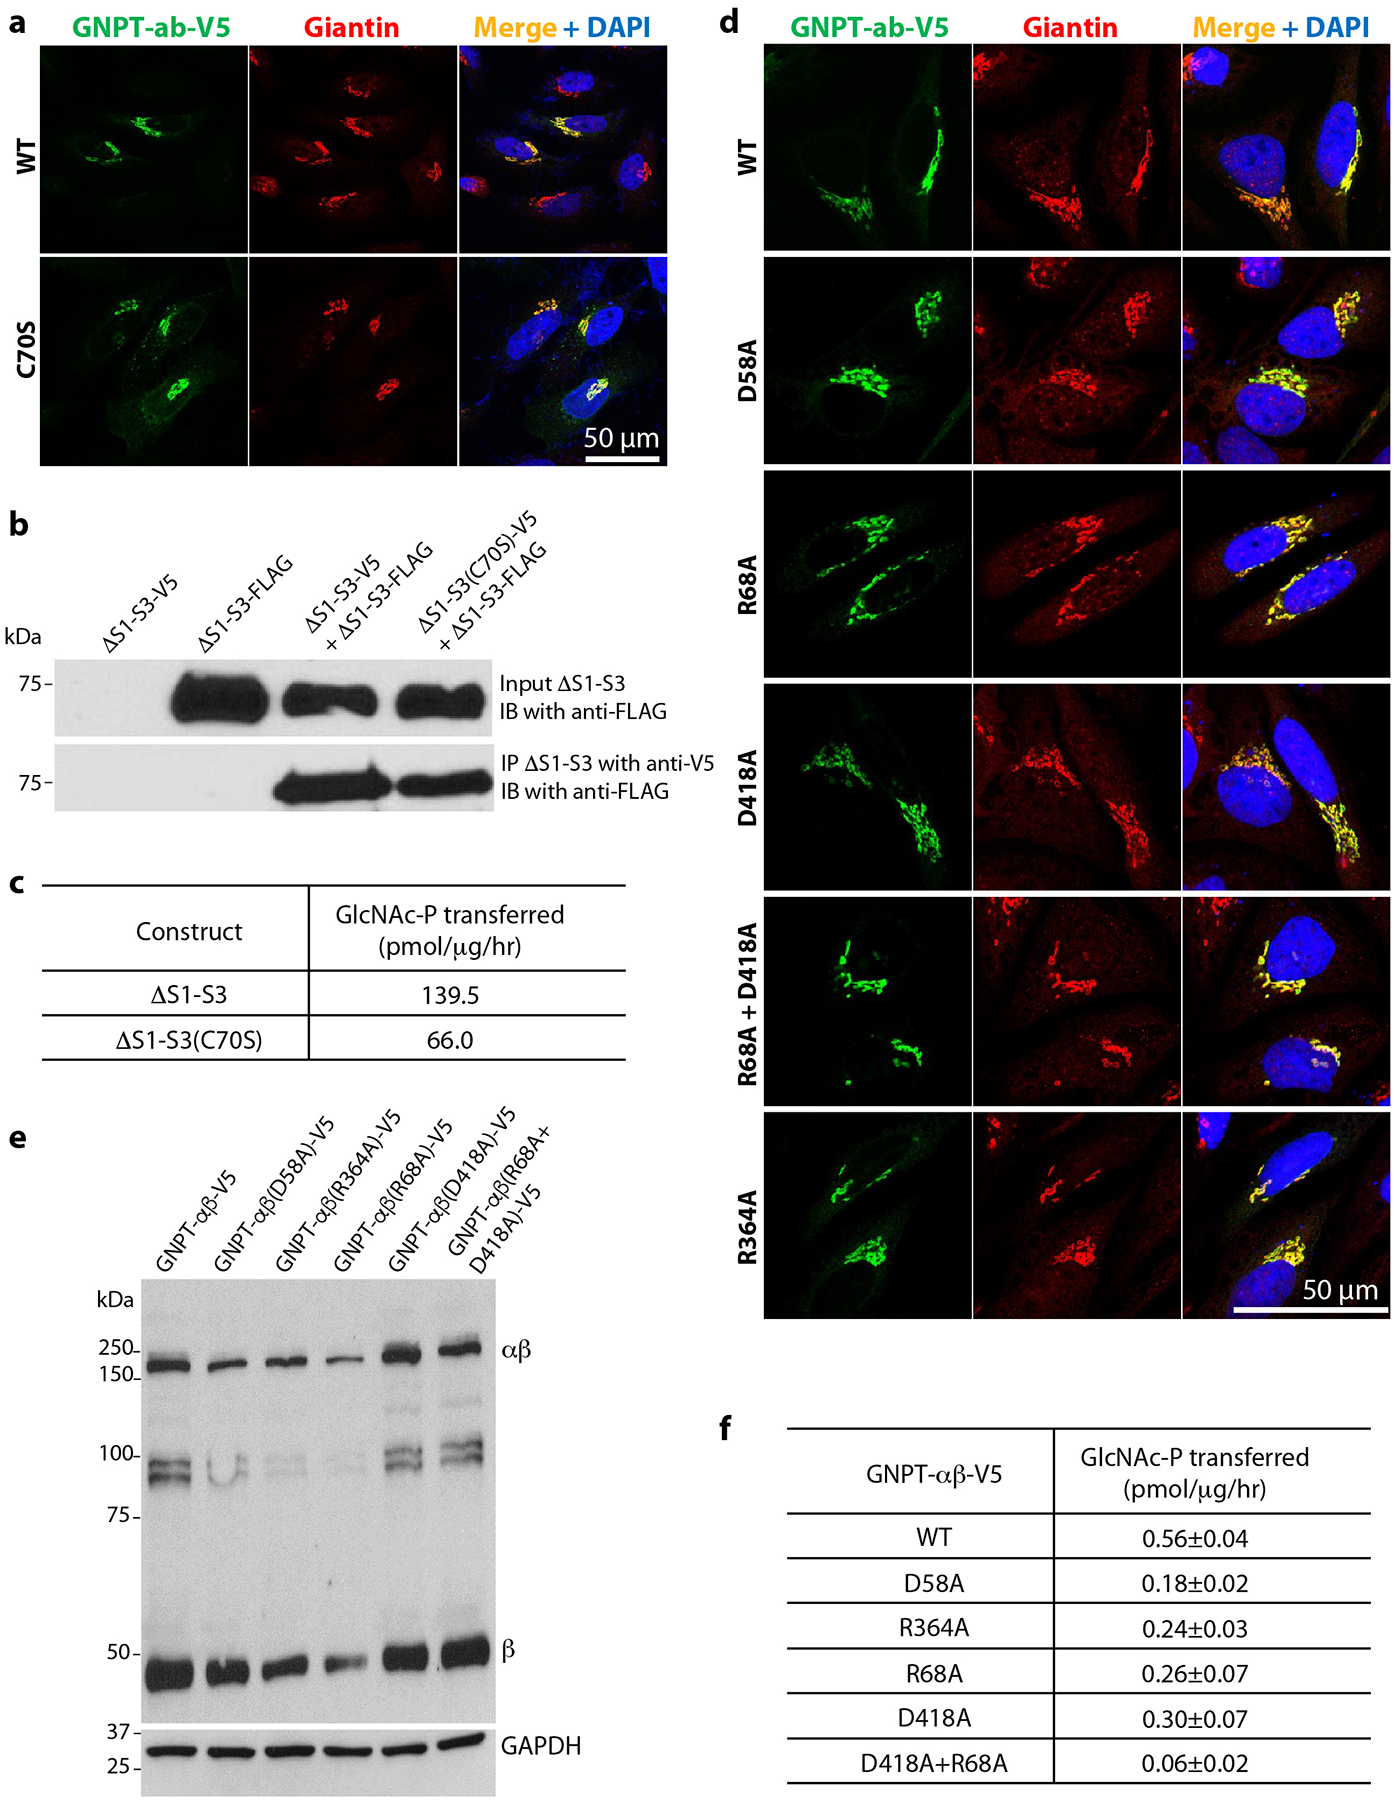
a) Immunofluorescence microscopy of transfected HeLa cells showing Golgi localization of WT PTase and the C70S mutant. b) Effect of C70S on the ability of PTase ΔS1-S3 to form a non-covalent dimer, as assessed by co-immunoprecipitation. Cell lysates from HEK 293 cells transfected with the indicated plasmids were immunoprecipitated with an anti-V5 rabbit monoclonal antibody, and the pellet fractions (10% loaded) were immunoblotted with an anti-FLAG mouse monoclonal antibody. For the input, only the immunoblot probed with the anti-FLAG antibody is shown here. The expression of ΔS1-S3-V5 in the input was ascertained by probing a separate blot with the anti-V5 rabbit monoclonal antibody (not shown). c) Effect of C70S on the ΔS1-S3 α-methylmannoside activity. For the activity assay, ΔS1-S3 and ΔS1-S3(C70S) were expressed in HEK 293 cells. The data shown are the mean of 2 independent experiments. d) Immunofluorescence microscopy of transfected HeLa cells shows the various interface mutants to be localized to the Golgi similar to WT PTase. e) Immunoblot of WT PTase and the interface mutants expressed in GNPTAB−/− HeLa cells, and probed with a monoclonal antibody against the V5 tag. 25μg of each cell lysate was loaded. f) α-methylmannoside activity of WT PTase and the interphase mutants expressed in GNPTAB−/− HeLa cells. The data shown are the mean ± SD for 3 independent experiments. Uncropped images for b,e and data for graphs in c,f are available as source data.
Extended Data Fig. 6. Effects of mutations in the dimer interface at the EF hand and CR4 region.
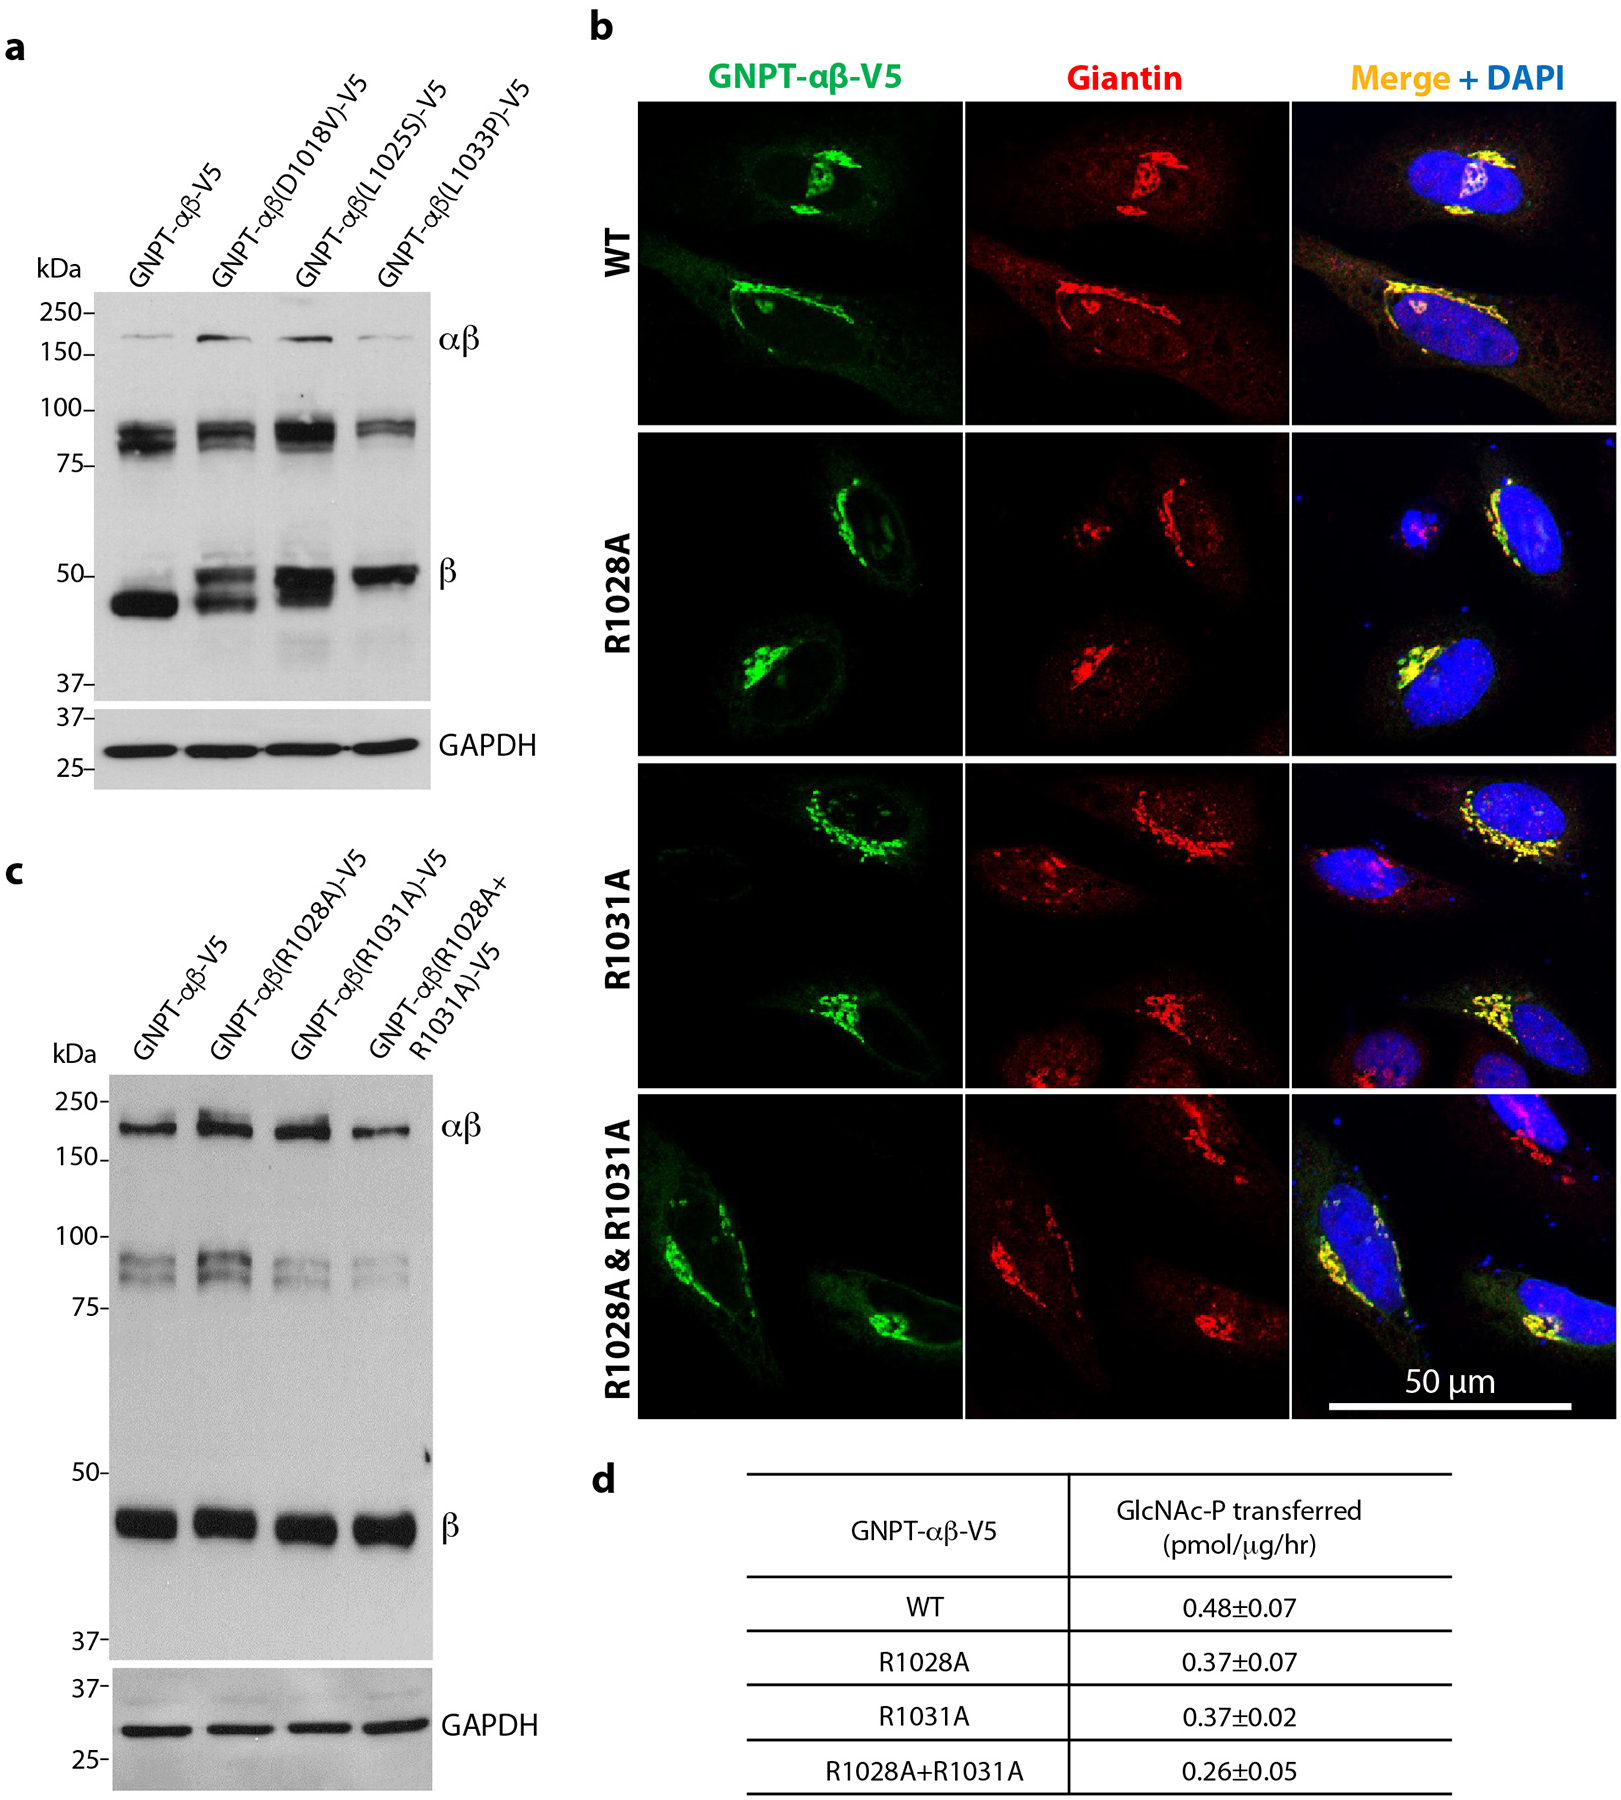
a) Immunoblot of WT PTase, D1018V, L1025S and L1033P expressed in GNPTAB−/− HeLa cells and probed with a monoclonal antibody against the V5 tag. 25μg of each cell lysate was loaded. b) Immunofluorescence microscopy of transfected HeLa cells shows the R1028A, R1031A, and R1028A/R1031A mutants to be localized to the Golgi similar to WT PTase. c) Immunoblot of WT PTase, R1028A, R1031A, and R1028A/R1031A expressed in GNPTAB−/− HeLa cells and probed with a monoclonal antibody against the V5 tag. 25μg of each cell lysate was loaded. d) α-methylmannoside activity of WT PTase, R1028A, R1031A, and R1028A/R1031A expressed in GNPTAB−/− HeLa cells. The data shown are the mean ± SD for 3 independent experiments. Uncropped images for a,c and data for graph in d are available as source data.
Extended Data Fig. 7. Effects of catalytic site mutations.
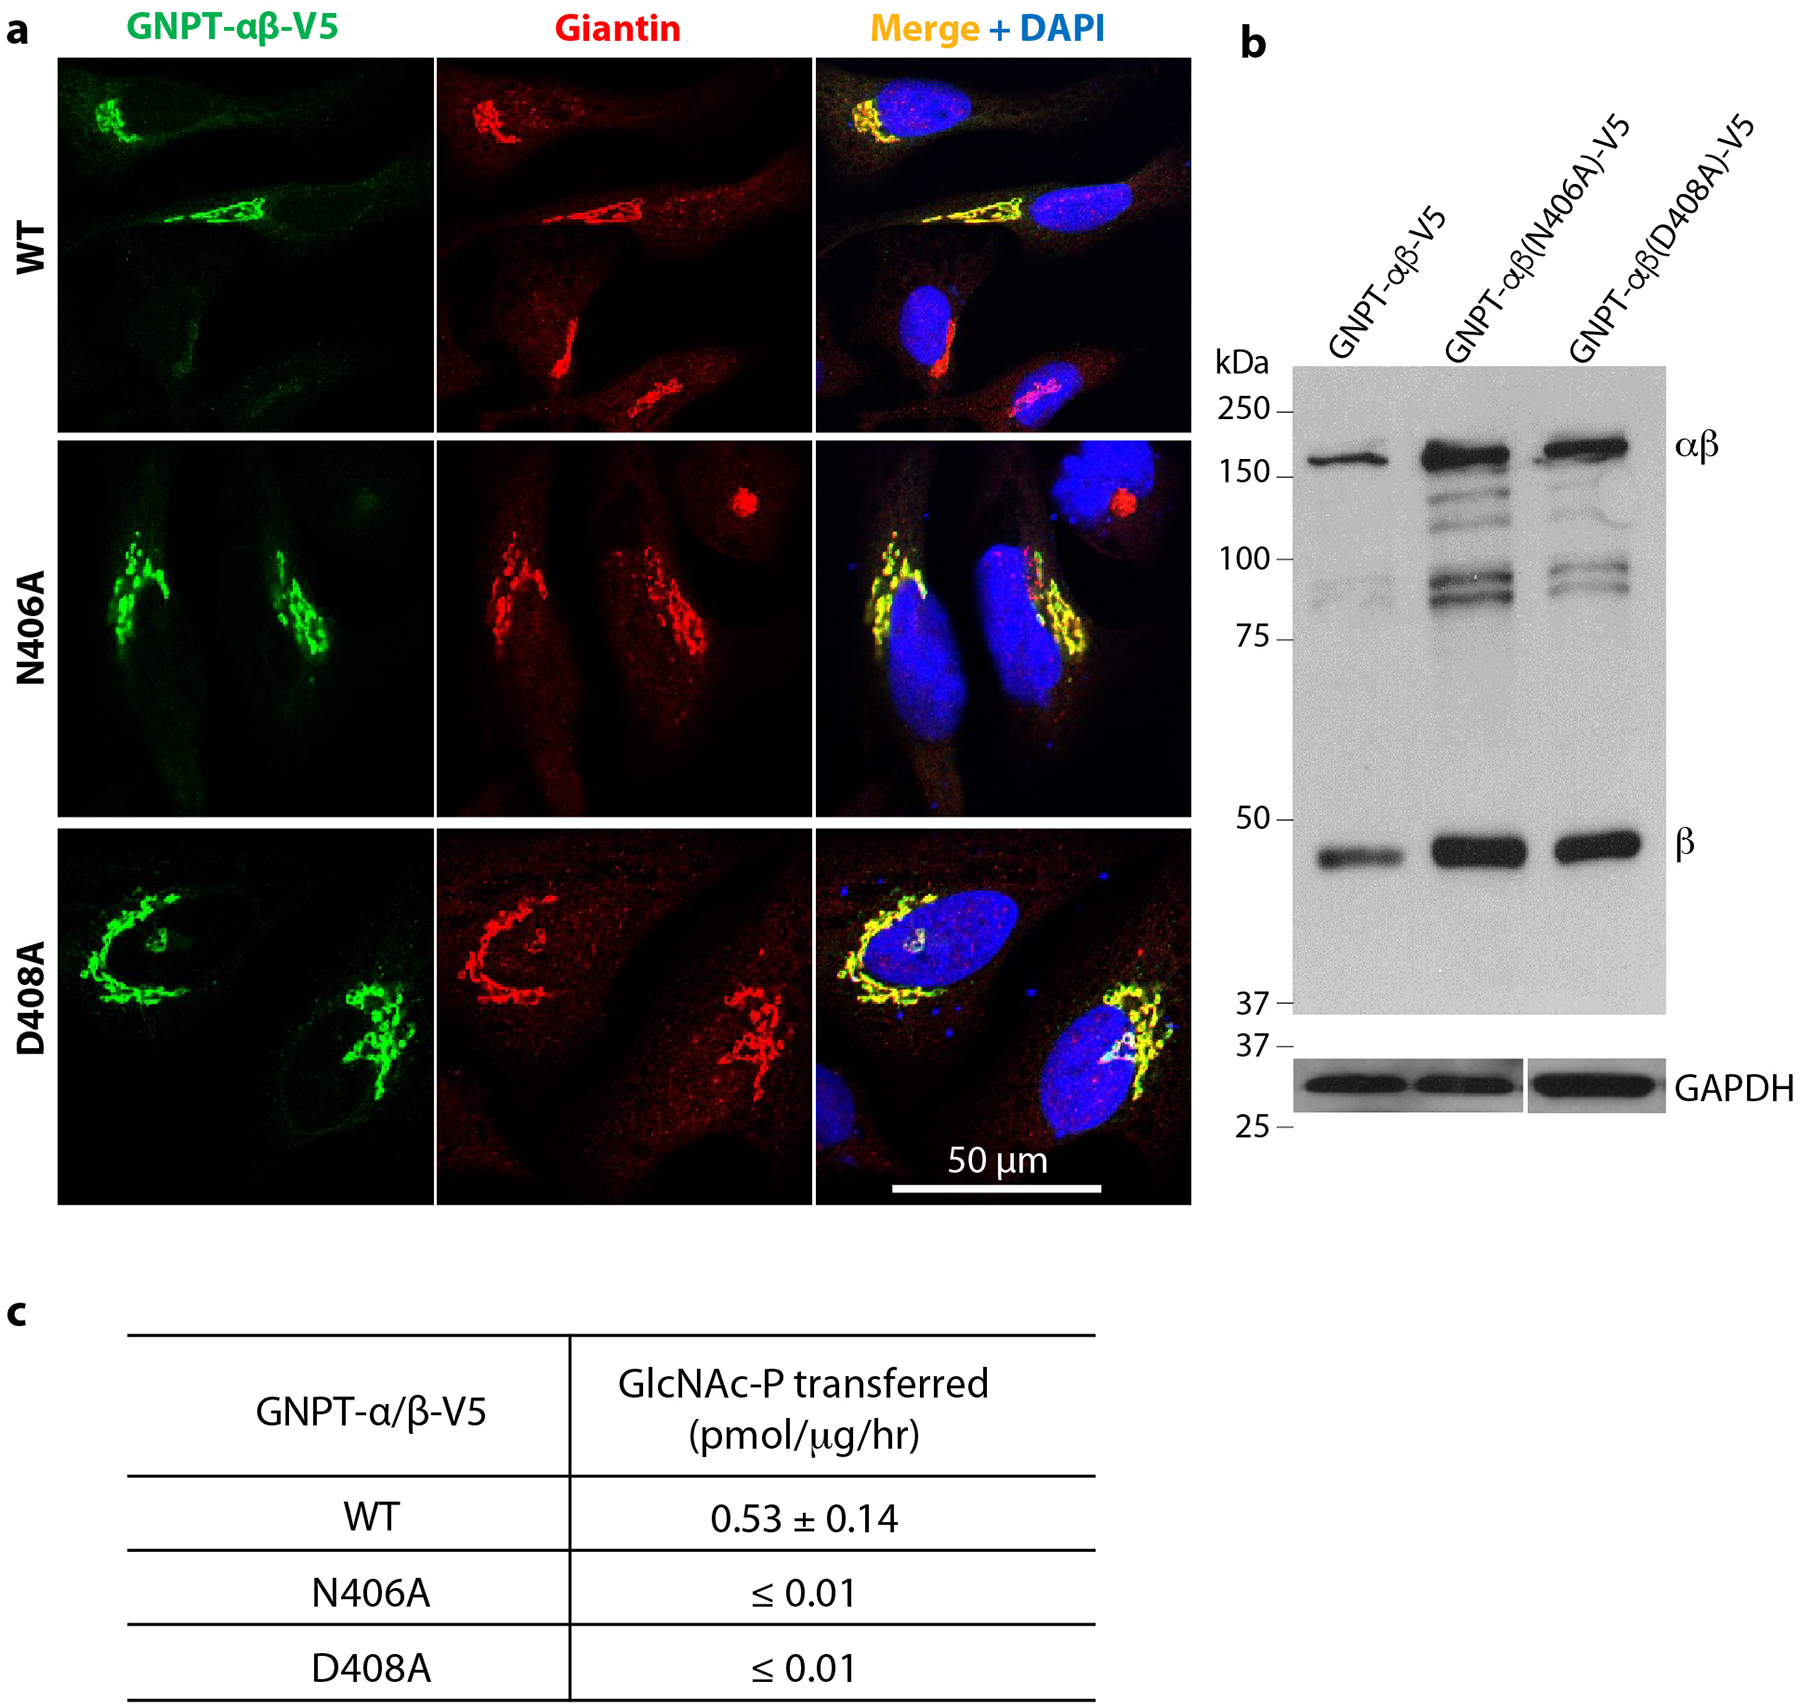
a) Immunofluorescence microscopy of transfected HeLa cells shows the N406A and D408A mutants to be localized to the Golgi similar to WT PTase. b) Immunoblot of WT PTase, N406A and D408A expressed in GNPTAB−/− HeLa cells and probed with a monoclonal antibody against the V5 tag. 25μg of each cell lysate was loaded. c) α-methylmannoside activity of WT PTase, N406A and D408A expressed in GNPTAB−/− HeLa cells. The data shown are the mean ± SD for 2 independent experiments. Uncropped images for b and data for graph in c are available as source data.
Extended Data Fig. 8. The S1 domain structure.
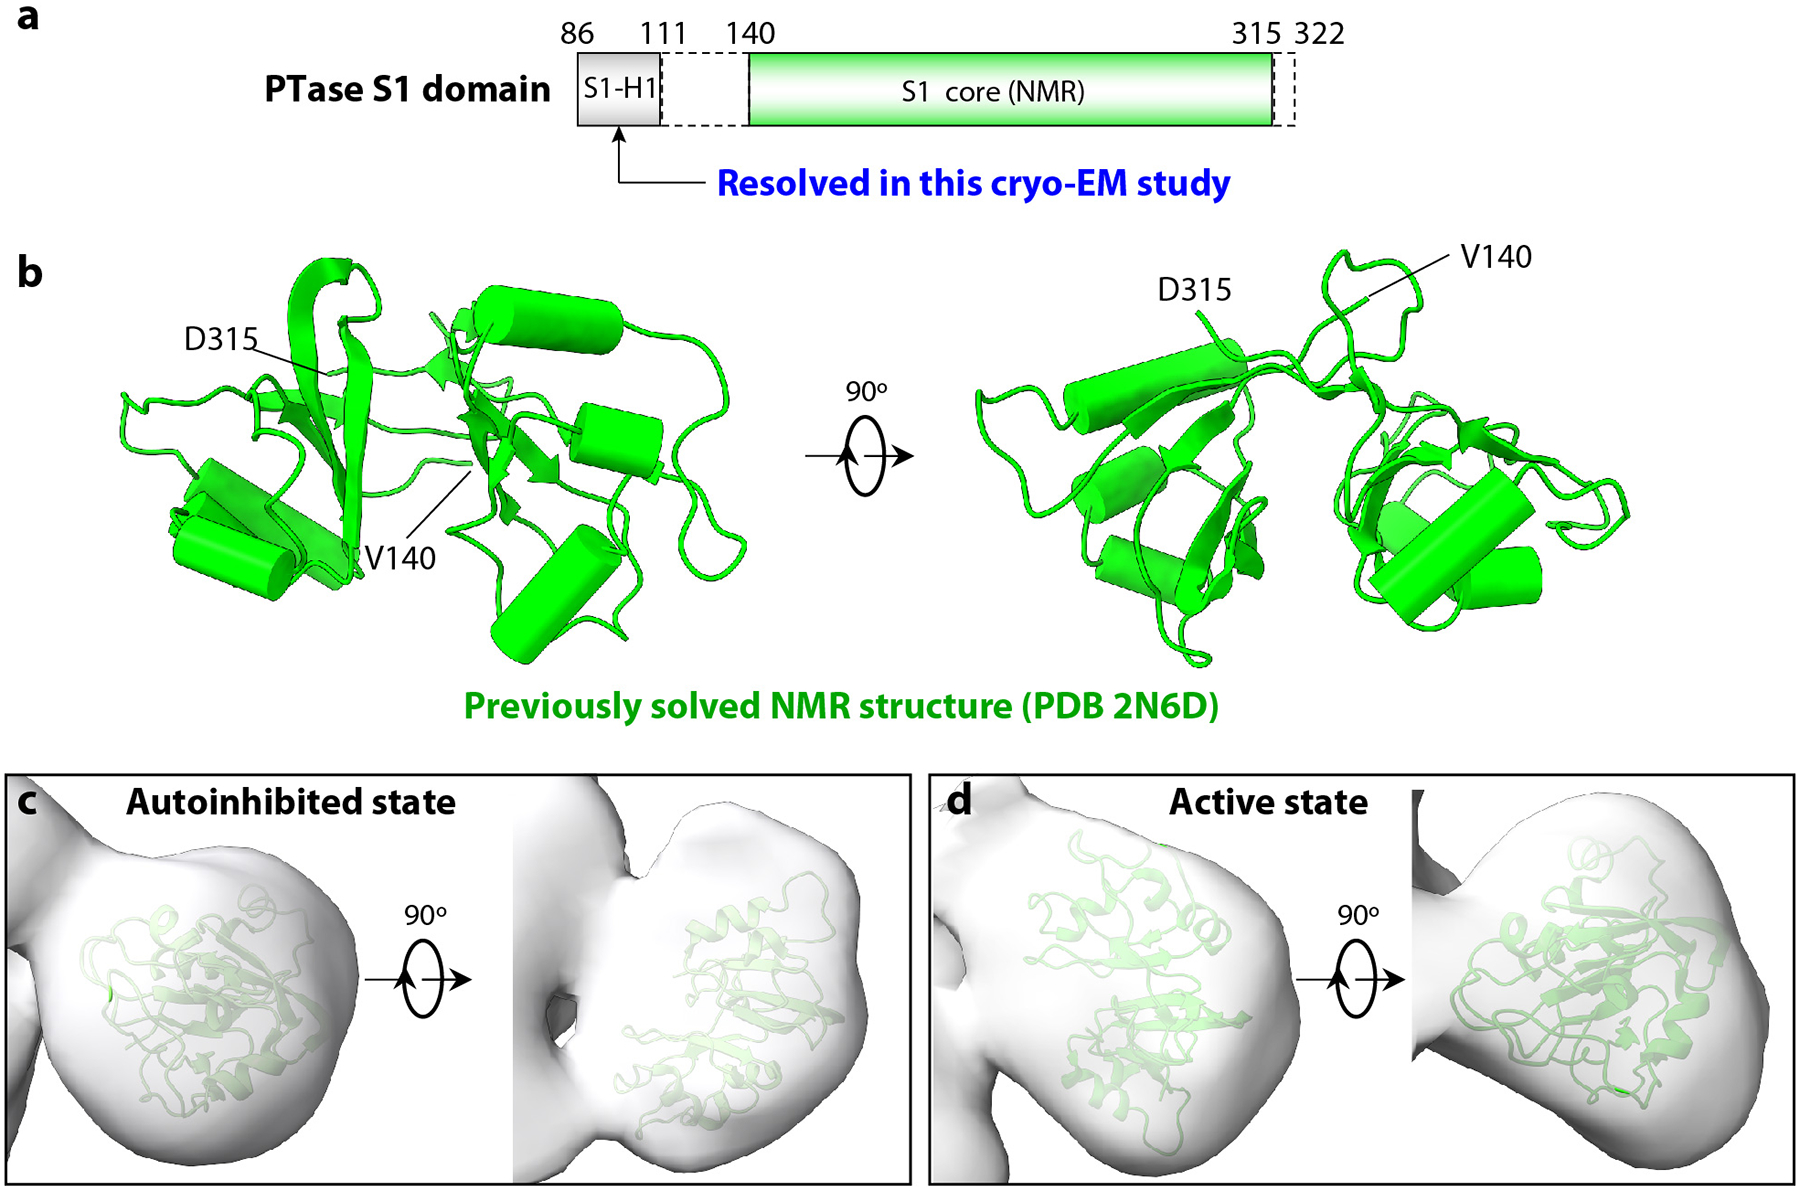
a) Sub domain organization of the human PTase S1 domain. S1-H1 is the first α-helix resolved in this study upstream of the S1 core. Structure in the dash rectangle, is currently unknown. b) Two orthogonal cartoon views of the S1 core structure solved previously by the Kurt Wuthrich lab and Joint Center for Structural Genomics using NMR method (PDB ID 2N6D). The S1 core has a saddle-like shape with a pseudo 2-fold symmetry. Each subdomain contains three α-helices and four β-strands and the two subdomains are connected by a bridge of two β-strands. c-d) The S1 core docked into the cryo-EM map of the S1 region in the autoinhibited (c) and active state (d).
Extended Data Fig. 9. Mutations mapped on the core structure of PTase.
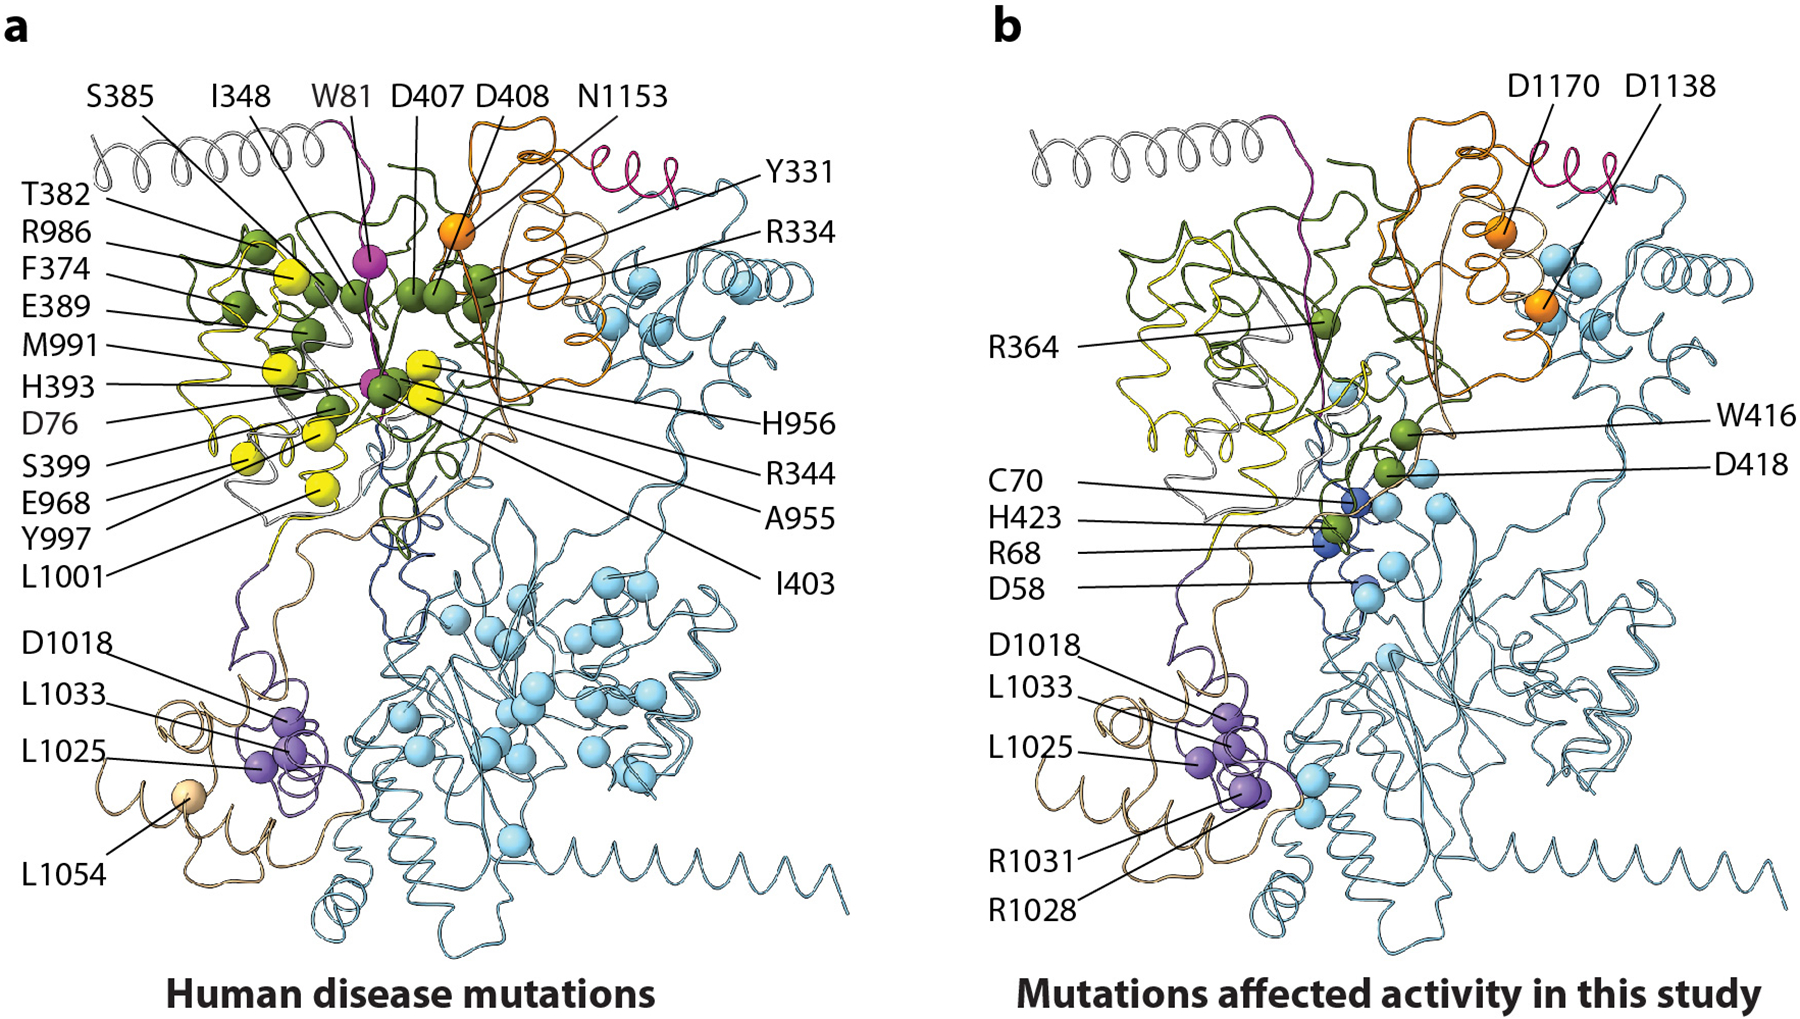
a) Reported human disease related mutations (Velho et al. Hum Mutat 2019, 40, 842–864). b) Mutations examined in this study. Amino acid identity is labeled only for one of the two protomers.
Supplementary Material
Source Data Fig. 2 Unprocessed Western Blots for panel 2c and statistic source data for panels 2d and 2g.
Source Data Fig. 3 Unprocessed Western Blots and statistic source data for panels 3e.
Source Data Extended Data Fig. 7 Unprocessed Western Blots for panels 7b and statistic source data for panel 7c.
Source Data Extended Data Fig. 5 Unprocessed Western Blots for panels 5b and 5e, and statistic source data for panels 5c and 5f.
Source Data Extended Data Fig. 6 Unprocessed Western Blots for panels 6a and 6c and statistic source data for panel 6d.
Supplementary Video 2 Dynamics in the PTase α2β2 complex. A low-resolution 3DVA analysis of the full structure, revealing the large-scale movement in the S1 and N1-S3 regions as the structure transitions from the autoinhibited state to the active state.
Supplementary Video 1 Dynamic in the PTase core region near the catalytic pocket. The video first shows a rotation of the 3D map of the core region in the autoinhibited state superimposed with the atomic model, then zooms into the catalytic site. Next, the scene changes to the 3DVA analysis result, which is composed of 20 3D frames (maps) revealing the EM density changes as the structure transitions from the autoinhibited state to the active state.
Acknowledgements.
Cryo-EM images were collected in the David Van Andel Advanced Cryo-Electron Microscopy Suite at Van Andel Institute. We thank Gongpu Zhao and Xing Meng for facilitating data collection. This work was supported by the U.S. National Institutes of Health (CA008759 to S.K. and CA231466 to H.L.) and a grant from the Yash Gandhi Foundation (to S.K.), and the Van Andel Institute (to H.L.). Raw data and materials generated in this study are freely available upon request from the corresponding authors.
Footnotes
Competing interests. The authors declare no competing interests.
REFERENCES
- 1.Braulke T & Bonifacino JS Sorting of lysosomal proteins. Biochim Biophys Acta 1793, 605–614, doi: 10.1016/j.bbamcr.2008.10.016 (2009). [DOI] [PubMed] [Google Scholar]
- 2.Burda P & Aebi M The dolichol pathway of N-linked glycosylation. Biochim Biophys Acta 1426, 239–257, doi: 10.1016/s0304-4165(98)00127-5 (1999). [DOI] [PubMed] [Google Scholar]
- 3.Bai L & Li H Cryo-EM is uncovering the mechanism of eukaryotic protein N-glycosylation. FEBS J 286, 1638–1644, doi: 10.1111/febs.14705 (2019). [DOI] [PMC free article] [PubMed] [Google Scholar]
- 4.Kudo M et al. The alpha- and beta-subunits of the human UDP-N-acetylglucosamine:lysosomal enzyme N-acetylglucosamine-1-phosphotransferase [corrected] are encoded by a single cDNA. J Biol Chem 280, 36141–36149, doi: 10.1074/jbc.M509008200 (2005). [DOI] [PubMed] [Google Scholar]
- 5.Raas-Rothschild A et al. Molecular basis of variant pseudo-hurler polydystrophy (mucolipidosis IIIC). J Clin Invest 105, 673–681, doi: 10.1172/JCI5826 (2000). [DOI] [PMC free article] [PubMed] [Google Scholar]
- 6.Sperisen P, Schmid CD, Bucher P & Zilian O Stealth proteins: in silico identification of a novel protein family rendering bacterial pathogens invisible to host immune defense. PLoS Comput Biol 1, e63, doi: 10.1371/journal.pcbi.0010063 (2005). [DOI] [PMC free article] [PubMed] [Google Scholar]
- 7.Qian Y et al. Functions of the alpha, beta, and gamma subunits of UDP-GlcNAc:lysosomal enzyme N-acetylglucosamine-1-phosphotransferase. J Biol Chem 285, 3360–3370, doi: 10.1074/jbc.M109.068650 (2010). [DOI] [PMC free article] [PubMed] [Google Scholar]
- 8.Marschner K, Kollmann K, Schweizer M, Braulke T & Pohl S A key enzyme in the biogenesis of lysosomes is a protease that regulates cholesterol metabolism. Science 333, 87–90, doi: 10.1126/science.1205677 (2011). [DOI] [PubMed] [Google Scholar]
- 9.Braulke T, Pohl S & Storch S Molecular analysis of the GlcNac-1-phosphotransferase. J Inherit Metab Dis 31, 253–257, doi: 10.1007/s10545-008-0862-5 (2008). [DOI] [PubMed] [Google Scholar]
- 10.Qian Y et al. Analysis of mucolipidosis II/III GNPTAB missense mutations identifies domains of UDP-GlcNAc:lysosomal enzyme GlcNAc-1-phosphotransferase involved in catalytic function and lysosomal enzyme recognition. J Biol Chem 290, 3045–3056, doi: 10.1074/jbc.M114.612507 (2015). [DOI] [PMC free article] [PubMed] [Google Scholar]
- 11.Liu L, Lee WS, Doray B & Kornfeld S Role of spacer-1 in the maturation and function of GlcNAc-1-phosphotransferase. FEBS Lett 591, 47–55, doi: 10.1002/1873-3468.12525 (2017). [DOI] [PMC free article] [PubMed] [Google Scholar]
- 12.Qian Y, Flanagan-Steet H, van Meel E, Steet R & Kornfeld SA The DMAP interaction domain of UDP-GlcNAc:lysosomal enzyme N-acetylglucosamine-1-phosphotransferase is a substrate recognition module. Proc Natl Acad Sci U S A 110, 10246–10251, doi: 10.1073/pnas.1308453110 (2013). [DOI] [PMC free article] [PubMed] [Google Scholar]
- 13.van Meel E et al. Multiple Domains of GlcNAc-1-phosphotransferase Mediate Recognition of Lysosomal Enzymes. J Biol Chem 291, 8295–8307, doi: 10.1074/jbc.M116.714568 (2016). [DOI] [PMC free article] [PubMed] [Google Scholar]
- 14.De Pace R et al. Subunit interactions of the disease-related hexameric GlcNAc-1-phosphotransferase complex. Hum Mol Genet 24, 6826–6835, doi: 10.1093/hmg/ddv387 (2015). [DOI] [PubMed] [Google Scholar]
- 15.Velho RV, De Pace R, Tidow H, Braulke T & Pohl S Identification of the interaction domains between alpha- and gamma-subunits of GlcNAc-1-phosphotransferase. FEBS Lett 590, 4287–4295, doi: 10.1002/1873-3468.12456 (2016). [DOI] [PubMed] [Google Scholar]
- 16.Liu L, Lee WS, Doray B & Kornfeld S Engineering of GlcNAc-1-Phosphotransferase for Production of Highly Phosphorylated Lysosomal Enzymes for Enzyme Replacement Therapy. Mol Ther Methods Clin Dev 5, 59–65, doi: 10.1016/j.omtm.2017.03.006 (2017). [DOI] [PMC free article] [PubMed] [Google Scholar]
- 17.Boustany RM Lysosomal storage diseases--the horizon expands. Nat Rev Neurol 9, 583–598, doi: 10.1038/nrneurol.2013.163 (2013). [DOI] [PubMed] [Google Scholar]
- 18.Velho RV et al. The lysosomal storage disorders mucolipidosis type II, type III alpha/beta, and type III gamma: Update on GNPTAB and GNPTG mutations. Hum Mutat 40, 842–864, doi: 10.1002/humu.23748 (2019). [DOI] [PubMed] [Google Scholar]
- 19.Appelqvist H, Waster P, Kagedal K & Ollinger K The lysosome: from waste bag to potential therapeutic target. J Mol Cell Biol 5, 214–226, doi: 10.1093/jmcb/mjt022 (2013). [DOI] [PubMed] [Google Scholar]
- 20.Marques ARA & Saftig P Lysosomal storage disorders - challenges, concepts and avenues for therapy: beyond rare diseases. J Cell Sci 132, doi: 10.1242/jcs.221739 (2019). [DOI] [PubMed] [Google Scholar]
- 21.Kudo M & Canfield WM Structural requirements for efficient processing and activation of recombinant human UDP-N-acetylglucosamine:lysosomal-enzyme-N-acetylglucosamine-1-phosphotransferase. J Biol Chem 281, 11761–11768, doi: 10.1074/jbc.M513717200 (2006). [DOI] [PubMed] [Google Scholar]
- 22.Tiede S et al. Mucolipidosis II is caused by mutations in GNPTA encoding the alpha/beta GlcNAc-1-phosphotransferase. Nat Med 11, 1109–1112, doi: 10.1038/nm1305 (2005). [DOI] [PubMed] [Google Scholar]
- 23.Wang Y et al. Identification of predominant GNPTAB gene mutations in Eastern Chinese patients with mucolipidosis II/III and a prenatal diagnosis of mucolipidosis II. Acta Pharmacol Sin 40, 279–287, doi: 10.1038/s41401-018-0023-9 (2019). [DOI] [PMC free article] [PubMed] [Google Scholar]
- 24.Pedersen LC et al. Crystal structure of an alpha 1,4-N-acetylhexosaminyltransferase (EXTL2), a member of the exostosin gene family involved in heparan sulfate biosynthesis. J Biol Chem 278, 14420–14428, doi: 10.1074/jbc.M210532200 (2003). [DOI] [PubMed] [Google Scholar]
- 25.Kitagawa H, Shimakawa H & Sugahara K The tumor suppressor EXT-like gene EXTL2 encodes an alpha1, 4-N-acetylhexosaminyltransferase that transfers N-acetylgalactosamine and N-acetylglucosamine to the common glycosaminoglycan-protein linkage region. The key enzyme for the chain initiation of heparan sulfate. J Biol Chem 274, 13933–13937, doi: 10.1074/jbc.274.20.13933 (1999). [DOI] [PubMed] [Google Scholar]
- 26.Tiede S et al. Missense mutations in N-acetylglucosamine-1-phosphotransferase alpha/beta subunit gene in a patient with mucolipidosis III and a mild clinical phenotype. Am J Med Genet A 137A, 235–240, doi: 10.1002/ajmg.a.30868 (2005). [DOI] [PubMed] [Google Scholar]
- 27.Punjani A & Fleet DJ 3D variability analysis: Resolving continuous flexibility and discrete heterogeneity from single particle cryo-EM. J Struct Biol 213, 107702, doi: 10.1016/j.jsb.2021.107702 (2021). [DOI] [PubMed] [Google Scholar]
- 28.Zheng SQ et al. MotionCor2: anisotropic correction of beam-induced motion for improved cryo-electron microscopy. Nat Methods 14, 331–332, doi: 10.1038/nmeth.4193 (2017). [DOI] [PMC free article] [PubMed] [Google Scholar]
- 29.Rohou A & Grigorieff N CTFFIND4: Fast and accurate defocus estimation from electron micrographs. J Struct Biol 192, 216–221, doi: 10.1016/j.jsb.2015.08.008 (2015). [DOI] [PMC free article] [PubMed] [Google Scholar]
- 30.Zivanov J et al. New tools for automated high-resolution cryo-EM structure determination in RELION-3. Elife 7, doi: 10.7554/eLife.42166 (2018). [DOI] [PMC free article] [PubMed] [Google Scholar]
- 31.Punjani A, Rubinstein JL, Fleet DJ & Brubaker MA cryoSPARC: algorithms for rapid unsupervised cryo-EM structure determination. Nat Methods 14, 290–296, doi: 10.1038/nmeth.4169 (2017). [DOI] [PubMed] [Google Scholar]
- 32.Emsley P, Lohkamp B, Scott WG & Cowtan K Features and development of Coot. Acta Crystallogr D Biol Crystallogr 66, 486–501, doi: 10.1107/S0907444910007493 (2010). [DOI] [PMC free article] [PubMed] [Google Scholar]
- 33.Buchan DWA & Jones DT The PSIPRED Protein Analysis Workbench: 20 years on. Nucleic Acids Res 47, W402–W407, doi: 10.1093/nar/gkz297 (2019). [DOI] [PMC free article] [PubMed] [Google Scholar]
- 34.Liebschner D et al. Macromolecular structure determination using X-rays, neutrons and electrons: recent developments in Phenix. Acta Crystallogr D Struct Biol 75, 861–877, doi: 10.1107/S2059798319011471 (2019). [DOI] [PMC free article] [PubMed] [Google Scholar]
- 35.Williams CJ et al. MolProbity: More and better reference data for improved all-atom structure validation. Protein Sci 27, 293–315, doi: 10.1002/pro.3330 (2018). [DOI] [PMC free article] [PubMed] [Google Scholar]
- 36.Robert X & Gouet P Deciphering key features in protein structures with the new ENDscript server. Nucleic Acids Res 42, W320–324, doi: 10.1093/nar/gku316 (2014). [DOI] [PMC free article] [PubMed] [Google Scholar]
- 37.Goddard TD et al. UCSF ChimeraX: Meeting Modern Challenges in Visualization and Analysis. Protein Sci, doi: 10.1002/pro.3235 (2017). [DOI] [PMC free article] [PubMed] [Google Scholar]
Associated Data
This section collects any data citations, data availability statements, or supplementary materials included in this article.
Supplementary Materials
Source Data Fig. 2 Unprocessed Western Blots for panel 2c and statistic source data for panels 2d and 2g.
Source Data Fig. 3 Unprocessed Western Blots and statistic source data for panels 3e.
Source Data Extended Data Fig. 7 Unprocessed Western Blots for panels 7b and statistic source data for panel 7c.
Source Data Extended Data Fig. 5 Unprocessed Western Blots for panels 5b and 5e, and statistic source data for panels 5c and 5f.
Source Data Extended Data Fig. 6 Unprocessed Western Blots for panels 6a and 6c and statistic source data for panel 6d.
Supplementary Video 2 Dynamics in the PTase α2β2 complex. A low-resolution 3DVA analysis of the full structure, revealing the large-scale movement in the S1 and N1-S3 regions as the structure transitions from the autoinhibited state to the active state.
Supplementary Video 1 Dynamic in the PTase core region near the catalytic pocket. The video first shows a rotation of the 3D map of the core region in the autoinhibited state superimposed with the atomic model, then zooms into the catalytic site. Next, the scene changes to the 3DVA analysis result, which is composed of 20 3D frames (maps) revealing the EM density changes as the structure transitions from the autoinhibited state to the active state.
Data Availability Statement
The 3D cryo-EM maps of human PTase catalytic core in the active state (3.1 Å) and autoinhibited state (3.3 Å) have been deposited in the Electron Microscopy Data Bank under accession code EMD-24784 and EMD-24785, respectively. The atomic model based on the two 3D maps has been deposited in the Protein Data Bank under accession code PDB ID 7S05 and 7S06, respectively. Source data are provided with this paper.


