Abstract
Natural oxygen defects play a vital role in the integrity, functional properties, and performance of well-known two-dimensional (2D) materials. The recently discovered chromium triiodide (CrI3) monolayer is the first real 2D magnet. However, its interaction with oxygen remains an open fundamental question, an understanding of which is essential for further exploration of its application potentials. Employing the quantum first-principles calculation method, we investigated the influence of oxygen defects on the structural, electronic, and magnetic properties of the CrI3 monolayer at the atomic level. We considered two oxygen-defective CrI3 monolayers with either a single O-attached or single O-doped structure, comparing them with an un-defective pristine monolayer. The two different oxygen defects significantly affect the original architecture of the CrI3 monolayer, being energetically favorable and increasing the stability of the CrI3 monolayer. Moreover, these point defects introduce either deep band lines or middle gap states in the band structure. As a result, the bandgap of oxygen-defective monolayers is reduced by up to 58%, compared with the pristine sheet. Moreover, the magnetic property of the CrI3 monolayer is drastically induced by oxygen defects. Importantly, O-defective CrI3 monolayers possess robust exchange coupling parameters, suggesting relatively higher Curie temperature compared with the un-defective sheet. Our findings reveal that the natural oxygen defects in the CrI3 monolayer enrich its structural, electronic, and magnetic properties. Thus, the controlled oxidation can be an effective way to tune properties and functionalities of the CrI3 monolayer and other ultrathin magnetic materials.
This work shows that the natural oxygen defects in the CrI3 monolayer, a first 2D magnet, enrich its structural, electronic, and magnetic properties, offering an effective way of tuning the functionality of CrI3 monolayer and other ultrathin magnets.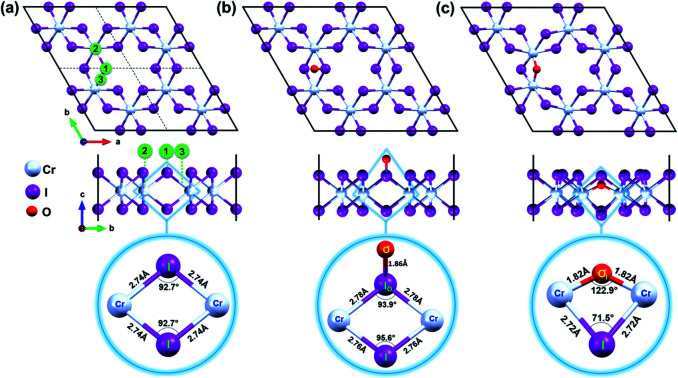
Introduction
Two-dimensional (2D) crystals made up of single atomic layers are revolutionary materials in natural sciences owing to their unique physical and chemical properties, which are drastically different from those of their bulk (3D) counterparts, offering widespread advanced applications in nanotechnology.1 Recently, the chromium triiodide (CrI3) monolayer has been experimentally discovered as the first real 2D magnet, bearing remarkable intrinsic ferromagnetic and semiconducting behaviour as well as ability to be easily exfoliated from its 3D phase by a low-cost scotch-tape method.2 Therefore, ultrathin CrI3 has attracted great research attention as an ideal material to investigate magnetism, spintronic, magneto-electric, and magneto-optic effects in the 2D limit as well as suggesting innovative applications in spintronic and magneto-optoelectronics.3–5 The magnetic property of this atomically thin 2D material has efficiently tailored through external stimuli other than magnetic fields, such as external electric fields, defects, strain, and heterostructures and so forth.6–10
Oxidation is the most common natural defect on existing 2D materials during fabrication11 or application period and has a significant influence on their properties and functionalities. Controlled oxidation is used as a means for tailoring the functional properties of existing 2D materials. For example, the manipulation of oxidation leads to significant bandgap reduction in MoS2 and an indirect-to-direct bandgap transition in arsenene.12,13 Likewise, the metallic character of graphene and silicene is converted to semiconducting behaviour by tuning the oxygen dose and the oxygen adsorption sites.14,15 Furthermore, atomic oxygen defects assist substantially in enhancing the photocatalytic activity of some 2D layered materials as well.16 Namely, oxygen defective SnS2 monolayer becomes an efficient 2D photocatalyst for CO2 reduction and water splitting, compared with pristine SnS2.16,17 Therefore, the fundamental understanding of oxygen defects on any 2D materials is essential for gaining insights into their functional properties and practical usages.
For the recently discovered CrI3 monolayer, even though the impressive progress has been made in the last few years, it is still necessary to investigate its fundamental properties in terms of the defects. For instance, like other TMDs, the oxygen trace is still detectable on the surface of the CrI3, after even the purification process.11 However, a fundamental question as to how oxygen defect affects the functional properties of CrI3 monolayer remains elusive to date. In the present study, utilizing spin-polarized first-principles calculations based on density functional theory (DFT), we investigate the effect of oxygen defects on the geometrical, electronic, and magnetic properties of CrI3 at the atomic level. Here we emphasize that the targeted scientific goal of this study is to elucidate how a minimum oxygen defect can lead to a considerable influence on the intrinsic properties of CrI3 monolayer, which is of prime importance not only for scientific researches but also for further applications.
Computational details
The first-principles DFT simulations are performed through the Vienna ab initio simulation package (VASP 5.4.4) within the plane-wave basis set, and projector augmented wave (PAW) methods.18,19 The spin-polarized PBE + U method, including the spin-orbital coupling (SOC) and the Grimme's D3 dispersive correction, is applied as hybrid exchange–correlation functional. Hubbard on-site Coulomb U parameter is tested with various values and then adopted to be 3 eV to accurately account the Cr (3d) states. The 2 × 2 × 1 supercell bearing an I–Cr–I sandwiched structure is used as a pristine CrI3 sheet. A vacuum region higher than 15 Å is added to the perpendicular direction to the ab-plane to simulate an isolated layer without spurious interaction of adjacent layers in periodic cells. All the investigated structures are optimized until the convergence thresholds of maximum forces and energy lower than 10−3 eV Å−1 and 10−6 eV, respectively. The first Brillouin zone is sampled with the gamma-centred 16 × 16 × 1 k-point meshes together with the energy cut-off of 400 eV throughout the entire calculations. We simulate the average binding energy per oxygen atom on the defective CrI3 monolayers using the following equation:
| Eb = EO/CrI3 − ECrI3 − EO | 1 |
where EO/CrI3, ECrI3 and EO represent the total energies of defective and un-defective CrI3 monolayers as well as an isolated oxygen atom, respectively. The formation energy of defective structure is calculated using the following equations, respectively:
| Ef1 = EO/CrI3 − ECrI3 − μO | 2 |
| Ef2 = EO/CrI3 − ECrI3 − μO + μI | 3 |
μI and μO are the chemical potentials of the iodine and oxygen molecule that are determined in term of the total energy of the corresponding molecules, μI = EI2/2 and μO = EO2/2, respectively (see details from Scheme S1 and S2 in ESI†). The phonon calculations were performed by the PHONOPY code20 where the force constants were estimated through the DFT perturbation theory (DFPT) method as implemented in VASP. Ab initio molecular dynamics (AIMD) simulation were carried out by canonical NVT-ensemble with Nosé–Hoover thermostat and time-step of 1 fs at 300 K.
Results and discussion
Structural properties and stability
The experimentally determined unit cell2 of CrI3 is first optimized to obtain a reliable computational condition. The optimized unit cell has hexagonal lattice with parameters of a = b = 6.93 Å, well agreeing with the previously reported findings.3,4 The unit cell contains two chromium (Cr) ions, each binds to six iodine (I) atoms.
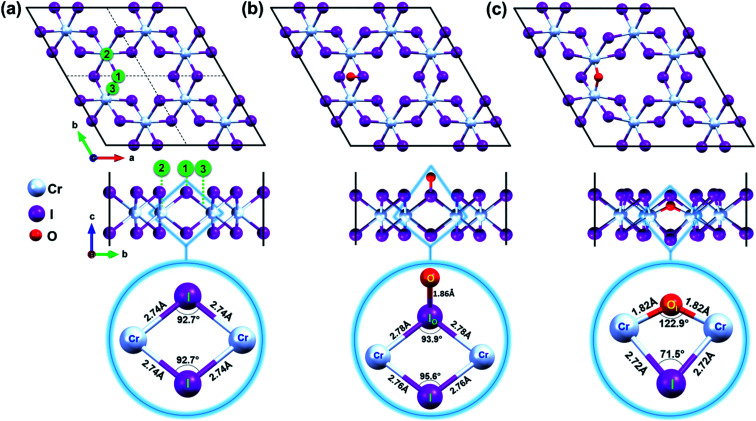
Furthermore, a supercell of 2 × 2 unit cell that has a lattice constant of a = b = 13.86 Å and contains 32 atoms (8 Cr and 24 I) is constructed to be a pristine CrI3 sheet, as shown in Fig. 1a.
Fig. 1. Top and side views of (a) pristine CrI3 monolayer. The black box displays the periodic supercell while dashed lines represent the boundaries of a unit cell. Oxygen was initially located 3 Å above at binding sites numbered as 1, 2, and 3 in green circles. Top and side view of (b) oxygen attached and (c) oxygen doped CrI3 monolayer. The selected units of CrI3 monolayer without and with oxygen defect are zoomed-in at the bottom panel of (a–c). The red, cyan, and purple balls belong to the O, Cr, and I-atoms, respectively.
Mindful the purpose to explore how a single oxygen atom interacts with the CrI3 monolayer, we examine the three initial locations of oxygen possibly binding to the basal plane of CrI3 monolayer, as illustrated in Fig. 1a: (1) on top of I-atom, (2) top on Cr-atom, and (3) top on the bridge site between the Cr and I atom. Initially, an oxygen atom is placed 3 Å above from the considered sites of CrI3 monolayer before structural optimization. Surprisingly, after precise optimization, the O-atom placed above either (1), (2), or (3) sites is bound preferentially with an I-atom of surface, appearing as a dangling-bond (Fig. 1b). In order to clarify in detail how oxygen brings distortion to the original structure, we carefully focus on the un-defective and defective local units. The bottom panel of Fig. 1a shows the reference unit selected from pristine CrI3 monolayer, where Cr–I bond length is 2.74 Å, and the Cr–I–Cr bond angle is 92.7°. Interestingly, after attaching O-atom to the I-top site, the O–I bond is resulted in 1.86 Å (at the bottom panel of Fig. 1b) and tilted by 50.82° from the CrI3 surface. The binding energy (eqn (1)) of oxygen atom to the surface is −9.4 eV, indicating strong I–O bonding. Moreover, the I-atom bound with the O-atom (IO) is dragged slightly above the surface. Consequently, the Cr–IO bond is 2.78 Å, while the Cr–IO–Cr bond angle is 93.9°. This situation implies that these resultant values are slightly increased by 0.04 Å and decreased by 1.2°, respectively, compared with those in the pristine monolayer. Note that there is no noticeable change in the distances between the neighbouring Cr–Cr atoms located at different distances from one another, compared with those in the pristine monolayer. In short, the defective unit with O-dangling behaves as a local distortion of the monolayer and does not affect the rest of the architecture for the CrI3 monolayer. Afterward, this defective sheet where oxygen bound with an I-atom is referred to as the O-attached CrI3 monolayer. In addition, we consider one different optional configuration of CrI3 monolayer with O-defect (O-dopant). In this regard, one of the I-atoms at the surface of the CrI3 monolayer is replaced by O-atom. After optimization, O-atom is settled between two Cr-atoms forming as an O-ligand within the monolayer. The binding energy (eqn (1)) of the dopant is −9.6 eV, implying that the oxygen atom binds strongly to the monolayer. This configuration is hereafter referred to as the O-doped CrI3 monolayer and is depicted in Fig. 1c. This oxygen-doping defect (OI) substituting into iodine alters significantly both the bond length and angles of the selected unit within the monolayer (at the bottom in Fig. 1c). In particular, the Cr–OI bond length is 1.82 Å that is shortened drastically by 0.93 Å compare with the original Cr–I bond in pristine CrI3. Furthermore, the Cr–OI–Cr bond angle is 122.9° that is impressively increased by 30.4° in contrast to that of the pristine monolayer (∠Cr–I–Cr = 92.7°). All the above results obtained from the reference and defective units are summarized in Table 1. Moreover, one can see that the defective unit with O-bridge can deform not only the distances between neighbouring Cr-atom but also affect the architecture of CrI3 (see in Table S1†). Thus, the structural changes associated with the O-bridge can lead to substantial modifications to the magnetic and electronic properties of this material, which will be discussed in the following sections.
Bond length (LCr–X) and bond angle (∠Cr–X–Cr) between magnetic Cr-atoms and X-ligand, in which X stands for I- and O-atom, plus the distance (dCr–Cr) between the Cr–Cr atoms within the reference and defective units.
| Configuration | Pristine CrI3 | O-attached CrI3 | O-doped CrI3 |
|---|---|---|---|
| L Cr–X (Å) | 2.74 | 2.78 | 1.82 |
| ∠Cr–X–Cr (deg) | 92.7 | 93.9 | 122.9 |
| d Cr–Cr (Å) | 4.00 | 4.06 | 3.28 |
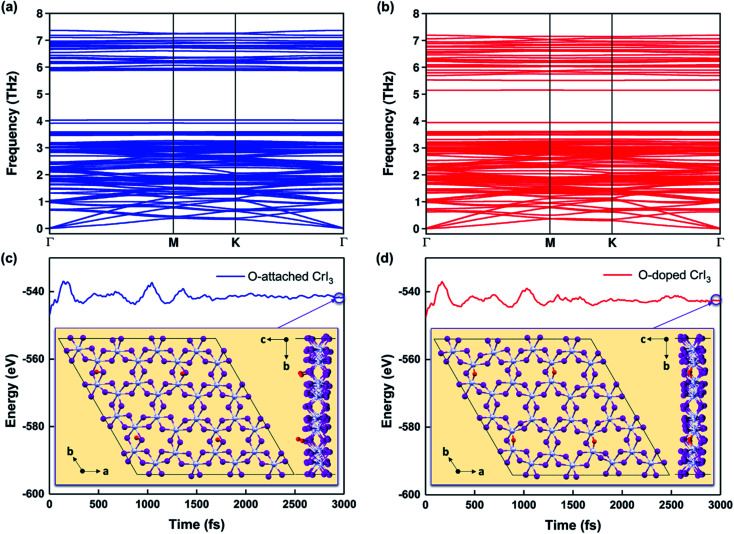
Notably, the formation energies are −6.4 eV for the O-attached structure (eqn (2)) and −7.9 eV for the O-doped structure (eqn (3)), respectively. The results of formation energy simulations reveal that both defective monolayers are stable, being energetically more favourable than pristine CrI3 monolayer. Moreover, Fig. 2a and b show the phonon dispersion for the defective monolayers. Remarkably, there is no imaginary phonon mode with negative frequency for O-attached and O-doped CrI3 monolayers, implying that both defective CrI3 monolayers are dynamically stable.
Fig. 2. (a and b) Calculated phonon dispersions and (c and d) energy fluctuations for O-attached (blue) and O-doped (red) CrI3 monolayers at 300 K during AIMD simulations (also see the enlarged graph for energy fluctuations of the present monolayers in Fig. S1a–c†). The insets are snapshots for the top and side view of defective monolayers at the end of AIMD simulations, which operated during 3000 fs with a time-step of 1 fs.
Furthermore, Fig. 2c and d presents the results of AIMD simulations at 300 K during 3000 fs. One can see that the energy profiles have small fluctuations, suggesting that atoms in O-defective sheets oscillate around their equilibrium during the AIMD simulations. In addition, the structural snapshots at the end of time-dependent evolutions (inset of Fig. 2c and d) reveal that the prime architectures are preserved at 300 K and no phase transition has occurred, indicating both O-defective sheets are thermally stable (also see Fig. S1a–c†). Therefore, based on the results of formation energy, phonon dispersion, and AIMD simulations, we infer that these oxygen defects are natural and are highly possible to form on the surface of CrI3 monolayer during fabrication and processing stages.
Magnetic properties
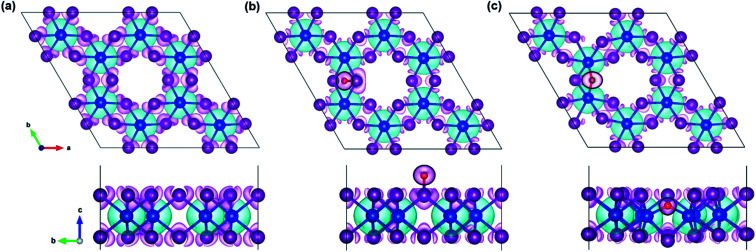
In the regard to investigate how a single oxygen atom induces the magnetic properties of CrI3 monolayer, we calculate spin density distribution, magnetic moment of Cr-atom, magnetic anisotropy energy (MAE), exchange coupling (Jex) and Curie temperature (TC) in the present monolayers. Fig. 3 illustrates the spin density distribution of (a) pristine, (b) O-attached, and (c) O-doped CrI3 monolayer, where the positive spin density is accumulated on the Cr-atom whereas the negative spin density is found around the I-atom. Moreover, the negative spin density is accumulated on the newly introduced O-atom (the black circle in Fig. 3b and c). It indicates that the Cr-atom with positive (up) spins remains the main source of magnetism in the present CrI3 monolayers. More precisely, the pristine CrI3 monolayer exhibits the calculated magnetic moment of 3.19 μB per Cr (mCr), being in good agreement with the previous experimental result of ∼3.0 μB per Cr.21 After introducing the O-atom, the magnetic moments of Cr-ions are decreased to 3.03 and 2.93 μB (listed in Table 2), still preserving a large spin polarization in the defective monolayers. In addition, the induced magnetic moment on I-atom (mI = −0.107 μB) in the pristine is significantly altered to −0.084 μB and −0.067 μB for defective monolayers. Moreover, in the case of the O-attached CrI3 monolayer, the O-atom gains a high magnetic moment of −0.129 μB. For the O-doped CrI3 monolayer, the induced magnetic moment on O-ligand enhances to −0.172 μB. This enhancement implies that the value of induced magnetic moment on O-atom (mO) reaches 5% of that on Cr-atom (mCr). The negative sign indicates that the induced magnetic moments on I- and O-atoms are antiparallel to the magnetic moment of Cr-atom. Notably, AIMD results also reveal that the magnetic moment of O-defective monolayers is preserved constantly at room temperature during the simulation (Fig. S1d and e†).
Fig. 3. The top view (top panel) and side view (bottom panel) of the spin density distribution in the (a) pristine, (b) O-attached, and (c) O-doped CrI3 monolayer, where the black circle highlights the O-defect. Aqua (magenta) isosurface represents the positive (negative) charges polarized in the up (down) spins with the density value of 0.003 e bohr−3.
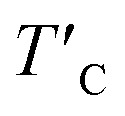
Average magnetic moment of Cr-ion (mCr), the induced magnetic moments on I-atom (mI) and O-atom (mO), the magnetic anisotropy energy (MAE) per Cr atom, the exchange coupling parameter (Jex), the estimated TC and rescaled 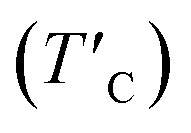 Curie temperature.
| Configuration | Pristine CrI3 | O-attached CrI3 | O-doped CrI3 |
|---|---|---|---|
| m Cr (μB) | 3.19 | 3.03 | 2.93 |
| m I (μB) | −0.107 | −0.084 | −0.067 |
| m O (μB) | — | −0.129 | −0.172 |
| MAE (meV per Cr) | 0.71 | 0.64 | 0.78 |
| J ex (meV) | 1.33 | 1.27 | 4.31 |
| T C (K) | 51.5 | 49.2 | 166.9 |
 (K) (K) |
— | 42.9 | 145.8 |
We further calculate the magnetic anisotropy energy (MAE) since it is one of the decisive parameters for a 2D magnetic material. The MAE is calculated by the energy difference between the perpendicular [001] and parallel [100] magnetization directions of the monolayer, expressed as E[100] − E[001]. The simulated MAE values of pristine, O-attached, and O-doped monolayers are 0.71, 0.64, and 0.78 meV per Cr (listed in Table 2), respectively. The positive MAEs reveal that the out-of-plane magnetic anisotropy is preferable in all the three monolayers, indicating the long-range ferromagnetic (FM) ordering at the magnetic ground state.
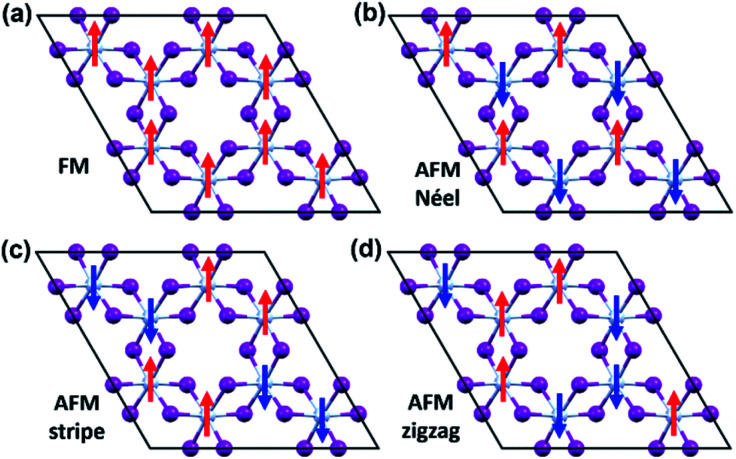
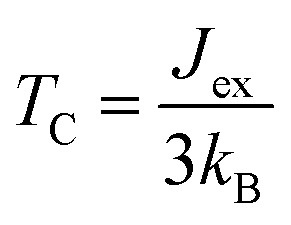
To evaluate the exchange coupling (Jex) and Curie temperature (TC) in the present monolayers, we determine the possible magnetic configurations in the monolayer since the exchange energy between the AFM and FM states is essential for TC. Fig. 4a and b illustrate four intralayer magnetic configurations, including ferromagnetic (FM), as well as three possible antiferromagnetic (AFM) arrangements that are named as AFM-Néel, AFM-stripe, and AFM-zigzag, respectively (details in Fig. S2†). We use equation of mean-field theory (MFT)22 to calculate TC:
 |
4 |
where Jex is determined as 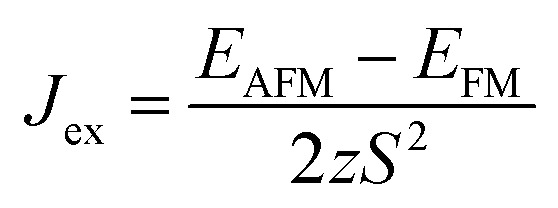 ; EAFM and EFM are the energies of AFM and FM states, and z is the number of the nearest neighbours surrounding the Cr site. The first NN containing 3 Cr atoms remains unchanged in the present monolayers and the spin of each Cr-atom prefers to be 3/2. The positive Jex confirms that the FM state is the magnetic ground state of the present monolayers. The calculated results of TC are also summarized in Table 2.
Fig. 4. The possible magnetic configurations of CrI3 monolayer. (a) FM, (b) AFM-Néel, (c) AFM-stripe, and (d) AFM-zigzag orders. The red (blue) arrows depict the spin-up (spin-down).
Our predicted value of TC in the pristine sheet is ∼51 K, being 1.2 times higher than the experimental Curie temperature of CrI3 monolayer (TexpC ∼ 45 K)2. Thus, eqn (4) tends to overestimate TC. For the defective monolayers, we find a trend that TC is suppressed to ∼49 K in the O-attached monolayers and then enhanced to ∼167 K in the O-doped CrI3 monolayer, compared with the pristine (∼51 K). In regard to determining the accurate TC for defective monolayers, TC obtained from eqn (4) is corrected by the following rescaling:23
 |
5 |
where TexpC(CrI3) is the experimental value of the pristine CrI3 monolayer,2TC(CrI3) and TC(O/CrI3) are Curie temperature estimated by eqn (4) for un-defective and defective CrI3 monolayers,  is the rescaled Curie temperature for defective monolayer (Table 2). As a consequence, our predicted value of
 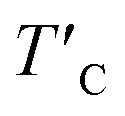 in the O-doped sheet is ∼145.8 K, being ∼3 times higher than TexpC of pristine CrI3 monolayer (∼45 K). In short, the O doping positively affects the magnetic properties of CrI3 monolayer, including the preserved FM ordering, enhanced MAE, and elevated TC of the present monolayer.
Electronic structure
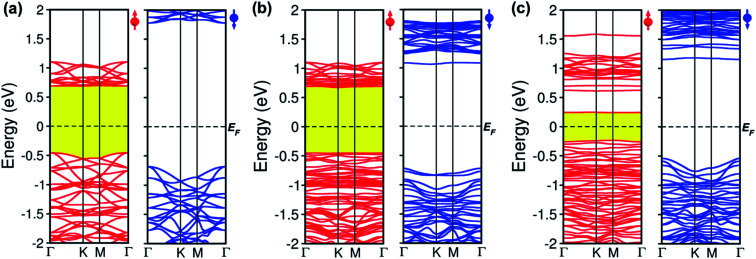
To comprehend how oxygen affects the electronic property of this material, the fundamental electronic structures such as bandgap energy, band structure, the density of states (DOS), and band-edges features of defective CrI3 monolayers are explored comparing with those of the pure sheet. The spin-polarized band structures of all investigated monolayers are displayed in Fig. 5 which clearly shows that the edges of both valence and conduction bands of all the monolayers consist only of spin-up channels (majority spins), while spin-down (minority spins) cases are not involved in the band-edges at all near to the Fermi level. Hence, we should note that both conduction band minimum (CBM) and valence band maximum (VBM) hereafter refer to spin-up channels. Fig. 5a shows the calculated spin-dependent band structure of the pristine CrI3 monolayer. As can be seen, both the CBM and VBM occurs at the Γ-point of Brillouin zone, showing a semiconducting behaviour with the direct bandgap of 1.14 eV that is consistent with the previously reported results.24–26Fig. 5b presents the spin-dependent electronic band structure of the O-attached CrI3 monolayer. The O-defect perturbs both lower conduction and higher valence bands, introducing deep band states. Consequently, the VBM remains at the Γ-point while the CBM shifts up at the K-point, causing a direct-to-indirect bandgap transition. The resultant bandgap is 1.12 eV, which value is slightly narrower than that of the pristine sheet. Thus, results indicate that the O-attached CrI3 monolayer has an FM semiconducting character with an indirect bandgap in the spin-up channel. It is worth note that the direct-to-indirect bandgap transition is rare and remarkable electronic changes in 2D materials, benefiting for optoelectronic applications.
Fig. 5. Spin-polarized band structures of (a) pristine, (b) oxygen attached, and (c) oxygen doped CrI3 monolayer with the majority (left) and minority (right) spins. Red (blue) lines represent the spin-up (down) bands. The dashed line illustrates the Fermi level, EF.
Intriguingly, the oxygen doping (OI) defect brings to more substantial influence on band structure than the O-attached defect. Fig. 5c displays the spin-dependent electronic band structure of the O-doped CrI3 monolayer. One can see that OI defect generates groups of new band lines visibly at both lower conduction and higher valence bands while it also creates the midgap defect states. Consequently, both the VBM and CBM shift to the M-point, showing a direct bandgap with a significantly narrowed value of 0.47 eV. These results indicate that the O-doped CrI3 monolayer bears a remarkable FM semiconducting character with a narrow and direct bandgap, both of which features are favourable for further applications. Besides, according to the crystal-field theory, the significantly narrowed bandgap is an initial clue result for the enhancement of Jex (see Fig. S3†).7
In short, our results from the band structure calculations reveal that the single-oxygen defects lead remarkable influence on the electronic structure of CrI3 monolayer, introducing deep or midgap states. As a result, depending on the presence of defects, the defective CrI3 monolayers have either direct or indirect bandgap with reduced values up to 58% compared with the pristine sheet. In addition, compared to the pristine sheet that has an insulating character in the minority (↓) spin channel, the bandgap in the spin-down channel of both defective CrI3 is notably reduced from ∼2.5 eV to 1.7 eV, presenting a semiconducting character with a moderate bandgap (Table 3 and Fig. S4†).
Energy bandgap at the majority (Eg↑), minority (Eg↓) channel of pristine and defective CrI3 monolayers.
| Configuration | Pristine CrI3 | O-attached CrI3 | O-doped CrI3 |
|---|---|---|---|
| Eg↑(eV) | 1.14 | 1.12 | 0.47 |
| Eg↓(eV) | 2.48 | 1.77 | 1.68 |
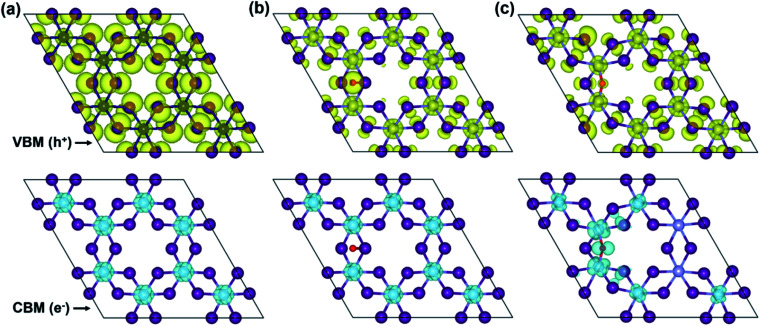
To more in-depth insight into the electronic structure, band-edges features are elucidated through the band-decomposed partial charge density. Fig. 6 illustrates band-decomposed partial charge densities, where the isosurfaces indicate a distribution of electrons (e−) at the CBM and holes (h+) at the VBM around the Fermi level. In the pristine monolayer (Fig. 6a), electrons at the CBM are localized around Cr-ions, which will be consistent with the DOS result. Meanwhile, holes at the VBM are predominantly contributed by the I- and Cr-ions and uniformly distributed through the entire layer. In the O-attached CrI3 monolayer (Fig. 6b), the charges are distributed as similar trends as in pristine one that the electrons at the CBM remain located around Cr-ions, except that the distribution around O-atom leads to minor alteration at the VBM. In particular, the O-atom acts as an independent ion at the hole while the contribution of I-ions becomes less, and that of Cr-ions becomes significant, meaning it causes the deep states at the band structure. Unlike the O-attached defect, the O-doping brings the asymmetric charge distribution on the band-edges in the O-doped monolayer (Fig. 6c) that is drastically different from both the pristine and O-attached CrI3 monolayers. More precisely, the noticeable contribution of electrons at the CBM is found on O-ion, which further donates to the charge around its nearest Cr-ions, also indirectly affects the next neighbouring Cr-ions (also see the zoomed-in view in Fig. S5†).
Fig. 6. Isosurfaces of the band-decomposed partial charge density of the CBM (top panel) and VBM (bottom panel) of (a) pristine, (b) O-attached, and (c) O-doped CrI3 monolayer, respectively. Herein, the cyan (yellow) isosurface represents the distribution of electrons (holes) charge density at the CBM (VBM).
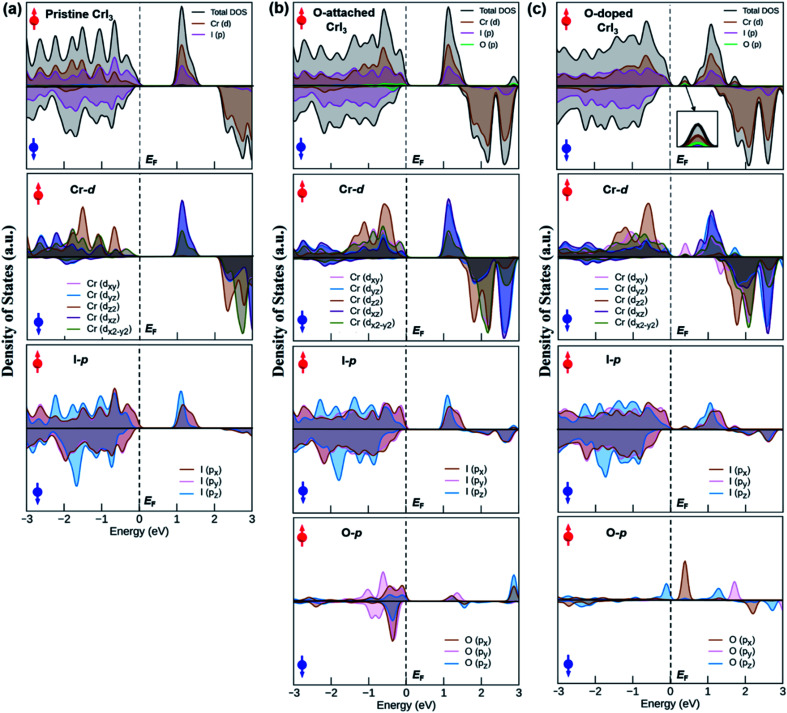
An origin of the remarkable changes in band structures can decipher by an analysis of the density of states (DOS) in Fig. 7, where the spin-resolved total DOS and average orbital-projected DOS of un-defective and defective CrI3 monolayers are given in the energy ranges of −3 to 3 eV and included the majority (↑) and minority (↓) spin channels. Fig. 7a presents the calculated DOS of pristine CrI3 monolayer. For the total DOS of pristine, the VBM in the majority (↑) channel is contributed by the I-p states with a mixture of Cr-d states, whereas the CBM is vice versa, i.e., this band mostly consists of Cr-d with some donations from I-p states. For the minority (↓) channel, the VBM is predominantly composed of I-p states whereas the CBM is dominated by Cr-d states. Note that our calculated DOS results for pristine CrI3 are consistent well with the previously reported results.26,27 Moreover, Fig. 7b shows the total and projected DOS of O-attached CrI3 monolayer. The total DOS clearly shows that the O-p states, together with strong hybridization of I-p and Cr-d states, substantially contribute to VBM in the (↓) channel, whereas the CBM predominates Cr-d and I-p states, with minor donations of O-p in the (↑) channel. It is clear from the projected DOS of O-atom, where the O-p states at the CBM are found at considerably high (∼3 eV) from the Fermi level. It reflects that the p-states of single O-atom can hybridize with p-states of IO atom, but hardly affects the Cr-d states. So, the electronic structure of the entire monolayer is less influenced by the O-atom near EF. In other words, it confirms that the O-defect induces numerous new deep states around the higher valence and lower conduction bands, but no oxygen-associated states are formed in the middle of the gap around the Fermi level in the band structure. Fig. 7c shows the total and projected DOS of the O-doped CrI3 monolayer. The total DOS of O-doped CrI3 monolayer reveals that the O-doping induces both conduction and valence states significantly. More specifically, the VBM is determined by Cr-d and I-p states, with minor contributions of O-p states. Meanwhile, the lower conduction bands are mixed states of I-p, Cr-d, and O-p, in which the prominent peak at the bottom of the conduction band is triggered by oxygen, resulting in the narrow bandgap for O-doped CrI3 monolayer. Therefore, the projected DOS is instructive to predict the origin of new states near the Fermi level, where the prominent peak near EF is found in the projected DOS of Cr-, I-, and O-atom. It indicates that the p-states of OI atom hybridize with its neighbouring Cr-d states and indirectly impact to the next neighbouring Cr-d states through I-p states. In particular, the O-p states significantly disturb the Cr-d states. As a result, the formal d-states of Cr atom no longer remain preserved, resulting in the new states into the band structure of monolayer. It leads to strong Jex and the possible enhancement for TC.
Fig. 7. The total and orbital-projected density of states of (a) pristine, (b) O-attached, and (c) O-doped CrI3 monolayer. Red (blue) arrow represents the spin-up (down) channel. The dashed line illustrates the Fermi level, EF.
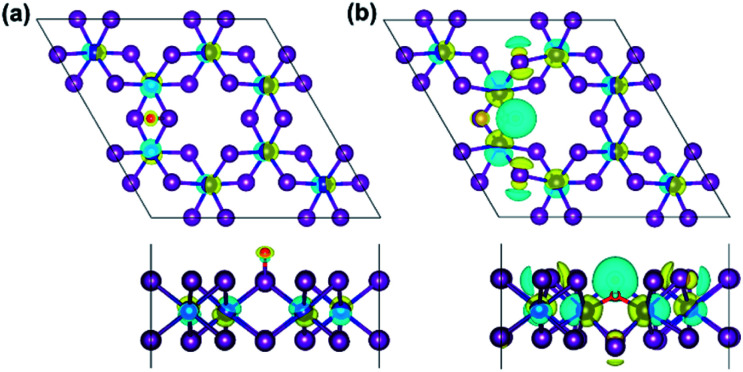
Moreover, the spin-resolved charge density distribution of defective monolayer is considered as an additional description (Fig. S6 and S7†). Furthermore, charge density difference (Δρ) is also illustrated in Fig. 8 to more clarify the change of the charge density in terms of O-defects, where Δρ is obtained as the follows:
| Δρ = ρO/CrI3 − ρCrI3 − ρO | 6 |
where ρO/CrI3, ρCrI3 and ρO represent the charge density distribution of defective and un-defective CrI3 monolayer as well as an isolated oxygen atom, respectively. For the O-attached monolayer (Fig. 8a), Δρ is found on the Cr-atoms evenly, but less around the single O-atom, and neutral on the I-atoms. It indicates that the charge density is localized on the Cr-atoms and the O-atom. Interestingly, Δρ is different in the O-doped monolayer (Fig. 8b), where the charge densities are not distributed only to the nearest Cr-atoms along oxygen-mediated (Cr−OI−Cr) bonds but also migrated to the next neighbouring Cr-atoms via I-atoms. In addition, we explored the electron localization function (ELF) profile of the CrI3 monolayers to support the above-mentioned change of the charge density distribution (Fig. S8†). Concisely, our results approve that the single O-defect definitely inspires the electronic behaviour of CrI3 monolayer.
Fig. 8. The top view (top panel) and side view (bottom panel) of the spin-resolved charge density difference in the (a) O-attached, and (b) O-doped CrI3 monolayer. Herein, the yellow (cyan) distribution reflects the charge accumulation (depletion) in the density of 0.05 e bohr−3.
Conclusions
The impact of oxygen on structural, electronic, and magnetic properties of a novel 2D magnetic CrI3 monolayer has been studied in terms of spin-polarized first-principles DFT calculations. Two different oxygen defects are investigated, and both affect the original structure of CrI3 monolayer, being energetically favourable and increasing the stability of CrI3 monolayer. Moreover, O-defects considerably induce the magnetic property of CrI3 monolayer. Importantly, compared with the pristine sheet, O-doped CrI3 monolayers possess robust exchange coupling parameter, suggesting to relatively higher Curie temperature. Moreover, O-defects also do not break the FM semiconducting nature of CrI3, rather bringing an attractive semiconducting character with the narrow bandgaps in both spin-up and spin-down channels. Overall, our findings indicate that the oxygen defects in CrI3 monolayer expressively inspire its structural, magnetic, and electronic properties. Thus, the controlled oxidation can be an effective way to tune properties and functionalities of CrI3 monolayer and other ultrathin magnetic materials.
Conflicts of interest
There are no conflicts to declare.
Supplementary Material
Acknowledgments
This work was financially supported by the Center of Atomic Initiative for New Materials (AI-MAT), National Taiwan University, from the Featured Areas Research Center Program within the framework of the Higher Education Sprout Project by the Ministry of Education in Taiwan (109L9008-03). M. H. thanks Ministry of Science and Technology (MOST) in Taiwan (109-2113-M-002-001) for the financial support. B. S. thanks National Taiwan University for the financial support under the Higher Education Sprout Project by the Ministry of Education in Taiwan (109L4000). We are grateful to the Computer and Information Networking Center, National Taiwan University, for the support of high-performance computing facilities.
Electronic supplementary information (ESI) available. See DOI: 10.1039/d0ra08153a
Notes and references
- Novoselov K. S. Geim A. K. Morozov S. V. Jiang D. Zhang Y. Dubonos S. V. Grigorieva I. V. Firsov A. A. Science. 2004;306:666–669. doi: 10.1126/science.1102896. [DOI] [PubMed] [Google Scholar]
- Huang B. Clark G. Navarro-Moratalla E. Klein D. R. Cheng R. Seyler K. L. Zhong D. Schmidgall E. McGuire M. A. Cobden D. H. Yao W. Xiao D. JarilloHerrero P. Xu X. Nature. 2017;546:270–273. doi: 10.1038/nature22391. [DOI] [PubMed] [Google Scholar]
- Gong C. Zhang X. Science. 2019;363:706. doi: 10.1126/science.aav4450. [DOI] [PubMed] [Google Scholar]
- Gibertini M. Koperski M. Morpurgo A. F. Novoselov K. S. Nat. Nanotechnol. 2019;14:408–419. doi: 10.1038/s41565-019-0438-6. [DOI] [PubMed] [Google Scholar]
- Gong C. Li L. Li Z. Ji H. Stern A. Xia Y. Cao T. Bao W. Wang C. Wang Y. Qiu Z. Q. Cava R. J. Louie S. G. Xia J. Zhang X. Nature. 2017;546:265–269. doi: 10.1038/nature22060. [DOI] [PubMed] [Google Scholar]
- Xu R. Zou X. J. Phys. Chem. Lett. 2020;11:3152–3158. doi: 10.1021/acs.jpclett.0c00567. [DOI] [PubMed] [Google Scholar]
- Huang C. Feng J. Wu F. Ahmed D. Huang B. Xiang H. Deng K. Kan E. J. Am. Chem. Soc. 2018;140:11519–11525. doi: 10.1021/jacs.8b07879. [DOI] [PubMed] [Google Scholar]
- Chen S. Huang C. Sun H. Ding J. Jena P. Kan E. J. Phys. Chem. C. 2019;123:17987–17993. doi: 10.1021/acs.jpcc.9b04631. [DOI] [Google Scholar]
- Kuklin A. V. Visotin M. A. Baek W. Avramov P. V. Phys. E. 2020;123:114205. doi: 10.1016/j.physe.2020.114205. [DOI] [Google Scholar]
- Moaied M. Hong J. Nanomaterials. 2019;9:153. doi: 10.3390/nano9020153. [DOI] [PMC free article] [PubMed] [Google Scholar]
- Grönke M. Buschbeck B. Schmidt P. Valldor M. Oswald S. Hao Q. Lubk A. Wolf D. Steiner U. Büchner B. Hampel S. Adv. Mater. Interfaces. 2019;6:1901410. doi: 10.1002/admi.201901410. [DOI] [Google Scholar]
- Kc S. Longo R. C. Wallace R. M. Cho K. J. Appl. Phys. 2015;117:135301. doi: 10.1063/1.4916536. [DOI] [Google Scholar]
- Wang Y. J. Zhou K. G. Yu G. L. Zhong X. Zhang H. L. Sci. Rep. 2016;6:24981. doi: 10.1038/srep24981. [DOI] [PMC free article] [PubMed] [Google Scholar]
- Eda G. Chhowalla M. Adv. Mater. 2010;22:2392–2415. doi: 10.1002/adma.200903689. [DOI] [PubMed] [Google Scholar]
- Du Y. Zhuang J. Liu H. Xu X. Eilers S. Wu K. Cheng P. Zhao J. Pi X. See K. W. Peleckis G. Wang X. Dou S. X. ACS Nano. 2014;8:10019–10025. doi: 10.1021/nn504451t. [DOI] [PubMed] [Google Scholar]
- Jiao X. Li X. Jin X. Sun Y. Xu J. Liang L. Ju H. Zhu J. Pan Y. Yan W. J. Am. Chem. Soc. 2017;139:18044–18051. doi: 10.1021/jacs.7b10287. [DOI] [PubMed] [Google Scholar]
- Sainbileg B. Lai Y.-R. Chen L.-C. Hayashi M. Phys. Chem. Chem. Phys. 2019;21:26292–26300. doi: 10.1039/C9CP04649F. [DOI] [PubMed] [Google Scholar]
- Kresse G. Furthmüller J. Phys. Rev. B: Condens. Matter Mater. Phys. 1996;54:11169–11186. doi: 10.1103/PhysRevB.54.11169. [DOI] [PubMed] [Google Scholar]
- Perdew J. P. Burke K. Ernzerhof M. Phys. Rev. Lett. 1996;77:3865–3868. doi: 10.1103/PhysRevLett.77.3865. [DOI] [PubMed] [Google Scholar]
- Togo A. Oba F. Tanaka I. Phys. Rev. B: Condens. Matter Mater. Phys. 2008;78:134106. doi: 10.1103/PhysRevB.78.134106. [DOI] [Google Scholar]
- McGuire M. A. Dixit H. Cooper V. R. Sales B. C. Chem. Mater. 2015;27:612–620. doi: 10.1021/cm504242t. [DOI] [Google Scholar]
- Fuh H. R. Chang C. R. Wang Y. K. Evans R. F. L. Chantrell R. W. Jeng H. T. Sci. Rep. 2016;6:32625. doi: 10.1038/srep32625. [DOI] [PMC free article] [PubMed] [Google Scholar]
- He J. Ding G. Zhong C. Li S. Li D. Zhang G. J. Mater. Chem. C. 2019;7:5084–5093. doi: 10.1039/C8TC05530K. [DOI] [Google Scholar]
- Kim J. Kim K.-W. Kim B. Kang C.-J. Shin D. Lee S.-H. Min B.-C. Park N. Nano Lett. 2020;20:929–935. doi: 10.1021/acs.nanolett.9b03815. [DOI] [PubMed] [Google Scholar]
- Jiang P. Li L. Liao Z. Zhao Y. X. Zhong Z. Nano Lett. 2018;18:3844–3849. doi: 10.1021/acs.nanolett.8b01125. [DOI] [PubMed] [Google Scholar]
- Guo G. Bi G. Cai C. Wu H. J. Phys.: Condens. Matter. 2018;30:285303. doi: 10.1088/1361-648X/aac96e. [DOI] [PubMed] [Google Scholar]
- Gudelli V. K. Guo G.-Y. New J. Phys. 2019;21:053012. doi: 10.1088/1367-2630/ab1ae9. [DOI] [Google Scholar]
Associated Data
This section collects any data citations, data availability statements, or supplementary materials included in this article.


