

Abstract
Adipocytes increase energy expenditure in response to prolonged sympathetic activation via persistent expression of uncoupling protein 1 (UCP1)1,2. Here we report that the regulation of glycogen metabolism by catecholamines is critical for UCP1 expression. Chronic β-adrenergic activation leads to increased glycogen accumulation in adipocytes expressing UCP1. Adipocyte-specific deletion of a scaffolding protein, protein targeting to glycogen (PTG), reduces glycogen levels in beige adipocytes, attenuating UCP1 expression and responsiveness to cold or β-adrenergic receptor-stimulated weight loss in obese mice. Unexpectedly, we observed that glycogen synthesis and degradation are increased in response to catecholamines, and that glycogen turnover is required to produce reactive oxygen species leading to the activation of p38 MAPK, which drives UCP1 expression. Thus, glycogen has a key regulatory role in adipocytes, linking glucose metabolism to thermogenesis.
Adipocyte thermogenesis3 has been suggested as a therapeutic approach to increase energy expenditure and reduce weight and insulin resistance4. While brown adipose tissue5 (BAT) is involved6, many studies have implicated browning or beiging of white adipose tissue (WAT) in improved metabolic homeostasis7. Browning of WAT is characterized by the appearance of ‘beige’ adipocytes with enrichment of mitochondria, multilocular lipid droplets and expression of uncoupling protein 1 (UCP1), which uncouples the proton gradient from ATP production, leading to the dissipation of heat.
While recent studies have demonstrated the existence of UCP1-independent thermogenic pathways8,9, uncoupling of ATP synthesis in mitochondria remains a major mechanism of thermogenesis in brown and beige adipocytes1. Ucp1 transcription is controlled by numerous factors including sympathetic activation via β-adrenergic receptors. Extended cold exposure or repeated injection of β-adrenergic agonists upregulates Ucp1 mRNA and protein expression and browning of subcutaneous WAT2.
Glycogen is a major mechanism of energy storage and utilization10. Glycogen synthase (GS), the rate-limiting enzyme in glycogen synthesis, is phosphorylated and inactivated by protein kinases, and subsequently activated by dephosphorylation via protein phosphatase 110 (PP1). Glycogen breakdown is catalysed by glycogen phosphorylase (GP), which is activated by phosphorylation11. To ensure the specificity of these phosphorylation/dephosphorylation events, both GS and GP are bound to targeting subunits that enable recognition by phosphatases and kinases10,12. These glycogen-targeting subunits have different tissue distributions and affinities for GP, GS and PP113. The ubiquitously expressed PTG—which is encoded by the Ppp1R3c gene—is highly enriched in adipocytes14. Whereas adipocytes maintain low levels of glycogen compared with liver or muscle, glycogen levels change substantially in these cells during fasting and refeeding, suggesting acute regulation15.
In this Article, we report the surprising discovery that glycogen has a crucial role in the regulation of browning of inguinal WAT (iWAT). Stimulation of adipocyte thermogenesis by sympathetic activation is accompanied by the coordinated upregulation of a cassette of glycogen-metabolizing genes, leading to dynamic glycogen accumulation and turnover in these cells. Expression of these genes in adipose tissue is also inversely correlated with obesity in two separate large cohorts of people with obesity. Moreover, glycogen synthesis and degradation are both required for adipocyte browning in response to β3-adrenergic agonist injection or prolonged cold exposure in vivo, and for the beneficial metabolic effects of catecholamines in obesity. Glycogen synthesis and turnover are required for the activation of p38, owing to the glycogen-dependent generation of reactive oxygen species (ROS). Together, these data reveal a role for glycogen metabolism as an intermediate in regulating thermogenic gene expression in beige adipocytes.
Glycogen is induced in beige adipocytes
Adipose tissue glycogen levels change during fasting, feeding and the diurnal cycle16, suggesting they may be regulated by β-adrenergic signals. We examined expression of glycogen metabolism genes in iWAT of mice treated with the β3-selective adrenergic agonist CL-316,243. Treatment with CL-316,243 for seven days resulted in a significant increase in the expression of Ucp1 and Dio2 (Extended Data Fig. 1a), indicating accumulation of beige adipocytes, as well as elevated expression of Gys1 and Ppp1r3c, which encode muscle glycogen synthase (mGS) and PTG, respectively. Unexpectedly, the expression of Gys2 and Pygl, which encode the liver glycogen synthase (hGS) and phosphorylase, were also significantly increased (Extended Data Fig. 1b). Moreover, analysis of a previously published dataset17 showed that the expression levels of GYS1, PYGL and PPP1R3C were upregulated by forskolin in human-derived adipocytes (Extended Data Fig. 2a). Compared with WAT, BAT showed higher basal expression of Ucp1, Dio2 and genes promoting glycogen metabolism, with only modest effects of CL-316,243 treatment (Extended Data Fig. 2b).
The CL-316243-dependent increase in mRNA levels of glycogen metabolism genes in WAT was accompanied by increased protein levels of mGS and hGS, as well as liver GP (hGP) (Extended Data Figs. 1c, 2c). Whereas no differences in protein expression were detected in BAT, hGS showed higher basal expression, suggesting a thermogenic function (Extended Data Fig. 2d). Mice treated with CL-316243 exhibited an approximately threefold increase in glycogen levels in adipocytes (Extended Data Fig. 1d). UCP1 expression was mainly detected in multilocular adipocytes (Extended Data Fig. 1e), where glycogen levels were highest. Electron microscopy analysis showed more glycogen granules juxtaposed to mitochondria in adipocytes from mice treated with CL-316243 (Extended Data Fig. 1f). Analysis of isolated mature adipocytes from iWAT confirmed that the gene expression changes highlighted above were adipocyte-specific (Extended Data Fig. 1g).
Glycogen affects UCP1 expression
The increased gene expression and accumulation of glycogen in beige adipocytes suggested a thermogenic role. PTG-knockout (KO) mice with a targeted deletion of Ppp1r3c showed less glycogen accumulation after CL-316243 treatment (Fig. 1a) and subsequently reduced expression of Ucp1 and Dio2 (Fig. 1c). RNA-sequencing analysis (RNA-seq) of isolated adipocytes from iWAT of mice revealed that 1,208 genes upregulated by CL-316,243 in wild-type adipocytes. Of those genes, expression levels of 617 were also changed in adipocytes from PTG-KO mice, leaving 169 uniquely upregulated in knockouts and 591 unique to wild-type mice. CL-316,243 treatment resulted in downregulation of 814 genes in isolated adipocytes from wild-type mice, of which 335 were also downregulated in PTG-KO mice. Knockout of PTG alone led to the upregulation of 178 genes and downregulation of 301 genes (Extended Data Fig. 3a, b). The increased expression of Ucp1 and Dio2 following CL-316,243 treatment was attenuated in PTG-KO mice (Extended Data Fig. 3c). The expression of glycogen-metabolizing genes was not different between genotypes, with the exception of the gene encoding glycogen debranching enzyme, Agl (Extended Data Fig. 3c).
Fig. 1 |. PTG-KO reduces the expression of UCP1 in beige adipocytes.
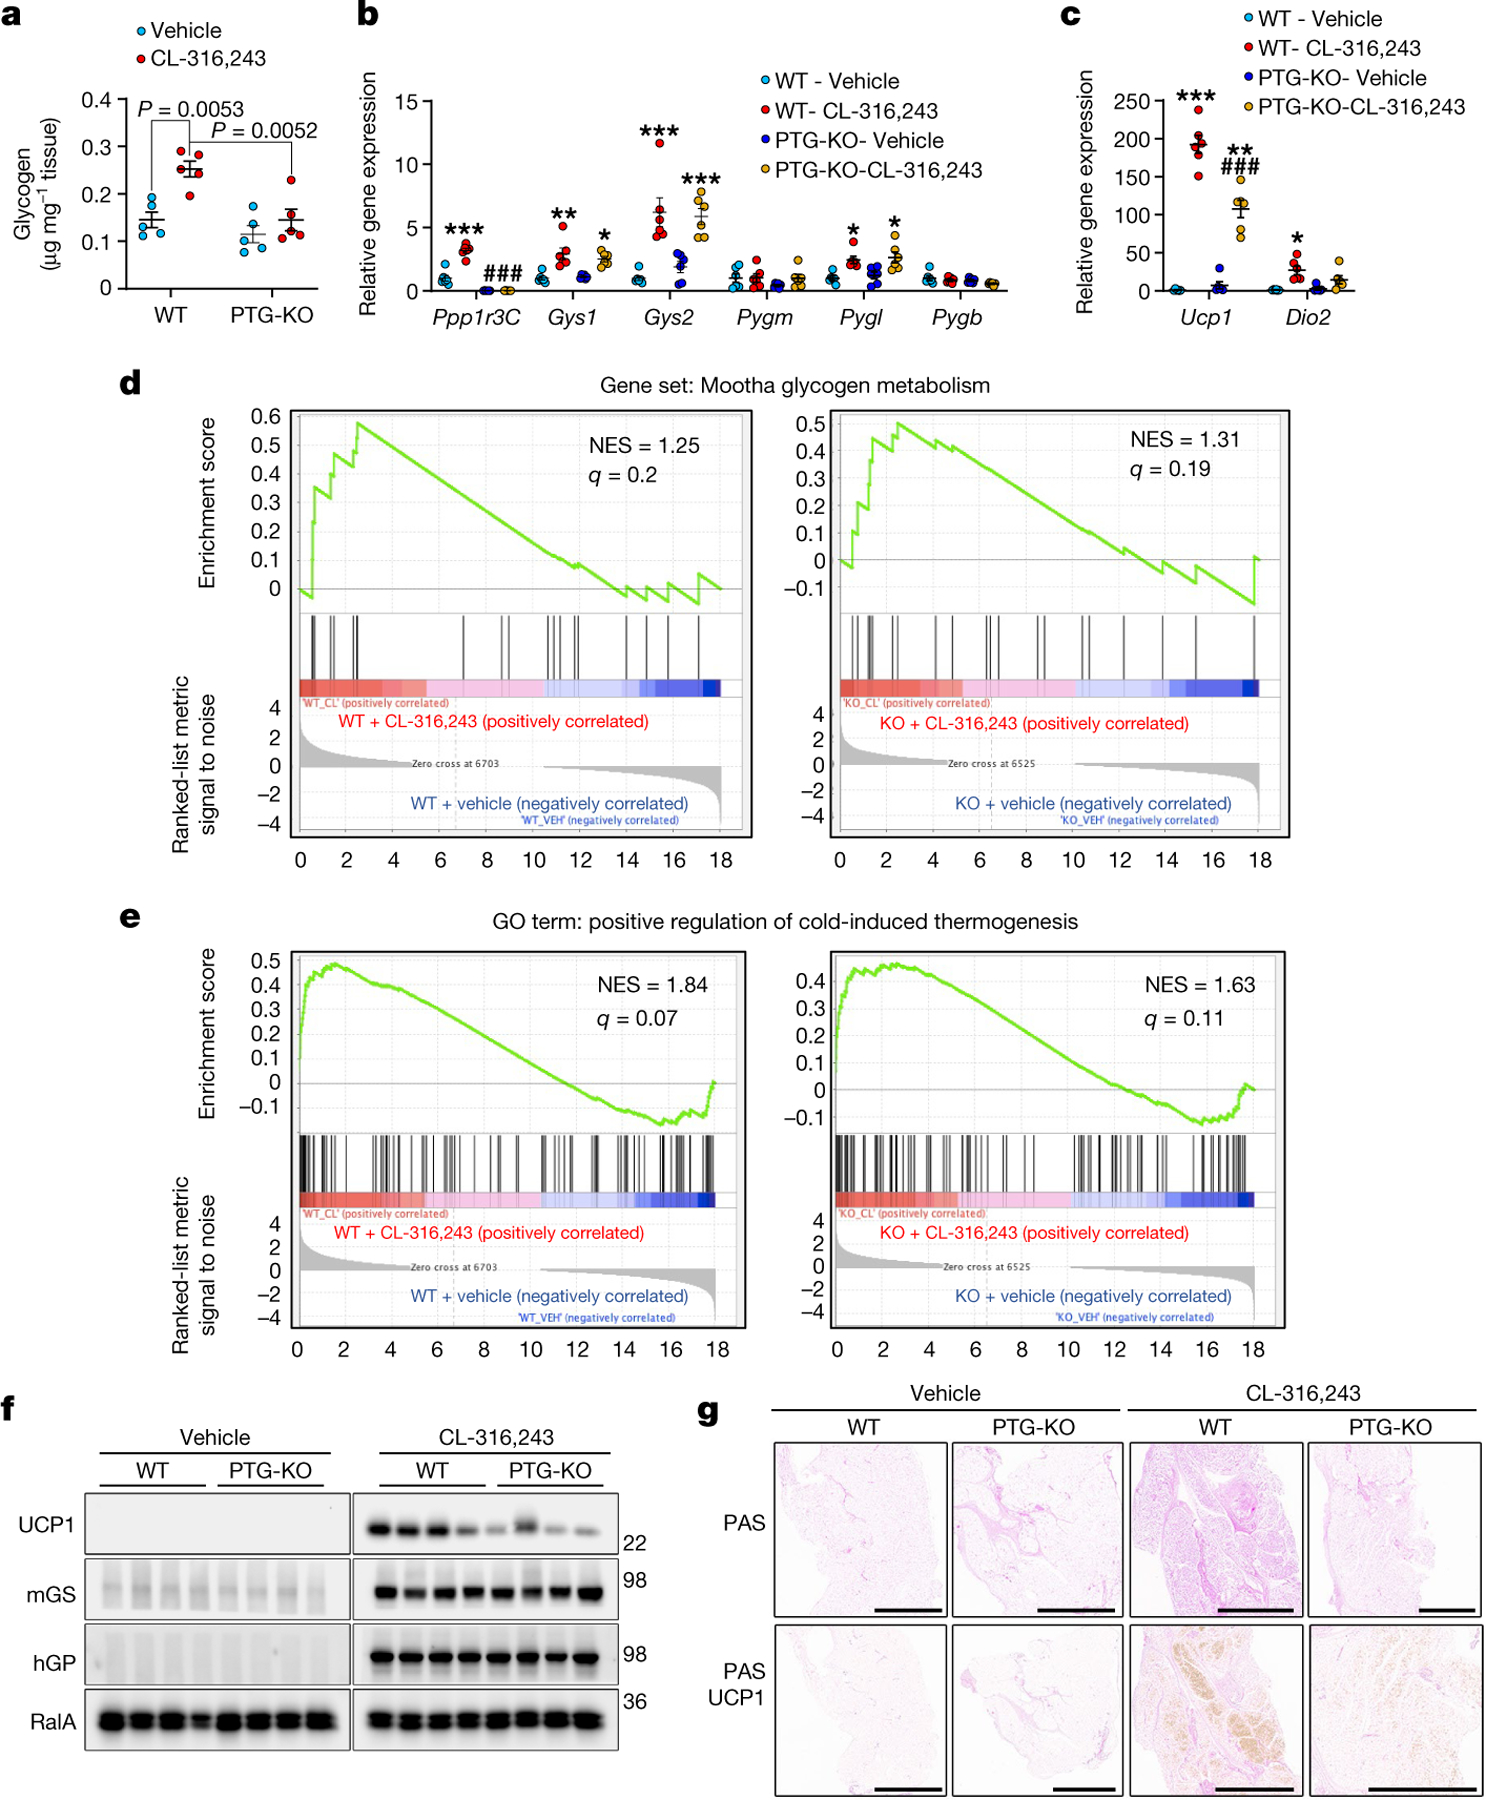
a, Glycogen levels in iWAT from wild-type (WT) and PTG-KO mice treated with either vehicle or CL-316,243 for 7 days. n = 5 mice per treatment per genotype. b, c, Gene expression in iWAT of mice treated as in a. n = 6 mice per treatment per genotype. d, e, GSEA on RNA-seq data from mature adipocytes isolated from PTG-KO and WT mice with or without CL-316,243 treatment for 7 days. n = 3 mice per genotype per condition. NES, normalized enrichment score. f, Expression of the specified proteins in iWAT of wild-type and PTG-KO mice treated as in a. n = 4 mice per treatment per genotype. g, Glycogen accumulation and UCP1 expression analysed by periodic acid-Schiff (PAS) and immunohistochemistry, respectively. Scale bars, 2 mm. Shown are representative images of tissues from 8 different mice, 2 per genotype per treatment. Data are mean ± s.e.m. Two-way analysis of variance (ANOVA) with adjustments for multiple comparisons (a–c). *P < 0.05, **P < 0.01, ***P < 0.001, ##P < 0.01, ###P < 0.001. *P value for difference between vehicle and CL-316,243 treatment within the same genotype; #P value for difference between wild-type and PTG-KO mice treated with CL-316,243.
Gene set enrichment analysis (GSEA) revealed increased expression of genes in the peroxisome proliferator activated receptor (PPAR) signalling and mitochondrial biogenesis pathway after CL-316,243 treatment in isolated adipocytes from both wild-type and PTG-KO mice (Extended Data Fig. 3d, e), suggesting that these pathways are not influenced by glycogen levels. By contrast, the gene ontology term ‘positive regulation of cold induced thermogenesis’ was enriched in adipocytes from wild-type but not from PTG-KO mice after CL-316,243 treatment, suggesting glycogen as a key regulator of thermogenic gene expression (Fig. 1d). Furthermore, enrichment of genes in the glycogen metabolism pathway was observed in both wild-type and PTG-KO adipocytes after CL-316,243 treatment (Fig. 1e).
UCP1 protein expression was reduced in PTG-KO iWAT (Fig. 1f, Extended Data Fig. 2f). Furthermore, histology of iWAT from PTG-KO mice revealed a marked reduction in CL-316,243-induced glycogen levels and UCP1 expression (Fig. 1g). The defect in UCP1 expression was not due to reduced sensitivity to CL-316,243, as hormone-stimulated and basal lipolysis were similar between the genotypes (Extended Data Fig. 3g).
To exclude possible systemic metabolic changes produced by whole body knockout, we generated Adipoq-cre-driven adipocyte-specific PTG-KO mice (PTG-AKO). CL-316,243-induced UCP1 expression was markedly reduced in PTG-AKO iWAT, confirming that adipocyte glycogen metabolism directly affects UCP1 expression (Fig. 2a, Extended Data Fig. 3a). Oxygen consumption was similar between genotypes during the first three days of CL-316,243 administration (Fig. 2b). On subsequent days CL-316,243 increased O2 consumption in wild-type but not in PTG-AKO mice (Fig. 2c). A similar trend was observed in carbon dioxide production (Extended Data Fig. 4b, c). PTG-AKO mice exhibited no difference in diet-induced obesity compared with wild-type mice (Fig. 2d). Repeated treatment of obese PTG-AKO mice with CL-316,243 led to decreased UCP1 induction compared with controls (Fig. 2e, Extended Data Fig. 3d, e). Moreover, weight loss in response to CL-316,243 was significantly less in PTG-AKO mice (Fig. 2f, Extended Data Fig. 3f, g), probably owing to less energy expenditure.
Fig. 2 |. Adipose-specific PTG knockout reduces UCP1 expression and energy expenditure.
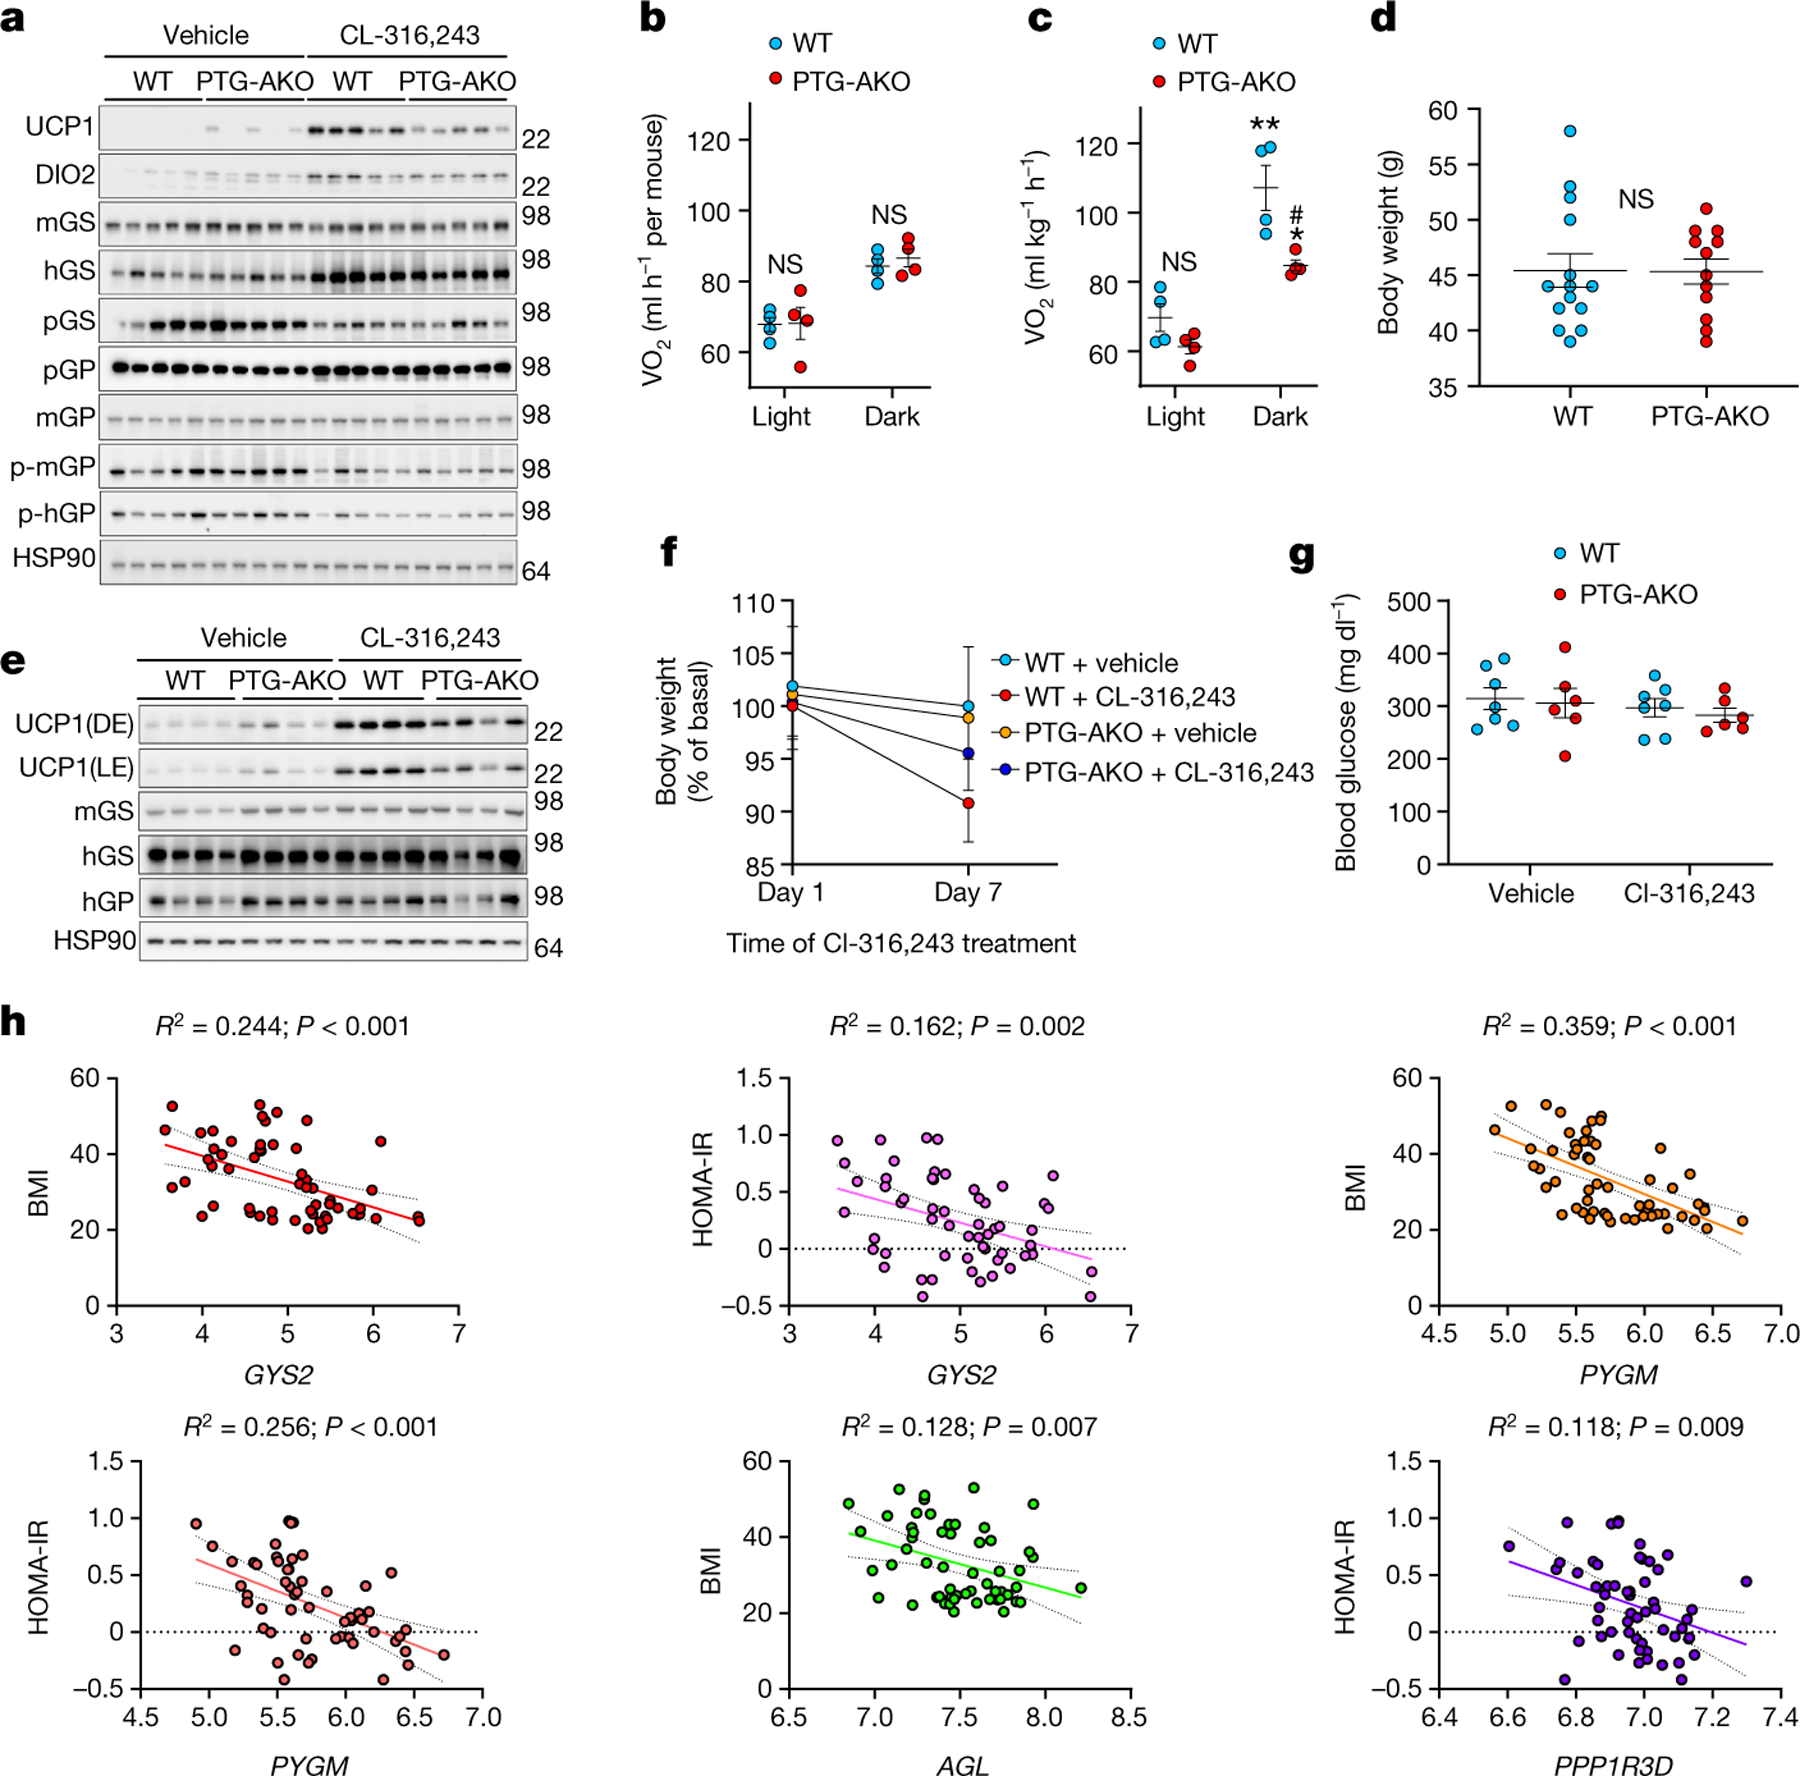
a, Protein expression in iWAT of wild-type and PTG-AKO mice treated with either vehicle or CL-316,243. n = 5 mice per genotype per treatment. b, c, Oxygen consumption (VO2) in wild-type and PTG-AKO mice. n = 4 mice per genotype per treatment. b, Average VO2 over the first three days of CL-316,243 treatment. c, VO2 on days 4–7 of CL-316,243 treatment. d, Body weight of obese (3-month high-fat-diet-fed) wild-type and PTG-AKO mice. n = 14 (wild type), n = 12 (PTG-AKO). e, Protein expression in iWAT of obese wild-type and PTG-AKO mice treated with vehicle or CL-316,243 for 7 days; DE, dark exposure; LE, light exposure. n = 4. f, Body weight loss in wild-type and PTG-AKO mice treated as described in e. n = 7 mice per genotype per treatment. g, Blood glucose levels in obese wild-type and PTG-AKO mice treated with either vehicle or CL-316,243 for 7 days. n = 7 mice per genotype per treatment. h, Linear regression of microarray data from subcutaneous adipose biopsies of lean (n = 26) and obese (n = 30) women. Data are mean ± s.e.m. Two-way ANOVA with adjustments for multiple comparisons (b–d, f, g). *P < 0.05, **P < 0.01. #P < 0.05. *P value for difference between vehicle and CL-316,243 treatment within the same genotype; #P value for difference between wild-type and PTG-AKO mice treated with CL-316,243.
Collectively, these data suggest that glycogen metabolism is required for adaptive thermogenesis in normal and obese mice. To determine the relevance to humans, we performed linear regression analyses on microarray data from subcutaneous adipose biopsies of non-obese (n = 26) and obese (n = 30) women18. The expression levels of GYS2, PYGM and AGL were negatively correlated with body mass index (BMI) (R2 = 0.244, 0.359 and 0.128, respectively), whereas GYS2, PYGM and PPP1RD were negatively correlated to log10 HOMA-IR (homeostatic model assessment for insulin resistance) (R2 = 0.162, 0.256 and 0.1118, respectively) (Fig. 2h). We validated these results in a second cohort of 770 men19. Specifically, GYS2 and PYGM were negatively correlated to BMI (R2 = 0.02564 and 0.1243, respectively), HOMA-IR (R2 = 0.04755 and 0.1421, respectively) and waist/hip ratio (R2 = 0.03780 and 0.1305, respectively) (Extended Data Fig. 4h). Together, higher expression of glycogen metabolism genes in adipose tissue is associated with lower body weight and higher insulin sensitivity in two independent cohorts of human subjects, including both sexes.
Glycogen affects p38 MAPK activation
We used iWAT-derived primary preadipocytes that were differentiated in vitro to examine the mechanisms responsible for glycogen dynamics in response to β3-adrenergic activation. CL-316,243 stimulation led to a substantial accumulation of glycogen in cells from wild-type but not PTG-KO mice (Fig. 3a). Furthermore, the levels of glucose-1-phosphate (G1P), the end product of glycogen breakdown, were also substantially reduced in PTG-KO adipocytes (Fig. 3b), and treatment of primary hepatocytes with glucagon decreased glycogen levels (Extended Data Fig. 5a), suggesting different responses between these two cell types. PTG-KO differentiated adipocytes showed reduced expression of Ucp1 and Dio2 in response to CL-316243 (Fig. 3c). Moreover, expression of GFP under the control of the Ucp1 promoter was significantly increased in cells co-expressing PTG (Extended Data Fig. 5b, c), suggesting that catecholamines increase both the synthesis and the turnover of glycogen in adipocytes to modulate thermogenesis.
Fig. 3 |. Attenuation of glycogen metabolism reduces the activation of p38.

a, Glycogen levels in CL-316,243-treated wild-type and PTG-KO preadipocytes. n = 3 biological replicates per genotype per treatment. b, G1P levels in wild-type and PTG-KO preadipocytes. n = 3 biological replicates per genotype per treatment. c, Gene expression in wild-type and PTG-KO preadipocytes treated as in a. n = 3 biological replicates per genotype per treatment. d, Ucp1 expression in response to CL-243,316 after pre-treatment with either p38 inhibitor (10 μM SB203580), PKA inhibitor (10 μM H89) or vehicle in wild-type preadipocytes. n = 3 biological replicates per treatment. e, Activation of p38 and HSL phosphorylation by CL-316,243 in wild-type and PTG-KO preadipocytes. n = 2 biological replicates per genotype per treatment. f–h, Wild-type preadipocytes treated with either CL-316,243 alone or in combination with 10 μM GPI. n = 3 biological replicates per treatment. f, Glycogen levels. g, Activation of p38. h, Thermogenic gene expression. Data are mean ± s.e.m. Two-way ANOVA with adjustments for multiple comparisons. *P < 0.05, **P < 0.01, ***P < 0.001, #P < 0.05, ##P < 0.01, ###P < 0.001, †††P < 0.001. In a–c: *P value for difference between vehicle and CL-316,243 treatment within the same genotype; #P value for difference between wild-type and PTG-KO mice treated with CL-316,243 at the same time point. In d, f, h: *P value for difference between vehicle and CL-316,243 treatment; #P value for difference between CL-316,243 treatment and CL-316,243 treatment in combination with H89 or SB203580 (daggers) at the same time point.
Inhibition of either PKA or p38 blunted CL-316,243-induced Ucp1 expression in differentiated adipocytes20 (Fig. 3d) and PTG-KO adipocytes. Notably, CL-316,243-dependent activation of p38 was reduced in PTG-KO adipocytes, whereas PKA-dependent phosphorylation of hormone sensitive lipase (HSL) was unaffected (Fig. 3e, Extended Data Fig. 5f). Similar to PTG-KO adipocytes, PP1 inhibition with tautomycin reduced the phosphorylation of p38 in response to catecholamine stimulation (Extended Data Fig. 5d, e), collectively suggesting that glycogen dynamics regulate p38 activation and subsequently UCP1 induction.
Because the expression of both GS and GP is induced upon CL-316,243 treatment, we suspected that glycogen turnover regulates UCP1 expression. We therefore blocked glycogenolysis with a GP inhibitor (GPI), which potentiated the accumulation of glycogen following β3-adrenergic activation (Fig. 3f) but reduced activation of p38 (Fig. 3g, Extended Data Fig. 5g) and subsequently Ucp1 and Dio2 expression (Fig. 3h). This indicates that glycogen turnover is required for the activation of p38 in adipocytes.
Glycogen regulates ROS-dependent p38 activation
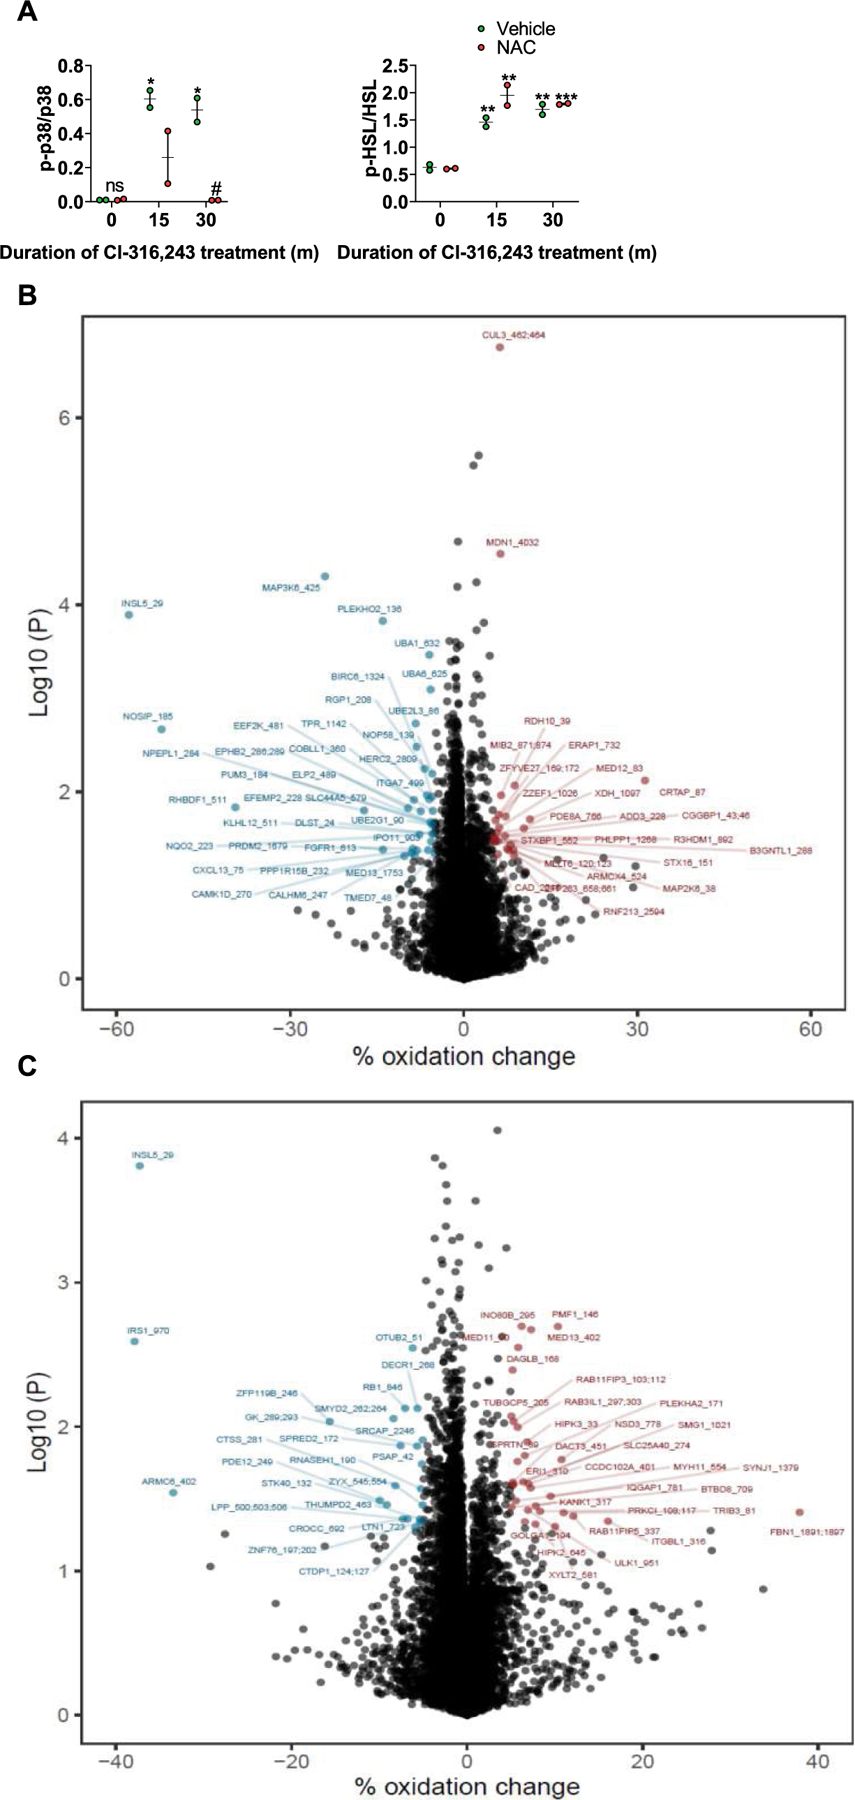
ROS production is required for the activation of p3821,22. Stimulation of differentiated adipocytes with CL-316,243 produced a 4.5-fold increase in ROS levels (Fig. 4a), with increased expression of ROS-detoxification genes, which was abrogated by the ROS scavenger N-acetyl-l cysteine (Fig. 4b). CL-316,243-induced activation of p38 and expression of Ucp1 and Dio2 were significantly attenuated in the presence of N-acetyl-l cysteine (Fig. 4c, d, Extended Data Fig. 6a), suggesting that the activation of p38 and subsequent increase in UCP1 expression depends on ROS production.
Fig. 4 |. Glycogen metabolism contributes to ROS production in adipocytes.
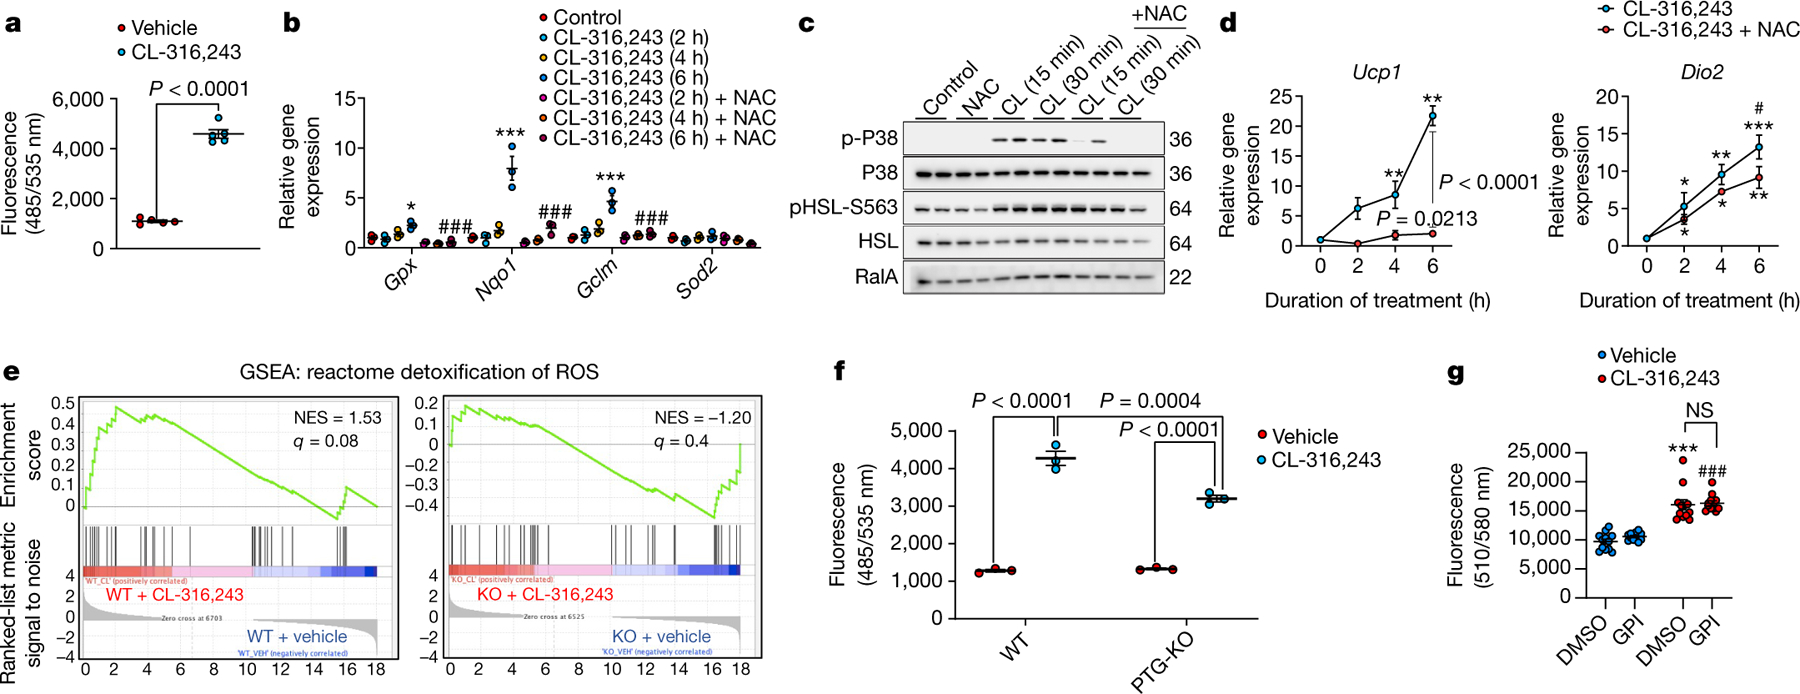
a, ROS production in response to CL-243,316 in wild-type preadipocytes. n = 5 biological replicates per treatment. b, Induction of ROS-detoxification genes by CL-316,243 in wild-type preadipocytes. n = 3 biological replicates per treatment. c, ROS-dependent activation of p38 in wild-type preadipocytes treated with CL-316,243 (CL) alone or in combination with the ROS scavenger N-acetyl-l cysteine (NAC). n = 2 biological replicates per treatment. d, Thermogenic gene expression in preadipocytes treated as in c. n = 3 biological replicates per treatment. e, ROS-related pathway analysis using GSEA on RNA-seq data from mature adipocytes isolated from iWAT of PTG-KO and wild-type mice treated with vehicle or CL-316,243 for 7 days. n = 3 biological replicates per genotype per treatment. f, ROS production in wild-type preadipocytes, wild-type preadipocytes treated with GPI, and PTG-KO preadipocytes. n = 3 biological replicates per genotype per treatment. g, Mitochondrial ROS production in preadipocytes treated with vehicle or Cl-316,243 with and without GPI treatment. n = 12 biological replicates per treatment. Data are mean ± s.e.m. Two-sided t-test and two-way ANOVA (a). *P < 0.05, **P < 0.01, ***P < 0.001, #P < 0.05, ###P < 0.001. In a, b, d, g: *P value for difference between vehicle and CL-316,243 treatment; #P value for difference between CL-316,243 treatment and CL-316,243 treatment in combination with the specified inhibitor at the same time point. In f, h: *P value for difference between vehicle and CL-316,243 treatment; #P value for difference between CL-316,243 treatment of wild-type preadipocytes and CL-316,243 treatment of PTG-KO preadipocytes.
GSEA of our RNA-seq data showed that the ‘detoxification and reactive oxygen species’ pathway was highly enriched in isolated adipocytes from wild-type mice treated with CL-316,243, but completely absent in PTG-KO adipocytes (Fig. 4e). Knockout of PTG significantly reduced ROS production in response to CL-316,243 (Fig. 4f), as did inhibition of GP, indicating that glycogen turnover is required for the generation of ROS. A global analysis of cysteine oxidation in adipocytes treated with vehicle, Cl-316,243 or Cl-316,243 plus GPI revealed that the cysteine oxidation state changed in a unique subpopulation of proteins after β-adrenergic stimulation with or without GPI (Extended Data Fig. 6b, c). Using specific probes, we determined that mitochondrial ROS increased after CL-316,243 treatment of adipocytes, but was independent of GP (Fig. 4g). Thus, glycogen synthesis and breakdown leading to ROS production and activation of p38 is likely to occur in the cytoplasm.
Glycogen is required for cold adaptation
Wild-type and PTG-KO mice both maintain core body temperature upon acute cold exposure (Extended Data Fig. 7a). However, returning wild-type but not PTG-KO mice to room temperature markedly increased BAT glycogen levels (Extended Data Fig. 7b). Wild-type mice subsequently challenged with a second cold exposure maintained their core body temperature, whereas PTG-KO mice did not (Extended Data Fig.7c),suggesting that glycogen metabolism is required for long-term cold adaptation. We generated Ucp1-cre dependent brown and beige adipocyte PTG-knockout mice (PTG-BKO). Long-term cold exposure induced the expression of genes involved in glycogen metabolism in both wild-type and PTG-BKO mice (Extended Data Fig. 7d, e); however, the induction of Ucp1 mRNA expression in iWAT was attenuated in PTG-BKO mice (Extended Data Fig. 7f). UCP1 protein levels in iWAT from cold-exposed PTG-KO mice were also lower relative to controls (Extended Data Figs. 7g, 8a).
PTG knockout did not affect UCP1 expression in BAT (Extended Data Fig. 8b). There was no difference in oxygen consumption during the initial cold (18 °C) adaptation between genotypes. However, PTG-KO mice exhibited reduced oxygen consumption and CO2 production after three days of cold exposure (4 °C), with a further reduction after 4 additional days at 4 °C (Extended Data Figs. 7h, 8c). We propose a model whereby adipocyte glycogen synthesis and turnover generate ROS to activate p38 and subsequently induce Ucp1 and other thermogenic genes to regulate energy expenditure (Extended Data Fig. 7i).
Discussion
Adaptive thermogenesis in brown and beige adipocytes may hold the key to understanding the regulation of energy homeostasis. Persistent exposure to cold or repeated injection of a β-adrenergic agonist increase UCP1 expression in subcutaneous white adipocytes, leading to the appearance of beige adipocytes promoting energy expenditure and weight loss, as well as other beneficial metabolic effects23.
Glycogen is generally considered the first option in cells for energy storage and utilization. The regulation of glycogen synthesis and degradation by insulin and adrenaline are well studied in muscle and liver10, but less so in adipocytes. Although glycogen levels in adipocytes are low, they express GS, GP and targeting proteins that are exquisitely sensitive to hormones and required for glycogen cycling24. Our finding that beige and brown adipocytes contain considerably higher levels of glycogen than white adipocytes and accumulate glycogen in response to a catabolic signal appears counterintuitive; however, refeeding-induced glycogen accumulation in brown adipocytes depends on catecholamine signalling16, suggesting a complex interplay between anabolic and catabolic signals in regulating adipocyte glycogen levels25.
We identified a cassette of glycogen metabolism genes that is markedly upregulated in beige adipocytes in response to β-adrenergic stimulation. While muscle isoforms of GS and GP are expressed normally, the major increase occurred in the liver isoforms of these genes. The muscle, but not the liver GP isoform is allosterically activated by AMP, whereas only the liver isoform is inhibited by glucose26. Thus, expression of the liver isoform may be restricted to beige and brown adipocytes to permit inhibition of glycogenolysis by glucose, since beige and brown adipocytes have enhanced glucose uptake27. While the expression of both GS isoforms is upregulated in beige adipocytes, the increase in the liver isoform is significantly higher. Moreover, basal levels of hGS are high in brown adipocytes, suggesting that this isoform facilitates thermogenesis.
Assessment of mice with whole-body, adipocyte-specific and brown and beige adipocyte-specific knockout of PTG, the key glycogen-targeting protein, revealed that glycogen metabolism is required for the induction of UCP1 by adrenergic activation both in vivo and in vitro in a cell-autonomous manner. Glycogen accumulation and turnover were also required for long-term cold adaptation in these models. Both synthetic and degrading enzymes are coordinately increased by β-adrenergic activation and are high in brown adipocytes, suggesting that this isoform facilitates adrenergic activation of thermogenesis in adipocytes, leading us to speculate that both glycogen turnover and synthesis are crucial. Supporting this hypothesis, pre-treatment with a GPI blocked β-adrenergic agonist-induced UCP1 expression. Of note, activation of p38 MAPK phosphorylation by β-adrenergic activation also required glycogen synthesis and turnover, which we traced to the generation of ROS, which is required for p38 activation. Substantial evidence supports the role of ROS in activating the p38 MAPK pathway28,29; sestrin 2 affects the expression of UCP1 by modulating ROS-dependent activation of p38 in brown adipocytes30. PKA is required for p38 activation in response to β3-adrenergic agonists31, as is the p38 kinase ASK1. However, whether p38 is directly activated by ROS remains unknown32. It is also possible that PKA-dependent activation of p38 requires direct as well as indirect pathways. Although it remains unclear how glycogen turnover contributes to ROS production, glucose oxidation is a major source of cellular ROS33. We speculate that glycogen-derived G1P provides a substrate for glycolysis, and glycolytic activity leads to ROS production.
UCP1 activation decreases ROS levels in brown adipocytes34. Mitochondrial ROS production induces sulfenylation of UCP1 to promote its activity35, functionally linking the two to keep ROS levels low. However, under circumstances of sustained elevated ROS levels, acute activation of UCP1 may not be sufficient to maintain homeostasis, and thus ROS production may also promote Ucp1 expression to reduce ROS levels in beige adipocytes.
The identification of a specific requirement for glycogen synthesis and turnover in the browning of WAT signifies a novel aspect of the regulation of energy expenditure. We speculate that this pathway ensures the beiging only of white adipocytes with sufficient energy to fuel thermogenesis, thus preventing the potentially toxic effects of ATP uncoupling produced by UCP1 expression. However, we also note that glycogen synthesis and turnover may have additional nongenomic effects on beige adipocytes that increase the flux of substrates contributing to increased energy expenditure. Nevertheless, the regulation of glycogen metabolism and the effect of glycogen metabolism on expression of thermogenic genes indicates previously unrecognized regulatory functions in adipocytes, suggesting that modulation of glycogen metabolism might have therapeutic benefits.
Methods
Animals
Whole-body PTG knockout was previously described36. Adiponectin and Ucp-cre-driven PTG-KO were generated in house. In brief, PTG floxed cells were purchased from EUCOMM (https://www.mousephenotype.org/about-impc/about-ikmc/eucomm/). These cells were expanded and validated at the UCSD transgenic core. Validated clones were injected into the blastocoel cavity of 3.5-day post-coitum blastocyst stage C57Bl6C57Bl6 albino embryos. Injected blastocysts were implanted into pseudo-pregnant recipient females, and chimeric pups were born. Floxed mice were generated by breeding positive mice to B6.Cg- (ACTFlpE) 9205Dym/J ( Jackson Laboratory, stock no. 005703). Adipose-specific and BAT-specific knockout mice were generated by crossing homozygous floxed mice to adiponectin-driven cre ( Jackson Laboratory, stock no. 028020) or Ucp1-cre ( Jackson Laboratory, stock no. 024670), respectively.
All experiments were done using wild-type (WT) and KO littermates. Mice were fed a standard normal chow (7912, Teklad) or fed for 3 months with a high-fat diet with 45% of the calories derived from fat (mice were put on a high-fat diet at 8–10 weeks of age). Cl-316,243 (C5976, Sigma-Aldrich) injections were performed on 8- to 11-week-old mice. Before CL-316,243 treatment, mice were conditioned for intraperitoneal injections for one week. CL-316,243 was injected intraperitoneally at 1 mg kg−1 (body weight). Mice were housed in a specific-pathogen-free (SPF) facility with 12 h:12 h light:dark cycles and given free access to food and water. All animal use was approved by the Institutional Animal Care and Use Committee (IACUC) at the University of California, San Diego.
Metabolic cage studies
Mice were maintained in Promethium system metabolic cages in a temperature-controlled cabinet. The presented values are normalized to body weight. For long-term cold adaptation, mice were housed in the metabolic cages for 3 days at 22 °C. Temperature was then reduced to 18 °C for 7 days and then switched to 4 °C for the rest of the experiment. Control mice were kept at 22 °C.
Gene expression data in clinical cohorts
Gene microarray data from 26 non-obese and 30 obese women were generated as described before18 and accessible through the Gene Expression Omnibus (http://ncbi.nim.nih.gov/geo) under the accession number GSE25402.
Free fatty acids measurement
Free fatty acids (FFA) were measured using the NEFA kit (WAKO) according to the manufacturer’s instructions. In brief, 75 μl of reagent A was mixed with 150 μl reagent B per sample and combined with 2 μl of serum. FFA standards were used to generate a standard curve. Absorbance was measured at 550 nm (reference 660 nm) using a Tecan microplate reader.
Preadipocytes and mature adipocyte isolation
Preadipocytes and mature adipocytes were isolated from iWAT of 4- to 8-week-old male mice as previously described37. In brief, following dissection, the fat tissue was finely minced and then resuspend in 10 ml of serum free DMEM supplemented with 1 mg ml−1 collagenase (C6885, Sigma). Digestion was done for 20–45 min at 37 °C with gentle agitation. FBS was added to a final concentration of 10% and the digested tissue was filtered through a 100-μm filter and then centrifuged at 1,500 rpm for 5 min at room temperature. For mature adipocyte isolation, the fat cake was collected and moved to a new tube, fresh medium was added and the cells were spun again at 1,500 rpm for 5 min, this wash step was repeated once more and then the fat cake was snap frozen till further processing. For preadipocytes isolation, the supernatant was discarded and the pellet was resuspended in DMEM containing 10% FBS, and the centrifugation and pellet wash were repeated twice more. Cells were plated in 10-cm tissue culture plates in DMEM medium containing 15% FBS. Cells were passaged one time and then allowed to grow to full confluence and induced to differentiate by adding 500 μM 3-isobutyl-1-methylxanthine, 250 nM dexamethasone, 1 μg ml−1 insulin and 1 μM troglitazone for 4 days. The medium was then changed to 1 μg ml−1 insulin for 3 days. Cells were used for experiments at 8 or 9 days after the initiation of differentiation.
Mouse primary hepatocyte isolation
Mouse primary hepatocytes were isolated from male mice at six weeks of age as previously described38. In brief, mice were anaesthetized and perfused with 25 ml calcium-free HEPES–phosphate buffer (pH 7.4) at a rate of 2.5 ml min−1. Mice where then perfused with 25 ml HEPES–phosphate buffer (pH 7.4) containing 40 μg ml−1 Liberase TM (5401127001, Roche). The last perfusion was done with 25 ml calcium-free HEPES– phosphate buffer (pH 7.4). Liver was taken out and hepatocytes were mechanically dissociated in HEPES–phosphate buffer (pH 7.4), passed through a 100-μm mesh nylon filter (Scientifics). Hepatocytes were spun down at 50g for 10 min. Supernatant was discarded, and the pellet resuspended in 50 ml HEPES–phosphate buffer (pH 7.4) containing 36 % percoll and spun at 100g for 10 min. The pellet was resuspended in William’s E medium (12551–032, Life Technologies) supplemented with 10 % FBS, GlutaMax (35050–061, Life Technologies) and 1 % penicillin/streptomycin and plated in collagen-coated plates. Four hours after plating, cells were washed with PBS and treated with 10 nM glucagon for the indicated times.
RNA extraction, RT–PCR and rtPCR
For RNA isolations from in vivo experiments, following dissection, tissues were immediately snap frozen in liquid nitrogen and stored at −80 °C until processing. Tissues were directly homogenized in TRIzol (15596018, Life Technologies) according to the manufacturer’s instructions. One-to-two micrograms of RNA were used for cDNA synthesis using the High-Capacity cDNA Reverse Transcription Kit (Applied Biosystems, 4374967). Quantitative PCR was performed in triplicates using the Power SYBR Green PCR Master Mix (Applied Biosystems). The Applied Biosystems QS5 real-time PCR (rtPCR) System was used with the standard curve settings. Sequences of primers used are listed in Supplementary Table 1.
RNA sequencing
WT and PTG-KO mice were treated with either CL 316,243 (1 mg kg−1) or vehicle for 7 days. Following dissection, mature adipocytes were isolated and RNA was extracted. The TruSeq RNA Sample Preparation Kit v2 (Illumina) was used for library preparation from ~300 ng RNA. A 2100 BioAnalyzer (Agilent) preformed library validation followed by sequencing on an Illumina HiSeq 2000 using barcoded multiplexing at a 100-bp read length. The 100-bp paired-end reads were sequenced to a depth of 2 to 6 × 10⁶ reads and CASAVA 1.8.2 was used to generate Fastq files. Fastq files were aligned using TopHat2 v2.0.4 and differential gene expression assessed using Cuffdiff v.2.0.2. Data are expressed as fragments per kilobase of exon per million fragments mapped (FPKM). Pathway analysis of RNA-seq results was performed with GSEA (GSEA v.4.0.3). Pathways were retrieved from ftp.broadinstitute.org://pub/gsea/gene_sets/c2.cp.v7.2.symbols.gmt and mouse ENSEMBL Gene ID MSigDB.v7.0.chip were used as the chip platform. Basic and advanced fields were left at default settings for all analyses.
Histology
Tissues were collected and fixed in 10 % formalin for 48 h and then washed and stored in 70% ethanol until processing. All the following steps such as paraffin embedding, sectioning, haematoxylin and eosin staining and immunohistochemistry were done at the UCSD Tissue Technology Core.
Immunoblotting
Lysates from tissues or cells were generated by extraction in 50 mM Tris (pH 7.5), 150 mM NaCl, 10% glycerol and 1% NP-40. Protein quantification was done using the DC protein assay (5000114, Bio-Rad). Samples were were resolved by SDS–PAGE and transferred to 0.4 μM nitrocellulose membranes (Bio-Rad).
Antibodies
Phospho-p44/42 MAPK (Erk1/2) (Thr202/Tyr204) (9101), p44/42 MAPK (Erk1/2) (137F5) (4695), pS563 HSL (4139), HSL (4107), pT108/pY182 p38 (9211), p38 (9212), HSP90 (4874s) mGS (3886s) and pGS (3891s) antibodies were obtained from Cell Signaling. Other antibodies used were Turbo-GFP (PA5–22688, Thermofisher), hGP (TA350315, AMSBIO), mGP (19716–1-AP, PROTEINTECH), UCP1 (ab10983, Abcam) and DIO2 (ab135711, Abcam).
Glycogen extraction
Glycogen extraction was done as previously described39 with slight modifications. WAT samples were defatted by incubation in 1 ml of methanol:choloroform solution (1:2 ratio) for 30 min at room temperature. Samples were centrifuged at 6,000g for 5 min, solution was aspirated and the process was repeated once more. Following the second centrifugation, samples were allowed to dry completely before proceeding to the next step. Cells, liver or BAT tissues did not go through this step. Samples were boiled for 30 min in 500 μl of 30% KOH solution. Samples were allowed to cool and 100 μl of 1 M NaSO4 were added followed by the addition of 1.2 ml pure ethanol. Samples were boiled for 5 min and centrifuged for 5 min at 16,000g. Pellets were washed twice by resuspending the pellet in 500 μl of double-distilled water, 1 ml pure ethanol was added and the samples were boiled again. Following the last wash, pellets were allowed to completely air dry and then resuspended in 150 μl of 50 mM sodium acetate pH 4.8 containing 0.3 mg ml−1 amyloglucosidase and incubated at 37 °C overnight. Fujifilm Autokit glucose assay (997–03001) was used to determine the amount of glycogen by comparing to a glycogen standard curve.
ROS measurements
ROS levels were analysed using the CM-H2DCFDA reagent from Thermo-fisher (C6827). In brief, fully differentiated adipocytes were treated with PBS or Cl-316,243 for 10 min and then CM-H2DCFDA was added at a final concentration of 5 μM for 30 min at 37 °C. Cells were then washed with fresh growth media twice and fluorescence was measured immediately.
Analysis of cysteine redox modifications
Differentiated adipocytes were treated with either vehicle, Cl-316,243 or Cl-316,243 in combination with GPI. Cells were collected and lysed rapidly on ice in 20% ice-cold trichloroacetic acid (TCA). The resulting lysate from each biological replicate was split into two identical half-samples each containing approximately 200 μg of protein, then washed with 20% TCA, 10% TCA and 5% TCA twice. One half-sample was resuspended in blocking buffer (100 mM HEPES pH 8.5, 2% SDS, 1 mM EDTA, 1 mM diethylenetriaminepentaacetic acid (DTPA), 10 μM neocuproine and 35 mM iodoacetamide) for 2 h at 37 °C in the dark on a shaking incubator (1,200 rpm) to block all unmodified cysteine residues, while the other half sample was treated with labelling buffer (100 mM HEPES, 2% SDS, 1 mM EDTA, 1 mM DTPA, 10 μM neocuproine and 35 mM cysteine-phosphate tags (CPT)) to label all unmodified cysteine residues with CPTs40. After labelling, proteins in both half-samples were precipitated by methanol and chloroform and resuspended in labelling buffer plus 5 mM tris(2-carboxyethyl)phosphine to label reversibly modified cysteines. Proteins were precipitated again and digested with LysC and trypsin in 200 mM EPPS buffer pH 8.0 at a 100:1 substrate-to-enzyme ratio overnight at 37 °C. After digestion, a microBCA assay (Thermo) was performed to determine the amount of peptides in each tube. One hundred micrograms of peptides from each half-sample was labelled by a channel of TMT 16-plex reagent following the SL-TMT protocol41, and a total of 16 half-samples from 8 biological samples were labelled by each TMT set. Two microliters of peptides from each channel were then mixed, desalted using a stage tip, and analysed with liquid chromatography and mass spectrometry (LC–MS) as a ‘ratio check’ to calibrate peptide loading. The remainder of samples were mixed according to the total peptide loading ratios obtained from the ratio-check, and a second ratio-check was performed to calibrate pipetting errors computationally for data analysis. CPT-labelled cysteine peptides were not included in the ratio-check analysis. The mixed samples were desalted using a Sep-Pak cartridge (Waters), treated with Lambda phosphatase (Santa Cruz Biotechnology) following the manufacturer’s protocol to remove endogenous phosphorylated peptides. The resulting mixture was desalted again, and CPT-labelled cysteine peptides were enriched using the High-Select Fe-NTA Phospho-peptide Enrichment Kit (Thermo) following the manufacturer’s instructions. Samples were then desalted again and fractionated with an Agilent 1100 quaternary pump with a degasser and a photodiode array using a 57 min linear gradient from 3% to 32% acetonitrile in10 mM ammonium bicarbonate pH = 8.0, at a flow rate of 0.25 ml min−1. Peptides were separated into a total of 96 wells and consolidated into 12 fractions. After overnight lyophilization, these 12 fractions were stage-tipped and reconstituted in a solution containing 5% formic acid and 5% acetonitrile, and analysed by LC–MS.
Samples were measured on an Orbitrap Eclipse instrument coupled with an Easy-nLC 1200 (Thermo) using a 180-min gradient consisting of 2%–23% acetonitrile, 0.125% formic acid at 500 nl min−1 flow rate. A FAIMSPro (Thermo) device was used for field-asymmetric ion mobility spectrometry (FAIMS) separation of precursors42. The FAIMS device was operated with default settings and multiple compensation voltages (−35 V, −45 V, −55 V), which is optimized for analysis of CPT-labelled peptides. Under each FAIMS voltage, peptide ions were collected in data-dependent mode using a m/z range of 400–1,600 using 2-s cycles. Resolution for MS1 was set at 120,000, with standard automatic gain control target. Multiply charged ions were selected and subjected to fragmentation at 35% normalized collisional energy for MS2 with a dynamic exclusion of 120 s. Quantification was performed using multinotch SPS-MS3 as described previously43.
The Comet algorithm44 was used to search all MS/MS spectra against a database containing sequences of mouse (Mus musculus) proteins downloaded from UniProt in 2020 (http://www.uniprot.org). Reversed sequences were appended as decoys for false discovery rate (FDR) filtering, and common contaminant proteins (for example, human keratins and trypsin) were included. Peptides were searched using following parameters: 25 ppm precursor mass tolerance; 1.0 Da product ion mass tolerance; fully tryptic digestion; up to two missed cleavages and three modifications; variable modification: oxidation of methionine (+15.9949); CPT (+221.08169) on cysteines; and static modifications: TMT 16-plex (+304.2071) on lysine and peptide N-terminus. The target-decoy method was employed to control the FDR45–47. To distinguish correct and incorrect peptide identifications, linear discriminant analysis was used to control peptide-level FDR to less than 1%. Peptides shorter than 7 amino acids were discarded. Protein-level FDR was also controlled to 1% and as a result the number of peptide reverse hits were further decreased. Peptides were matched to the least number of proteins. TMT reporter ion signal-to-noise ratios were used to calculate the per cent oxidation of each cysteine site. Student’s t-test was used to determine statistical significance between samples. Cysteine-site stoichiometry changes of at least 5% between sample groups and P < 0.05 were designated as significant.
Extended Data
Extended Data Fig. 1 |. Glycogen metabolism is enhanced in beige adipocytes.
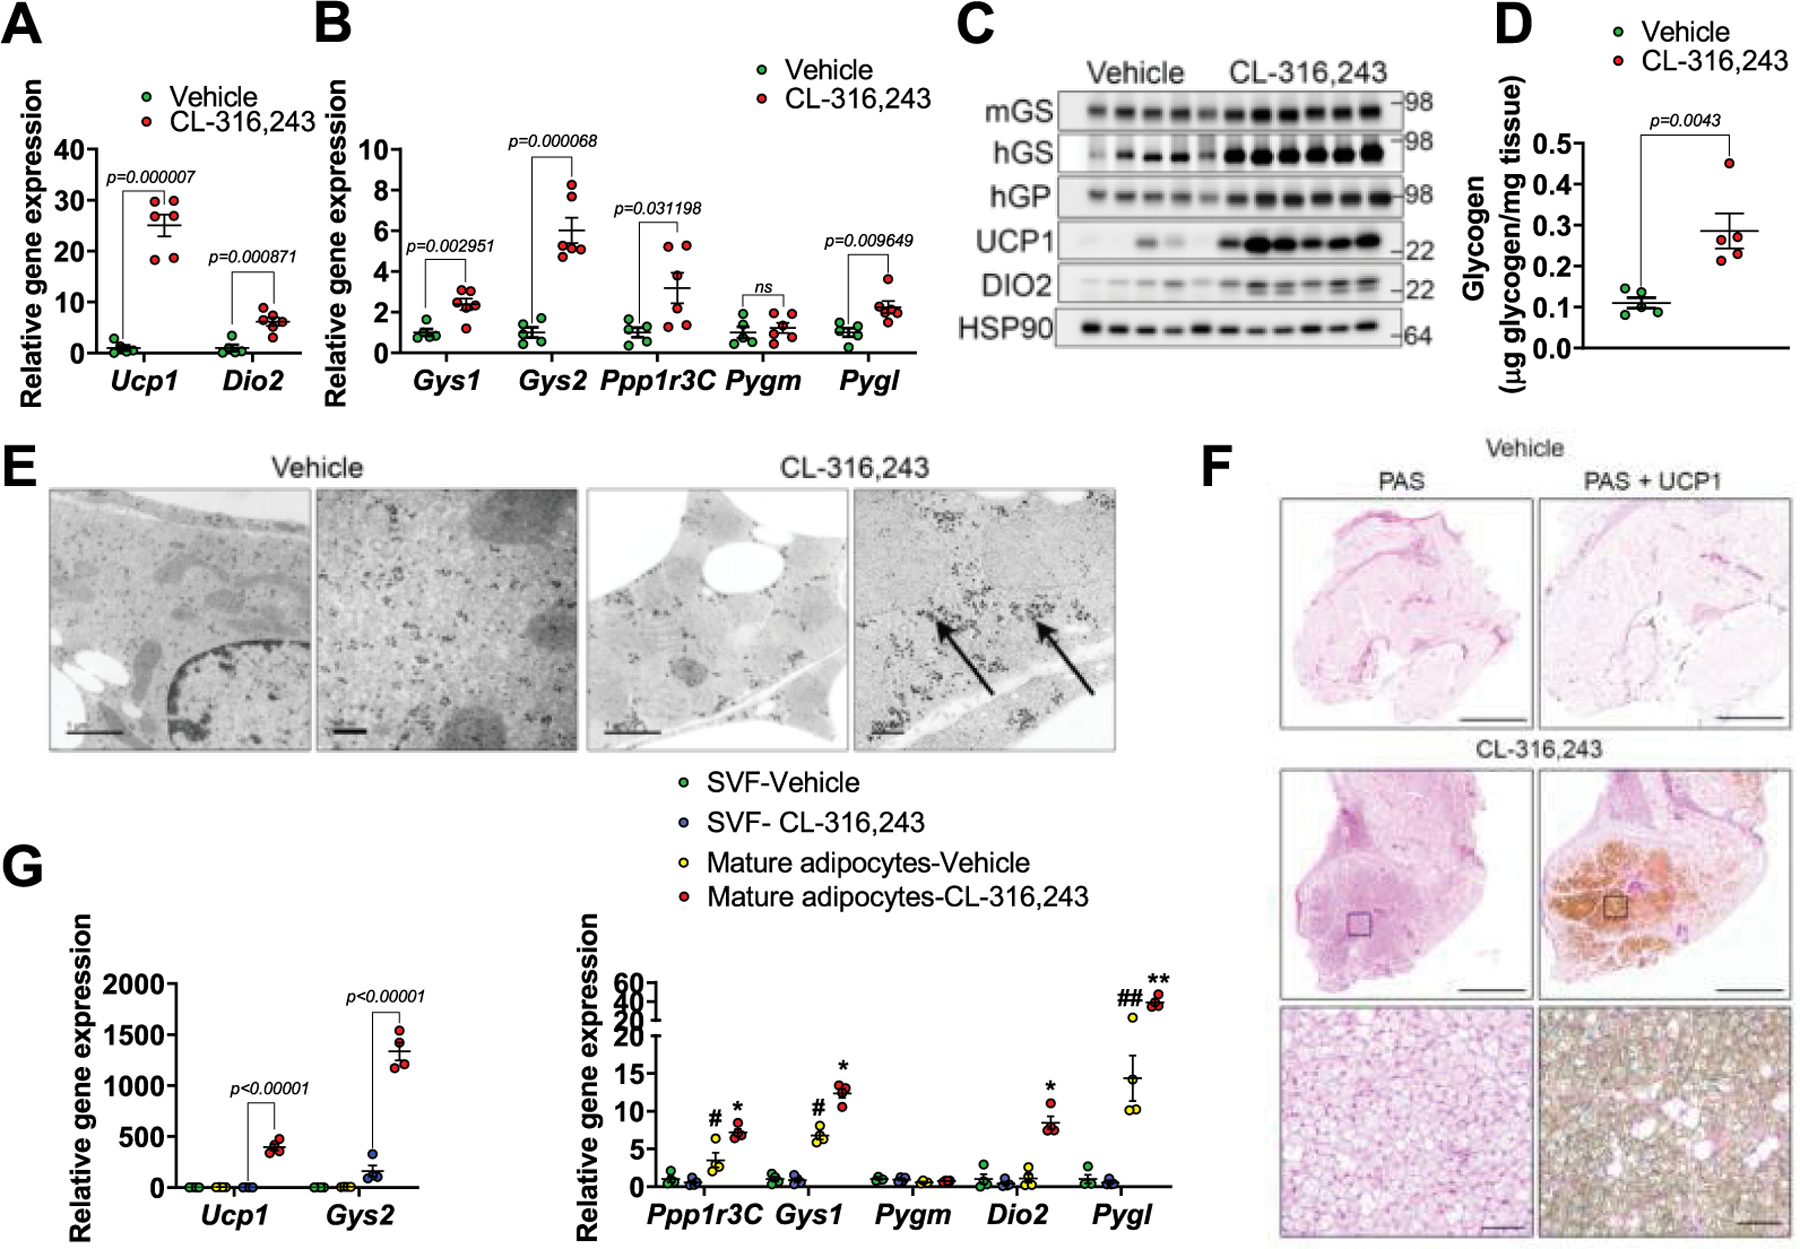
a, b, Gene expression in iWAT from mice treated with either vehicle or CL-316,243 for. 7 days. n = 5 mice (vehicle) and 6 mice (CL-316,243). c, Protein expression in mice treated as in a, n = 5 mice (vehicle) and 6 mice (CL-316,243). d, Glycogen levels in iWAT of vehicle or CL-316,243 treated mice, n = 4 mice (vehicle) and 5 mice (CL-316,243). e, Electron micrographs of iWAT from vehicle or CL-316,243 treated mice. Arrows point to glycogen granules. Scale bar, Left two images − 1 μm, right two images – 260 nm. Shown are representative images of tissues from 6 different mice (3 vehicle and 3 Cl-316,243). f, Periodic acid-Schiff (PAS) staining for glycogen and UCP1 immunostaining in iWAT of vehicle or CL-316,243 treated miceUcp1. Right panels show a higher magnification of areas marked by a square. Scale bars, 4 left images – 2 mm, high magnification images – 100μm. Shown are representative images of tissues from 6 different mice (3 vehicle and 3 Cl-316,243). g, Gene expression in iWAT-derived stromal-vascular fraction and primary mature adipocytes from vehicle or CL-316,243 treated mice n = 4 biological replicates per treatment. Data are presented as mean ± s.e.m. *P < 0.05, **P < 0.01, ***P < 0.001. #P < 0.05, ##P < 0.01. *Significance between vehicle and CL-316,243 treatment. #Significance between SVF and vehicle treated mature adipocytes. Statistical significance for a, b and d was determined by two-sided t-test, two-way ANOVA with adjustments for multiple comparisons was used for g.
Extended Data Fig. 2 |. CL-316,243 treatment does not affect the expression of glycogen metabolizing genes in BAT.
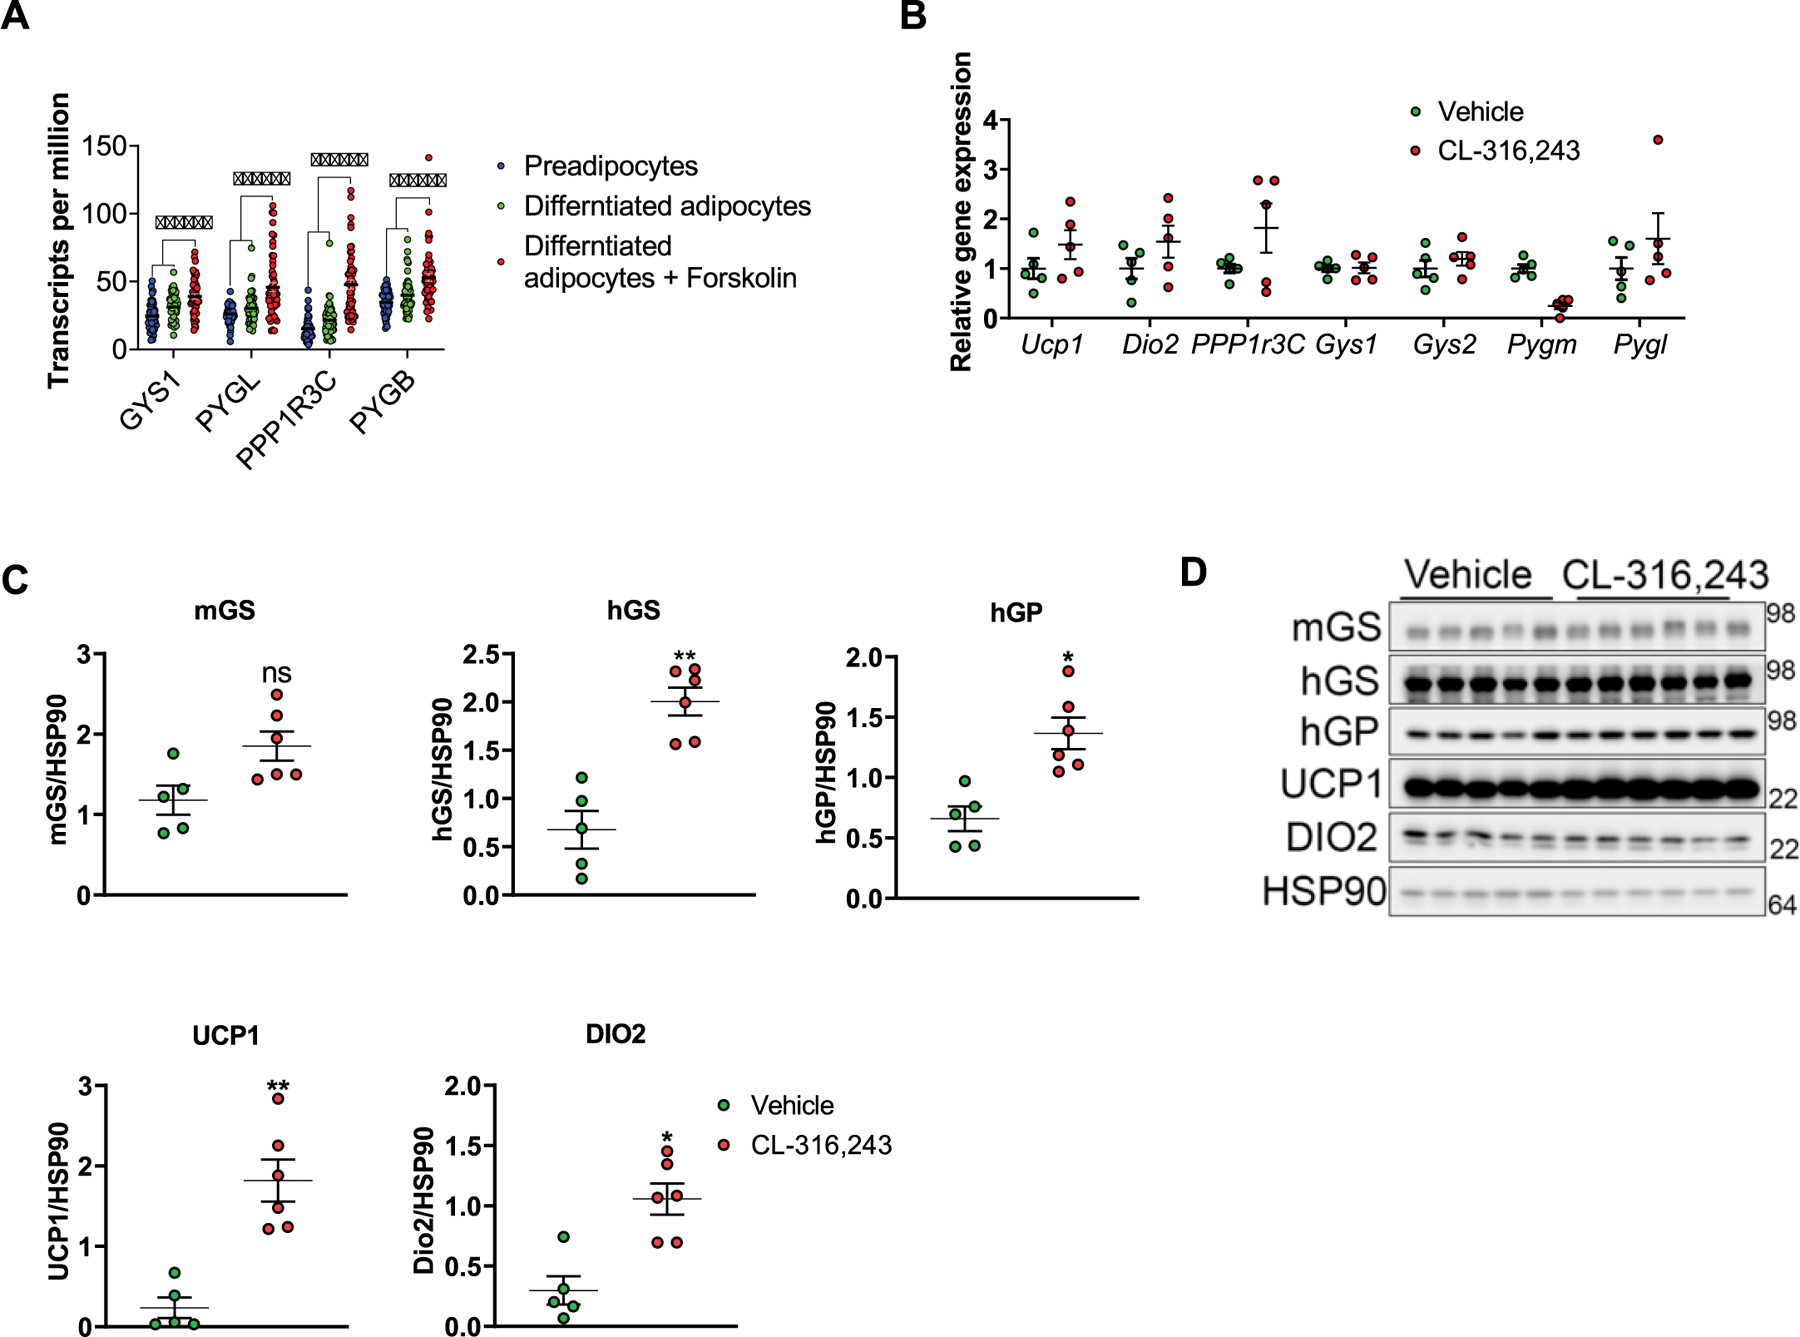
a, gene expression in human preadipocytes, differentiated adipocytes or differentiated adipocytes treated with forskolin for 3 days. n = 52 biological replicates per treatment. Statistical significance was determined using two-way ANOVA with adjustments for multiple comparisons, ***-p < 0.001. b, Mice were treated with either vehicle or CL-316,243 for 7 days. Gene expression in BAT was determined using qPCR, n = 5 mice per treatment. c, Quantification of protein expression data shown in Extended Data Fig. 1C (main text), expression was normalized to HSP90. n = 5 mice ( Vehicle), n = 6 mice (CL-316,243). Statistical significance was determined using two-sided t-test. d, Protein expression in BAT from mice treated as in b was determined by SDS-PAGE, n = 5 mice (vehicle), n = 6 mice (CL-316,243). No statistical significance detected. Data in a–c are presented as mean ± s.e.m.
Extended Data Fig. 3 |. PTG-KO does not affect the response to CL-316,243.
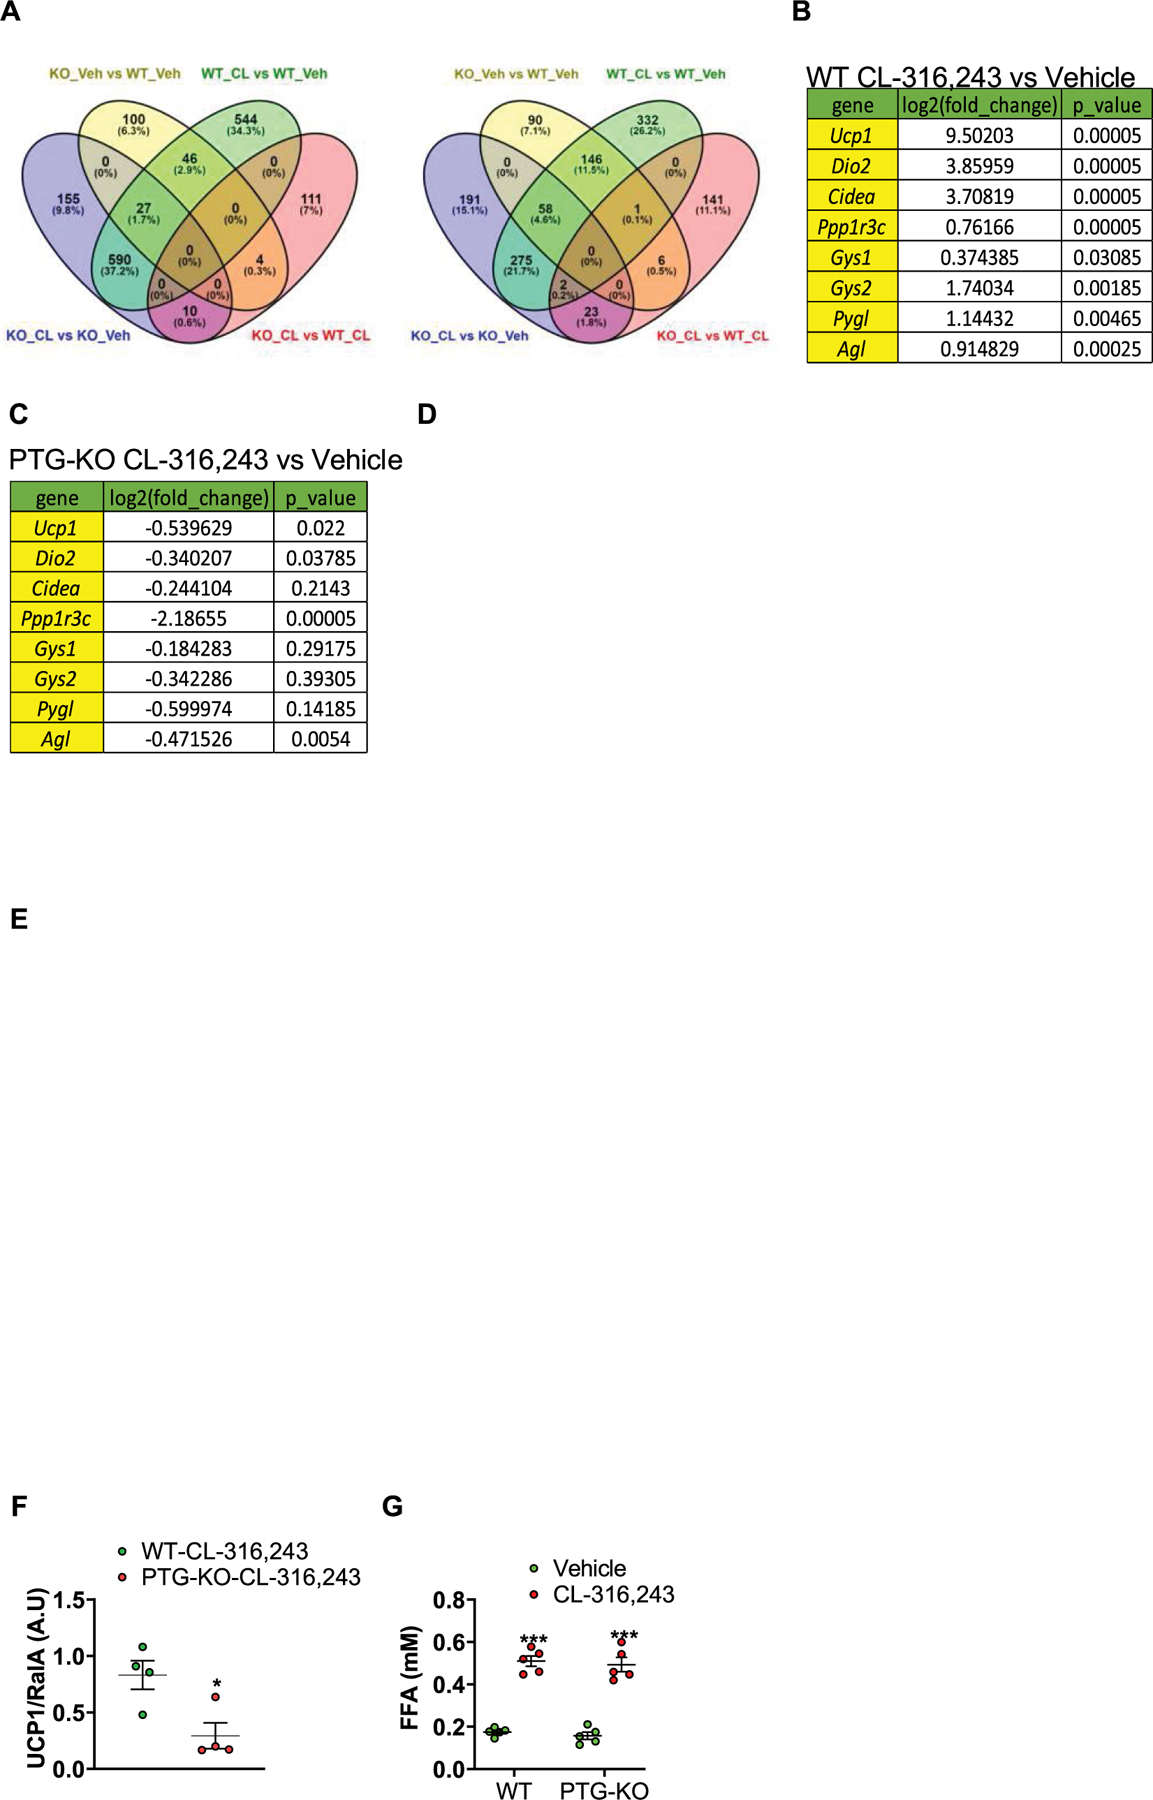
a-e, RNAseq data from iWAT-derived mature adipocytes of WT and PTG-KO mice treated with either vehicle or CL-316,243, n =3. a, Differential gene expression analyses of RNAseq data. b, Log2 of fold change of gene expression of CL-316,243 treated WT mice versus vehicle-treated WT mice. Statistical significance was determined using two-sided t-test. c, Log2 of fold change of gene expression of CL-316,243 treated PTG-KO mice versus vehicle treated PTG-KO mice. Statistical significance was determined using two-sided t-test. d, e, Pathway analyses of RNAseq were conducted using Gene Set Enrichment Analysis. f, Quantification of UCP1 protein expression data shown in Fig. 1f (main text), expression was normalized to RalA. n = 4 mice per treatment. Statistical significance was determined using two-sided t-test. g, Serum FFA levels in WT and PTG-KO mice treated with either vehicle or CL-316,243 for 20 min, n = 5 mice per genotype per treatment. Statistical significance was determined using two-way ANOVA with adjustments for multiple comparisons. Data are presented as mean ± s.e.m. *-p < 0.05. ***-p < 0.001. Accession number to cite these SRA data: PRJNA752350.
Extended Data Fig. 4 |. Adipose specific PTG-KO reduces energy expenditure.
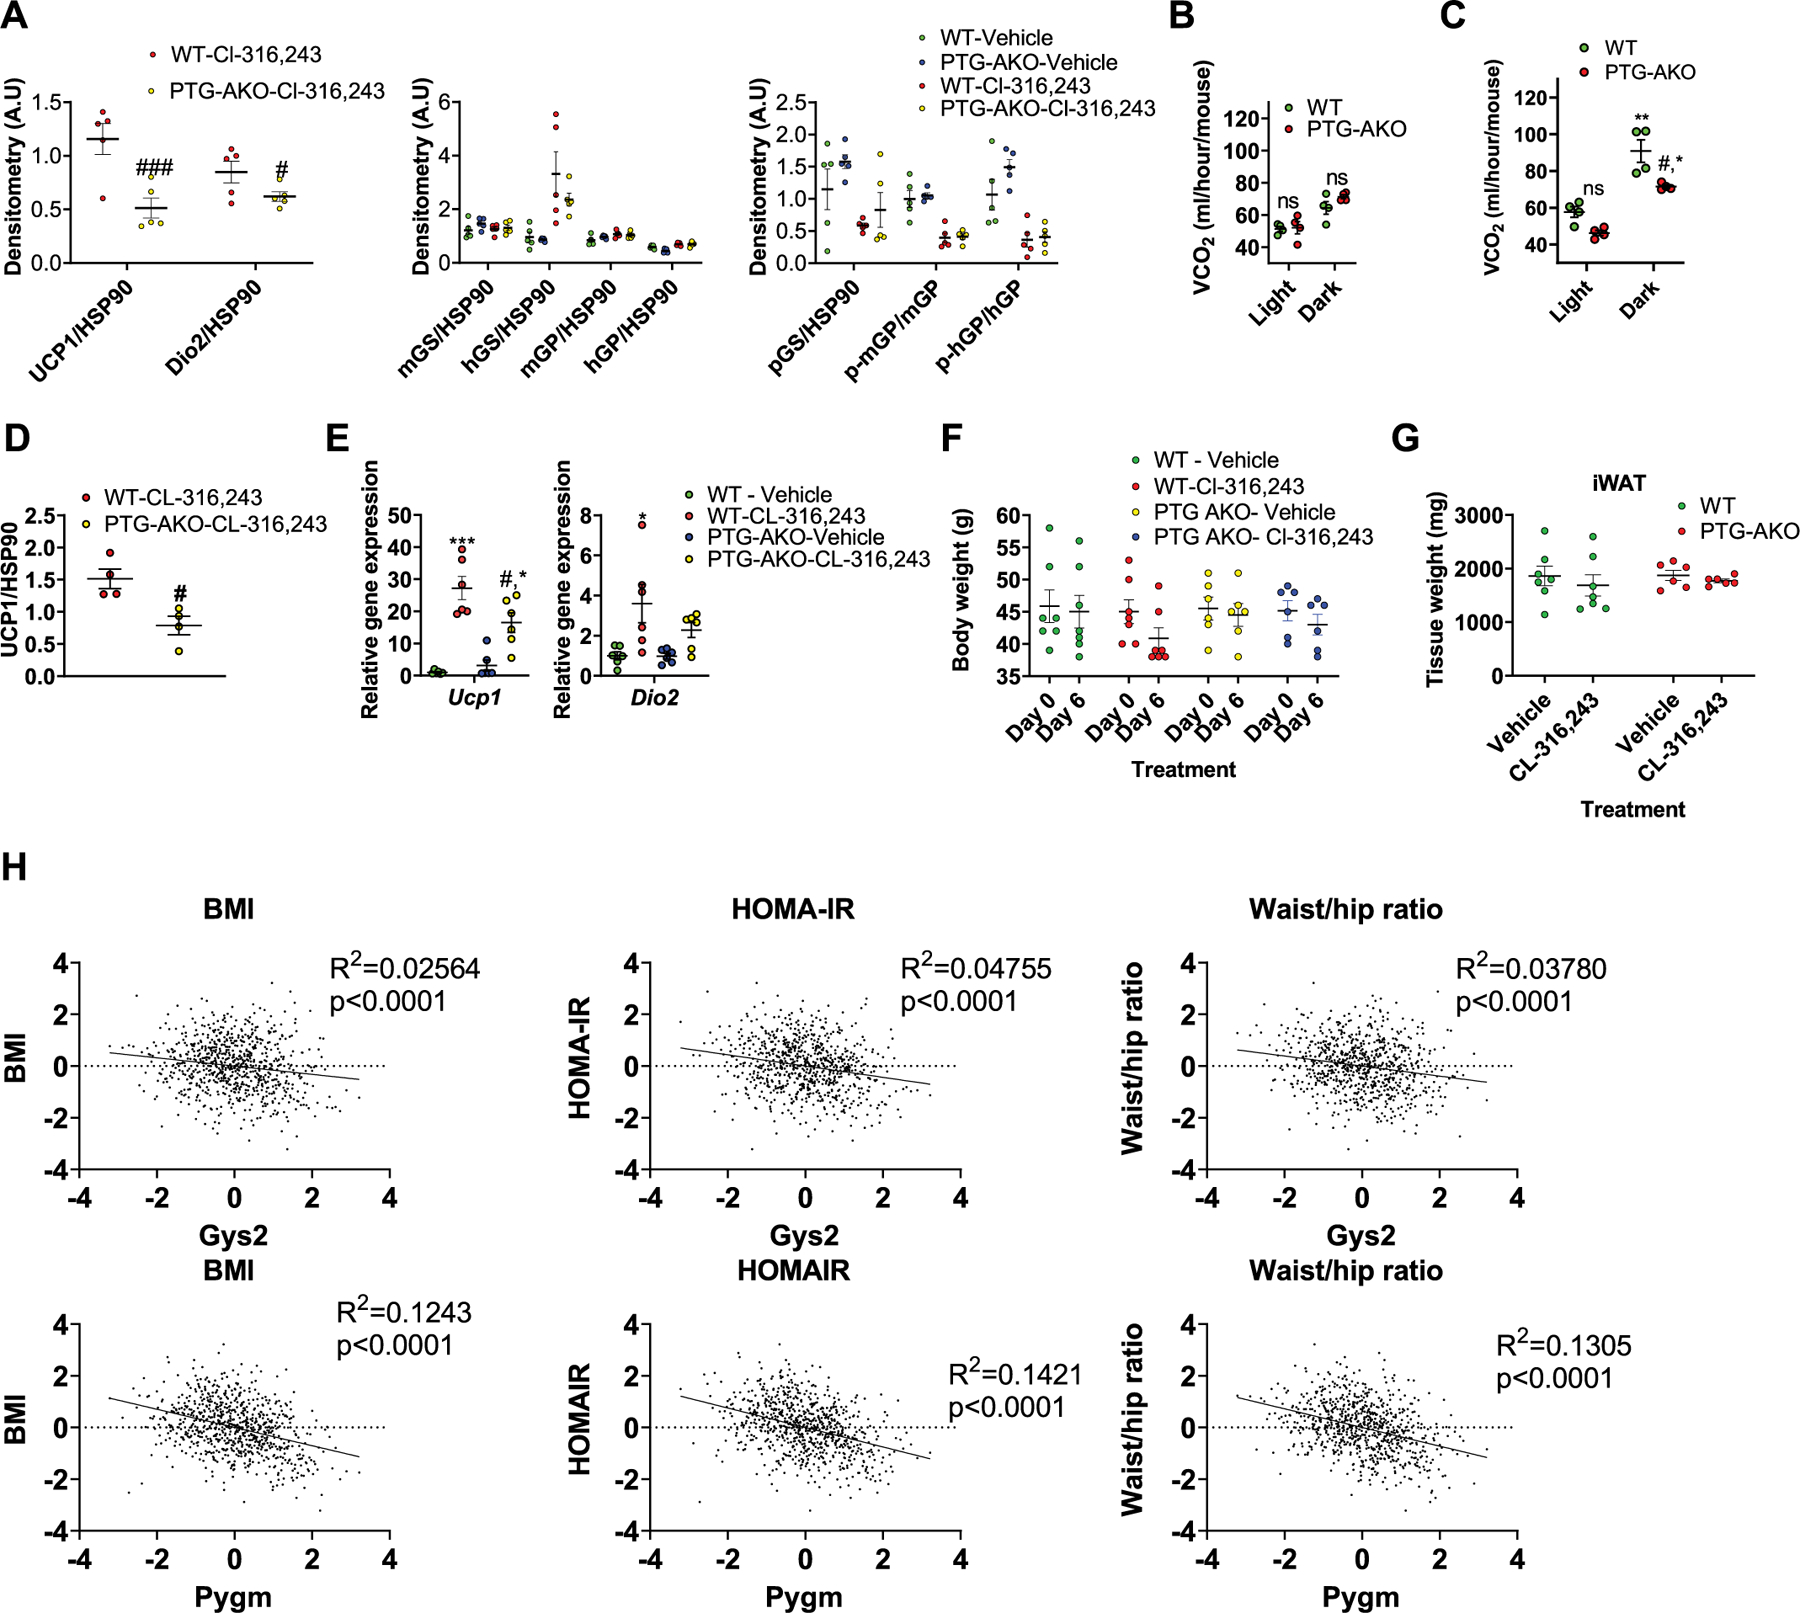
a, Quantification of protein expression data shown in Fig. 2a (main text), expression was normalized to HSP90. n = 5 mice per treatment per genotype. b, c, Carbon dioxide production (VCO2) in WT and PTG-AKO mice treated with CL-316,243. n = 4 mice per treatment per genotype. b, Average VCO2 over the first three days of CL-316,243 treatment. c, Average VCO2 during days 4–7 of CL-316,243 treatment. d, Quantification of UCP1 protein expression data shown in Fig. 2e (main text), expression was normalized to HSP90. n = 4 mice per treatment per genotype. e, Gene expression in iWAT of WT and PTG-AKO mice fed HFD for three months and then treated with either vehicle or CL-316,243 for 7 days. n = 6 mice per treatment per genotype. f, Body weight of WT and PTG-AKO mice fed HFD for three months before (day 0) and after 7 days (day 6) daily injections of Cl-316,243. n = 7 mice (WT), n = 6 mice (PTG-AKO). g, Weight of the inguinal white adipose tissue of WT and PTG-AKO mice fed HFD for three months and then treated for 7 days with either vehicle or Cl-316,243. n = 7 mice (WT), n = 6 mice (PTG-AKO). h, Linear regression analysis on anthropometric measurements in relation to gene expression from adipose tissue of 770 men. Data are presented as mean ± s.e.m. Statistical significance determined by two-way ANOVA with adjustments for multiple comparisons. *P < 0.05, **P < 0.01, ***P < 0.001. #P < 0.05. * - significance between vehicle and Cl-316–243 treatment within the same genotype. #- significance between WT and PTG-AKO mice treated with CL-316,243.
Extended Data Fig. 5 |. Overexpression of PTG increases UCP1 expression in vitro.
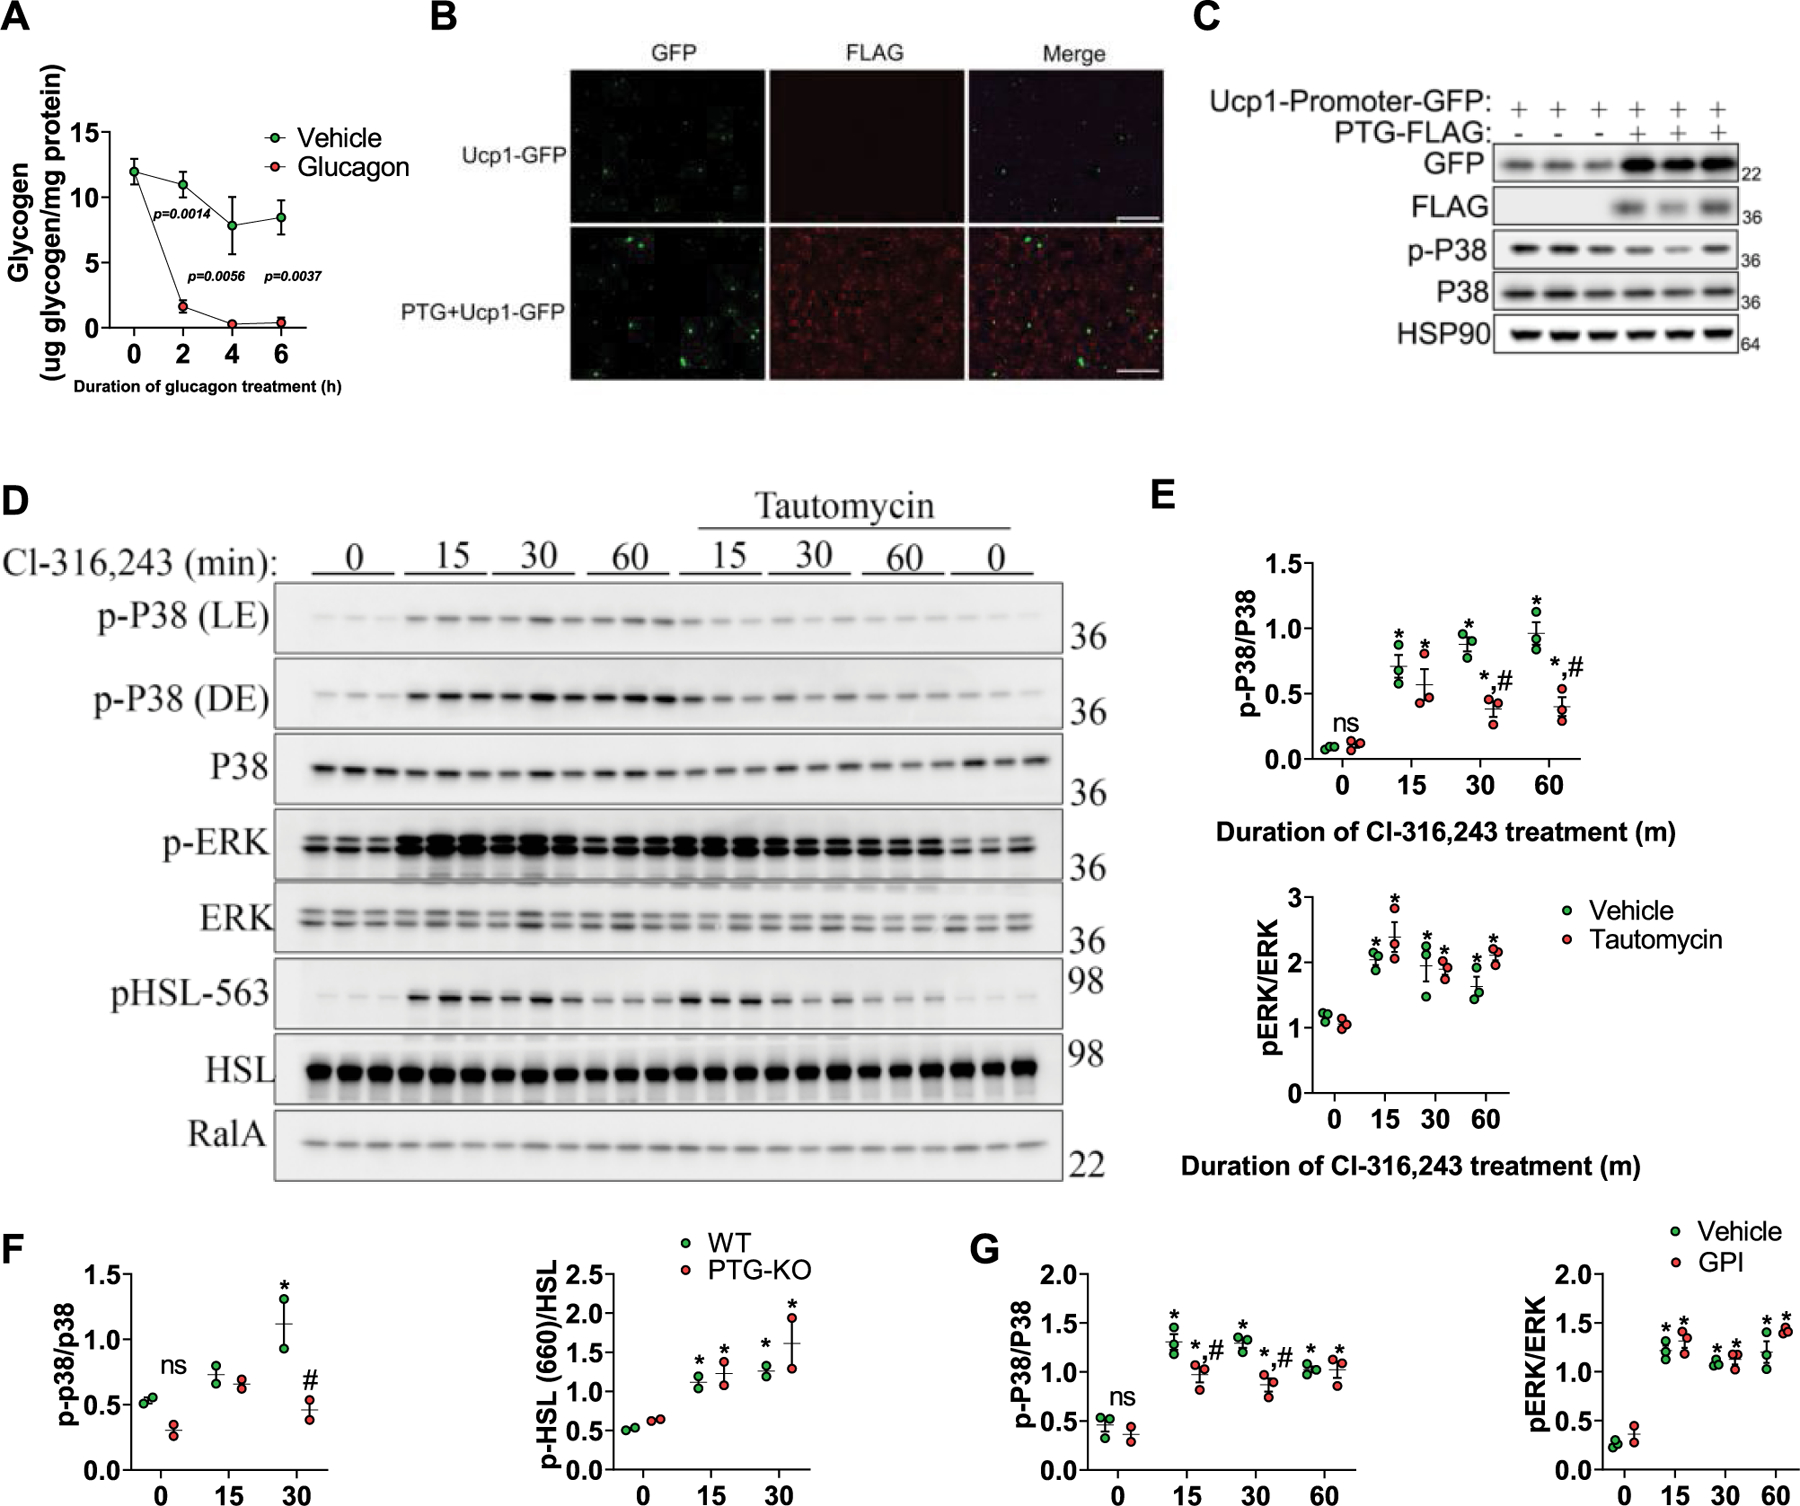
a, Glycogen levels in mouse primary hepatocytes treated with either vehicle or glucagon (10nM). n = 2 biological replicates per treatment. b, c, HEK-293t cells transfected with a Ucp1-promoter-driven turbo-GFP (Ucp1-GFP) alone or with FLAG tagged PTG (PTG-FLAG). b, Images of transfected cells were acquired using the Nikon eclipse Ts2R microscope. Shown are representative images from 3 independent experiments. Scale bar − 1μm. c, GFP expression levels were determined by western blot. d, Preadipocytes were treated with either Cl-316,243 alone or in combination with Tautomycin. Protein expression was determined by western blot. n = 3 biological replicates per treatment. e, Quantification of protein expression data shown in D. n = 3 biological replicates per treatment. f, Quantification of protein expression data shown in Fig. 3e (main text). n = 2 biological replicates per treatment per genotype. g, Quantification of protein expression data shown in Fig. 3g (main text). n =3 biological replicates per treatment. Data are presented as mean ± s.e.m. Statistical significance was determined using two-way ANOVA with adjustments for multiple comparisons. *P < 0.05, **P < 0.01. #P < 0.05. * - Significance between the zero time point and Glucagon/Cl-316,243 treatment within the same genotype. # - Significance between genotypes within the same time point.
Extended Data Fig. 6 |. Glycogen metabolism affects ROS production in response to Cl-316,243.
a, Quantification of protein expression data shown in Fig. 4c (main text). n = 2 biological replicates per treatment. Data are presented as mean ± s.e.m. Statistical significance was determined using two-way ANOVA with adjustments for multiple comparisons. *P < 0.05, **P < 0.01, ***P < 0.001. #P < 0.05. * - Significance between the zero time point and the assigned time point within the same treatment. # - Significance between different vehicle and NAC treatments within the same time point. b and c, Global cysteine oxidation in preadipocytes treated with either vehicle or Cl-316,243 (b) or Cl-316,243 alone or in combination with GPI (c), was determined as described in the methods section. b, Blue dots represent proteins with higher cysteine oxidation in vehicle-treated cells, red dots represent proteins with higher cysteine oxidation in Cl-316,243 treated cells. c, Blue dots represent proteins with higher cysteine oxidation in Cl-316,243 treated cells, red dots represent proteins with higher cysteine oxidation in cells treated with Cl-316,243 in combination with GPI. Statistical significance was determined using two-sided t test, cysteine sites shown had at least 5% change between treatments with a p < 0.05.
Extended Data Fig. 7 |. PTG-KO reduces energy expenditure during long term cold adaptation.
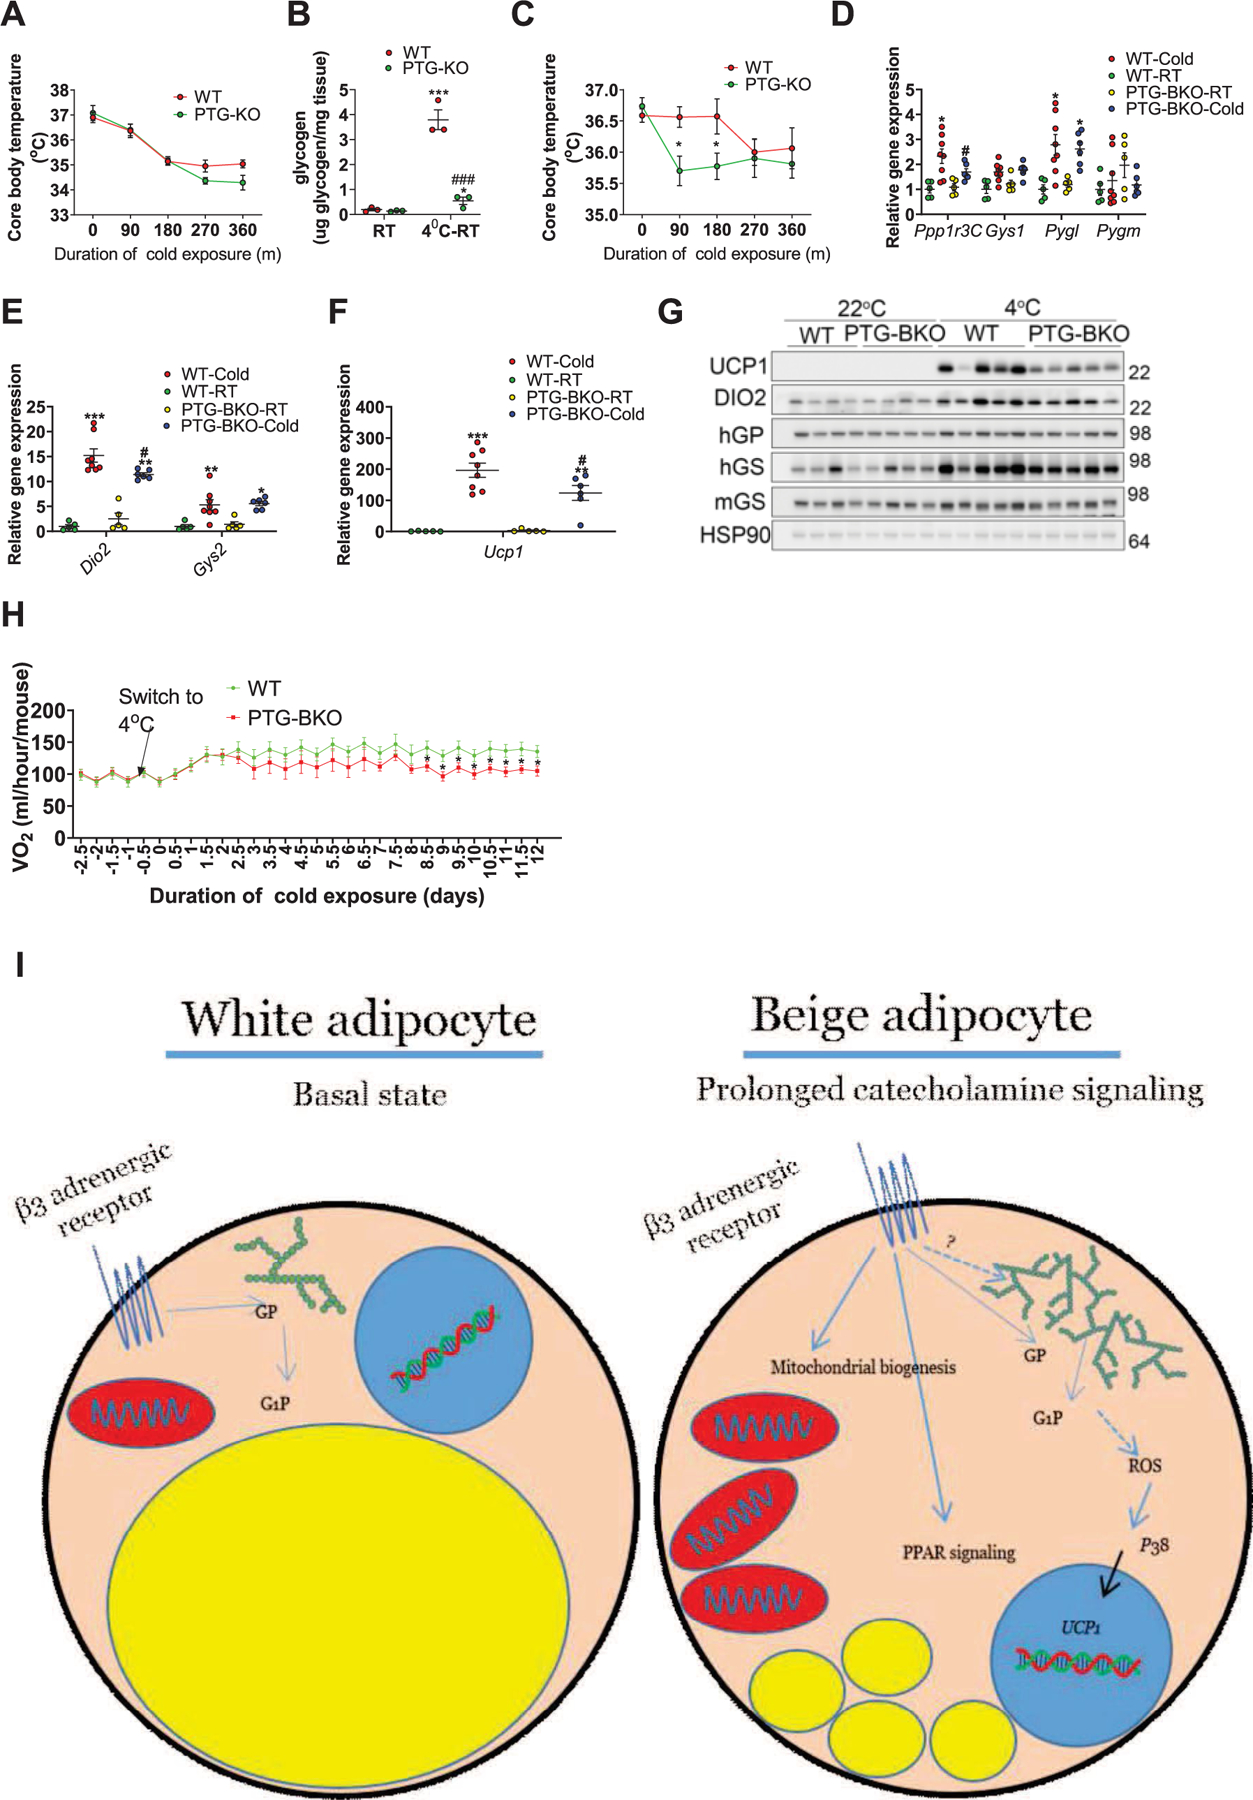
a, Core body temperature of WT and PTG-KO mice measured every 90 min during an acute cold exposure (4 °C), n = 8 mice per genotype. b, Brown adipose tissue glycogen levels in WT and PTG-KO mice at room temperature (RT) or cold exposed for 6 h and allowed to recover for 4 h at RT (4 °C-RT), n = 3 mice per genotype per condition. c, Core body temperature during a second cold exposure in WT and PTG-KO mice that were first cold exposed for 6 h and allowed to recover at room temperature for 4 h, n = 8 mice per genotype. d, e and f, gene expression in iWAT of WT and PTG-BKO mice housed either at room temperature or subjected to prolonged cold adaptation (7 days at 18 °C followed by 14 days at 4 °C), n = 8 mice per genotype. g, Protein expression in iWAT of the mice described in d, n = 5 mice per genotype. h, Oxygen consumption (VO2) in WT and PTG-BKO mice before and during prolonged cold adaptation n = 8 mice per genotype. i, Working model. Acute activation of the β3-adrenergic receptor in white adipocytes results in lipolysis and glycogenolysis through the activation of PKA and subsequent activation of HSL and GP respectively. Prolonged β3-adrenergic receptor activation results in enhanced glycogen accumulation turnover which is required for ROS-dependent p38 activation and the subsequent expression of Ucp1. Data are presented as mean ± s.e.m. Statistical significance was determined two-way ANOVA with adjustments for multiple comparisons. *P < 0.05, **P < 0.01. #P < 0.05. * - significance between room temperature and cold exposure within the same genotype. #- significance between WT and PTG-KO/PTG-BKO with the same treatment.
Extended Data Fig. 8 |. Increased expression of BAT-Ucp1 following long-term cold exposure does not require PTG.
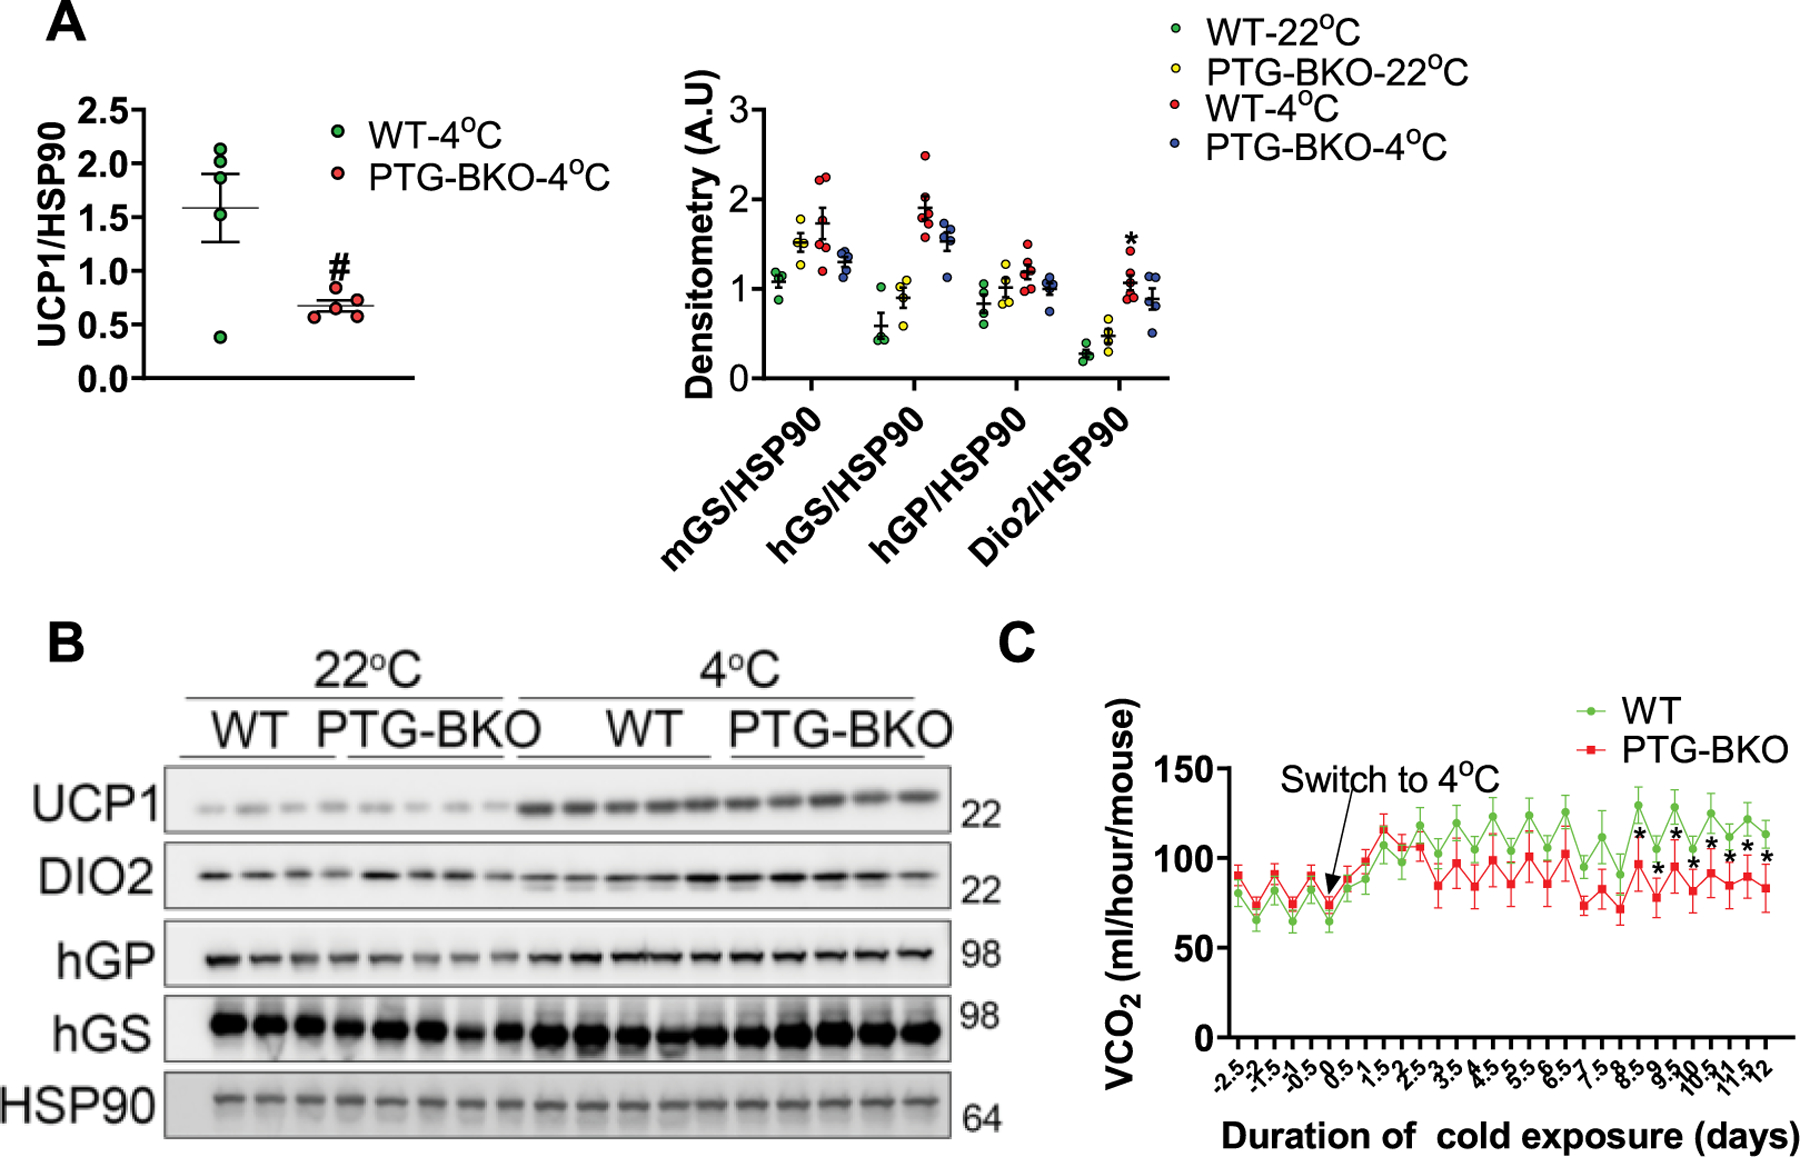
a, Quantification of protein expression data shown in Extended Data Fig. 7 (main text). n = 5 mice per genotype. b, Protein expression levels in BAT of WT and PTG-BKO mice housed either at room temperature or subjected to prolonged cold adaptation was determined by SDS-PAGE, n (22 °C) = 4, n (4 °C) = 5. c carbon dioxide production (VCO2) in WT and PTG-BKO mice before and during prolonged cold adaptation. n = 8 mice per genotype. Data are presented as mean ± s.e.m. Statistical significance was determined using two-sided t test (A) or two way ANOVA with adjustments for multiple comparisons (C). *P < 0.05. #P < 0.05. * - Significance between 4 °C and 22 °C within the same genotype. # - Significance between different genotypes within the same time point.
Supplementary Material
Acknowledgements
We thank members of Saltiel laboratory at UCSD for helpful discussions, comments and suggestions and the UCSD histology core for tissue sectioning and staining. The authors are supported by 1R01 DK117850 and 1R01 HL147883 (A.J.L.); American Diabetes Association no. 1-19-PDF-177 (M.A.-O.); American Diabetes Association grant no. 1-19-JDF-012 (S.M.R.); F32DK124947 (J.M.V.); DK057978 and DK120480 (R.M.E.); R01DK117551, R01DK125820 and R01DK076906 (A.R.S.); and P30 DK063491 (R.M.E. and A.R.S.). E.T.C. is supported by Claudia Adams Barr Program, the Lavine Family Fund and NIH DK123095. H.X. is supported by a postdoctoral fellowship from the National Cancer Center.
Footnotes
Online content
Any methods, additional references, Nature Research reporting summaries, source data, extended data, supplementary information, acknowledgements, peer review information; details of author contributions and competing interests; and statements of data and code availability are available at https://doi.org/10.1038/s41586-021-04019-8.
Reporting summary
Further information on research design is available in the Nature Research Reporting Summary linked to this paper.
Competing interests The authors declare no competing interests.
Additional information
Supplementary information The online version contains supplementary material available at https://doi.org/10.1038/s41586-021-04019-8.
Peer review information Nature thanks the anonymous reviewer(s) for their contribution to the peer review of this work.
Data availability
RNA-seq data reported in this paper have been deposited in the National Center for Biotechnology Information (NCBI) Sequence Read Archive48 database under BioProject PRJNA752350.
References
- 1.Ikeda K & Yamada T UCP1 dependent and independent thermogenesis in brown and beige adipocytes. Front. Endocrinol 11, 498 (2020). [DOI] [PMC free article] [PubMed] [Google Scholar]
- 2.Wu J et al. Beige adipocytes are a distinct type of thermogenic fat cell in mouse and human. Cell 150, 366–376 (2012). [DOI] [PMC free article] [PubMed] [Google Scholar]
- 3.Kusminski CM, Bickel PE & Scherer PE Targeting adipose tissue in the treatment of obesity-associated diabetes. Nat. Rev. Drug Discov 15, 639–660 (2016). [DOI] [PubMed] [Google Scholar]
- 4.Saltiel AR New therapeutic approaches for the treatment of obesity. Sci. Transl. Med 8, 323rv2 (2016). [DOI] [PubMed] [Google Scholar]
- 5.Dobin A et al. STAR: ultrafast universal RNA-seq aligner. Bioinformatics 29, 15–21 (2013). [DOI] [PMC free article] [PubMed] [Google Scholar]
- 6.Oelkrug R, Polymeropoulos ET & Jastroch M Brown adipose tissue: physiological function and evolutionary significance. J. Comp. Physiol. B 185, 587–606 (2015). [DOI] [PubMed] [Google Scholar]
- 7.Thyagarajan B & Foster MT Beiging of white adipose tissue as a therapeutic strategy for weight loss in humans. Horm. Mol. Biol. Clin. Investig 31, 0016 (2017). [DOI] [PubMed] [Google Scholar]
- 8.Ikeda K et al. UCP1-independent signaling involving SERCA2b-mediated calcium cycling regulates beige fat thermogenesis and systemic glucose homeostasis. Nat. Med 23, 1454–1465 (2017). [DOI] [PMC free article] [PubMed] [Google Scholar]
- 9.Kazak L et al. A creatine-driven substrate cycle enhances energy expenditure and thermogenesis in beige fat. Cell 163, 643–655 (2015). [DOI] [PMC free article] [PubMed] [Google Scholar]
- 10.Roach PJ, Depaoli-Roach AA, Hurley TD & Tagliabracci VS Glycogen and its metabolism: some new developments and old themes. Biochem. J 441, 763–787 (2012). [DOI] [PMC free article] [PubMed] [Google Scholar]
- 11.Brady MJ, Nairn AC & Saltiel AR The regulation of glycogen synthase by protein phosphatase 1 in 3T3-L1 adipocytes. Evidence for a potential role for DARPP-32 in insulin action. J. Biol. Chem 272, 29698–29703 (1997). [DOI] [PubMed] [Google Scholar]
- 12.Brady MJ & Saltiel AR The role of protein phosphatase-1 in insulin action. Recent Prog. Horm. Res 56, 157–173 (2001). [DOI] [PubMed] [Google Scholar]
- 13.Newgard CB, Brady MJ, O’Doherty RM & Saltiel AR Organizing glucose disposal: emerging roles of the glycogen targeting subunits of protein phosphatase-1. Diabetes 49, 1967–1977 (2000). [DOI] [PubMed] [Google Scholar]
- 14.Printen JA, Brady MJ & Saltiel AR PTG, a protein phosphatase 1-binding protein with a role in glycogen metabolism. Science 275, 1475–1478 (1997). [DOI] [PubMed] [Google Scholar]
- 15.Chandler AM & Moore RO Glycogen deposition in adipose tissue: variations in levels of glycogen-cycle enzymes during fasting and refeeding. Arch. Biochem. Biophys 108, 183–192 (1964). [DOI] [PubMed] [Google Scholar]
- 16.Carmean CM, Bobe AM, Yu JC, Volden PA & Brady MJ Refeeding-induced brown adipose tissue glycogen hyper-accumulation in mice is mediated by insulin and catecholamines. PLoS ONE 8, e67807 (2013). [DOI] [PMC free article] [PubMed] [Google Scholar]
- 17.Min SY et al. Diverse repertoire of human adipocyte subtypes develops from transcriptionally distinct mesenchymal progenitor cells. Proc. Natl Acad. Sci. USA 116, 17970–17979 (2019). [DOI] [PMC free article] [PubMed] [Google Scholar]
- 18.Arner E et al. Adipose tissue microRNAs as regulators of CCL2 production in human obesity. Diabetes 61, 1986–1993 (2012). [DOI] [PMC free article] [PubMed] [Google Scholar]
- 19.Civelek M et al. Genetic regulation of adipose gene expression and cardio-metabolic traits. Am. J. Hum. Genet 100, 428–443 (2017). [DOI] [PMC free article] [PubMed] [Google Scholar]
- 20.Cao W et al. p38 mitogen-activated protein kinase is the central regulator of cyclic AMP-dependent transcription of the brown fat uncoupling protein 1 gene. Mol. Cell. Biol 24, 3057–3067 (2004). [DOI] [PMC free article] [PubMed] [Google Scholar]
- 21.Ito K et al. Reactive oxygen species act through p38 MAPK to limit the lifespan of hematopoietic stem cells. Nat. Med 12, 446–451 (2006). [DOI] [PubMed] [Google Scholar]
- 22.Noguchi T et al. Requirement of reactive oxygen species-dependent activation of ASK1-p38 MAPK pathway for extracellular ATP-induced apoptosis in macrophage. J. Biol. Chem 283, 7657–7665 (2008). [DOI] [PubMed] [Google Scholar]
- 23.Thomas SA & Palmiter RD Thermoregulatory and metabolic phenotypes of mice lacking noradrenaline and adrenaline. Nature 387, 94–97 (1997). [DOI] [PubMed] [Google Scholar]
- 24.Markan KR, Jurczak MJ & Brady MJ Stranger in a strange land: roles of glycogen turnover in adipose tissue metabolism. Mol. Cell. Endocrinol 318, 54–60 (2010). [DOI] [PMC free article] [PubMed] [Google Scholar]
- 25.Wertheimer E Glycogen in adipose tissue. J. Physiol 103, 359–366 (1945). [DOI] [PMC free article] [PubMed] [Google Scholar]
- 26.Kobayashi M, Soman G & Graves DJ A comparison of the activator sites of liver and muscle glycogen phosphorylase b. J. Biol. Chem 257, 14041–14047 (1982). [PubMed] [Google Scholar]
- 27.Merlin J et al. The PPARγ agonist rosiglitazone promotes the induction of brite adipocytes, increasing beta-adrenoceptor-mediated mitochondrial function and glucose uptake. Cell Signal 42, 54–66 (2018). [DOI] [PubMed] [Google Scholar]
- 28.Jia YT et al. Activation of p38 MAPK by reactive oxygen species is essential in a rat model of stress-induced gastric mucosal injury. J. Immunol 179, 7808–7819 (2007). [DOI] [PubMed] [Google Scholar]
- 29.Emerling BM et al. Mitochondrial reactive oxygen species activation of p38 mitogen-activated protein kinase is required for hypoxia signaling. Mol. Cell. Biol 25, 4853–4862 (2005). [DOI] [PMC free article] [PubMed] [Google Scholar]
- 30.Ro SH et al. Sestrin2 inhibits uncoupling protein 1 expression through suppressing reactive oxygen species. Proc. Natl Acad. Sci. USA 111, 7849–7854 (2014). [DOI] [PMC free article] [PubMed] [Google Scholar]
- 31.Cao W, Medvedev AV, Daniel KW & Collins S β-Adrenergic activation of p38 MAP kinase in adipocytes: cAMP induction of the uncoupling protein 1 (UCP1) gene requires p38 MAP kinase. J. Biol. Chem 276, 27077–27082 (2001). [DOI] [PubMed] [Google Scholar]
- 32.Hattori K et al. ASK1 signalling regulates brown and beige adipocyte function. Nat. Commun 7, 11158 (2016). [DOI] [PMC free article] [PubMed] [Google Scholar]
- 33.Forrester SJ, Kikuchi DS, Hernandes MS, Xu Q & Griendling KK Reactive oxygen species in metabolic and inflammatory signaling. Circ. Res 122, 877–902 (2018). [DOI] [PMC free article] [PubMed] [Google Scholar]
- 34.Jastroch M Uncoupling protein 1 controls reactive oxygen species in brown adipose tissue. Proc. Natl Acad. Sci. USA 114, 7744–7746 (2017). [DOI] [PMC free article] [PubMed] [Google Scholar]
- 35.Chouchani ET et al. Mitochondrial ROS regulate thermogenic energy expenditure and sulfenylation of UCP1. Nature 532, 112–116 (2016). [DOI] [PMC free article] [PubMed] [Google Scholar]
- 36.Crosson SM, Khan A, Printen J, Pessin JE & Saltiel AR PTG gene deletion causes impaired glycogen synthesis and developmental insulin resistance. J. Clin. Invest 111, 1423–1432 (2003). [DOI] [PMC free article] [PubMed] [Google Scholar]
- 37.Reilly SM et al. Catecholamines suppress fatty acid re-esterification and increase oxidation in white adipocytes via STAT3. Nat. Metab 2, 620–634 (2020). [DOI] [PMC free article] [PubMed] [Google Scholar]
- 38.Smets FN, Chen Y, Wang LJ & Soriano HE Loss of cell anchorage triggers apoptosis (anoikis) in primary mouse hepatocytes. Mol. Genet. Metab 75, 344–352 (2002). [DOI] [PubMed] [Google Scholar]
- 39.Lu B, et al. Metabolic crosstalk: molecular links between glycogen and lipid metabolism in obesity. Diabetes 63, 2935–2948 (2014). [DOI] [PMC free article] [PubMed] [Google Scholar]
- 40.Xiao H et al. A quantitative tissue-specific landscape of protein redox regulation during aging. Cell 180, 968–83.e24 (2020). [DOI] [PMC free article] [PubMed] [Google Scholar]
- 41.Navarrete-Perea J, Yu Q, Gygi SP & Paulo JA Streamlined tandem mass tag (SL-TMT) protocol: an efficient strategy for quantitative (phospho)proteome profiling using tandem mass tag-synchronous precursor selection-MS3. J. Proteome Res 17, 2226–2236 (2018). [DOI] [PMC free article] [PubMed] [Google Scholar]
- 42.Schweppe DK et al. Characterization and optimization of multiplexed quantitative analyses using high-field asymmetric-waveform ion mobility mass spectrometry. Anal. Chem 91, 4010–4016 (2019). [DOI] [PMC free article] [PubMed] [Google Scholar]
- 43.McAlister GC et al. MultiNotch MS3 enables accurate, sensitive, and multiplexed detection of differential expression across cancer cell line proteomes. Anal. Chem 86, 7150–7158 (2014). [DOI] [PMC free article] [PubMed] [Google Scholar]
- 44.Eng JK, Jahan TA & Hoopmann MR Comet: an open-source MS/MS sequence database search tool. Proteomics 13, 22–24 (2013). [DOI] [PubMed] [Google Scholar]
- 45.Elias JE & Gygi SP Target-decoy search strategy for increased confidence in large-scale protein identifications by mass spectrometry. Nat. Methods 4, 207–214 (2007). [DOI] [PubMed] [Google Scholar]
- 46.Huttlin EL et al. A tissue-specific atlas of mouse protein phosphorylation and expression. Cell 143, 1174–1189 (2010). [DOI] [PMC free article] [PubMed] [Google Scholar]
- 47.Peng J, Elias JE, Thoreen CC, Licklider LJ & Gygi SP Evaluation of multidimensional chromatography coupled with tandem mass spectrometry (LC/LC-MS/MS) for large-scale protein analysis: the yeast proteome. J. Proteome Res 2, 43–50 (2003). [DOI] [PubMed] [Google Scholar]
- 48.Orian A et al. Structural motifs involved in ubiquitin-mediated processing of the NF-κB precursor p105: roles of the glycine-rich region and a downstream ubiquitination domain. Mol. Cell. Biol 19, 3664–3673 (1999). [DOI] [PMC free article] [PubMed] [Google Scholar]
Associated Data
This section collects any data citations, data availability statements, or supplementary materials included in this article.
Supplementary Materials
Data Availability Statement
RNA-seq data reported in this paper have been deposited in the National Center for Biotechnology Information (NCBI) Sequence Read Archive48 database under BioProject PRJNA752350.