Abstract
A fundamental factor in natural product drug discovery programs is the necessity to identify the active component(s) from complex chemical mixtures. Whereas this has traditionally been accomplished using bioassay-guided fractionation, we questioned whether alternative techniques could supplement and, in some cases, even supplant this approach. We speculated that a combination of ligand-fishing methods and modern analytical tools (e.g., LC-MS and online natural product databases) offered a route to enhance natural product drug discovery. Herein, a candidate solution referred to as the lickety-split ligand-affinity-based molecular angling system (LLAMAS) is described. This approach utilizes an ultrafiltration-based LC-PDA-MS/MS-guided DNA-binding assay in combination with the (i) Global Natural Products Social Molecular Networking, (ii) Dictionary of Natural Products, and (iii) SciFinder platforms to identify DNA binders in complex chemical mixtures. LLAMAS was initially vetted in tests using known small-molecule DNA binders and then optimized to a 96-well plate-based format. A set of 332 plant samples used in traditional Chinese medicine was screened for DNA-binding activity with LLAMAS, resulting in the identification of seven DNA-binding molecules, including berberine (12), palmatine (13), coptisine (14), fangchinoline (15), tetrandrine (16), daurisoline (17), and dauricine (18). These results demonstrate that LLAMAS is an effective natural product discovery platform for the efficient identification and dereplication of DNA-binding molecules from complex mixtures.
Graphical Abstract
Natural products are an important source of therapeutic drug leads due to the incredible diversity of their structures and bioactivities.1–3 Many of the success stories to emerge from natural product drug development are legendary: the discovery of the antibiotic penicillin in 1928,4 the identification and subsequent clinical approval of the anticancer drug Taxol (paclitaxel) in 1992,5 the development of the antimalarial drug artemisinin (a discovery that was acknowledged by the 2015 Nobel Prize in Physiology or Medicine),6 and more.7 These milestones in drug discovery established natural products as an unparalleled resource for identifying therapeutically useful compounds to combat a wide range of diseases.
Strikingly, a majority of these and other iconic natural products that are used as medicines1,8,9 were discovered using the well-established, yet powerful technique known as bioassay-guided purification.10,11 This approach relies on subjecting mixtures of compounds (e.g., extracts and fractions) to iterative steps of fractionation and biological testing with the underlying strategy aimed at reducing the chemical complexity of each sample until a single bioactive compound or group of bioactive substances is secured. This method is effective and intuitive and offers tremendous rigor as researchers parse complex natural product mixtures; however, it has also been criticized for some real and perceived weaknesses: the process is slower as compared to other library screening approaches (e.g., pure compound testing), and it requires researchers to carefully track and dereplicate bioactive compounds throughout the purification process.12 While some supporting techniques have been reported to enhance bioassay-guided purification strategies,13–15 few fundamental changes have occurred to alter this tenet of natural products drug discovery in over a century of use.16
The longevity of bioassay-guided purification in natural product drug discovery speaks volumes to its power; undoubtedly, this technique will remain a mainstay of the field for years to come. Yet natural product drug discovery has also witnessed many extraordinary technological advances including new tools and data resources that have the capacities to disrupt long-established practices like bioassay-guided purification.17–19 Our group sought to explore a variety of these emerging technologies not just as modifying agents to be used within existing drug discovery frameworks but rather as potentially transformative approaches that would function in parallel or, in some cases, even supplant the established paradigm of bioassay-guided purification.
One area where we see exceptional promise for enhancing natural product drug discovery is based on the concept of ligand fishing. Although this approach is not new,20 it is well positioned to take full advantage of the wealth of analytical tools and knowledge-based resources21–23 that have become available to natural products researchers. Ligand fishing offers two key features that make this approach an attractive alternative to classical bioassay-guided purification: (1) it allows researchers to condense multiple rounds of purification and bioassays into a single step, and (2) it can be used as a “target-forward” discovery tool for mechanism-guided bioactive compound discovery. These advantageous features are made possible because ligand fishing transforms the biological target into both the subject of the assay and a pseudosorbent for retaining compounds of interest.
Whereas a detailed review of drug discovery applications using ligand fishing is beyond the scope of this discussion,20,24 it is worth noting that this conceptual approach has been interpreted and applied in diverse ways, including within the field of natural products.20,25–28 Notwithstanding these accounts, we noted the relative dearth of reports pertaining to the utilization of DNA as a biological target in ligand-fishing-based studies despite its favorable history as a focal point for biomedical interventions.29–31 Considering our group’s collaborative interests in the discovery of natural products that selectively inhibit different types of pediatric and triple-negative breast cancers,32–36 we found this point intriguing given the expansive role that DNA-targeting agents have played in the field of cancer chemotherapy.37–39 For these reasons, our goal was to develop a ligand-fishing system that could be used for the detection and identification of DNA-binding molecules from natural product mixtures. In this report, we describe our efforts to implement a natural product drug discovery pipeline using an ultrafiltration-based assay system linked with hyphenated mass spectrometry to seamlessly detect, dereplicate, and, in some cases, identify compounds from complex mixtures of natural products.
RESULTS AND DISCUSSION
Designing an Ultrafiltration-Based LC-PDA-MS/MS DNA-Binding Assay.
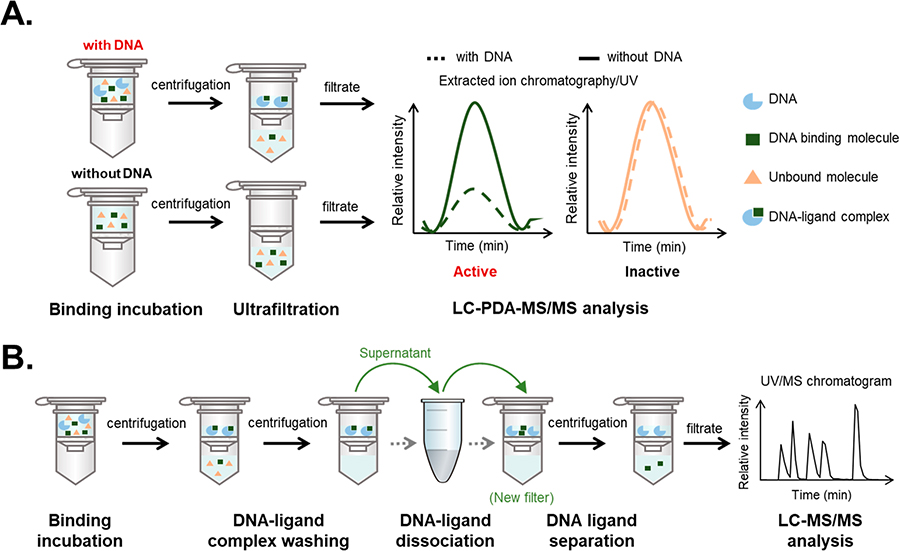
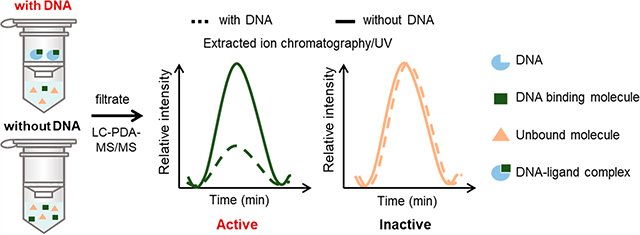
A ligand-fishing strategy was conceived for the purpose of identifying DNA-binding agents from complex mixtures of natural products (Figure 1A). Our adaptation of ligand fishing consisted of four linked parts: (1) an incubation phase to afford binding of compounds with their DNA targets, (2) ultrafiltration to separate the ligand-bound DNA complex from unbound small molecules, (3) untargeted hyphenated-mass-spectrometric analysis of the filtrates to detect candidate DNA-binding molecules, and (4) employment of natural product data resources [e.g., Global Natural Products Social Molecular Networking (GNPS), Dictionary of Natural Products, SciFinder, and others] to both dereplicate and guide efforts toward the identification of putative DNA-binding molecules. By comparing the filtrates of extracts incubated with DNA versus control samples processed without DNA, we reasoned that compounds bound or otherwise associated with DNA would be revealed based on their differential abundances in experimental versus control filtrates. The filtrates from the experimental (with DNA) and control (without DNA) conditions could then be comparatively analyzed using an ultra-high-performance-liquid-chromatography (UHPLC or simply LC) system equipped with a photodiode-array (PDA) detector and coupled to an ion trap mass spectrometer with ion fragmentation capabilities (MS/MS). We reasoned that employing the orthogonal detection capabilities of LC-PDA-MS/MS (i.e., UV and EIC traces) would provide a sensitive analytical platform capable of handling a broad range of chemical scaffolds such as those found among natural products. Furthermore, if the system were operated within the linear dynamic range of putative binding agents (Figure S1, Supporting Information), the peak areas for DNA-binding molecules would measurably decrease within the experimental group, whereas the peak areas for non-DNA binding molecules would remain unchanged. Based on these considerations, a sample-processing workflow was established (Figure 1B) that served as the template for our ligand-fishing process, which we named lickety-split ligand-affinity-based molecular angling system (LLAMAS).40
Figure 1.
Approach to detecting DNA-binding molecules from chemical mixtures using an ultrafiltration assay coupled to LC-PDA-MS/MS. (A) Strategic overview demonstrating how putative DNA binding molecules could be detected by comparing the filtrates of samples that were incubated with (experimental group) versus without (control group) DNA. (B) Procedural workflow showing the operational steps that were tested and incorporated into LLAMAS.40
Many experimental parameters were considered throughout the development phase of the project and optimized during our experiments; the reasoning behind some of those decisions merits further discussion. Bulk salmon sperm DNA was used as the assay target since it represented an affordable source of moderately sized, intact DNA [double-helix fragments consisting on average of ~2000 bp (1300 kDa)] that would be widely available to other laboratories wanting to adopt this protocol. After considering several types of ultrafiltration membranes, a modified poly(ether sulfone) membrane with a 100 kDa cutoff was selected since it presented an advantageous suite of properties (e.g., compatible with a range of elution solvents and reasonable inertness). Moreover, elution could be conducted using ordinary centrifugation conditions (i.e., 5000g). A variety of assay conditions were also evaluated as we searched for an incubation buffer that would allow the DNA to retain its double-helix structure, enable the solubilization of a wide range of natural products, and minimize the number of weakly bound compounds in favor of molecules that exhibited stronger DNA-binding interactions. This led to the identification of a modified glycerol-containing Tris-EDTA buffer containing 33% by volume MeOH, which was used as the incubation medium and in the washing step to remove unbound molecules. In our hands, this buffer system enabled a wide range of compounds (including many rather hydrophobic substances) (Table 1) to remain solubilized and avoided extensive sample precipitation during experiments.
Table 1.
DNA Binders 1–8 Used for Method Development
| Name | Structure | Binding mechanism | Solubility in aqueous solution | Distinct UV absorbance | Theoretical m/z in MS |
|---|---|---|---|---|---|
|
| |||||
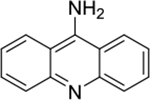
| 9-aminoacridine (1) |
|
intercalator | poor | yes | 195.09 |
| ellipticine (2) |

|
intercalator | poor | yes | 247.12 |
| methapyrilene (3) |

|
intercalator | poor | yes | 262.14 |
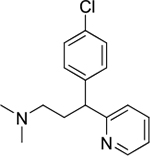
| chlorpheniramine (4) |
|
intercalator | good | yes | 275.13 |
| bisenzimide (H 33258) (5) |
|
groove binder | poor | yes | 425.21 |
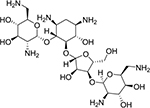
| neomycin (6) |
|
groove binder | good | N/A | 615.32 |
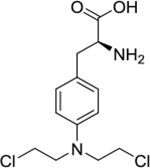
| melphalan (7) |
|
covalent binder | poor | yes | 305.08 |
| carmustine (8) |

|
covalent binder | poor | yes | N/A |
Testing DNA-Binding Agents.
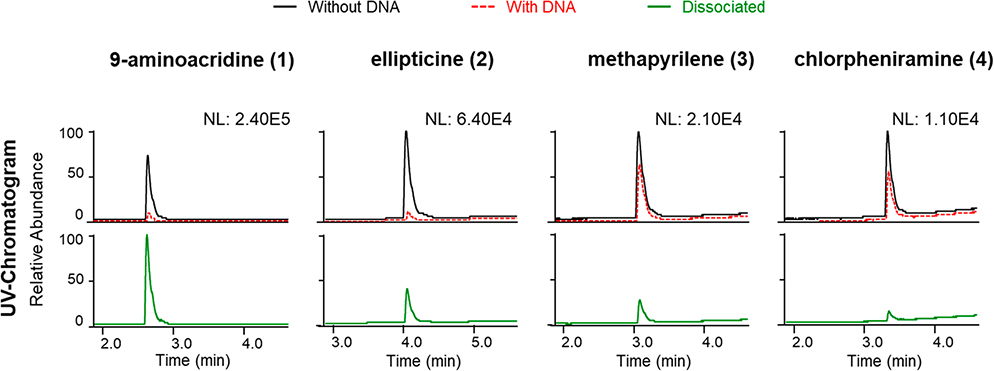
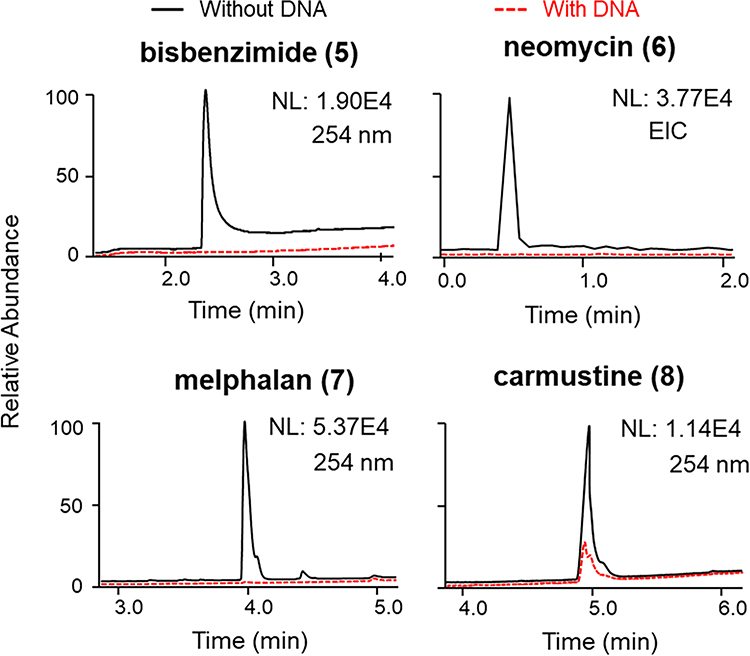
Eight compounds known to interact with DNA (Table 1) were selected to test the ligand-fishing system. Those compounds were chosen based on several criteria: inclusion of diverse structural features and chemical properties, coverage of different DNA-binding mechanisms, and nonequivalent sensitivities to detection by UV and MS instrumentation. Two assay end points were examined (Figures 2 and 3 and Figures S2 and S3, Supporting Information). The first end point involved determining whether a putative DNA-binding molecule was present in the eluent obtained from the ultrafiltration washing step based on semiquantitative comparisons of its relative concentrations in samples incubated with and without DNA (Figure 2, upper panels). The second end point relied on analyzing the profiles of substances obtained from an organic solvent rinse step (MeOH spiked with 0.1% formic acid) used to disrupt small-molecule binding interactions with DNA after rinsing with buffer (Figure 2, lower panels). While both methods provided valuable information [e.g., distinguishing between covalent versus noncovalent DNA binders (Figure 3)], we concluded that in most cases the first method alone was sufficient for screening. Thus, we determined that LLAMAS could detect molecules that exhibited different DNA binding mechanisms (i.e., intercalators 1–4, groove binders 5 and 6, and covalent binders 7 and 8) and covered a wide range of structural motifs including molecules that were difficult to ionize under standard ESIMS conditions [e.g., despite many attempts, compound 8 was not consistently detectable by MS under the conditions used in our experiments].
Figure 2.
Detection of intercalating compounds 1–4 in the LLAMAS (DNA-binding) assay. The UV chromatograms (λ 254 nm) show the peak areas of the filtrate for the control group samples incubated without DNA compared to experimental group samples that were incubated with DNA (overlying traces, upper panels). The compounds bound to the DNA were subsequently dissociated with MeOH containing 0.1% formic acid (lower panels) (NL: normalized intensity).
Figure 3.
Detection of groove-binding agents bisbenzimide (5) and neomycin (6) and covalent-binding compounds melphalan (7) and carmustine (8) using LLAMAS. Compounds 5, 7, and 8 were observed by UV (λ 254 nm) detection, whereas 6, which lacks a suitable UV chromophore, was monitored using the MS EIC trace. Individual plots show the peak areas for the compounds in the filtrate of the control group (incubated without DNA) superimposed on the traces recorded for the experimental samples (incubated with DNA) (NL: normalized intensity; EIC: extracted-ion chromatogram).
LLAMAS Detection of DNA-Binding Molecules in Mixtures and Complex Matrices.
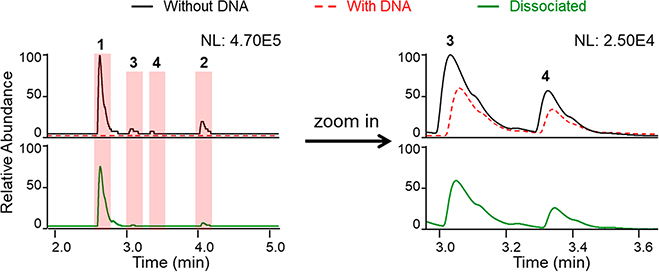
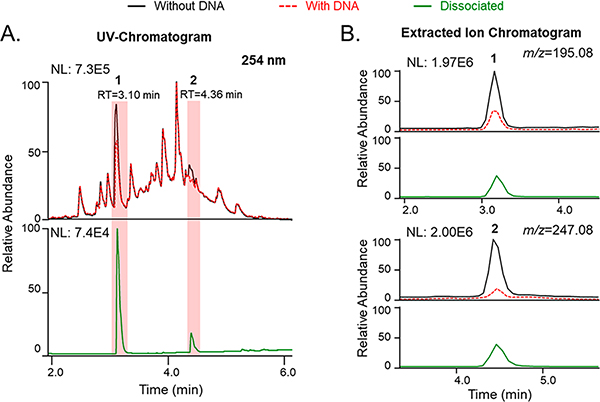
Because many of the metabolites encountered in natural product extracts occur as mixtures, it is likely that competition for binding sites would occur during sample screening. To identify what would happen when several compounds interacted with the same or similar DNA-binding sites, a mixture of four DNA-intercalating agents [final assay concentrations: 51 μM 9-aminoacridine (1), 81 μM ellipticine (2), 67 μM methapyrilene (3), and 51 μM chlorpheniramine (4)] was tested. The results showed that each compound was readily detected by LC-PDA-MS/MS (Figure 4), indicating that such mixtures should not be problematic.
Figure 4.
Monitoring the outcome for four DNA intercalators (1–4) tested as a mixture in the LLAMAS (DNA-binding) assay. The upper panels (UV traces recorded at λ 254 nm) show the results for compounds incubated with and without DNA, while the lower panels show the UV traces following compound dissociation using MeOH containing 0.1% formic acid (NL: normalized intensity).
Next, we sought to test how LLAMAS would perform when DNA binding compounds were incorporated into a complex matrix. We employed a potential “worst-case” scenario that consisted of an organic extract prepared from soil (the top ~7 cm of material collected from a low-lying hardwood forest plot that supported lush herbaceous plant growth). The soil extract contained >1000 potential chemical features as determined by LC-MS that occurred in a wide range of concentrations (data not shown).41 Two DNA intercalators, 1 and 2, were spiked into the soil extract in low concentrations [1:1:600 (w/w/w), respectively] to test the robustness of the assay. Analysis revealed that even under those challenging conditions both compounds were readily detected (Figure 5), affording confidence that LLAMAS could be expected to function even in cases presenting extreme levels of chemical complexity.
Figure 5.
Detection of DNA-binding agents incorporated into a complex soil extract using LLAMAS. DNA intercalators 1 and 2 were added to an organic extract of soil (1:1:600, w/w/w). (A) UV chromatograms (λ 254 nm) revealed test compounds were detectable based on comparisons of samples incubated with and without DNA (upper trace) and after dissociation (lower trace). (B) Similarly, the EIC traces demonstrated that mass-spectrometry-based detection could also serve as a suitable tool for compound detection when dealing with complex chemical mixtures (NL: normalized intensity; RT: retention time).
Using LLAMAS for the Identification of DNA-Binding Natural Products in a Microbial Extract.
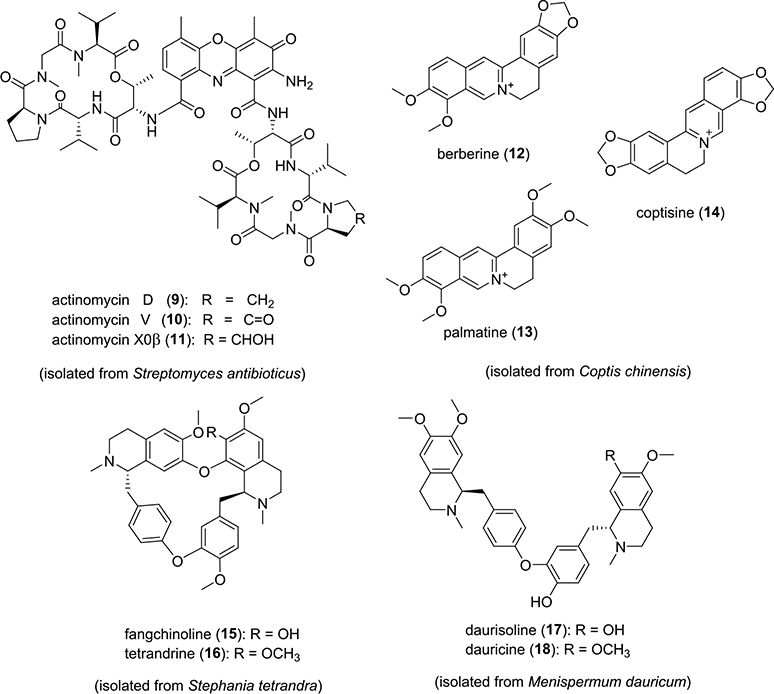
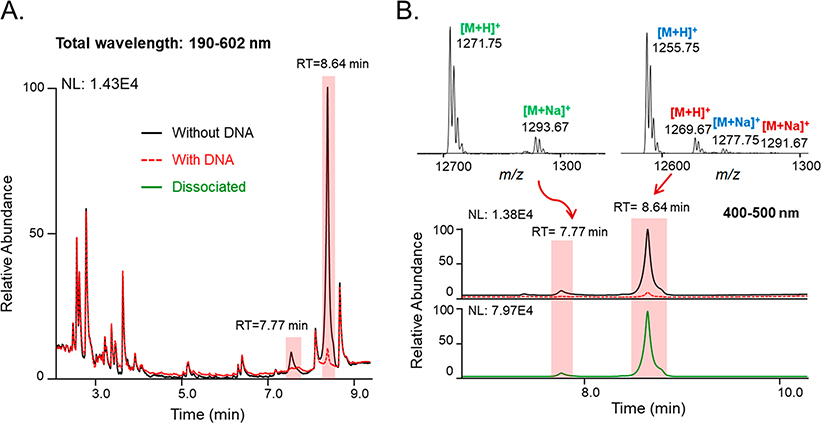
Actinomycin D (9) (Scheme 1) and its analogues are DNA-intercalating agents found in several Streptomyces spp.42–44 A sample containing the EtOAc-soluble components from a Streptomyces antibioticus (ATCC14888) culture was prepared and analyzed using LLAMAS. Multiple putative DNA-binding candidates were detected including a major UV-active peak (tR 8.64 min) that afforded two mass features (m/z 1255.75 and 1269.67), as well as a minor UV-active peak (tR 7.77 min) offering a single mass feature (m/z of 1271.75) (Figure 6). The resulting MS data were analyzed using the GNPS open-source cheminformatics platform,15,21,45 leading to the provisional identification of 9 (Figure S4, Supporting Information) along with two metabolites that were likely to be structural analogues of 9 (Figure S5, Supporting Information) based on their mass fragmentation data. MS-guided semipreparative C18 HPLC was used to purify the three metabolites, which were subsequently subjected to NMR and other spectroscopic tests, resulting in their authentication as actinomycins D (9), V (10), and X0β (11) (Scheme 1).46 Thus, the incorporation of molecular networking into the LLAMAS platform demonstrated the potential of this method to accelerate the identification/dereplication of DNA-binding compounds from multicomponent natural product samples.
Scheme 1.
Structures of DNA-Binding Natural Products 9–18 Identified from Bacterial and Plant Extracts Using LLAMAS
Figure 6.
Identification of the DNA-binding natural products actinomycin D (9), V (10), and X0β (11) from S. antibioticus using LLAMAS. (A) Analysis of the PDA chromatogram (λ 190–602 nm) revealed putative DNA-binding substances in the bacterial extract (candidate DNA-binding compounds are highlighted in red). (B) By focusing on these regions of interest, the MS data revealed evidence for three suspected DNA-binding agents in the extract: 9 (tR = 8.64 min, [M + H]+ ion at m/z 1255.75), 10 (tR = 8.64 min, [M + H]+ ion at m/z 1269.67), and 11 (tR = 7.77 min, [M + H]+ ion at m/z 1271.75).
Adapting LLAMAS for 96-Well Plate-Based Assays.
Considering the speed with which a single sample could be tested and its DNA-binding compounds identified using LLAMAS, we speculated that substituting the filtration microtubes for a device with higher throughput would enhance the ability to rapidly screen larger numbers of samples. Thus, a 96-well microtiter plate system that contained a 100 kDa cutoff ultrafiltration membrane designed for use in conjunction with a vacuum manifold device was tested for the purpose of increasing sample throughput. This approach was assessed with LLAMAS using the eight DNA binders (1–8) listed in Table 1. It was determined that all the test compounds could be detected alone (Figure S6A, Supporting Information) and in mixtures (Figure S6B, Supporting Information) using the 96-well ultrafiltration plate format. As an additional test, a mixture of several wild herbaceous annual and perennial plants (an unidentified assemblage of plants containing ~15–20 dicotyledons and monocotyledons) was collected, combined, and extracted creating a complex natural product extract. Compounds 1 and 4 were added to the mixed-plant extract in a ratio of 1:5:250 (w/w/w of 1:4:extract, respectively), and the sample was tested using the 96-well plate-based version of LLAMAS. The spiked-in DNA intercalators were readily detected employing sample sizes as small as 250 μg of extract in a working volume of 100 μL (Figure S6C, Supporting Information), which was far less than the 400 μL working volume and 2–3 mg of extract used for the initial microtube-based system. Thus, it was concluded that the 96-well plate-based adaptation of LLAMAS offered a favorable reduction in the amount of sample required for analysis, as well as improving the overall sample testing speed.
Testing LLAMAS Using a Collection of Herbal Supplement Extracts.
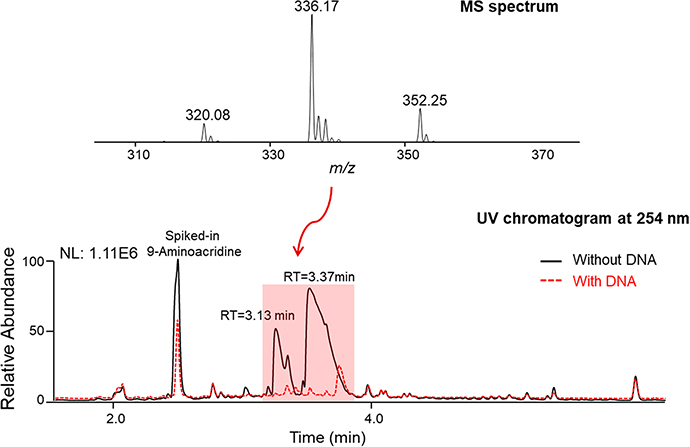
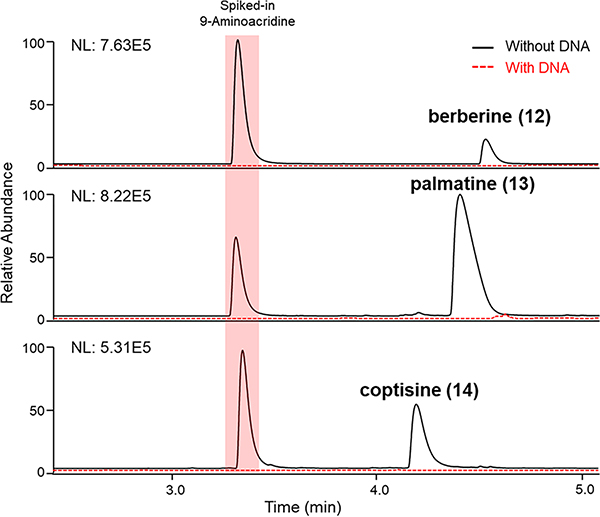
The University of Oklahoma laboratory acquired a modest set of 62 plant specimens sold commercially as herbal supplements in the United States (Table S1, Supporting Information). Organic solvent extracts were prepared from the samples, and portions of each were formatted in a 96-well microtiter plate for testing using LLAMAS. The experiment was performed in a blinded manner to ensure experimental rigor. Based on comparisons of the UV chromatograms and total ion traces made from sample filtrates acquired following incubation of the extracts with and without added DNA, one sample was identified as a “hit” (i.e., it contained putative DNA-binding molecules) (Figure 7). The sample had three UV-absorbing peaks that exhibited m/z values of 320.08, 336.17, and 352.25. The MS/MS fragmentation data for the three analytes were submitted to the GNPS platform, which generated strong matches to the DNA-intercalating compound berberine (12), as well as two berberine analogues.47,48 To confirm the identities of the natural products, semipreparative C18 HPLC was used to purify the compounds, which were dereplicated by NMR data analyses and confirmed as 12, palmatine (13), and coptisine (14) (Scheme 1).49 Unmasking of the identities of the plants revealed the source of 12–14 to be the roots of Coptis chinensis Franch., which is a well-established natural source of benzylisoquinoline metabolites. The DNA-binding activities of 12–14 were confirmed (Figure 8) and found to be consistent with published data.47,50,51 In further support of the rigorousness and correctness of the results afforded by LLAMAS, a post hoc literature search was performed on the other 61 plant specimens, and none were reported to contain known DNA-binding compounds. The results of this test, although limited in scope, suggested that LLAMAS was not overly vulnerable to false-negative or false-positive results under real-world natural-product screening conditions. For transparency purposes, it must be noted that the plant materials used in this study were received as small pieces or as powders, negating the opportunity to conduct macroscale visual authentication of each plant specimen.
Figure 7.
Three putative DNA-binding compounds were detected in an extract of C. chinensis root using LLAMAS. The UV chromatogram (λ 254 nm) and MS data associated with peaks of interest revealed the presence of the DNA-binding compounds berberine 12, palmatine (13), and coptisine (14).
Figure 8.
Confirmation of the DNA-binding activities of berberine (12), palmatine (13), and coptisine (14) using LLAMAS. UV chromatograms (λ 254 nm) show how the compounds behaved with and without DNA present.
Using LLAMAS to Test a Library of Traditional Chinese Medicinal Plant Extracts.
The U.S. National Cancer Institute (NCI) has assembled a library composed of 332 organic extracts prepared from plants used in Traditional Chinese Medicine (TCM), and those samples are available to researchers upon written request.52 This library, which offers good coverage of diverse natural product scaffolds originating from several plant families, presented an excellent opportunity for further assessment of LLAMAS. Testing of the 332 organic extracts in duplicate yielded three samples that were identified as containing probable DNA-binding compounds. Upon examination of the sources of the three active extracts, we noted that one of the samples was prepared from C. chinensis; the data derived from LC-MS/MS revealed that the same three DNA-binding metabolites we previously dereplicated, 12–14 (vide supra), were present in the new sample from the NCI TCM collection.
The two other active samples prepared from Stephania tetrandra S. Moore and Menispermum dauricum DC. were subsequently examined. Focusing first on the results obtained for S. tetrandra, two molecular features were detected with m/z values of 609.33 and 623.33 ([M + H]+ ions) in the LC-MS data, which were tentatively attributed to the bisbenzylisoquinoline metabolites fangchinoline (15) and tetrandrine (16), respectively (Scheme 1). Those assertions were further supported based on consideration of the biogenic source, UV–vis spectroscopic data, their reported DNA binding activities, and MS/MS data for the two metabolites.53,54 LC-MS data obtained from testing the M. dauricum extract supported the presence of two active compounds based on the appearance of [M + H]+ ions exhibiting m/z values of 611.50 and 625.42, which were preliminarily identified as daurisoline (17) and dauricine (18), respectively (Scheme 1). Likewise, those assignments were buttressed by evidence derived from considerations of the biogenic source, UV–vis spectroscopic data, their reported DNA binding activities, and MS/MS data for the two metabolites.55,56 The preliminary structure assignments of 15–18 were subsequently confirmed based on comparisons of their 1H NMR spectroscopic data, specific rotation values, and MS features with reported data.54,57–59 The DNA-binding activities of purified 15–18 were subsequently confirmed using the LLAMAS method (Figure S7, Supporting Information).
Evaluation of DNA-Binding Compounds for Antiproliferative and Cytotoxic Activities against Diverse Cancer Cell Types.
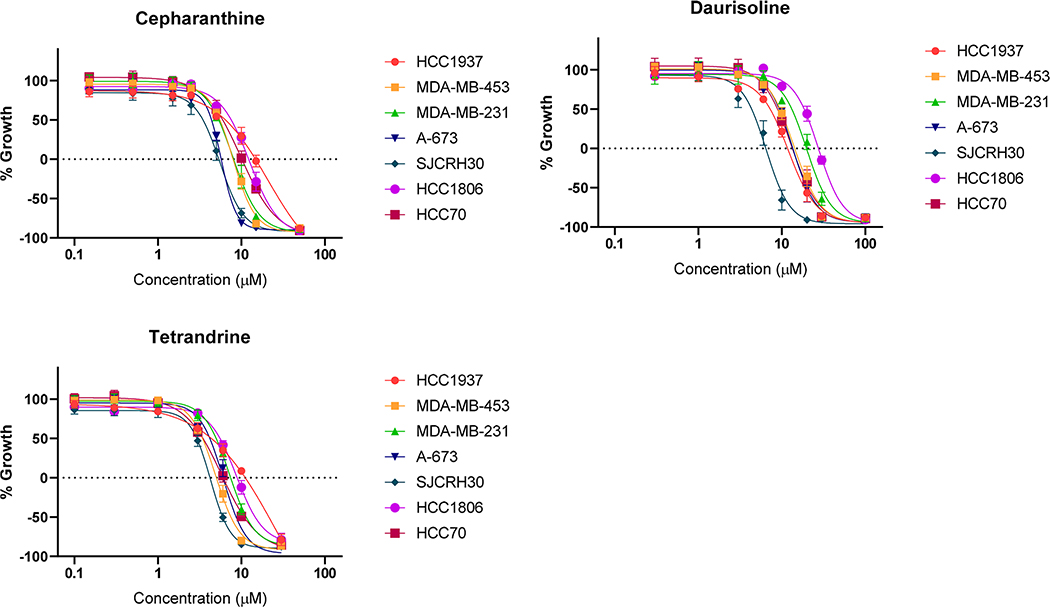
Compounds 16 and 17 and a bisbenzylisoquinoline analogue, cepharanthine, were tested for their effects against a panel of triple-negative breast cancer cells and two solid pediatric cancer cell lines. The results (Table 2, Figure 9) show that each of these compounds is highly effective at inhibiting proliferation (GI50 and TGI values) and causing cytotoxicity (LC50). There was no selectivity for any of the compounds in this panel of cell lines, consistent with a global ability to bind DNA and initiate DNA-damage-mediated cytotoxicity.
Table 2.
GI50, TGI, and LC50 Values of Compounds in Cancer Cellsa
| compound | HCC1937 | MDA-MB-453 | MDA-MB-231 | A-673 | SJCRH30 | HCC 1806 | HCC70 | |
|---|---|---|---|---|---|---|---|---|
| cepharanthine | GI50 | 6.0 ± 0.3 | 5.5 ± 0.2 | 5.3 ± 0.1 | 4.5 ± 0.08 | 3.8 ± 0.2 | 7.2 ± 0.1 | 5.8 ± 0.03 |
| TGI | 14 ± 0.9 | 7.8 ± 0.2 | 7.7 ± 0.3 | 5.8 ± 0.08 | 5.7 ± 0.1 | 12 ± 0.5 | 9.6 ± 0.1 | |
| LC50 | 27 ± 2 | 11 ± 0.4 | 12 ± 0.6 | 7.5 ± 0.1 | 8.4 ± 0.2 | 19 ± 1 | 17 ± 0.2 | |
| daurisoline (17) | GI50 | 6.9 ± 0.1 | 9.0 ± 0.2 | 13 ± 0.3 | 9.2 ± 0.03 | 3.7 ± 0.2 | 17 ± 0.3 | 8.8 ± 0.02 |
| TGI | 11 ± 0.2 | 14 ± 0.4 | 19 ± 0.1 | 13 ± 0.6 | 6.0 ± 0.2 | 27 ± 0.7 | 13 ± 0.4 | |
| LC50 | 18 ± 0.7 | 21 ± 1 | 30 ± 0.8 | 19 ± 2 | 9.7 ± 0.1 | 41 ± 2 | 19 ± 1 | |
| tetrandrine (16) | GI50 | 4.2 ± 0.07 | 3.3 ± 0.1 | 5.0 ± 0.09 | 4.0 ± 0.3 | 3.0 ± 0.03 | 5.1 ± 0.1 | 3.4 ± 0.1 |
| TGI | 10 ± 0.2 | 4.8 ± 0.1 | 7.4 ± 0.07 | 6.0 ± 0.3 | 4.3 ± 0.04 | 8.5 ± 0.3 | 5.9 ± 0.3 | |
| LC50 | 21 ± 1 | 7.1 ± 0.2 | 12 ± 0.7 | 8.9 ± 0.2 | 6.1 ± 0.06 | 15 ± 1 | 11 ± 0.6 | |
GI50, TGI, and LC50 concentrations and standard error of mean (SEM) are reported in μM, n = 3, 4.
Figure 9.
Concentration–response curves for cepharanthine, tetrandrine (16), and dauisolide (17) in triple-negative breast cancer (HCC1937, HCC1806, HCC70, MDA-MB-231, and MDA-MB-453) and pediatric cancer cell lines (Ewing sarcoma, A-673; rhabdomyosarcoma, SJCRH30). Data represent the mean of 3 or 4 experiments, ±SEM.
In conclusion, the results of these studies demonstrate that LLAMAS is an effective platform for the high-throughput detection and dereplication of DNA-binding natural products from complex chemical mixtures. While this initial application of LLAMAS focused on compounds that interact with genomic DNA, we see tremendous potential for expanding this methodology to include alternative biological targets (e.g., disease-related DNA sequences such as G-quadruplexes,51 RNA, proteins, cellular organelles, and more). The enduring dominance of bioassay-guided fractionation in natural products discovery is a testament to its power and practicality. However, alternative target-based approaches that take full advantage of the timely confluence of an expanding range of readily accessible data repositories and analytical technologies should be embraced to create alternative bioactive natural product detection measures. Whereas various forms of ligand-fishing techniques have been reported, they have not been fully exploited for bioactive natural product discovery. We anticipate that LLAMAS and related approaches, which consolidate the detection and identification of biologically intriguing compounds, offer exciting opportunities as paths to further enhancing natural-product-driven drug discovery.
EXPERIMENTAL SECTION
General Experimental Procedures.
Data for specific rotation measurements were obtained on a Rudolph Research Autopol III automatic polarimeter. Column chromatography was performed using silica gel and HP20SS. Preparative HPLC was carried out on a Shimadzu system equipped with LC-6AD pumps, coupled to an SPD-M20A PDA detector, and a Phenomenex Luna C18 column (21.2 × 250 mm and 10 × 250 mm, 5 μm). Analytical and semipreparative HPLC were conducted using a Waters HPLC system with 1525 binary pumps and a 2998 PDA detector using Phenomenex Gemini C18 (250 × 4.6 mm, 1 mL/min, 5 μm) and Kinetex pentafluorophenyl (250 × 10 mm, 4 mL/min, 5 μm) columns. NMR data were collected on a Varian 600 MHz NMR spectrometer. Microcentrifuge-tube-based ultrafiltration filters (100 kDa) were obtained from Pall Corporation (Houston, TX, USA). Salmon sperm DNA and other chemicals were purchased from MilliporeSigma (St. Louis, MO, USA). Cephaeranthine was purchased from Cayman Chemical Company (Ann Arbor, MI, USA), and tetrandrine (16) and daurisoline (17) were obtained from MilliporeSigma. Distilled water was prepared with a Milli-Q water purification apparatus (Millipore, Bedford, MA, USA). All solvents were of ACS grade or better.
Preparation and Extraction of the S. antibioticus Culture.
The S. antibioticus strain (14888) was purchased from the American Type Culture Collection (ATCC, Manassas, VA, USA). The bacterium was cultured on yeast malt agar plates, containing 0.5% peptone, 0.3% yeast extract, 0.3% malt extract, 1% dextrose, and 0.15–0.2% agar (final pH 6.2 ± 0.2), then grown in a broth medium composed of 0.5% tryptone and 0.3% yeast extract. A single colony was used to inoculate Falcon tubes containing 20 mL of the broth medium, and the tubes were shaken at 200 rpm (30 °C) for 24 h for seed culture preparation. The seed cultures were aseptically added to 1.25 L aliquots of liquid medium in Erlenmeyer flasks that were subsequently shaken at 200 rpm (30 °C) for 6 days. The resulting pooled culture broth (~5 L) was homogenized and partitioned against EtOAc overnight (equal volumes ×3). The combined organic phase was reduced under vacuum for testing and compound purification.
Preparation of Commercial Botanical Extracts.
Plant materials were purchased from Dandelion Botanical Company (Seattle, WA, USA). Samples consisting of 2 g (dry weight) of each plant were soaked in 200 mL of MeOH for 24 h. The solvent was decanted and then removed by rotary evaporation to afford organic residues containing the MeOH-soluble materials. The samples were suspended in mixtures of EtOAc (200 mL) and H2O (200 mL) and subjected to partitioning. The organic phases were collected and the solvent was removed prior to testing. A 550 mg sample of the C. chinensis extract (obtained from 20 g root slices) was used for the purification of its DNA-binding components. The TMC plant extracts were obtained from the Natural Products Branch of the United States National Cancer Institute.
General LLAMAS Protocols.
Compounds were prepared before each assay by dissolving in water or DMSO–MeOH (1:1, v/v). DNA stock solutions (1 mg/mL) were prepared in TE buffer (10 mM Tris, 1 mM EDTA, pH 8.0) with 15% glycerol and stored at 4 °C before use. For experiments requiring “no-DNA” controls, the TE buffer with 15% glycerol was prepared without DNA and stored at 4 °C.
For tests using LLAMAS, compounds (typically 5–50 μg each) or mixtures/extracts (typically 1–3 mg) were dissolved in 200 μL of water, MeOH, or mixtures of the two solvents to afford solubilization of the test substances. The solubilized compounds and extracts were added to 400 μL aliquots of the buffered DNA solution in the microcentrifuge tubes and incubated at room temperature for 30 min with gentle shaking. The samples were passed through the ultrafiltration membrane (100 kDa cutoff) by centrifugation at 5000g at 10 °C. The resulting filtrates were collected for LC-PDA-MS/MS analysis. When a compound dissociation step was required (Figure 1B), the DNA–ligand complexes retained in the upper chambers of the microcentrifuge tubes were initially rinsed with 30% MeOH in H2O and subjected to centrifugation (3× at 5000g, 10 °C) to aid in the removal of unbound, weakly bound, and/or precipitated substances. After washing, the upper chambers of the tubes were filled with 600 μL of 95% MeOH in H2O with 1% formic acid. The tubes were incubated with periodic vortexing at room temperature for 20 min. The solubilized contents of the tubes were transferred to microcentrifuge tubes outfitted with new ultrafiltration filters and centrifuged at 5000g at 10 °C for 10 min. The filtrates were subjected to solvent evaporation in vacuo, and the residues suspended in 50 μL of MeOH for LC-MS/MS analysis.
For microtiter-plate-based testing of LLAMAS, compounds (typically 0.5–25 μg each) or mixtures/extracts (125 μg) were dissolved in 50 μL of MeOH and added to the wells of the ultrafiltration microtiter plates (100 kDa cutoff) containing 100 μL of the buffered DNA solution or DNA-free control buffer (vide supra). For most experiments, 0.5 μg of DNA intercalator 1 was added to serve as an internal standard to monitor assay performance. The plates were sealed with an inert silicon film to control evaporation and incubated at room temperature for 30 min with periodic shaking. For the filtration step, the plates were unsealed and placed on a MultiScreen HTS vacuum manifold (EMD Millipore, Billerica, MA, USA) before being subjected to vacuum filtration (15–20 in. Hg). The resulting filtrates were introduced directly into the LC-PDA-MS/MS system (10 μL sample injections) for analysis.
Untargeted LC-PDA-MS/MS Analysis.
The LC-PDA-MS/MS data were acquired on an Accucore Vanquish UHPLC system, equipped with a PDA detector, and an Accucore C18 column (1.5 μm, 100 × 2.1 mm, 0.4 mL/min). Mobile phases for LC separation included H2O (A) and MeCN (B) (both with 0.1% formic acid). For assays with pure compounds, gradient LC conditions were used starting at 7% B for 0.5 min, with a linear increase from 7% to 50% B over 5 min, followed by a linear gradient to 95% B over 0.5 min. The 95% B wash step was held for 0.5 min with a return to 7% B over 0.5 min, and the 7% B was maintained for 2 min to reequilibrate the column. For tests involving the soil and microbial extracts, a starting condition of 3% B was used followed by a linear gradient from 3% to 95% B in 10 min. For tests involving plant extracts, a starting condition of 3% B was used followed by a linear gradient from 3% to 80% B in 7 min. The column temperature was maintained at 40 °C and the sample compartment was held at 10 °C throughout the analyses. The flow rate was set at 0.4 mL/min. MS data were acquired on a Thermo LTQ XL mass spectrometer under electrospray ionization (ESI) conditions. Capillary settings were 270 °C and 18 V with a spray voltage of 4.5 kV. Sheath gas (N2) and auxiliary gas (N2) were set at 40 and 5 arb, respectively. Tube lens voltage was set at 95 V for positive-ion mode. Collisional-induced dissociation (CID) for MS/MS fragmentation analyses was carried out with a normalized collision energy setting of 35% in the data-dependent acquisition mode using the five most abundant parent ions.
Dereplication and Preliminary Characterization of DNA-Binding Candidates.
The dereplication and preliminary structure assignments for putative DNA-binding compounds were accomplished using a combination of data including retention time (i.e., analyses performed based on comparisons to authentic samples), PDA-derived information, and MS and MS/MS features. Dereplication was also performed using the online GNPS platform by exporting the mgf file from MZmine. Additional comparative analyses were carried out by comparing experimental data with information curated in subscription-based chemistry databases (i.e., SciFinder and Dictionary of Natural Products).
Purification of DNA-Binding Compounds.
Extracts were prefractionated by vacuum-liquid chromatography (VLC) over HP20ss resin using a step gradient composed of MeOH–H2O (3:7, 1:1, 7:3, 9:1, and 1:0) as the eluent. Compounds were targeted for purification based on data from LLAMAS experiments and were tracked during fractions by LC-PDA-MS/MS.
For the S. antibioticus project, 1.3 g of extract was subjected to VLC, and the 9:1 MeOH–H2O fraction was determined to contain the three candidate mass features of interest (m/z 1255.75, 1269.67, and 1271.75). Fractionation of this sample was carried out by preparative HPLC (gradient elution conditions using MeCN–H2O with 0.1% formic acid and 58–80% MeCN in 30 min over a C18 column), followed by semipreparative HPLC (isocratic 52% MeCN in H2O with 0.1% TFA using a pentafluorophenyl column), to afford known actinomycins D (9, 14.9 mg), V (10, 10.0 mg), and X0β (11, 9.8 mg). The 1H and 13C NMR spectra and additional structure analysis data are provided in the Supporting Information (Tables S2–S4, Figures S8–S12, Supporting Information).
For the C. chinensis project, 0.55 g of extract was subjected to VLC, and two fractions (50:50 and 90:10 MeOH–H2O) were determined to contain the three candidate mass features of interest (m/z of 320.08, 336.17, and 352.25). Fractionation of these samples was carried out by semipreparative HPLC (isocratic elution using 70% MeCN in H2O with 0.1% TFA over a pentafluorophenyl column) to afford the known metabolites berberine (12, 19.2 mg), palmatine (13, 5.4 mg), and coptisine (14, 4.9 mg). Data used to confirm the structures of these metabolites are provided in the Supporting Information (Tables S5–S7, Figures S13–S18, Supporting Information).
For the S. tetrandra project, 1.0 g of extract was subjected to VLC, and the 9:1 MeOH–H2O fraction was determined to contain the two candidate mass features of interest (m/z 609.33 and 623.33). Fractionation of this sample was carried out by semipreparative HPLC (isocratic elution using 70% MeCN in H2O with 0.02% Et2NH over a C18 column) to afford the known metabolites fangchinoline [15, 1.2 mg, [α]D 275 (c 0.08, CHCl3)] and tetrandrine [16, 7.2 mg, [α]D 279 (c 0.48, CHCl3)]. Data used to confirm the structures of these metabolites are provided in the Supporting Information (Figures S19 and S20, Supporting Information).
For the M. dauricum project, 1.0 g of extract was subjected to VLC and the 9:1 MeOH–H2O fraction was determined to contain the two candidate mass features of interest (m/z 611.50 and 625.42). Fractionation of this sample was carried out by semipreparative HPLC (isocratic elution using 60% MeCN in H2O with 0.02% Et2NH using a C18 column) to afford the known metabolites daurisoline [17, 1.2 mg, [α]D – 125 (c 0.08, MeOH)] and dauricine [18, 2.3 mg, [α]D – 134 (c 0.15, MeOH)]. Data used to confirm the structures of these metabolites are provided in the Supporting Information (Figures S21 and S22, Supporting Information).
Cell Culture.
Triple-negative breast cancer cell lines (HCC1937, HCC1806, HCC70, MDA-MB-231, and MDA-MB-453) and two pediatric cancer cell lines (Ewing sarcoma, A-673; rhabdomyosarcoma, SJCRH30) were purchased from the American Type Culture Collection. The identities of the cell lines were validated by STR profiling (Genetica DNA Laboratories, Burlington, NC, USA). The HCC1937, HCC70, and SJCRH30 cells were grown in RPMI-1640 supplemented with 10% fetal bovine serum (FBS) and 50 μg/mL gentamicin, and the A-673 and HCC1806 cells utilized the same media with 5% FBS. MDA-MB-453 and MDA-MB-231 cells were cultured in modified IMEM with 5% FBS and 30 μg/mL gentamicin. All cellular assays were conducted within 4 months of retrieval of cells from liquid nitrogen stocks. Cells were maintained in humidified incubators at 37 °C with 5% CO2.
Sulforhodamine B Assay.
The effects of compounds on cell proliferation and cytotoxicity were evaluated using the sulforhodamine B (SRB) assay60 as previously described.61 Cells were plated at predetermined densities in 96-well tissue culture plates and allowed to adhere and grow overnight. The cells were treated with the compounds solubilized in DMSO with a final concentration of DMSO of 0.5% (v/v). The cells were incubated with the compounds for 48 h and then treated as previously described.61 The GI50, TGI, and LC50 values were calculated for each experiment using the nonlinear regression function in Prism 8.3.1 (GraphPad Software, La Jolla, CA, USA).
Supplementary Material
ACKNOWLEDGMENTS
The authors are grateful for assistance provided by M. Murphy and A. Caldwell, who helped prepare culture medium and carried out the solvent extraction of botanical samples. This project was supported by NIH grant U01CA182740 to R.H.C. and S.L.M. and the Greehey Endowment (S.L.M.). R.H.C. would like to thank P. Crews and A. Wright for thoughtprovoking dialogue in 2014, which served as the thought seed that matured into LLAMAS.
Footnotes
The authors declare no competing financial interest.
DEDICATION
Dedicated to Dr. A. Douglas Kinghorn, The Ohio State University, for his pioneering work on bioactive natural products.
ASSOCIATED CONTENT
Supporting Information
The Supporting Information is available free of charge at https://pubs.acs.org/doi/10.1021/acs.jnatprod.0c00946.
Summaries of the list of a modest set of 62 plant specimens, NMR data for compounds 9–14, overflow of DNA–ligand complex dissociation, calibration curve analysis of compounds 1–5, some EIC analysis in LLAMAS, annotation of actinomycin D and its analogues using GNPS, confirmation of the DNAbinding activities of compounds 15–18, and 1D NMR spectra for compounds 9–18 (PDF)
Complete contact information is available at: https://pubs.acs.org/10.1021/acs.jnatprod.0c00946
Contributor Information
Hongyan Ma, Department of Chemistry and Biochemistry, Stephenson Life Sciences Research Center, and Natural Products Discovery Group and Institute for Natural Products Applications and Research Technologies, University of Oklahoma, Norman, Oklahoma 73019, United States.
Huiyun Liang, Department of Pharmacology, University of Texas Health Science Center, San Antonio, Texas 78229, United States.
Shengxin Cai, Department of Chemistry and Biochemistry, Stephenson Life Sciences Research Center, and Natural Products Discovery Group and Institute for Natural Products Applications and Research Technologies, University of Oklahoma, Norman, Oklahoma 73019, United States.
Barry R. O’Keefe, Natural Products Branch, Developmental Therapeutics Program, Division of Cancer Treatment and Diagnosis, and Molecular Targets Program, Center for Cancer Research, National Cancer Institute, Frederick, Maryland 21702, United States
Susan L. Mooberry, Department of Pharmacology, University of Texas Health Science Center, San Antonio, Texas 78229, United States
Robert H. Cichewicz, Department of Chemistry and Biochemistry, Stephenson Life Sciences Research Center, and Natural Products Discovery Group and Institute for Natural Products Applications and Research Technologies, University of Oklahoma, Norman, Oklahoma 73019, United States
REFERENCES
- (1).Newman DJ; Cragg GM J. Nat. Prod 2016, 79, 629–661. [DOI] [PubMed] [Google Scholar]
- (2).Dias DA; Urban S; Roessner U Metabolites 2012, 2, 303–336. [DOI] [PMC free article] [PubMed] [Google Scholar]
- (3).Harvey AL; Edrada-Ebel R; Quinn RJ Nat. Rev. Drug Discovery 2015, 14, 111–129. [DOI] [PubMed] [Google Scholar]
- (4).Lobanovska M; Pilla G Yale J. Biol. Med 2017, 90, 135–145. [PMC free article] [PubMed] [Google Scholar]
- (5).Weaver BA Mol. Biol. Cell 2014, 25, 2677–2681. [DOI] [PMC free article] [PubMed] [Google Scholar]
- (6).Su XZ; Miller LH Sci. China: Life Sci 2015, 58, 1175–1179. [DOI] [PMC free article] [PubMed] [Google Scholar]
- (7).Shen B Cell 2015, 163, 1297–1300. [DOI] [PMC free article] [PubMed] [Google Scholar]
- (8).Newman DJ; Cragg GM J. Nat. Prod 2020, 83, 770–803. [DOI] [PubMed] [Google Scholar]
- (9).Newman DJ; Cragg GM J. Nat. Prod 2012, 75, 311–335. [DOI] [PMC free article] [PubMed] [Google Scholar]
- (10).Boufridi A; Quinn RJ Annu. Rev. Pharmacol. Toxicol 2018, 58, 451–470. [DOI] [PubMed] [Google Scholar]
- (11).Prior M; Chiruta C; Currais A; Goldberg J; Ramsey J; Dargusch R; Maher PA; Schubert D ACS Chem. Neurosci 2014, 5, 503–513. [DOI] [PMC free article] [PubMed] [Google Scholar]
- (12).Nothias LF; Nothias-Esposito M; da Silva R; Wang M; Protsyuk I; Zhang Z; Sarvepalli A; Leyssen P; Touboul D; Costa J; Paolini J; Alexandrov T; Litaudon M; Dorrestein PC J. Nat. Prod 2018, 81, 758–767. [DOI] [PubMed] [Google Scholar]
- (13).Weller MG Sensors 2012, 12, 9181–9209. [DOI] [PMC free article] [PubMed] [Google Scholar]
- (14).Phillipson DW; Milgram KE; Yanovsky AI; Rusnak LS; Haggerty DA; Farrell WP; Greig MJ; Xiong X; Proefke ML J. Comb. Chem 2002, 4, 591–599. [DOI] [PubMed] [Google Scholar]
- (15).Nothias L-F; Nothias-Esposito M; da Silva R; Wang M; Protsyuk I; Zhang Z; Sarvepalli A; Leyssen P; Touboul D; Costa J; Paolini J; Alexandrov T; Litaudon M; Dorrestein PC J. Nat. Prod 2018, 81, 758–767. [DOI] [PubMed] [Google Scholar]
- (16).Weller MG Sensors 2012, 12, 9181–9209. [DOI] [PMC free article] [PubMed] [Google Scholar]
- (17).Bergsdorf C; Ottl J Expert Opin. Drug Discovery 2010, 5, 1095–1107. [DOI] [PubMed] [Google Scholar]
- (18).Rinschen MM; Ivanisevic J; Giera M; Siuzdak G Nat. Rev. Mol. Cell Biol 2019, 20, 353–367. [DOI] [PMC free article] [PubMed] [Google Scholar]
- (19).Katz L; Baltz RH J. Ind. Microbiol. Biotechnol 2016, 43, 155–176. [DOI] [PubMed] [Google Scholar]
- (20).Zhuo R; Liu H; Liu N; Wang Y Molecules 2016, 21, 1516. [DOI] [PMC free article] [PubMed] [Google Scholar]
- (21).Wang M; Carver JJ; Phelan VV; Sanchez LM; Garg N; Peng Y; Nguyen DD; Watrous J; Kapono CA; Luzzatto-Knaan T; Porto C; Bouslimani A; Melnik AV; Meehan MJ; Liu W-T; Crüsemann M; Boudreau PD; Esquenazi E; SandovalCalderon M; Kersten RD; Pace LA; Quinn RA; Duncan KR; Hsu C-C; Floros DJ; Gavilan RG; Kleigrewe K; Northen T; Dutton RJ; Parrot D; Carlson EE; Aigle B; Michelsen CF; Jelsbak L; Sohlenkamp C; Pevzner P; Edlund A; McLean J; Piel J; Murphy BT; Gerwick L; Liaw C-C; Yang Y-L; Humpf H-U; Maansson M; Keyzers RA; Sims AC; Johnson AR; Sidebottom AM; Sedio BE; Klitgaard A; Larson CB; P CAB; Torres-Mendoza D; Gonzalez DJ; Silva DB; Marques LM; Demarque DP; Pociute E; O’Neill EC; Briand E; Helfrich EJN; Granatosky EA; Glukhov E; Ryffel F; Houson H; Mohimani H; Kharbush JJ; Zeng Y; Vorholt JA; Kurita KL; Charusanti P; McPhail KL; Nielsen KF; Vuong L; Elfeki M; Traxler MF; Engene N; Koyama N; Vining OB; Baric R; Silva RR; Mascuch SJ; Tomasi S; Jenkins S; Macherla V; Hoffman T; Agarwal V; Williams PG; Dai J; Neupane R; Gurr J; Rodríguez AMC; Lamsa A; Zhang C; Dorrestein K; Duggan BM; Almaliti J; Allard P-M; Phapale P; Nothias L-F; Alexandrov T; Litaudon M; Wolfender J-L; Kyle JE; Metz TO; Peryea T; Nguyen D-T; VanLeer D; Shinn P; Jadhav A; Müller R; Waters KM; Shi W; Liu X; Zhang L; Knight R; Jensen PR; Palsson BO; Pogliano K; Linington RG; Gutiérrez M; Lopes NP; Gerwick WH; Moore BS; Dorrestein PC; Bandeira N Nat. Biotechnol 2016, 34, 828–837. [DOI] [PMC free article] [PubMed] [Google Scholar]
- (22).Gabrielson SW J. Med. Libr. Assoc 2018, 106, 588–590. [Google Scholar]
- (23).Sorokina M; Steinbeck CJ Cheminf. 2020, 12, 20. [DOI] [PMC free article] [PubMed] [Google Scholar]
- (24).Chronopoulou EG; Varotsou C; Georgakis N; Premetis G; Ioannou E; Labrou NE Methods Mol. Biol 2020, 2089, 235–243. [DOI] [PubMed] [Google Scholar]
- (25).Xu N; Yang H; Cui M; Wan C; Liu S Anal. Chem 2012, 84, 2562–2568. [DOI] [PubMed] [Google Scholar]
- (26).Wubshet SG; Brighente IMC; Moaddel R; Staerk DJ Nat. Prod 2015, 78, 2657–2665. [DOI] [PMC free article] [PubMed] [Google Scholar]
- (27).Rush MD; Walker EM; Burton T; van Breemen RB J. Nat. Prod 2016, 79, 2898–2902. [DOI] [PMC free article] [PubMed] [Google Scholar]
- (28).Kelly MA; McLellan TJ; Rosner PJ Anal. Chem 2002, 74, 1–9. [DOI] [PubMed] [Google Scholar]
- (29).Gurova K Future Oncol. 2009, 5, 1685–1704. [DOI] [PMC free article] [PubMed] [Google Scholar]
- (30).Cheung-Ong K; Giaever G; Nislow C Chem. Biol 2013, 20, 648–659. [DOI] [PubMed] [Google Scholar]
- (31).Rahman A; O’Sullivan P; Rozas I MedChemComm 2019, 10, 26–40. [DOI] [PMC free article] [PubMed] [Google Scholar]
- (32).Robles AJ; Du L; Cichewicz RH; Mooberry SL J. Nat. Prod 2016, 79, 1822–1827. [DOI] [PMC free article] [PubMed] [Google Scholar]
- (33).Pederson PJ; Cai S; Carver C; Powell DR; Risinger AL; Grkovic T; O’Keefe BR; Mooberry SL; Cichewicz RH J. Nat. Prod 2020, 83, 2269–2280. [DOI] [PMC free article] [PubMed] [Google Scholar]
- (34).Kil YS; Risinger AL; Petersen CL; Mooberry SL; Cichewicz RH J. Nat. Prod 2020, 83, 2010–2024. [DOI] [PMC free article] [PubMed] [Google Scholar]
- (35).Cai S; Risinger AL; Petersen CL; Grkovic T; O’Keefe BR; Mooberry SL; Cichewicz RH J. Nat. Prod 2019, 82, 928–936. [DOI] [PMC free article] [PubMed] [Google Scholar]
- (36).Robles AJ; Cai S; Cichewicz RH; Mooberry SL Breast Cancer Res. Treat 2016, 157, 475–488. [DOI] [PMC free article] [PubMed] [Google Scholar]
- (37).Rycenga HB; Long DT Curr. Opin. Pharmacol 2018, 41, 20–26. [DOI] [PMC free article] [PubMed] [Google Scholar]
- (38).Dasari S; Tchounwou PB Eur. J. Pharmacol 2014, 740, 364–378. [DOI] [PMC free article] [PubMed] [Google Scholar]
- (39).Chanes RE; Condit PT; Bottomley RH; Nisimblat W Cancer 1971, 27, 613–617. [DOI] [PubMed] [Google Scholar]
- (40). The accronym LLAMAS (lickety-split ligand-affinity-based molecular angling system) was adopted as a simple moniker to specify the multifaceted combination of techniques incorporated in our ultrafiltration-based LC-PDA-MS/MS macromolecule-binding assay and the associated compound identification process.
- (41).Nguyen TD; Lesani M; Forrest I; Lan Y; Dean DA; Gibaut QMR; Guo Y; Hossain E; Olvera M; Panlilio H; Parab AR; Wu C; Bernatchez JA; Cichewicz RH; McCall LI Metabolites 2020, 10, 86. [DOI] [PMC free article] [PubMed] [Google Scholar]
- (42).Liu XF; Xiang LM; Zhou Q; Carralot JP; Prunotto M; Niederfellner G; Pastan I Proc. Natl. Acad. Sci. U. S. A 2016, 113, 10666–10671. [DOI] [PMC free article] [PubMed] [Google Scholar]
- (43).Sobell HM; Jain SC J. Mol. Biol 1972, 68, 21–34. [DOI] [PubMed] [Google Scholar]
- (44).Kamitori S; Takusagawa FJ Mol. Biol 1992, 225, 445–456. [DOI] [PubMed] [Google Scholar]
- (45).Quinn RA; Nothias LF; Vining O; Meehan M; Esquenazi E; Dorrestein PC Trends Pharmacol. Sci 2017, 38, 143–154. [DOI] [PubMed] [Google Scholar]
- (46).Zhang XF; Ye XW; Chai WY; Lian XY; Zhang ZZ Mar. Drugs 2016, 14, 181. [DOI] [PMC free article] [PubMed] [Google Scholar]
- (47).Li XL; Hu YJ; Wang H; Yu BQ; Yue HL Biomacromolecules 2012, 13, 873–880. [DOI] [PubMed] [Google Scholar]
- (48).Kamath S; Skeels M; Pai A Chin. Med 2009, 4, 17. [DOI] [PMC free article] [PubMed] [Google Scholar]
- (49).Jung HA; Yoon NY; Bae HJ; Min BS; Choi JS Arch. Pharmacal Res 2008, 31, 1405–1412. [DOI] [PubMed] [Google Scholar]
- (50).Dumont E; Monari AJ Phys. Chem. B 2015, 119, 410–419. [DOI] [PubMed] [Google Scholar]
- (51).Papi F; Ferraroni M; Rigo R; Da Ros S; Bazzicalupi C; Sissi C; Gratteri PJ Nat. Prod 2017, 80, 3129–3136. [DOI] [PubMed] [Google Scholar]
- (52).He M; Grkovic T; Evans JR; Thornburg CC; Akee RK; Thompson JR; Whitt JA; Harris MJ; Loyal JA; Britt JR; Jia L; White JD; Newman DJ; O’Keefe BR Fitoterapia 2019, 137, 104285. [DOI] [PMC free article] [PubMed] [Google Scholar]
- (53).Yang H; Wang Y; Yu W; Shi L; Wang H; Su R; Chen C; Liu S J. Sep. Sci 2018, 41, 2878–2885. [DOI] [PubMed] [Google Scholar]
- (54).Xie Z; Xu X; Xie C; Liang Z; Yang M; Huang J; Yang DJ Liq. Chromatogr. Relat. Technol 2014, 37, 343–352. [Google Scholar]
- (55).Li H; Chen X; Zhou S-JJ Pharmacol. Sci 2018, 137, 12–19. [DOI] [PubMed] [Google Scholar]
- (56).Wu M-Y; Wang S-F; Cai C-Z; Tan J-Q; Li M; Lu J-J; Chen X-P; Wang Y-T; Zheng W; Lu J-H Oncotarget 2017, 8, 77673. [DOI] [PMC free article] [PubMed] [Google Scholar]
- (57).Luo H; Peng M; Ye H; Chen L; Peng A; Tang M; Zhang F; Shi JJ Chromatogr. B: Anal. Technol. Biomed. Life Sci 2010, 878, 1929–1933. [DOI] [PubMed] [Google Scholar]
- (58).Fournet A; Cavé A; Duté P; Weber J-F; Bruneton J Phytochemistry 1987, 26, 2136–2137. [Google Scholar]
- (59).Schiff PL Jr. J. Nat. Prod 1991, 54, 645–749. [DOI] [PubMed] [Google Scholar]
- (60).Skehan P; Storeng R; Scudiero D; Monks A; McMahon J; Vistica D; Warren JT; Bokesch H; Kenney S; Boyd MR J. Natl. Cancer Inst 1990, 82, 1107–1112. [DOI] [PubMed] [Google Scholar]
- (61).Shaffer CV; Cai S; Peng J; Robles AJ; Hartley RM; Powell DR; Du L; Cichewicz RH; Mooberry SL J. Nat. Prod 2016, 79, 531–540. [DOI] [PMC free article] [PubMed] [Google Scholar]
Associated Data
This section collects any data citations, data availability statements, or supplementary materials included in this article.


