

Abstract
In vivo tibial loading in mice is increasingly used to study bone adaptation and mechanotransduction. To achieve standardized and defined experimental conditions, loading parameters and animal-related factors must be considered when performing in vivo loading studies. In this review we discuss these loading and animal-related experimental conditions, present methods to assess bone adaptation, and suggest reporting guidelines. This review originated from presentations by each of the authors at the workshop “Developing Best Practices for Mouse Models of In Vivo Loading” during the Preclinical Models Section at the Orthopaedic Research Society Annual Meeting, San Diego, CA, March 2017. Following the meeting, the authors engaged in detailed discussions with consideration of relevant literature. The guidelines and recommendations in this review are provided to help researchers perform in vivo loading experiments in mice, and thus further our knowledge of bone adaptation and the mechanisms involved in mechanotransduction.
Keywords: in vivo mechanical loading, bone adaptation, tibial loading
A description of the relationship between mechanical stress (or strain) and internal skeletal structures was first detailed in the mid-late 1800s by von Meyer, Culmann, and Wolff1; 2. The culmination of their works can be summarized by the trajectorial theory for bone, which describes the alignment of cancellous bone tissues with principal stress trajectories in the bone2. Roux (1880) added uniquely to this body of work the idea that functional adaptation of the skeleton is a dynamic and self-regulating process, rather than supposing that bones always exist at some static optimum3. These theories have since been extended to encompass functional relationships between mechanical loading and cortical bone geometry 4; 5, bone curvature 6, collagen fiber orientation 7–9, and vascular canal (osteonal) orientation 10. Investigation of skeletal functional adaptation through human exercise studies and pre-clinical animal models that used controlled applied loads and functional disuse began in the 1960s 11–16; and provided experimental evidence for the adaptive nature of the skeleton in response to mechanical loading. The results of these studies collectively led to mechanistic hypotheses predicated upon components of skeletal loading history in regulating bone modeling and remodeling responses at local skeletal sites (Figure 1) 10; 17–22. These hypotheses led to an entire field of computational bone remodeling in response to simulated mechanical stimuli 17; 23–27 and laid the foundation for much of our current understanding of skeletal mechanobiology (a.k.a., bone adaptation).
Figure 1:

(A) Illustration of the Mechanostat hypothesis, modified from Harold Frost’s original drawing 28. The horizontal axis depicts peak bone strain, and the vertical axis depicts net loss (−) or gain (+) of bone mass. The lower (yellow) pulsed line shows the threshold values of minimum effective strain (MES) for remodeling (MESr), modeling (MESm), microdamage (MESp) and fracture strain (Fx). The regions labeled at the top represent the disuse window (DW), adapted window (AW), mild overload window (MOW), and pathologic overload window (POW). The dotted line curves illustrate disuse and maintenance of bone and bone formation, originally suggested by Carter18. (B) In a model proposed by Carter and colleagues17; 29; 30, the horizontal axis represents the cumulative daily stress stimulus (a combination of stress magnitude and number of loading cycles experienced per day) relative to the rate of bone formation or resorption on the vertical axis. The attractor stimulus (ΨAS) is similar to Frost’s MESm and the width of the “lazy zone” is ΨAS +W, where W is the half-width of the range of stress stimuli experienced during normal daily activities.
Although local bone strain magnitude and loading history (the cumulative product of load-induced bone stress/strain and number of load cycles) were initially identified as key stimuli driving local formation and resorption, studies have reported bone formation at spatial sites experiencing low bone strain magnitude31; 32. Thus, to better understand the diversity of factors that influence load-induced bone (re)modeling, beyond simply the magnitude of the applied loads, a number of pre-clinical animal models have been developed. Use of these models has advanced our understanding of the sensitivity of the skeleton’s mechanobiological mechanisms to strain or loading rate, the number of load cycles applied within a given load bout, the duration (days or weeks) of the stimulus, and the role of rest-insertions or refractory periods in re-setting the sensitivity of the skeleton to subsequent load stimuli. Not only have these studies developed the foundation for physical strategies for stimulating bone formation or maintaining bone mass, but they have also led to the elucidation of molecular and cellular mechanisms for bone functional adaptation and tissue anabolism. While the skeletons of larger animal models (rabbits, dogs, pigs, sheep) may better represent human bone physiology, in the past twenty years, rodents have been predominantly used for these studies because of their relatively low cost, short lifespans, and the ability to manipulate their genomes to study specific cellular pathways. Targeting bone-formative mechanobiological pathways in combination with optimized physical regimens could synergistically provide more effective therapies for age-related bone loss, fracture healing, and other musculoskeletal diseases in humans and other species.
The goal for this review is to describe one commonly used rodent loading model, the mouse axial compression tibial loading model and key considerations for implementing and reporting the results using this model. Other reviews of the tibial axial compression model convey some of the aspects discussed here33–36. However, where these previous reviews focused on providing detailed methodological guidance for conducting tibial loading experiments, here we emphasize the various pre- and post-experimental factors to consider in successful implementation of this model. We specifically present (i) the basic software and hardware requirements for successfully conducting this model, (ii) methods for characterizing the load-induced mechanical environment in the tibia, (iii) the loading protocol parameters to consider in implementing this model, (iv) biological outcome measures that can be assessed using this model, (v) animal welfare considerations, and (vi) a select list of validated protocols for studying tibial adaptation to applied compressive loads.
A review of animal models used in skeletal loading studies
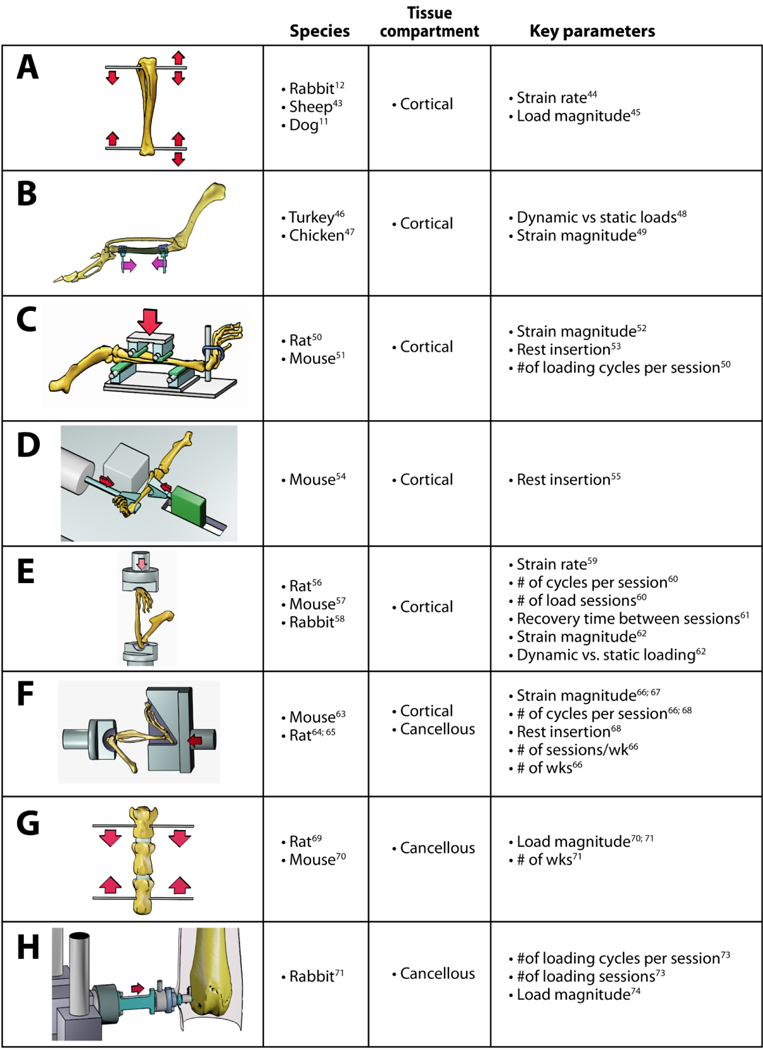
A number of pre-clinical skeletal loading models have contributed to our understanding of skeletal mechanobiology and bone functional adaptation (Table 1). These models maintain a high level of control over the loads applied to the skeleton, which consequently allows for a highly repeatable load stimulus and induced skeletal strains that can be accurately characterized empirically and computationally. Controlled loading models contrast exercise models in which the loads applied to the skeleton are not easily controlled and can be difficult to characterize. Furthermore, controlled loading models are able to isolate the effects of the mechanical stimulus to a target bone element, without inducing systemic physiological loading effects that might influence skeletal remodeling more broadly. Thus investigators are able to use the contralateral non-loaded limb as a within-animal control, which reduces the overall cost of animal life 37. Studies by one group have challenged this notion as they demonstrated that loading of a single limb (ulna) in young rats had systemic skeletal effects that led to changes in the contralateral limbs as well during the loading experiments38; 39. However, similar systemic effects were not reported by others using rat ulnar loading40 or mouse tibial loading 37; 41; 42, consistent with the notion that loading effects are predominantly local. Thus, the contralateral limb generally can be used as an internal control. We recommend that investigators confirm that the contralateral limb is equivalent to the limbs of non-loaded control animals in their own laboratory. Regardless of whether unilateral loading causes systemic-based effects on the skeleton, comparison of loaded versus contralateral control limbs will account for any systemic effects on the loaded limb’s response to load by normalizing the structural and histomorphometric parameters measured in the loaded limb to those measured for the contralateral limb.
Table 1:
Key in vivo animal models for the study of bone mechanobiology. References are shown for the initial report for each model as well as parameterization studies using the model. The models shown are (A) tibial axial loading though surgically-placed wires or pins, (B) avian surgically-isolated ulnar loading, (C) rodent four-point tibial bending, (D) mouse tibial cantilever bending, (E) rodent ulnar axial compression, (F) rodent tibial axial compression, (G) rodent vertebral compression, (H) rabbit distal femur cancellous compression.
|
The majority of the non-surgical, controlled skeletal loading models exclusively examine cortical bone adaptation to mechanical loading in rodents. In the rodent four-point bend tibial model (Table 1C), two load points on both the medial and lateral tibial diaphysis are used to induce a pure bending moment in the central diaphysis 50. In this model, loads are applied directly to the periosteum which elicits a periosteal contact response that potentially limits the use of this model to analyses of the endosteal response to load 51. Subsequent models have addressed this limitation by applying load through the joints, far removed from the cortical diaphysis. The rodent ulnar loading model examines cortical bone adaptation by applying compressive loads along the ulna’s long axis, while taking advantage of the bone’s curvature to induce a bending moment along the diaphysis 56; 57 (Table 1E). Because the carpus and olecranon process are used as the primary points of load application, no direct load is placed on the ulnar diaphysis. This model is the most well-characterized of the current rodent loading models in terms of the interactive effects of the different load parameters regulating cortical bone response to mechanical load. This model is still commonly used in mice and rats, and was recently adapted for rabbits58. While cancellous bone tissue is present in the olecranon and distal ulna, the volume of tissue present is quite small, especially in mice. As a result, no studies using this model have reported the effects of applied load on cancellous bone. A final purely cortical bone adaptation model is the mouse tibial cantilever model, which secures the knee against medial-lateral movement and applies a load laterally to the distal tibia to induce medial-lateral bending of the tibial diaphysis 54 (Table 1D).
Fewer animal models are available to examine cancellous bone adaptation, with all but one requiring surgical intervention to isolate cancellous tissue 69; 75. The rat tail vertebral model is a surgical model that was developed in the early 1990s 69, and continues to be used in a scaled- down version in the mouse 70 (Table 1G). This model applies load to adjacent vertebrae through pins, which can introduce a healing response. Furthermore, this model induces a non-physiological loading mode to generate supraphysiological strain that can produce pin deformation and pull out 76. Also, while the lumbar vertebrae (L5) in female C57Bl/6 mice undergo age-related bone loss77, the caudal vertebrae do not78. Thus, comparing adaptation at caudal vertebral sites in aged mice to aged humans may have limited clinical relevance and requires further study79.
One of the most recent long bone loading models to be developed and receive widespread use is the mouse axial compression tibial model, which can be used to examine both cortical and cancellous bone adaptation 63; 80 (Table 1F). Like the rodent ulnar model, the tibial model does not apply direct loads to the diaphysis. In this model, the distal femur and foot are fixed with plastic or metal fixtures and compressive loads are applied along the length of the tibia through the knee and ankle joints. The axial compression tibial model uses the tibia’s natural curvature proximal to the tibiofibular junction to induce highly repeatable tensile strains on the anterior-medial surface and compressive strains on the posterior-lateral surface of the diaphysis. While the bone strains required to induce bone formation are supraphysiological for the mouse, the strain distribution is fairly physiological, agreeing with the locomotor strain distributions measured in vivo 80 or modeled via finite element simulations81. This controlled loading model has been used to examine the effects of applied strain magnitude 66; 67; 82, load frequency (cycles per load bout) 66; 68, experiment length (number of daily load bouts) 66; 68, rest-insertion68, sex 83, sex hormones84, and age 42; 85–89 on the cortical bone response to load. Furthermore, this model has also been used in studies seeking to describe the role of specific proteins in bone anabolism and mechanobiology 90–95.
The axial compression tibial loading model uniquely enables investigation of these same mechanical and genetic variables in the cancellous bone tissues of the proximal tibia. This specific feature is important because most osteopenia-related bone fractures occur at cancellous-rich bone sites 96. The proximal tibial metaphysis has a cancellous bone volume fraction varying between 5% and 20% in C57Bl/6 and BALB/c mice depending upon age and sex 42; 79; 83; 86; 97; 98. While the absolute bone volume in the proximal tibial metaphysis is fairly similar to the ulnar olecranon, due to anatomical differences, histomorphometric and molecular analyses may be more technically-accessible for the proximal tibia than for the olecranon. Thus, the axial tibial loading model is able to examine the functional adaptation of cortical and cancellous bone tissues to fairly physiological loading as an integrated unit in a single long bone.
Implementing the mouse axial compression tibial loading model
The required elements for successfully implementing the axial compression tibial loading model include animal anesthesia, fixation of the knee and foot during loading, a device for controlled linear actuation, and a load cell. The system must also include software for designating load waveform parameters and that provides force feedback control to apply temporally repeatable peak loads of a specific magnitude to the hindlimb. Both custom and commercial linear actuator devices (hydraulic, electromagnetic, moving coil) with in-series load cells and software-based force feedback control have been used to implement this model (Figure 2). Most commonly, commercial materials testing systems with linear actuators (e.g., Dartec, Instron, TA Instruments/Bose, Biomomentum) are repurposed for in vivo bone loading.
Figure 2:

Photos of different loading devices used to perform in vivo tibial loading in mice 42; 63; 80; 100. A and C show mice in supine position with a horizontally-oriented tibia. B shows a supine mouse with vertical tibial orientation.
Beyond selecting proper hardware with software control, another important consideration is the alignment and shape of the fixtures used to hold the knee and foot during loading. For the fixtures, the critical design constraint is that the central points of force application on each end should align along an anatomical axis that transmits load along the tibia and limits flexion and extension of the knee during the load cycle (Figure 3). A large design space can satisfy these critical specifications. The point of contact at the femur can be fairly localized, while the contact with the foot is necessarily broad. Dorsiflexion of the foot in most established systems ranges from 30° to 56° 42; 83(Supplementary Figure 1). The foot holder must be wide enough to not laterally pinch the foot (4–5mm for mice) to avoid wear sores and calluses over the course of a multi-week loading study. Such calluses can also appear on the heels and should be monitored.
Figure 3:

Microcomputed tomography reconstruction of the mouse hindlimb showing common sites for strain gauge attachment for tibial loading studies and calibration of finite element (FE) models (modified from 106). Transverse FE cross-sections of the tibia showing that the common strain gauge locations do not coincide with peak modeled strains, which typically occur in the compression zone on the posterior-lateral surface of the tibia, a common site for bone formation in this model.
The knee fixture is a critical consideration in conducting tibial loading studies, but is rarely described in most protocols. The knee fixture should be designed to hold the distal femur and patella without applying load directly to the tibia. This configuration ensures that the applied load will be transmitted through the distal femoral condyles to the tibial plateau. In many published studies, the knee fixture features a semi-spherical cup to hold the distal femur. The dimensions of the knee cup can have profound effects on the outcome of a study. One of the authors (R.P. Main) has found that a cup with 6mm inner diameter and 3mm depth can be used to apply loads as high as 13–15N with no palpable disruption of the knee anatomy following multiple days of loading, while a knee cup with 10mm inner diameter and 5mm depth routinely causes knee dislocation and joint instability, with likely ACL rupture, within 100 applied load cycles using loads as low as 8N. Similarly, one group reported using a cup with a diameter of 9mm and a depth of 2–3mm that could safely be used at 7N loads, but caused ACL rupture at 9–10N loads 101. Knee flexion could be altered by variations in fixture cup diameter and depth. Deeper or wider cups can lead to increased joint mobility during loading that makes injury more likely. A potential link between knee flexion, femoral-tibial translation and knee cup geometry has not been formally investigated. This area deserves more attention since not all the potential users of this model may be trained to identify ACL rupture or other knee injuries. Such injuries should be avoided because of local or systemic pathologic responses that would affect the interpretation of load-induced skeletal changes. We have provided drawings of foot and knee fixtures used currently by some of the authors (Supplementary Figure 1). Another possible fixturing approach is to make custom-molded pads from hardened modeling clay or PMMA102; 103. This approach would allow a snug fit for the foot and knee, but would require different sets of molds for mice of different age, sex, or genotype.
Different research groups have positioned mice with different body and limb orientations during loading; supine with the limb held horizontally (supine-horizontal)63; 68; 93, prone with the limb held vertically (prone-vertical)88; 101, or supine with the limb held vertically (supine-vertical)80; 100; 104. These configurations are often dictated by physical restrictions caused by the hardware used to load the hindlimb. The potential effect of body positioning and limb orientation during loading has not been thoroughly examined. However, adaptive responses reported for prone-vertical and supine-horizontal orientations are generally similar41.
Calibrating and assessing the mechanical environment in the tibia during axial compression loading.
The goal for controlled loading models is to relate a quantifiable, known mechanical stimulus to a biological response. Therefore, the mechanical environment must be known and comparable across animals. The “mechanical environment” is the imposed load, the ensuing deformation, and the resulting stresses and strains in the tissue. For a given load, the stresses and strains induced in the bone are dependent on bone geometry (cross sectional size and shape) and material properties (elastic modulus). The applied load is almost always the controlled parameter for in vivo loading. “Load-matched” protocols apply the same peak load to all experimental groups, which is appropriate for answering the question, “How does the bone respond to a specific load magnitude?” For load-matched protocols tissue stresses and strains may vary across experimental groups, particularly if inter-group differences in bone size or material properties are present due to sex, age, or genotype. If such differences exist, the “load-matched” approach is typically not the best choice.
“Strain-matched” protocols adjust the peak loads, if necessary, so that the peak longitudinal strains are similar across groups. We recommend this approach as the gold standard, based on widespread evidence that the local strain stimulus drives the local (re)modeling response. To accomplish “strain matching”, a load-strain calibration is typically determined by attaching a strain gauge on the medial surface of the tibia. Some protocols have used two 80 or three 105 gauges. Locations for placement of the strain gauge are limited because of the size and shape of the tibia. Along most of the cortical diaphysis proximal to the tibiofibular junction, the medial (or anterior-medial) surface experiences tension (+strain) and the lateral (or posterior-lateral) surface experiences compression (-strain) during axial compression loading 86–89(1). Consistency in gauge placement is critical so that load-induced strains at a specific bone site can be directly compared for each group. Detailed protocols for strain gauging have been published previously 33; 34.
Calibration of the strain can be performed in vivo (in live anesthetized animals) or ex vivo (in cadaveric mice). Although in vivo calibration ensures conditions are exactly as in the experiments, ex vivo calibration is easier to perform. Strain-matched protocols ensure that the mechanical environment in the tissue is comparable between groups, and is often used when comparing mice of different sizes, ages, or genotypes 80; 93; 105. A longitudinal strain of 1200–2000με on the medial diaphysis is often used as a target value to induce an adaptive response. However, because strain magnitude varies greatly with location on the tibia, this target value is highly dependent on strain gauge placement. Thus, specific description of calibration gauge placement should be reported for each study in which this calibration is conducted.
Two common sites for strain gauge attachment are the mid-diaphysis (50% bone length) and a site at about 37% of bone length from the proximal end of the tibia (Fig. 3). Load-induced strain magnitudes differ at these two sites, typically with greater strains at the 37% site. At either of these two sites the peak strains at that bone level (i.e., the location along the long axis of the tibia) do not occur at the specific site of gauge placement. If knowing the peak induced strains is an important factor for a given study these can be estimated via finite element (FE) or planar strain analysis 105–107. The latter approach requires that three strain gauges be attached to a bone at the same proximal-distal plane which, in the mouse, can only realistically be accomplished ex vivo.
Strain gauges measure strain at specific locations on the tibia; however, the strain in the tibia is not homogenous and sampling a single location may not be representative. Digital image correlation (DIC) is an ex vivo technique that provides surface strains over a region. A speckle pattern is applied to the surface of the tibia (with soft tissues removed on a cadaveric tibia) and imaged during loading. The deformation of the speckle pattern on the surface allows determination of longitudinal, transverse, and shear strains across the entire surface of the tibia 104; 108. At least two cameras are used to record the speckle deformation during loading. The resolution of the strain measurement is dependent on the speckle pattern and the processing parameters used in determining strain. Studies using DIC to assess strain have demonstrated that local values of peak strain are much higher than those measured with strain gauges, and the distribution of strain in the tibia becomes more homogeneous with adaptation due to loading 108. To calibrate applied loads to achieve strain-matched protocols with DIC, one can use peak strain measures or an average strain over a defined area of the bone to achieve greater assurance that a larger area of the strain field is similar across groups than when a strain gauge is used to measure strain over a relatively small area of bone. While average strain values ultimately reduce all the spatial information provided by DIC into a single number, and therefore may not seem much different than strain gauging, the regions of bone that can be assessed by DIC are more extensive than can be achieved with strain gauges. DIC is particularly useful if the spatial characterization of the mechanical environment is needed to answer the research question.
Finite element (FE) modeling of the tibia is often used to determine non-measurable mechanical parameters (Figure 4). Tibial geometry is readily obtained from microCT scans. Material properties generally are assumed to be linear elastic and may be homogenous or heterogeneous, and isotropic or orthotropic 35; 105; 109–113. The tibial and fibular growth plates may or may not be modeled. The properties of the proximal fibular attachment can affect results 110; 113. As with any FE model, the assumptions limit the validity of the results, and the effects of assumptions on the results should be examined through sensitivity analyses and model validation with experimental measures 110. Parametric studies have shown that heterogeneous material properties and location and orientation of the applied load significantly influence the strains engendered 110; 115. If the centroid of the applied load is not aligned with the centroid of the fixed elements at the other end of the bone, excessive bending may be imposed and high strains at the tibiofibular junction ensue. Bending occurs even when the centroids are aligned due to the curvature of the tibia, but aligning centroids better ensures that FE-simulated axial loading matches actual loading conditions.
Figure 4:

(A) Finite element models of murine tibiae with simulated applied axial compressive loads from i.) based on 110 ii.) 114 iii.) 111, iv.) 105, and v.) 112. vi.) DIC of surface strains 108. All tibiae in (A) are viewed from the medial surface, except (iii) which is in lateral view. Tibiae shown are from mice of different ages and model different applied load magnitudes, but one can appreciate that while there are some differences in whole bone strain patterns, (particularly ii and iii, which have high strains at the tibiofibular junction), strain distributions at the (B) mid-point between the proximal bone end and the tibiofibular junction (~37% bone length) and (C) mid-shaft (50% of bone length) have quite similar strain distributions, likely owing to the strong effect of the bone curvature on the induced strain environment.
Calibration and characterization of the mechanical environment during tibial loading are not required for every study and depend on study design. For example, groups of mice of the same genotype, age, and gender will have similar mechanical environment, and it is sufficient to apply a load known to elicit a response for that genetic strain, age, and gender. If comparison of mechanoadaptation is required across groups that differ in genotype, age, gender, or treatment, calibration of the load is critical to ensure that the mechanical environment is the same for all groups. For these studies, a priori strain estimation with strain gauges remains the gold standard86; 109; 116; 117.
Experimental parameters to consider for in vivo loading experiments
With the increasing use of electromagnetic materials testing systems to apply mechanical loads to the murine tibia, more detailed manipulation of the loading protocol is possible. Although these systems allow for increased accuracy in delivering the desired loading regimen, they also allow for an increase in the number of customizable parameters, which consequently makes comparison of different studies from different groups challenging. Comparisons are further confounded because details of the loading protocol are frequently incompletely reported.
A key consideration when designing a mechanical loading protocol is the study rationale. Different research questions will require different loading protocols to generate the desired skeletal response. A single loading protocol will clearly not be suitable for all studies. For example, one investigator may wish to induce microdamage to investigate bone repair or woven bone formation in one study 118; 119, while in another study lamellar bone formation may be of interest. Generally, a submaximal response may be preferable so that any enhancement of the loading response is detectable for interventions that are expected to cause additive or synergistic effects on bone formation 120. Finally, the desired biological response should be considered when deciding upon a loading protocol. For example enzymatic changes are evident as early as six minutes following a single load bout 121 and changes in gene expression one hour after a single load 94; 122, while for mineralized bone formation generally 1–2 weeks of loading is required 66; 68.
A number of different characteristics define any experimental loading protocol and could synergistically affect the skeletal response to mechanical loading, including: the shape of the waveform (triangle, trapezoid, haversine), the dwell and peak load magnitudes, the rate of load application or duration of a single load cycle, the frequency of the applied loads, the number of cycles applied each day, the number of days over which to load, and the presence of any low-magnitude ‘rest’ phases (Fig. 5). The specific combination of these protocol characteristics should be thoroughly described in any published loading study.
Figure 5:

Illustration of the different waveforms used in tibial loading studies, including identification of their key characteristics.
Static vs. dynamic load
The first reports of experimentally applying mechanical load to animal bones were by Heřt who used a surgical approach for loading the rabbit tibia 12 (Table 1A). A key finding was that bone formation occurred in response to dynamic but not static loading. These findings were developed further by Lanyon using the isolated turkey ulna loading model (Table 1B) confirming endosteal bone resorption and increased porosity in response to static loading, whereas periosteal bone formation occurred with dynamic loading 48. The importance of a dynamic load stimulus has also been shown using the tibial four-point bend and ulnar axial compression models62; 123 (Table 1C, 1E). Studies investigating bone formation following loading will therefore almost exclusively apply a dynamic load waveform.
Loading waveform
Various waveforms have been used to investigate bone formation in response to mechanical stimulation, including: triangular 63, sinusoidal 124 or trapezoidal 57 (Figure 5). A sinusoidal waveform (e.g. haversine) possesses variation in the loading rate (slope) during loading and subsequent unloading, while triangle and trapezoid waveforms maintain constant loading rates during the entire loading and unloading phases, albeit with abrupt changes at the end of each loading segment. These abrupt changes in slope can introduce higher order frequencies that have not been characterized in tibial loading studies, but may affect the osteogenic potential of the different waveforms. Applying Fourier transform to the different waveforms would reveal the relative importance of different frequency components. The effects of waveform shape and frequency composition on the tissue-level response to load have not been comprehensively examined in the tibial loading model.
A recent study attempted a comparison between triangle and sinusoidal (haversine) waveforms, but found that their actuator system was not able to replicate the triangle waveform command signal in the mouse hindlimb, such that both waveforms appeared fairly sinusoidal as measured by the load cell 66 (Figure 6). Success in obtaining reliable triangle and trapezoidal waveforms is typically related to accurate tuning of the actuator-load cell feedback control, which some systems may be better able to achieve. Given the possible variance between command load signal and actual load output, investigators must validate the fidelity of the measured load signal relative to the programmed command signal. Where possible, the actual and intended load and load rates should be reported.
Figure 6:

Example load waveforms showing degrees of fidelity between the software-programmed, command waveforms and the load cell-measured waveforms for (A) triangle waveform38, (B) trapezoidal waveform, and (C) haversine and triangle waveforms66. These waveforms were commanded on different mechanical systems: (A) TA Instruments Electroforce TestBench, (B) TA Instruments Electroforce 3100, (C) Instron ElectroPuls E1000. In (A), the small ‘recovery’ spike needed to achieve the correct command pre-load results in a short delay of the signal and a load frequency of 3.75Hz, as opposed to the intended 4Hz. Some custom devices do not exhibit this spike when conducting triangle waveforms52.
Strain magnitude
Load-related bone formation correlates with the peak strain magnitude attained during loading. A clear dose:response relationship can be observed that is linear within the lamellar bone formation window 52; 67; 125 Above the threshold for woven bone formation the linear relationship can change depending on whether damage occurs to the cortical bone 22. Microdamage to human cortical bone occurs at 2500με in tension and 4000με in compression126, although values for rodent bone may be different. Bone formation will only be observed if the peak strain magnitude attained during loading exceeds that of normal habitual cage activity (a threshold limit sometimes referred to as the minimum effective strain, MES, Figure 7), or if the direction of loading is sufficiently novel to stimulate bone formation 89; 98. Below this level, bone mass will not change leading to a phenomenon known as the lazy zone, dead zone, or adapted window 22; 30.
Figure 7:

In animals which ambulate normally between loading bouts a minimum effective strain (MES) is apparent where bone formation is only observed above this threshold, referred to as the lazy or dead 30 zone; adapted from 89. This phenomenon was first reported experimentally for cortical bone using the tibial four-point bend model52 and the ulnar axial compression model125.
Similar to the practical limitations of achieving an idealized waveform, target load magnitudes can sometimes be difficult to reach depending upon the tuning of the loading system, due to a combination of the high rates of loading used and the viscoelastic nature of the mouse hindlimb. In these situations, some level of load ‘over-command’ or ‘under-command’ may be necessary to achieve the exact desired load (+ 0.2N). Iterative adjustment to the command load signal to match the intended and actual peak load magnitudes is more easily done in multi-day load protocols in which the command load magnitude can be adjusted from day-to-day. For single bout protocols, we suggest tuning the loading device and establishing a load protocol in fresh cadaveric material prior to loading in live mice.
Strain rate
Consistent with extra-cellular fluid flow around osteocytes being proposed as a possible mechano-stimulus in bone127, the rate at which strain (or load) is applied has also been positively correlated to the bone formation response 44; 59; 128. Using sinusoid waveforms, strain rate is impossible to alter without also altering load frequency, strain magnitude, or the dynamic strain range experienced by the bone. Changes in strain rate can be isolated from changes in strain magnitude and load frequency using trapezoidal or triangle waveforms, but only by altering the length of time spent at peak load or in the “rest” phase48. Because some studies have shown length of the rest phase to enhance load-induced bone formation, changing the duration of these static periods in the waveform could impact the response of the bone to load as well 55; 129. Thus, determining the relative contribution of each of these variables independently (strain rate, strain magnitude and load frequency) is challenging.
Frequency (number of loading cycles per second)
Studies using the turkey ulna loading model46, rat tibia four-point bending model 123; 128, and rat ulna axial loading model 125; 130 have all shown that increasing loading frequency causes enhanced bone formation (Table 1B, 1C, 1E). Cortical bone adaptation to mechanical loading increased with loading frequency up to 5–10 Hz and then plateaued with frequencies from 10–30Hz130. Increasing loading frequency may lead to an enhanced rate of fluid flow in the bone’s lacunar-canalicular system, with frequencies greater than 10 Hz leading to less efficient fluid flow and transduction processes. Load– response curves for in vivo osteocyte Ca2+ signaling were also shown to be dependent upon loading frequency (0.5, 1, and 2Hz), using a novel mouse metatarsal three-point bend model131.
Number of loading cycles per session
The number of cycles required to maintain bone mass or generate a bone formation response is surprisingly few, ranging from 5 to 60 depending on the study 47; 66; 68; 132. Increasing the cycle number beyond this does not dramatically increase the osteogenic response, suggesting that saturation of the stimulus occurs after relatively few cycles. Including excessive numbers of loading cycles in the loading regimen may unnecessarily increase anesthesia time and could increase the likelihood of inducing fatigue damage in the bone. Articular cartilage in the knee is also prone to damage, which could cause lameness and affect ambulation between loading bouts that would alter habitual loading and potentially bone mass 133–135. Furthermore, one study demonstrated that the bone formation response in trabecular bone actually decreased slightly when cycle number was increased from 216 to 1200 68. Therefore, minimizing loading cycle number is recommended whenever possible.
Number of loading sessions per week
A recent study demonstrated that the total number of load sessions (or bouts) over which loading is applied to the limb also affects the adaptive response 66. Loading for five days per week induced a 38% increase in cortical bone volume compared to 15% when loading was performed three days per week. Furthermore, reducing the length of loading from two weeks to one week did not reduce the bone formation response in cortical bone at the 37% site. Therefore, it would seem sensible to limit loading studies to a single week with loading on five consecutive days. This study measured only cortical bone response to load by dynamic histomorphometry and did not assess cancellous bone response to load, which may be differentially sensitive in response to various loading variables relative to cortical bone 68.
Rest insertion
Partitioning the number of loading cycles into short bouts with rest periods in between or inserting a period of rest between every cycle can increase the bone-formative response to loading in different loading models 53; 136. More recently, the effectiveness of short rest insertions for enhancing bone formation was challenged in a study using tibial axial compression, which did not find any benefit of inserting rest between every four cycles 68. A similar result was noted in an earlier rat ulnar loading study, albeit with more than one loading parameter varied between the two protocols compared40.
Pre-load or inter-cycle ‘resting’ load magnitude
Typically, a pre-load is applied through the loading system software prior to the start of any loading protocol, to hold the hindlimb firmly in place. This same load magnitude is often used as the ‘rest’ (or ‘dwell’) load in any rest-inserted protocol. When reported, this load has varied from −0.2N to −12.4N across different axial compression tibial loading studies 42; 63; 66; 86; 100. The effect of altering this initial (or resting) load level itself, or in combination with other loading parameters has not been systematically examined in the axal tibial loading model. A recent study using a novel off-axis compression tibial loading model in 4-month-old female BALB/c mice showed that even when keeping the change from pre-load to peak load similar (−3.8N), increasing the static pre-load from −0.03N to −1.5N had detrimental effects on bone formation, even though the greatest pre-load (−1.5N) also corresponded to the greatest applied peak load (−5.3N) 137. These results may depend upon the genetic strain, age of mouse, and loading protocol employed, but suggest that choice of pre-load magnitude can have important effects upon the load-induced anabolic response of both cortical and cancellous bone tissue. To this end, we recommend that the pre-load magnitude be minimized to below −1.0N where possible.
Minimum loading protocol parameter reporting
As part of this review, we have suggested guidelines regarding the minimum parameters that should be reported in a bone mechanical loading study (Table 2). In addition to reporting these parameters, ensuring that the desired parameters (e.g. peak load, loading rate, frequency) are achieved and the actual values reported is important.
Table 2:
Important loading protocol variables to report for tibial loading studies
| Number of loading cycles/bout | Number of loading bouts/week | Number of weeks loading |
|---|---|---|
| Peak load magnitude | Peak strain engendered and location in the bone | Frequency (e.g. # of load cycles/second) |
| Peak loading rate | Peak strain rate | Pre-load magnitude |
| Waveform used | Rest insertion (duration and load magnitude) | Animal/bone orientation: supinehorizontal, supine-vertical, prone-vertical |
Outcome measures to consider for tibial loading studies and when they are most effective
Microcomputed tomography
Microcomputed tomography (microCT) is the standard method to assess rodent volumetric bone mineral density and microstructure; reporting guidelines and nomenclature have been previously outlined 138. Although microCT is often performed ex vivo, after euthanasia, an increasing number of studies are implementing in vivo microCT imaging.
Longitudinal microCT imaging allows one to monitor changes in bone density and microstructure over time, but comes with special considerations, such as radiation exposure. Since frequent or excessive exposure to X-rays can lead to bone loss or skeletal abnormalities 139, a trade-off must be made between radiation dose and image quality if microCT will be used for in vivo assessment. Decreased trabecular bone volume fraction was reported in radiated limbs (4 scans over 5 weeks, 0.5 Gy per scan) compared to contralateral limbs (one scan) in 8–10 week old C3H/He (−8%), C57BL/6 (−13%), and BALB/cBy (−20%) female mice140. Willie et al. 42 also showed that radiation (approximate dose of 0.48 Gy per scan) caused decreased trabecular bone volume fraction and increased trabecular separation in young (10-week-old), but not adult (26week-old) C57BL/6 mice after comparing morphometric parameters of animals being radiated four times with an interval of five days to mice being radiated only once. Interestingly, a greater increase in trabecular bone volume fraction due to loading was measured in mice scanned four times over 2 weeks compared to mice scanned only once (+140% versus +88% load-induced increase, respectively) 42. These data and subsequent studies42; 141; 142 suggest that exposure to ionizing radiation from microCT imaging at these doses does not hamper the response of cancellous and cortical bone to mechanical loading.
Studies performing repeated in vivo microCT analyses should either measure the effect of radiation on bone formation in their individual study or use established protocols 143, with special attention when using skeletally immature mice. When choosing a volume of interest and voxel size, one must consider if the resulting scanning time and radiation exposure is acceptable. It is recommended that when using new protocols, an age-matched non-scanned or minimally scanned control group be included to determine the influence of radiation on bone (re)modeling.
Furthermore, because the contralateral hindlimb is commonly used as a non-loaded control, mice should be examined at baseline “time zero” prior to loading and imaging, by performing an additional in vivo microCT scan at baseline or including an additional group to examine with ex vivo microCT at baseline. These baseline data allow one to control for handedness, i.e., the assumption that the bone density, morphology, and microstructure of both left and right limbs are not significantly different at the onset of the study. This same age-matched non-loaded group (non-loaded left and right limb) that is scanned at baseline to determine handedness could also be scanned at end-point to compare with the non-loaded control limb of the loaded group, thus lending confidence to the use of your contralateral limb as a control that is unaffected by loading of the opposite limb. In some studies, the contralateral limb by itself is not an adequate control, such as when a tumor or systemic drug is injected into the mice, and thus a separate non-loaded group is essential 144.
Histomorphometry
While microCT is considered the gold standard to assess static bone microarchitecture, histomorphometry is still considered the gold standard to evaluate bone (re)modeling. Fluorochrome labeling has been used since the 1950s 145, when it was observed that tetracycline and other fluorescent dyes, such as alizarin and calcein green bind to newly forming hydroxyapatite, and thereby provide labels, which can be used to quantify dynamic active bone formation over a known time period. Histomorphometry guidelines and nomenclature have been reported 146, and continue to be updated 147.
Fluorochrome-derived histomorphometry must be performed on undecalcified sections, which are usually embedded in polymethyl methacrylate. The embedded mice tibiae should be sectioned in the frontal plane of the proximal metaphysis to assess trabecular bone morphology and in the transverse plane of the diaphysis to assess cortical bone morphology. The proximal metaphysis should not be sectioned in the transverse plane, since it is difficult to assess how far the region of interest is from the growth plate compared to having the entire proximal bone section within the analyzed field. In contrast to humans, mice do not normally undergo Haversian (intracortical) remodeling, but rather experience surface remodeling. Thus, the cortical diaphyseal region should be analyzed at both the endo- and periosteal surface. Intracortical remodeling has been observed in very old mice 148 or after fatigue loading which produces microdamage 149. At least the following parameters should be reported: single- and double-labeled surface per bone surface (sLS/BS, dLS/BS), mineralizing surface (MS/BS), mineral apposition rate (MAR), and bone-formation rate (BFR/BS), calculated as 0.5x sLS/BS + dLS/BS. An alternative metric that has been reported is inter-label area, which provides a simple measure of bone accrual in cases where a mix of lamellar and woven bone is induced59; 80. In cases where woven bone is noted, the incidence and location of woven bone should be described, and if applicable, values of woven bone surface (Wo.S/BS) and area (Wo.Ar/Ct.Ar) should be reported66; 67; 85. Recommendations on how one should express MS/BS, BFR/BS, and MAR in the absence of double and/or single labels in a sample are addressed elsewhere 150; 151.
Alternative methods for analyzing bone remodeling
Although histomorphometry has greatly advanced our understanding of bone formation, limitations include many necessary assumptions and the two-dimensional nature of the analyses. Label escape can occur if bone formation is initiated after the first label is given or if formation stopped before the second label was administered, resulting in only one label. Also, differentiating between surface modeling and surface remodeling in rodents using histomorphometry is extremely challenging 147; 152–155. Resorption cannot be assessed with dynamic histomorphometry, but rather is commonly assessed using tartrate-resistant acid phosphatase (TRAP) staining of osteoclasts. However, TRAP staining is a static measure that does not allow investigation of temporal or spatial distribution of resorption. Serial block face imaging has been reported as an alternative to assess both formation and resorption, since it allows 3D fluorochrome mapping 156 and quantification of the number and size of resorption cavities157. Although this approach for 3D mapping is often limited to measuring small sample volumes and only one-time point within a particular specimen, this method remains a valuable tool that combines the benefits of classical bone histomorphometry with the ability to examine volumes rather than areas.
Advances in microCT allow one to follow structural changes in the bone of living animals in 3D space over time 158; 159. A series of three-dimensional high-resolution images of the bone architecture of the living animal are taken with a time lapse, the duration of which depends on how rapidly the bone is (re)modeling (e.g. up to fifteen days or less in young growing mice tibiae170). A later 3D microCT data set is superimposed (registered) onto an earlier data set of the same mouse in a common coordinate system by rotating and translating one data set with respect to the other using an optimization criterion. This method identifies formation (F), resorption (R) and quiescent (Q) sites over given time intervals. Bone volumes only present in the earlier data set are considered resorbed, while volumes only present in the latter data correspond to formed bone volumes. Formed and resorbed bone volumes (MV/BV, EV/BV) surface areas (MS/BS, ES/BS), and thicknesses (MTh, ED) are reported. Time-lapse in vivo microCT-based morphometry was used in mice to assess cortical 87 and trabecular 160 bone formation and resorption after mechanical loading. By combining time-lapse in vivo morphometry with micro-finite element analysis, the local mechanoregulation of bone formation and resorption was reported for the mouse caudal vertebra 161; 162 and tibia 163; 164. This approach was extended to spatially and temporally track formation, resorption, and quiescent sites over time to distinguish between surface modeling (spatially not correlated formation and resorption) and surface remodeling (resorption followed by new formation at the same site) after tibial loading in adult female mice165. These microCT-based time-lapse methods hold a great deal of promise, but are limited by voxel size, which is typically on the order of the thickness of newly formed (or resorbed) bone. Additionally, image registration may be difficult in cases of rapid longitudinal bone growth and/or bone formation and resorption, such that the scanned VOI at the two time intervals does not include sufficient mutual information (similar architecture) to align and rigidly register the data 166.
Whole bone and material characterization.
Mechanical loading can alter the bone mass, geometry and microstructure and thus measuring these changes at the whole bone and tissue level are often performed. Jepsen et al. 167 introduced guidelines to evaluate phenotypic changes in mouse long bones using biomechanical testing and recommended minimum reportable information for experimental testing conditions and outcome variables. Other whole-bone morphometric properties to consider reporting are the tibial length and anterior–posterior and medial-lateral radii of curvature (CAP and CML, mm) 116, which can be measured from microCT scans.
In addition to altering bone mass and microstructure, some studies have indicated that mechanical loading can also alter bone mineral and matrix properties 168–171. The material bone mineral density or so-called tissue mineral density (TMD) represents a volume of bone matrix that does not include marrow spaces, osteonal canals, lacunae or canaliculi, thus reflecting the degree of mineralization of organic bone matrix. Although microCT can be used to assess tissue mineralization, lower resolutions are often used that include contributions from porosity. Also, the polychromatic beam used in lab-based microCT can suffer from beam hardening, which limits the accuracy of tissue mineralization measurements. Thus, other methods are often used to assess degree and heterogeneity of tissue mineralization including: quantitative backscattered electron imaging (qBEI), Fourier transform infrared spectroscopy (FTIR), and Raman spectroscopy. Mineral particle thickness, collagen crosslinks and microdamage, for example, can be measured using some of the aforementioned techniques.
Gene and protein expression analysis
The cellular and molecular mechanisms driving bone formation caused by mouse tibial loading have been examined using immunohistochemistry, quantitative real-time polymerase chain reaction, microarray, and RNA-sequencing91; 122; 172; 94; 124; 173; 174. Load-induced alterations in gene expression can be measured within one hour following loading 94. Therefore, studies that focus on gene-level mechano-transduction responses will typically perform a single bout of loading and then sacrifice the mice at various time points, up to 24 or 72 hours post-loading 122; 172. A single load bout is usually sufficient to induce a detectable immediate or near-term response to load, albeit the number of differentially expressed genes at 1–4 hrs after loading may be few122. To assay genes related to downstream bone formation and resorption effects following loading, gene expression should be measured within the first week following the initiation of loading, after either a single or multiple loading bouts 172; 174. Studies examining protein expression generally mimic either the single loading protocol used for gene expression analyses or the week(s) long loading protocol to assess bone mass gains 111. Processing of whole bones, diaphyses, or separation of the cancellous bone volume from the cortical bone volume have been reported 175. If the focus of the study is bone cell response to loading, we recommend removal of bone marrow (by flushing or centrifugation) so that the transcriptional response reflects bone cell activity and is not diluted by the large number of marrow cells175. If separately analyzing the cortical and cancellous bone is desirable, mice characterized by low bone mass phenotypes may require pooling of cancellous bone samples from multiple mice to obtain an adequate amount of RNA. When initially establishing a loading protocol, one should first determine if the protocol is anabolic in cortical and/or cancellous bone of the particular mouse strain being studied using standard methods including microCT and conventional histomorphometry before assessing outcome parameters such as gene or protein expression.
Animal welfare and husbandry considerations in tibial loading studies
Local and national animal welfare committee guidelines should be followed for animal housing, anesthesia, analgesia, and all other animal procedures. If choosing to individually house mice during the loading study, separation of mice no later than five days prior to loading is advised to reduce their time alone. Extended periods of pre-study isolation should be avoided as group housing is considered less stressful by most institutional animal welfare committees. The potential effects of cage enrichment (e.g. play tunnels, cardboard houses) on load-induced bone (re)modeling have not been explicitly examined. However, treadmill exercise prior to initiation of axial tibial loading altered some aspects of the bone adaptive response176, so enrichment options that offer opportunities for highly repetitive limb loading (e.g. running wheels) should be avoided. Isoflurane anesthesia is most commonly used during loading and additional procedures such as in vivo microCT imaging due to ease in controlling the depth of consciousness and lower mortality risk, in our experience, compared to injected ketamine-based cocktails.
Analgesics are not used in most loading protocols, but may be required by institutional animal care committees. While typically not visible by eye, evidence suggests that axial tibial loading can cause minor gait asymmetries following loading. Interestingly, changes in gait kinematics (stance time, stride length) do not occur in the loaded limbs, but in the non-loaded contralateral limb, perhaps as compensation for trauma done to the loaded limb 135. Development of protocols for gait outcome measures in loading studies would be a valuable advancement for monitoring behavior and cage activity following loading. While the analgesic Carprofen was effective in returning contralateral limb gait parameters to normal following a single loading bout, analgesics did not correct the altered gait in mice loaded three times a week for two weeks. We recommend avoiding the use of Carprofen and other COX-2 inhibitors that have been implicated in delayed bone healing in animals 177, blocking the activation of β-catenin signaling, and reducing sclerostin expression post-loading 178. If an analgesic is required by your institutional animal care committee or a more invasive procedure is coupled with tibial loading (e.g. bone healing)175, we recommend using buprenorphine or tramadol 66; 179. Analgesic dosage information should always be provided by the authors.
Care should be taken to avoid using load levels or fixture designs that cause pain or tissue damage such that the animal alters its normal gait and/or weight-bearing status because the anabolic response to loading is a combination of the applied loading protocol and normal ‘background’ loading. Application of high load magnitudes are a particular concern when using mice with high bone mass phenotypes that require higher load levels to engender comparable strains to those in wild-type mice. Pflanz et al. 93 reported excessive limping and ankle swelling in 10-week-old Sost KO mice after three days of loading mice at −17N to engender 1200μɛ on the medial midshaft. In this case, the investigators terminated the experiment at three days, euthanized the mice and proceeded with a new experiment in which the Sost mice were loaded at −12.9N engendering 900μɛ on the tibial mid-shaft. Similarly, the loads for the control mice were reduced from −11N to −7N to match the 900μɛ induced in the Sost KO mice. At these loads, the mice did not exhibit any ankle swelling or limping during the experiment.
Each study should describe the methods used for induction and maintenance of anesthesia during loading, the use of any post-loading analgesics, and provide assurance of approval for the study by the relevant institutional animal care and use review board. All excluded animals should be reported as well as the reason for their removal from the study, which can include for example, anesthesia overdose, euthanized to relieve distress, euthanized after sustaining a tibial fracture during loading. A poor response by the animals to the mechanical loading protocol will often be reflected in their body mass. Body mass should be monitored daily for loading studies of three days or longer and animals given nutritional supplement if their mass drops by 10–15%. Animals should be excluded from the study (or euthanized) if body mass decreases by 25% of the initial body mass.
What we have learned about mechanoresponse from tibial axial loading studies?
Several studies have used this model to examine the effects of age, sex, mouse strain, and background activity levels on the cortical and cancellous bone response to loading. The bone formation response to loading is reduced with age in female C57Bl/6 mice tibiae 42; 85; 86; 89; 97; 180; 181. Less is known about age-related changes in adaptation to loading in males or other mouse strains 79. The Silva group 88 reported that old (22 months) male BALB/c mice had a significantly greater response to loading at the endocortical surface than mature (7 months) mice, while responses at the periosteal surface did not differ between age groups. They also examined female BALB/c mice 174 and observed at cortical sites that the young-adult skeleton (4 months) is more responsive to loading in terms of bone formation than the mature to middle aged skeleton (7–12 months). Interestingly, their loading protocol was not anabolic in these studies, and actually diminished trabecular BV/TV in adult mice (4–12 months old)88; 174. In a follow-up study, they observed a mild anabolic response in trabecular bone in 4-month-old mice, although when they compared their loading protocol to one used by the Cornell/HSS group, regardless of mouse strain (C57BL/6 or BALB/c), the Cornell/HSS protocol induced a greater accrual of trabecular bone and an earlier peak in cortical bone volume accrual41. In terms of bone volume, mouse strain did not affect the overall tibial response to loading, but rather the manner of relative changes in trabecular thickness and cortical accrual, which were greater in C57BL/6 than BALB/c mice 41. However, the estimated peak bone strains differed by approximately 20% between C57BL/6 and BALB/c mice, so results for the bone tissue response to load between these two strains may not be directly comparable in this study. Additional studies are needed to further investigate mouse strain-related differences in mechano-adaptation using the axial compression tibial loading model.
Studies have used this tibial loading model to investigate the role of specific proteins on bone mechanotransduction by subjecting transgenic and conditional knock-in/knock-out mice to tibial loading. An experimental design consideration is whether to use littermate or wild-type controls when examining transgenic mice. To avoid the effects of genetic drift within a mouse strain, littermate control mice are the gold-standard. Wildtype mice may display more variability in terms of basal expression of certain proteins, due to differing genetic backgrounds compared to littermates who share the same parents as the transgenic strain of interest.
Studies of tibial loading have been performed using both male and female mice, although far fewer studies have examined how male mice respond to loading. The effect of mechanical load on cancellous response to load did not show any differences by sex, when strain-matched loading was performed in 10wk old male and female C57BL/6 mice 83. Other studies observed an elevated mechanoresponse in the cortical bone of female compared to male wild-type mice 91; 117; 182; 183; 179. In keeping with NIH guidelines, inclusion of sex as a biological variable is encouraged. However, certain differences between males and females must be considered. First, studies working with adult male mice must consider the possible impact of group housing on study results (see below). Secondly, important sex-related differences exist in cortical and cancellous bone mass between male and female mice.
Strain gauge calibration allows one to equalize cortical bone strain stimuli at a specific cortical location. Relative cancellous bone volume can vary by sex and genotype 77; 83; 89 and may induce different cancellous mechanical stimuli between experimental groups. If the primary goal is to compare the cancellous tissue response to load between different sexes or genotypes, the strains induced in cancellous tissues during loading should be modeled for all study groups. If two load values alone are not sufficient to equalize strain stimuli in the cancellous and cortical tissues simultaneously between two groups, one can prioritize the experimental design for one tissue type or conduct two independent studies in which strain stimuli are equalized in cortical and cancellous tissues separately.
Another variable to consider is the habitual activity of the mice between loading bouts. Reducing hindlimb loading through unilateral sciatic neurectomy can increase the unloaded tibia’s response to loading, even in aged mice 176; 184. Conversely, increasing activity through treadmill exercise prior to loading reduced the trabecular response to mechanical loading.33 Finally, the response to loading in adult male mice was reduced when mice were group housed. The reduced adaptive response was believed to be caused by increased strains engendered in the tibiae during group-housed fighting activities that increased the minimum effective strain and masked the response to loading 98. Adult male mice should be individually housed during loading studies. If group housing is used, care should be taken to observe if fighting is occurring. The influence of group housing in interpreting the results of skeletal loading studies is less for younger mice or females, who are less likely to fight. If male mice are over 7 weeks of age and group housed, placing them into separate cages 5–7 days prior to the loading experiment is sufficient to permit a significant load-induced bone formation response (R. Main, unpublished data).
Recommendations for tibial loading protocols (consensus from our group)
About 100 published studies have used the axial compression tibial loading model to study various aspects of bone formation and bone mechanobiology. Many of these studies employ different protocol parameters to accomplish their goals. Thus, no single loading protocol has been used consistently in axial compression tibial loading. Assuming that one protocol would be ‘right’ for all studies is unrealistic. Protocol parameters should be chosen according to the study goals. Furthermore, a lot of unexplored parameter space remains and our understanding is limited regarding interactions of the various protocol parameters with one another and animal intrinsic factors (e.g. animal age, sex, genetic strain, hormone status) to form either lamellar or woven bone. As mentioned earlier, one problem with all of the unique loading protocols used is that comparison of results across studies is difficult. Thus, despite the near limitless options for combinations of protocol parameters and the number of different protocols that have successfully produced load-induced bone formation, we provide here four protocols that have been used successfully on numerous occasions in an effort to facilitate inter-study comparison, or provide a starting point for new investigators. These protocols reliably result in bone formation and/or elicit changes in gene expression related to bone formation. Please note that applied load (or strain) levels may need to be altered from those presented here depending on animal intrinsic factors.
Target longitudinal bone strain and strain rate: +1200με on medial mid-shaft (50%) site (+16,000με/s)
Waveform: triangle
Ramp/unload timeframe: 0.15s (0.075s ramp, 0.075sec unload)
Load application frequency: 4Hz (0.1sec ‘rest’ phase between consecutive ramp/unload cycles)
Inter-cycle ‘rest’ phase load: −1.5N
Long-term rest insert: None
Number of load cycles per day: 1200
Number of loading days: 10d over two weeks (e.g. Monday-Friday loading for two weeks)
Euthanasia: Mice euthanized on the third day following the last day of load application
Notes: Protocol induces cancellous and cortical anabolic responses detected by endpoint microCT in female and male C57Bl/6 mice. Short-term load-induced changes in gene expression by RNA-Seq and qPCR have been found in mice euthanized within 3–24 hours following a single loading bout122.
Target longitudinal bone strain and strain rate: +1000με on medial 37% site (+13,333 με/s); −1800με on posterior-lateral cortex 37% site (−24,000με/s).
Waveform: Haversine
Load application frequency: 4Hz
Pre-load: −0.5N
Rest Insert: None
Number of load cycles per day: 60
Number of loading days: 5d consecutive over one week
Euthanasia: Mice euthanized one week following last load application
Notes: Protocol induces increased bone formation indices by dynamic histomorphometry, and changes in gene expression by qPCR and RNA-Seq in female C57Bl/6 mice; the number of loading days may be increased to 10 over a 2-week period to better induce detectable bone accrual by microCT.
Target longitudinal bone strain and strain rate: +1200με on medial mid-shaft (50%) site (+16,000με/s), +1750με on anterior-medial cortex at the 37% site (26-week-old female C57Bl/6 mice).
Waveform: triangle
Ramp/unload timeframe: 0.15s (0.075s ramp, 0.075sec unload)
Load application frequency: 4Hz (0.1sec ‘rest’ phase between consecutive ramp/unload cycles)
Inter-cycle rest phase load: −1N
Rest Insert: 5s at −1N after every fourth cycle
Number of load cycles per day: 216
Number of loading days: 10d over two weeks (e.g. Monday-Friday loading for two weeks)
Euthanasia: Mice euthanized three days after the last day of load application
Notes: Protocol induces cancellous and cortical lamellar bone formation detected by endpoint microCT, time-lapse morphometry and histomorphometry in female 10, 26, and 78 week old C57Bl/6 mice24; 87;170. Short-term load-induced changes in gene expression by microarray and qPCR have been found in female 78 week old C57BL/6 mice euthanized within 1–24 hours following a single loading bout (B. Willie, unpublished data).
Target longitudinal bone strain and strain rate: +1800με on medial 37% site (+31,000με/s);
−4000με on posterior-lateral cortex at the 37% site (−160,000με/s).
Waveform: trapezoid
Ramp/unload timeframe: 0.10s (0.025s ramp, 0.05s hold at peak load, 0.025s unload)
Load application frequency: Not applicable, a single load cycle then long rest phase
Inter-cycle ‘rest’ phase load: −0.5N
Rest Insert: 10s after every cycle
Number of load cycles per day: 40
Number of loading days: Three days per week (e.g. Monday, Wednesday, Friday) or alternate days for two weeks
Euthanasia: Mice euthanized two days following the last load application
Notes: Woven bone can be observed on the periosteal surface of the posterior-lateral cortex of 16–19-week-old female C57Bl/6 mice67; 89; 111. Woven or lamellar bone is formed on this surface in male mice of similar age89; 98. Lamellar bone is formed on the medial periosteal surface. Older mice (19 month) of both sexes show primarily lamellar periosteal bone formation89. Cancellous BV/TV increases with load. Load-related changes in sclerostin and other bone anabolic markers have been described using this protocol or subtle variants of it after one or two loading bouts89; 111 and gene expression changes as early as one hour after a single loading bout94.
Conclusions
The guidelines and recommendations provided in this review are intended to help researchers successfully perform in vivo loading experiments in mice, and thus contribute to extension of our knowledge of the mechanisms of bone mechanotransduction. Furthermore, the reporting of mechanical loading studies needs to become more complete and transparent, using the defined parameters that we have outlined in this review. Adopting a single loading protocol for all studies using the tibial axial compression model is unrealistic. However, limiting protocol variation to a small set of defined protocols upon which minor changes can be made as dictated by study requirements would enhance the uniformity of basic results and increase our ability to compare study results between different research groups.
Prior studies with the tibial axial compression model and other skeletal loading models have laid a strong foundation for our understanding of bone mechanotransduction. However, much remains to be learned about the physical and chemical processes of mechanotransduction at the level of the single cell (osteocyte, osteoblast, etc.). Adopting a broader view of bone as a heterogenous organ, instead of focusing on discrete tissue envelopes (cancellous bone, cortical bone, periosteum, marrow tissues), will determine how cross-talk between these tissues regulate bone (re)modeling and the unique contributions of different tissue microenvironments to this process. Studies examining interactions between skeletal loading and factors such as age, sex, obesity, reproductive status, stage in estrus cycle, circulating protein and hormone levels, and genetic modification are expected to continue to reveal important insights regarding disease- or age-related changes in skeletal mechanotransduction and contribute to our understanding of age-related skeletal wasting diseases. Novel applications of this model, such as studies examining the role of mechanical loading on cancer tumor growth and metastasis in bone144, the role of repetitive loading in the development of knee osteoarthritis133; 134, or solute transport in the lacunar-canalicular network185 are expected to continue to develop.
While in vitro and computational studies are critical to continued advancements in bone mechanobiology, presently such approaches are not able to capture the complexity of the three-dimensional environment in bone, the interaction of different cell types, or the complexities of relevant genetic pathways to answer all questions. Thus, for the foreseeable future, much of our understanding of bone mechanobiology at the cell and tissue levels will continue to be based on in vivo loading models, including the mouse axial compression tibial loading model.
Supplementary Material
Acknowledgments
We thank the Orthopaedic Research Society Pre-Clinical Models Section, especially Dr. Kurt Hankenson, for inviting us to develop and present a workshop focused on the implementation of the tibial axial compression loading model. We thank Dr. Dianne Little of the ORS Pre-Clinical Animals Models Section, for providing critical feedback on an earlier draft of this manuscript. We thank Dr. Joseph Wallace for Figure 2B and Mark Lepik for assistance with figures.
Funding support:
RPM: NSF CMMI 1463523; SJS: BBSRC BB/I012702/1; MJS: NIH R01-AR047867; MCHvdM: NIH R21-AR071587; BMW: Shriners Hospitals for Children and FRQS Programme de bourses de chercheur.
Footnotes
Conflict of Interest Statement: All authors state that there are no financial or institutional conflicts of interest represented in this work.
Publisher's Disclaimer: This is the author manuscript accepted for publication and undergone full peer review but has not been through the copyediting, typesetting, pagination and proofreading process, which may lead to differences between this version and the Version of Record. Please cite this article as doi: 10.1002/jor.24466.
References:
- 1.Roesler H. 1981. Some historical remarks on the theory of cancellous bone structure (Wolff’s Law). In: SC C editor. Mechanical properties of bone: American Society of Mechanical Engineers Publication AMD; pp. 27–42. [Google Scholar]
- 2.Wolff J. 1892. Das Gesetz der Transformation der Knochen. Berlin: Hischwald; [Google Scholar]
- 3.Roux W. 1881. Der Kampf der Teile im Organismus;
- 4.de Margerie E, Sanchez S, Cubo J, et al. 2005. Torsional resistance as a principal component of the structural design of long bones: comparative multivariate evidence in birds. Anat Rec A Discov Mol Cell Evol Biol 282:49–66. [DOI] [PubMed] [Google Scholar]
- 5.Pauwels F. 1980. Biomechanics of the locomotor apparatus. Berlin: SpringerVerlag. [Google Scholar]
- 6.Bertram JE, Biewener AA. 1988. Bone curvature: sacrificing strength for load predictability? J Theor Biol 131:75–92. [DOI] [PubMed] [Google Scholar]
- 7.Skedros JG, Mendenhall SD, Kiser CJ, et al. 2009. Interpreting cortical bone adaptation and load history by quantifying osteon morphotypes in circularly polarized light images. Bone 44:392–403. [DOI] [PubMed] [Google Scholar]
- 8.Riggs CM, Lanyon LE, Boyde A. 1993. Functional associations between collagen fibre orientation and locomotor strain direction in cortical bone of the equine radius. Anat Embryol (Berl) 187:231–238. [DOI] [PubMed] [Google Scholar]
- 9.Riggs CM, Vaughan LC, Evans GP, et al. 1993. Mechanical implications of collagen fibre orientation in cortical bone of the equine radius. Anat Embryol (Berl) 187:239–248. [DOI] [PubMed] [Google Scholar]
- 10.Lanyon LE. 1987. Functional strain in bone tissue as an objective, and controlling stimulus for adaptive bone remodelling. J Biomech 20:1083–1093. [DOI] [PubMed] [Google Scholar]
- 11.Chamay A, Tschantz P. 1972. Mechanical influences in bone remodeling. Experimental research on Wolff’s law. J Biomech 5:173–180. [DOI] [PubMed] [Google Scholar]
- 12.Hert J, Liskova M, Landa J. 1971. Reaction of bone to mechanical stimuli. 1. Continuous and intermittent loading of tibia in rabbit. Folia Morphol (Praha) 19:290–300. [PubMed] [Google Scholar]
- 13.Hert J, Liskova M, Landrgot B. 1969. Influence of the long-term, continuous bending on the bone. An experimental study on the tibia of the rabbit. Folia Morphol (Praha) 17:389–399. [PubMed] [Google Scholar]
- 14.Goodship AE, Lanyon LE, McFie H. 1979. Functional adaptation of bone to increased stress. An experimental study. J Bone Joint Surg Am 61:539–546. [PubMed] [Google Scholar]
- 15.Uhthoff HK, Jaworski ZF. 1978. Bone loss in response to long-term immobilisation. J Bone Joint Surg Br 60-B:420–429. [DOI] [PubMed] [Google Scholar]
- 16.Jones HH, Priest JD, Hayes WC, et al. 1977. Humeral hypertrophy in response to exercise. J Bone Joint Surg Am 59:204–208. [PubMed] [Google Scholar]
- 17.Beaupre GS, Orr TE, Carter DR. 1990. An approach for time-dependent bone modeling and remodeling--theoretical development. J Orthop Res 8:651–661. [DOI] [PubMed] [Google Scholar]
- 18.Carter DR. 1984. Mechanical loading histories and cortical bone remodeling. Calcif Tissue Int 36 Suppl 1:S19–24. [DOI] [PubMed] [Google Scholar]
- 19.Frost HM. 1983. A determinant of bone architecture. The minimum effective strain. Clin Orthop Relat Res:286–292. [PubMed]
- 20.Frost HM. 1987. Bone “mass” and the “mechanostat”: a proposal. Anat Rec 219:1–9. [DOI] [PubMed] [Google Scholar]
- 21.Frost HM. 1987. The mechanostat: a proposed pathogenic mechanism of osteoporoses and the bone mass effects of mechanical and nonmechanical agents. Bone Miner 2:73–85. [PubMed] [Google Scholar]
- 22.Frost HM. 2003. Bone’s mechanostat: a 2003 update. Anat Rec A Discov Mol Cell Evol Biol 275:1081–1101. [DOI] [PubMed] [Google Scholar]
- 23.Fyhrie DP, Carter DR. 1986. A unifying principle relating stress to trabecular bone morphology. J Orthop Res 4:304–317. [DOI] [PubMed] [Google Scholar]
- 24.van der Meulen MC, Beaupre GS, Carter DR. 1993. Mechanobiologic influences in long bone cross-sectional growth. Bone 14:635–642. [DOI] [PubMed] [Google Scholar]
- 25.Huiskes R, Ruimerman R, van Lenthe GH, et al. 2000. Effects of mechanical forces on maintenance and adaptation of form in trabecular bone. Nature 405:704706. [DOI] [PubMed] [Google Scholar]
- 26.Ryser MD, Nigam N, Komarova SV. 2009. Mathematical modeling of spatiotemporal dynamics of a single bone multicellular unit. J Bone Miner Res 24:860870. [DOI] [PubMed] [Google Scholar]
- 27.Tiwari AK, Prasad J. 2017. Computer modelling of bone’s adaptation: the role of normal strain, shear strain and fluid flow. Biomech Model Mechanobiol 16:395410. [DOI] [PubMed] [Google Scholar]
- 28.Frost HM 1997. On our age-related bone loss: insights from a new paradigm. J Bone Miner Res 12:1539–1546. [DOI] [PubMed] [Google Scholar]
- 29.Carter DR, Beaupré GS. 2001. Skeletal Function and Form: Mechanobiology of Skeletal Development, Aging, and Regeneration.: Cambridge University Press. [Google Scholar]
- 30.Beaupre GS, Orr TE, Carter DR. 1990. An approach for time-dependent bone modeling and remodeling-application: a preliminary remodeling simulation. J Orthop Res 8:662–670. [DOI] [PubMed] [Google Scholar]
- 31.Gross TS, Edwards JL, McLeod KJ, et al. 1997. Strain gradients correlate with sites of periosteal bone formation. J Bone Miner Res 12:982–988. [DOI] [PubMed] [Google Scholar]
- 32.Judex S, Gross TS, Zernicke RF. 1997. Strain gradients correlate with sites of exercise-induced bone-forming surfaces in the adult skeleton. J Bone Miner Res 12:1737–1745. [DOI] [PubMed] [Google Scholar]
- 33.Melville KM, Robling AG, van der Meulen MC. 2015. In vivo axial loading of the mouse tibia. Methods Mol Biol 1226:99–115. [DOI] [PMC free article] [PubMed] [Google Scholar]
- 34.Saxon LK, Lanyon LE. 2008. Assessment of the in vivo adaptive response to mechanical loading. Methods Mol Biol 455:307–322. [DOI] [PubMed] [Google Scholar]
- 35.Stadelmann VA, Hocke J, Verhelle J, et al. 2009. 3D strain map of axially loaded mouse tibia: a numerical analysis validated by experimental measurements. Comput Methods Biomech Biomed Engin 12:95–100. [DOI] [PubMed] [Google Scholar]
- 36.de Souza RL, Saxon L. 2012. In vivo mechanical loading. Methods Mol Biol 816:621–636. [DOI] [PubMed] [Google Scholar]
- 37.Sugiyama T, Price JS, Lanyon LE. 2010. Functional adaptation to mechanical loading in both cortical and cancellous bone is controlled locally and is confined to the loaded bones. Bone 46:314–321. [DOI] [PMC free article] [PubMed] [Google Scholar]
- 38.Sample SJ, Collins RJ, Wilson AP, et al. 2010. Systemic effects of ulna loading in male rats during functional adaptation. J Bone Miner Res 25:2016–2028. [DOI] [PMC free article] [PubMed] [Google Scholar]
- 39.Sample SJ, Behan M, Smith L, et al. 2008. Functional adaptation to loading of a single bone is neuronally regulated and involves multiple bones. J Bone Miner Res 23:1372–1381. [DOI] [PMC free article] [PubMed] [Google Scholar]
- 40.McKenzie JA, Silva MJ. 2011. Comparing histological, vascular and molecular responses associated with woven and lamellar bone formation induced by mechanical loading in the rat ulna. Bone 48:250–258. [DOI] [PMC free article] [PubMed] [Google Scholar]
- 41.Holguin N, Brodt MD, Sanchez ME, et al. 2013. Adaptation of tibial structure and strength to axial compression depends on loading history in both C57BL/6 and BALB/c mice. Calcif Tissue Int 93:211–221. [DOI] [PMC free article] [PubMed] [Google Scholar]
- 42.Willie BM, Birkhold AI, Razi H, et al. 2013. Diminished response to in vivo mechanical loading in trabecular and not cortical bone in adulthood of female C57Bl/6 mice coincides with a reduction in deformation to load. Bone 55:335346. [DOI] [PubMed] [Google Scholar]
- 43.Churches AE, Howlett CR. 1982. Functional adaptation of bone in response to sinusoidally varying controlled compressive loading of the ovine metacarpus. Clin Orthop Relat Res:265–280. [PubMed]
- 44.O’Connor JA, Lanyon LE, MacFie H. 1982. The influence of strain rate on adaptive bone remodelling. J Biomech 15:767–781. [DOI] [PubMed] [Google Scholar]
- 45.Meade JB, Cowin SC, Klawitter JJ, et al. 1984. Bone remodeling due to continuously applied loads. Calcif Tissue Int 36 Suppl 1:S25–30. [DOI] [PubMed] [Google Scholar]
- 46.Rubin CT, Lanyon LE. 1987. Kappa Delta Award paper. Osteoregulatory nature of mechanical stimuli: function as a determinant for adaptive remodeling in bone. J Orthop Res 5:300–310. [DOI] [PubMed] [Google Scholar]
- 47.Rubin CT, Lanyon LE. 1984. Regulation of bone formation by applied dynamic loads. J Bone Joint Surg Am 66:397–402. [PubMed] [Google Scholar]
- 48.Lanyon LE, Rubin CT. 1984. Static vs dynamic loads as an influence on bone remodelling. J Biomech 17:897–905. [DOI] [PubMed] [Google Scholar]
- 49.Rubin CT, Lanyon LE. 1985. Regulation of bone mass by mechanical strain magnitude. Calcif Tissue Int 37:411–417. [DOI] [PubMed] [Google Scholar]
- 50.Turner CH, Akhter MP, Raab DM, et al. 1991. A noninvasive, in vivo model for studying strain adaptive bone modeling. Bone 12:73–79. [DOI] [PubMed] [Google Scholar]
- 51.Akhter MP, Cullen DM, Pedersen EA, et al. 1998. Bone response to in vivo mechanical loading in two breeds of mice. Calcif Tissue Int 63:442–449. [DOI] [PubMed] [Google Scholar]
- 52.Turner CH, Forwood MR, Rho JY, et al. 1994. Mechanical loading thresholds for lamellar and woven bone formation. J Bone Miner Res 9:87–97. [DOI] [PubMed] [Google Scholar]
- 53.Robling AG, Burr DB, Turner CH. 2000. Partitioning a daily mechanical stimulus into discrete loading bouts improves the osteogenic response to loading. J Bone Miner Res 15:1596–1602. [DOI] [PubMed] [Google Scholar]
- 54.Gross TS, Srinivasan S, Liu CC, et al. 2002. Noninvasive loading of the murine tibia: an in vivo model for the study of mechanotransduction. J Bone Miner Res 17:493–501. [DOI] [PMC free article] [PubMed] [Google Scholar]
- 55.Srinivasan S, Agans SC, King KA, et al. 2003. Enabling bone formation in the aged skeleton via rest-inserted mechanical loading. Bone 33:946–955. [DOI] [PubMed] [Google Scholar]
- 56.Torrance AG, Mosley JR, Suswillo RF, et al. 1994. Noninvasive loading of the rat ulna in vivo induces a strain-related modeling response uncomplicated by trauma or periostal pressure. Calcif Tissue Int 54:241–247. [DOI] [PubMed] [Google Scholar]
- 57.Lee KC, Maxwell A, Lanyon LE. 2002. Validation of a technique for studying functional adaptation of the mouse ulna in response to mechanical loading. Bone 31:407–412. [DOI] [PubMed] [Google Scholar]
- 58.Baumann AP, Aref MW, Turnbull TL, et al. 2015. Development of an in vivo rabbit ulnar loading model. Bone 75:55–61. [DOI] [PubMed] [Google Scholar]
- 59.Mosley JR, Lanyon LE. 1998. Strain rate as a controlling influence on adaptive modeling in response to dynamic loading of the ulna in growing male rats. Bone 23:313–318. [DOI] [PubMed] [Google Scholar]
- 60.Robling AG, Hinant FM, Burr DB, et al. 2002. Improved bone structure and strength after long-term mechanical loading is greatest if loading is separated into short bouts. J Bone Miner Res 17:1545–1554. [DOI] [PubMed] [Google Scholar]
- 61.Robling AG, Burr DB, Turner CH. 2001. Recovery periods restore mechanosensitivity to dynamically loaded bone. J Exp Biol 204:3389–3399. [DOI] [PubMed] [Google Scholar]
- 62.Robling AG, Duijvelaar KM, Geevers JV, et al. 2001. Modulation of appositional and longitudinal bone growth in the rat ulna by applied static and dynamic force. Bone 29:105–113. [DOI] [PubMed] [Google Scholar]
- 63.Fritton JC, Myers ER, Wright TM, et al. 2005. Loading induces site-specific increases in mineral content assessed by microcomputed tomography of the mouse tibia. Bone 36:1030–1038. [DOI] [PubMed] [Google Scholar]
- 64.Ko CY, Jung YJ, Park JH, et al. 2012. Trabecular bone response to mechanical loading in ovariectomized Sprague-Dawley rats depends on baseline bone quantity. J Biomech 45:2046–2049. [DOI] [PubMed] [Google Scholar]
- 65.Torcasio A, Zhang X, Duyck J, et al. 2012. 3D characterization of bone strains in the rat tibia loading model. Biomech Model Mechanobiol 11:403–410. [DOI] [PubMed] [Google Scholar]
- 66.Sun D, Brodt MD, Zannit HM, et al. 2018. Evaluation of loading parameters for murine axial tibial loading: Stimulating cortical bone formation while reducing loading duration. J Orthop Res 36:682–691. [DOI] [PMC free article] [PubMed] [Google Scholar]
- 67.Sugiyama T, Meakin LB, Browne WJ, et al. 2012. Bones’ adaptive response to mechanical loading is essentially linear between the low strains associated with disuse and the high strains associated with the lamellar/woven bone transition. J Bone Miner Res 27:1784–1793. [DOI] [PMC free article] [PubMed] [Google Scholar]
- 68.Yang H, Embry RE, Main RP 2017. Effects of Loading Duration and Short Rest Insertion on Cancellous and Cortical Bone Adaptation in the Mouse Tibia. PLoS One 12:e0169519. [DOI] [PMC free article] [PubMed] [Google Scholar]
- 69.Chambers TJ, Evans M, Gardner TN, et al. 1993. Induction of bone formation in rat tail vertebrae by mechanical loading. Bone Miner 20:167–178. [DOI] [PubMed] [Google Scholar]
- 70.Webster D, Wasserman E, Ehrbar M, et al. 2010. Mechanical loading of mouse caudal vertebrae increases trabecular and cortical bone mass-dependence on dose and genotype. Biomech Model Mechanobiol 9:737–747. [DOI] [PubMed] [Google Scholar]
- 71.Kim CH, Takai E, Zhou H, et al. 2003. Trabecular bone response to mechanical and parathyroid hormone stimulation: the role of mechanical microenvironment. J Bone Miner Res 18:2116–2125. [DOI] [PubMed] [Google Scholar]
- 72.van der Meulen MC, Morgan TG, Yang X, et al. 2006. Cancellous bone adaptation to in vivo loading in a rabbit model. Bone 38:871–877. [DOI] [PMC free article] [PubMed] [Google Scholar]
- 73.van der Meulen MC, Yang X, Morgan TG, et al. 2009. The effects of loading on cancellous bone in the rabbit. Clin Orthop Relat Res 467:2000–2006. [DOI] [PMC free article] [PubMed] [Google Scholar]
- 74.Yang X, Willie BM, Beach JM, et al. 2013. Trabecular bone adaptation to loading in a rabbit model is not magnitude-dependent. J Orthop Res 31:930–934. [DOI] [PubMed] [Google Scholar]
- 75.Goldstein SA, Matthews LS, Kuhn JL, et al. 1991. Trabecular bone remodeling: an experimental model. J Biomech 24 Suppl 1:135–150. [DOI] [PubMed] [Google Scholar]
- 76.Chow JW, Jagger CJ, Chambers TJ. 1993. Characterization of osteogenic response to mechanical stimulation in cancellous bone of rat caudal vertebrae. Am J Physiol 265:E340–347. [DOI] [PubMed] [Google Scholar]
- 77.Glatt V, Canalis E, Stadmeyer L, et al. 2007. Age-related changes in trabecular architecture differ in female and male C57BL/6J mice. J Bone Miner Res 22:1197–1207. [DOI] [PubMed] [Google Scholar]
- 78.Lambers FM, Kuhn G, Weigt C, et al. 2015. Bone adaptation to cyclic loading in murine caudal vertebrae is maintained with age and directly correlated to the local micromechanical environment. J Biomech 48:1179–1187. [DOI] [PubMed] [Google Scholar]
- 79.Willinghamm MD, Brodt MD, Lee KL, et al. 2010. Age-related changes in bone structure and strength in female and male BALB/c mice. Calcif Tissue Int 86:470483. [DOI] [PMC free article] [PubMed] [Google Scholar]
- 80.De Souza RL, Matsuura M, Eckstein F, et al. 2005. Non-invasive axial loading of mouse tibiae increases cortical bone formation and modifies trabecular organization: a new model to study cortical and cancellous compartments in a single loaded element. Bone 37:810–818. [DOI] [PubMed] [Google Scholar]
- 81.Prasad J, Wiater BP, Nork SE, et al. 2010. Characterizing gait induced normal strains in a murine tibia cortical bone defect model. J Biomech 43:2765–2770. [DOI] [PubMed] [Google Scholar]
- 82.Weatherholt AM, Fuchs RK, Warden SJ. 2013. Cortical and trabecular bone adaptation to incremental load magnitudes using the mouse tibial axial compression loading model. Bone 52:372–379. [DOI] [PMC free article] [PubMed] [Google Scholar]
- 83.Lynch ME, Main RP, Xu Q, et al. 2010. Cancellous bone adaptation to tibial compression is not sex dependent in growing mice. J Appl Physiol 109:685–691. [DOI] [PMC free article] [PubMed] [Google Scholar]
- 84.Fritton JC, Myers ER, Wright TM, et al. 2008. Bone mass is preserved and cancellous architecture altered due to cyclic loading of the mouse tibia after orchidectomy. J Bone Miner Res 23:663–671. [DOI] [PMC free article] [PubMed] [Google Scholar]
- 85.Holguin N, Brodt MD, Sanchez ME, et al. 2014. Aging diminishes lamellar and woven bone formation induced by tibial compression in adult C57BL/6. Bone 65:83–91. [DOI] [PMC free article] [PubMed] [Google Scholar]
- 86.Lynch ME, Main RP, Xu Q, et al. 2011. Tibial compression is anabolic in the adult mouse skeleton despite reduced responsiveness with aging. Bone 49:439446. [DOI] [PMC free article] [PubMed] [Google Scholar]
- 87.Birkhold AI, Razi H, Duda GN, et al. 2014. Mineralizing surface is the main target of mechanical stimulation independent of age: 3D dynamic in vivo morphometry. Bone 66:15–25. [DOI] [PubMed] [Google Scholar]
- 88.Brodt MD, Silva MJ. 2010. Aged mice have enhanced endocortical response and normal periosteal response compared with young-adult mice following 1 week of axial tibial compression. J Bone Miner Res 25:2006–2015. [DOI] [PMC free article] [PubMed] [Google Scholar]
- 89.Meakin LB, Galea GL, Sugiyama T, et al. 2014. Age-related impairment of bones’ adaptive response to loading in mice is associated with sex-related deficiencies in osteoblasts but no change in osteocytes. J Bone Miner Res 29:1859–1871. [DOI] [PMC free article] [PubMed] [Google Scholar]
- 90.Morse A, McDonald MM, Kelly NH, et al. 2014. Mechanical load increases in bone formation via a sclerostin-independent pathway. J Bone Miner Res 29:24562467. [DOI] [PMC free article] [PubMed] [Google Scholar]
- 91.Saxon LK, Galea G, Meakin L, et al. 2012. Estrogen receptors alpha and beta have different gender-dependent effects on the adaptive responses to load bearing in cancellous and cortical bone. Endocrinology 153:2254–2266. [DOI] [PubMed] [Google Scholar]
- 92.Windahl SH, Borjesson AE, Farman HH, et al. 2013. Estrogen receptor-alpha in osteocytes is important for trabecular bone formation in male mice. Proc Natl Acad Sci U S A 110:2294–2299. [DOI] [PMC free article] [PubMed] [Google Scholar]
- 93.Pflanz D, Birkhold AI, Albiol L, et al. 2017. Sost deficiency led to a greater cortical bone formation response to mechanical loading and altered gene expression. Sci Rep 7:9435. [DOI] [PMC free article] [PubMed] [Google Scholar]
- 94.Galea GL, Meakin LB, Harris MA, et al. 2017. Old age and the associated impairment of bones’ adaptation to loading are associated with transcriptomic changes in cellular metabolism, cell-matrix interactions and the cell cycle. Gene 599:36–52. [DOI] [PMC free article] [PubMed] [Google Scholar]
- 95.Wang B, Lai X, Price C, et al. 2014. Perlecan-containing pericellular matrix regulates solute transport and mechanosensing within the osteocyte lacunar-canalicular system. J Bone Miner Res 29:878–891. [DOI] [PMC free article] [PubMed] [Google Scholar]
- 96.Melton LJ 3rd., 2003. Adverse outcomes of osteoporotic fractures in the general population. J Bone Miner Res 18:1139–1141. [DOI] [PubMed] [Google Scholar]
- 97.Main RP, Lynch ME, van der Meulen MC. 2014. Load-induced changes in bone stiffness and cancellous and cortical bone mass following tibial compression diminish with age in female mice. J Exp Biol 217:1775–1783. [DOI] [PMC free article] [PubMed] [Google Scholar]
- 98.Meakin LB, Sugiyama T, Galea GL, et al. 2013. Male mice housed in groups engage in frequent fighting and show a lower response to additional bone loading than females or individually housed males that do not fight. Bone 54:113–117. [DOI] [PMC free article] [PubMed] [Google Scholar]
- 99.Yang H, Xu X, Bullock W, et al. 2019. Adaptive changes in micromechanical environments of cancellous and cortical bone in response to in vivo loading and disuse. J Biomech 89:85–94. [DOI] [PubMed] [Google Scholar]
- 100.Berman AG, Clauser CA, Wunderlin C, et al. 2015. Structural and mechanical improvements to bone are strain dependent with axial compression of the tibia in female C57BL/6 mice. PLoS One 10:e0130504. [DOI] [PMC free article] [PubMed] [Google Scholar]
- 101.Heffner MA, Genetos DC, Christiansen BA. 2017. Bone adaptation to mechanical loading in a mouse model of reduced peripheral sensory nerve function. PLoS One 12:e0187354. [DOI] [PMC free article] [PubMed] [Google Scholar]
- 102.Hsia AW, Tarke FD, Shelton TJ, et al. 2018. Comparison of knee injury threshold during tibial compression based on limb orientation in mice. J Biomech 74:220224. [DOI] [PMC free article] [PubMed] [Google Scholar]
- 103.Stadelmann VA, Brun J, Bonnet N. 2015. Preclinical mouse models for assessing axial compression of long bones during exercise. Bonekey Rep 4:768. [DOI] [PMC free article] [PubMed] [Google Scholar]
- 104.Carriero A, Abela L, Pitsillides AA, et al. 2014. Ex vivo determination of bone tissue strains for an in vivo mouse tibial loading model. J Biomech 47:2490–2497. [DOI] [PMC free article] [PubMed] [Google Scholar]
- 105.Patel TK, Brodt MD, Silva MJ. 2014. Experimental and finite element analysis of strains induced by axial tibial compression in young-adult and old female C57Bl/6 mice. J Biomech 47:451–457. [DOI] [PMC free article] [PubMed] [Google Scholar]
- 106.Biewener AA 1992. In vivo measurement of bone strain and tendon force. In: Biewener AA editor. Biomechanics – Structures and Systems. New York: Oxford University Press; pp. pp. 123–147. [Google Scholar]
- 107.Verner KA, Lehner M, Lamas LP, et al. 2016. Experimental tests of planar strain theory for predicting bone cross-sectional longitudinal and shear strains. J Exp Biol 219:3082–3090. [DOI] [PubMed] [Google Scholar]
- 108.Sztefek P, Vanleene M, Olsson R, et al. 2010. Using digital image correlation to determine bone surface strains during loading and after adaptation of the mouse tibia. J Biomech 43:599–605. [DOI] [PubMed] [Google Scholar]
- 109.Yang H, Albiol L, Chan WL, et al. 2017. Examining tissue composition, whole-bone morphology and mechanical behavior of Gorab(Prx1) mice tibiae: A mouse model of premature aging. J Biomech 65:145–153. [DOI] [PMC free article] [PubMed] [Google Scholar]
- 110.Yang H, Butz KD, Duffy D, et al. 2014. Characterization of cancellous and cortical bone strain in the in vivo mouse tibial loading model using microCT-based finite element analysis. Bone 66:131–139. [DOI] [PubMed] [Google Scholar]
- 111.Moustafa A, Sugiyama T, Prasad J, et al. 2012. Mechanical loading-related changes in osteocyte sclerostin expression in mice are more closely associated with the subsequent osteogenic response than the peak strains engendered. Osteoporos Int 23:1225–1234. [DOI] [PMC free article] [PubMed] [Google Scholar]
- 112.Pereira AF, Javaheri B, Pitsillides AA, et al. 2015. Predicting cortical bone adaptation to axial loading in the mouse tibia. J R Soc Interface 12:0590. [DOI] [PMC free article] [PubMed] [Google Scholar]
- 113.Albiol L, Cilla M, Pflanz D, et al. 2018. Sost deficiency leads to reduced mechanical strains at the tibia midshaft in strain-matched in vivo loading experiments in mice. J R Soc Interface 15. [DOI] [PMC free article] [PubMed] [Google Scholar]
- 114.Razi H, Birkhold AI, Zaslansky P, et al. 2015. Skeletal maturity leads to a reduction in the strain magnitudes induced within the bone: a murine tibia study. Acta Biomater 13:301–310. [DOI] [PubMed] [Google Scholar]
- 115.Razi H, Birkhold AI, Zehn M, et al. 2014. A finite element model of in vivo mouse tibial compression loading: influence of boundary conditions. FACTA UNIVERSITATIS 12:195–207. [Google Scholar]
- 116.Main RP, Lynch ME, van der Meulen MC. 2010. In vivo tibial stiffness is maintained by whole bone morphology and cross-sectional geometry in growing female mice. J Biomech 43:2689–2694. [DOI] [PMC free article] [PubMed] [Google Scholar]
- 117.Melville KM, Kelly NH, Surita G, et al. 2015. Effects of deletion of ERalpha in osteoblast-lineage cells on bone mass and adaptation to mechanical loading differ in female and male mice. J Bone Miner Res 30:1468–1480. [DOI] [PMC free article] [PubMed] [Google Scholar]
- 118.Matsuzaki H, Wohl GR, Novack DV, et al. 2007. Damaging fatigue loading stimulates increases in periosteal vascularity at sites of bone formation in the rat ulna. Calcif Tissue Int 80:391–399. [DOI] [PMC free article] [PubMed] [Google Scholar]
- 119.McBride SH, Silva MJ. 2012. Adaptive and injury response of bone to mechanical loading. Bonekey Osteovision 1. [DOI] [PMC free article] [PubMed] [Google Scholar]
- 120.Sugiyama T, Saxon LK, Zaman G, et al. 2008. Mechanical loading enhances the anabolic effects of intermittent parathyroid hormone (1–34) on trabecular and cortical bone in mice. Bone 43:238–248. [DOI] [PubMed] [Google Scholar]
- 121.Skerry TM, Bitensky L, Chayen J, et al. 1989. Early strain-related changes in enzyme activity in osteocytes following bone loading in vivo. J Bone Miner Res 4:783–788. [DOI] [PubMed] [Google Scholar]
- 122.Kelly NH, Schimenti JC, Ross FP, et al. 2016. Transcriptional profiling of cortical versus cancellous bone from mechanically-loaded murine tibiae reveals differential gene expression. Bone 86:22–29. [DOI] [PMC free article] [PubMed] [Google Scholar]
- 123.Turner CH, Forwood MR, Otter MW. 1994. Mechanotransduction in bone: do bone cells act as sensors of fluid flow? FASEB J 8:875–878. [DOI] [PubMed] [Google Scholar]
- 124.Zaman G, Saxon LK, Sunters A, et al. 2010. Loading-related regulation of gene expression in bone in the contexts of estrogen deficiency, lack of estrogen receptor alpha and disuse. Bone 46:628–642. [DOI] [PMC free article] [PubMed] [Google Scholar]
- 125.Hsieh YF, Turner CH. 2001. Effects of loading frequency on mechanically induced bone formation. J Bone Miner Res 16:918–924. [DOI] [PubMed] [Google Scholar]
- 126.Pattin CA, Caler WE, Carter DR. 1996. Cyclic mechanical property degradation during fatigue loading of cortical bone. J Biomech 29:69–79. [DOI] [PubMed] [Google Scholar]
- 127.Fritton SP, Weinbaum S. 2009. Fluid and Solute Transport in Bone: FlowInduced Mechanotransduction. Annu Rev Fluid Mech 41:347–374. [DOI] [PMC free article] [PubMed] [Google Scholar]
- 128.Turner CH, Owan I, Takano Y. 1995. Mechanotransduction in bone: role of strain rate. Am J Physiol 269:E438–442. [DOI] [PubMed] [Google Scholar]
- 129.Srinivasan S, Ausk BJ, Poliachik SL, et al. 2007. Rest-inserted loading rapidly amplifies the response of bone to small increases in strain and load cycles. J Appl Physiol (1985) 102:1945–1952. [DOI] [PubMed] [Google Scholar]
- 130.Warden SJ, Turner CH. 2004. Mechanotransduction in the cortical bone is most efficient at loading frequencies of 5–10 Hz. Bone 34:261–270. [DOI] [PubMed] [Google Scholar]
- 131.Lewis KJ, Frikha-Benayed D, Louie J, et al. 2017. Osteocyte calcium signals encode strain magnitude and loading frequency in vivo. Proc Natl Acad Sci U S A 114:11775–11780. [DOI] [PMC free article] [PubMed] [Google Scholar]
- 132.Umemura Y, Ishiko T, Yamauchi T, et al. 1997. Five jumps per day increase bone mass and breaking force in rats. J Bone Miner Res 12:1480–1485. [DOI] [PubMed] [Google Scholar]
- 133.Ko FC, Dragomir C, Plumb DA, et al. 2013. In vivo cyclic compression causes cartilage degeneration and subchondral bone changes in mouse tibiae. Arthritis Rheum 65:1569–1578. [DOI] [PMC free article] [PubMed] [Google Scholar]
- 134.Poulet B, Hamilton RW, Shefelbine S, et al. 2011. Characterizing a novel and adjustable noninvasive murine joint loading model. Arthritis Rheum 63:137–147. [DOI] [PubMed] [Google Scholar]
- 135.Poulet B, de Souza R, Kent AV, et al. 2015. Intermittent applied mechanical loading induces subchondral bone thickening that may be intensified locally by contiguous articular cartilage lesions. Osteoarthritis Cartilage 23:940–948. [DOI] [PMC free article] [PubMed] [Google Scholar]
- 136.Srinivasan S, Weimer DA, Agans SC, et al. 2002. Low-magnitude mechanical loading becomes osteogenic when rest is inserted between each load cycle. J Bone Miner Res 17:1613–1620. [DOI] [PMC free article] [PubMed] [Google Scholar]
- 137.Srinivasan S, Balsiger D, Huber P, et al. 2018. Static Preload Inhibits LoadingInduced Bone Formation. JBMR Plus. [DOI] [PMC free article] [PubMed]
- 138.Bouxsein ML, Boyd SK, Christiansen BA, et al. 2010. Guidelines for assessment of bone microstructure in rodents using micro-computed tomography. J Bone Miner Res 25:1468–1486. [DOI] [PubMed] [Google Scholar]
- 139.Mitchell MJ, Logan PM. 1998. Radiation-induced changes in bone. Radiographics 18:1125–1136. [DOI] [PubMed] [Google Scholar]
- 140.Klinck RJ, Campbell GM, Boyd SK. 2008. Radiation effects on bone architecture in mice and rats resulting from in vivo microCT scanning. Medical Engineering and Physics 30:888–895. [DOI] [PubMed] [Google Scholar]
- 141.Govey PM, Zhang Y, Donahue HJ. 2016. Mechanical loading attenuates radiation-induced bone loss in bone marrow transplanted mice. PLoS One 11:e0167673. [DOI] [PMC free article] [PubMed] [Google Scholar]
- 142.Shirazi-Fard Y, Alwood JS, Schreurs AS, et al. 2015. Mechanical loading causes site-specific anabolic effects on bone following exposure to ionizing radiation. Bone 81:260–269. [DOI] [PubMed] [Google Scholar]
- 143.Laperre K, Depypere M, van Gastel N, et al. 2011. Development of micro-CT protocols for in vivo follow-up of mouse bone architecture without major radiation side effects. Bone 49:613–622. [DOI] [PubMed] [Google Scholar]
- 144.Lynch ME, Brooks D, Mohanan S, et al. 2013. In vivo tibial compression decreases osteolysis and tumor formation in a human metastatic breast cancer model. J Bone Miner Res 28:2357–2367. [DOI] [PMC free article] [PubMed] [Google Scholar]
- 145.Milch RA, Rall DP, Tobie JE 1958. Fluorescence of tetracycline antibiotics in bone. J Bone Joint Surg Am 40-A:897–910. [PubMed]
- 146.Parfitt AM. 1988. Bone histomorphometry: proposed system for standardization of nomenclature, symbols, and units. Calcif Tissue Int 42:284–286. [DOI] [PubMed] [Google Scholar]
- 147.Dempster DW, Compston JE, Drezner MK, et al. 2013. Standardized nomenclature, symbols, and units for bone histomorphometry: a 2012 update of the report of the ASBMR Histomorphometry Nomenclature Committee. J Bone Miner Res 28:2–17. [DOI] [PMC free article] [PubMed] [Google Scholar]
- 148.Piemontese M, Almeida M, Robling AG, et al. 2017. Old age causes de novo intracortical bone remodeling and porosity in mice. JCI Insight 2. [DOI] [PMC free article] [PubMed] [Google Scholar]
- 149.Bonnet N, Gineyts E, Ammann P, et al. 2013. Periostin deficiency increases bone damage and impairs injury response to fatigue loading in adult mice. PLoS One 8:e78347. [DOI] [PMC free article] [PubMed] [Google Scholar]
- 150.Foldes J, Shih MS, Parfitt AM. 1990. Frequency distributions of tetracyclinebased measurements: implications for the interpretation of bone formation indices in the absence of double-labeled surfaces. J Bone Miner Res 5:1063–1067. [DOI] [PubMed] [Google Scholar]
- 151.Recker RR, Kimmel DB, Dempster D, et al. 2011. Issues in modern bone histomorphometry. Bone 49:955–964. [DOI] [PMC free article] [PubMed] [Google Scholar]
- 152.Hattner R, Epker BN, Frost HM. 1965. Suggested sequential mode of control of changes in cell behaviour in adult bone remodelling. Nature 206:489–490. [DOI] [PubMed] [Google Scholar]
- 153.Frost HM. 1969. Tetracycline-based histological analysis of bone remodeling. Calcified tissue research 3:211–237. [DOI] [PubMed] [Google Scholar]
- 154.Erben RG. 1996. Trabecular and endocortical bone surfaces in the rat: modeling or remodeling? The Anatomical record 246:39–46. [DOI] [PubMed] [Google Scholar]
- 155.Büttner A, Yang H, Albiol L, et al. 2019. Cortical bone adaptation to mechanical loading is age and sex dependent in Sost deficient mice. Journal of bone and mineral research under review.
- 156.Carrieroa A, Pereirab AF, Wilson AJ, et al. 2018. Spatial relationship between bone formation and mechanical stimulus within cortical bone: Combining 3D fluorochrome mapping and poroelastic finite element modelling. Bone Rep 8:7280. [DOI] [PMC free article] [PubMed] [Google Scholar]
- 157.Slyfield CR, Tkachenko EV, Wilson DL, et al. 2012. Three-dimensional dynamic bone histomorphometry. J Bone Miner Res 27:486–495. [DOI] [PMC free article] [PubMed] [Google Scholar]
- 158.David V, Laroche N, Boudignon B, et al. 2003. Noninvasive in vivo monitoring of bone architecture alterations in hindlimb-unloaded female rats using novel three-dimensional microcomputed tomography. Journal of Bone and Mineral Research 18:1622–1631. [DOI] [PubMed] [Google Scholar]
- 159.Waarsing JH, Day JS, van der Linden JC, et al. 2004. Detecting and tracking local changes in the tibiae of individual rats. Bone 34:163–169. [DOI] [PubMed] [Google Scholar]
- 160.Schulte FA, Lambers FM, Kuhn G, et al. 2011. In vivo micro-computed tomography allows direct three-dimensional quantification of both bone formation and bone resorption parameters using time-lapsed imaging. Bone 48:433–442. [DOI] [PubMed] [Google Scholar]
- 161.Schulte FA, Ruffoni D, Lambers FM, et al. 2013. Local mechanical stimuli regulate bone formation and resorption in mice at the tissue level. PLoS One 8:e62172. [DOI] [PMC free article] [PubMed] [Google Scholar]
- 162.Cresswell EN, Goff MG, Nguyen TM, et al. 2016. Spatial relationships between bone formation and mechanical stress within cancellous bone. J Biomech 49:222228. [DOI] [PubMed] [Google Scholar]
- 163.Birkhold AI, Razi H, Duda GN, et al. 2017. Tomography-based quantification of regional differences in cortical bone surface remodeling and mechano-response. Calcif Tissue Int 100:255–270. [DOI] [PubMed] [Google Scholar]
- 164.Razi H, Birkhold AI, Weinkamer R, et al. 2015. Aging leads to a dysregulation in mechanically driven bone formation and resorption. J Bone Miner Res 30:18641873. [DOI] [PubMed] [Google Scholar]
- 165.Birkhold AI, Razi H, Weinkamer R, et al. 2015. Monitoring in vivo (re)modeling: a computational approach using 4D microCT data to quantify bone surface movements. Bone 75:210–221. [DOI] [PubMed] [Google Scholar]
- 166.Altman AR, Tseng WJ, de Bakker CMJ, et al. 2015. Quantification of skeletal growth, modeling, and remodeling by in vivo micro computed tomography. Bone 81:370–379. [DOI] [PMC free article] [PubMed] [Google Scholar]
- 167.Jepsen KJ, Silva MJ, Vashishth D, et al. 2015. Establishing biomechanical mechanisms in mouse models: practical guidelines for systematically evaluating phenotypic changes in the diaphyses of long bones. J Bone Miner Res 30:951966. [DOI] [PMC free article] [PubMed] [Google Scholar]
- 168.Aido M, Kerschnitzki M, Hoerth R, et al. 2015. Effect of in vivo loading on bone composition varies with animal age. Exp Gerontol 63:48–58. [DOI] [PMC free article] [PubMed] [Google Scholar]
- 169.Bergstrom I, Kerns JG, Tornqvist AE, et al. 2017. Compressive loading of the murine tibia reveals site-specific micro-scale differences in adaptation and maturation rates of bone. Osteoporos Int 28:1121–1131. [DOI] [PMC free article] [PubMed] [Google Scholar]
- 170.Isaksson H, Tolvanen V, Finnila MA, et al. 2009. Long-term voluntary exercise of male mice induces more beneficial effects on cancellous and cortical bone than on the collagenous matrix. Exp Gerontol 44:708–717. [DOI] [PubMed] [Google Scholar]
- 171.Kohn DH, Sahar ND, Wallace JM, et al. 2009. Exercise alters mineral and matrix composition in the absence of adding new bone. Cells Tissues Organs 189:33–37. [DOI] [PMC free article] [PubMed] [Google Scholar]
- 172.Holguin N, Brodt MD, Silva MJ. 2016. Activation of Wnt Signaling by Mechanical Loading Is Impaired in the Bone of Old Mice. J Bone Miner Res 31:2215–2226. [DOI] [PMC free article] [PubMed] [Google Scholar]
- 173.Bonnet N, Standley KN, Bianchi EN, et al. 2009. The matricellular protein periostin is required for sost inhibition and the anabolic response to mechanical loading and physical activity. J Biol Chem 284:35939–35950. [DOI] [PMC free article] [PubMed] [Google Scholar]
- 174.Silva MJ, Brodt MD, Lynch MA, et al. 2012. Tibial loading increases osteogenic gene expression and cortical bone volume in mature and middle-aged mice. PLoS One 7:e34980. [DOI] [PMC free article] [PubMed] [Google Scholar]
- 175.Kelly NH, Schimenti JC, Patrick Ross F, et al. 2014. A method for isolating high quality RNA from mouse cortical and cancellous bone. Bone 68:1–5. [DOI] [PMC free article] [PubMed] [Google Scholar]
- 176.Meakin LB, Udeh C, Galea GL, et al. 2015. Exercise does not enhance aged bone’s impaired response to artificial loading in C57Bl/6 mice. Bone 81:47–52. [DOI] [PMC free article] [PubMed] [Google Scholar]
- 177.Kurmis AP, Kurmis TP, O’Brien JX, et al. 2012. The effect of nonsteroidal antiinflammatory drug administration on acute phase fracture-healing: a review. J Bone Joint Surg Am 94:815–823. [DOI] [PubMed] [Google Scholar]
- 178.Lara-Castillo N, Kim-Weroha NA, Kamel MA, et al. 2015. In vivo mechanical loading rapidly activates beta-catenin signaling in osteocytes through a prostaglandin mediated mechanism. Bone 76:58–66. [DOI] [PMC free article] [PubMed] [Google Scholar]
- 179.Histing T, Garcia P, Holstein JH, et al. 2011. Small animal bone healing models: standards, tips, and pitfalls results of a consensus meeting. Bone 49:591–599. [DOI] [PubMed] [Google Scholar]
- 180.Birkhold AI, Razi H, Duda GN, et al. 2014. The influence of age on adaptive bone formation and bone resorption. Biomaterials 35:9290–9301. [DOI] [PubMed] [Google Scholar]
- 181.Javaheri B, Carriero A, Wood M, et al. 2018. Transient peak-strain matching partially recovers the age-impaired mechanoadaptive cortical bone response. Sci Rep 8:6636. [DOI] [PMC free article] [PubMed] [Google Scholar]
- 182.Meakin LB, Sugiyama T, Galea G, et al. 2013. Male mice housed in groups engage in frequent fighting and show a lower response to additional bone loading than females or individually housed males that do not fight. Bone 54:113–117. [DOI] [PMC free article] [PubMed] [Google Scholar]
- 183.Meakin LB, Galea G, Sugiyama T, et al. 2014. Age-related impairment of bones’ adaptive response to loading in mice is associated with sex-related deficiencies in osteoblasts but no change in osteocytes. J Bone Miner Res 29:1859–1871. [DOI] [PMC free article] [PubMed] [Google Scholar]
- 184.Meakin LB, Delisser PJ, Galea GL, et al. 2015. Disuse rescues the age-impaired adaptive response to external loading in mice. Osteoporos Int 26:2703–2708. [DOI] [PMC free article] [PubMed] [Google Scholar]
- 185.Price C, Zhou X, Li W, et al. 2011. Real-time measurement of solute transport within the lacunar-canalicular system of mechanically loaded bone: direct evidence for load-induced fluid flow. J Bone Miner Res 26:277–285. [DOI] [PMC free article] [PubMed] [Google Scholar]
Associated Data
This section collects any data citations, data availability statements, or supplementary materials included in this article.