Abstract
Epigenetic remodeling is essential for oncogene-induced cellular transformation and malignancy. In contrast to histone posttranslational modifications, how oncogenic signaling remodels DNA methylation remains poorly understood. The oncoprotein YAP, a coactivator of the TEAD transcription factors mediating Hippo signaling, is widely activated in human cancer. Here we identify the 5-methylcytosine dioxygenase TET1 as a direct YAP target and a master regulator that coordinates the genome-wide epigenetic and transcriptional reprogramming of YAP target genes in the liver. YAP activation induces the expression of TET1, which physically interacts with TEAD to cause regional DNA demethylation, histone H3K27 acetylation and chromatin opening in YAP target genes to facilitate transcriptional activation. Loss of TET1 not only reverses YAP-induced epigenetic and transcriptional changes but also suppresses YAP-induced hepatomegaly and tumorigenesis. These findings exemplify how oncogenic signaling regulates site specificity of DNA demethylation to promote tumorigenesis and implicate TET1 as a potential target for modulating YAP signaling in physiology and disease.
Editor summary:
YAP upregulates TET1, which physically interacts with TEAD1/4 to demethylate DNA at YAP target genes in the liver. Loss of TET1 reverses YAP-induced chromatin and transcriptional changes and suppresses YAP-induced hepatomegaly and tumorigenesis.
Introduction
Preexisting epigenetic landscape represents a barrier for oncogene-induced cellular transformation and malignancy. Oncogenic signaling overcomes this barrier by epigenetic remodeling as evidenced by altered histone posttranslational modifications and DNA methylation in cancer cells1–3. While oncogenic signaling pathways often function through their respective downstream nuclear effectors to recruit histone-modifying enzymes4,5, how oncogenic signaling remodels DNA methylation to elicit oncogenic transcriptional program remains poorly understood6,7.
DNA methylation is one of the most widely studied epigenetic mechanism underlying gene expression in mammals8,9, with aberrant DNA methylation implicated in various human diseases including cancer8,10–13. This reversible covalent modification involves methylation of cytosine in CpG dinucleotides, which modulates recruitment of methyl-CpG binding proteins to compact chromatin structure and attenuate gene transcription. Both genome-wide and locus-specific DNA methylation is dictated by the antagonizing action of two classes of enzymes: DNA methyltransferases (DNMTs) that modify cytosine to 5-methylcytosine (5mC)14, and Ten-eleven translocation (TET) dioxygenases that remove DNA methylation15,16.
TET1 is a member of the TET family of enzymes, which includes TET1, TET2 and TET315–17. TET proteins function as iron- and α-ketoglutarate-dependent 5-methylcytosine dioxygenases that convert 5-methylcytosine (5mC) to 5-hydroxymethylcytosine (5hmC)17,18, which is further oxidated to 5-formylcytosine (5fC) and 5-carboxycytosine (5caC)19. TET1 is highly expressed in embryos and embryonic stem cells (ESCs), and its expression diminishes in adult tissues or upon ESC differentiation17,18,20–22. Depletion of TET1 in mouse embryonic stem cells results in decreased 5hmC level, increased 5mC level, and defects in gene transcription17,18,20–22. However, loss of TET1 can be compatible with embryonic development and postnatal growth due to compensation by TET2 and TET320,23. Interestingly, elevated levels of TET1 and 5hmC have been reported in hepatocellular carcinoma24,25, cholangiocarcinoma26, breast cancer27, lung cancer28, glioblastoma29 and leukemia30. Functional perturbation further revealed that TET1 contributes to the induction of cancer-related genes in these contexts.
The evolutionarily conserved Hippo signaling pathway controls organ size, tissue homeostasis and regeneration by impinging on cell proliferation and apoptosis31–35. In mammals, this pathway involves multiple tumor suppressors such as NF2, MST1/2, SAV1, LATS1/2 acting through a core kinase cascade that ultimately phosphorylates and inactivates the oncoprotein YAP and its paralogue TAZ. Accordingly, overexpression of YAP or inactivation of its upstream tumor suppressors has been reported to cause uncontrolled growth in many tissues32,34–37. This is best illustrated in the liver, where YAP activation results in massive hepatocyte proliferation, hepatomegaly and tumorigenesis33,38,39. In addition, aberrant activation of YAP has been frequently observed in a variety of human tumor types and is associated with aggressive phenotype and poor prognosis34,40.
YAP functions as a transcriptional coactivator and primarily engages the TEAD family DNA-binding transcription factors in transcriptional regulation. Thus, understanding the molecular mechanisms by which the TEAD-YAP complex activates target gene transcription is critical for interrogating Hippo signaling in physiology and disease. In this study, we identify TET1 as a direct transcription target of the TEAD-YAP complex and critical mediator of YAP-induced oncogenic transcriptional program. Not only is TET1 expression potently induced upon YAP activation, TET1 physically interacts with TEAD to cause regional DNA demethylation, histone H3K27 acetylation and chromatin opening in YAP target genes to facilitate transcriptional activation. We further show that loss of TET1 reverses YAP-induced epigenetic and transcriptional changes, and more importantly, suppresses YAP-induced hepatomegaly and tumorigenesis. These findings exemplify how oncogenic signaling engages a feedforward mechanism to elicit regional DNA demethylation and implicate TET1 as a master effector that coordinates the genome-wide YAP-dependent transcriptional landscape in tissue growth and tumorigenesis and a potential target for modulating YAP signaling in physiology and disease.
Results
TET1 is a direct target of the YAP-TEAD transcription factor complex
To identify critical YAP target genes that mediate its growth-promoting activity, we performed RNA-seq analysis using the well-characterized ApoE-rtTA-YAP transgenic mouse model (abbreviated as YAPTg)39, in which one can reversibly turn on and off the wildtype YAP transgene in the liver by subjecting the transgenic mice to doxycycline (Dox) treatment followed by withdrawal. As shown previously, Dox treatment resulted in robust liver size expansion accompanied by the induction of canonical YAP target genes such as Myc, Cyr61/Ccn1 and Ctgf/Ccn2 (Fig. 1a and Extended Data Fig. 1a), as well as upstream tumor suppressors of the Hippo pathway due to negative feedback (Extended Data Fig. 1a). Heatmap of RNA-seq data displaying the expression of representative hepatic lineage markers41 clearly showed that YAP overexpression reprogrammed mature hepatocytes to proliferating hepatoblast-like cells without ductal characteristics (Fig. 1b)33,38,39,42. Immunostaining confirmed the induction of hepatoblast marker AFP in hepatocytes in YAPTg livers, as well as another genetic background of YAP activation (Mst1/2 mutant livers)42 (Extended Data Fig. 1b). Interestingly, one of the most robustly induced genes in YAPTg livers is Tet1 (Fig. 1a and Extended Data Fig. 1a), which encodes a 5-methylcytosine dioxygenase implicated in epigenetic regulation of mammalian development and cancer15–17. In YAPTg livers, Tet1 mRNA was acutely and robustly induced by Dox treatment and quickly diminished after Dox withdrawal (Fig. 1c), with liver size closely tracking Tet1 mRNA level in the Dox on/off regime (Fig. 1d). In contrast, Tet2 or Tet3 mRNA was not induced in YAPTg livers (Extended Data Fig. 1a). Retrospective analysis of a different YAP transgenic model, which involves the overexpression of an active YAPS127A mutant43, revealed a similar induction of Tet1 and Afp expression as in the YAPTg livers (Extended Data Fig. 1c). As expected, TET1 protein was also induced in YAPTg livers (Fig. 1e). Conversely, Tet1 mRNA was decreased in liver-specific knockout of Yap (Alb-cre; Yapflox/flox)44 (Extended Data Fig. 1d), suggesting that Tet1 expression is sensitive to YAP activity in the liver.
Fig. 1 |. Tet1 is a direct target of the YAP-TEAD complex.
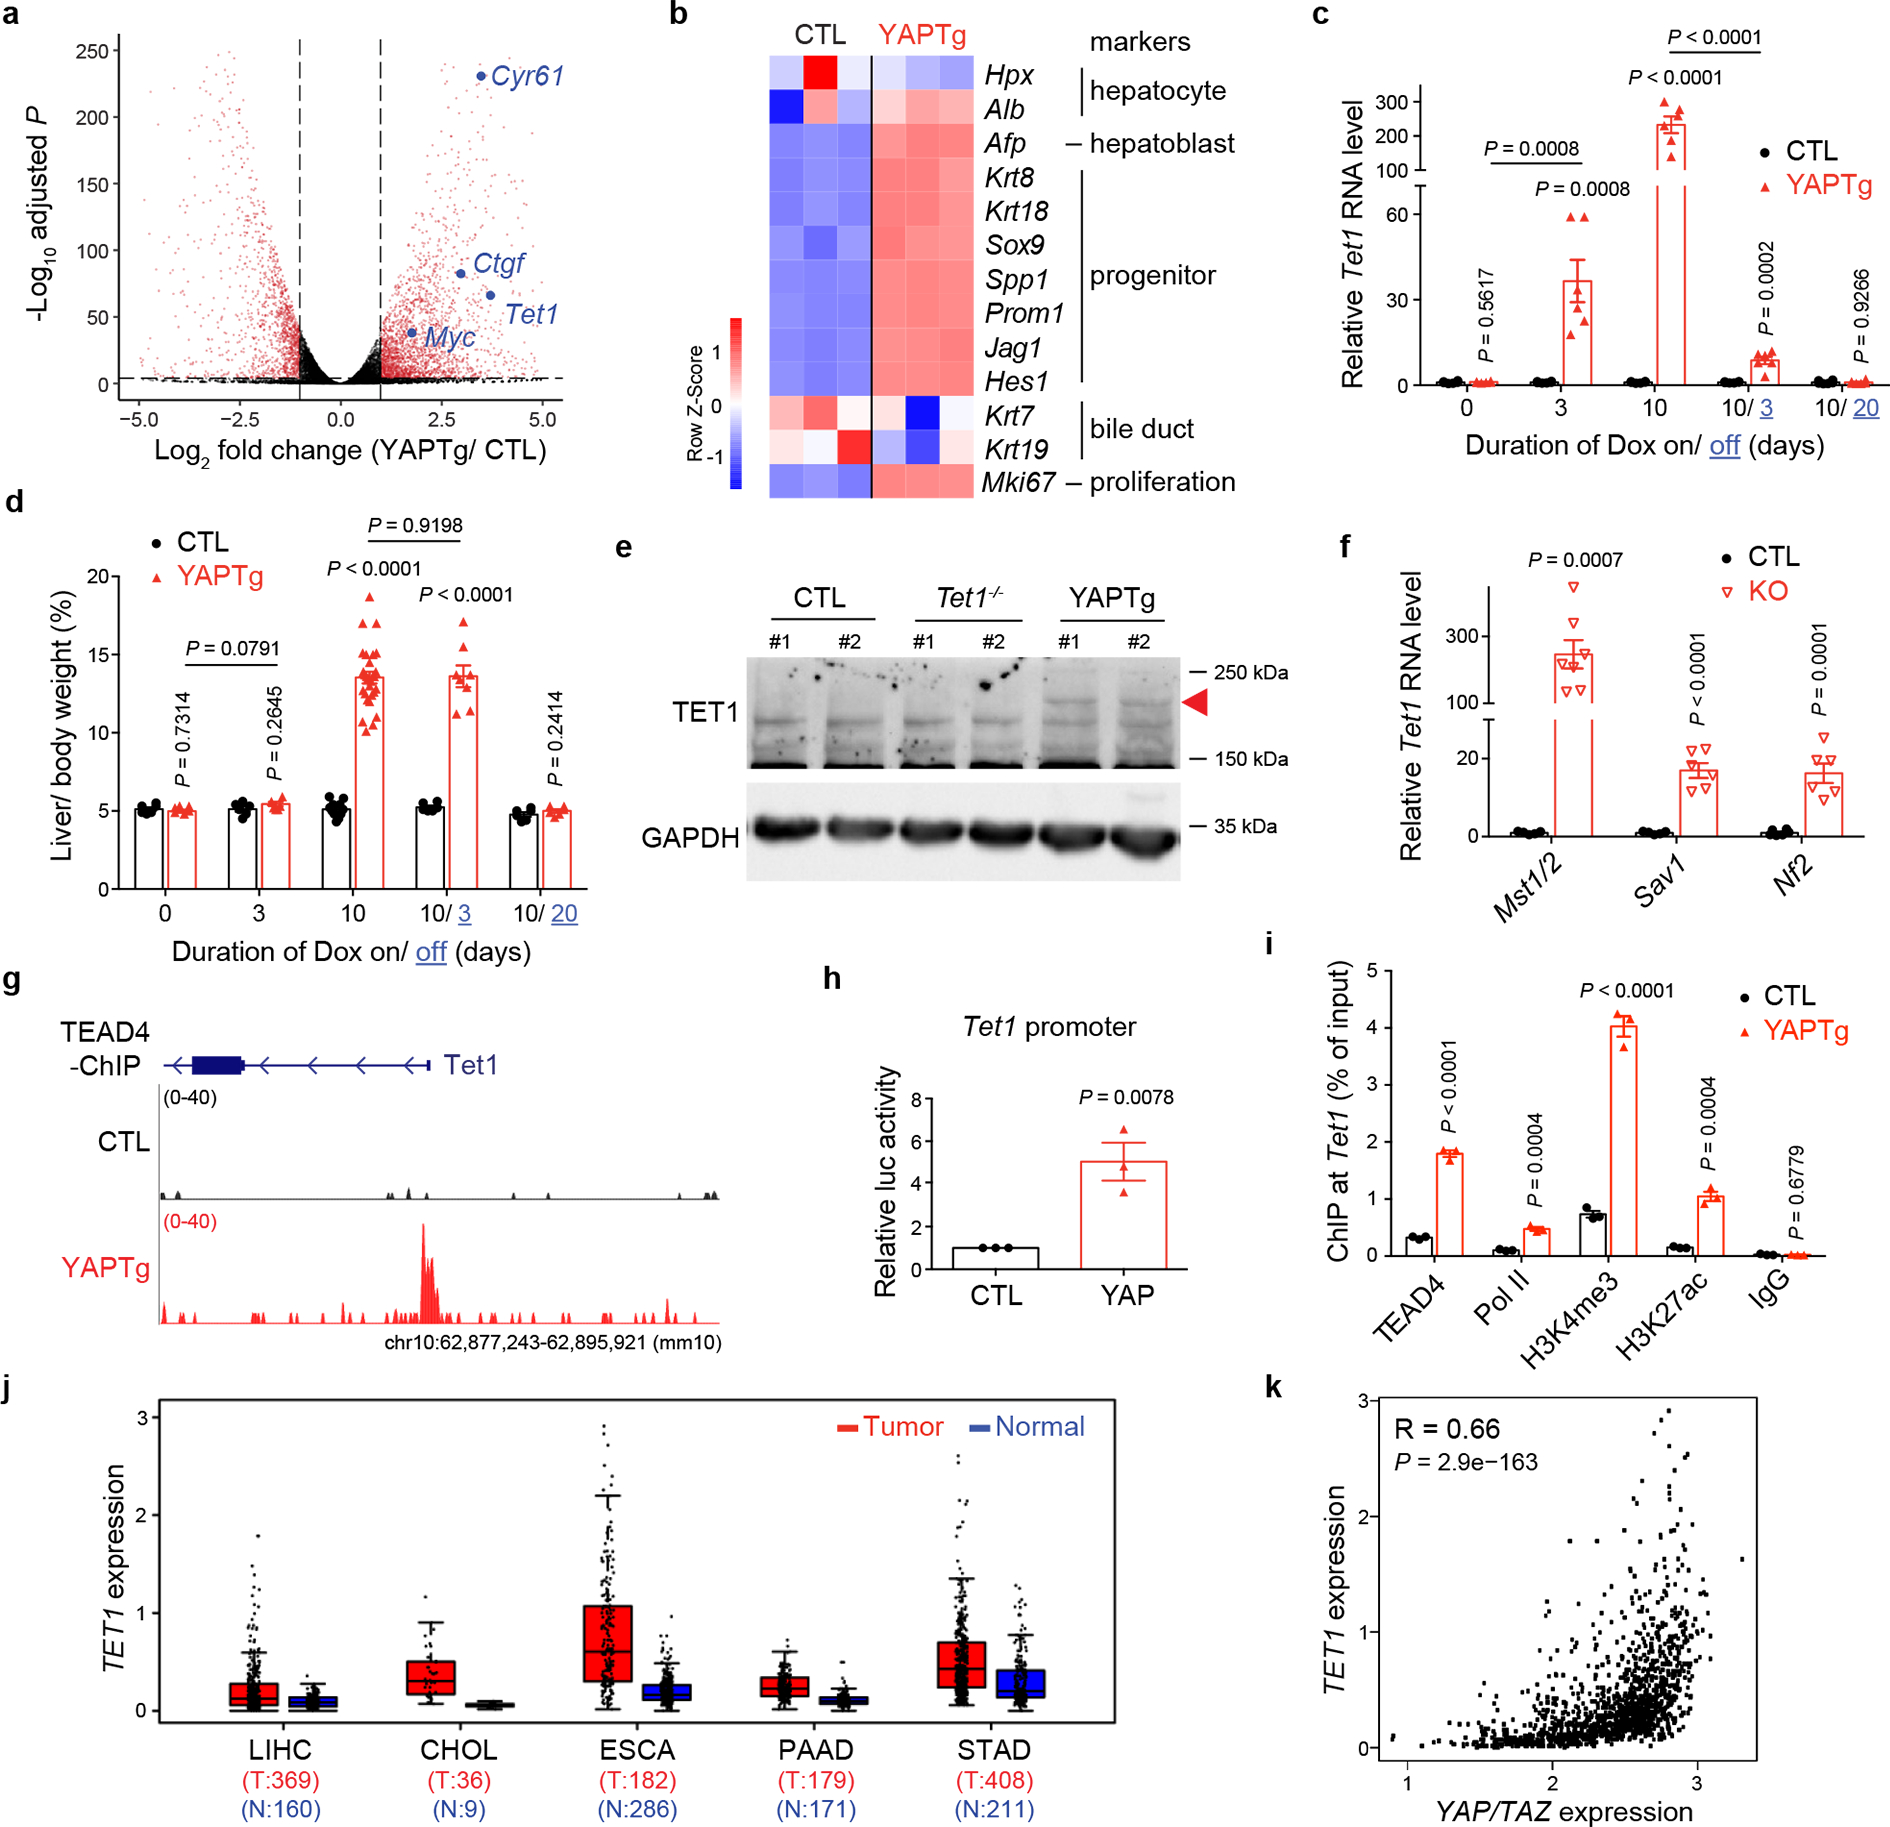
a, A volcano plot of differential expressed genes in YAPTg compared to control (CTL) livers. Red dots represent remarkable (fold change ≥ 2) and significant (P < 0.00001) genes. Genes of interest are marked in blue. b, Heatmap of RNA-seq data from control and YAPTg livers showing the expression of representative hepatic lineage markers. c, RT-qPCR showing the dynamics of Tet1 transcription in YAPTg livers during the temporal course of Dox induction and withdrawal (n = 6). 1-month-old YAPTg mice treated with Dox for 10 days followed by withdrawal for 20 days. d, Quantification of liver-to-body weight ratio under same condition as in (c) (CTL n = 6, 6, 11, 6, 6 and YAPTg n = 6, 6, 28, 8, 6 from left to right). e, Western blot of TET1 protein level in YAPTg livers. Arrowhead marks the specific TET1 protein band. Images are representative of three independent experiments. f, RT-qPCR of Tet1 mRNA level in mutant livers lacking Mst1/2, Sav1 or Nf2 at 1 month of age (CTL n = 5, 5, 6 and KO n = 7, 6, 6 from left to right). g, Genomic tracks displaying TEAD4 ChIP-seq reads at Tet1 promoter in control and YAPTg livers. h, Luciferase reporter assay driven by the promoter sequence of mouse Tet1 in HEK293T cells of three independent experiments. Reporter construct containing mouse Tet1 promoter was co-transfected with YAP-expressing or empty pcDNA3 vector. i, ChIP-qPCR at Tet1 promoter in YAPTg livers (n = 3). j, Elevated expression of TET1 in five human cancers obtained from the TCGA database. The center lines show the medians, the box limits mark the 25th to the 75th percentiles and the whiskers indicate 1.5× the interquartile range. k, Spearman’s correlation coefficient analysis between the expression of YAP/TAZ and TET1 in human foregut cancers (LIHC, CHOL, ESCA, PAAD and STAD). Values represent mean ± s.e.m. (c, d, f, h, i). P values are calculated with unpaired two-tailed Student’s t-test (c, d, f, h, i) or two-tailed Spearman’s correlation test (k).
To exclude the possibility that TET1 induction is simply the consequence of increased proliferation or hepatomegaly, we examined another liver enlargement model by treating mice with the hepatocyte mitogen TCPOBOP (TCP)45 (Extended Data Fig. 2a). Unlike the YAPTg model, TCP did not induce Tet1, Myc, Cyr61, Ctgf, or upstream tumor suppressors of the Hippo pathway (Extended Data Fig. 2b–c). Consistent with this result, YAP was dispensable for TCP-induced hepatomegaly (Extended Data Fig. 2d). On the other hand, TET1 was induced not only in the YAPTg model, but also in transgenic livers expressing constitutively active TAZ4SA (ApoE-rtTA; TRE-TAZ4SA) (Extended Data Fig. 1e), as well as in liver-specific knockouts of Mst1/2, Sav1 or Nf2 (Fig. 1f and Extended Data Fig. 1f), suggesting that TET1 induction is a specific consequence of Hippo pathway perturbation. Indeed, TEAD4 ChIP-seq data revealed robust TEAD4 occupancy at the Tet1 promoter in YAPTg livers (Fig. 1g and Extended Data Fig. 1g), human embryonic stem cells and mouse trophoblast stem cells (Extended Data Fig. 1h), implicating TET1 as a direct target of the YAP-TEAD complex. This was confirmed by a cell-based assay showing that a luciferase reporter driven by the promoter sequence of mouse Tet1 was responsive to YAP co-expression (Fig. 1h). Further supporting Tet1 as a direct target of the YAP-TEAD complex, ChIP-qPCR revealed increased TEAD4 and RNA polymerase II (Pol II) binding, as well as increased active histone marks H3 trimethylation of lysine 4 (H3K4me3) and histone H3 acetylation of lysine 27 (H3K27ac), at the Tet1 promoter in YAPTg livers (Fig. 1i and Extended Data Fig. 1i).
Consistent with our findings in mouse livers, analysis of the human Cancer Genome Atlas (TCGA) datasets revealed elevated YAP/TAZ and TET1 mRNA levels as well as a positive correlation between their abundance in both liver hepatocellular carcinomas (LIHC) and cholangiocarcinomas (CHOL) (Fig. 1j and Extended Data Fig. 3a–b). Besides liver cancers, a positive correlation between elevated YAP/TAZ and TET1 mRNA levels was also observed in other foregut cancers including esophageal carcinoma (ESCA), pancreatic adenocarcinoma (PAAD) and stomach adenocarcinoma (STAD) (Fig. 1j–k and Extended Data Fig. 3a–b), but not in non-foregut cancers with elevated expression of YAP/TAZ and TET1, such as brain lower-grade glioma (LGG) and glioblastoma (GBM) (Extended Data Fig. 3c). These data support a potential role for YAP/TAZ-induced TET1 in the tumorigenesis of foregut tissues.
YAP activation causes regional DNA demethylation in target gene enhancers
Given the importance of DNA methylation in epigenetic regulation of gene expression, we investigated a potential role for TET1-mediated DNA demethylation in YAP-induced transcriptional program. We first quantified global 5-methylcytosine (5mC) and 5-hydroxymethylcytosine (5hmC) levels, and observed no significant changes in YAPTg compared to control livers (Fig. 2a and Extended Data Fig. 4a). Next, we performed methyl-CpG binding domain (MBD)-based methylated DNA enrichment followed by high-throughput sequencing (MBD-seq) and TET1 ChIP-seq to assess genome-wide distribution of DNA methylation and TET1 binding in YAPTg and control livers. Consistent with the well-established role of TET1 in DNA demethylation, we observed a decrease of regional DNA methylation associated with TET1 peaks upon YAP activation (Fig. 2b). Our MBD-seq analysis revealed a total of 14,282 peaks with ≥ 3-fold decrease in DNA methylation in YAPTg compared to control livers. These reduced differentially methylated regions (rDMRs) were annotated to 12,289 genes, including well-known YAP targets such as Myc, Cyr61 and Ctgf. Consistent with TET1’s role in converting 5mC to 5hmC, analysis of these canonical YAP target genes by MBD-qPCR (to reveal 5mC) and hydroxymethylated DNA immunoprecipitation (hMeDIP)-qPCR (to reveal 5hmC) showed that decreased DNA methylation was accompanied by increased DNA hydroxymethylation in the rDMRs (Fig. 2c and Extended Data Fig. 4b). This was further confirmed at single-base resolution by traditional bisulfite sequencing, which indiscriminately detects 5mC and 5hmC46, and Tet-assisted bisulfite sequencing (TAB-seq), which specifically detects 5hmC47 (Fig. 2d and Extended Data Fig. 4c–d). In contrast to the YAP-induced decrease of DNA methylation in these YAP target genes, such changes were not observed in hepatocyte mitogen TCP-induced hepatomegaly (Extended Data Fig. 2e).
Fig. 2 |. YAP activation causes regional DNA demethylation in enhancers.
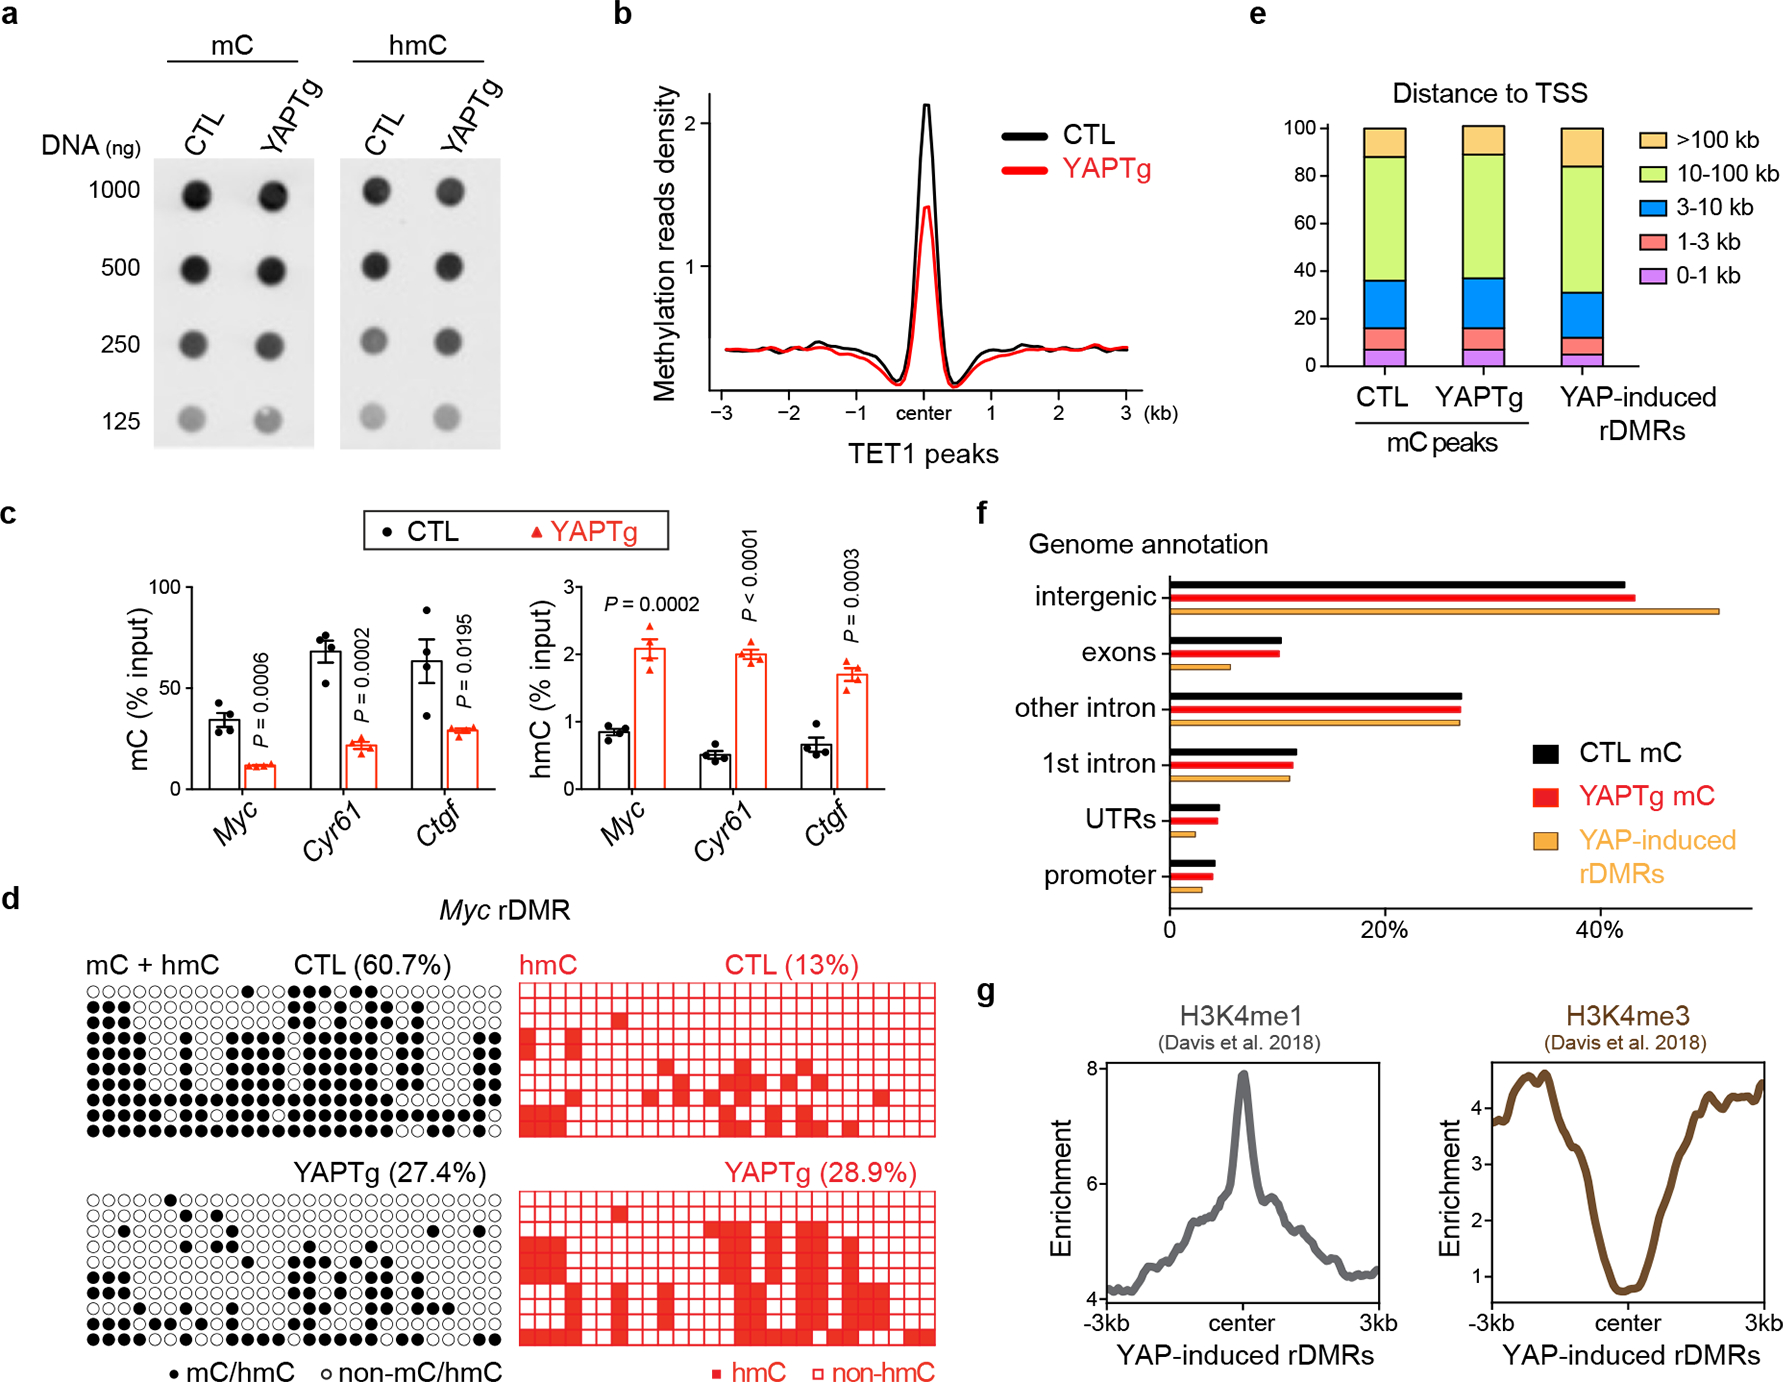
a, DNA dot blot of genomic 5mC and 5hmC levels in YAPTg livers. Images are representative of two independent experiments. b, Methylation profile representing the MBD-seq reads from control and YAPTg livers centered at TET1 peaks. c, 5mC and 5hmC validation at Myc, Cyr61 and Ctgf rDMRs in YAPTg livers. Methylation (left panel) and hydroxymethylation (right panel) levels were determined by MBD-qPCR and hMeDIP-qPCR, respectively (n = 4). Values represent mean ± s.e.m. P values are calculated with unpaired two-tailed Student’s t-test. d, Cloning-based traditional bisulfite sequencing (left panels) and TAB-seq (right panels) of 27 CpG sites at the Myc rDMR locus. All sequencing results include 10 independent clones. e, Absolute distance of methylation peaks and YAP-induced rDMRs relative to nearest TSS. f, Genomic distribution of methylation peaks and YAP-induced rDMRs. YAPTg and control livers showed similar distribution of methylation peaks among intergenic, exon, intron, UTR and promoter at genome-wide level. However, YAP-induced rDMRs were relatively enriched in intergenic (51.0% compared to 42.2%) and depleted in promoter region (3.0% compared to 4.2%). g, Enrichment profiles representing the H3K4me1 ChIP-seq reads (left panel) and the H3K4me3 ChIP-seq reads (right panel) from E15.5 mouse livers centered at YAP-induced rDMRs.
Gene ontology (GO) analysis of YAP-induced rDMRs and YAP up-regulated genes revealed common biological features such as regulation of localization, system development, embryogenesis/morphogenesis, regulation of developmental process and response to stimulus (Supplementary Tables 1–2), suggesting that alteration of DNA methylation may directly contribute to YAP-induced transcriptional program. Interestingly, YAP-induced rDMRs were specifically enriched in distal intergenic regions, but not in promoters (Fig. 2e–f and Extended Data Fig. 5a). Average peak profile analysis around transcription start site (TSS) further confirmed the disassociation of YAP-induced rDMRs from TSS (Extended Data Fig. 5b). These data suggest that YAP activation causes regional DNA demethylation predominantly in enhancers, but not in promoters. Consistent with this view, peak overlap enrichment analysis of YAP-induced rDMRs with the available ChIP-seq profile of histone marks from fetal mouse livers48 revealed an association of YAP-induced rDMRs with the enhancer mark histone H3 monomethylation of lysine 4 (H3K4me1), but not the promoter mark H3K4me3 (Fig. 2g and Extended Data Fig. 4c and Supplementary Table 3).
TEAD transcription factors recruit TET1 to regulate target gene transcription
To understand how YAP induces regional DNA demethylation, we performed de novo motif analysis of YAP-induced rDMRs. This analysis revealed significant enrichment of consensus binding motifs for transcription factors such as RUNX and TEAD (Extended Data Fig. 5c–e and Supplementary Table 4). Interestingly, both RUNX and TEAD physically interact with YAP in transcriptional regulation49–52, and RUNX1 was further reported to associate with TET2/353.
To examine whether TET1 may be recruited by any of these transcription factors to chromatin, we examined physical interactions between TET1 and these transcription factors by co-immunoprecipitation assays. We found that epitope-tagged TET1 interacted with both RUNX1 and TEAD1/TEAD4 in a DNA/RNA-independent manner when co-expressed in HEK293T cells (Extended Data Fig. 6a–c). Moreover, this interaction requires the CXXC domain of TET1 (Fig. 3a and Extended Data Fig. 6d) and the YAP binding domain (YBD) of TEAD4 (Extended Data Fig. 6e–f). In contrast, TEAD4 did not associate with TET2 or TET3 (Extended Data Fig. 6g). Interestingly, epitope-tagged TET1 did not co-IP with YAP when they were co-expressed in HEK293T cells, but did co-IP with YAP when TEAD4 was also co-expressed. This result suggests that TEAD4, through its YBD, can simultaneously bind TET1 and YAP to form a protein complex (Fig. 3b). Consistent with this view, a YAP-binding site point mutation in TEAD454 abolished YAP-binding as expected but retained normal TET1 binding (Fig. 3b). We further confirmed physical interactions between endogenous TET1 and TEAD4 (Fig. 3c) or TEAD1 (Extended Data Fig. 6h) in YAPTg livers.
Fig. 3 |. TET1 interacts with TEAD4 transcription factor to cause regional histone acetylation and chromatin opening.
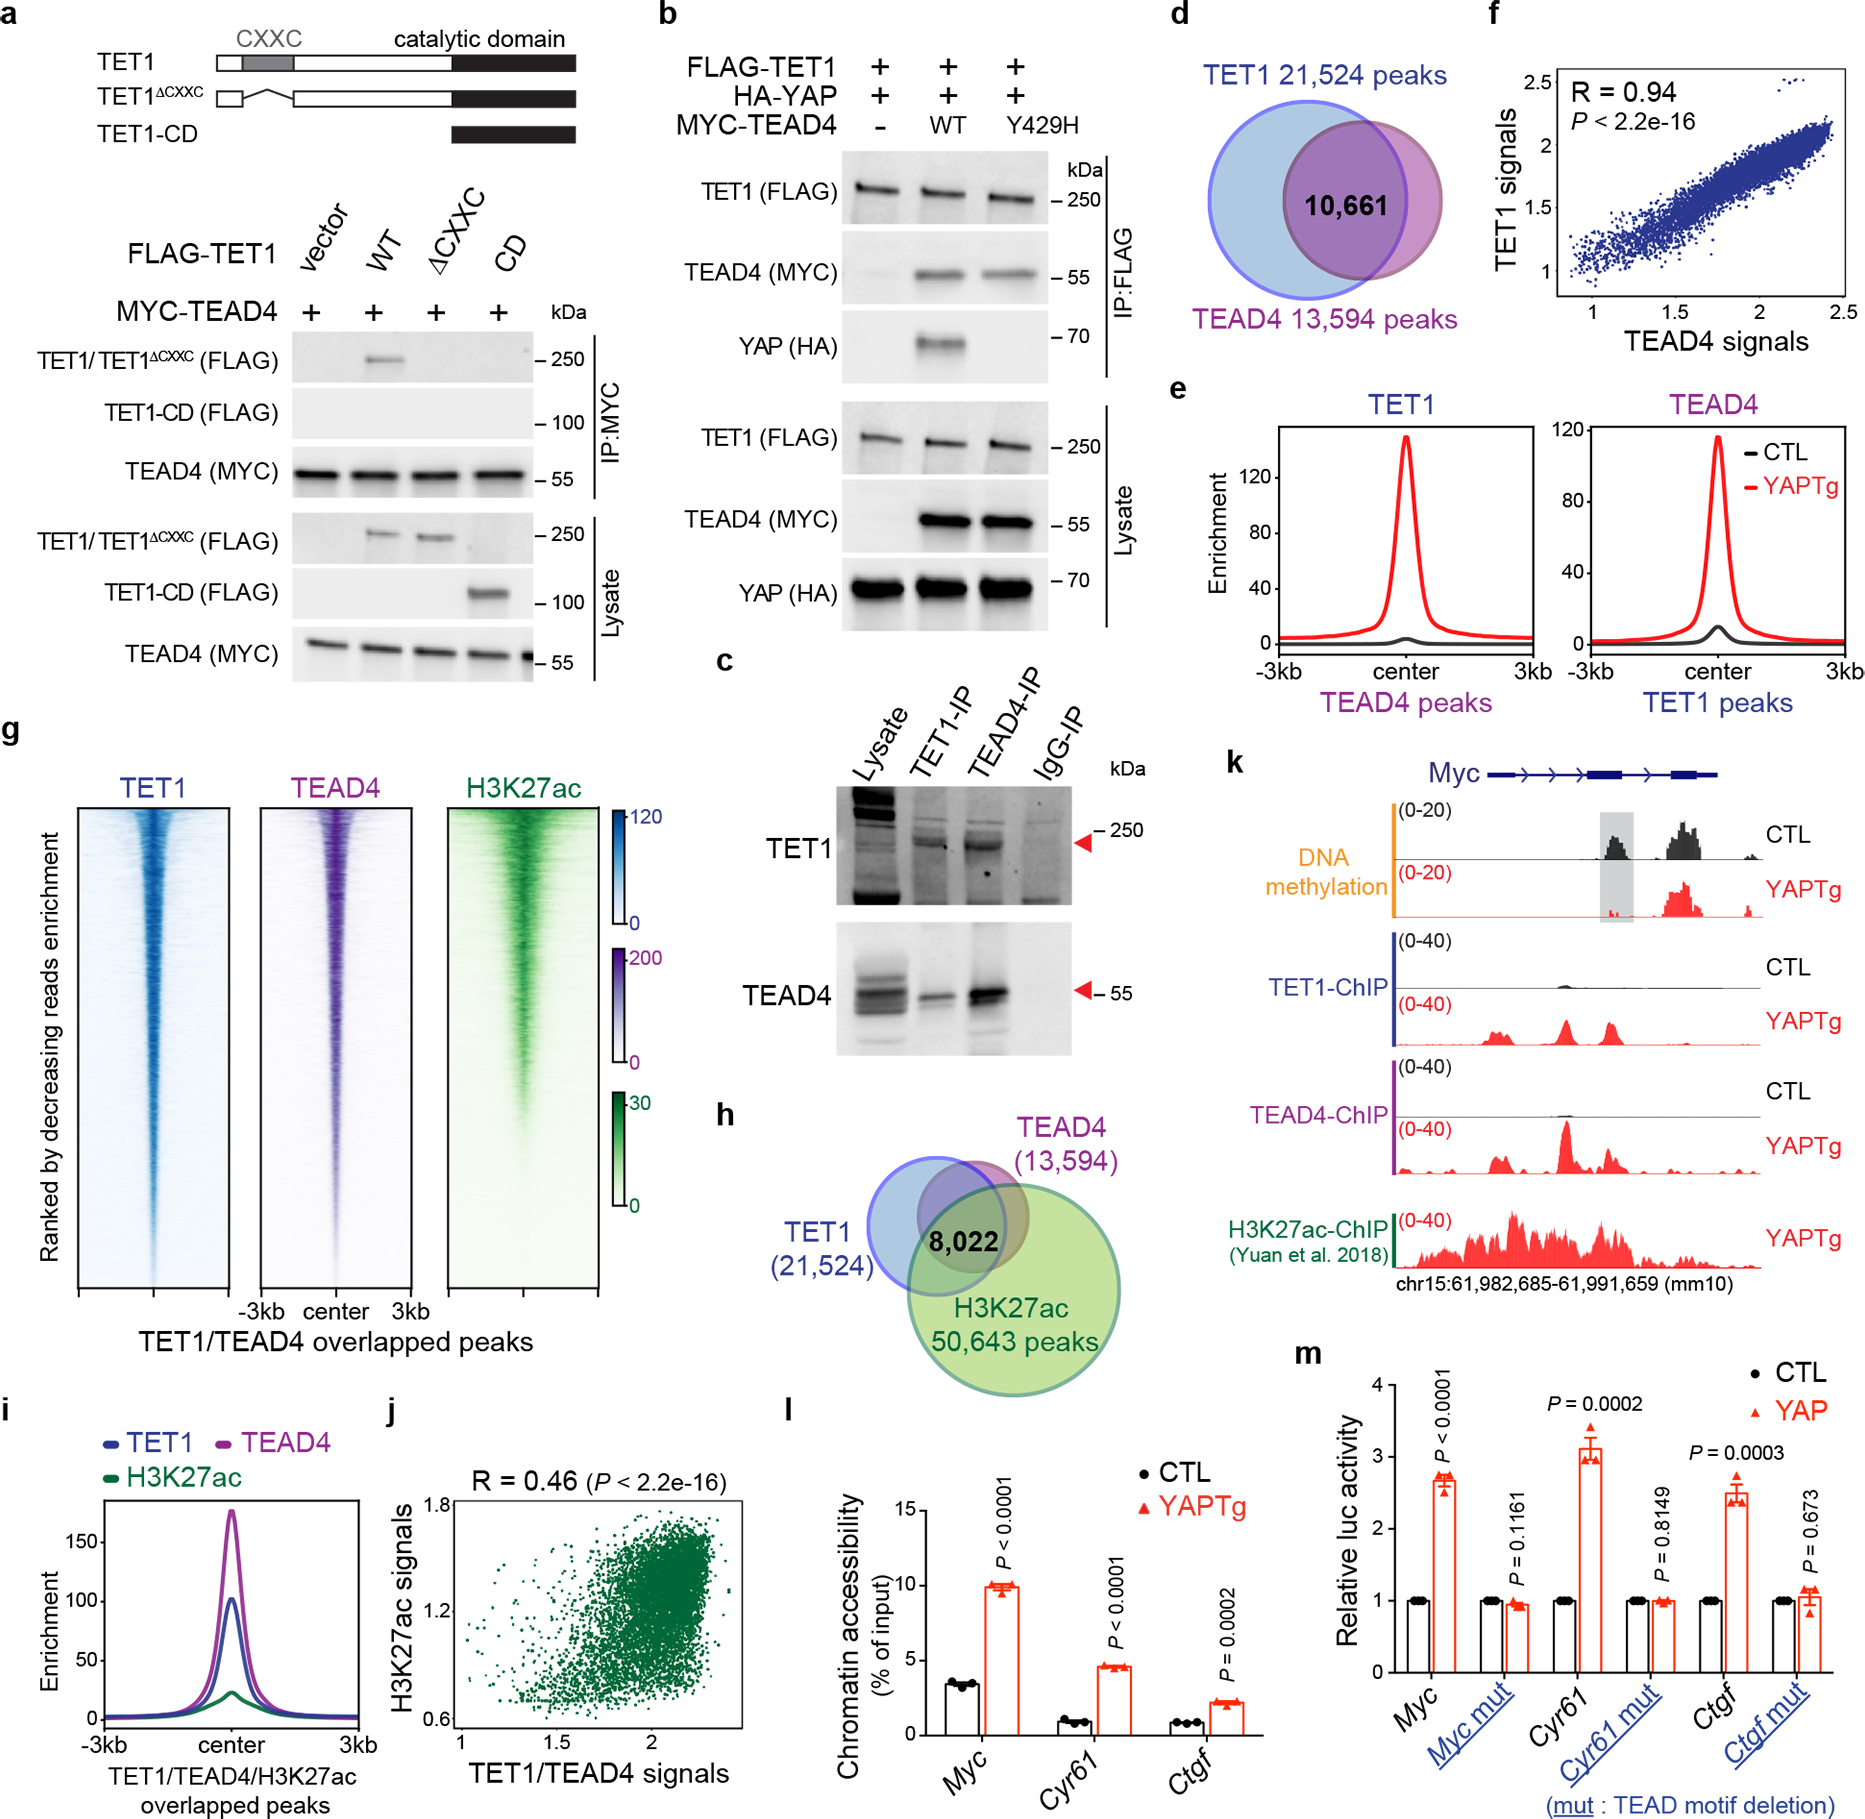
a, Co-IP assay showing physical interactions between TET1 and TEAD4. The schematic diagram indicates the relevant domains and deletion mutants of TET1 protein. b, Co-IP assay showing physical interactions between TET1, TEAD4 and YAP. TEAD4-Y429H is a YAP-binding defective mutant. c, Co-IP assay showing physical interactions between endogenous TET1 and TEAD4 in YAPTg livers. d, Venn diagram showing the overlap of TET1 ChIP-seq peaks and TEAD4 ChIP-seq peaks in YAPTg livers. e, Enrichment profiles representing the TET1 ChIP-seq reads from control and YAPTg livers centered at TEAD4 peaks (left panel) and the TEAD4 ChIP-seq reads from control and YAPTg livers centered at TET1 peaks (right panel). f, Spearman’s correlation coefficient analysis between TET1 and TEAD4 ChIP signals from the identified 10,661 TET1/TEAD4 overlapped peaks. g, Heatmaps representing ChIP enrichment of TET1, TEAD4 and H3K27ac reads centered at TET1/TEAD4 overlapped peaks. h, Venn diagram showing the overlap of peaks among TET1 ChIP-seq, TEAD4 ChIP-seq and H3K27ac ChIP-seq upon YAP activation. i, Enrichment profiles representing the TET1, TEAD4 and H3K27ac ChIP-seq reads centered at TET1/TEAD4/H3K27ac overlapped peaks upon YAP activation. j, Spearman’s correlation coefficient analysis between TET1/TEAD4 and H3K27ac signals from the identified 8,022 TET1/TEAD4/H3K27ac overlapped peaks. k, Genomic tracks displaying MBD-seq, TET1 ChIP-seq, TEAD4 ChIP-seq and H3K27ac ChIP-seq reads at the Myc rDMR locus. Grey column represents a YAP-induced rDMR region. l, FAIRE-qPCR at Myc, Cyr61 and Ctgf rDMRs in YAPTg livers (n = 3). m, Luciferase reporter assay showing enhancer activity of Myc, Cyr61 and Ctgf rDMRs of three independent experiments. Reporter construct containing rDMRs with either wild-type or mutated TEAD-binding motif was co-transfected with YAP-expressing or empty pcDNA3 vector into HEK293T cells. Images are representative of three independent experiments (a, b, c). Values represent mean ± s.e.m. (l, m). P values are calculated with two-tailed Spearman’s correlation test (f, j) or unpaired two-tailed Student’s t-test (l, m).
TET1 is known to encode two isoforms, a full-length embryonic isoform containing the CXXC domain and a short somatic isoform lacking the CXXC domain55. Since the CXXC domain is essential for TET1/TEAD4 interaction, we analyzed the exon usage of Tet1 and further confirmed that the full-length isoform of Tet1 is the predominant form in YAPTg mouse livers (Extended Data Fig. 6i) and in human liver cancers (Extended Data Fig. 6j).
The physical interactions between TEAD and TET1 suggest that TET1 may be recruited by TEAD to chromatin. To corroborate the functional significance of TEAD-TET1 interaction, we performed ChIP-seq to determine the genome-wide distribution of TET1 and TEAD4. Indeed, the vast majority of TEAD4 binding sites (78.4%, or 10,661 out of 13,594 sites) overlapped with TET1 binding sites in YAPTg livers (Fig. 3d). Moreover, the TET1 peak summits coincided with the corresponding TEAD4 peak summits, and vice versa (Fig. 3e and Extended Data Fig. 7b). Remarkably, in these TET1/TEAD4 overlapped peaks, the signals of TET1 peaks showed a strong positive correlation with their corresponding TEAD4 peaks (R = 0.94) (Fig. 3f). These data therefore revealed a genome-wide colocalization of TET1 and TEAD4 in vivo. To examine the functional significance of TET1/TEAD4 colocalization on chromatin, we compared TET1/TEAD4 overlapped peaks with published H3K27ac ChIP-seq data from YAP transgenic livers56. We found that 75.2% of TET1/TEAD4 co-bound sites were associated with the active chromatin mark H3K27ac (8,022 out of 10,661 sites) (Fig. 3g–j and Extended Data Fig. 5f, 7c), suggesting that TEAD-recruited TET1 occupies transcriptionally active chromatin in vivo.
To validate the genome-wide analyses, we performed ChIP-qPCR to examine TET1/TEAD4 binding and the active chromatin mark H3K27ac at the rDMRs of canonical YAP target genes Myc, Cyr61 and Ctgf. This analysis confirmed increased TET1/TEAD4 binding and H3K27ac upon YAP activation (Fig. 3k and Extended Data Fig. 7d–f). Consistent with these data, probing chromatin accessibility by formaldehyde-assisted isolation of regulatory elements followed by qPCR (FAIRE-qPCR)57 confirmed that these rDMRs became nucleosome-free, open chromatin upon YAP activation (Fig. 3l and Extended Data Fig. 7g). To functionally characterize their gene regulatory activity, we assayed luciferase reporters driven by the rDMR of Myc, Cyr61 or Ctgf. Indeed, these rDMRs yielded significant enhancer activity in response to YAP co-expression in a TEAD motif-dependent manner (Fig. 3m). To further determine whether YAP-induced TET1 has a functional effect on methylated rDMRs, we cloned Myc or Cyr61 rDMR into pCpGfree-promoter-Lucia, and then transfected the luciferase reporter construct, with or without in vitro DNA methylation, into HEK293T cells. Consistent with our model, we found that: 1) methylated reporter resulted in lower YAP-induced transcriptional activity (Extended Data Fig. 7h); 2) YAP-induced transcriptional activity of methylated reporter was further reduced by TET1 knockdown (Extended Data Fig. 7i). These data support that TET1 is essential for re-activating these methylated rDMRs upon YAP activation. Taken together, our findings suggest that TET1 is recruited by TEAD4 to induce regional DNA demethylation and subsequently histone acetylation to establish a permissive chromatin structure at enhancers of YAP target genes to facilitate transcriptional activation.
Loss of Tet1 suppresses YAP-induced transcriptional activation, hepatomegaly and tumorigenesis
To examine the physiological importance of TET1 in YAP-induced transcriptional program, we assessed the genetic requirement of TET1 in YAP-induced hepatomegaly and tumorigenesis, by combining the Dox-inducible YAPTg mice with Tet1 knockout20 (YAPTg Tet1−/−). Strikingly, although Tet1−/− mice are viable with no overt effect on liver function20 (Extended Data Fig. 8a) or liver-to-body weight ratio (Fig. 4a, 4c), genetic ablation of Tet1 dramatically suppressed YAP-induced hepatocyte proliferation and hepatomegaly (Fig. 4a, 4c and Extended Data Fig. 8b–c), completely prevented HCC formation, and greatly improved the survival of YAPTg mice (Extended Data Fig. 8g–m). A similar suppression of YAP-induced hepatomegaly was observed by knockdown of Tet1 using liver-targeted hydrodynamic injection of lentivirus expressing Tet1 short hairpin RNA (shRNA) (Fig. 4f–h and Extended Data Fig. 8d).
Fig. 4 |. Loss of Tet1 suppresses YAP-induced hepatomegaly and transcriptional activation.
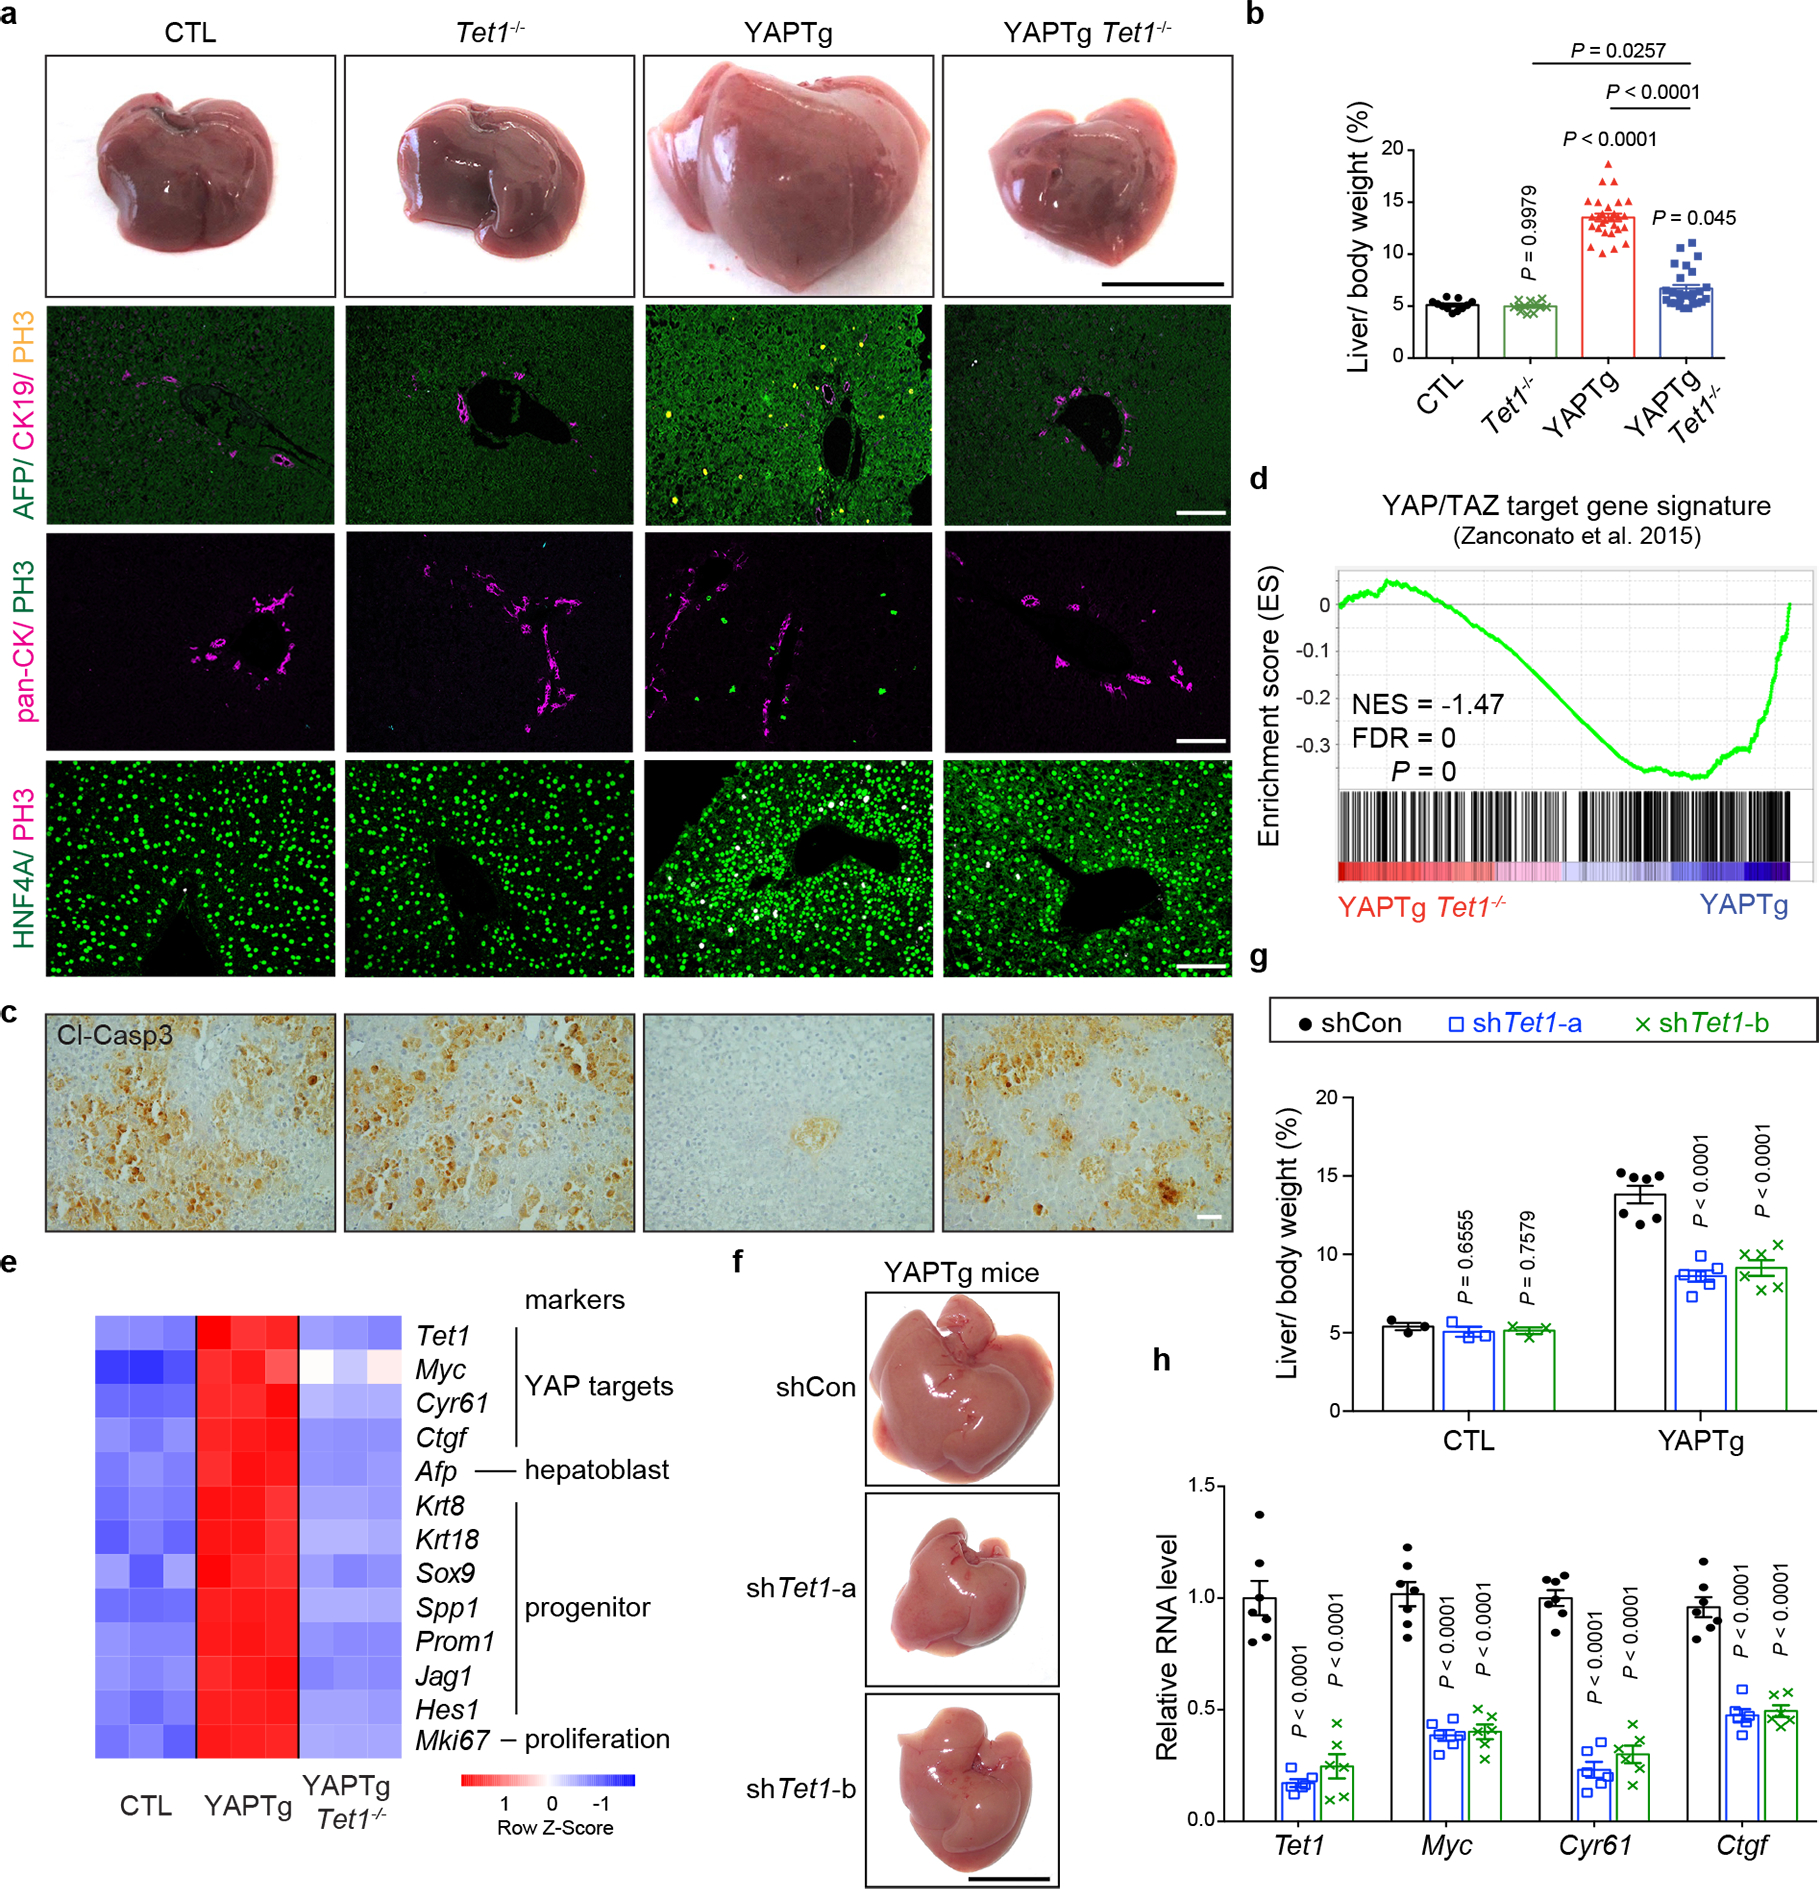
a, b, Representative gross image and immunostaining of livers (a) and quantification of liver-to-body weight ratio (b) from CTL (n = 11), Tet1−/− (n = 11), YAPTg (n = 28) and YAPTg Tet1−/− (n = 26) mice. Black scale bar, 1 cm. White scale bar, 100 μm. c, Representative cleaved caspase-3 (Cl-casp3) staining of liver sections from CTL (n = 6), Tet1−/− (n = 3), YAPTg (n = 6) and YAPTg Tet1−/− (n = 6) mice. Mice were kept on 50 mg/l Dox for 10 days, injected with Jo-2 antibody to induce liver injury and analyzed 5 hours post injection. Scale bar, 100 μm. d, GSEA of YAPTg Tet1−/− versus YAPTg livers for the expression of previously reported direct YAP/TAZ target genes. Also indicated are normalized enrichment score (NES) and false discovery rate (FDR). e, Heatmap of RNA-seq data displaying expression of representative hepatic lineage markers between control, YAPTg and YAPTg Tet1−/− livers. f, g, Representative gross image of livers (f) and quantification of liver-to-body weight ratio (g) from shCon (n = 7), shTet1-a (n = 6) and shTet1-b (n = 6) YAPTg mice. Mice were treated with Dox and received hydrodynamic injection of non-targeting control or Tet1 shRNA lentivirus. Black scale bar, 1 cm. h, RT-qPCR of Tet1, Myc, Cyr61 and Ctgf in YAPTg livers treated with Tet1 shRNA from shCon (n = 7), shTet1-a (n = 6) and shTet1-b (n = 6) YAPTg mice. Values represent mean ± s.e.m. (b, g, h). P values are calculated with one-way ANOVA with Tukey’s test (b, g, h).
Using an unbiased set of 379 direct YAP target genes previously identified in MDA-MB-231 cells as a reference49, gene set enrichment analysis (GSEA) revealed enrichment of these known YAP targets in YAPTg livers, but not YAPTg Tet1−/− livers (Fig. 4d). Consistent with this result, loss of Tet1 dramatically suppressed YAP-dependent transcriptional activation to a level comparable to that seen in control livers (Fig. 4e and Extended Data Fig. 8e–f), indicating that TET1 is essential for YAP-induced transcriptional program in mouse livers. Tet1 deletion also suppressed bile duct epithelial cells hyperplasia and intrahepatic cholangiocellular carcinoma (ICC) formation in liver-specific knockout of Nf2 (Alb-cre; Nf2flox/flox) (Fig. 5a–c), as well as tumorigenesis in liver-specific knockout of Sav1 (Alb-cre; Sav1flox/flox) (Fig. 5d–f), demonstrating a general requirement for TET1 in YAP-induced liver overgrowth and tumorigenesis. In contrast, Tet1 deletion did not impair TCP-induced hepatomegaly (Extended Data Fig. 2f), consistent with TET1 induction by YAP but not hepatocyte mitogen TCP as we showed earlier in this study. We also examined the contribution of TET1 to YAP-mediated anti-apoptotic function. Unlike YAP-activated livers, which was resistant to hepatocellular apoptosis induced by the Fas agonist Jo-2 antibody39, Tet1 deletion restored apoptosis in YAPTg livers to a level comparable to that seen in control livers (Fig. 4b). Thus, TET1 is critically required for both pro-proliferative and anti-apoptotic function of YAP. Taken together, these findings support the importance of TET1 and DNA demethylation in YAP-induced cell growth.
Fig. 5 |. Tet1 deletion suppresses YAP-induced hepatomegaly and tumorigenesis in diverse genetic models of YAP activation.
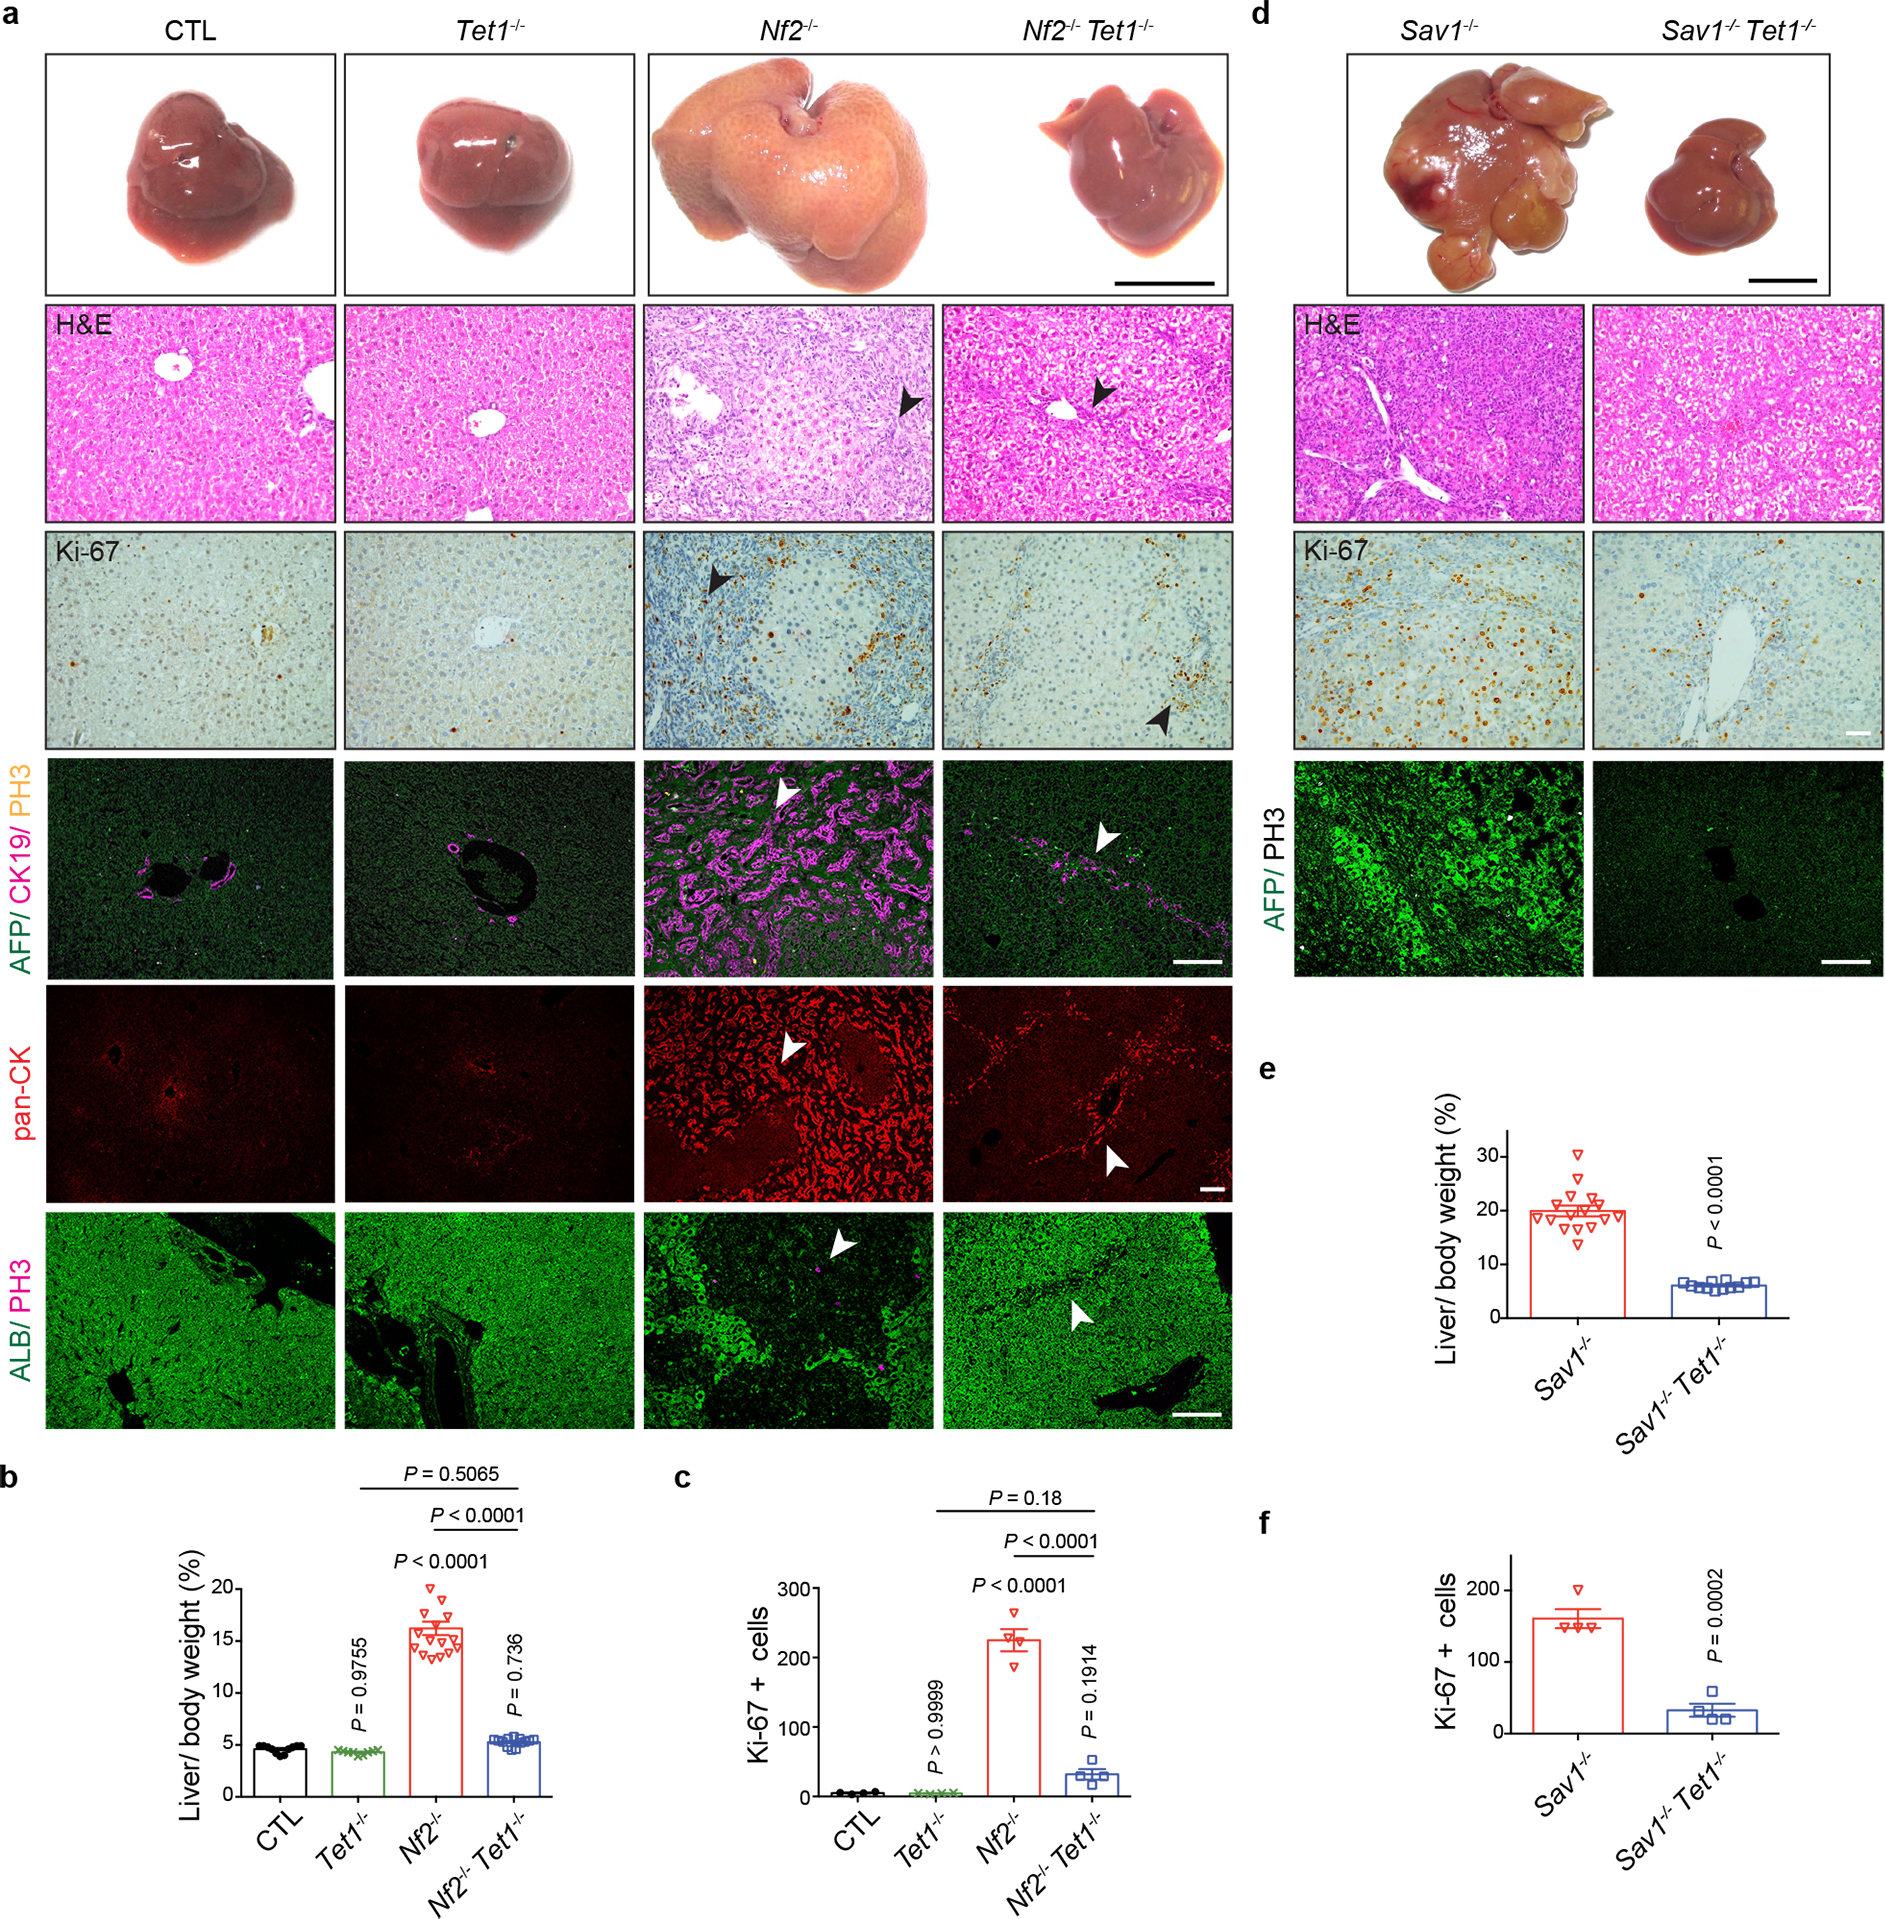
a, b, Representative gross image, H&E staining and immunostaining of livers (a) and quantification of liver-to-body weight ratio (b) from CTL (n = 11), Tet1−/− (n = 9), Nf2−/− (n = 17) and Nf2−/− Tet1−/− (n = 13) mice at ~6 months of age. Arrowheads mark bile duct cells expansion. Black scale bar, 1 cm. White scale bar, 100 μm. c, Quantification of Ki-67 positive cells from the indicated mice at ~6 months of age (n = 4). d, e, Representative gross image, H&E staining and immunostaining of livers (d) and quantification of liver-to-body weight ratio (e) from Sav1−/− (n = 16) and Sav1−/− Tet1−/− (n = 12) mice at ~6 months of age. Note that Tet1-deletion suppressed YAP-induced hepatomegaly and induction of the hepatoblast marker AFP. Black scale bar, 1 cm. White scale bar, 100 μm. f, Quantification of Ki-67 positive cells from the indicated mice at ~6 months of age (n = 4). Values represent mean ± s.e.m. (b, c, e, f). P values are calculated with unpaired two-tailed Student’s t-test (e, f) or one-way ANOVA with Tukey’s test (b, c).
TET1-dependent DNA demethylation and RNA induction of YAP target genes
To systematically interrogate the contribution of TET1 to YAP-induced DNA demethylation and transcriptional program, we used MBD-seq to compare DNA methylation profiles and RNA-seq to compare gene expression profiles between control, YAPTg, and YAPTg Tet1−/− livers. For DNA methylation, among 14,282 rDMRs (representing 12,289 genes) with ≥ 3-fold reduction in YAPTg compared to control livers, Tet1-deficiency restored DNA methylation in 8,131 rDMRs (representing 7,408 genes) (Fig. 6a–b and Extended Data Fig. 9a–e and Supplementary Table 5), suggesting that TET1 is a key mediator of YAP-induced DNA demethylation. Interestingly, among 2,963 genes with ≥ 2-fold induction in YAPTg compared to control livers, Tet1-deficiency reversed the induction for 2,579 genes (Fig. 6a–b and Supplementary Table 6), suggesting that TET1 is also a key mediator of YAP-induced transcriptional program. Indeed, hierarchical clustering revealed similar DNA methylation and gene expression profiles in YAPTg Tet1−/− and control livers that were distinct from YAPTg livers (Extended Data Fig. 9a), underscoring the central role of TET1 as a master effector in YAP-induced epigenetic and transcriptional changes in mouse livers. Integrated analysis of MBD-seq and RNA-seq datasets allowed us to identify 1,003 genes that exhibit both TET1-dependent DNA demethylation and TET1-dependent mRNA induction upon YAP activation (TET1-dependent YAP target genes) (Fig. 6b and Supplementary Tables 7–8), which were enriched in KEGG pathway such as MAPK signaling pathway, cell cycle and pathways in cancer (Fig. 6c).
Fig. 6 |. YAP activation drives TEAD4 expression through TET1-dependent epigenetic remodeling.
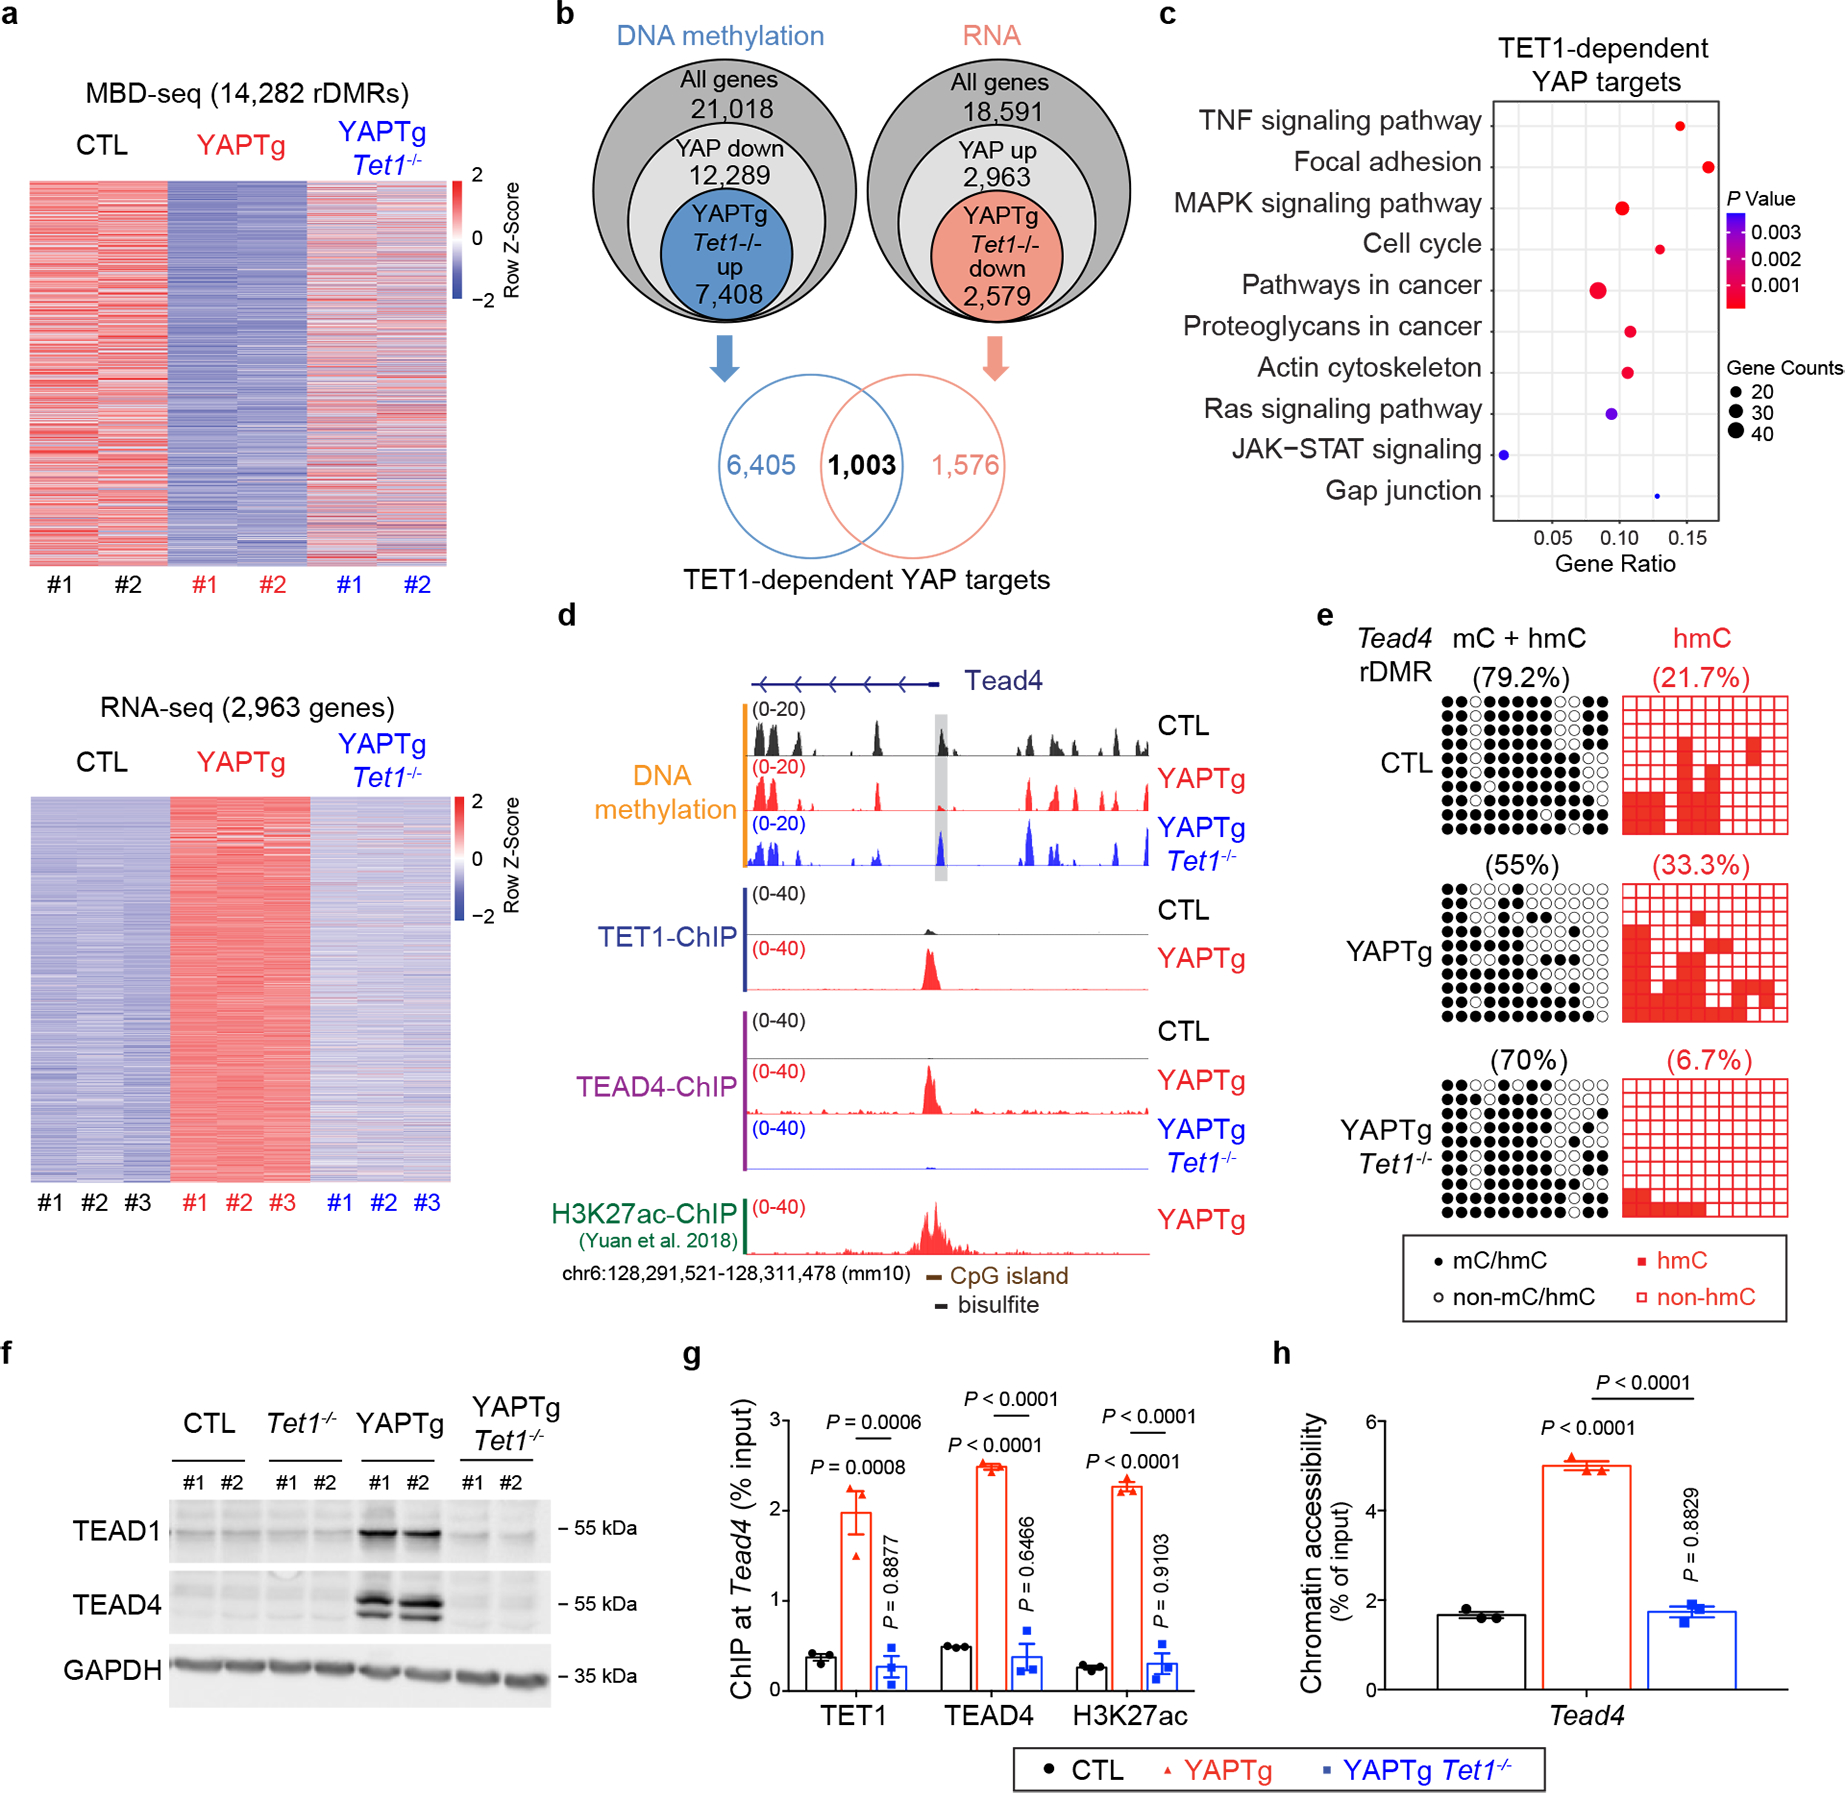
a, Top panel, heatmap of MBD-seq data displaying DNA methylation changes of rDMRs in control, YAPTg and YAPTg Tet1−/− livers, ranked from highest reduction in YAPTg livers to lowest (YAP/control ≥ 3-fold decrease and P < 0.05). Bottom panel, heatmap of RNA-seq data displaying fold changes of differentially expressed genes in control, YAPTg and YAPTg Tet1−/− livers, ranked from highest induction in YAPTg livers to lowest (YAP/control ≥ 2-fold increase and P < 0.05). b, Venn diagram showing the overlap of DNA methylation (MBD-seq) and RNA expression (RNA-seq) to identify 1,003 genes regulated by TET1-dependent DNA demethylation and RNA induction (TET1-dependent YAP targets). c, Kyoto Encyclopedia of Genes and Genomes (KEGG) pathway enrichment analysis of 1,003 TET1-dependent YAP target genes. d, Genomic tracks displaying MBD-seq, TET1 ChIP-seq, TEAD4 ChIP-seq and H3K27ac ChIP-seq reads at the Tead4 rDMR locus. Grey column represents a YAP-induced rDMR region. The cloning-based locus-specific bisulfite sequencing site is also marked. e, Cloning-based traditional bisulfite sequencing (left panels) and TAB-seq (right panels) of 12 CpG sites at the Tead4 rDMR locus. All sequencing results include 10 independent clones. f, Western blot of TEAD1 and TEAD4 protein levels in the indicated livers. Images are representative of three independent experiments. g, h, ChIP-qPCR (n = 3) (g) and FAIRE-qPCR (n = 3) (h) at Tead4 rDMR in the indicated livers. Values represent mean ± s.e.m. P values are calculated with one-way ANOVA with Tukey’s test.
TET1-mediated DNA demethylation is required for TEAD1/4 induction by YAP
A close examination of TET1-dependent YAP target genes revealed many well characterized YAP targets such as Myc, Cyr61 and Ctgf, as well as several known YAP interacting proteins, such as Tead1, Tead4, Runx1 and Fos49 (Supplementary Table 7). Both Tead1 and Tead4 exhibited decreased 5mC, increased 5hmC and increased expression levels upon YAP activation, all in a TET1-dependent manner (Fig. 6d–f and Extended Data Fig. 9f–k). These results suggest that the TEAD transcription factors may be directly induced by YAP as part of a feedforward loop to boost the activity of the YAP-TEAD transcription complex. Indeed, analysis of published TEAD4 ChIP-seq data revealed robust TEAD4 peaks at both TEAD1 and TEAD4 genes in human embryonic stem cells (Extended Data Fig. 9l), suggesting that TEAD1 and TEAD4 are direct targets of the YAP-TEAD complex. Further supporting this view, the rDMRs of Tead1 and Tead4 showed increased TET1/TEAD4 binding, active chromatin mark H3K27ac and chromatin accessibility in YAPTg livers (Fig. 6g–h and Extended Data Fig. 10a–d), consistent with these YAP-induced rDMRs functioning as active, open chromatin for the YAP-TEAD complex. Moreover, analysis of TCGA revealed increased TEAD1 and TEAD4 transcript levels in human foregut cancers with a positive correlation between YAP/TAZ and TEAD1/4 abundance (Extended Data Fig. 3d–e), and foregut cancer patients with higher expression of TEAD1/4 had a worse prognosis (Extended Data Fig. 3f). Taken together, we suggest that TET1-mediated DNA demethylation facilitates the induction of TEAD1 and TEAD4 upon YAP activation, constituting a feedforward loop that sustains the activity of the YAP-TEAD transcription complex in a TET1-dependent manner. Accordingly, genetic ablation of Tet1 terminates this self-sustaining cycle and abolishes much of the YAP-induced transcriptional and oncogenic programs.
Drug-induced DNA demethylation partially compensates for TET1 function in YAPTg Tet1−/− livers
To further interrogate the role of TET1 and DNA methylation in YAP signaling, we treated YAPTg Tet1−/− mice with low-dose 5-Aza-2’-deoxycytidine (decitabine; DAC)58,59, an epigenetic drug that inhibits DNA methylation and induces non-specific genome-wide DNA demethylation. Interestingly, while DAC treatment did not alter liver size of control mice (Fig. 7c), we observed a remarkable restoration of liver size, cell proliferation and apoptosis resistance in DAC-treated YAPTg Tet1−/− livers as compared to mock-treated YAPTg Tet1−/− livers (Fig. 7a–d). Consistent with these findings, DAC treatment was sufficient to re-activate expression of canonical YAP target genes and hepatoblast/progenitor markers (Fig. 7a and 7e). Genome-wide analysis revealed that 45.8% of TET1-dependent YAP target genes (459 out of 1,003) were up-regulated in YAPTg Tet1−/− livers after DAC treatment (Fig. 7f), and DAC-treated YAPTg Tet1−/− livers showed similar gene expression and DNA methylation profiles as YAPTg livers (Fig. 7g and Extended Data Fig. 10e–f). Thus, YAP-induced TET1 activity can be bypassed, at least in part, by drug-induced DNA demethylation, similar to previous report that TET2-deficiency in erythroleukemia cells can be partially corrected by 5-Azacytidine60. That drug-induced DNA demethylation could re-activate YAP targets in YAPTg Tet1−/− animals provides further support for the importance of TET1 and DNA demethylation in YAP-dependent transcriptional program.
Fig. 7 |. Drug-induced DNA demethylation partially compensates for TET1 function in YAPTg Tet1−/− livers.
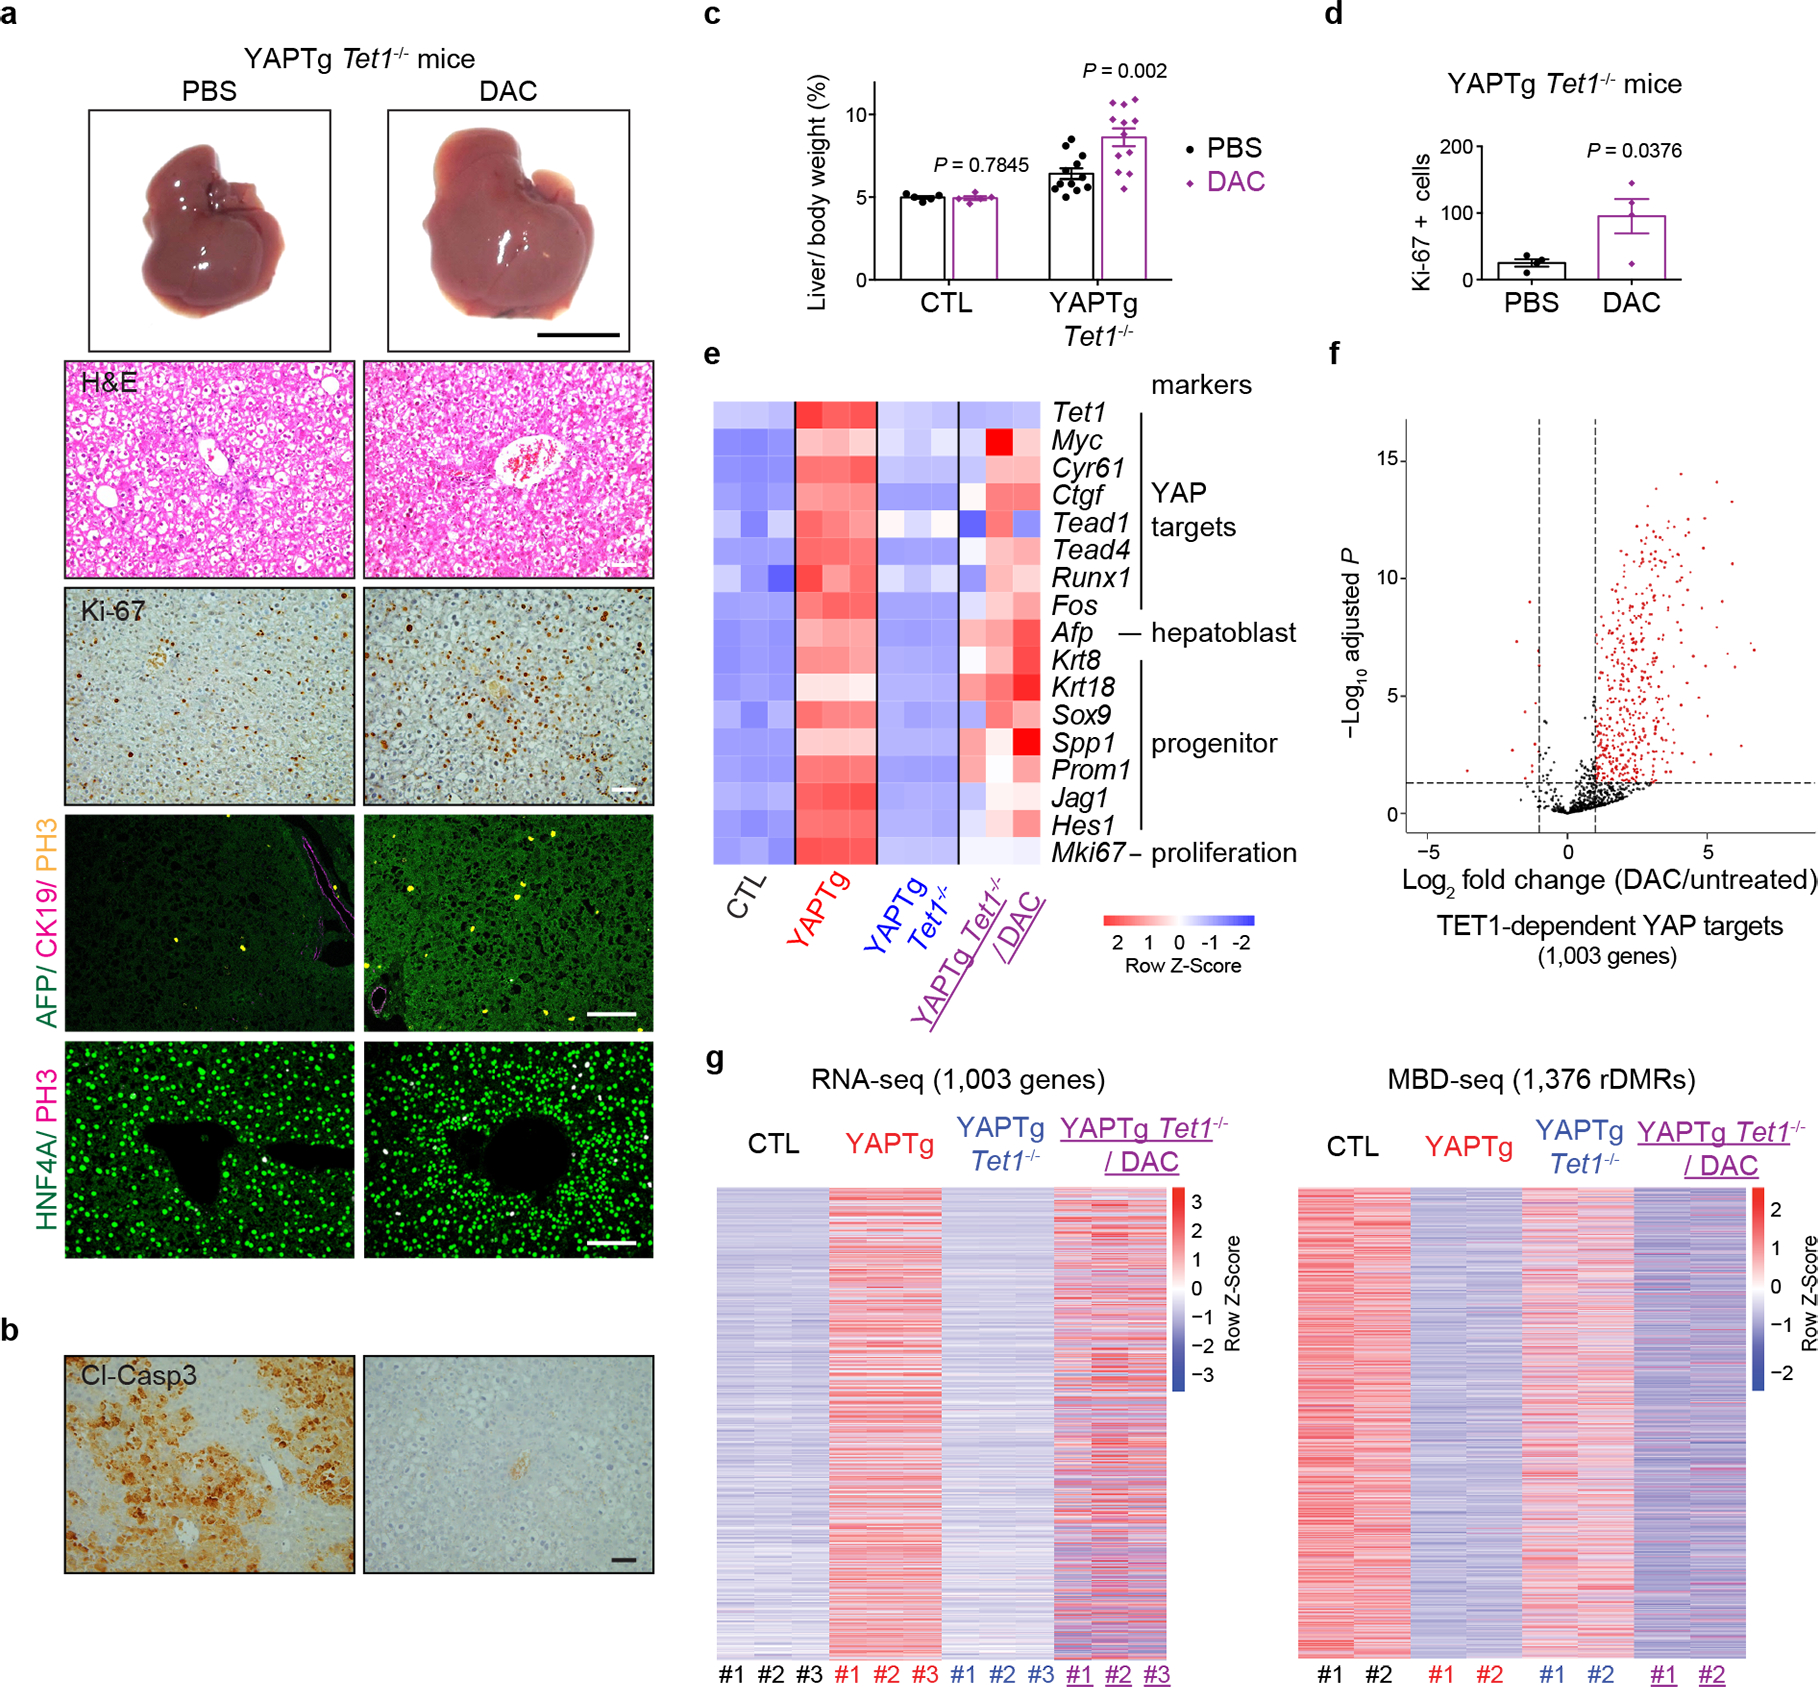
a, Representative gross image, H&E staining and immunostaining of livers from PBS-treated (n = 12) and DAC-treated (n = 12) YAPTg Tet1−/− mice. 1-month-old mice were kept on 50 mg/l Dox, injected intraperitoneally with 0.5 mg/kg DAC daily for 10 days. Black scale bar, 1 cm. White scale bar, 100 μm. b, Representative cleaved caspase-3 (Cl-casp3) staining of liver sections from PBS-treated (n = 4) and DAC-treated (n = 7) YAPTg Tet1−/− mice. 1-month-old mice were kept on 50 mg/l Dox, injected intraperitoneally with 0.5 mg/kg DAC daily for 10 days. Mice were then injected with Jo-2 antibody to induce liver injury and analyzed 5 hours post injection. Scale bar, 100 μm. c, Quantification of liver-to-body weight ratio from control (PBS-treated n = 5; DAC-treated n = 5) and YAPTg Tet1−/− mice (PBS-treated n = 12; DAC-treated n = 12). d, Quantification of Ki-67 positive cells in livers from PBS-treated and DAC-treated YAPTg Tet1−/− mice (n = 4). e, Heatmap of RNA-seq data displaying expression of representative hepatic lineage markers between the indicated mice. f, A volcano plot for differential RNA expression of 1,003 TET1-dependent YAP target genes in DAC-treated compared to untreated YAPTg Tet1−/− livers. Red dots represent remarkable (fold change ≥ 2) and significant (P < 0.05) genes. g, Heatmaps of RNA-seq (left panel) and MBD-seq (right panel) data displaying changes of 1,003 TET1-dependent YAP target genes between the indicated mice. Values represent mean ± s.e.m. (c, d). P values are calculated with unpaired two-tailed Student’s t-test (c, d).
Discussion
Although the YAP-TEAD complex is known to regulate the expression of thousands of target genes, how these target genes contribute to the oncogenic program driven by YAP remains unknown. In particular, it is unclear whether there are any key targets that underlie the growth-promoting activities of YAP. Such key targets, in principle, may function as master regulators that coordinate the expression of YAP target genes at the genome-wide level. Our current study implicates the 5-methylcytosine dioxygenase TET1 as one such critical target in the liver. Not only is TET1 expression induced by YAP activation, TET1 is also recruited by the YAP-TEAD complex to its target genes to facilitate their transcriptional induction. Accordingly, loss of TET1 not only reverses YAP-induced epigenetic and transcriptional changes but also suppresses YAP-induced hepatomegaly and tumorigenesis. These findings therefore not only place TET1 at a central node in the YAP-induced transcriptional network, but also illustrate how oncogenic signaling induces regional DNA demethylation to promote liver growth and tumorigenesis. While our current study has focused on the liver, the regulation of TET1 transcription by the YAP-TEAD complex might extend to other tissues, in light of the positive correlation between elevated YAP/TAZ and TET1 mRNA levels in multiple foregut cancers (Fig. 1j–k and Extended Data Fig. 3a–b).
The molecular mechanisms by which nuclear effectors of oncogenic signaling pathways activate target gene transcription have been an active area of research. Previous studies of the Hippo-pathway-specific YAP-TEAD complex have implicated histone-modifying enzymes such as histone methyltransferase NCOA6 and histone acetyltransferase p30051,61,62, as well as chromatin remodelers such as SWI/SNF complex, BRD4 and GAGA factor63–66, in YAP-mediated transcriptional activation. Our current findings shed new light into this question by revealing a functional link between YAP-TEAD and DNA methylation. This conclusion is supported by physical interactions between TET1 and YAP-TEAD, the genome-wide colocalization of TET1, TEAD and active chromatin mark H3K27ac, as well as the TET1-dependent DNA demethylation and transcriptional induction of YAP-TEAD target genes. Whether nuclear effectors of other oncogenic signaling pathway also employ similar mechanism to remodel DNA demethylation warrants further investigation.
Another notable finding from our study concerns a feedforward loop whereby YAP directly induces the expression of TEAD DNA-binding transcription factors to help sustain the activity of the YAP-TEAD transcription complex in YAP activated cells (Extended Data Fig. 10g). Interestingly, YAP-induced transcription of TEAD genes not only requires the direct binding of YAP-TEAD as reported previously49,67,68, but also TET1-mediated DNA demethylation at the TEAD gene loci. This conclusion is supported by direct binding of TET1 and TEAD to TEAD gene loci, as well as the TET1 dependency of DNA demethylation, active chromatin marks and transcriptional induction of TEAD genes. Besides the positive feedforward loop described here, Yki/YAP is known to engage a negative feedback loop by inducing the transcription of upstream tumor suppressors of the Hippo pathway, such as Merlin/NF2 and KIBRA, presumably as a mechanism to maintain signaling homeostasis39,69–71. Indeed, we observed that the expression of Kibra and Amotl2, two upstream Hippo pathway tumor suppressors, was induced in YAPTg livers in a TET1- and DNA-demethylation-dependent manner (Supplementary Table 7). Thus, TET1-mediated DNA demethylation is critical for both the positive and the negative transcriptional loops regulating the Hippo pathway. Consistent with this view, TET1 was reported to promote the formation of bile duct organoids in culture by regulating the expression of the Hippo pathway tumor suppressors (such as Nf2 and Kibra) and oncogenes (such as Taz and Tead1)72.
In summary, we identify TET1 as a direct YAP target and critical mediator of YAP-induced oncogenic transcriptional program. We show that YAP reprograms chromatin accessibility via TET1-mediated regional DNA demethylation of canonical YAP targets such as Myc, Cyr61 and Ctgf, as well as YAP-binding partners such as Tead1 and Tead4. This facilitates chromatin opening and binding of TEAD transcription factors to further enhance the transcription of YAP target genes including the TEAD transcription factors themselves. Importantly, loss of TET1 reverses YAP-induced transcriptional and chromatin changes as well as YAP-induced hepatomegaly and tumorigenesis. These findings suggest that, among the thousands of genes directly induced by YAP, TET1 functions as a master regulator that coordinates the global expression of YAP target genes at the genome-wide level, thus exemplifying the critical importance of DNA methylation remodeling in oncogene-induced transcriptional reprogramming. Given the widespread roles of YAP in development, regeneration and disease, our identification of TET1 as a critical YAP target underlying the global YAP-induced epigenetic and transcriptional landscapes implicates TET1 as a potential target for modulating YAP signaling in physiology and disease.
Methods
Ethics statement
This research complies with all relevant ethical regulations. Animal protocols (#APN 2016-101758) were approved by the Institutional Animal Care and Use Committee of the University of Texas Southwestern Medical Center.
Animal models
All experiments were performed in both male and female mice unless otherwise stated. Albumin-cre (Alb-cre) — (catalog #: 003574, The Jackson Laboratory), Tet1 knockout (Tet1−/−) — (catalog #: 017358, The Jackson Laboratory), ApoE-rtTA-YAP 39, ApoE-rtTA, TRE-TAZ4SA 73, Mst1−/−; Mst2flox/flox 42, Nf2flox/flox, Sav1flox/flox and YAPflox/flox 44 mice were described previously. To generate liver-specific gene overexpression mice, ApoE-rtTA mice were bred with TRE-TAZ4SA mice. To generate liver-specific gene deletion mice, Alb-cre mice were bred with Mst1−/−; Mst2flox/flox, Nf2flox/flox, Sav1flox/flox or YAPflox/flox mice. To generate Tet1-deficient mice, Tet1−/− mice were bred with ApoE-rtTA-Yap, Alb-cre; Nf2flox/flox or Alb-cre; Sav1flox/flox mice. For Doxycycline treatment, 1-month-old mice or nursing mothers of newborn pups were fed with 50 mg/l Doxycycline (LKT Laboratories, Inc.) in drinking water for the indicated time. To induce hepatocytes apoptosis, 1-month-old mice were kept on 50 mg/l Dox for 10 days, injected intraperitoneally with 0.4 mg/kg Jo-2 antibody (BD Biosciences). Mice were sacrificed 5 hours post injection. For decitabine administration, 1-month-old mice were kept on 50 mg/l Dox, injected intraperitoneally with 0.5 mg/kg decitabine (Cayman Chemical) daily for 10 days. For TCP-induced hepatocyte proliferation and hepatomegaly, 1-month-old mice were injected intraperitoneally with a single dose of 3 mg/kg TCPOBOP (Sigma) prepared in 10% DMSO/90% corn oil. Mice were sacrificed 7 days post injection.
All mice in this study were housed at the Animal Resource Center at the UT Southwestern Medical Center and bred inside animal facility with 12 h dark/12 h light cycles and a climate control system monitoring the ambient temperature and humidity. Mice were provided standard laboratory chow and allowed free access to water.
Cell Culture
All cell lines were cultured at 37 °C with 5% CO2 in tissue culture incubators. HEK293T cells were cultured in Dulbecco’s modified eagle medium (DMEM) in 10% FBS (Gibco), 100 units/ml streptomycin, 100 mg/ml penicillin.
Plasmids
pGL3-Tet1 promoter A was a gift from Kian Peng Koh (Addgene plasmid # 63881; http://n2t.net/addgene:63881; RRID:Addgene_63381)74. FLAG-TET1 (full-length) and FLAG-TET1 (ΔCXXC) were gifts from Shaun Cowley (Addgene plasmid # 124396; http://n2t.net/addgene:124396; RRID:Addgene_124396) (Addgene plasmid # 124398; http://n2t.net/addgene:124398; RRID:Addgene_124398)75. FLAG-TET1-CD was a gift from Jean-Pierre Issa (Addgene plasmid # 83570; http://n2t.net/addgene:83570; RRID:Addgene_83570)76. FLAG-TET2 and FLAG-TET3 were gifts from Anjana Rao (Addgene plasmid # 41710; http://n2t.net/addgene:41710; RRID:Addgene_41710)77 (Addgene plasmid # 49446; http://n2t.net/addgene:49446; RRID:Addgene_49446)78. pRK5-Myc-TEAD1, Myc-TEAD4 (ΔTEA) and Myc-TEAD4-Y429H (ΔTEA) were gifts from Kunliang Guan (Addgene plasmid # 33109; http://n2t.net/addgene:33109; RRID:Addgene_33109)54 (Addgene plasmid # 24638; http://n2t.net/addgene:24638; RRID:Addgene_24638) (Addgene plasmid # 33041; http://n2t.net/addgene:33041; RRID:Addgene_33041)79. Myc-RUNX1 and Myc-TEAD4 (full-length) were purchased from ORIGENE (RC223809; RC219686).
Tet1 lentiviral shRNA cloning, virus production and injection
Tet1 knockdown viral vectors were generated by cloning the mouse Tet1 shRNA hairpin sequence into the lentiviral miR30-based expression vectors pRRL as described previously (Supplementary Table 9)80. Lentiviral particles expressing shRNA hairpins were generated by co-transfecting viral vector, psPAX2 packaging plasmid and pVSV-G plasmid into HEK293T cells. Virus-contained media were filtered through 0.45 μm filter to removed cell debris and concentrated by ultracentrifugation. Virus was reconstituted with PBS and stored at −80 °C in aliquots. The titer of each viral stock was determined by fluorescence titering assay in HEK293T cells. shRNA lentiviral particle was injected into 6-weeks-old mice at 1 × 10⁹ TU/ml in 0.2 ml of sterile saline via tail vein. After injection, mice were kept on 50 mg/l Dox for 10 days and sacrificed.
Serum alanine aminotransferase (ALT), aspartate aminotransferase (AST) and albumin (ALB) measurements
Serum levels of ALT, AST and ALB were measured using ALT Colorimetric Activity Assay Kit (Cayman, 700260), AST Colorimetric Activity Assay Kit (Cayman, 701640) and Mouse Albumin ELISA Kit (abcam, ab108792) according to the manufacturer’s protocols, respectively.
RT-qPCR
Total RNA from mouse livers was extracted using the TRIzol reagent (Invitrogen). 1 μg RNA was reverse-transcribed to generate cDNA using an iScript cDNA Synthesis Kit (Bio-Rad). Specific primer pairs were then used to amplify target genes (Supplementary Table 9). qPCR reactions were conducted duplicates or triplicates with iQ SYBR Green Supermix (Bio-Rad) on a CFX96 Real-time System (Bio-Rad). Expression levels are given relative to Gapdh.
RNA-seq library preparation, sequencing and data analysis
3 biological replicates of RNA samples from control, YAPTg, YAPTg Tet1−/− and DAC-treated YAPTg Tet1−/− livers were used. 1-month-old male mice were kept on 50 mg/l Dox for 10 days. Liver total RNA was extracted using TRIzol Plus RNA Purification Kit (Invitrogen) and further cleaned up by TURBO DNA-free Kit (Ambion). Samples were run on the Agilent 2100 Bioanalyzer for quality control. 1 μg of RNA was then prepared with the TruSeq Stranded Total RNA LT Sample Prep Kit from Illumina according to the manufacturer’s protocols. Samples were run on the Illumina HiSeq 2500 at the University of Texas Southwestern Next Generation Sequencing Core. For RNA-seq data analysis, sequencing reads were mapped to the mm10 mouse genome and differential gene expression analysis was carried out by edgeR R package (v3.36.0). RNA-Seq results were visualized with volcano-plot using ggplot2 R package. For heatmap analysis, differential expression of genes with more than 2-fold increase in YAPTg compared to control livers or 1,003 TET1-dependent YAP target genes were visualized with heatmap using pheatmap R package. Ward D clustering was used as hierarchical clustering method for columns. Expression profile of selected genes from dataset GSE55559 43 was also visualized with heatmap using pheatmap R package.
Gene ontology (GO) and KEGG pathway analysis
For indicated genes, GO analysis was performed with iDEP web site (http://bioinformatics.sdstate.edu/idep/)81. For 1,003 TET1-regulated YAP target genes, KEGG pathway analysis was performed with Enrichr web site (https://maayanlab.cloud/Enrichr/). KEGG result was visualized using ggplot2 R package.
Gene set enrichment analysis (GSEA)
GSEA was performed using GSEA v4.0.3 software with default settings. 379 direct YAP/TAZ/TEAD target genes previously identified in MDA-MB-231 human breast cancer cells49 were loaded as gene set databases.
Western blot
50 mg mouse livers was lysed with RIPA buffer containing protease inhibitors. Equal amounts of extracted proteins were loaded on 10% SDS-PAGE gels and transferred onto nitrocellulose membrane (Bio-Rad). Primary antibodies used were anti-TET1 (1:1,000, GeneTex, GTX124207), anti-TEAD1 (1:500, BD Transduction Laboratories, 610923), anti-TEAD4 (1:1,000, abcam, ab58310) or anti-GAPDH (1:3,000, Millipore Sigma, MAB374). Secondary antibodies used were HRP-linked ECL anti-mouse IgG (1:5,000, GE Healthcare, NA931) or HRP-linked ECL anti-rabbit IgG (1:5,000, GE Healthcare, NA9340). Signal was visualized by SuperSignal West Dura Extended Duration Substrate (Thermo Scientific) with the ChemiDoc MP Imaging System (Bio-Rad).
Luciferase reporter assay
The Tet1-promoter-driven firefly luciferase reporter included mouse Tet1 promoter (nucleotides −4,260 to 410) within pGL3-basic luciferase reporter plasmid (pGL3-Tet1 promoter A, Addgene plasmid #63881)74. The rDMR enhancer-driven firefly luciferase reporter included rDMR fragments from Myc, Cyr61 or Ctgf within pGL3-Promoter luciferase reporter plasmid (pGL3-Promoter vector, Promega, E176A). rDMR fragments were amplified from mouse liver genomic DNA with specific primer sets (Supplementary Table 9). Mutagenesis of the TEAD binding site was performed using the In-fusion HD Cloning Plus (TaKaRa, 638910) according to the manufacturer’s protocols with specific primer sets (Supplementary Table 9). For luciferase assay, HEK293T cells in 24-well plates were co-transfected with 200 ng of firefly luciferase plasmid (Tet1 promoter or rDMR enhancer), 20 ng of Renilla luciferase internal control plasmid and 200 ng of YAP-expression plasmid or pcDNA3 vector plasmid. Luciferase assay was performed at 48 hours post-transfection using Dual Luciferase Reporter Assay System (Promega) according to the manufacturer’s protocols. Results were expressed as a normalized ratio of firefly to Renilla luciferase. Three independent experiments were performed with 4 replicates.
Lucia reporter assay with in vitro DNA methylation
The rDMR enhancer-driven Lucia luciferase reporter included the rDMR fragment from Myc or Cyr61 within pCpGfree-promoter-Lucia vector (InvivoGen, pcpgf-promlc). rDMR fragments were amplified from mouse liver genomic DNA with specific primer sets (Supplementary Table 9). Plasmid were methylated in vitro using CpG methyltransferase M. SssI (New England Biolabs, M0226M). Successful methylation was confirmed by digestion with methylation sensitive restriction enzymes Hha I (New England Biolabs, R0139S) and Hpa II (New England Biolabs, R0171S) and methylation insensitive restriction enzymes Msp I (New England Biolabs, R0106S). HEK293T cells in 24-well plates were co-transfected with 100 ng of unmethylated or methylated Lucia luciferase plasmid with rDMRs, 10 ng of firefly luciferase internal control plasmid and 200 ng of YAP-expression plasmid. Luciferase assay was performed at 48 hours post-transfection using Dual Luciferase Reporter Assay System (Promega) according to the manufacturer’s protocols. Results were expressed as a normalized ratio of Lucia to firefly luciferase. Three independent experiments were performed with 4 replicates.
siRNA transfection
HEK293T cells were transfected with 10 nM siRNA using the Lipofectamine RNAiMAX transfection reagent (Invitrogen, 13778075). siRNAs were purchased from ON-TARGETplus SMARTpool with 4 individual siRNAs (Dharmacon), including non-targeting control (D-001810-10-05), human TEAD4 siRNA (L-019570-00-0005) and human TET1 siRNA (L-014635-03-0005). Samples were collected at 48 hours post-transfection for luciferase assay or western blot.
TCGA data analysis
TCGA RNA expression, correlation and overall survival data analyses were performed with GEPIA2 (http://gepia2.cancer-pku.cn) webtools82,83. Spearman’s correlation coefficient analysis was used to calculate gene expression relationship between target genes and cutoffs for visualization were determined by gene expression level as the program’s default setting.
DNA dot blot assays
For global 5mC and 5hmC quantifications, DNA dot blots were performed with a 96-well manifold. Genomic DNA from mouse livers was extracted using DNeasy Blood and Tissue Kit (Qiagen) and further purified with Genomic DNA Clean and Concentrator (Zymo Research). 1 μg genomic DNA was mixed with 0.4 M NaOH, 10 mM EDTA and denatured at 100 °C for 10 min. Samples were then chilled on ice and neutralized with an equal volume of 2 M ammonium acetate pH 7.0 and serial 2-fold dilutions were loaded onto nitrocellulose membrane (Bio-Rad). 5mC and 5hmC were detected using specific antibodies (anti-5mC, 1:500, Epigentek, A-1014; anti-5hmC, 1:2,000, Epigentek, A-1018) and visualized by SuperSignal West Dura Extended Duration Substrate (Thermo Scientific). Signal detection was done with the ChemiDoc MP Imaging System (Bio-Rad). 0.02% methylene blue staining was performed to confirm equal DNA loading.
MBD-qPCR and hMeDIP-qPCR
Regional DNA methylation and hydroxymethylation analyses were performed using MethylMiner Methylated DNA Enrichment Kit (Invitrogen) and hMeDIP kit (Active Motif), respectively. 5 μg genomic DNA was first fragmented by sonication to an average size of 400 bp (Peak: 400; Intensity: 4; Duty cycle: 10%; Cycles per Burst: 200; Treatment Time: 55 s; sample volume:130 μl) (S2 Focused-ultrasonicator, Covaris). Methylated DNA or hydroxymethylated DNA was captured and eluted from 1 μg fragmented DNA according to the manufacturer’s protocols. 0.1 μg fragmented DNA was aliquoted as 10% input control. The released DNA was purified using MinElute PCR Purification Kit (Qiagen). 5mC and 5hmC levels were analyzed using specific primer sets with qPCR (Supplementary Table 9).
MBD-seq library preparation, sequencing and data analysis
Two biological replicates of DNA samples from control, YAPTg, YAPTg Tet1−/− and DAC-treated YAPTg Tet1−/− livers were used. 1-month-old male mice were kept on 50 mg/l Dox for 10 days. Using MethylMiner Methylated DNA Enrichment Kit (Invitrogen) (same preparation procedure as MBD-qPCR), input control and methylated DNA fraction were collected. 5 ng of input DNA and methylated DNA were then prepared using KAPA HTP Library Preparation Kit according to the manufacturer’s protocols. PCR amplified libraries were purified with Ampure XP beads, then checked on the Agilent 2100 Bioanalyzer for quality control. Samples were run on Illumina HiSeq 2500 at the University of Texas Southwestern Next Generation Sequencing Core. For MBD-seq data analysis, reads were aligned to the mm10 mouse genome using the ENCODE ChIP-seq pipeline. DMRs were obtained from biological duplicates with DiffBind R package (v3.0.15) according to user’s manual. DMRs were then mapped to mouse GRCm38 using GREAT website (http://great.stanford.edu)84 with distal region setting for the associated gene set as up to 50 kb. Genomic track data of MBD-seq results were obtained by uploading Bigwig files into mm10 assembly of UCSC genome browser. For YAP-induced rDMR, DMRs with more than 3-fold decrease in YAPTg compared to control livers were selected, and GO analysis was performed using GREAT website. Genomic distribution of mouse mm10 genome, mC peaks or rDMRs was analyzed with ChIPseeker R package (v1.26.2)85 according to user’s manual and visualized with pie and bar charts. Absolute distance of peaks relative to TSS, average profile of peaks to TSS region and peak overlap enrichment analysis against histone mark peaks from E15.5 mouse livers (mouse ENCODE project)48 were also analyzed with ChIPseeker R package. For motif analysis of YAP-induced rDMRs, de novo motif analysis was carried out using the peak-motifs analysis function in the RSAT website (http://rsat.sb-roscoff.fr)86 and distribution of TEAD motif to YAP-induced rDMRs was performed using TFmotifView website (http://bardet.u-strasbg.fr/tfmotifview/)87. For heatmap analysis, rDMRs were visualized with heatmap using pheatmap R package. Ward D clustering was used as hierarchical clustering method for columns.
Cloning-based locus-specific bisulfite sequencing
For 5mC and 5hmC detection using traditional bisulfite sequencing, genomic DNA was treated with bisulfite using EpiTect Bisulfite kit (Qiagen). Bisulfite-treated DNA was then used as a template and PCR was performed using specific primer pairs (Supplementary Table 9). Final PCR products were gel purified and cloned into the pGEM-T easy vector (Promega). Independent clones were subjected to sequencing. For 5hmC detection using TAB-Seq, genomic DNA was applied to 5hmC TAB-Seq Kit (WiseGene) according to the manufacturer’s protocols prior to bisulfite conversion.
Formaldehyde-assisted isolation of regulatory element (FAIRE)
FAIRE was performed based on previous published protocols with minor modifications57. Fragmented chromatin was obtained from ChIP procedure. For input control, 50 μg fragmented chromatin was subjected to decrosslinking, phenol-chloroform extraction twice and chloroform extraction once. For FAIRE sample, 50 μg fragmented chromatin was subjected to phenol-chloroform extraction twice, chloroform extraction once, and then decrosslinking. The released DNA of input control and FAIRE sample were purified using MinElute PCR Purification Kit (Qiagen). FAIRE enrichment was analyzed using specific primer sets with qPCR (Supplementary Table 9).
Co-immunoprecipitation (Co-IP)
Co-IP was performed with Pierce Direct Magnetic IP/Co-IP Kit (Thermo Scientific) according to the manufacturer’s protocols. Briefly, HEK293T cells were transfected with indicated plasmids. At 48 hours post-transfection, cells were lysed with or without 250 U/ml benzonase (Millipore Sigma). Cell lysates were subjected to immunoprecipitated by anti-FLAG (Millipore Sigma, F1804), anti-MYC antibodies (Millipore Sigma, M4439) or anti-HA antibodies (Millipore Sigma, H3663). Normal IgG (Millipore Sigma, CS200581) immunoprecipitates serves as negative control to assess non-specific binding. The immunoprecipitates were analyzed by immunoblotting with anti-FLAG (1:1,000, Millipore Sigma, F1804), anti-MYC antibodies (1:5,000, Millipore Sigma, M4439) or anti-HA antibodies (1:1,000, Millipore Sigma, H3663). For endogenous TET1, 100 mg YAPTg mouse livers were lysed with ice-cold IP Lysis/Wash Buffer containing protease inhibitors (Thermo Scientific). Cell lysate was subjected to immunoprecipitated by anti-TET1 (GeneTex, GTX124207), anti-TEAD1 (BD Transduction Laboratories, 610923) or anti-TEAD4 (abcam, ab58310). Normal IgG (Millipore Sigma, CS200581) immunoprecipitates serves as negative control to assess non-specific binding. The immunoprecipitates were analyzed by immunoblotting with anti-TET1 (1:1,000, GeneTex, GTX124207), anti-TEAD1 (1:500, BD Transduction Laboratories, 610923) or anti-TEAD4 (1:1,000, abcam, ab58310).
Chromatin immunoprecipitation (ChIP)
ChIP was performed with Magna ChIP HiSens chromatin immunoprecipitation kit (Millipore Sigma) according to the manufacturer’s protocols. Briefly, 100 mg mouse livers were pulverized with liquid nitrogen, and crosslinked in 1% methanol-free formaldehyde at room temperature for 10 minutes. Fixed cells were collected and lysed in Nuclei Isolation Buffer for 15 minutes. Then, cells were homogenized 10 times in a Dounce homogenizer (loose pestle). Extracted nuclei were fragmented by sonication to an average size of 200–700 bp (Intensity: 3; Duty factor: 2%; Cycles per Burst: 200; Treatment Time: 12 min; sample volume: 130 μl) (S2 Focused-ultrasonicator, Covaris). 10 μg fragmented chromatin was subjected to overnight incubation at 4 °C with specific antibody pre-conjugated beads. 1 μg fragmented chromatin was aliquoted as 10% input control. Primary antibodies used for ChIP were anti-TET1 (4 μg, GeneTex, GTX124207), anti-TEAD4 (4 μg, abcam, ab58310), anti-RNA polymerase II (2 μg, Millipore Sigma, 05–623), anti-trimethyl-Histone H3 (Lys4) (2 μl, Millipore Sigma, CS200580), anti-acetyl-Histone H3 (Lys 27) (2 μl, Millipore Sigma, 07–360) or anti-normal rabbit IgG (2 μl, Millipore Sigma, CS200581). The specificity of anti-TET1 and anti-TEAD4 antibodies was further verified by Western blot analysis of HEK293T cells treated with siRNA targeting TET1 or TEAD4 (Extended Data Fig. 7a). After serial washing, the beads were incubated with ChIP elution buffer, Proteinase K at 65 °C for 2 hours and at 95 °C for 15 minutes. The released DNA was purified using MinElute PCR Purification Kit (Qiagen). ChIP signal was analyzed using specific primer sets with qPCR (Supplementary Table 9).
TET1 and TEAD4 ChIP-seq library preparation, sequencing and data analysis
Two biological replicates of DNA samples from control, YAPTg, and YAPTg Tet1−/− livers were used. 1-month-old male mice were kept on 50 mg/l Dox for 10 days. Using Magna ChIP HiSens chromatin immunoprecipitation kit (Millipore Sigma) (same preparation procedure as ChIP), 100 μg fragmented chromatin was subjected to overnight incubation at 4 °C with specific antibody pre-conjugated beads. 10 μg fragmented chromatin was aliquoted as 10% input control. Primary antibodies used for ChIP were anti-TET1 (10 μg, GeneTex, GTX124207), anti-TEAD4 (10 μg, abcam, ab58310) or anti-normal rabbit IgG (5 μl, Millipore Sigma, CS200581). Input control, IgG control, anti-TET1 ChIP and anti-TEAD4 ChIP fraction were collected. For ChIP normalization, 10 ng spike-in Drosophila chromatin (Active Motif, 53083) and 1 μg spike-in antibody (Active Motif, 61686) were added in each reaction before overnight incubation. ChIP-seq library preparation, sequencing and read alignments to the mm10 mouse genome and dm3 Drosophila genome were performed as described in MBD-seq section. Aligned results were normalized with ChipSeqSpike R package (v1.9.0) and visualized by uploading normalized Bigwig files into mm10 assembly of USCS genome browser. TET1 and TEAD4 peaks were called against mm10 background using MACS2 default parameters. Correlation between TEAD4 and TET1 ChIP-seq signal was visualized by plotting the average of normalized read count data at each overlapped peak with ggplot2 R package. Peak overlapping was determined by using the default bedtools intersect intervals functions (at least 1 bp overlap). TEAD4 ChIP-seq signals summit to TET1 peaks, TET1 ChIP-seq signals summit to TEAD4 peaks and TET1/TEAD4/H3K27ac ChIP-seq signals summit to TET1/TEAD4 overlapped peaks were performed with Deeptools v3.5.0 and visualized with plotHeatmap function in Deeptools. Distribution of TEAD motif at TET1 peaks was performed with TFmotifView website.
TEAD4 ChIP-seq tracks
TEAD4 ChIP-seq tracks were obtained from ENCODE H1-hESC TEAD448 with hg19 assembly and GSE37350 in mTS88 with mm9 assembly.
Mouse histological analysis and immunostaining
Paraffin-embedded livers were sectioned at 5 μm. Sections were stained with hematoxylin-eosin for histological analysis. Immunohistochemical and immunofluorescent staining were performed according to the manufacturer’s protocols. Primary antibodies used were: anti-AFP (alpha fetal protein, 1:20, R & D Systems, MAB1368), anti-CK19 (cytokeratin 19, 1:500, AbboMax, 602–670), anti-PH3 (phosphorylated histone H3, 1:500, Millipore Sigma, MABE939), anti-ALB (albumin, 1:1,000, Millipore Sigma, SAB3500217), anti-HNF4A (hepatocyte nuclear factor 4 alpha, 1:500, Thermo Fisher, MA1–199), anti-pan-CK (wide spectrum screening cytokeratin including CK7, 1:500, DAKO, Z0622), anti-Ki-67 (1:500, DAKO, GA62661-2), or anti-Cl-Casp3 (cleaved caspase-3, 1:500, Cell Signaling, 9661). For immunofluorescent staining, Alexa488-conjugated goat anti-mouse secondary antibodies (Thermo Fisher, A-11001), Alexa488-conjugated goat anti-chicken secondary antibodies (Thermo Fisher, A-11039), Alexa546-conjugated goat anti-rabbit secondary antibodies (Thermo Fisher, A-11010), Alexa546-conjugated goat anti-rat secondary antibodies (Thermo Fisher, A-11081) or Alexa647-conjugated goat anti-rat secondary antibodies (Thermo Fisher, A-21247) were used for immunofluorescent staining. Slides were treated with Vector TrueVIEW Autofluoresence Quenching Kit (Vector Laboratories, SP-8500) according to the manufacturer’s protocols. For immunohistochemical staining, the signals were developed using the ABC-HRP kit (Vector Laboratories, PK-6101) and SIGMAFAST DAB reagent (Sigma) according to manufacturer’s protocols. Slides were imaged using Leica SP8 microscope with LAS X software (v3.5.7.23225) and processed using ImageJ.
Definition of 1,003 genes regulated by TET1-dependent DNA demethylation and RNA induction (TET1-dependent YAP target genes)
Centered bubble chart was created for both MBD-seq and RNA-seq results followed by Venn diagram for the overlapping. For DNA methylation, 680,429 peaks were collected from control, YAPTg or YAPTg Tet1−/− livers and mapped to mm10 mouse genome within 21,018 genes (all genes), while peaks with 3-fold decrease and P value < 0.05 in YAPTg livers compared to control livers were selected as YAP down group (14,282 rDMRs within 12,289 genes). These rDMRs are defined as YAP-induced rDMRs. Peaks in YAP down group were further selected for 2-fold increase and p-value < 0.1 in YAPTg Tet1−/− livers compared to YAPTg livers as YAPTg Tet1−/− up group (8,131 rDMRs within 7,408 genes). These rDMRs are defined as TET1-dependent rDMRs. For RNA, genes with 2-fold increase and p-value < 0.05 in YAPTg livers compared to control livers were selected as YAP up group (2,963 genes). Genes in YAP up group were further selected for 30% decrease and p-value < 0.1 in YAPTg Tet1−/− livers compared to YAPTg livers as YAPTg Tet1−/− down group (2,579 genes).
Quantification and statistical analysis
All statistical analyses were performed using GraphPad Prism 7 (GraphPad). All data were presented as mean ± s.e.m. Unpaired two-tailed Student’s t-tests or one-way ANOVA with Tukey’s multiple comparisons test was used to calculate P value and determine significance. P values below 0.05 were considered statistically significant.
Data availability
RNA-seq, MBD-seq and ChIP-seq data that support the findings of this study have been deposited in the Gene Expression Omnibus (GEO) under accession numbers GSE178227.
All other data and reagents supporting the findings of this study are available from the corresponding author on reasonable request. Source data are provided with this paper.
Extended Data
Extended Data Fig. 1. YAP activation induces TET1 expression.
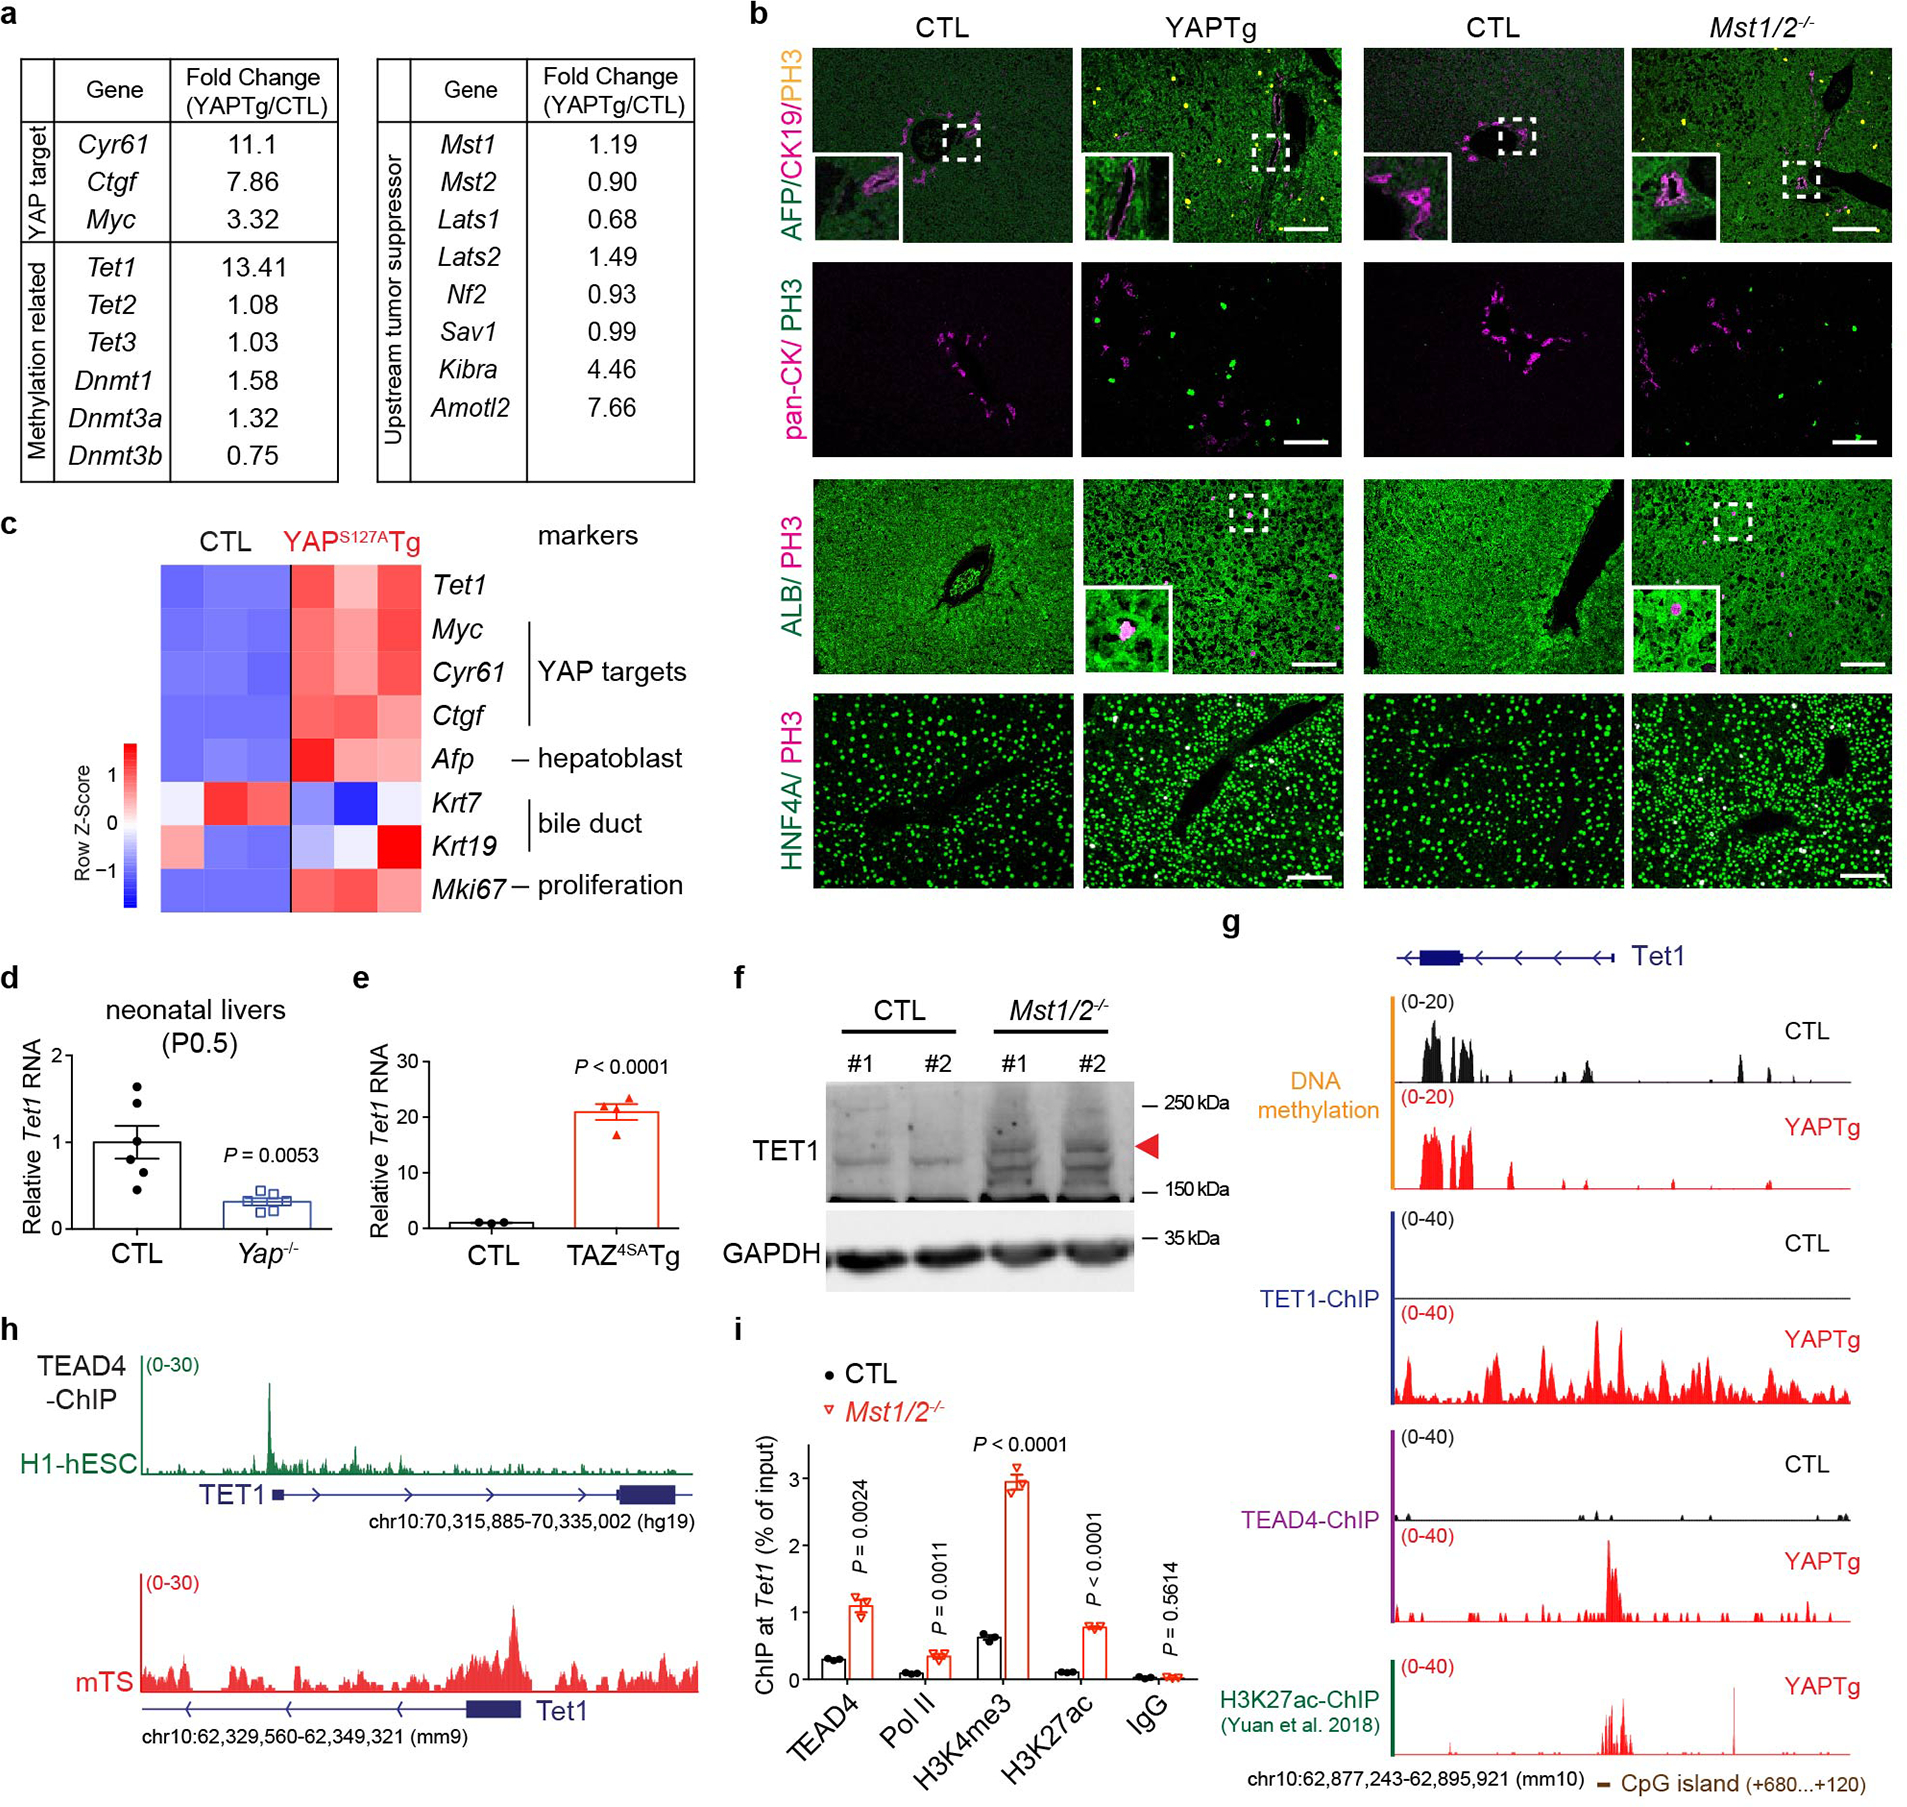
a, RNA-seq analysis showing the expression of canonical YAP target genes, YAP upstream tumor suppressor genes and DNA methylation-related genes in induced YAPTg compared to control livers. Mice were treated with 50 mg/l Dox for 10 days starting at 1 month of age. b, Representative immunostaining of livers from induced YAPTg and Mst1/2 mutant mice at 1 month of age (n = 4), showing the induction of the hepatoblast marker AFP, but not the bile duct marker CK19, in YAP-activated hepatocytes. Also note the normal expression of the hepatocyte markers ALB and HNF4A in the proliferating hepatocytes (PH3). White scale bar, 100 μm. c, Heatmap of representative gene expression, derived from the published microarray data from YAPS127A transgenic livers after 7 days Dox induction. Note the induction of Tet1 and hepatoblast marker (Afp), but not bile duct markers (Krt7 and Krt19), in YAPS127A transgenic livers. d-e, RT-qPCR of Tet1 mRNA level in Yap mutant livers at neonatal P0.5 (n = 6) (d) and active mutant TAZ4SA transgenic (TAZ4SATg) livers (CTL n = 3; TAZ4SATg n = 4) which were treated with 50 mg/l Dox for 3 days starting at 1 month of age (e). Tet1 mRNA level was normalized to control livers. f, Western blot of TET1 protein in Mst1/2 mutant livers. Arrowhead marks the specific TET1 protein band. Images are representative of three independent experiments. g, Genomic tracks displaying MBD-seq, TET1 ChIP-seq, TEAD4 ChIP-seq and H3K27ac ChIP-seq reads at TET1 promoter. h, Genomic tracks displaying TEAD4 ChIP-seq reads at TET1 promoter in human embryonic stem cells (H1-hESC, green) and in mouse trophoblast stem cells (mTS, red). i, ChIP-qPCR at Tet1 promoter in Mst1/2 mutant livers (n = 3). Values represent mean ± s.e.m. (d, e, i). P values are calculated with unpaired two-tailed Student’s t-test (d, e, i).
Extended Data Fig. 2. YAP and TET1 are dispensable for TCP-induced hepatomegaly.
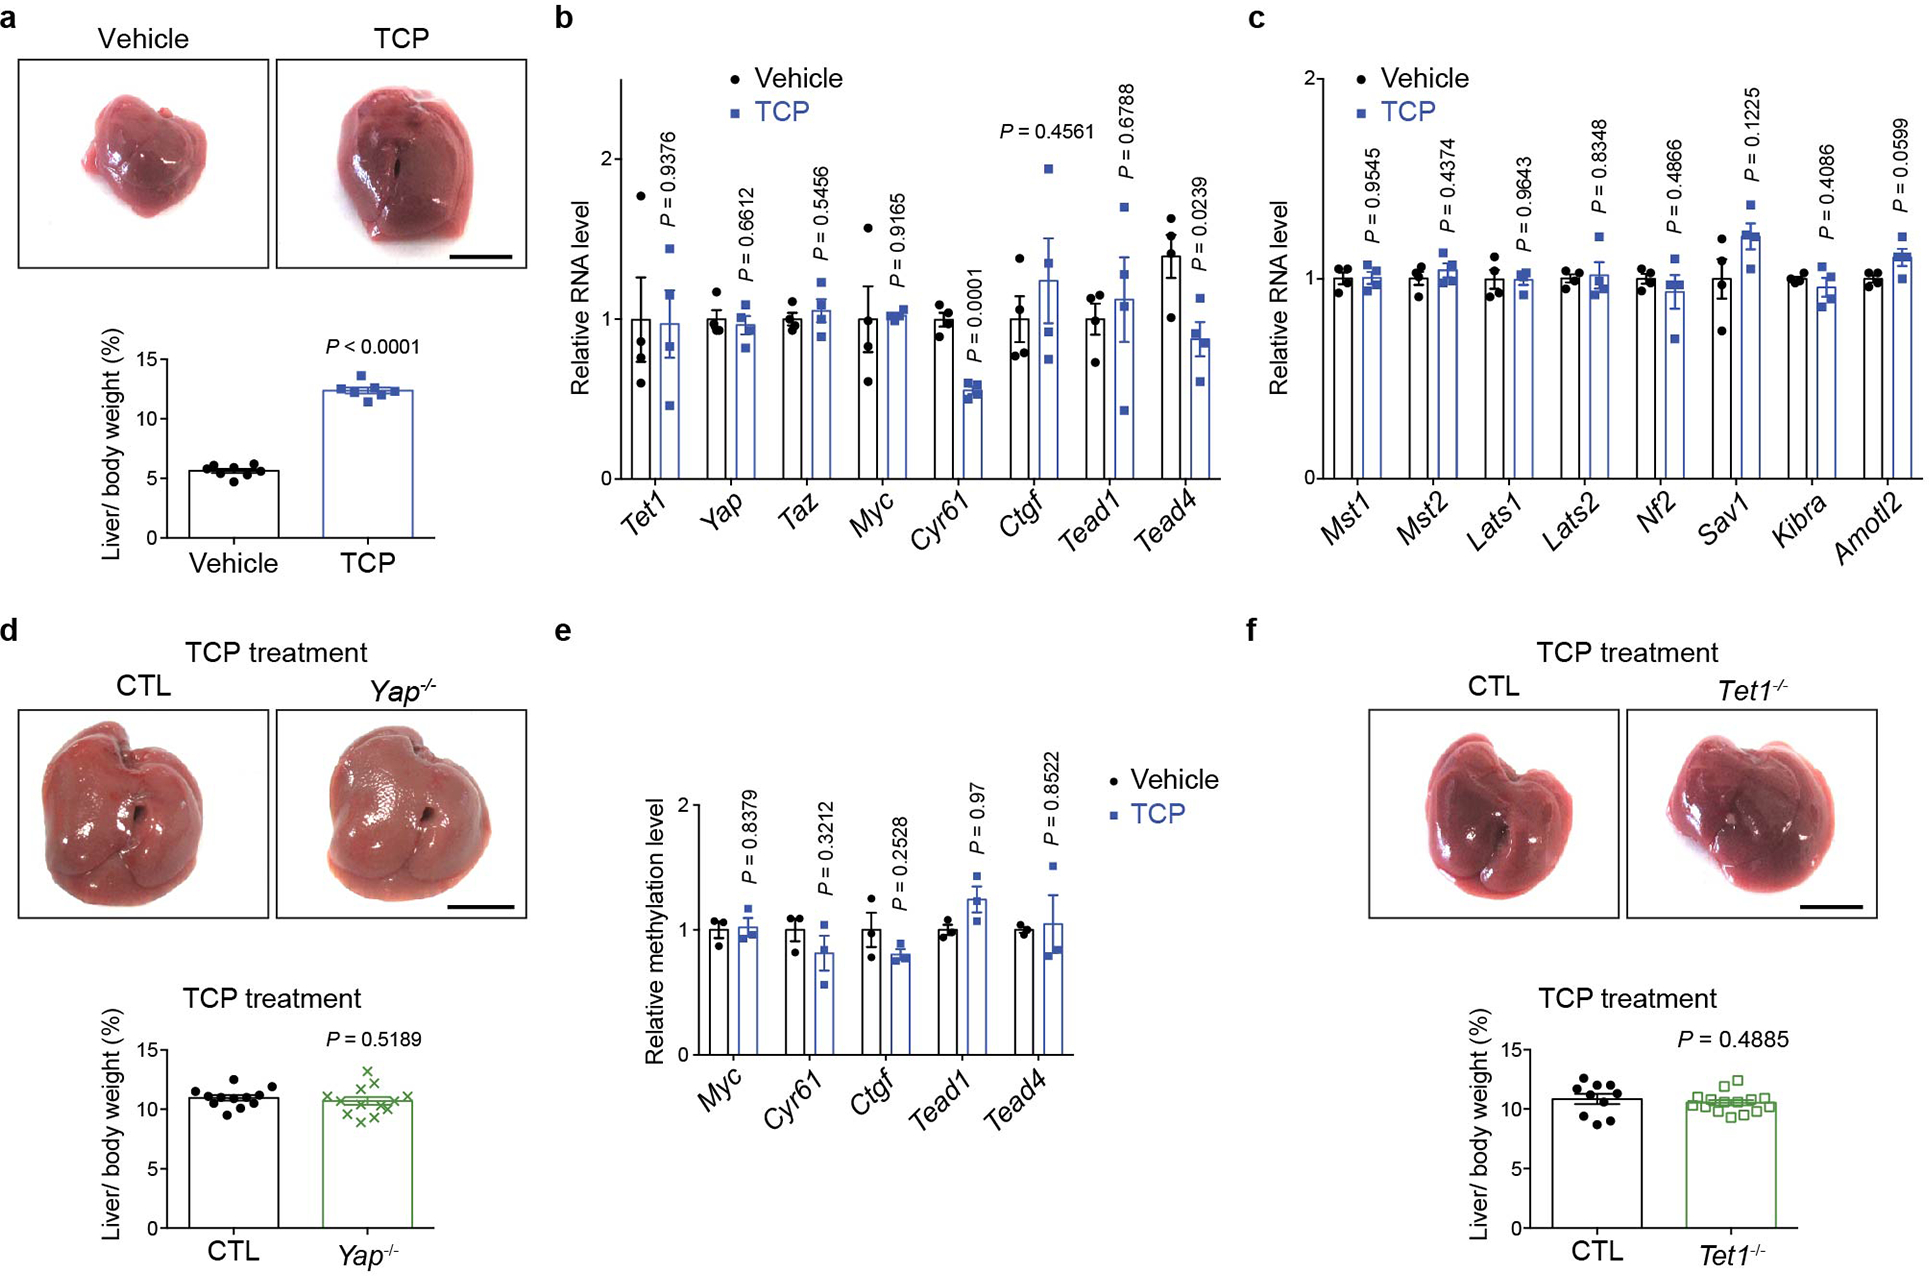
a, Representative gross image of livers (top panel) and quantification of liver-to-body weight ratio (bottom panel) from vehicle-treated (n = 8) and TCP-treated (n = 7) mice. 1-month-old mice were injected intraperitoneally with a single dose of 3 mg/kg TCP. Mice were sacrificed 7 days post injection. b, c, RT-qPCR showing mRNA levels of the YAP downstream target genes (b) or upstream suppressor genes (c) in TCP-treated livers. mRNA levels were normalized to vehicle-treated control livers (n = 4). d, Representative gross image of livers (top panel) and quantification of liver-to-body weight ratio (bottom panel) from 1-month-old Yap mutant mice (CTL n = 12; Yap−/− n = 13) subjected to TCP-induced hepatomegaly. e, MBD-qPCR of methylation levels at the indicated rDMRs in TCP-treated mouse livers. Methylation levels were normalized to vehicle-treated control livers (n = 3). f, Representative gross image of livers (top panel) and quantification of liver-to-body weight ratio (bottom panel) from 1-month-old Tet1 mutant mice (CTL n = 10; Tet1−/− n = 15) subjected to TCP-induced hepatomegaly. Values represent mean ± s.e.m. (a, b, c, d, e, f). P values are calculated with unpaired two-tailed Student’s t-test (a, b, c, d, e, f).
Extended Data Fig. 3. Elevated YAP/TAZ and TET1 abundance in foregut cancers shows a significant and positive correlation.
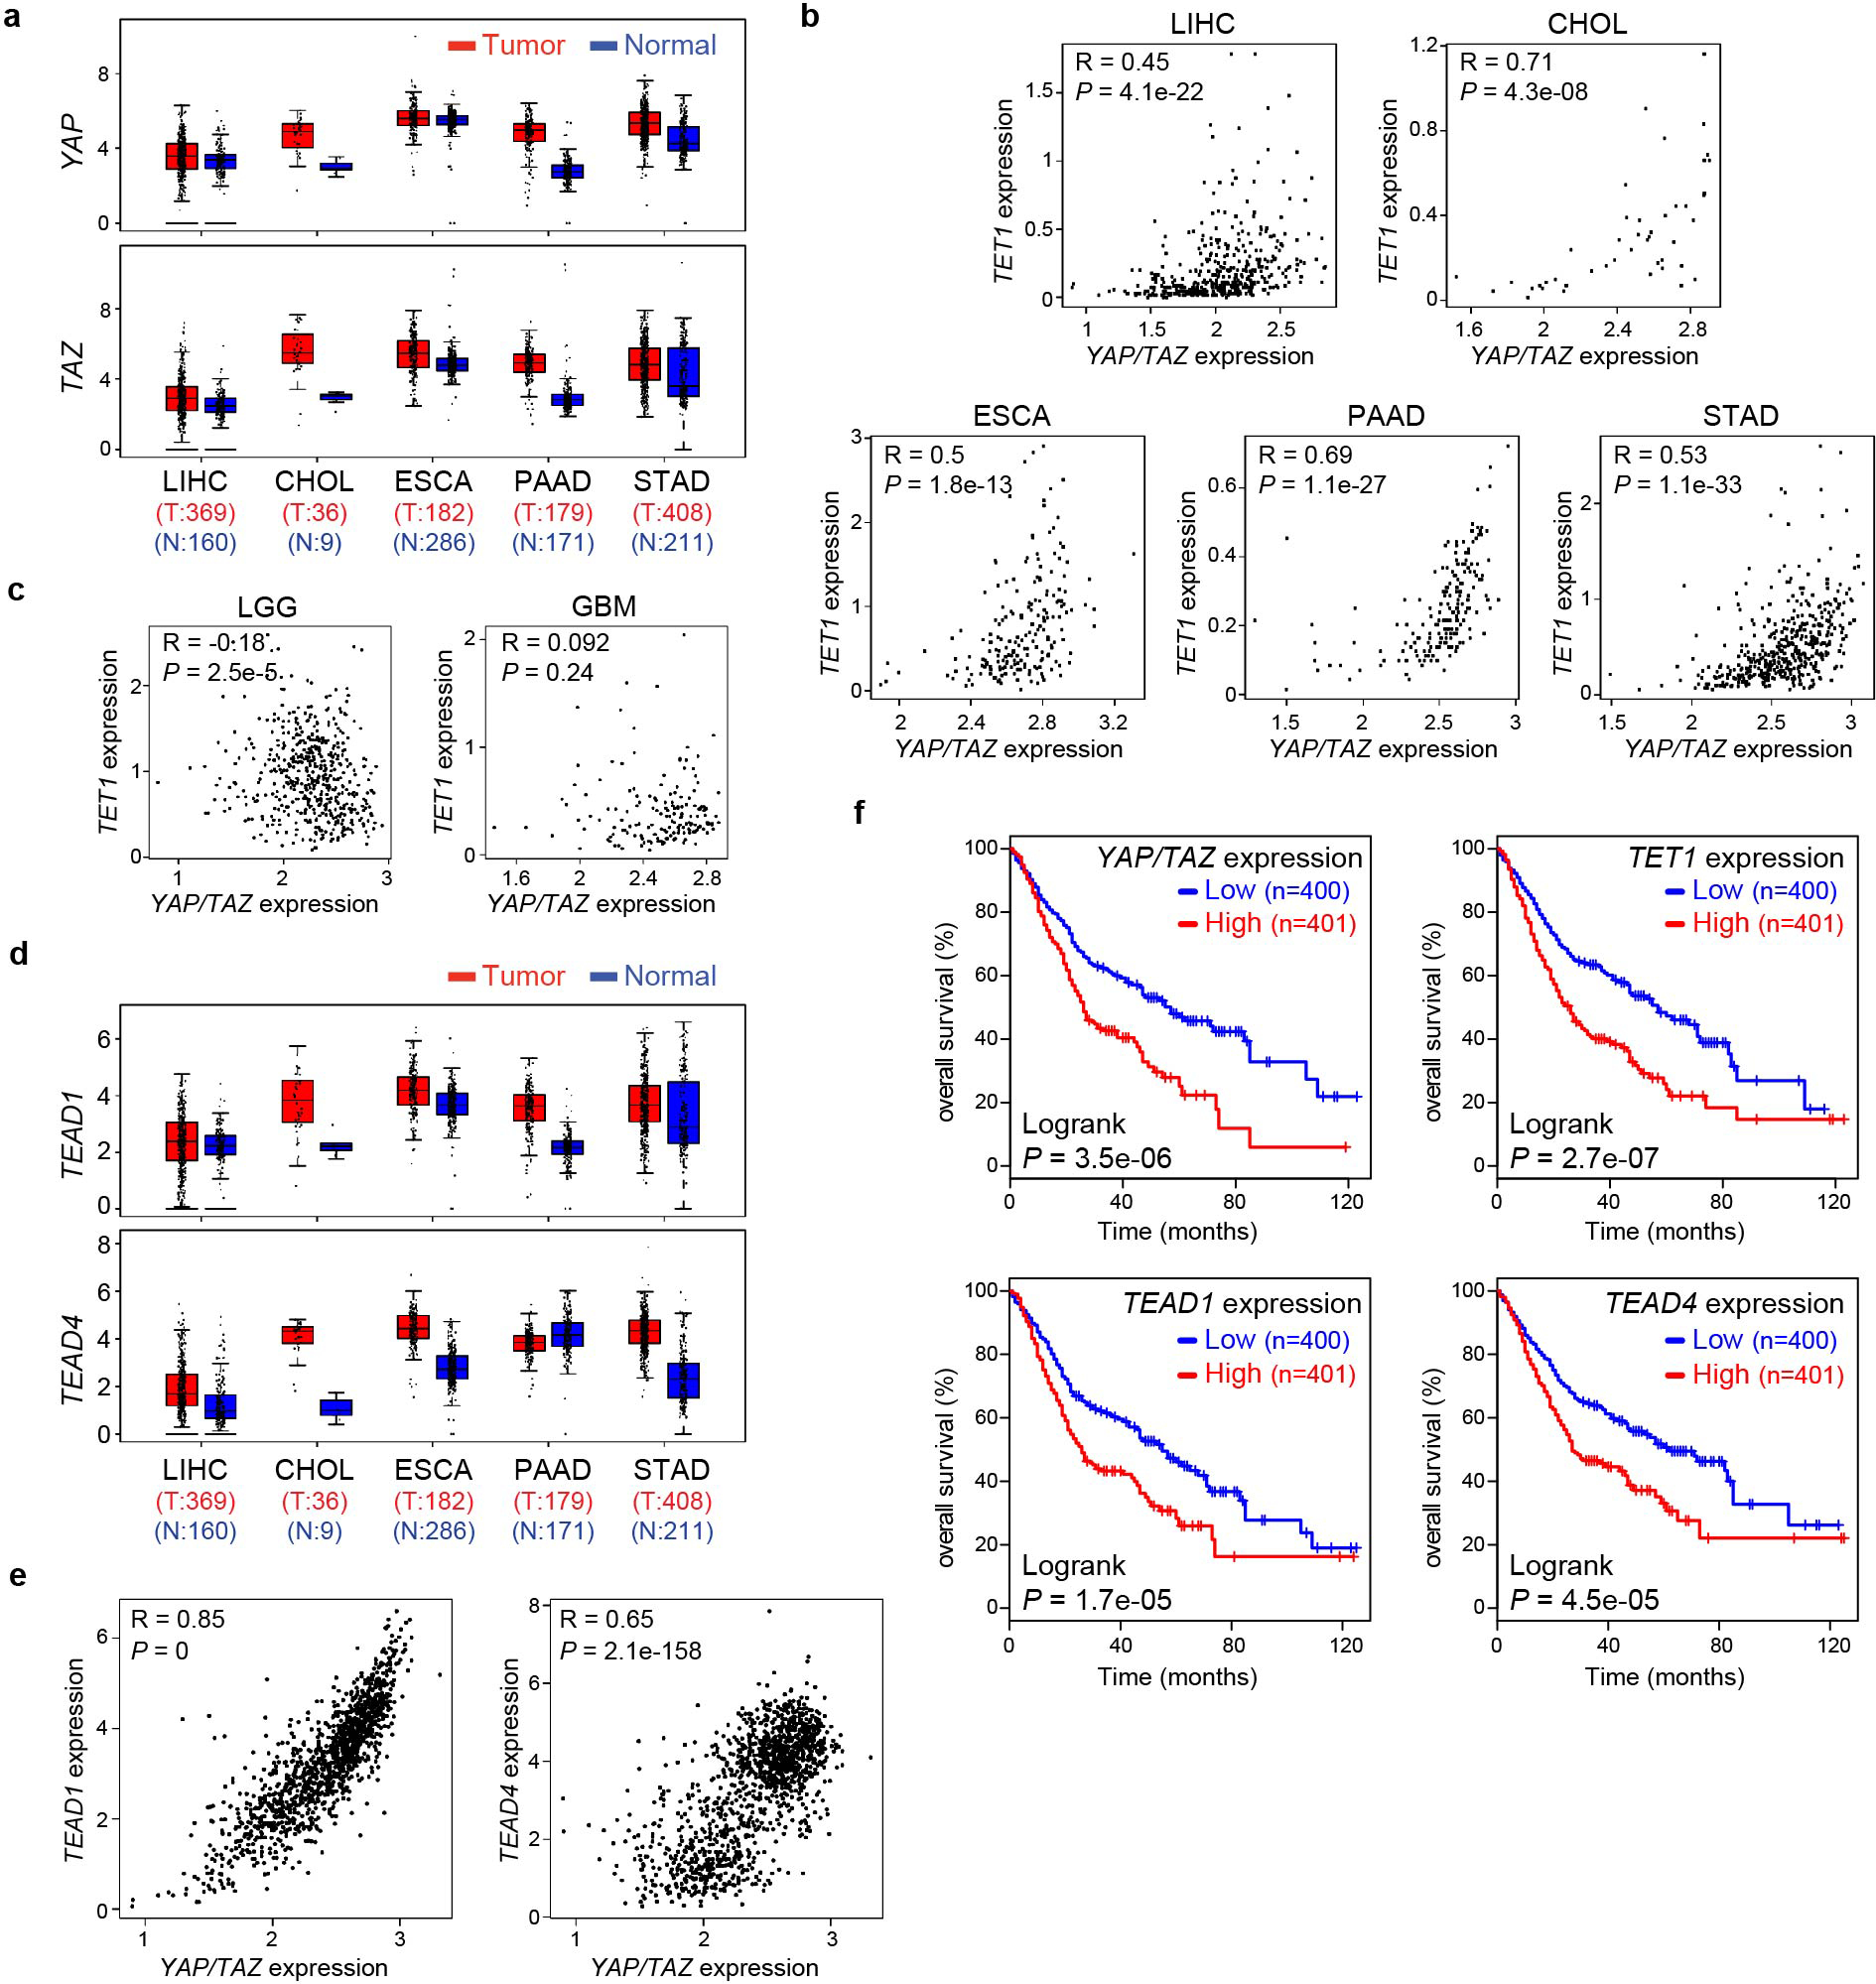
a, Elevated expression of YAP and TAZ in five human cancers (LIHC, CHOL, ESCA, PAAD and STAD) obtained from the TCGA database. The center lines show the medians, the box limits mark the 25th to the 75th percentiles and the whiskers indicate 1.5× the interquartile range. b, c, Spearman’s correlation coefficient analysis between the expression of YAP/TAZ and TET1 in LIHC, CHOL, ESCA, PAAD, STAD (b), LGG and GBM (c). d, Elevated expression of TEAD1 and TEAD4 in human foregut cancers (LIHC, CHOL, ESCA, PAAD and STAD) obtained from the TCGA database. e, Spearman’s correlation coefficient analysis between the expression of YAP/TAZ and TEAD1 (left panel) or TEAD4 (right panel) in human foregut cancers (LIHC, CHOL, ESCA, PAAD and STAD) obtained from the TCGA database. f, Kaplan-Meier analysis of overall survival in patients with human foregut cancers (LIHC, CHOL, ESCA, PAAD and STAD) according to high or low mRNA expression of YAP/TAZ, TET1, TEAD1 or TEAD4. P values are calculated with two-tailed Spearman’s correlation test (b, c, e) or two-sided log-rank test (f).
Extended Data Fig. 4. YAP activation causes regional DNA demethylation in canonical YAP target genes.
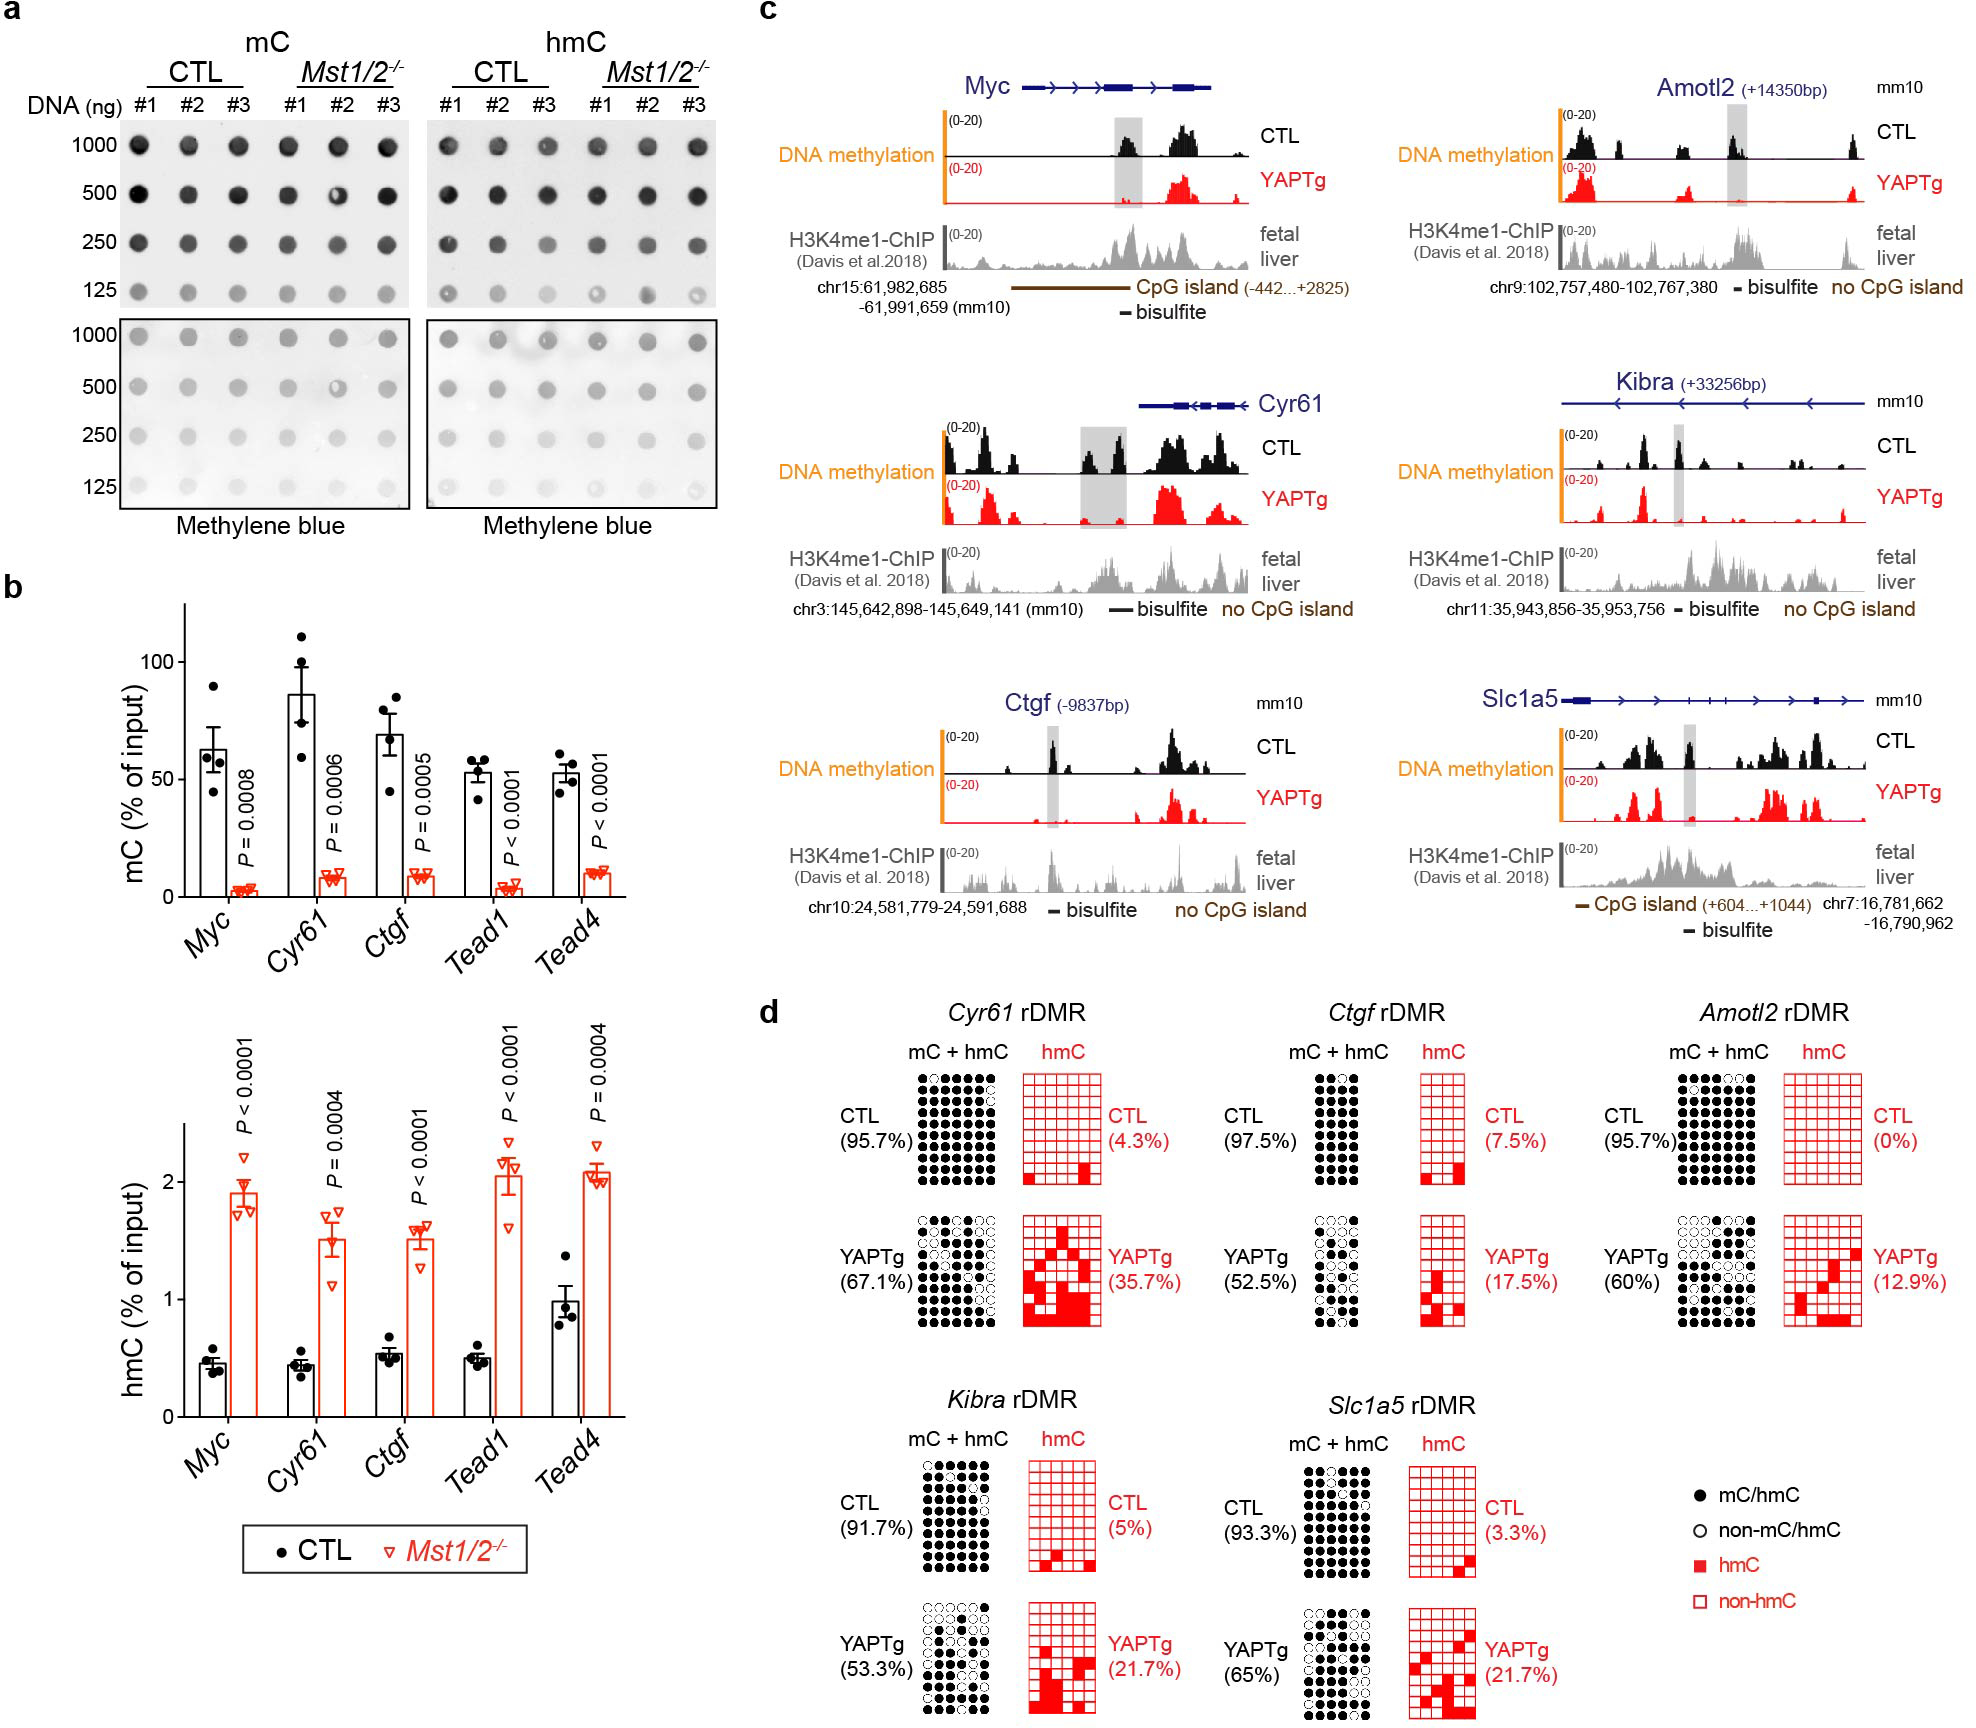
a, DNA dot blot of genomic 5mC and 5hmC levels in 1-month-old Mst1/2 mutant livers (top panels). The blot was then stained with methylene blue as loading control (bottom panels). Images are representative of two independent experiments. b, 5mC and 5hmC validation at the indicated rDMRs in Mst1/2 mutant livers. Methylation (top panel) and hydroxymethylation (bottom panel) levels were determined by MBD-qPCR and hMeDIP-qPCR, respectively (n = 4). Values represent mean ± s.e.m. P values are calculated with unpaired two-tailed Student’s t-test. c, Genomic tracks displaying MBD-seq and H3K4me1 ChIP-seq reads at the rDMR loci of the indicated YAP target genes. Grey columns represent YAP-induced rDMRs. The cloning-based locus-specific bisulfite sequencing sites are also marked. Note the robust enhancer mark H3K4me1 occupancy at the YAP-induced rDMRs. d, Cloning-based traditional bisulfite sequencing (left panels) and TAB-seq (right panels) of CpG sites at the rDMR loci of YAP target genes. All sequencing results include 10 independent clones.
Extended Data Fig. 5. YAP activation causes regional DNA demethylation in enhancers.
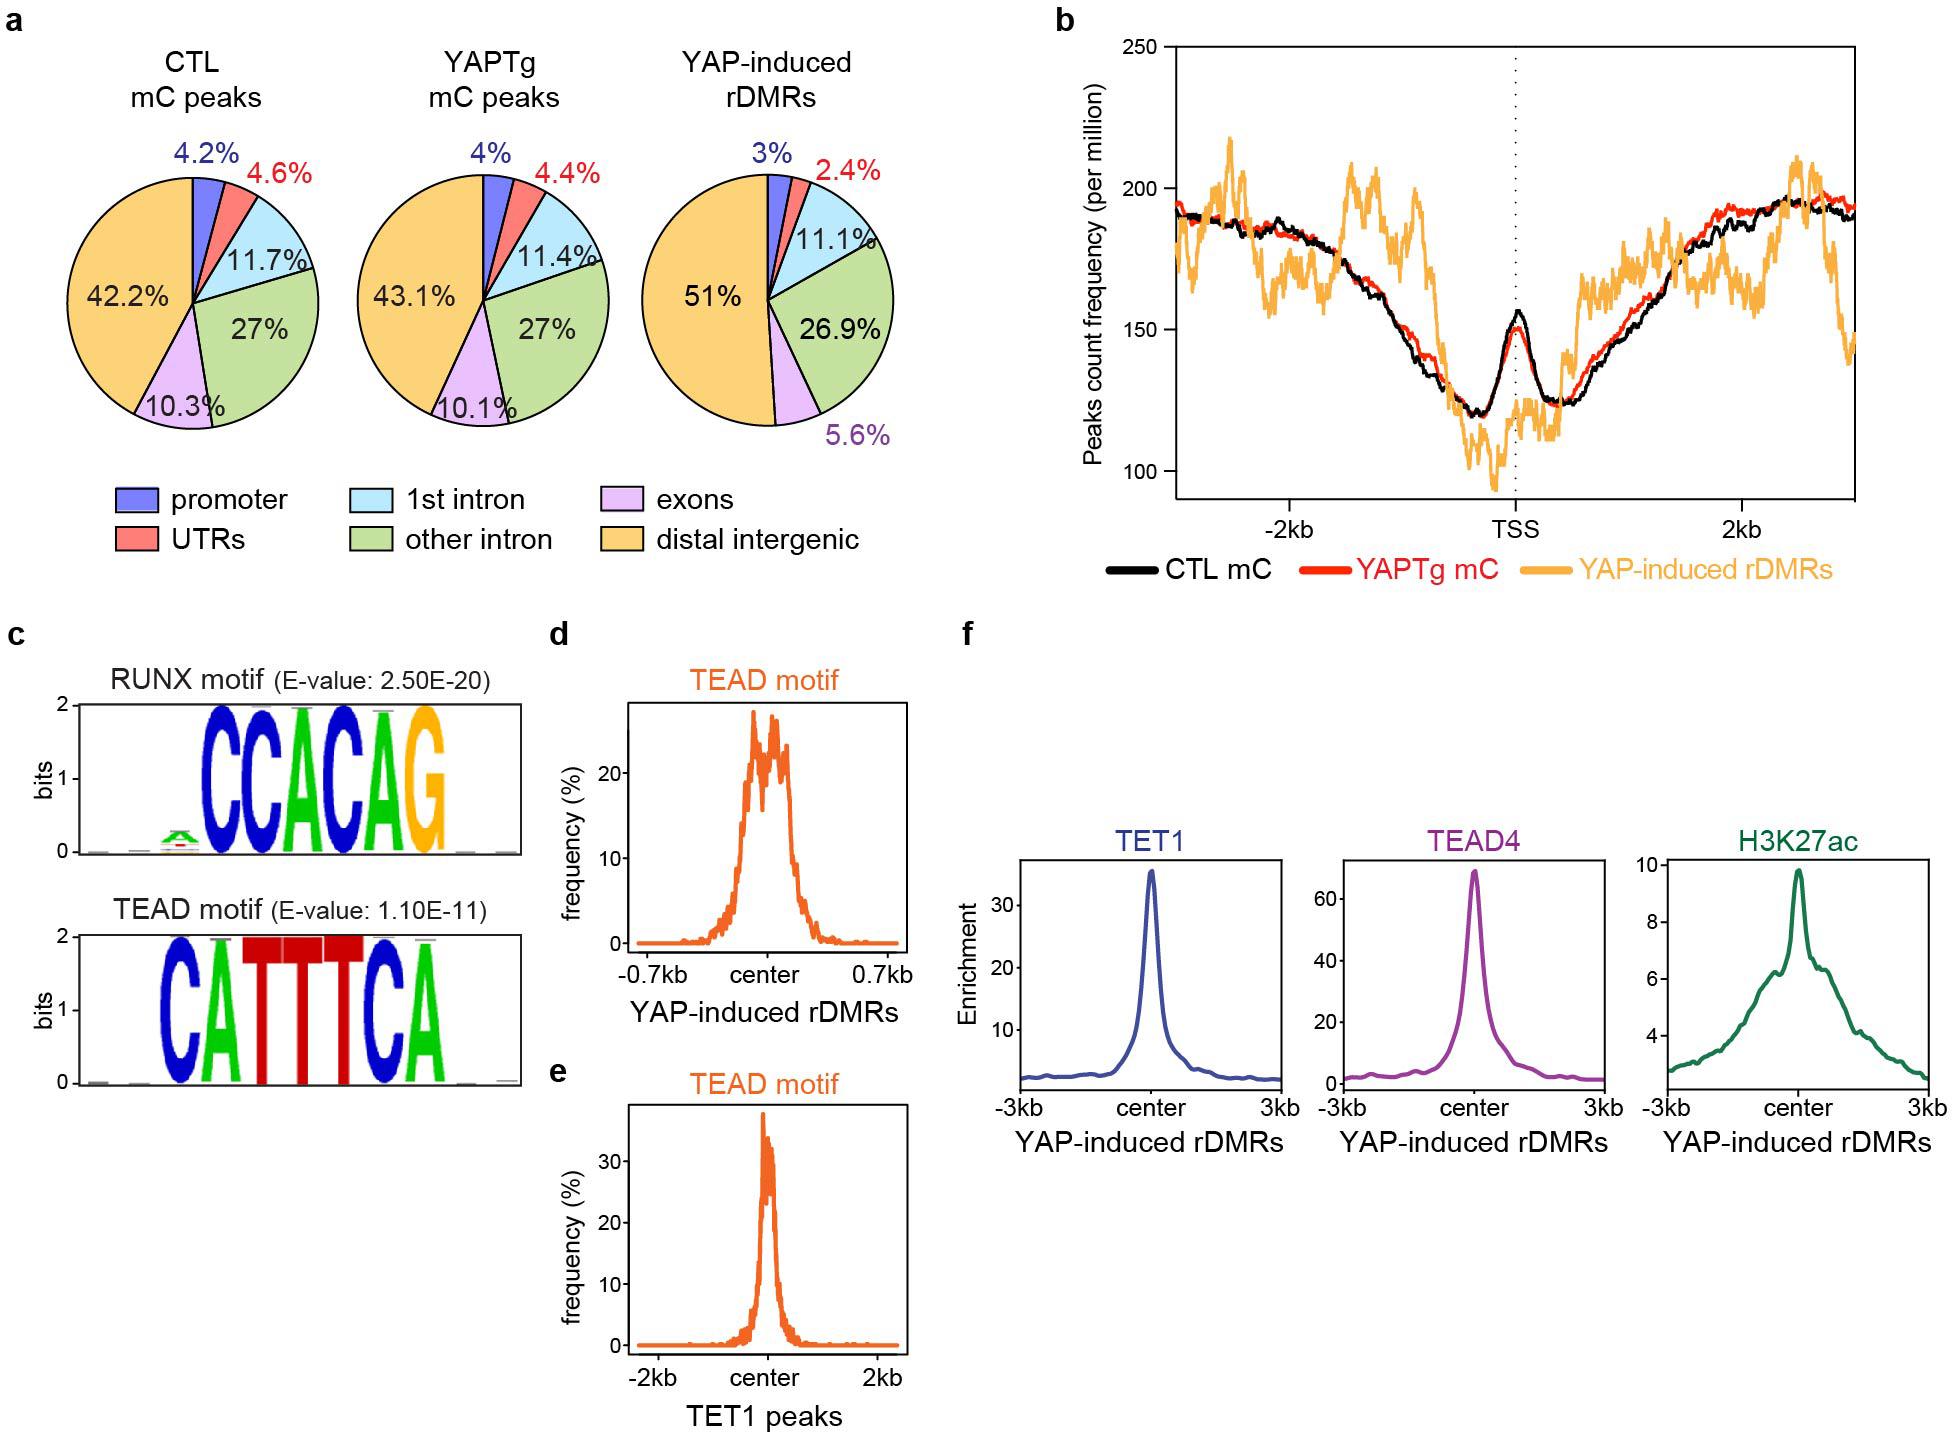
a, Pie charts showing the distribution of methylation peaks and YAP-induced rDMRs to mm10 mouse genomic features. b, Average peak profile of methylation peaks and YAP-induced rDMRs mapped to nearest TSS. Note the disassociation of YAP-induced rDMRs from TSS. c, The de novo motif analysis of YAP-induced rDMRs. Both RUNX and TEAD recognition motifs were identified in the top 10 enriched motifs. d, e, Enrichment profiles representing the TEAD motif centered at YAP-induced rDMRs (d) and TET1 peaks (e). f, Enrichment profiles representing the TET1, TEAD4 and H3K27ac ChIP-seq reads centered at YAP-induced rDMRs.
Extended Data Fig. 6. TEAD4 interacts with TET1 through its YAP binding domain (YBD).
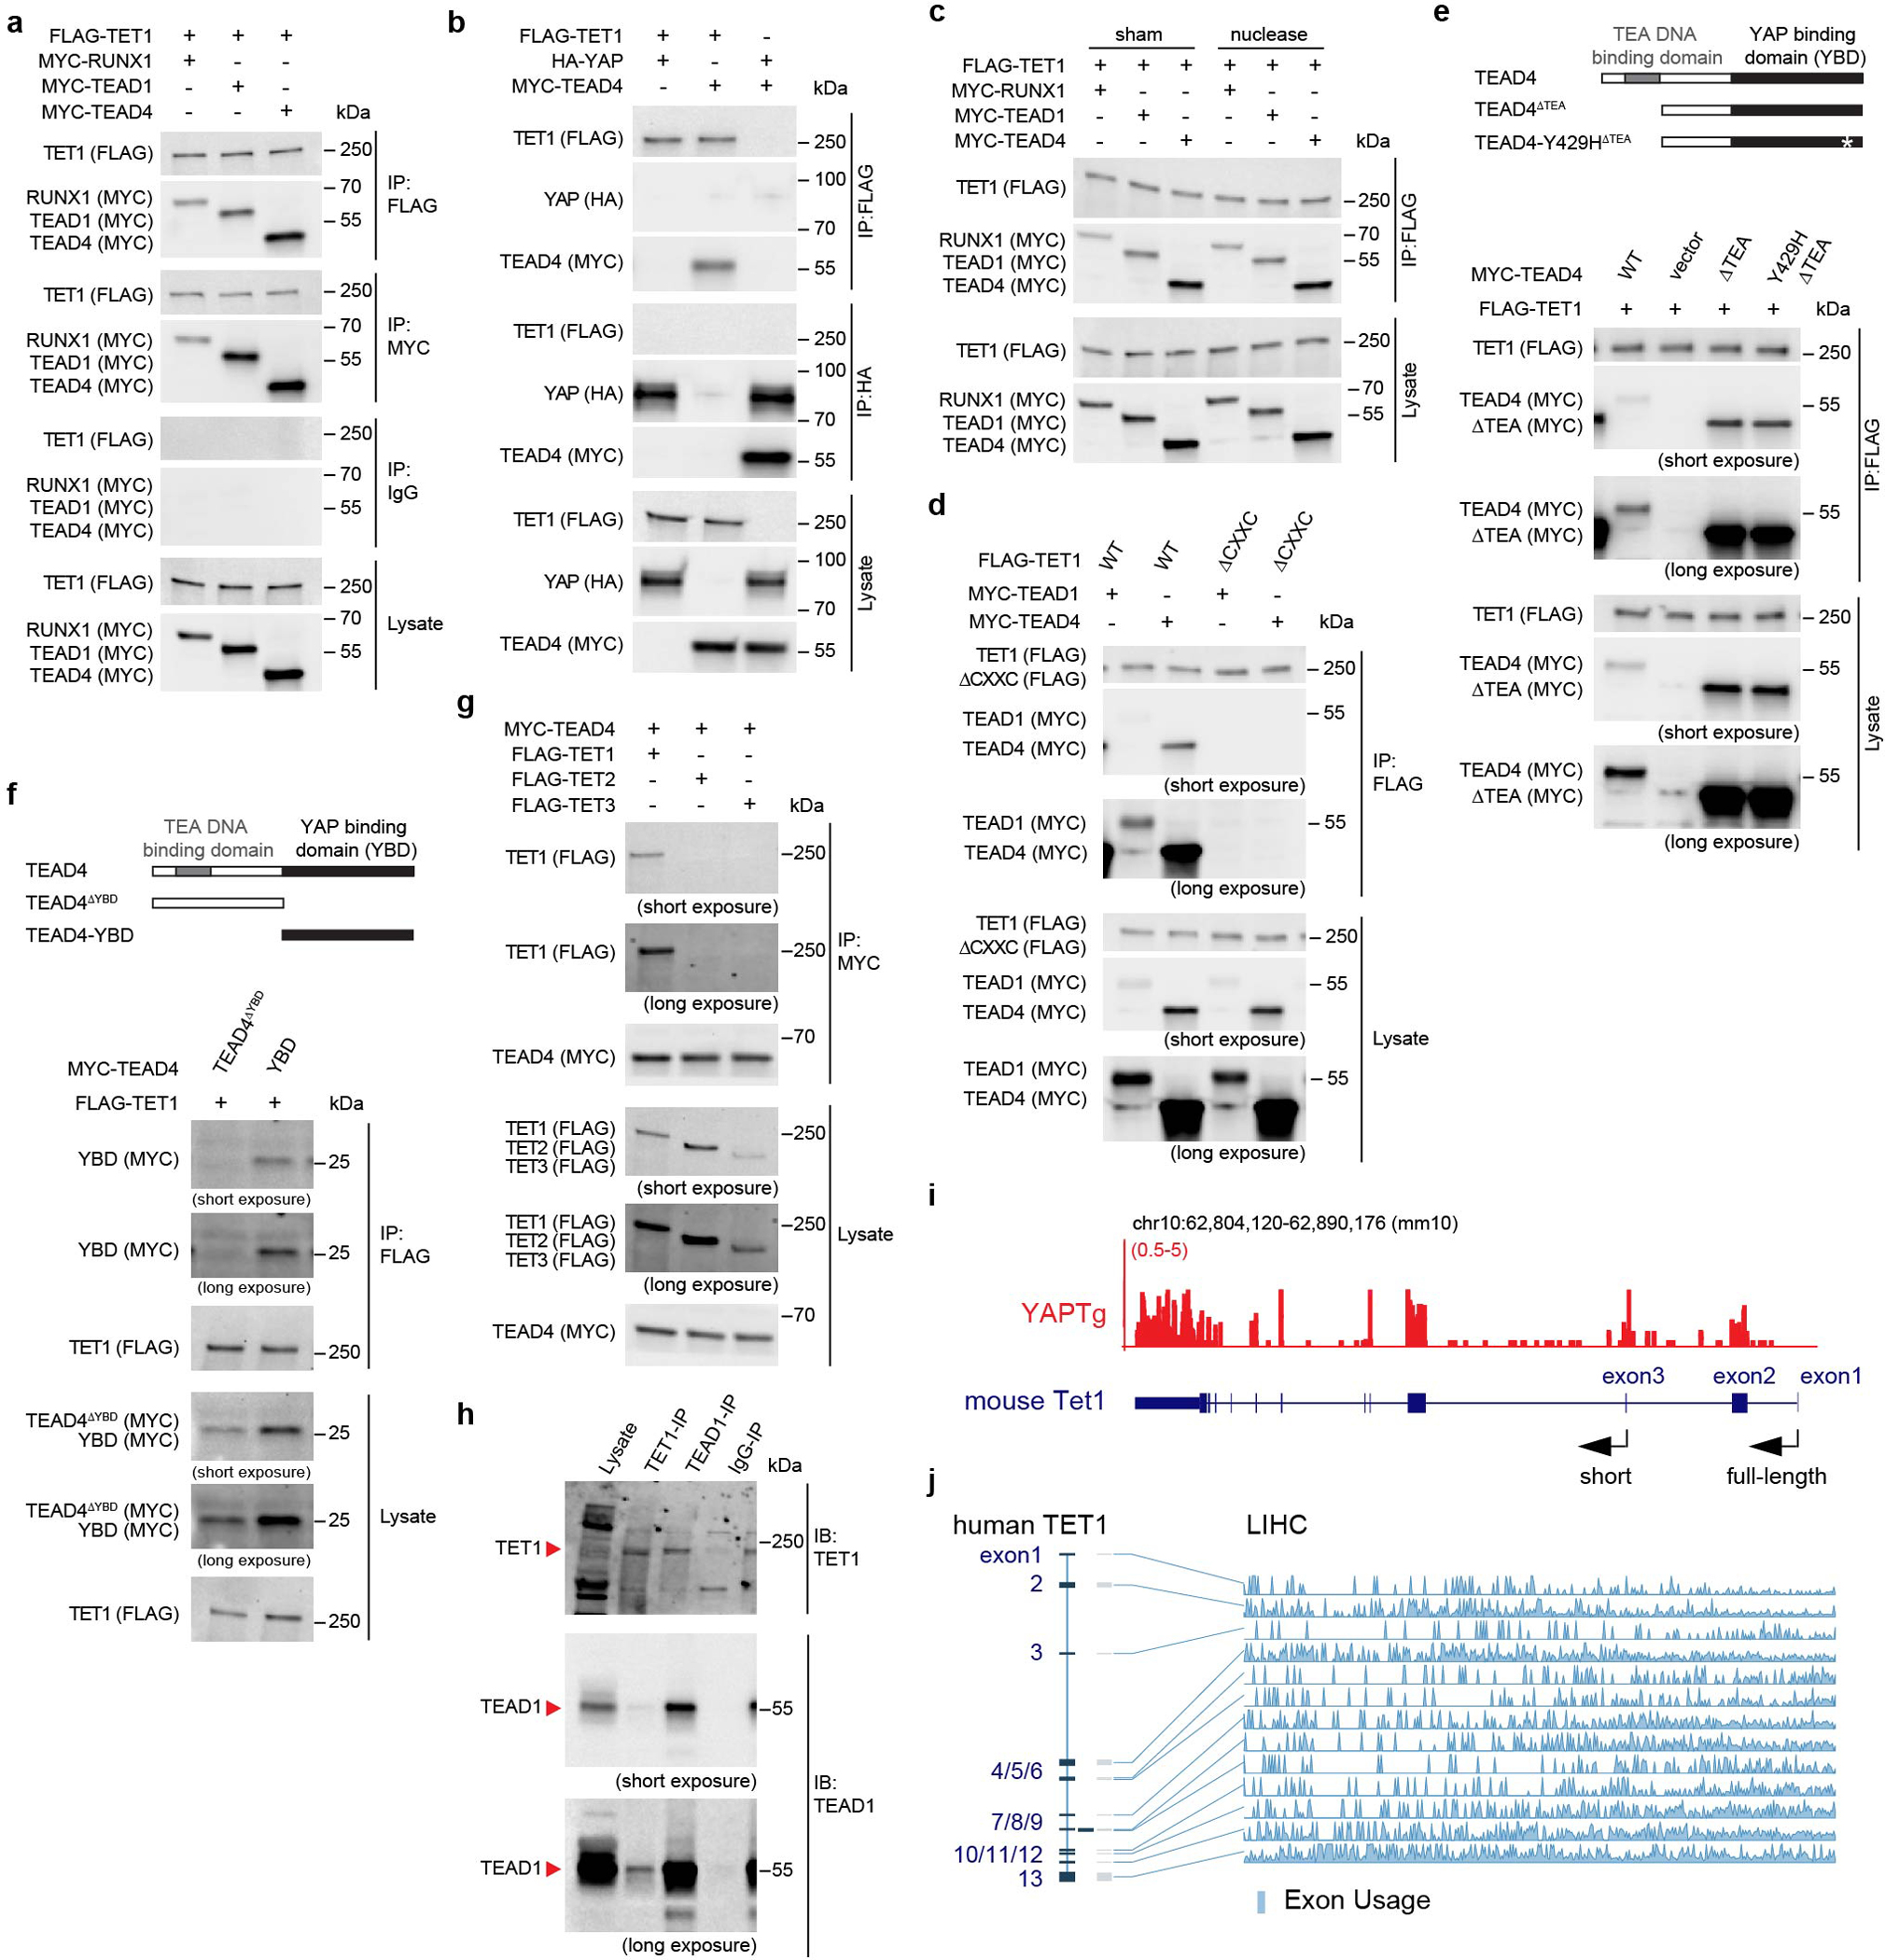
a, Co-IP assay showing physical interactions between TET1 and RUNX1 or TEAD1/TEAD4. The indicated constructs were transfected into HEK293T cells, lysed and subjected to immunoprecipitation assays. Normal IgG immunoprecipitates serve as negative control. b, Co-IP assay showing no interactions between TET1 and YAP. Co-IP assay was conducted under same condition as in (a). c, Co-IP assay showing physical interactions between TET1 and RUNX1 or TEAD1/TEAD4 in the presence or absence of DNA/RNA nuclease. The indicated constructs were transfected into HEK293T cells, lysed with or without benzonase treatment before immunoprecipitation assays. Note the co-IP between TET1 and RUNX1 or TEAD1/TEAD4, regardless of nuclease treatment. d, Co-IP assay showing physical interactions between TET1 and TEAD1/TEAD4. Note that the TET1-TEAD1/TEAD4 interaction were abolished by deletion of the CXXC domain in TET1 protein. e, Co-IP assay showing physical interactions between TEAD4 and TET1. The schematic diagram indicates the TEAD4 mutants used: TEAD4ΔΤΕΑ is defective in DNA-binding and TEAD4-Y429H is defective in YAP-binding. Both TEAD4 mutants interacted with TET1. f, Co-IP assay showing physical interactions between TEAD4 and TET1. Note that TEAD4 interacts with TET1 through its YAP binding domain (YBD). g, Co-IP assay showing physical interactions between TEAD4 and TET1/2/3. Note the co-IP between TEAD4 and TET1, not TET2 or TET3. h, Co-IP assay showing physical interactions between endogenous TET1 and TEAD1 in YAPTg livers. i, Genome track showing Tet1 RNA-seq in YAPTg livers. j, TET1 exon usage profile in LIHC samples from the TCGA database. Exon usage profile was visualized with TSVdb web tool. Patients are represents in x-axis and exon usage of each exon are showed in y-axis. Images are representative of two (a, b, c, g) or three (d, e, f, h) independent experiments.
Extended Data Fig. 7. TET1 interacts with TEAD4 transcription factor to cause regional histone acetylation and chromatin opening at the rDMRs of canonical YAP target genes.
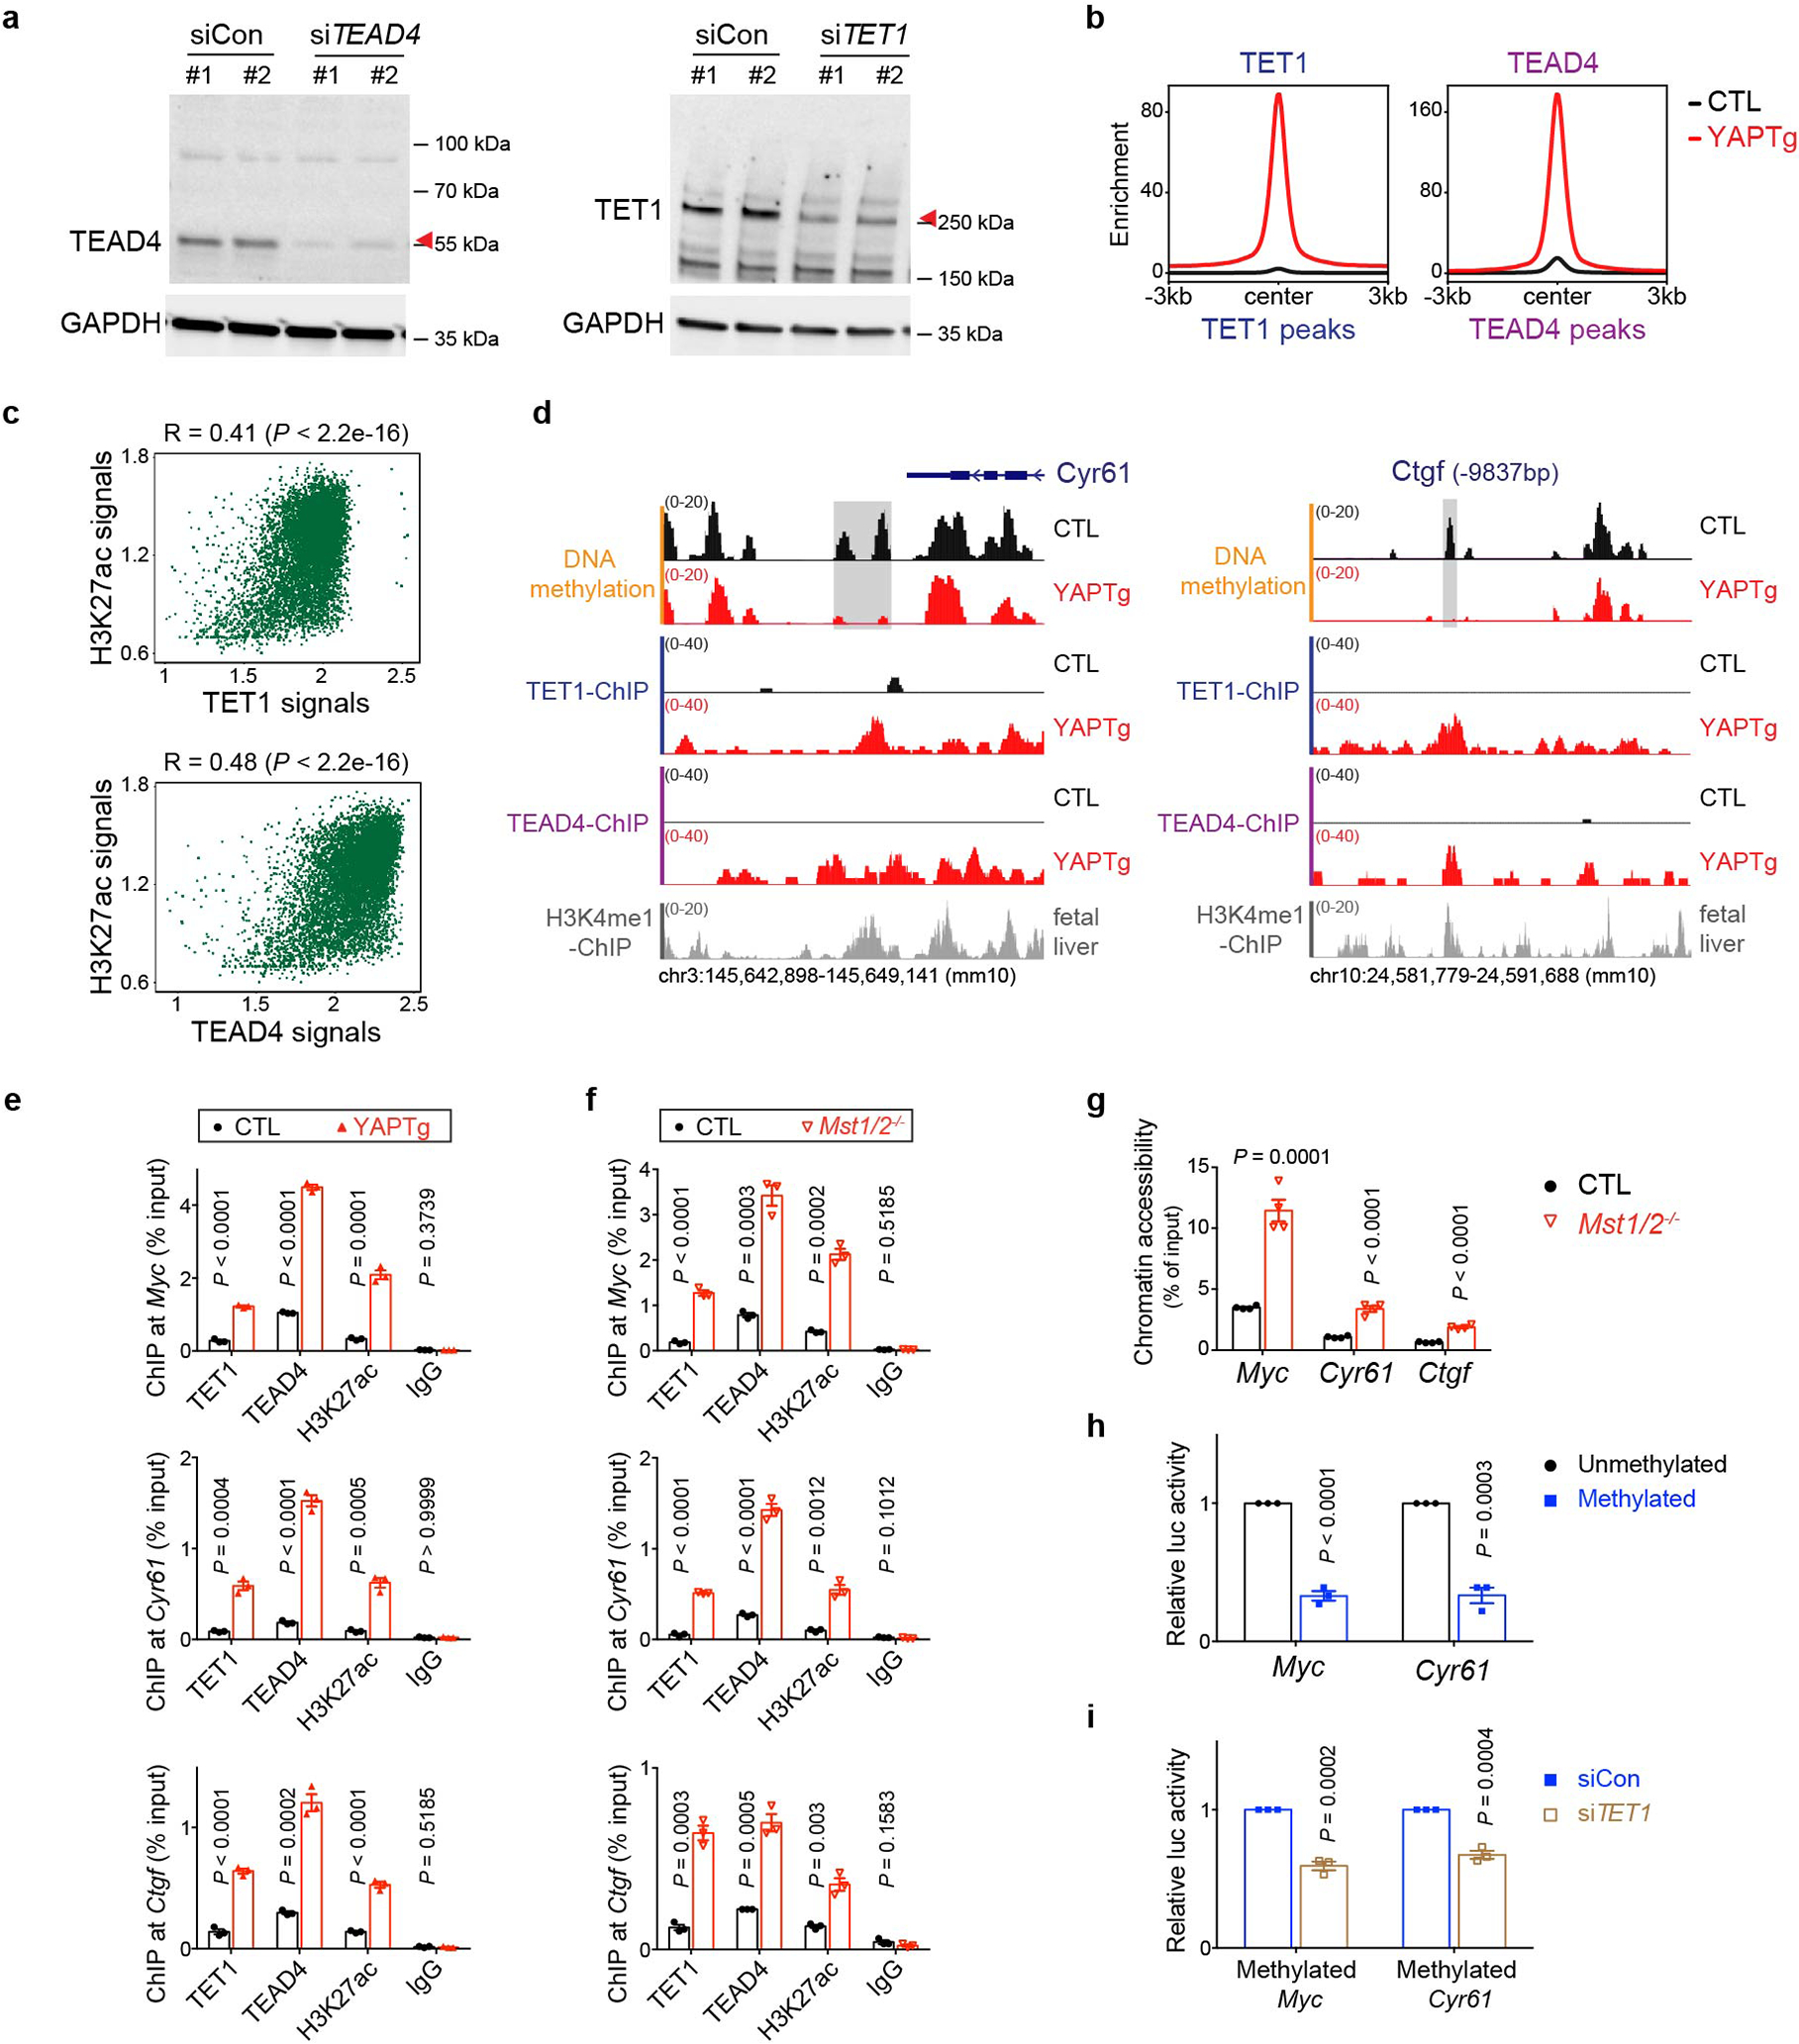
a, Validation of TEAD4 and TET1 antibody specificity. Western blot of TEAD4 or TET1 protein in HEK293T cells with non-targeting control (siCon) or siRNA targeting TEAD4 (siTEAD4) or siRNA targeting TET1 (siTET1) treatment. Images are representative of two independent experiments. b, Enrichment profiles representing the TET1 ChIP-seq reads from control and YAPTg livers centered at TET1 peaks (left panel) and the TEAD4 ChIP-seq reads from control and YAPTg livers centered at TEAD4 peaks (right panel). c, Spearman’s correlation coefficient analysis using the signals of peaks between H3K27ac and TET1 or TEAD4 from the identified 8,022 TET1/TEAD4/H3K27ac overlapped peaks. d, Genomic tracks displaying MBD-seq and ChIP-seq reads at the rDMR loci of Cyr61 and Ctgf. Grey columns represent YAP-induced rDMR regions. e, ChIP-qPCR at rDMRs in YAPTg livers (n = 3). f, g, ChIP-qPCR (n = 3) (f) and FAIRE-qPCR (n = 4) (g) at rDMRs in Mst1/2 mutant livers. h, Luciferase reporter assay showing enhancer activity of unmethylated and methylated Myc and Cyr61 rDMRs of three independent experiments. Reporter construct containing respective rDMRs with or without in vitro methylation was co-transfected with YAP-expressing vector into HEK293T cells. Luciferase activity was normalized to unmethylated rDMR. i, Luciferase reporter assay showing enhancer activity of methylated Myc or Cyr61 rDMR with non-targeting control (siCon) or siRNA targeting TET1 (siTET1) of three independent experiments. Reporter construct containing methylated rDMR was co-transfected with YAP-expressing vector together with either non-targeting control or siRNA targeting TET1 into HEK293T cells. Luciferase activity was normalized to non-targeting control. Values represent mean ± s.e.m. (e, f, g, h, i). P values are calculated with unpaired two-tailed Student’s t-test (e, f, g, h, i) or two-tailed Spearman’s correlation test (c).
Extended Data Fig. 8. Loss of Tet1 suppresses YAP-induced hepatomegaly and tumorigenesis.
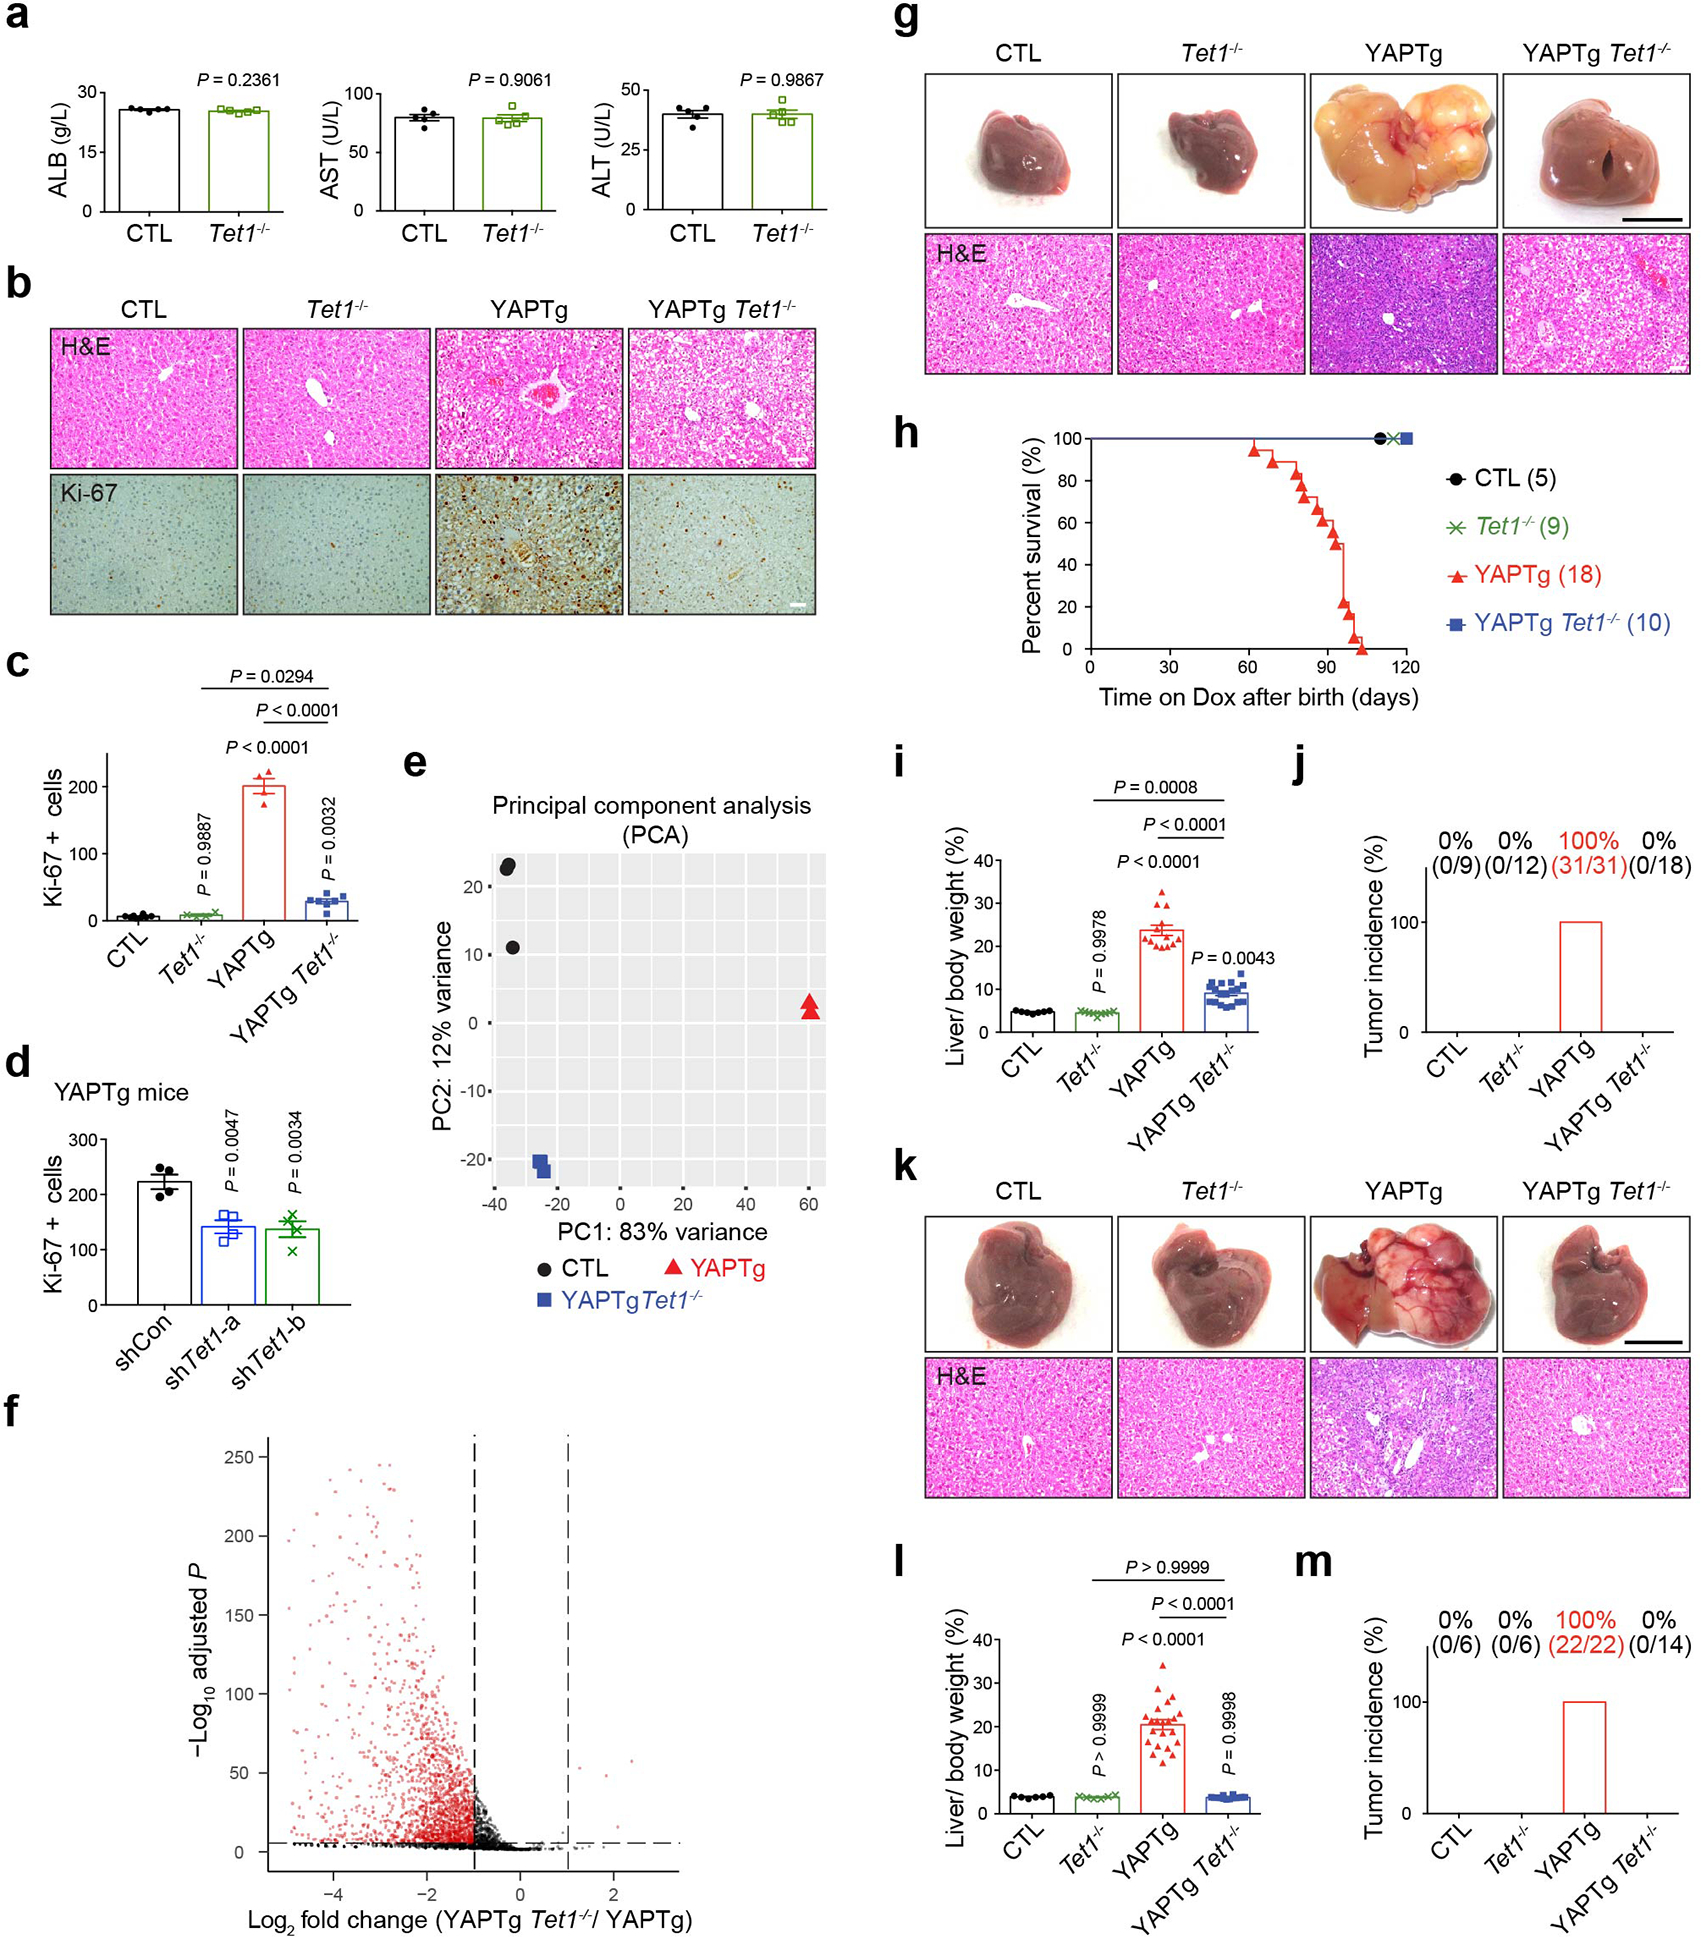
a, Normal liver function in Tet1 mutant mice, as indicated by similar serum levels of ALB, AST and ALT compared to control mice (n = 5). b, c, Representative H&E and Ki-67 staining of liver sections (b) and quantification of Ki-67 positive cells (c) from the indicated mice (n = 4) treated with Dox for 10 days starting at 1 month of age. d, Quantification of Ki-67 positive cells in YAPTg livers treated with Tet1 shRNA lentivirus (n = 4). e, Principal components analysis (PCA) for transcriptome profiles from the indicated mice (n = 3). f, A volcano plot showing differential expression of 2,963 YAP-upregulated genes in YAPTg Tet1−/− compared to YAPTg livers. Red dots represent remarkable (fold change ≥ 2) and significant (P < 0.00001) genes. g, i, Representative gross image and H&E staining of livers (g) and quantification of liver-to-body weight ratio (i) from CTL (n = 7), Tet1−/− (n = 9), YAPTg (n = 13) and YAPTg Tet1−/− (n = 18) mice treated with Dox starting at birth for ~2 months. h, Kaplan-Meier survival curve showing the survival of the indicated mice treated with Dox starting at birth, monitored for 120 days. j, Quantification of HCC incidence under same condition as in (g). k, l, Representative gross image and H&E staining of livers (k) and quantification of liver-to-body weight ratio (l) from CTL (n = 6), Tet1−/− (n = 6), YAPTg (n = 22) and YAPTg Tet1−/− (n = 14) mice at ~14 months of age without Dox treatment. m, Quantification of HCC incidence under same condition as in (k). Values represent mean ± s.e.m. (a, c, d, i, l). P values are calculated with unpaired two-tailed Student’s t-test (a) or one-way ANOVA with Tukey’s test (c, d, i, l).
Extended Data Fig. 9. TET1-mediated DNA methylation is required for transcriptional induction of TEAD1/4.
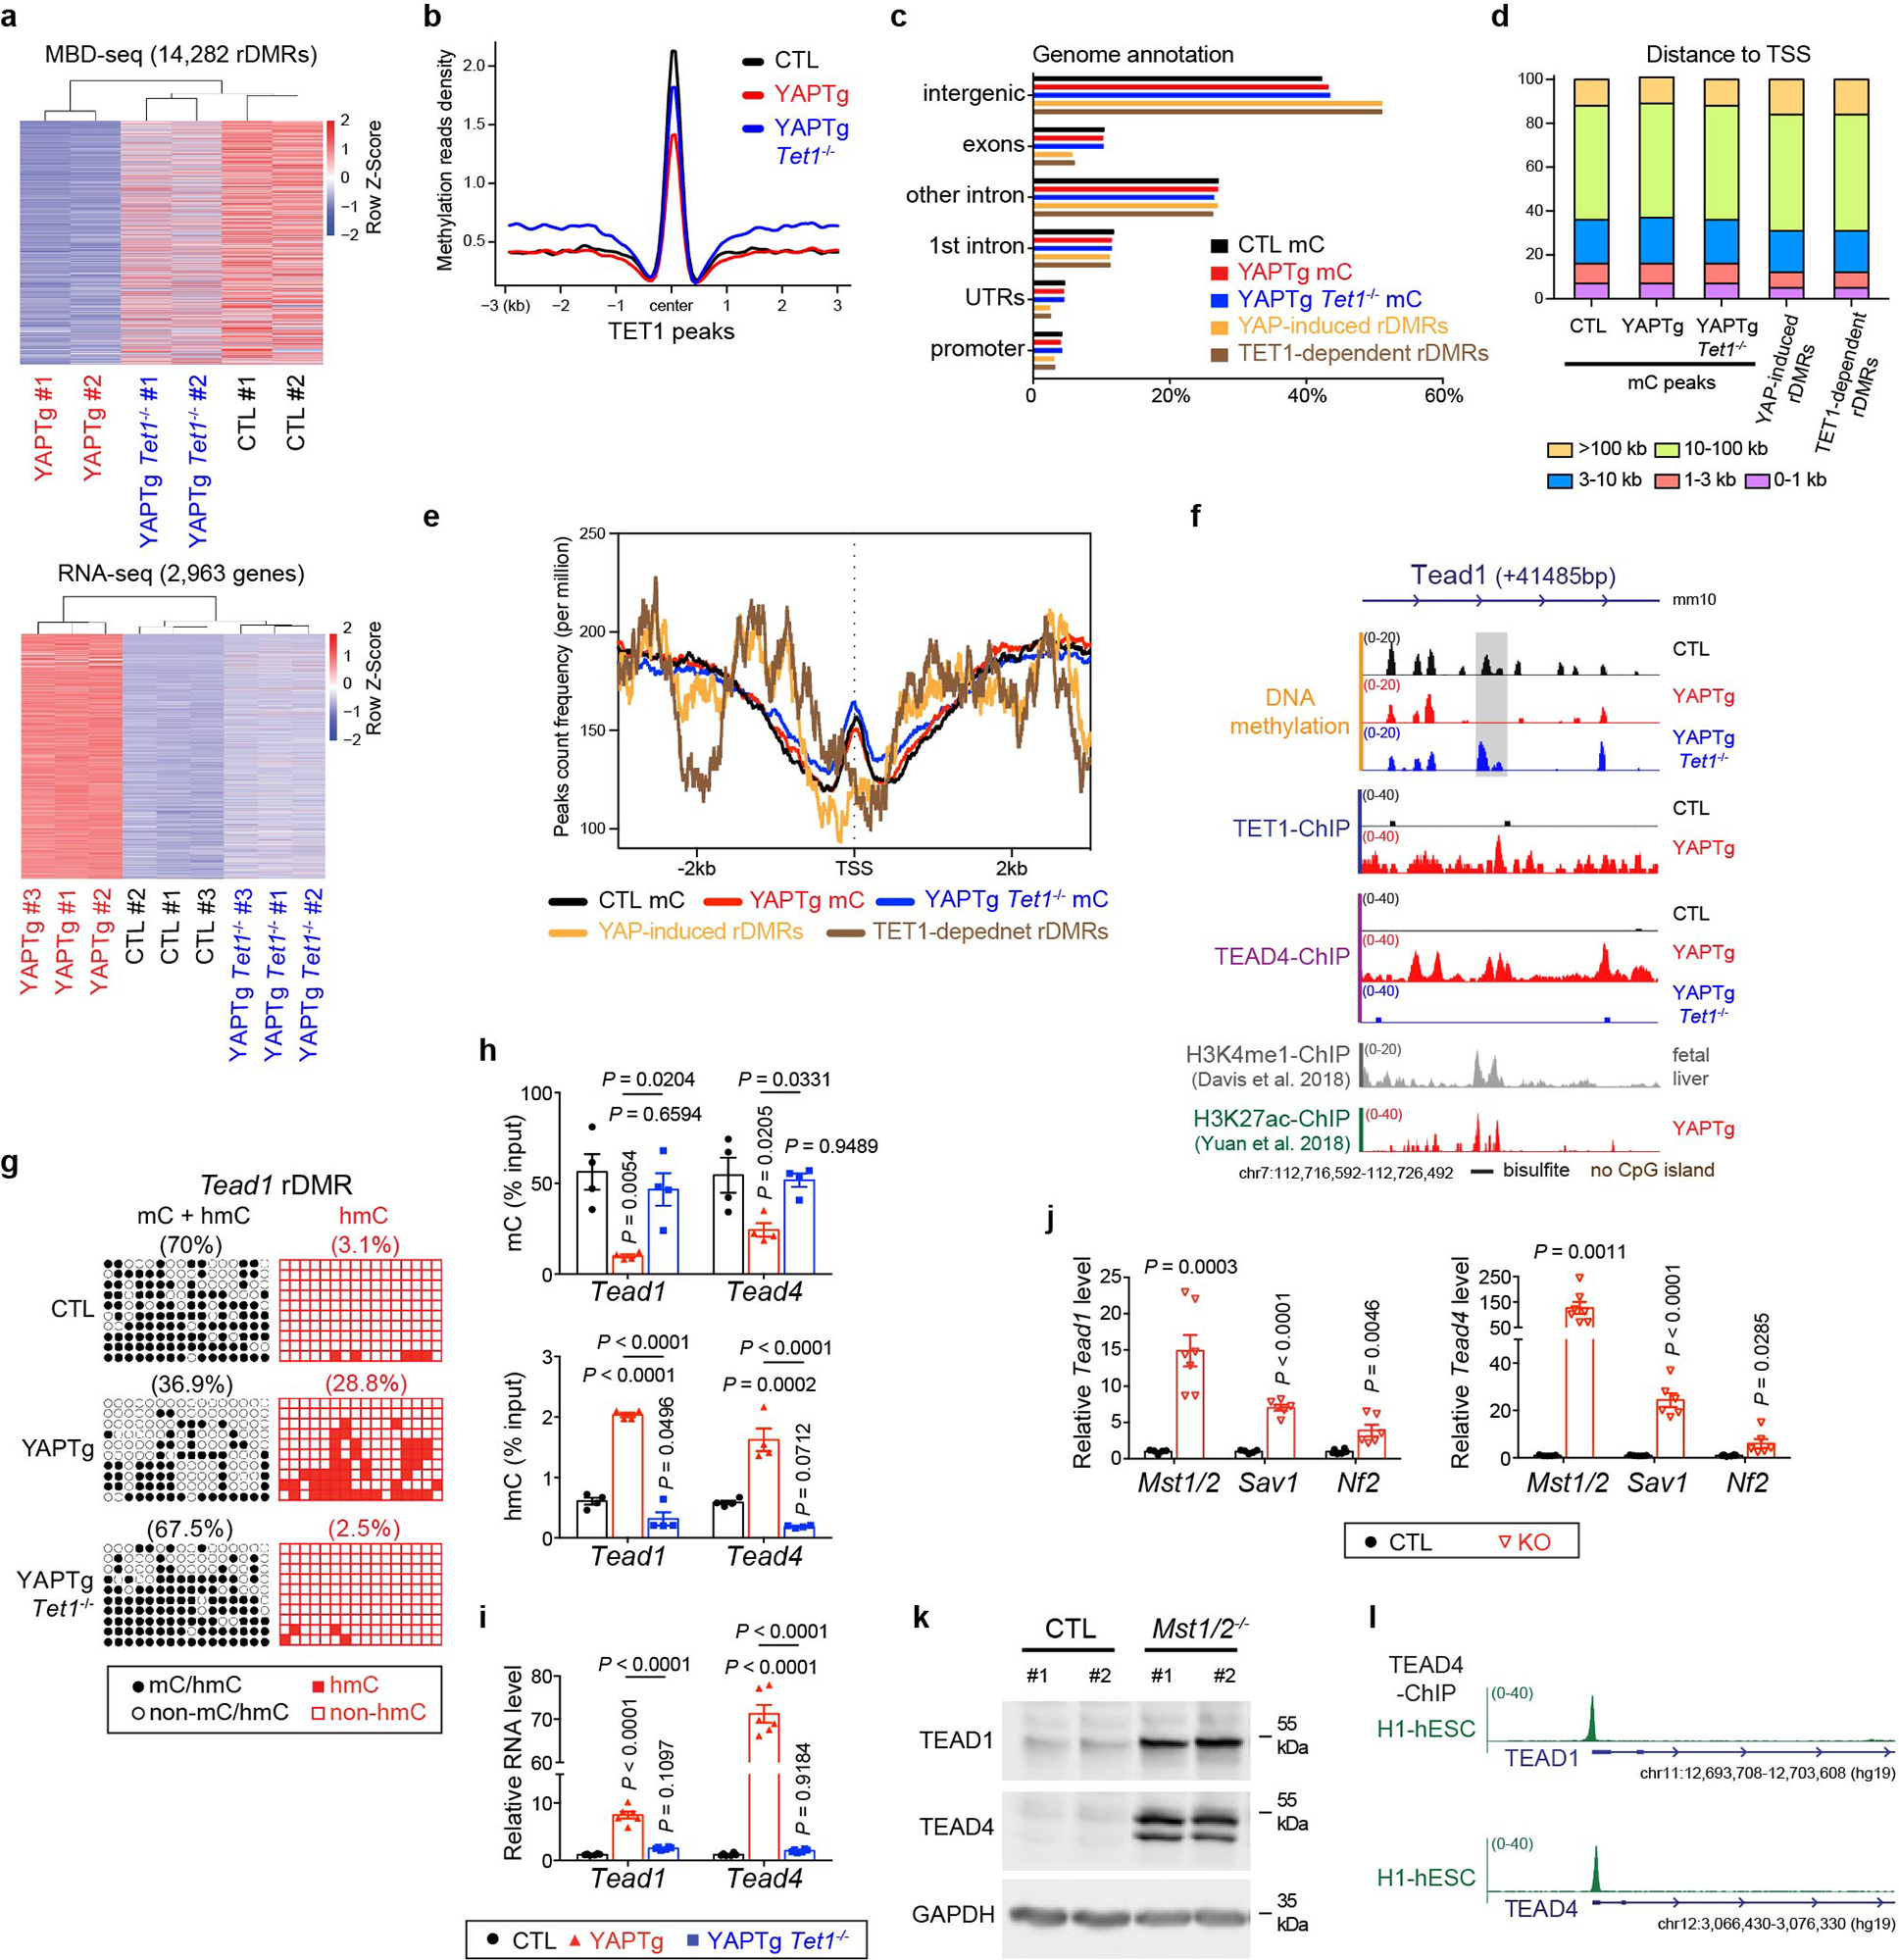
a, Clustered heatmaps of MBD-seq data (top panel) and RNA-seq data (bottom panel) displaying sample-to-sample distance between the indicated genetic background. b, Methylation profile representing the MBD-seq signals from the indicated mutant livers centered at TET1 peaks. c, Absolute distance of methylation peaks, YAP-induced rDMRs and TET1-dependent rDMRs relative to nearest TSS. d, Genomic distribution of methylation peaks, YAP-induced rDMRs and TET1-dependent rDMRs. e, Average peak profile of methylation peaks, YAP-induced rDMRs and TET1-dependent rDMRs mapped to nearest TSS. f, Genomic tracks displaying MBD-seq, TET1 ChIP-seq, TEAD4 ChIP-seq, H3K4me1 ChIP-seq and H3K27ac ChIP-seq reads at the Tead1 rDMR locus. Grey column represents a YAP-induced rDMR region. g, Cloning-based traditional bisulfite sequencing (left panels) and TAB-seq (right panels) of 16 CpG sites at the Tead1 rDMR locus. All sequencing results include 10 independent clones. h, 5mC and 5hmC validation at the Tead1 and Tead4 rDMRs in the indicated mutant livers. Methylation (top panel) and hydroxymethylation (bottom panel) levels were determined by MBD-qPCR and hMeDIP-qPCR, respectively (n = 4). i, RT-qPCR of Tead1 and Tead4 in the indicated mutant livers. mRNA level was normalized to control livers (n = 6). j, RT-qPCR of Tead1 and Tead4 in the indicated 1-month-old mutant livers (CTL n = 5, 5, 6 and KO n = 7, 6, 6 from left to right). mRNA level was normalized to control livers. k, Western blot of TEAD1 and TEAD4 protein in Mst1/2 mutant livers. Images are representative of three independent experiments. l, Genomic tracks displaying TEAD4 ChIP-seq reads at TEAD1 and TEAD4 genes in human embryonic stem cells (H1-hESC).Values represent mean ± s.e.m. (h, i, j). P values are calculated with unpaired two-tailed Student’s t-test (j) or one-way ANOVA with Tukey’s test (h, i).
Extended Data Fig. 10. YAP directly induces the transcription of Tead1 and Tead4 in a TET1-dependent manner.
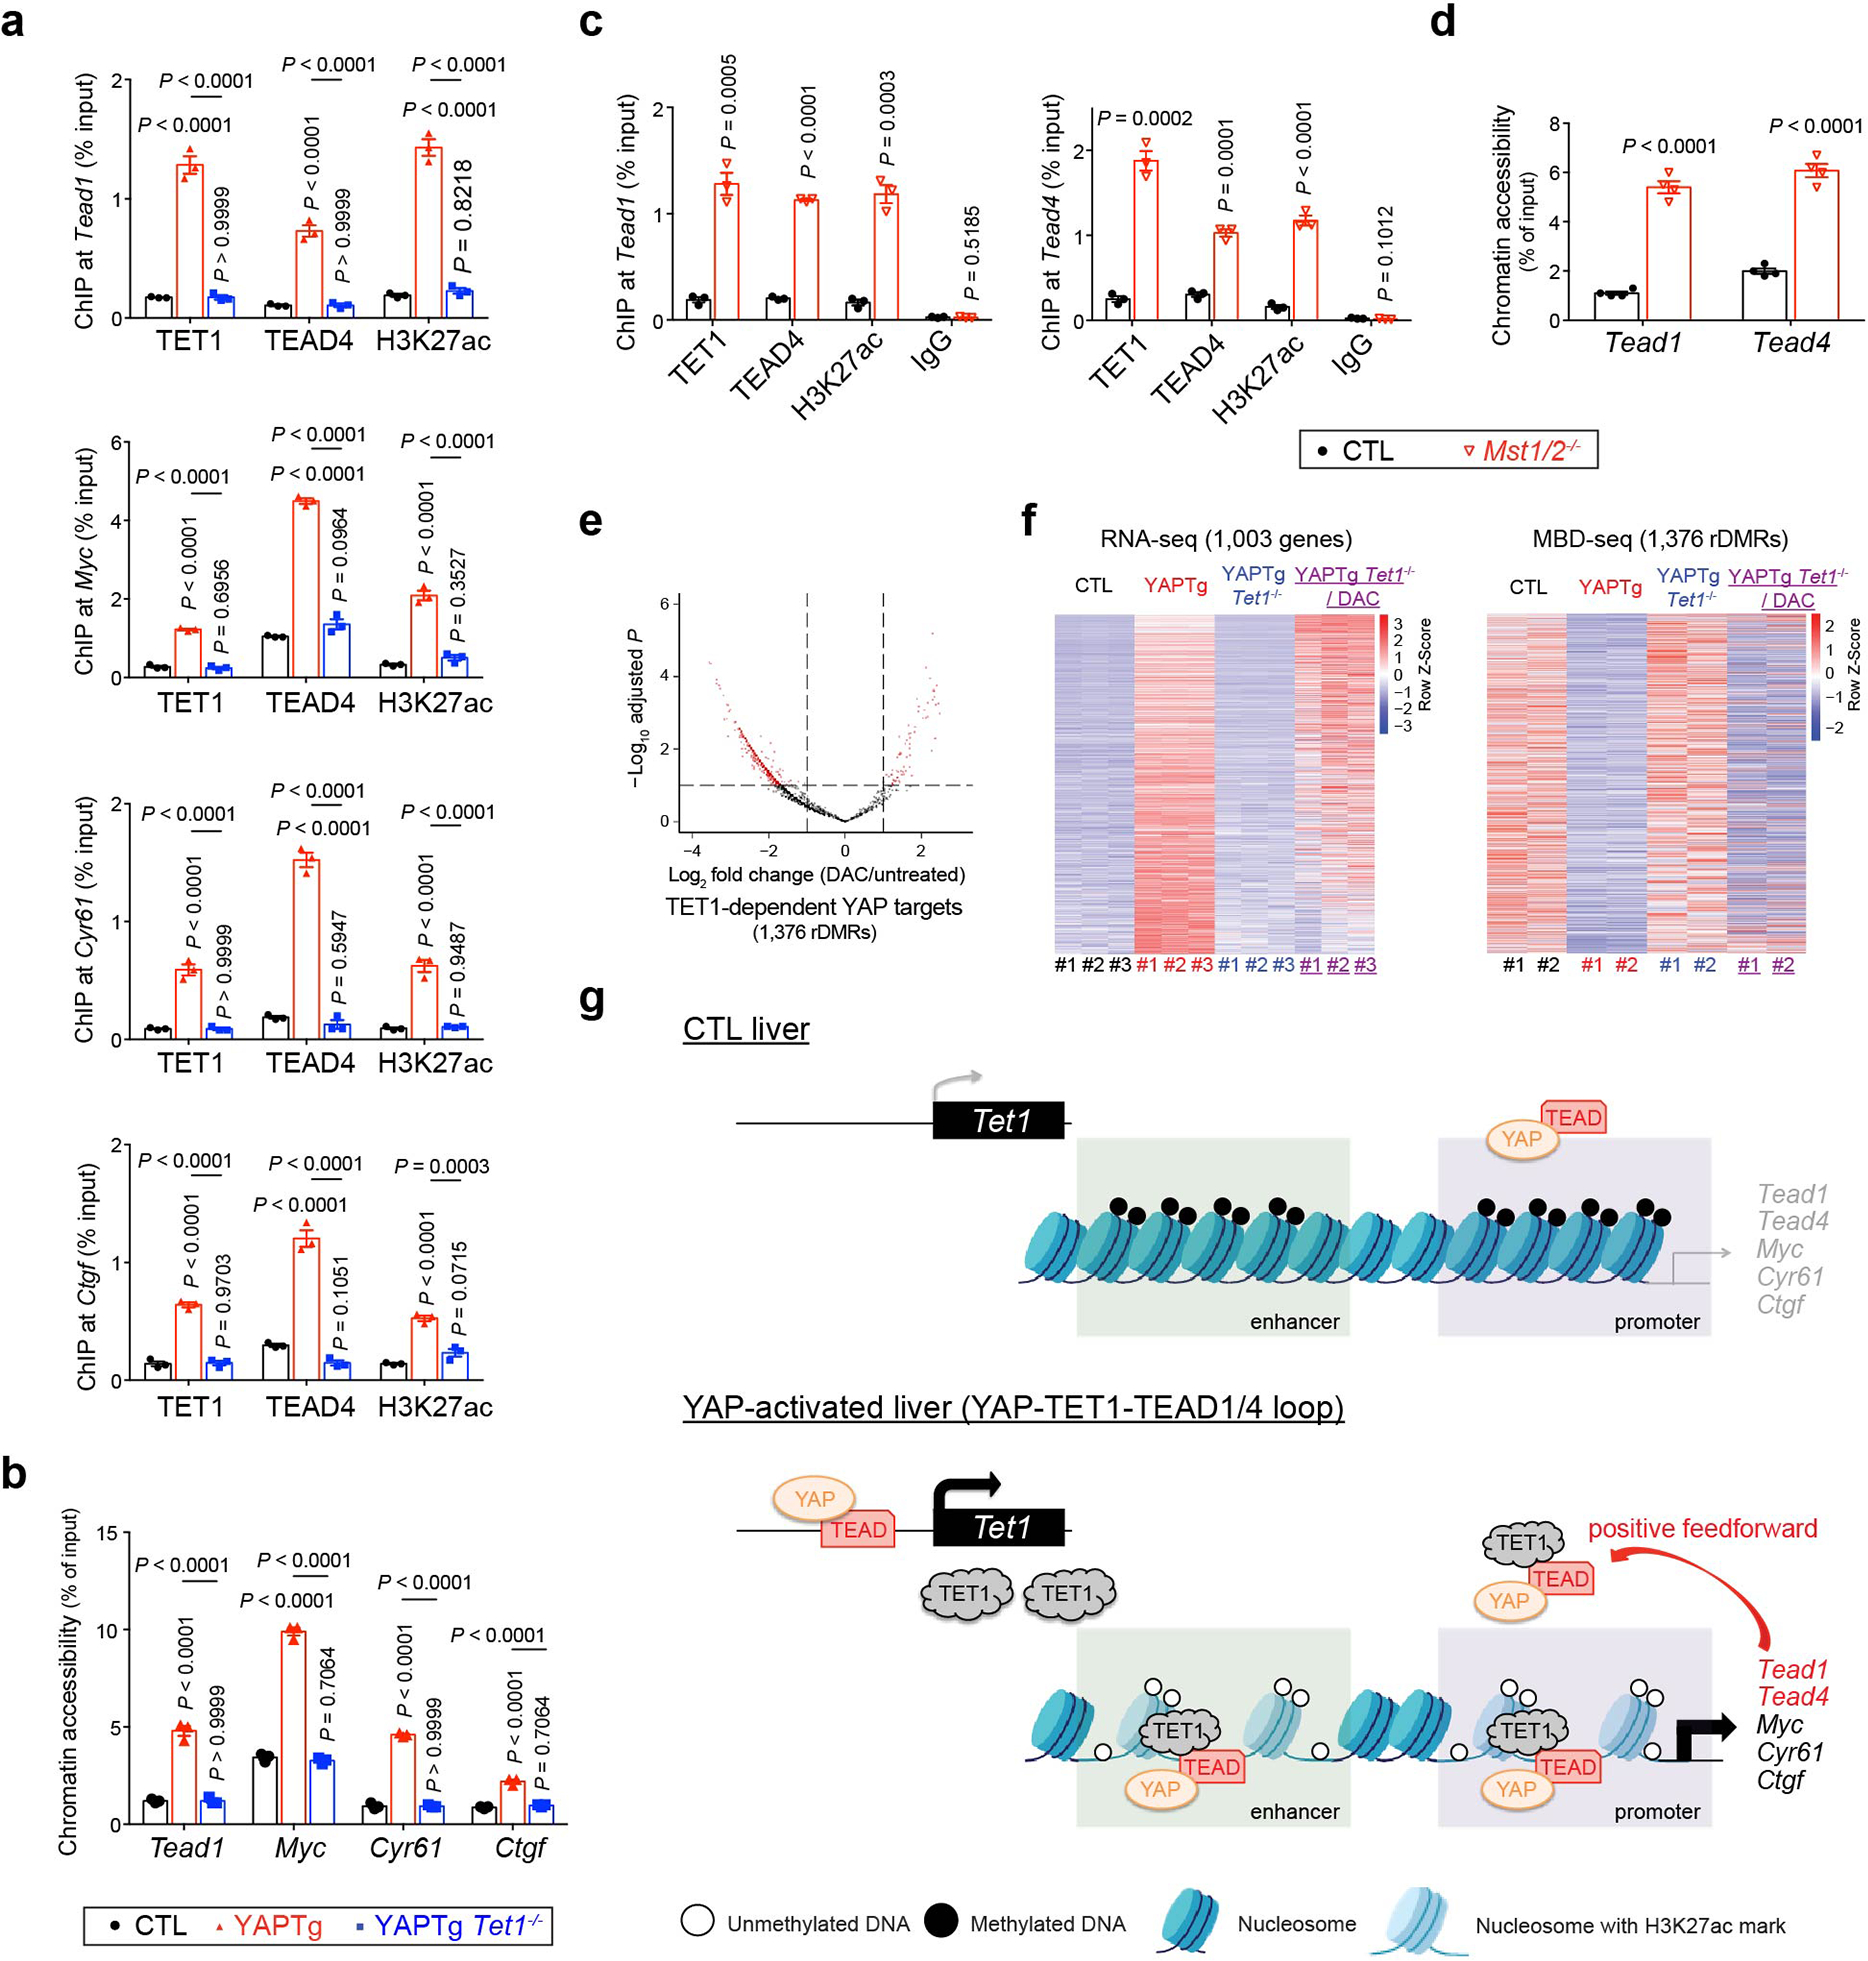
a, b, ChIP-qPCR (n = 3) (a) and FAIRE-qPCR (n = 3) (b) at rDMRs in the indicated mutant livers (also see Fig. 3l and Extended Data Fig. 7e). c, d, ChIP-qPCR (n = 3) (c) and FAIRE-qPCR (n =4) (d) at Tead1 and Tead4 rDMRs in Mst1/2 mutant livers. e, A volcano plot for differential DNA methylation of 1,376 rDMRs sites (associated with 1,003 TET1-dependent YAP target genes) in DAC-treated compared to untreated YAPTg Tet1−/− livers. Red dots represent remarkable (fold change ≥ 2) and significant (P < 0.1) genes. Note that 27.4% of rDMRs (377 out of 1,376) were DNA demethylation by DAC treatment. f, Heatmaps of RNA-seq (left panel) and MBD-seq (right panel) data displaying changes of 1,003 TET1-dependent YAP target genes between the indicated mice, ranked based on P values (between YAPTg Tet1−/− and YAPTg Tet1−/−/DAC) with the most significant on top. g, Schematic model showing a YAP-TET1-TEAD positive feedforward loop sustains YAP signaling. In control livers, the YAP-TEAD complex has limited access to the promoter and enhancer of YAP target genes due to closed chromatin. In YAP-activated livers, YAP-induced expression of TET1 protein causes regional DNA demethylation and local chromatin opening to facilitate YAP-TEAD binding. As a transcriptional coactivator, YAP then recruits histone-modifying enzymes such as NCOA6 and P300, as well as chromatin remodelers such as SWI/SNF complex, to further increase chromatin opening. This further facilitates the association of the YAP-TEAD complex to YAP target genes to activate their transcription. Induction of Tead1 and Tead4 by the YAP-TEAD complex constitutes a feedforward loop to amplify YAP signaling. Values represent mean ± s.e.m. (a, b, c, d). P values are calculated with unpaired two-tailed Student’s t-test (c, d) or one-way ANOVA with Tukey’s test (a, b).
Supplementary Material
Acknowledgements
We thank the McDermott Sequencing Core, the Next Generation Sequencing Core, the Bioinformatics Lab, the Animal Resource Center and the Transgenic Core Facility at University of Texas Southwestern Medical Center for their assistance with this work. This work was supported in part by grants from National Institutes of Health (EY015708 to D.P. and R35GM136316 to E.H.C.) and Department of Defense (PR190360 to D.P.). D.P. is an investigator of the Howard Hughes Medical Institute.
Footnotes
Competing interests
The authors declare no competing interests.
References
- 1.Baylin SB & Jones PA Epigenetic Determinants of Cancer. Cold Spring Harb Perspect Biol 8(2016). [DOI] [PMC free article] [PubMed] [Google Scholar]
- 2.Suva ML, Riggi N & Bernstein BE Epigenetic reprogramming in cancer. Science 339, 1567–70 (2013). [DOI] [PMC free article] [PubMed] [Google Scholar]
- 3.Allis CD & Jenuwein T The molecular hallmarks of epigenetic control. Nat Rev Genet 17, 487–500 (2016). [DOI] [PubMed] [Google Scholar]
- 4.Suganuma T & Workman JL Signals and combinatorial functions of histone modifications. Annu Rev Biochem 80, 473–99 (2011). [DOI] [PubMed] [Google Scholar]
- 5.Audia JE & Campbell RM Histone Modifications and Cancer. Cold Spring Harb Perspect Biol 8, a019521 (2016). [DOI] [PMC free article] [PubMed] [Google Scholar]
- 6.Rasmussen KD & Helin K Role of TET enzymes in DNA methylation, development, and cancer. Genes Dev 30, 733–50 (2016). [DOI] [PMC free article] [PubMed] [Google Scholar]
- 7.Wu X & Zhang Y TET-mediated active DNA demethylation: mechanism, function and beyond. Nat Rev Genet 18, 517–534 (2017). [DOI] [PubMed] [Google Scholar]
- 8.Jones PA & Baylin SB The fundamental role of epigenetic events in cancer. Nat Rev Genet 3, 415–28 (2002). [DOI] [PubMed] [Google Scholar]
- 9.Jones PA & Baylin SB The epigenomics of cancer. Cell 128, 683–92 (2007). [DOI] [PMC free article] [PubMed] [Google Scholar]
- 10.Robertson KD DNA methylation and human disease. Nat Rev Genet 6, 597–610 (2005). [DOI] [PubMed] [Google Scholar]
- 11.Issa JP CpG island methylator phenotype in cancer. Nat Rev Cancer 4, 988–93 (2004). [DOI] [PubMed] [Google Scholar]
- 12.Belinsky SA Gene-promoter hypermethylation as a biomarker in lung cancer. Nat Rev Cancer 4, 707–17 (2004). [DOI] [PubMed] [Google Scholar]
- 13.Greenberg MVC & Bourc’his D The diverse roles of DNA methylation in mammalian development and disease. Nat Rev Mol Cell Biol 20, 590–607 (2019). [DOI] [PubMed] [Google Scholar]
- 14.Bestor TH The DNA methyltransferases of mammals. Hum Mol Genet 9, 2395–402 (2000). [DOI] [PubMed] [Google Scholar]
- 15.Pastor WA, Aravind L & Rao A TETonic shift: biological roles of TET proteins in DNA demethylation and transcription. Nat Rev Mol Cell Biol 14, 341–56 (2013). [DOI] [PMC free article] [PubMed] [Google Scholar]
- 16.Kohli RM & Zhang Y TET enzymes, TDG and the dynamics of DNA demethylation. Nature 502, 472–9 (2013). [DOI] [PMC free article] [PubMed] [Google Scholar]
- 17.Tahiliani M et al. Conversion of 5-methylcytosine to 5-hydroxymethylcytosine in mammalian DNA by MLL partner TET1. Science 324, 930–5 (2009). [DOI] [PMC free article] [PubMed] [Google Scholar]
- 18.Ito S et al. Role of Tet proteins in 5mC to 5hmC conversion, ES-cell self-renewal and inner cell mass specification. Nature 466, 1129–33 (2010). [DOI] [PMC free article] [PubMed] [Google Scholar]
- 19.Ito S et al. Tet proteins can convert 5-methylcytosine to 5-formylcytosine and 5-carboxylcytosine. Science 333, 1300–3 (2011). [DOI] [PMC free article] [PubMed] [Google Scholar]
- 20.Dawlaty MM et al. Tet1 is dispensable for maintaining pluripotency and its loss is compatible with embryonic and postnatal development. Cell Stem Cell 9, 166–75 (2011). [DOI] [PMC free article] [PubMed] [Google Scholar]
- 21.Ficz G et al. Dynamic regulation of 5-hydroxymethylcytosine in mouse ES cells and during differentiation. Nature 473, 398–402 (2011). [DOI] [PubMed] [Google Scholar]
- 22.Koh KP et al. Tet1 and Tet2 regulate 5-hydroxymethylcytosine production and cell lineage specification in mouse embryonic stem cells. Cell Stem Cell 8, 200–13 (2011). [DOI] [PMC free article] [PubMed] [Google Scholar]
- 23.Zhang RR et al. Tet1 regulates adult hippocampal neurogenesis and cognition. Cell Stem Cell 13, 237–45 (2013). [DOI] [PMC free article] [PubMed] [Google Scholar]
- 24.Watanabe K et al. Emergence of the Dedifferentiated Phenotype in Hepatocyte-Derived Tumors in Mice: Roles of Oncogene-Induced Epigenetic Alterations. Hepatol Commun 3, 697–715 (2019). [DOI] [PMC free article] [PubMed] [Google Scholar]
- 25.Shirai K et al. TET1 upregulation drives cancer cell growth through aberrant enhancer hydroxymethylation of HMGA2 in hepatocellular carcinoma. Cancer Sci (2021). [DOI] [PMC free article] [PubMed] [Google Scholar]
- 26.Bai X et al. Ten-Eleven Translocation 1 Promotes Malignant Progression of Cholangiocarcinoma With Wild-Type Isocitrate Dehydrogenase 1. Hepatology 73, 1747–1763 (2021). [DOI] [PMC free article] [PubMed] [Google Scholar]
- 27.Good CR et al. TET1-Mediated Hypomethylation Activates Oncogenic Signaling in Triple-Negative Breast Cancer. Cancer Res 78, 4126–4137 (2018). [DOI] [PMC free article] [PubMed] [Google Scholar]
- 28.Filipczak PT et al. p53-Suppressed Oncogene TET1 Prevents Cellular Aging in Lung Cancer. Cancer Res 79, 1758–1768 (2019). [DOI] [PMC free article] [PubMed] [Google Scholar]
- 29.Takai H et al. 5-Hydroxymethylcytosine plays a critical role in glioblastomagenesis by recruiting the CHTOP-methylosome complex. Cell Rep 9, 48–60 (2014). [DOI] [PubMed] [Google Scholar]
- 30.Huang H et al. TET1 plays an essential oncogenic role in MLL-rearranged leukemia. Proc Natl Acad Sci U S A 110, 11994–9 (2013). [DOI] [PMC free article] [PubMed] [Google Scholar]
- 31.Halder G & Johnson RL Hippo signaling: growth control and beyond. Development 138, 9–22 (2011). [DOI] [PMC free article] [PubMed] [Google Scholar]
- 32.Yu FX, Zhao B & Guan KL Hippo Pathway in Organ Size Control, Tissue Homeostasis, and Cancer. Cell 163, 811–28 (2015). [DOI] [PMC free article] [PubMed] [Google Scholar]
- 33.Yimlamai D, Fowl BH & Camargo FD Emerging evidence on the role of the Hippo/YAP pathway in liver physiology and cancer. J Hepatol 63, 1491–501 (2015). [DOI] [PMC free article] [PubMed] [Google Scholar]
- 34.Zanconato F, Cordenonsi M & Piccolo S YAP/TAZ at the Roots of Cancer. Cancer Cell 29, 783–803 (2016). [DOI] [PMC free article] [PubMed] [Google Scholar]
- 35.Zheng Y & Pan D The Hippo Signaling Pathway in Development and Disease. Dev Cell 50, 264–282 (2019). [DOI] [PMC free article] [PubMed] [Google Scholar]
- 36.Harvey KF, Zhang X & Thomas DM The Hippo pathway and human cancer. Nat Rev Cancer 13, 246–57 (2013). [DOI] [PubMed] [Google Scholar]
- 37.Moya IM & Halder G Hippo-YAP/TAZ signalling in organ regeneration and regenerative medicine. Nat Rev Mol Cell Biol 20, 211–226 (2019). [DOI] [PubMed] [Google Scholar]
- 38.Patel SH, Camargo FD & Yimlamai D Hippo Signaling in the Liver Regulates Organ Size, Cell Fate, and Carcinogenesis. Gastroenterology 152, 533–545 (2017). [DOI] [PMC free article] [PubMed] [Google Scholar]
- 39.Dong J et al. Elucidation of a universal size-control mechanism in Drosophila and mammals. Cell 130, 1120–33 (2007). [DOI] [PMC free article] [PubMed] [Google Scholar]
- 40.Sanchez-Vega F et al. Oncogenic Signaling Pathways in The Cancer Genome Atlas. Cell 173, 321–337 e10 (2018). [DOI] [PMC free article] [PubMed] [Google Scholar]
- 41.Prior N et al. Lgr5(+) stem and progenitor cells reside at the apex of a heterogeneous embryonic hepatoblast pool. Development 146(2019). [DOI] [PMC free article] [PubMed] [Google Scholar]
- 42.Zhou D et al. Mst1 and Mst2 maintain hepatocyte quiescence and suppress hepatocellular carcinoma development through inactivation of the Yap1 oncogene. Cancer Cell 16, 425–38 (2009). [DOI] [PMC free article] [PubMed] [Google Scholar]
- 43.Yimlamai D et al. Hippo pathway activity influences liver cell fate. Cell 157, 1324–38 (2014). [DOI] [PMC free article] [PubMed] [Google Scholar]
- 44.Zhang N et al. The Merlin/NF2 tumor suppressor functions through the YAP oncoprotein to regulate tissue homeostasis in mammals. Dev Cell 19, 27–38 (2010). [DOI] [PMC free article] [PubMed] [Google Scholar]
- 45.Baskin-Bey ES et al. Constitutive androstane receptor (CAR) ligand, TCPOBOP, attenuates Fas-induced murine liver injury by altering Bcl-2 proteins. Hepatology 44, 252–62 (2006). [DOI] [PubMed] [Google Scholar]
- 46.Huang Y et al. The behaviour of 5-hydroxymethylcytosine in bisulfite sequencing. PLoS One 5, e8888 (2010). [DOI] [PMC free article] [PubMed] [Google Scholar]
- 47.Yu M et al. Base-resolution analysis of 5-hydroxymethylcytosine in the mammalian genome. Cell 149, 1368–80 (2012). [DOI] [PMC free article] [PubMed] [Google Scholar]
- 48.Davis CA et al. The Encyclopedia of DNA elements (ENCODE): data portal update. Nucleic Acids Res 46, D794–D801 (2018). [DOI] [PMC free article] [PubMed] [Google Scholar]
- 49.Zanconato F et al. Genome-wide association between YAP/TAZ/TEAD and AP-1 at enhancers drives oncogenic growth. Nat Cell Biol 17, 1218–27 (2015). [DOI] [PMC free article] [PubMed] [Google Scholar]
- 50.Yagi R, Chen LF, Shigesada K, Murakami Y & Ito Y A WW domain-containing yes-associated protein (YAP) is a novel transcriptional co-activator. EMBO J 18, 2551–62 (1999). [DOI] [PMC free article] [PubMed] [Google Scholar]
- 51.Stein C et al. YAP1 Exerts Its Transcriptional Control via TEAD-Mediated Activation of Enhancers. PLoS Genet 11, e1005465 (2015). [DOI] [PMC free article] [PubMed] [Google Scholar]
- 52.Vassilev A, Kaneko KJ, Shu H, Zhao Y & DePamphilis ML TEAD/TEF transcription factors utilize the activation domain of YAP65, a Src/Yes-associated protein localized in the cytoplasm. Genes Dev 15, 1229–41 (2001). [DOI] [PMC free article] [PubMed] [Google Scholar]
- 53.Suzuki T et al. RUNX1 regulates site specificity of DNA demethylation by recruitment of DNA demethylation machineries in hematopoietic cells. Blood Adv 1, 1699–1711 (2017). [DOI] [PMC free article] [PubMed] [Google Scholar]
- 54.Zhao B et al. TEAD mediates YAP-dependent gene induction and growth control. Genes Dev 22, 1962–71 (2008). [DOI] [PMC free article] [PubMed] [Google Scholar]
- 55.Zhang W et al. Isoform Switch of TET1 Regulates DNA Demethylation and Mouse Development. Mol Cell 64, 1062–1073 (2016). [DOI] [PubMed] [Google Scholar]
- 56.Yuan WC et al. NUAK2 is a critical YAP target in liver cancer. Nat Commun 9, 4834 (2018). [DOI] [PMC free article] [PubMed] [Google Scholar]
- 57.Simon JM, Giresi PG, Davis IJ & Lieb JD Using formaldehyde-assisted isolation of regulatory elements (FAIRE) to isolate active regulatory DNA. Nat Protoc 7, 256–67 (2012). [DOI] [PMC free article] [PubMed] [Google Scholar]
- 58.Tsai HC et al. Transient low doses of DNA-demethylating agents exert durable antitumor effects on hematological and epithelial tumor cells. Cancer Cell 21, 430–46 (2012). [DOI] [PMC free article] [PubMed] [Google Scholar]
- 59.Cheng Y et al. Targeting epigenetic regulators for cancer therapy: mechanisms and advances in clinical trials. Signal Transduct Target Ther 4, 62 (2019). [DOI] [PMC free article] [PubMed] [Google Scholar]
- 60.Reilly BM et al. 5-Azacytidine Transiently Restores Dysregulated Erythroid Differentiation Gene Expression in TET2-Deficient Erythroleukemia Cells. Mol Cancer Res 19, 451–464 (2021). [DOI] [PMC free article] [PubMed] [Google Scholar]
- 61.Oh H et al. Yorkie promotes transcription by recruiting a histone methyltransferase complex. Cell Rep 8, 449–59 (2014). [DOI] [PMC free article] [PubMed] [Google Scholar]
- 62.Qing Y et al. The Hippo effector Yorkie activates transcription by interacting with a histone methyltransferase complex through Ncoa6. Elife 3(2014). [DOI] [PMC free article] [PubMed] [Google Scholar]
- 63.Chang L et al. The SWI/SNF complex is a mechanoregulated inhibitor of YAP and TAZ. Nature 563, 265–269 (2018). [DOI] [PMC free article] [PubMed] [Google Scholar]
- 64.Skibinski A et al. The Hippo transducer TAZ interacts with the SWI/SNF complex to regulate breast epithelial lineage commitment. Cell Rep 6, 1059–1072 (2014). [DOI] [PMC free article] [PubMed] [Google Scholar]
- 65.Oh H et al. Genome-wide association of Yorkie with chromatin and chromatin-remodeling complexes. Cell Rep 3, 309–18 (2013). [DOI] [PMC free article] [PubMed] [Google Scholar]
- 66.Zanconato F et al. Transcriptional addiction in cancer cells is mediated by YAP/TAZ through BRD4. Nat Med 24, 1599–1610 (2018). [DOI] [PMC free article] [PubMed] [Google Scholar]
- 67.Joshi S et al. TEAD transcription factors are required for normal primary myoblast differentiation in vitro and muscle regeneration in vivo. PLoS Genet 13, e1006600 (2017). [DOI] [PMC free article] [PubMed] [Google Scholar]
- 68.Liu X et al. Tead and AP1 Coordinate Transcription and Motility. Cell Rep 14, 1169–1180 (2016). [DOI] [PMC free article] [PubMed] [Google Scholar]
- 69.Chen Q et al. Homeostatic control of Hippo signaling activity revealed by an endogenous activating mutation in YAP. Genes Dev 29, 1285–97 (2015). [DOI] [PMC free article] [PubMed] [Google Scholar]
- 70.Hamaratoglu F et al. The tumour-suppressor genes NF2/Merlin and Expanded act through Hippo signalling to regulate cell proliferation and apoptosis. Nat Cell Biol 8, 27–36 (2006). [DOI] [PubMed] [Google Scholar]
- 71.Genevet A, Wehr MC, Brain R, Thompson BJ & Tapon N Kibra is a regulator of the Salvador/Warts/Hippo signaling network. Dev Cell 18, 300–8 (2010). [DOI] [PMC free article] [PubMed] [Google Scholar]
- 72.Aloia L et al. Epigenetic remodelling licences adult cholangiocytes for organoid formation and liver regeneration. Nat Cell Biol 21, 1321–1333 (2019). [DOI] [PMC free article] [PubMed] [Google Scholar]
- 73.Driskill JH et al. WWTR1(TAZ)-CAMTA1 reprograms endothelial cells to drive epithelioid hemangioendothelioma. Genes Dev 35, 495–511 (2021). [DOI] [PMC free article] [PubMed] [Google Scholar]
- 74.Sohni A et al. Dynamic switching of active promoter and enhancer domains regulates Tet1 and Tet2 expression during cell state transitions between pluripotency and differentiation. Mol Cell Biol 35, 1026–42 (2015). [DOI] [PMC free article] [PubMed] [Google Scholar]
- 75.Chandru A, Bate N, Vuister GW & Cowley SM Sin3A recruits Tet1 to the PAH1 domain via a highly conserved Sin3-Interaction Domain. Sci Rep 8, 14689 (2018). [DOI] [PMC free article] [PubMed] [Google Scholar]
- 76.Jin C et al. TET1 is a maintenance DNA demethylase that prevents methylation spreading in differentiated cells. Nucleic Acids Res 42, 6956–71 (2014). [DOI] [PMC free article] [PubMed] [Google Scholar]
- 77.Ko M et al. Impaired hydroxylation of 5-methylcytosine in myeloid cancers with mutant TET2. Nature 468, 839–43 (2010). [DOI] [PMC free article] [PubMed] [Google Scholar]
- 78.Ko M et al. Modulation of TET2 expression and 5-methylcytosine oxidation by the CXXC domain protein IDAX. Nature 497, 122–6 (2013). [DOI] [PMC free article] [PubMed] [Google Scholar]
- 79.Li Z et al. Structural insights into the YAP and TEAD complex. Genes Dev 24, 235–40 (2010). [DOI] [PMC free article] [PubMed] [Google Scholar]
- 80.Zuber J et al. Toolkit for evaluating genes required for proliferation and survival using tetracycline-regulated RNAi. Nat Biotechnol 29, 79–83 (2011). [DOI] [PMC free article] [PubMed] [Google Scholar]
- 81.Ge SX, Son EW & Yao R iDEP: an integrated web application for differential expression and pathway analysis of RNA-Seq data. BMC Bioinformatics 19, 534 (2018). [DOI] [PMC free article] [PubMed] [Google Scholar]
- 82.Tang Z, Kang B, Li C, Chen T & Zhang Z GEPIA2: an enhanced web server for large-scale expression profiling and interactive analysis. Nucleic Acids Res 47, W556–W560 (2019). [DOI] [PMC free article] [PubMed] [Google Scholar]
- 83.Tang Z et al. GEPIA: a web server for cancer and normal gene expression profiling and interactive analyses. Nucleic Acids Res 45, W98–W102 (2017). [DOI] [PMC free article] [PubMed] [Google Scholar]
- 84.McLean CY et al. GREAT improves functional interpretation of cis-regulatory regions. Nat Biotechnol 28, 495–501 (2010). [DOI] [PMC free article] [PubMed] [Google Scholar]
- 85.Yu G, Wang LG & He QY ChIPseeker: an R/Bioconductor package for ChIP peak annotation, comparison and visualization. Bioinformatics 31, 2382–3 (2015). [DOI] [PubMed] [Google Scholar]
- 86.Thomas-Chollier M et al. A complete workflow for the analysis of full-size ChIP-seq (and similar) data sets using peak-motifs. Nat Protoc 7, 1551–68 (2012). [DOI] [PubMed] [Google Scholar]
- 87.Leporcq C et al. TFmotifView: a webserver for the visualization of transcription factor motifs in genomic regions. Nucleic Acids Res 48, W208–W217 (2020). [DOI] [PMC free article] [PubMed] [Google Scholar]
- 88.Home P et al. Altered subcellular localization of transcription factor TEAD4 regulates first mammalian cell lineage commitment. Proc Natl Acad Sci U S A 109, 7362–7 (2012). [DOI] [PMC free article] [PubMed] [Google Scholar]
Associated Data
This section collects any data citations, data availability statements, or supplementary materials included in this article.
Supplementary Materials
Data Availability Statement
RNA-seq, MBD-seq and ChIP-seq data that support the findings of this study have been deposited in the Gene Expression Omnibus (GEO) under accession numbers GSE178227.
All other data and reagents supporting the findings of this study are available from the corresponding author on reasonable request. Source data are provided with this paper.


