Summary
Gene therapy is a potentially curative medicine for many currently untreatable diseases, and most successfully delivered in vivo by recombinant adeno-associated virus (rAAV) vectors. However, rAAV-based gene therapy suffers from several limitations, such as constrained DNA cargo size and toxicities caused by non-physiological expression of a transgene. Here we show that rAAV delivery of a suppressor tRNA (rAAV.sup-tRNA) safely and efficiently rescued a genetic disease mouse model carrying a nonsense mutation more than six months after a single treatment. Mechanistically, this was achieved by a synergistic effect of premature stop codon readthrough and inhibition of nonsense-mediated mRNA decay. rAAV.sup-tRNA had mild impact on global readthrough at normal stop codons and did not perturb endogenous tRNA homeostasis, as determined by ribosome profiling and tRNA sequencing, respectively. By optimizing AAV capsid and route of administration, therapeutic efficacy in various target tissues could be achieved, including liver, heart, skeletal muscle, and brain. This study suggests the feasibility of developing a toolbox of AAV-delivered nonsense suppressor tRNAs operating on premature termination codons (AAV-NoSTOP) to rescue pathogenic nonsense mutations, restoring gene function under endogenous regulation. As nonsense mutations account for 11% of pathogenic mutations, AAV-NoSTOP can benefit a large number of patients. AAV-NoSTOP obviates the need to deliver a full-length protein-coding gene that may exceed the rAAV packaging limit, elicit immune responses, or cause transgene-related toxicities, and therefore represents a valuable addition to gene therapeutics.
INTRODUCTION
Recombinant adeno-associated virus (rAAV)-based gene therapy1,2 typically uses transgenes to produce therapeutic effects, such as delivering a complementary DNA (cDNA) to replace a mutated endogenous gene. Although it holds tremendous promise3, transgene expression at non-physiological levels or in off-target cell and tissue types may cause toxicity4–6. Therefore, harnessing the endogenous gene expression regulation is an attractive approach to gene therapy development. This can be achieved by gene editing to directly repair a DNA mutation. However, in vivo delivery of gene editing machineries, such as the CRISPR-based system, can be challenging due to their large gene sizes and immunogenicity7.
Nonsense mutations, DNA mutations that change a sense codon to a premature termination codon (PTC) in mRNA, account for 11% of human pathogenic mutations. A PTC in mRNA abrogates full-length protein synthesis and usually triggers nonsense mediated mRNA decay (NMD) that greatly reduces the steady-state level of the PTC-containing mRNA. To tackle nonsense mutations, using suppressor transfer RNA (sup-tRNA) to induce PTC readthrough was proposed as a gene therapy approach8,9. A sup-tRNA is derived from a natural tRNA with the anticodon altered to base-pair with one of three stop codons (UAG, UAA, UGA), and aminoacylated to participate in translation elongation at the targeted PTC, thus restoring full-length protein production and function under endogenous gene regulation (Fig. 1a). However, since the concept was formally introduced four decades ago8,9, therapeutic development has been largely limited to testing in cell culture models10 due to inefficient in vivo delivery, and to our knowledge, long-term in vivo efficacy and safety at molecular level are not documented due to lack of proper genome-wide methodologies. We reasoned that rAAV-based in vivo gene delivery and advances in nucleic acid sequencing techniques should allow us to further investigate the efficacy and safety of therapeutic sup-tRNA.
Figure 1. Sup-tRNAs suppressed the mIdua-W401X mutation in HEK293 cells.
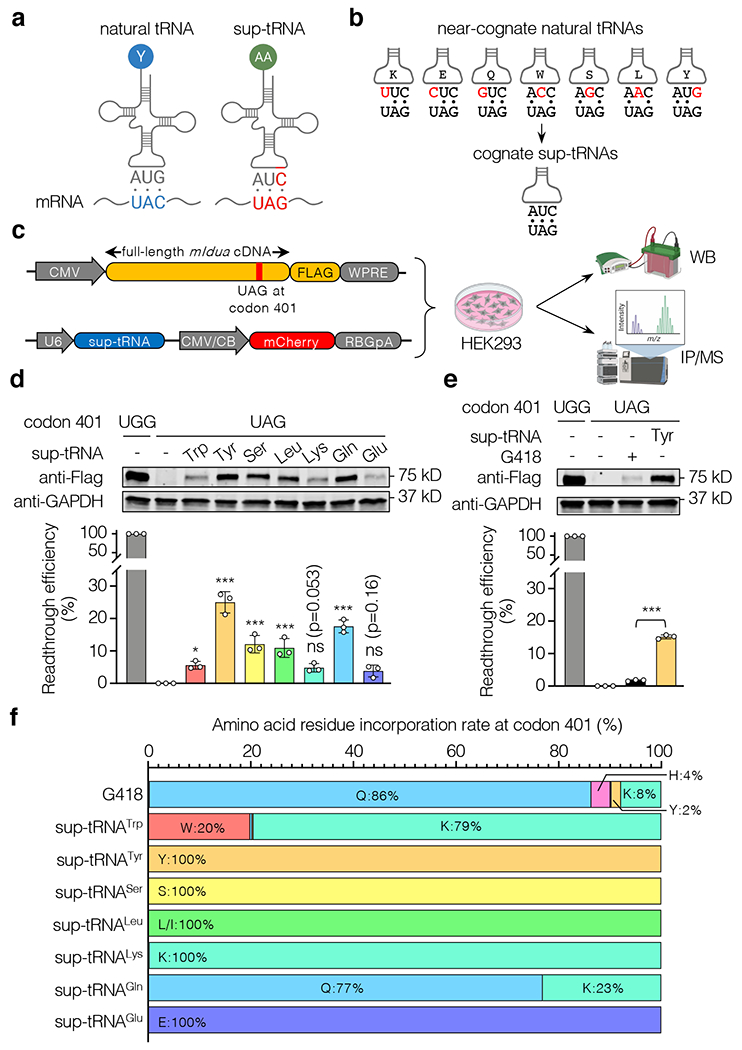
a, Schematic showing that a natural tRNA recognizes a sense codon (UAC in blue), whereas a suppressor tRNA (sup-tRNA) recognizes a stop codon (UAG in red) by the engineered anticodon. b, Near-cognate natural tRNAs have anticodons partially base-pairing with UAG (mismatches are in red), whereas sup-tRNAs have the engineered 3’-AUC-5’ anticodon that completely base-pairs with UAG. c, Workflow to examine sup-tRNA-induced readthrough efficiency by Western blot (WB) and amino acid residue incorporation by immunoprecipitation/mass spectrometry (IP/MS). Constructs expressing FLAG-tagged mouse IDUA and sup-tRNA, respectively, are shown. d, Representative Western blot images and quantification of mouse IDUA protein expression restored by sup-tRNA-induced readthrough. Data are mean ± s.d. of three biological replicates. e, Representative Western blot images and quantification of mouse IDUA protein expression restored via readthrough by G418 (0.1 mg/mL) or sup-tRNATyr. Data are mean ± s.d. of three biological replicates. f, Amino acid residue incorporation rate at the mIdua-W401X PTC by G418 or various sup-tRNAs as determined by mass spectrometry analysis of FLAG-tagged mouse IDUA. Statistical analysis was performed by one-way ANOVA followed by two-sided Dunnett’s multiple comparisons test (d and e). *p < 0.05, **p < 0.01, ***p < 0.001, ns: not significant. For gel source data, see Supplementary Figure 1.
In this study, we utilized a mouse model carrying a homozygous nonsense mutation in the Idua gene (Idua-W401X, TGG→TAG)11 to develop AAV-delivered nonsense suppressor tRNAs operating on premature termination codons (AAV-NoSTOP). This mouse model recapitulates human mucopolysaccharidosis type I (MPS-I), a lysosomal storage disease caused by lack of alpha-L-iduronidase enzymatic activity and accumulation of glycosaminoglycans (GAGs) that result in the disease through diverse mechanisms12. Although MPS-I is treatable13, we chose this disease model because the biochemical defects are present in the whole body and quantifiable by well-established assays, allowing for investigation of multiple target tissues; such data can inform on broader application of the rAAV.sup-tRNA therapeutics in other diseases afflicting those tissues caused by a common UAG PTC. Furthermore, we leveraged the recently developed ribosome profiling (Ribo-seq)14,15 and tRNA sequencing (tRNA-seq)16 techniques to interrogate off-target readthrough at normal stop codons and interference with endogenous tRNA homeostasis, respectively, which revealed a good safety profile.
RESULTS
Sup-tRNAs rescued UAG nonsense reporters
In mammalian cells, extremely low level of basal readthrough at the UAG stop codon is mediated by near-cognate natural tRNAs that carry seven different amino acids (Fig. 1b). To develop sup-tRNAs that can decode UAG more efficiently, we selected a panel of seven human tRNAs carrying such amino acids, and mutated their anticodons to 3’-AUC-5’ that completely base-pairs with UAG (Supplementary Table 1). We used a U6 promoter to drive sup-tRNA expression, because it could achieve higher nonsense suppression efficacy than using the endogenous Pol III promoter activity within tRNA17. In pilot experiments employing a nonsense fluorescence reporter and a more quantitative dual-luciferase reporter, all seven sup-tRNAs induced readthrough in HEK293 cells, and sup-tRNATyr, sup-tRNASer, and sup-tRNAGln were the most potent, inducing readthrough up to 70% (Extended Data Fig. 1a, b). PTC readthrough can also be achieved by small-molecule drugs, such as aminoglycosides and PTC124 among others, some of which have been in clinic use18. Notably, all sup-tRNAs exhibited higher readthrough efficiency than G418 (Extended Data Fig. 1b), an aminoglycoside widely regarded as a potent and gold-standard readthrough compound15. We further showed that nonsense suppression by the representative sup-tRNATyr was dose-dependent (Extended Data Fig. 1c), and highly influenced by the nucleotide immediately following the PTC in a similar manner as G418 (Extended Data Fig. 1d), in agreement with previous studies19,20.
To assess readthrough of full-length nonsense Idua transcript, we generated plasmid expressing 3’FLAG-tagged mouse Idua (mIdua) mRNA carrying the W401X mutation (Fig. 1c). Western blot following co-transfection in HEK293 cells showed that all sup-tRNAs could restore full-length mouse IDUA protein expression, and that sup-tRNATyr was superior to other sup-tRNAs and G418 (Fig. 1d, e). G418-mediated readthrough resulted in the incorporation of diverse amino acids such as Gln, Lys, and Tyr21,22 (Fig. 1f). In contrast, readthrough by most sup-tRNAs inserted a single residue that aminoacylates the parental natural tRNA, consistent with a previous study demonstrating cognate encoding by two sup-tRNAs23; sup-tRNATrp and sup-tRNAGln inserted lysine besides their cognate amino acids, indicating that anticodon modification compromised charging fidelity24 (Fig. 1f). Importantly, mIdua variants encoding different amino acid residues at codon 401 could express to comparable levels, ruling out potential detection bias due to differential expression of variants (Extended Data Fig. 1e). Together, these results demonstrated that sup-tRNAs could induce not only efficient readthrough, but also precise and customizable amino acid residue incorporation at the targeted PTC.
Sup-tRNA treatment in patient fibroblast
To examine therapeutic effect in vitro, we infected IDUAW402X/W402X patient fibroblasts with lentiviral vectors expressing each sup-tRNA (Fig 2a) using a protocol that led to more than 80% transduction efficiency (Ext. Fig. 2a). Previous studies showed that residual IDUA activity in patient fibroblasts as low as 0.5% of normal level was associated with attenuated disease manifestations, including a delayed onset, slow progression, sparing of neurological involvement, and a longer life span up to normal25,26. Treatment with lenti.sup-tRNATyr restored IDUA specific enzyme activity to 6% of normal level, above the IDUA activity observed in all severe MPS-I patients and most attenuated MPS-I patients25,26 (Fig. 2b). In contrast, the effect of other sup-tRNAs and G418 was much less (Fig. 2b), and it was unlikely caused by incorporating detrimental non-wildtype amino acids, because the expression level and enzymatic activity among variants were comparable (Extended Data Fig. 2b–e). Instead, it is plausible that different cell types (e.g., HEK293 cells and human fibroblasts) can process sup-tRNAs differently due to energy status and regulation of aminoacyl tRNA synthetase (aaRS) expression27,28, leading to disparate levels of aminoacylated and functional sup-tRNAs. Therefore, we focused on sup-tRNATyr in the following studies.
Figure 2. Functional characterization of sup-tRNA in MPS-I patient fibroblasts.
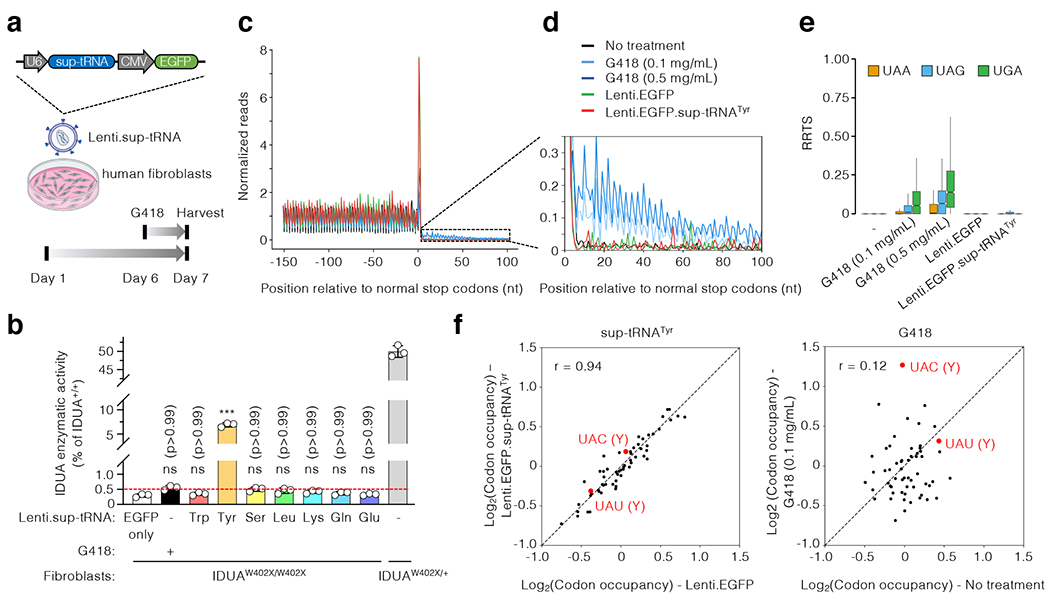
a, Workflow to examine readthrough of the endogenous IDUA-W402X mutation in human fibroblasts by G418 or lentiviral vectors expressing sup-tRNA (Lenti.sup-tRNA). The Lenti.sup-tRNA construct is shown. b, IDUA activity assay in fibroblasts from an MPS-I patient carrying homozygous IDUA-W402X mutation (IDUAW402X/W402X) or carrier (IDUAW402X/+), treated with or without readthrough agent. The y-axis denotes relative activity normalized to untreated IDUAW402X/+ as 50% of normal level (IDUA+/+). Red dashed line indicates that 0.5% of normal IDUA activity was associated with attenuated disease (see text for details). Data are mean ± s.d. of three biological replicates. c, Metagene plot showing normalized reads of ribosome protected fragments (RPFs) relative to the distance from the normal stop codon at position 0. RPFs from untreated MPS-I patient fibroblasts (black), or cells treated for 24 hr with G418 (light blue: 0.1 mg/mL; dark blue: 0.5 mg/mL), Lenti.EGFP (green), or Lenti.EGFP.sup-tRNATyr (red) are overlaid. d, Magnified view of the 3′ untranslated region (UTR) showing increased RPFs in this region in G418-treated cells, but not in cells treated with sup-tRNATyr. e, Box plot of ribosome readthrough score (RRTS) derived from ribosome profiling of patient fibroblasts treated under indicated conditions. Representative results of two biological replicates are shown. RRTS values were calculated for transcripts harboring different normal stop codons, namely UAA (orange), UAG (blue), and UGA (green), respectively. Center line indicates the median, the box ends indicate the first and third quartiles, and the whiskers indicate the range of the remaining data excluding outliers. f, Scatter plots showing RPF densities at each codon (codon occupancy) in patient fibroblasts under indicated conditions. Two tyrosine (Y) codons are highlighted in red. Statistical analysis was performed by one-way ANOVA followed by two-sided Dunnett’s multiple comparisons test (b). ***p < 0.001, ns: not significant.
It was well documented that aminoglycosides such as G41815 and some sup-tRNAs23 can induce readthrough at normal stop codons of transcriptome, posing a safety concern in therapeutic setting. To gain insights into sup-tRNATyr-induced global readthrough, we carried out Ribo-seq14,15 with lenti.sup-tRNATyr-infected patient fibroblasts and compared with G418-treated cells. Two experiments quantifying ribosome protected mRNA fragments (RPFs) using biological replicates correlated very well (Extended Data Fig. 3), demonstrating the robustness of the assay. Consistent with a recent study15, G418 induced discernable transcriptome-wide readthrough at normal stop codons, reflected by increased abundance of RPFs mapped to 3’ untranslated regions (UTRs) (Fig. 2c, d). In addition, readthrough by G418 occurred at all three stop codons (UAG, UAA, UGA), whereas sup-tRNATyr-induced readthrough was specific to UAG and much lower (Fig. 2e). Besides translation termination, G418 also perturbed elongating ribosome occupancy at some codons (Fig. 2f)15. In contrast, sup-tRNATyr did not cause such perturbation, including occupancy at both Tyr codons (Fig. 2f). Therefore, sup-tRNATyr could induce higher on-target readthrough at the IDUA-W402X mutation in patient fibroblasts than G418, with much less off-target effect on global translation termination and elongation.
In vivo efficacy of rAAV9.sup-tRNATyr
To test whether sup-tRNATyr could yield therapeutic outcome in vivo, we generated three AAV vector constructs carrying 1x, 2x, or 4x copies of sup-tRNATyr cassettes driven by U6 or H1 promoter (Extended Data Fig. 4a), because previous studies showed that multimeric design could enhance sup-tRNA expression and readthrough efficiency29. We packaged each construct into AAV9 capsid, and treated adult IduaW401X/W401X female knock-in mice (KI/KI) via tail vein injection of 1x10¹² genome copies (GC) of each AAV9 vector (Extended Data Fig. 4b). Ten weeks later, IDUA activity assay using the liver and heart lysates showed that the 2x construct restored the most enzymatic activity (Extended Data Fig. 4c). The surprisingly lower efficacy of the 4x construct was caused by considerable amount of truncated vector genomes likely due to the presence of repeating sequences (Extended Data Fig. 4d), analogous to the effects of strong secondary structural elements30. Therefore, we focused on the 2x vector design in the following experiments to comprehensively evaluate therapeutic efficacy.
In a cohort of adult male KI/KI mice, rAAV9.2xsup-tRNATyr was injected at 2x10¹² GC per mouse via tail vein (Fig. 3a), and therapeutic efficacy was benchmarked against KI/+ littermates that possess 50% of WT (+/+) IDUA activity and exhibit no phenotype11 (Extended Data Fig. 4e). Ten weeks later, serum IDUA activity was restored from undetectable to 2.5% of WT level, causing significant reduction in urine GAGs (Fig 3b, c). IDUA activity in the liver and heart lysates was restored to 9.5% and 27% of WT levels, respectively, which significantly reduced GAG accumulation (Fig. 3d, e). Notably, GAG accumulation in the liver was completely normalized (Fig. 3e). Lysosomal abnormalities, such as increased lysosome abundance and lysosomal enzymes, are hallmarks of many lysosomal storage diseases including MPS-I11. Immunohistochemistry of LAMP1, a lysosome marker protein, revealed that rAAV9.2xsup-tRNATyr treatment almost completely normalized lysosome abundance in the liver (Fig. 3f), which was corroborated by Western blot (Extended Data Fig. 5a). In addition, activities of glucuronidase and hexosaminidase, two lysosomal enzymes elevated in MPS-I, were significantly reduced to or close to normal levels (Extended Data Fig. 5b, c).
Figure 3. rAAV9.2xsup-tRNATyr treatment rescued MPS-I phenotype in mice.
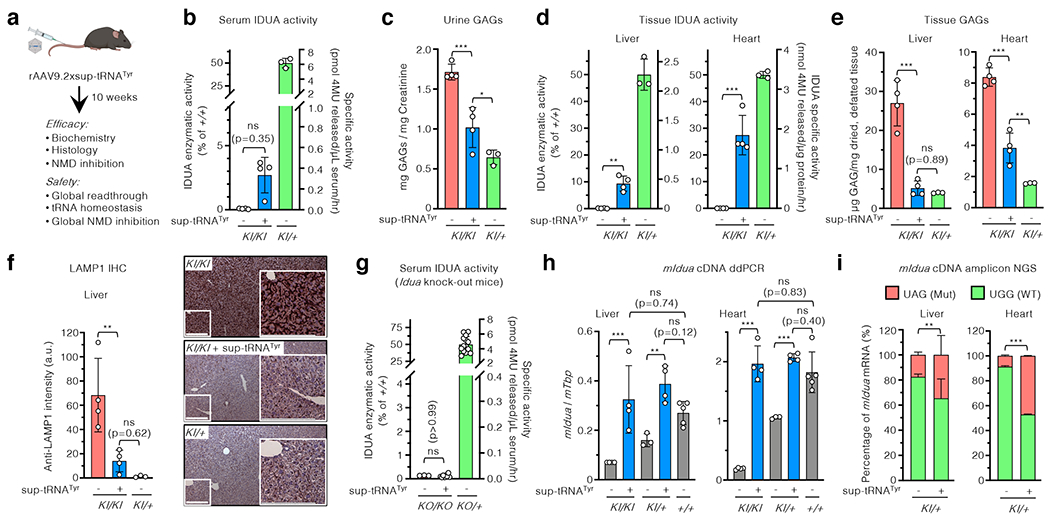
a, Workflow to assess in vivo rAAV9 delivery of the 2xsup-tRNATyr expression cassette in male IduaW401X/W401X knock-in mice (KI/KI). b-f, Serum IDUA enzymatic activity (b), urine GAG levels (c), tissue IDUA enzymatic activity (d), tissue GAG levels (e), and representative LAMP1 immunohistochemistry images and quantification of liver sections (f) in KI/KI mice with (+) or without (−) rAAV9.2xsup-tRNATyr treatment at 10 weeks post treatment (n=4 per group). In b and d, the right y-axis denotes absolute IDUA specific activity, and the left y-axis denotes relative activity normalized to untreated heterozygous mice (KI/+) (n=3) as 50% of wildtype (+/+) level. In f, scale bar=200 μm. g, Serum IDUA activity in KO/KO mice with (+) or without (−) sup-tRNATyr treatment (n=3 and 8, respectively) and KO/+ without sup-tRNATyr treatment (n=14). h, Droplet digital PCR (ddPCR) quantification of mouse Idua cDNA in the liver and heart of KI/KI (n=4), KI/+ (n=4), or +/+ (n=5) mice, with (+) or without (−) rAAV9.2xsup-tRNATyr treatment. i, Next generation sequencing (NGS) quantification of targeted mouse Idua cDNA amplicons in the liver and heart of KI/+ mice, with (+) or without (−) rAAV9.2xsup-tRNATyr treatment (n=4 per group). The percentage of Idua cDNA harboring the W401X mutation [UAG(Mut), orange] or WT sequence [UGG(WT), green] is shown. Statistical analysis in (i) was performed by two-sided Fisher’s exact test. In b-h, statistical analysis was performed by one-way ANOVA followed by two-sided Dunnett’s multiple comparisons test; data are mean ± s.d. of individual animals (circles). *p < 0.05, **p < 0.01, ***p < 0.001, ns: not significant.
In a long-term cohort of male KI/KI mice, serum IDUA activity restoration was largely stable over six months after treatment, and urine GAGs remained significantly reduced at 28 weeks after treatment, the last time point examined (Extended Data Fig. 5d, e).The same treatment regimen showed similar therapeutic outcome in female KI/KI mice, despite being less effective in some assays (Extended Data Fig. 6). This is likely because rAAV9 delivery is less efficient in females than in males31.
Molecular mechanisms of efficacy
In an MPS-I knock-out mouse model (KO/KO), the same treatment had no effect (Fig. 3g), demonstrating that PTC readthrough is the mechanism of action in the KI/KI mice. It was well documented that efficient readthrough at a PTC can antagonize NMD of the PTC-containing transcript15,32. We next sought to determine whether readthrough by sup-tRNATyr could stabilize the NMD-sensitive Idua-W401X transcript11, which would further enhance protein restoration. Indeed, sup-tRNATyr treatment in KI/KI mice led to significant increase of the nonsense Idua mRNA in the liver (4.6-fold) and heart (10.2-fold) to the levels in WT mice (Fig. 3h). The same treatment regimen in KI/+ mice also increased the total Idua mRNA abundance (Fig. 3h), restoring the nonsense Idua mRNA close to or at the WT Idua mRNA levels in the liver and heart, respectively (Fig. 3i). These results suggested that PTC readthrough and nonsense Idua mRNA stabilization via NMD inhibition synergistically contributed to the therapeutic effects, likely because PTC readthrough antagonized NMD during the pioneer round of translation33,34.
Safety following rAAV9.sup-tRNA treatment
Importantly, we did not observe gross toxicity by histological analysis and clinical serum biochemistry following systemic delivery of rAAV9.2xsup-tRNATyr (Extended Data Fig. 7). To gain more insights into the safety profile, we performed a series of molecular analysis. First, consistent with the findings in patient fibroblasts (Fig. 2c–f), Ribo-seq showed that global readthrough in the treated mouse liver (n=3) was largely restricted to UAG, sparing the UAA and UGA stop codons, and that codon occupancy by elongating ribosomes was not altered (Extended Data Fig. 8). Second, we performed tRNA-seq16 using livers of treated and untreated mice (n=3 each) to evaluate the impact of rAAV9.2xsup-tRNATyr treatment on endogenous tRNAs. When tRNAs were categorized by anticodons, none was significantly changed upon treatment (Fig. 4a). Interestingly, a subset of tRNA isodecoders (tRNAs that share the same anticodon but have different body sequences) showed mild differential expression between the two groups (Fig. 4b). Therefore, the mild changes of a small number of tRNA isodecoders (38 out of 243, adjusted p<0.05) seemed to buffer the total tRNA pool to maintain stable tRNA abundance at the anticodon level, a phenomenon also described in a recent study16. Third, we quantified the charging efficiency of sup-tRNATyr and its parental isodecoder, because the altered anticodon and lack of intron in the sup-tRNATyr may compromise charging efficiency35; accumulation of uncharged tRNA can cause cellular stress36. We found that both species were charged at similar levels in treated or untreated mouse livers (Fig. 4c), likely because the major identity elements in eukaryotic tRNATyr are not the anticodon37. Notably, the steady-state sup-tRNATyr was only a small fraction relative to the parental tRNATyr isodecoder (Fig. 4d), unlikely saturating the tyrosyl tRNA synthetase. Fourth, we performed mRNA-seq to examine whether sup-tRNATyr would upregulate some endogenous NMD substrates with a UAG normal stop codon38. In the rAAV9.2xsup-tRNATyr-treated mouse livers, we detected 23 upregulated transcripts with at least a 2-fold significant change compared to rAAV9.mCherry-treated controls, representing 0.06% of all detected transcripts (Fig. 4e). We also performed mRNA-seq on human fibroblasts upon lenti.sup-tRNATyr treatment, which revealed 148 upregulated transcripts compared to lenti.EGFP treatment; 14 of them were previously identified as putative NMD substrates39, among which only 2 transcripts contain UAG as the normal stop codon, arguing against global NMD inhibition (Extended Data Fig. 9). Lastly, a previous study showed that severely compromising global translation termination accuracy by knocking down eRF3 in mouse liver could elicit unfolded protein response (UPR) as measured by elevated Chop expression40. However, we observed no significant elevation of Chop or Bip, two critical UPR markers (Fig. 4f).
Figure 4. Transcriptome changes in the liver following sup-tRNATyr treatment.
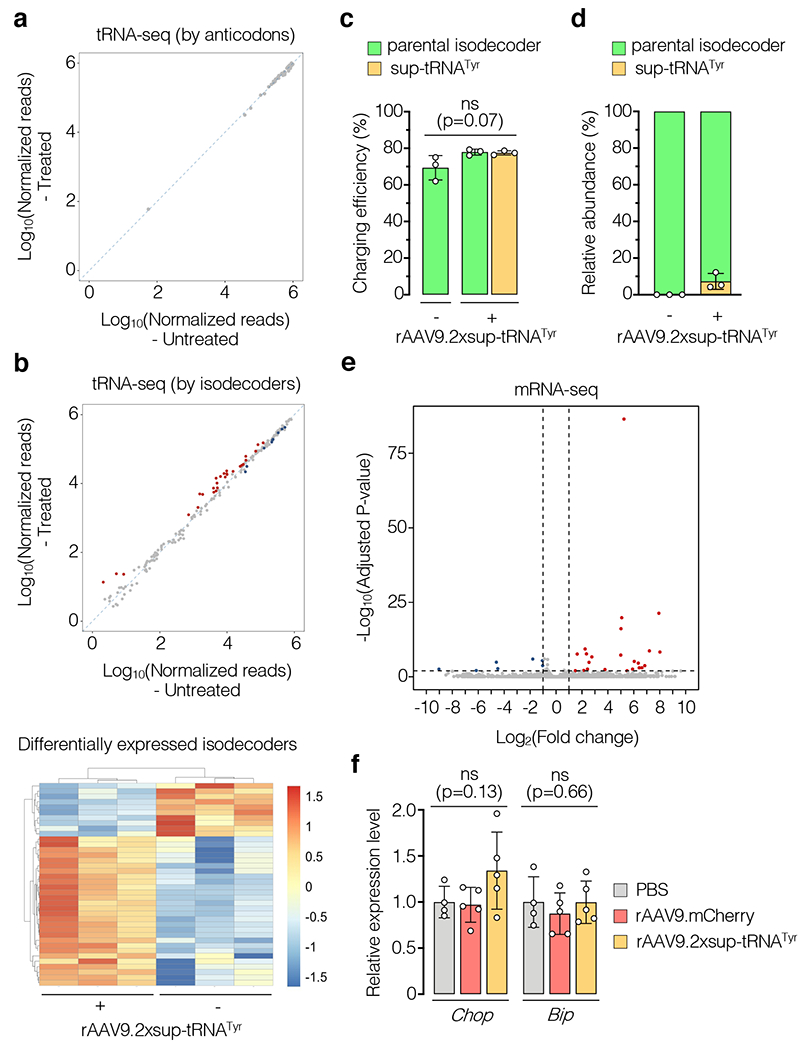
a, Differential expression analysis of unique tRNA transcripts grouped by anticodons in rAAV9.2xsup-tRNATyr-treated mouse livers relative to untreated mouse livers (n=3 per group). b, Same as a, but grouped by unique isodecoders (top panel). Red and blue dots denote significantly upregulated and downregulated isodecoders (adjusted p<0.05), respectively. The bottom panel shows a heat map of differentially expressed isodecoders in treated and untreated mouse livers. c, Quantification of charging efficiency of the parental tRNATyr isodecoder and sup-tRNATyr in mouse livers with (+) or without (−) rAAV9.2xsup-tRNATyr treatment (n=3 per group). d, Quantification of the relative expression levels of sup-tRNATyr and the parental tRNATyr isodecoder in mouse livers as described in c (n=3 per group). e, Volcano plot showing differentially expressed transcripts revealed by RNA-seq in rAAV9.2xsup-tRNATyr-treated mouse livers compared to rAAV9.mCherry-treated ones (n=5 per group). Red and blue dots denote significantly upregulated and downregulated genes (adjusted p<0.01 and fold change>2), respectively. f, Reverse-transcription and ddPCR of Chop and Bip mRNA in livers of PBS (n=4), rAAV9.mCherry (n=5), and rAAV9.2xsup-tRNATyr (n=5) treated mice. Data are mean ± s.d. of individual animals (circles) in c, d and f. Statistical analysis was performed by one-way ANOVA. ns: not significant.
Improving gene delivery and efficacy
Although intravenous (IV) delivery of rAAV9.2xsup-tRNATyr restored IDUA activity to 9.5% and 27% of WT levels in the liver and heart, respectively (Fig. 3d), the tibialis anterior (TA) muscle was less responsive, showing only 0.5% of WT IDUA activity after treatment (Extended Data Fig. 10a). To investigate whether gene delivery was a limiting factor, we performed intramuscular (IM) injection of rAAV9.2xsup-tRNATyr into the TA muscle. IM delivery restored IDUA activity in the injected TA muscle up to 5% of WT level, which correlated with higher gene delivery efficiency than the IV route (Extended Data Fig. 10a, b). Delivery by AAVMYO41, a more muscle-tropic capsid, under the same condition as IV rAAV9 treatment restored IDUA activity in the TA muscle to 7% of WT level (Extended Data Fig. 10c).
Similarly, the brain was poorly responsive to IV delivery of rAAV9.2xsup-tRNATyr, likely due to inefficient gene delivery, because the same construct delivered by AAV.PHPeB42, an engineered capsid that crosses the blood-brain-barrier in certain mouse strains 100-fold more efficiently than AAV9, restored brain IDUA activity up to 1.3% of WT level (Extended Data Fig. 10d–e). Alternatively, unilateral intrahippocampal injection of rAAV9.2xsup-tRNATyr resulted in even higher IDUA activity in the injected hippocampus, reaching 10% of WT level (Extended Data Fig. 10f). Together, these experiments suggested that the sup-tRNATyr functions in multiple tissues, and it is feasible to achieve therapeutic readthrough levels in various tissues through optimizing gene delivery.
DISCUSSION
Here, we combined rAAV-based gene delivery and sup-tRNA-mediated PTC readthrough to develop AAV-NoSTOP, which overcame a pathogenic nonsense mutation when administered in vivo via synergistic PTC readthrough and NMD inhibition. Importantly, AAV-NoSTOP demonstrated a good safety profile and stable efficacy more than six months after treatment. It obviates the need to deliver a full-length cDNA that may exceed the packaging limit of rAAV such as CFTR for cystic fibrosis, or elicit immune responses such as CRISPR-associated (Cas) proteins for gene editing43,44. In contrast to gene replacement therapy, AAV-NoSTOP operates on endogenous transcripts, and therefore restores gene function under physiological expression regulation, avoiding potential toxicity related to overexpression and/or off-target expression of a cDNA such as MECP2 for Rett syndrome45. Although the UAG-targeting sup-tRNATyr was developed for MPS-I, the same therapeutics can be potentially applied to a broad range of diseases caused by a common TAG nonsense mutation in various genes.
A major concern for all readthrough agents is their impact on normal termination codons (NTCs) throughout the transcriptome. We performed Ribo-seq and found that, while G418 induced high global readthrough at all three stop codons, sup-tRNATyr caused much less and UAG-restricted global readthrough. It should be noted that Ribo-seq interrogates readthrough events at the mRNA level. Several studies showed that C-terminus extended proteins generated by NTC readthrough can be recognized and degraded by cellular surveillance mechanisms, ensuring the high fidelity of proteome46–48. Therefore, Ribo-seq represents a rigorous measurement of global readthrough, and the proteomic changes induced by sup-tRNA are likely more limited and deserve future studies, because unique unnatural peptides generated by off-target readthrough may result in adverse consequences or elicit immune responses.
Besides high readthrough efficiency and specificity, another advantage of sup-tRNA over G418 is the precise and customizable incorporation of an amino acid residue at the PTC. This is important when inserting non-WT amino acids at a PTC compromises protein function or confers a dominant-negative effect49. It is conceivable to develop an AAV-NoSTOP toolbox comprising a panel of sup-tRNAs derived from various natural tRNAs that not only target any PTC (UAG, UAA, or UGA), but also insert desired amino acid residue(s). Although 19 sup-tRNAs should rescue all known pathogenic PTCs by inserting WT amino acid residues (Supplementary Table 5), we note that not all diseases caused by a PTC are amenable to AAV-NoSTOP due to limitations of gene delivery and therapeutic threshold among other factors. Because effective tRNA charging is largely determined by aaRS recognizing tRNA identity elements, and a single cytosolic aaRS charges a unique set of tRNA isoacceptors (tRNAs charged with the same amino acids, but harbor different anticodons), we initially chose one tRNA from each of the seven isoacceptor sets. While our study was not designed to comprehensively survey the entire tRNA repertoire, a previous study showed that sup-tRNAs derived from many natural tRNAs possess readthrough activity in HEK293 cells, and that a sup-tRNAArg could readthrough a co-delivered PTC reporter cDNA when electroporated as plasmid into mouse skeletal muscle23. These and other sup-tRNAs remain to be tested for their in vivo safety and therapeutic efficacy in rescuing endogenous PTC transcripts.
Although naturally occurring AAV capsids dominate the current clinical AAV gene therapy landscape, numerous engineered AAV capsids with enhanced tropism have emerged2, some of which are under clinical testing50. When combined with the rapidly advancing AAV-based gene delivery technology, the envisioned AAV-NoSTOP toolbox is expected to be a valuable addition to gene-based therapeutics.
METHODS
Cell culture and transfection
HEK293 cells were maintained in Dulbecco’s Modified Eagle Medium (DMEM) (Gibco, Cat. No. 11965-084) supplemented with 10% (v/v) fetal bovine serum (Gibco, Cat. No. 26140-079) and antibiotics (Penicillin Streptomycin, Thermo Fisher Scientific, Cat. No. 15140122) at 37 °C with 5% CO2. HEK293 cells were transfected using PEI (Polysciences, Cat. No. 23966-1). Patient and control fibroblasts (GM00798, GM00799, GM01099) were purchased from Coriell Institute and were maintained in Eagle’s Minimum Essential Medium (EMEM) (ATCC, Cat. No. 30-2003) supplemented with 15% (v/v) fetal bovine serum (Gibco, Cat. No. 26140-079) and antibiotics (Penicillin Streptomycin, Thermo Fisher Scientific, Cat. No. 15140122) at 37 °C with 5% CO2. Patient fibroblasts were infected with lentiviral vectors in the presence of 8 μg/mL polybrene (Sigma-Aldrich, Cat. No. TR-1003-G). G418 (Life Technologies, Cat. No. 10131-027) was added to culture media to a final concentration of 0.1 mg/mL or 0.5 mg/mL as indicated 24 hours prior to harvest.
Western blot
Cell cultures were lysed in ice-cold 1% NP-40 buffer (50 mM Tris HCl, 150 mM NaCl, 1% NP-40, pH 7.6) with protease inhibitor (Roche, Cat. No. 4693159001). Tissues were homogenized in ice-cold T-PER protein extraction reagent (Thermo Fisher Scientific, Cat. No. 78510) with protease inhibitor (Roche, Cat. No. 4693159001) using TissueLyser II (Qiagen). Total protein concentration was determined by bicinchoninic acid (BCA) method (Pierce, Cat. No. 23225). Normalized protein lysate was boiled with 4x Laemmli Sample Buffer (Bio-rad, Cat. No. 1610747) at 95 °C for 10 min. Primary antibodies rat anti-LAMP1 (BD Pharmingen, RUO - 553792) (1:2,000 dilution), mouse anti-FLAG M2 (Sigma, Cat. No. F1804) (1:5,000 dilution), rabbit anti-GAPDH (Abcam, Cat. No. ab9485) (1:5,000 dilution) and secondary antibodies LICOR IRDye 680RD Goat Anti-Rat IgG (H + L) (LI-COR Biosciences, Cat. No. 926-68076) (1:5,000 dilution), LICOR IRDye 680RD Goat Anti-Mouse IgG (H + L) (LI-COR Biosciences, Cat. No. 926-68070) (1:5,000 dilution), LICOR IRDye 800CW Goat Anti-Rabbit IgG (H + L) (LI-COR Biosciences, Cat. No. 926-32211) (1:5,000 dilution) were used in Western blot. Blot membrane was scanned with a LI-COR scanner (Odyssey). Western blot quantification analysis was performed with Image Studio Lite (LI-COR).
Immunoprecipitation (IP) and mass spectrometry (MS)
Plasmids expressing sup-tRNA and mouse Idua cDNA (WT or nonsense mutant) fused to FLAG-tag, respectively, were co-transfected in HEK293 cells. Cells were harvested 72h post transfection and lysed in 1% NP-40 buffer (50 mM Tris HCl, 150 mM NaCl, 1% NP-40, pH 7.6) with protease inhibitor (Roche, Cat. No. 4693159001). mIDUA-FLAG protein was purified with ANTI-FLAG M2 Affinity Gel beads (Sigma-Aldrich, Cat. No. A2220-5ML), boiled with 4x Laemmli Sample Buffer (Bio-rad, Cat. No. 1610747) at 95 °C for 10 min, and subjected to sodium dodecyl sulphate-polyacrylamide gel electrophoresis (SDS-PAGE). Gels were stained by Coomassie blue to visualize the mIDUA-FLAG bands, which were cut out and processed for MS. Samples were in-gel digested with either trypsin or AspN, and the peptides were lyophilized in a SpeedVac and resuspended in 16 μL of 5% acetonitrile with 0.1% (v/v) formic acid for mass spectrometry analysis. Data was acquired using a NanoAcquity UPLC (Waters Corporation, Milford, MA) coupled to an Orbitrap Fusion Lumos Tribrid mass spectrometer (Thermo Fisher Scientific, Waltham, MA). Raw data was processed using Thermo Proteome Discoverer 2.1.1.21 (Thermo) and the database search was performed by Mascot 2.6.2 (Matrix Science, London, UK) using the Swiss-Prot human database (accessed on April 9, 2019), appended with mouse IDUA protein sequences containing single amino acid substitution at W401 position with other naturally occurring 19 amino acids. Peptide and protein validation and annotation was done in Scaffold 4.8.9 (Proteome Software, Portland, OR) employing Peptide Prophet51 and Protein Prophet52 algorithms. Peptides were filtered at a 1% false discovery rate (FDR), while protein identification threshold was set to greater than 99% probability and with a minimum of 2 identified peptides per protein. Skyline (University of Washington) was used to integrate peptide peak areas covering the mouse IDUA 401 position and the results were used to estimate the relative abundance of the variants.
Flow cytometry
Cells were detached in trypsin and collected in 2 ml centrifuge tubes. Cell pellets were washed with PBS (Corning, Cat. No. 21-031-CV) and resuspended in FACS buffer (PBS + 2% FBS). Flow cytometry was performed on an Attune NxT Flow Cytometer (Thermo Fisher Scientific) and data was analyzed using the Attune NxT software (Thermo Fisher Scientific).
Luciferase assay
The dual luciferase reporter expresses the Cypridina luciferase (Cluc, as transfection control) and Gaussia luciferase (Gluc), which are separated by the T2A sequence and part of mouse Idua cDNA of wild-type (WT) sequence or mutant counterpart with a nonsense mutation. This reporter plasmid was co-transfected with plasmid expressing sup-tRNA into HEK293 cells. G418 (Life Technologies, Cat. No. 10131-027) was added to cell culture media upon transfection. Cell culture media was collected at 24h post-transfection. Cluc was measured with the Pierce® Cypridina Luciferase Glow Assay Kit (Thermo Scientific, Cat. No. 16171) and Gluc was measured with the Pierce™ Gaussia Luciferase Flash Assay Kit (Thermo Scientific, Cat. No. 16159) using a plate reader (BioTek) following manufacturer’s instruction. The ratio of GLuc over CLuc with the 401-stop construct normalized to that of the 401-sense construct reflects readthrough efficiency.
Lentiviral vectors
Sup-tRNA driven by U6 promoter and EGFP driven by CMV promoter were cloned into the lentiviral transfer plasmid pLenti-CSCGW2. The 3rd generation system was used to package lentiviral vector. Packaging plasmids (pMDLg/Prre and pRSV/REV) and envelope plasmid (pHCMV/VSVG) were co-transfected with transfer plasmid to HEK293T cells using CaCl2 method. Medium was collected at 48h and 72h post-transfection and ultra-centrifuged to concentrate virus. Virus titer was determined using QuickTiter™ Lentivirus Titer Kit (CELL BIOLABS, INC. Cat. No. VPK-107).
Sample preparation for ribosome profiling
Samples were processed as previously described15,53 with several modifications. Human fibroblasts cultured at 60-80% confluence in vitro were infected with lentiviral vectors at multiplicity of infection (MOI) of 200 in the presence of 8 μg/ml of polybrene for 6 days. G418 was added at low (0.1 mg/mL) or high (0.5 mg/mL) concentration 24 hours prior to harvest. Cells were dislodged by scrapping, transferred to 15 mL conical tubes, and pelleted via centrifugation at 400×g for 5 min under room temperature. Media was aspirated and cells were lysed in 400 μL of fresh-made ice-cold lysis buffer [20 mM Tris-Cl pH 7.4, 150 mM NaCl, 5 mM MgCl2, 1 mM DTT, 100 μg/mL cycloheximide (Sigma-Aldrich, C4859-1ML), 1% Triton X-100, 2.5 U/mL Turbo DNase I (Invitrogen, AM2238)] on ice for 10 min. MPS-I mouse livers were ground in liquid nitrogen, and approximately 30 mg of tissue powder was lysed in 400 μL of ice-cold lysis buffer for 10 min. Lysates were centrifuged at 21,000×g for 10 min under 4°C. The soluble ribosome supernatant was aliquoted, flash-frozen in liquid nitrogen, and stored under −80°C until assay.
Library preparation for ribosome profiling
Supernatant containing 20 μg of total RNA was diluted to a final volume of 400 μL in fresh-made polysome buffer (20 mM Tris-Cl pH 7.4, 150 mM NaCl, 5 mM MgCl2, 1 mM DTT, 100 μg/mL cycloheximide), digested with 1.5 μL of RNase I (Epicentre, N6901K, 10U/μL), and incubated for 45 min at room temperature with gentle agitation. Digestion was stopped by adding 10 μL of SUPERase× RNase inhibitor (Invitrogen, AM2696, 20U/μL). The fragmented lysates were underlaid with 1.2 mL of 1M sucrose cushion in 13 x 56 mm polycarbonate ultracentrifuge tubes (Beckman Coulter, 362305), centrifuged at 100,000 RPM for 1 hr under 4°C in a TLA 100.3 rotor using a Beckmann-Coulter Optima MAX ultracentrifuge. Supernatant was removed by gentle pipetting, and ribosome protected fragments (RPFs) were extracted from the pellet using the miRNeasy mini kit (Qiagen, 217004). RNA corresponding to 26-34 nucleotides long was size-selected following separation by denaturing 15% TBE-Urea polyacrylamide gel electrophoresis (PAGE). RNA fragments were dephosphorylated using T4 PNK (New England Biolabs, M0201S), and ligated to pre-adenylated 3′-universal miRNA cloning linker (New England Biolabs, S1315S) by T4 RNA ligase 2, truncated (New England Biolabs, M0242S) at room temperature for 3 hours. The linker-ligated RPFs were purified by denaturing 15% TBE-Urea PAGE and reverse-transcribed (RT) to cDNA by SuperScript III (Invitrogen, 18080-093) at 55°C for 30min. RT products were hydrolyzed by NaOH followed by denaturing 15% TBE-Urea PAGE purification. The cDNAs were then circularized by CircLigase ssDNA ligase (Epicentre, CL4115K) and rRNA depletion was performed with biotinylated subtraction oligo pool. The circularized cDNAs were purified by ethanol precipitation and amplified by PCR using Phusion high-fidelity polymerase (New England Biolabs, M0530S). The libraries were quantified with high sensitivity DNA fragment analysis assay. The barcoded libraries were pooled at equimolar ratios, and sequenced using NextSeq500 (Illumina). Sequencing data were collected using the Illumina Nextseq Control software (4.0.2).
Analysis of ribosome profiling data
3′ adapter sequences were removed using Trimmomatic (with parameters ILLUMINACLIP, minlength, 10; seed mismatches, 2; palindrome clip threshold, 30; simple clip threshold, 5). Then 1 nucleotide from the 3’ end of each read was trimmed using FASTX-Toolkit Trimmer (http://hannonlab.cshl.edu/fastx-toolkit). The trimed reads that mapped to noncoding RNA sequences (rRNA, from RefSeq; Mt_rRNA, Mt_tRNA, rRNA, miRNA, scRNA, scaRNA, snoRNA, snRNA, sRNA, vaultRNA from GENCODE v30 were discarded. STAR54 was used for this alignment step with following parameters: --limitBAMsortRAM 20000000000 --outFilterMismatchNmax 1 --outFilterMultimapNmax 100 --alignIntronMax 1 --outWigType wiggle read1_5p. The remaining reads were mapped to the hg38 human or mm10 mouse genome using annotations from GENCODE (v30 and m25), respectively. For this step, STAR was used with following parameters to keep only uniquely mapped reads: --alignSJDBoverhangMin 1 --alignSJoverhangMin 8 --outFilterType BySJout --outFilterMultimapNmax 200 --outSAMmultNmax 1 --outMultimapperOrder Random --outWigType wiggle read1_5p. Following alignment, reads were assigned to a custom transcriptome annotation based on the method described55 where single transcripts are selected for each protein-coding gene. Then reads of 15nt-40nt long were assigned to protein-coding transcripts and densities for ribosomal A or P sites were calculated as described15. By using density data, relative 3′UTR density was calculated by dividing normalized 3′UTR density by CDS density and plotted. Similarly, RRTS values were calculated for each transcript by dividing the density of 3′UTR between the NTC and first in-frame downstream 3′TC by CDS density. Differences between RRTS values of each sample were tested with the Mann-Whitney U test for each stop codon. Average codon occupancies were calculated using the ribosome densities of each codon divided by the average density for the CDS of each transcript. These ratios for each transcript were averaged to get the codon occupancies for each codon. Data analysis was performed on the Ribosome-Profiling pipeline of the DolphinNext55, available at https://github.com/dolphinnext/ribosome-profiling and https://dolphinnext.umassmed.edu/index.php?np=1&id=695. The pipeline was adapted from https://github.com/jrw24/G418_readthrough15.
AAV vectors
AAV vector construct contains a sup-tRNA gene driven by the human U6 promoter, and mCherry driven by the cytomegalovirus-enhancer/chicken beta-actin promoter. This cassette was packaged into a single-stranded AAV9 vector. The sup-tRNA sequences are shown in Supplementary Table 1. AAV vectors were produced by a triple-transfection method, purified by CsCl sedimentation and dialysis. Titer of rAAV was determined by droplet digital PCR (for rAAV genome) and gel electrophoresis followed by silver staining (for rAAV capsid).
AAV vector DNA analysis by denaturing agarose gel electrophoresis
1% agarose gel (Thermo Fisher, Cat. No. 16500-100) was boiled with ultra-pure water and cooled to 55°C, to which 0.1 volume of 10X alkaline gel electrophoresis buffer (500 mM NaOH and 10 mM EDTA) was added. Viral vector DNA was extracted from purified AAV vectors using the QIAamp DNA mini kit (Qiagen, Cat. No. 51306). Extracted DNA was mixed with 6X Alfa Aesar Agarose gel loading dye, alkaline (Fisher Scientific, Cat. No. AAJ62157AB), and resolved on the 1% alkaline agarose gel. After running at <3.5V/cm on ice for 3h, the alkaline agarose gel was soaked in neutralization solution (BioWorld, Cat. No. 10750014) for at least 45 minutes at room temperature. Gel was post-stained using SYBR Gold (Thermo Fisher, Cat. No. S11494), and analyzed using the ChemiDoc™ Touch Imaging System (Bio-rad).
Animal use
MPS-I IduaW401X mice (Stock No. 017681)11 and IduaKO mice (Stock No. 004068)56 were purchased from the Jackson Laboratory and bred in-house. The IduaKO allele carries an insertional neo cassette that disrupts the Idua gene. Treatment conditions can be found in Supplementary Table 2. To harvest tissues, mice were transcardially perfused with ice-cold PBS, and tissues were immediately dissected, snap-frozen in liquid nitrogen, and stored under −80 °C. All animal procedures were reviewed and approved by The Institutional Animal Care and Use Committee (IACUC) at University of Massachusetts Medical School, and performed in compliance with all relevant ethical regulations.
Enzymatic activity assays
The α-L-iduronidase, β-D-glucuronidase, and β-D-hexosaminidase activity assays were performed as previously described11,57,58 with minor modifications. Patient fibroblasts were lysed in ice-cold M-PER protein extraction reagent (Thermo Fisher Scientific, Cat. No. 78501) with protease inhibitor (Roche, Cat. No. 11873580001). Tissues were homogenized in ice-cold T-PER protein extraction reagent (Thermo Fisher Scientific, Cat. No. 78510) with protease inhibitor (Roche, Cat. No. 4693159001) using TissueLyser II (Qiagen). Supernatant was used to quantify total protein concentration using the bicinchoninic acid (BCA) method (Pierce, Cat. No. 23225). For α-L-iduronidase enzyme activity assay, tissue lysates containing no more than 80 μg of total protein or 10 μL of serum was used in the enzymatic reaction (100 μL of total reaction volume), which includes sodium formate buffer, pH 3.5 (130 mM), D-saccharic acid 1,4-lactone monohydrate (0.42 mg/mL, Sigma-Aldrich, Cat. No. S0375), and 4MU-iduronic acid (0.12 mM, Santa Cruz Biotechnology, Cat. No. sc-220961). The reaction was incubated under 37 °C for 17-24 h, and quenched with glycine buffer, pH 10.8. For β-D-glucuronidase and β-D-hexosaminidase activity assays, substrates 4MU-β-D-glucuronide (1 mM, Sigma, Cat. No. M9130) and 4MU-β-D-hexosaminide (4 mM, Sigma, Cat. No. M2133) were used, respectively. Protein in reaction was 0.6 μg or 6 μg and incubation time was 30 min. The fluorescence of released 4MU (excitation wavelength: 365 nm; emission wavelength: 450 nm) was detected using a fluorescence plate reader (BioTek), and compared against a standard curve generated using 4MU (Sigma-Aldrich, Cat. No. M1381). The specific enzyme activity was calculated as 4MU released (pmole) per milligram of total protein per hour.
Glycosaminoglycan (GAG) assay
The GAG assay was performed using a protocol previously described58. Tissues were homogenized in a mixture of chloroform and methanol (2:1) using TissueLyser II (Qiagen), and dried in a Vacufuge (Eppendorf) to remove fat. The dried and defatted tissue was weighed, and digested using papain (Sigma-Aldrich, Cat. No. P3125) at 60°C overnight. The supernatant was used in the Blyscan assay to quantify GAG content using chondroitin-4-sulfate as standard (Accurate Chemical, Cat. No. CLRB1000). The GAG level was calculated as GAGs (microgram) per milligram of dried, defatted tissue. Urine was collected by holding mouse over a petri dish, transferred to an Eppendorf tube, and centrifuged at 13,000 rpm for 15 min. Clear urine sample was stored under −80°C until assay using the Blyscan assay.
Droplet digital PCR (ddPCR)
DNA and RNA from human fibroblasts or mouse tissues was extracted using the AllPrep DNA/RNA Mini kit (Qiagen, Cat. No. 80204). Viral vector genome copy number was determined in a multiplexed reaction using Taqman reagents targeting mCherry and Tfrc (Thermo Fisher Scientific, Cat. No. 4458367), respectively. RNA was reverse-transcribed using High Capacity cDNA Reverse Transcription Kit (Fisher Scientific, Cat. No. 43-688-13). Mouse Idua cDNA was quantified in a multiplexed reaction using Taqman reagents targeting Idua (Thermo Fisher Scientific, Assay ID: Mm01198845_m1) and mTbp (Thermo Fisher Scientific, Assay ID: Mm01277042_m1), respectively. Mouse Chop cDNA was quantified in a multiplexed reaction using Taqman reagents targeting Chop40 (forward primer: TGAGCCTAACACGTCGATTATATCA, reverse primer: TCTGGAACACTCTCTCCTCAGGTT, Probe: CAGCGACAGAGCCAGAATAACAGCCG) and mTbp (Thermo Fisher Scientific, Assay ID: Mm01277042_m1), respectively. Mouse Bip (Hspa5) cDNA was quantified in a multiplexed reaction using Taqman reagents targeting Bip (Hspa5) (Thermo Fisher Scientific, Assay ID: Mm00517691_m1) and mGapdh (Thermo Fisher Scientific, Assay ID: Mm99999915_g1), respectively. rAAV.sup-tRNATyr genome copy (GC) was quantified in a multiplexed reaction using Taqman reagents targeting mCherry (forward primer: CAGAGGCTGAAGCTGAAGGA, reverse primer: GCTTCTTGGCCTTGTAGGTG, Probe: CGGCGGCCACTACGACGCTG) and mTfrc (Thermo Fisher Scientific, Cat. No. 4458367), respectively. ddPCR was performed with a QX200 ddPCR system (Bio-Rad).
Idua amplicon sequencing
Total RNA was extracted using the AllPrep DNA/RNA Mini Kit (Qiagen, Cat. No. 80204) with on-column DNA digestion using the RNase-Free DNase Set (Qiagen, Cat. No. 79254). Oligo d(T)23 VN (New England Biolabs, Cat. No. S1327S) was used to reverse-transcribe mRNA into cDNA using the High-Capacity cDNA Reverse Transcription kit (Thermo Fisher Scientific, Cat. No. 4368813). KAPA HiFi HotStart ReadyMix (Roche, Cat. No. 7958935001) was used to amplify a portion of the Idua cDNA spanning the nonsense mutation (W401X in mouse and W402X in human) (primers are listed in Supplementary Table 3. Amplicons were purified with DNA Clean & Concentrator Kit (Zymo Research, Cat. No. D4014) and subjected to next-generation sequencing by Massachusetts General Hospital CCIB DNA Core under standard conditions.
Histology and immunohistochemistry (IHC)
Mouse tissues were fixed in 10% formalin buffer (Fisher Scientific, Cat. No. SF100-20) overnight and embedded in paraffin. Sectioning, hematoxylin and eosin (HE) staining, IHC were performed by the Morphology Core at University of Massachusetts Medical School under standard conditions. Rat anti-LAMP1 antibody (BD Pharmingen, RUO-553792, 1:500 dilution) was used in IHC. Images were acquired on a Leica DM5500 B microscope. Blind evaluation of HE staining sections were performed by a certified pathologist (Z.J.). Quantification of LAMP1 IHC was performed using the ImageJ software as previously described59.
Clinical serum biochemistry
Mouse blood was collected into a BD SST™ microtainer (BD Pharmingen, Cat. No. 365967), and centrifuged at 8,000 rpm for 5 min to isolate serum. Clinical serum biochemistry analysis was performed by IDEXX BioAnalytics (60514-Rodent Expanded Tox Panel).
Library preparation for tRNA sequencing
Libraries for tRNA sequencing were prepared as described16 with minor modifications. Total RNA from approximately 30 mg of liver tissue powder was isolated using TRIzol and Phasemaker tubes (Thermo Scientific, A33251) according to the manufacturer’s instructions. After RNA oxidation with 50 mM NaIO4 (freshly prepared) and β-elimination with 100 mM sodium borate, pH 9.5 (freshly prepared), a mixture of two synthetic RNA standards with intact 3’-CCA (5’- GUAAUUAUACUCAUAAAUUCGUUGUACGUGAUGCCUAAUUCCUCCA-3’) or a 3’-CC (5’- GUAAUUAUACUCA UAAAUUCGUUGUACGUGAUGCCUAAUUCCUCC-3’) were added to total RNA in a 3:1 molar ratio at 0.06 pmol/μg total. Total RNA was subsequently dephosphorylated using 10 U of T4 PNK (New England Biolabs, M0201S) at 37°C for 30 min and purified by ethanol precipitation in 0.3 M sodium acetate, pH 4.5, with 25 mg of GlycoBlue (Invitrogen, AM9515). Mature tRNAs were purified by denaturing 10% TBE-Urea PAGE followed by ligation with the I4 3’ adapter using T4 RNA ligase 2, truncated KQ (New England Biolabs, M0373L). For primer-dependent reverse transcription, adapter-ligated tRNAs were incubated with TGIRT (InGex, TGIRT50) in low-salt buffer (50 mM Tris-HCl, pH 8.0, 75 mM KCl, 3 mM MgCl2) at 42°C for 16 hours. Ethanol purified cDNA was circularized with CircLigase ssDNA ligase (Epicentre, CL4115K) followed by PCR using a common forward primer (5’-AATGATACGGCGACCACCGAGATCTACACTCTTTCCCTA CACGACGCT*C-3’) and unique indexed reverse primers (5’-CAAGCAGAAGACGGCATACGAGATNNNNNNGTGACTGGAGTTCA GACGTGT*G-3’), asterisks denoting a phosphorothioate bond and NNNNNN being reverse complementary to an Illumina index sequence). Amplified libraries were purified with 8% PAGE and ethanol precipitation. Libraries were dissolved in 15 μL of 10 mM Tris-HCl, pH 8.0, quantified with the high sensitivity fragment analysis assay, pooled at equimolar ratios, and sequenced for 150 cycles on NextSeq 500.
Analysis of tRNA-seq data
3′ adapter sequence (GATTCTAGCAAGATCGGAAGAGCACACGTCTGAA) were removed using Trimmomatic (with parameters ILLUMINACLIP, minlength, 10; seed mismatches, 2; palindrome clip threshold, 30; simple clip threshold, 5)60. Two nucleotides from the 5’ end of each read were trimmed using FASTX-Toolkit Trimmer. Then, Trimmomatic was used for quality filtering (with parameters SLIDINGWINDOW:10:15; LEADING, 5; TRAILING, 5; MINLEN, 10). Custom tRNA fasta and intron files prepared for tRNAseq pipeline by adding the sup-tRNATyr and oligo-standard sequences. tRNAscan-SE 2.0 (http://lowelab.ucsc.edu/tRNAscan-SE/) was used for getting intron-related information required by mim-tRNAseq. Quality filtered reads were mapped and analyzed with mim-tRNAseq pipeline with parameters; --cluster --cluster-id 0.95 --threads 10 --min-cov 2000 --max-mismatches 0.1 --max-multi 1 --remap --remap-mismatches 0.075. Data analysis was performed on the tRNA-Seq Pipeline of the DolphinNext55, available at https://github.com/dolphinnext/trnaseq and https://dolphinnext.umassmed.edu/index.php?np=1&id=744. The pipeline was adapted from https://github.com/nedialkova-lab/mim-tRNAseq16.
Messenger RNA sequencing (RNA-seq)
RNA-seq was carried out by Novegene (Novogene Corporation Inc, CA) under standard conditions. RNA was extracted using RNeasy Plus Mini Kit (Qiagen, Cat. No. 74136). Isolated RNA sample quality was assessed by High Sensitivity RNA TapeStation (Agilent Technologies Inc., California, USA) and quantified by Qubit 2.0 RNA HS assay (ThermoFisher, Massachusetts, USA). Paramagnetic beads coupled with oligo d(T)25 were combined with total RNA to isolate poly(A)+ transcripts based on NEBNext® Poly(A) mRNA Magnetic Isolation Module manual (New England BioLabs, Cat. No. E7490L). Prior to first strand synthesis, samples were randomly primed (5’ d(N6) 3’ [N=A,C,G,T]) and fragmented based on manufacturer’s recommendations. The first strand was synthesized with the Protoscript II Reverse Transcriptase (New England BioLabs, Cat. No. M0368X) with a longer extension period, approximately 30 minutes at 42°C. All remaining steps for library construction were carried out according to the NEBNext® Ultra™ II RNA Library Prep Kit for Illumina® (New England BioLabs, Cat. No. E7770L). Final libraries quantity was assessed by Qubit 2.0 (ThermoFisher, Massachusetts, USA) and quality was assessed by TapeStation HSD1000 ScreenTape (Agilent Technologies Inc., California, USA). Equimolar pooling of libraries was sequenced on an Illumina® NovaSeq S4 (Illumina, California, USA) with a read length configuration of 150 PE for 40 M PE reads per sample (20M in each direction).
For data analysis, 3′ adapter sequence was removed using Trimmomatic (with parameters ILLUMINACLIP, minlength, 10; seed mismatches, 2; palindrome clip threshold, 30; simple clip threshold, 5)60.Then, reads were mapped to mm10 mouse genome or hg38 human genome using STAR54. To estimate expression levels, RSEM55 was used to align reads to a predefined set of transcripts from GENCODE. Finally, the RSEM quantification matrix, i.e., estimated counts for each gene and/or for each annotated isoform, was used for differential gene expression analysis. Count matrix was loaded into DEBrowser software for interactive analysis.
Data analysis was performed on the RNA-seq pipeline of the DolphinNext55, available at https://github.com/dolphinnext/rnaseq and https://dolphinnext.umassmed.edu/index.php?np=1&id=732.
Next-generation sequencing of targeted tRNATyr amplicons
Total RNA extraction, oxidation and β-elimination were processed as previously described61. Mature tRNAs were isolated by denaturing 8% TBE-Urea PAGE, and spiked in with two synthetic RNA standards with intact 3’-CCA (5’- GUAAUUAUACUCAUAAAUUCGUUGUACGUGAUGCCUAAUUCCUCCA-3’) or a 3’-CC (5’- GUAAUUAUACUCA UAAAUUCGUUGUACGUGAUGCCUAAUUCCUCC-3’) in a 3:1 molar ratio at 0.06 pmol/μg total. The mature tRNAs were demethylated with rtStar tRF&tiRNA Pretreatment Kit (Arraystar Inc, Cat. No. AS-FS-005) according to the manufacturer’s instructions. A Zymo RNA clean & concentrator kit (Zymo Research, Cat. No. R1014) was used to clean up the reaction followed by end repair using T4 PNK (New England Biolabs, Cat. No. M0201S). Demethylated tRNAs were ligated with the I4 3’ adapter using T4 RNA ligase 2, truncated KQ (New England Biolabs, Cat. No. M0373L). 100ng of adapter-ligated tRNAs were incubated with SuperScript™ IV Reverse Transcriptase (Invitrogen, Cat. No. 18090200) at 55°C for 16 hours with the primer JW845 (Supplementary Table 3). KAPA HiFi HotStart ReadyMix (Roche, Cat. No. 7958935001) was used to amplify tRNA cDNA using primers JW857 and JW859 (Supplementary Table 3). Amplicons were purified with DNA Clean & Concentrator Kit (Zymo Research, Cat. No. D4014) and subjected to next-generation sequencing at the Massachusetts General Hospital CCIB DNA Core under standard conditions.
Statistical analysis:
Comparison between two groups were analyzed by t-test (two-sided). Comparison among three or more groups were analyzed by one-way analysis of variance (ANOVA), followed by pair-wise comparison that was corrected for multiple comparisons. All statistical analysis was performed using Prism 8. More information about data analysis can be found in the Life Sciences Reporting Summary.
Life Sciences Reporting Summary:
Further information on experimental design is available in the Nature Research Reporting Summary linked to this article.
Extended Data
Extended Data Figure 1. Sup-tRNAs suppressed UAG PTCs in HEK293 cells.
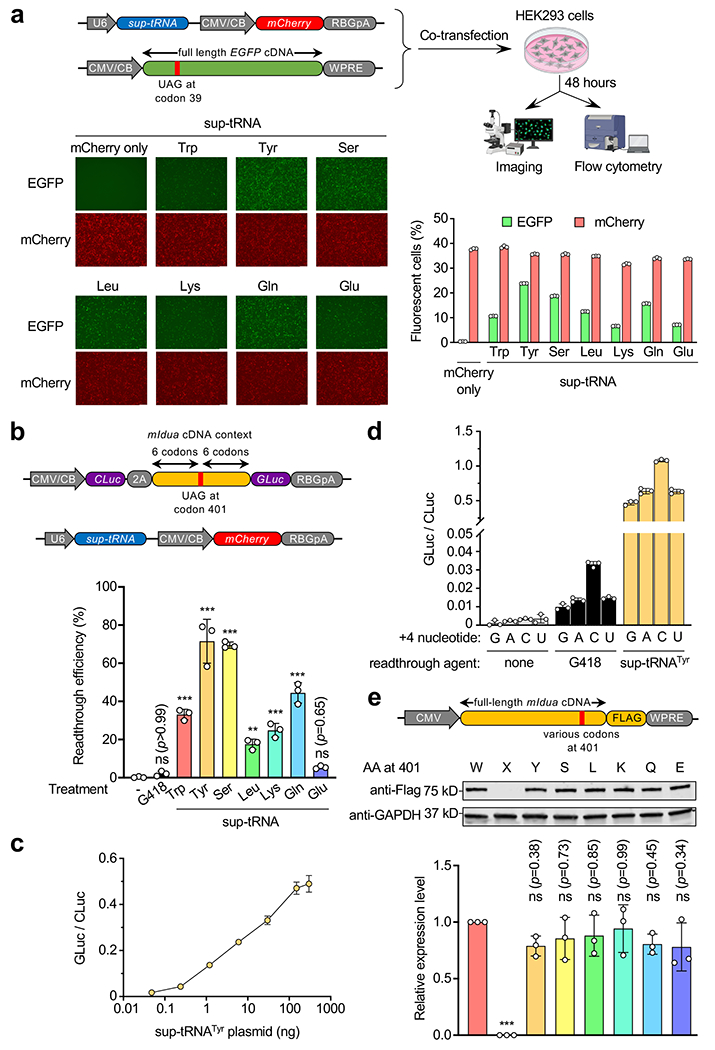
a, Workflow of a fluorescence reporter assay to examine sup-tRNA-induced readthrough of the Y39X premature termination codon (PTC) in the enhanced green fluorescence protein (EGFP) gene. Representative fluorescence images and quantification of fluorescent cells by flow cytometry are shown. Scale bar=250 μm. b, Dual-luciferase reporter assay to quantify G418 (0.1 mg/mL) or sup-tRNA-induced readthrough at the Idua-W401X PTC. Readthrough efficiency is calculated as the normalized ratio of Gaussia luciferase (Gluc) activity to Cypridina luciferase (Cluc) activity. Data are mean ± s.d. of three biological replicates. c, Dual-luciferase reporter assay using escalating amounts of sup-tRNATyr plasmid in co-transfection. d, Dual-luciferase reporter assay using a series of constructs harboring different nucleotides immediately downstream of the W401X PTC (+4 nucleotide), in the absence or presence of G418 (0.1 mg/mL) or sup-tRNATyr plasmid co-transfection. e, Representative Western blot images and quantification of protein expression from mouse Idua cDNA variants that encode different amino acid residues at codon 401. Data are mean ± s.d. of three biological replicates. Statistical analysis was performed by one-way ANOVA followed by two-sided Dunnett’s multiple comparisons test (b and e). **p < 0.01, ***p < 0.001, ns: not significant. Nucleotide sequences of EGFP-Y39X and dual-luciferase reporters are shown in Supplementary Table 4. For gel source data, see Supplementary Figure 1.
Extended Data Figure 2. Comparable expression level and enzymatic activity among Idua variants.
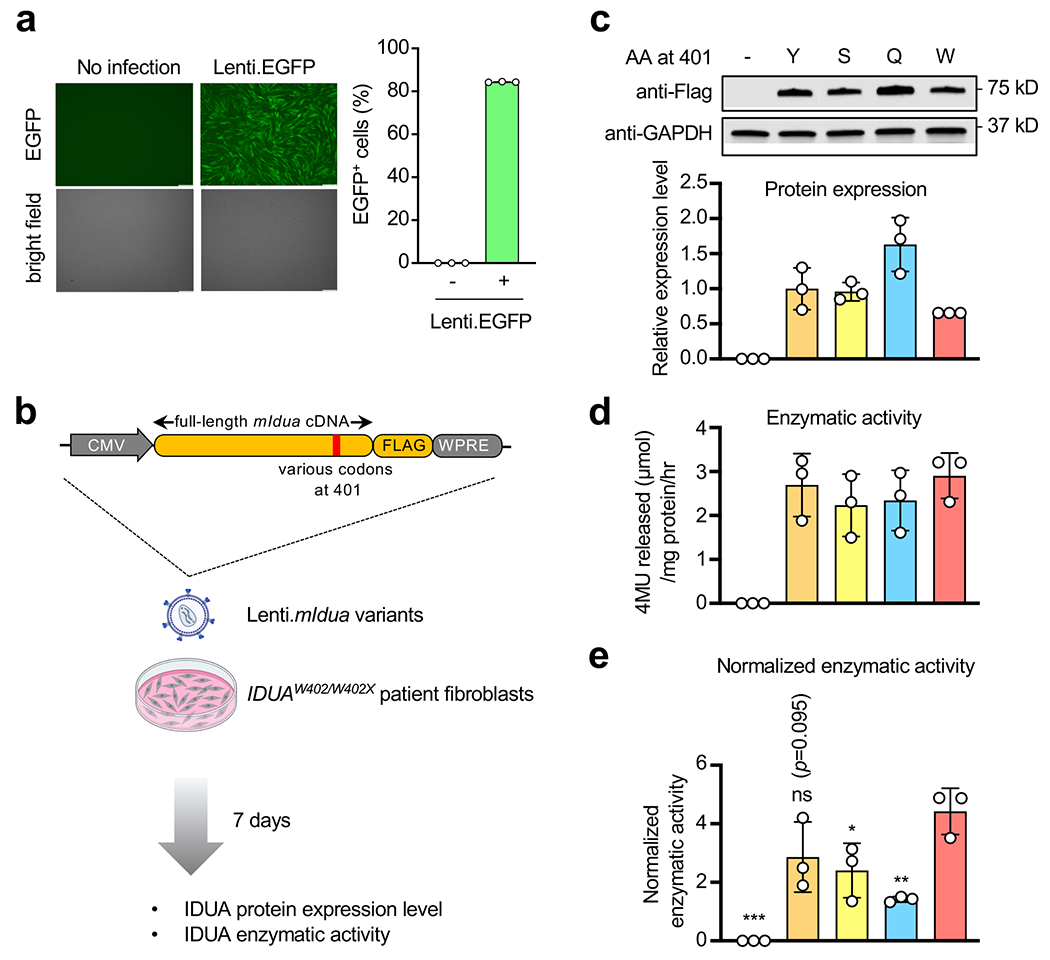
a, Representative images and quantification of EGFP+ human fibroblasts by flow cytometry following Lenti.EGFP infection. Scale bar=250 μm. b, Workflow to examine mouse Idua cDNA variants expression and IDUA enzyme activity in IDUAW402X/W402X patient fibroblasts. The lentiviral construct expressing FLAG-tagged mouse IDUA variants is shown. c, Representative Western blot images and quantification of relative protein expression of mouse IDUA variants with different amino acid residues at codon 401. d, Absolute IDUA enzyme activity of different mouse IDUA variants. e, IDUA enzyme activity of different mouse IDUA variants normalized to expression level. Data are mean ± s.d. of three technical replicates (a), or of three biological replicates (c, d and e). Statistical analysis was performed by one-way ANOVA followed by two-sided Dunnett’s multiple comparisons (e). *p < 0.05, **p < 0.01, ***p < 0.001, ns: not significant. For gel source data, see Supplementary Figure 1.
Extended Data Figure 3. Good correlation between replicates in Ribo-seq.
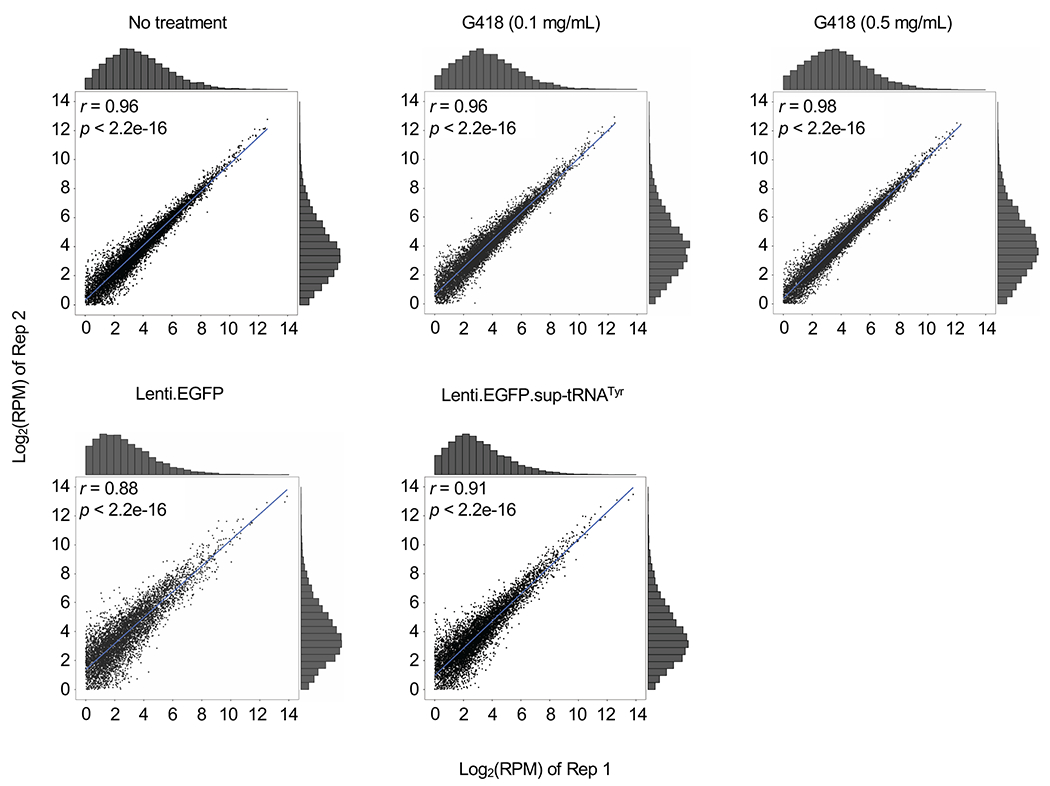
Density of coding sequence (CDS) is shown comparing two biological replicates of MPS-I patient fibroblasts treated under indicated conditions. Pearson correlations (two-sided) of log-transformed CDS densities and p values are shown. Histogram shows the CDS distribution sorted by binned densities.
Extended Data Figure 4. Optimizing sup-tRNA expression cassette for in vivo rAAV delivery.
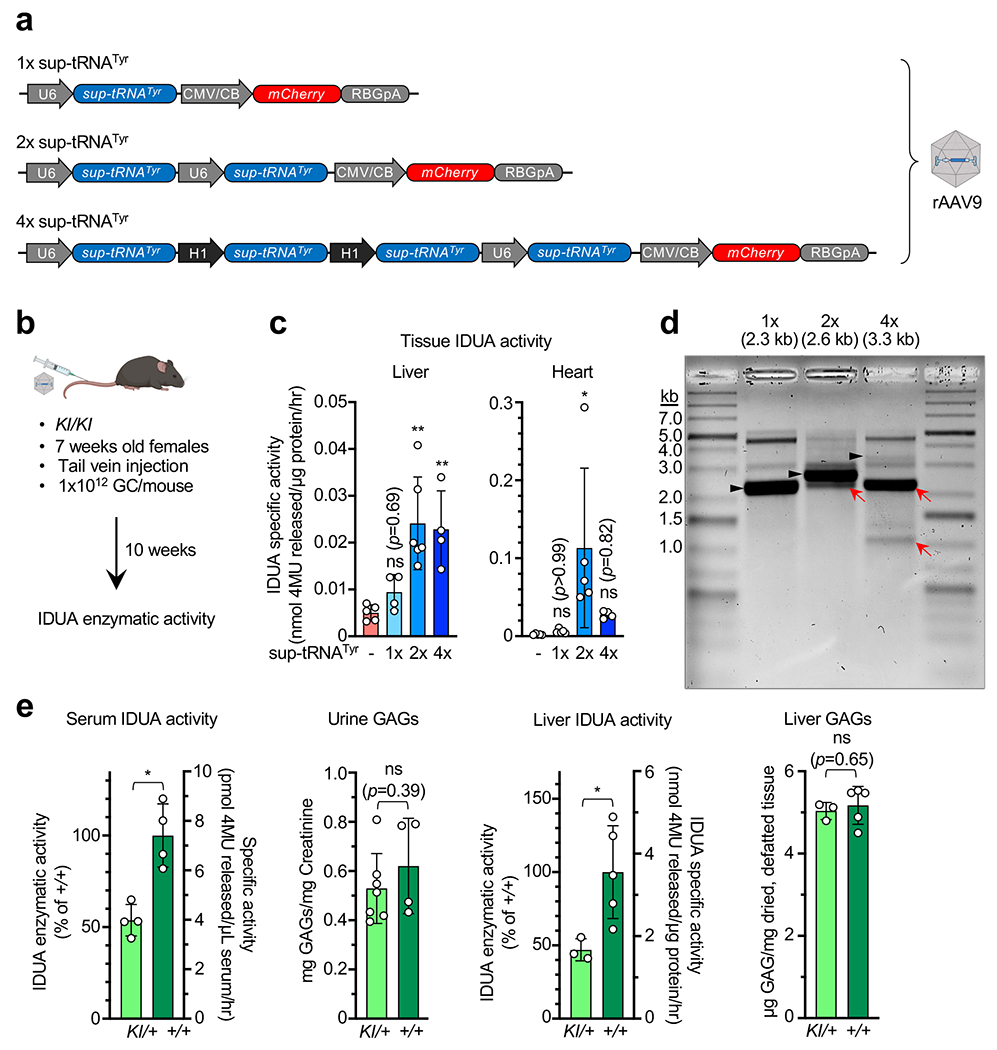
a, Schematic showing AAV9 vector constructs expressing 1x, 2x, or 4x sup-tRNATyr. Nucleotide sequences are shown in Supplementary Table 4. b, Workflow to study in vivo rAAV9 delivery of various sup-tRNATyr expression cassettes in the IduaW401X/W401X knock-in mice (KI/KI). c, IDUA enzymatic activity in liver (n=5, 4, 6, 4 as indicated by individual circles) and heart (n=5, 5, 5, 4 as indicated by individual circles) tissue lysates derived from mice treated by indicated AAV9 vectors. Data are mean ± s.d. Statistical analysis was performed by one-way ANOVA followed by two-sided Dunnett’s multiple comparisons test against the untreated group. d, Representative denaturing gel electrophoresis of extracted rAAV vector genomes of the 1x, 2x, 4x constructs of three technical replicates. Predicated vector genome sizes are labeled at the top. Black arrowheads: intact vector genomes; red arrows: truncated vector genomes. e, Characterization of serum IDUA activity (n=4 per group), urine GAGs (n=7 or 4 per group), liver IDUA activity (n=3 or 5 per group), and liver GAGs (n=3 or 5 per group) in KI/+ and wildtype (+/+) mice. Statistical analysis was performed by two-sided Student t-test. *p < 0.05, **p < 0.01, ns: not significant.
Extended Data Figure 5. rAAV9.2xstRNATyr alleviated lysosomal abnormalities in MPS-I mice and yielded long-term (>6 months) therapeutic effect.
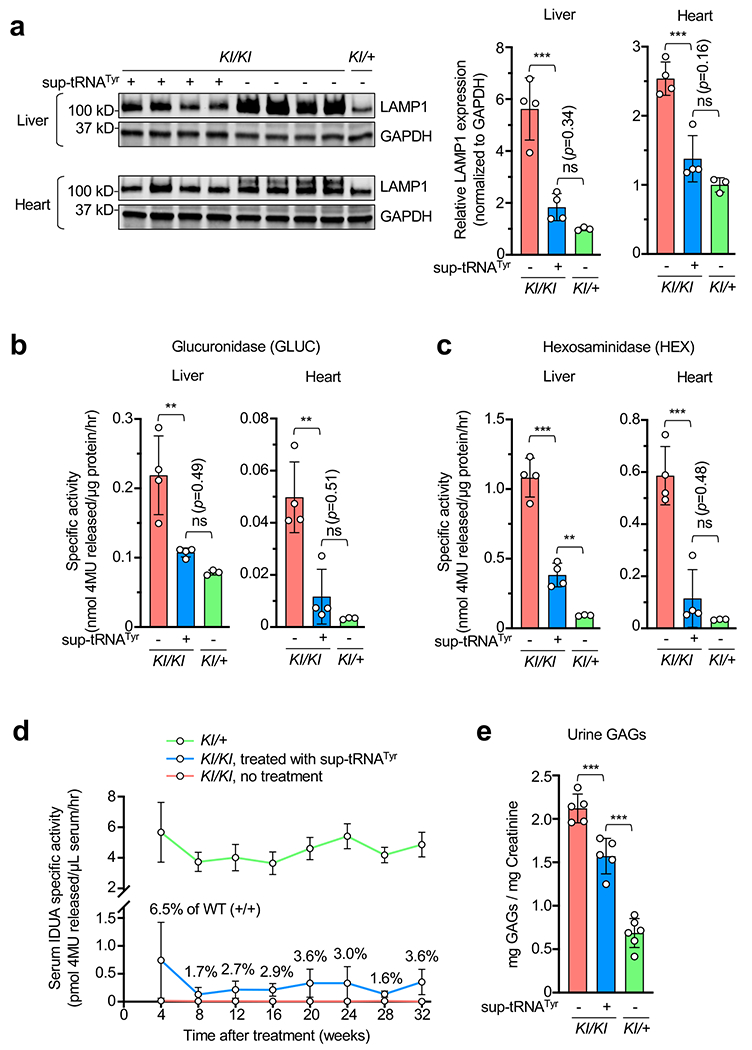
a-c, Western blot images and quantification of mouse LAMP1 protein expression (a), glucuronidase activity (b), and hexosaminidase activity (c) in the liver and heart of KI/KI mice with (+) or without (−) rAAV9.2xsup-tRNATyr treatment (n=4 per group), KI/+ without (−) rAAV9.2xsup-tRNATyr treatment (n=3). Data are mean ± s.d. of individual animals (circles). d, Serum IDUA enzyme activity in untreated KI/+ mice (green line, n=8), untreated KI/KI mice (red line, n=7) and KI/KI mice treated with rAAV9.2xsup-tRNATyr (blue line, n=7) at various timepoints after treatment at 6 weeks old. IDUA activity in untreated KI/+ mice was normalized to 50% of that in WT (+/+) mice at each timepoint, and IDUA activity in treated KI/KI mice as percentage of that in WT (+/+) mice is labeled. e, Urine GAG levels in KI/KI with (+) or without (−) rAAV9.2xsup-tRNATyr treatment (n=5 per group), KI/+ mice without (−) rAAV9.2xsup-tRNATyr treatment (n=6) determined at 28 weeks post treatment. Statistical analysis was performed by one-way ANOVA followed by two-sided Dunnett’s multiple comparisons test (a-c and e). **p < 0.01, ***p < 0.001, ns: not significant. For gel source data, see Supplementary Figure 1.
Extended Data Figure 6. rAAV9.2xstRNATyr rescued MPS-I phenotype in female mice.
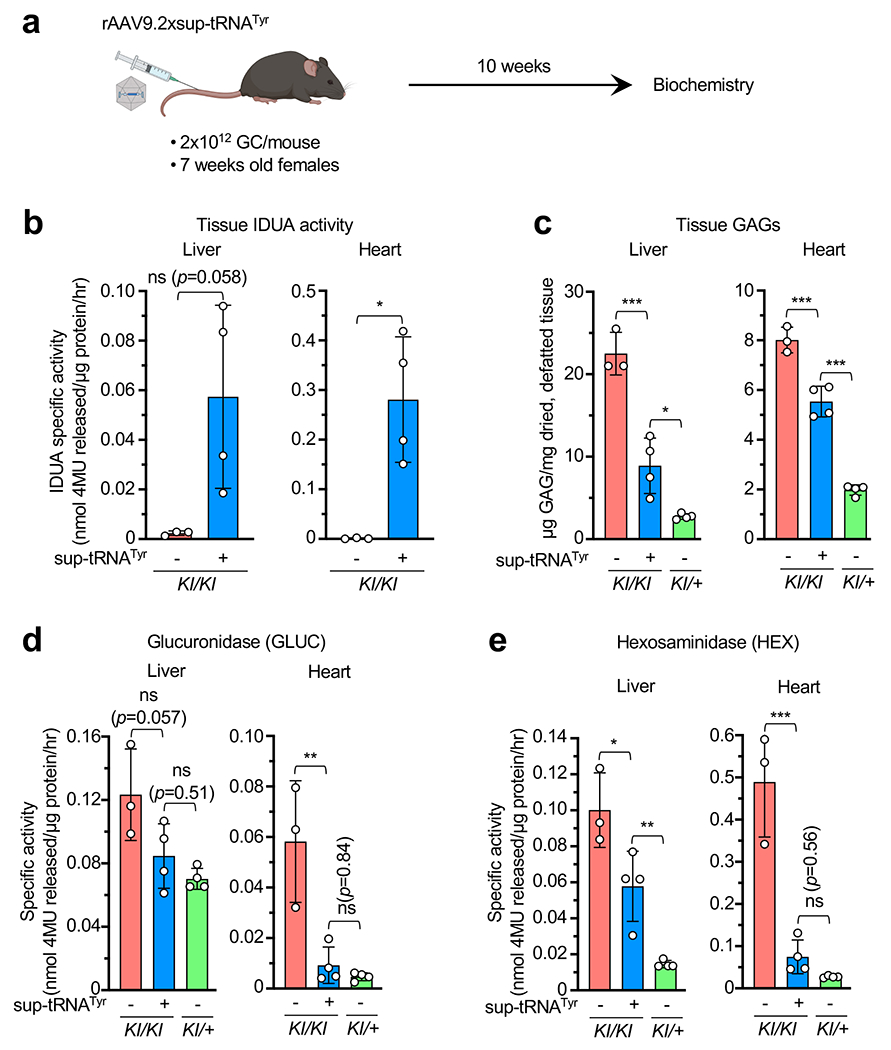
a, Workflow to assess in vivo rAAV9.2xsup-tRNATyr treatment efficacy in female IduaW401X/W401X knock-in mice (KI/KI). b, IDUA enzymatic activity in liver and heart tissue lysates derived from KI/KI mice with (+) or without (−) rAAV9.2xsup-tRNATyr treatment (n=4 and 3, respectively). Statistical analysis was performed by two-sided Welch’s t-test. c-e, Tissue GAG (c), glucuronidase activity (d), and hexosaminidase activity (e) levels in KI/KI with (+) or without (−) rAAV9.2xsup-tRNATyr treatment (n=4 or 3 per group), KI/+ mice without (−) rAAV9.2xsup-tRNATyr treatment (n=4). Data are mean ± s.d. of individual animals (circles). Statistical analysis was performed by one-way ANOVA followed by two-sided Dunnett’s multiple comparisons test (c-e). *p < 0.05, **p < 0.01, ***p < 0.001, ns: not significant.
Extended Data Figure 7. No gross toxicity was observed in mice treated with rAAV9.2xsup-tRNATyr.
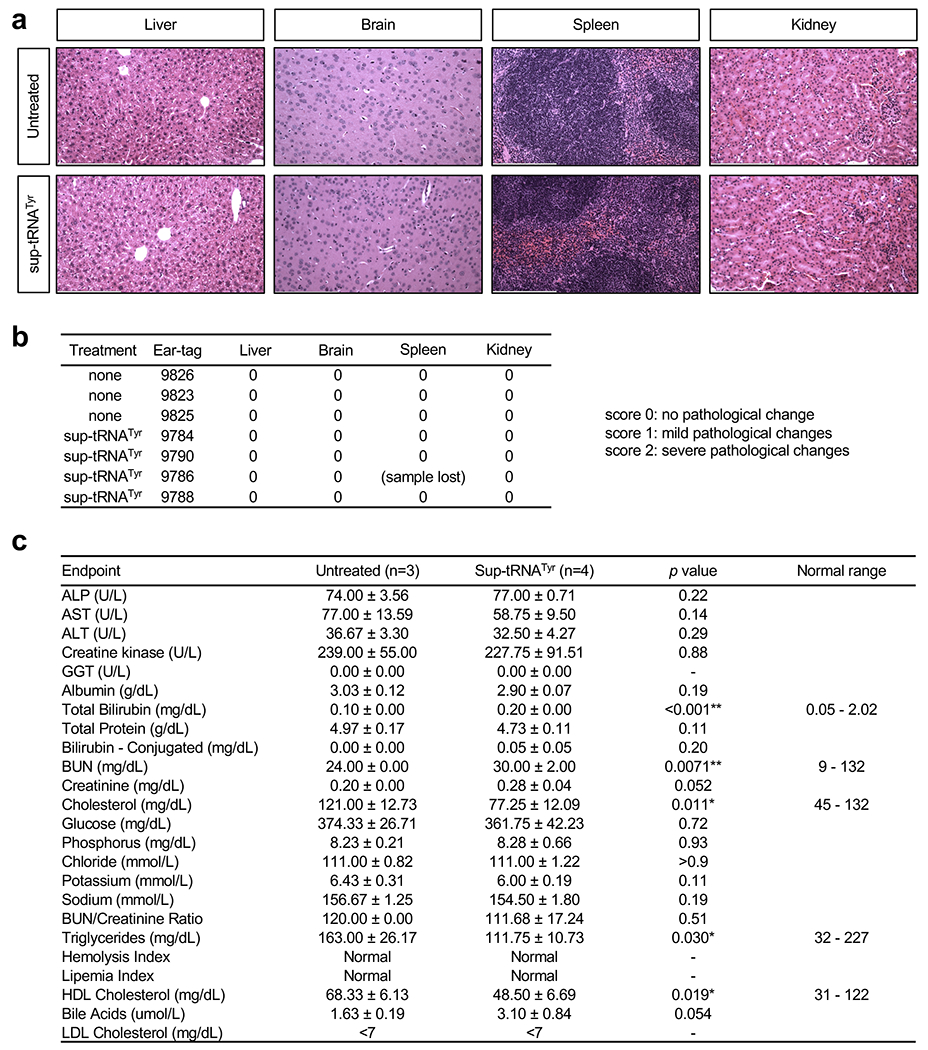
a, Representative H&E staining images of liver, brain, spleen, and kidney sections in untreated (n=3) or sup-tRNATyr-treated (n=4) male KI/+ mice. Mice were treated at 6 weeks old, and euthanized at 16 weeks old. Scale bar=200 μm. b, Blind pathological assessment of the liver, brain, spleen, and kidney H&E slides as described in (a). c, Summary of endpoint serum clinical biochemistry of untreated (n=3) or sup-tRNATyr-treated (n=4) KI/+ mice. Data are mean ± s.d. of biological replicates. Statistical analysis was performed by two-sided Student t-test. *p < 0.05, **p < 0.01. Note that for the endpoints showing statistical significance, values of both groups are within the normal ranges (https://phenome.jax.org/projects/CGDpheno2).
Extended Data Figure 8. Ribosome profiling revealed that global readthrough is largely restricted to UAG in the liver.
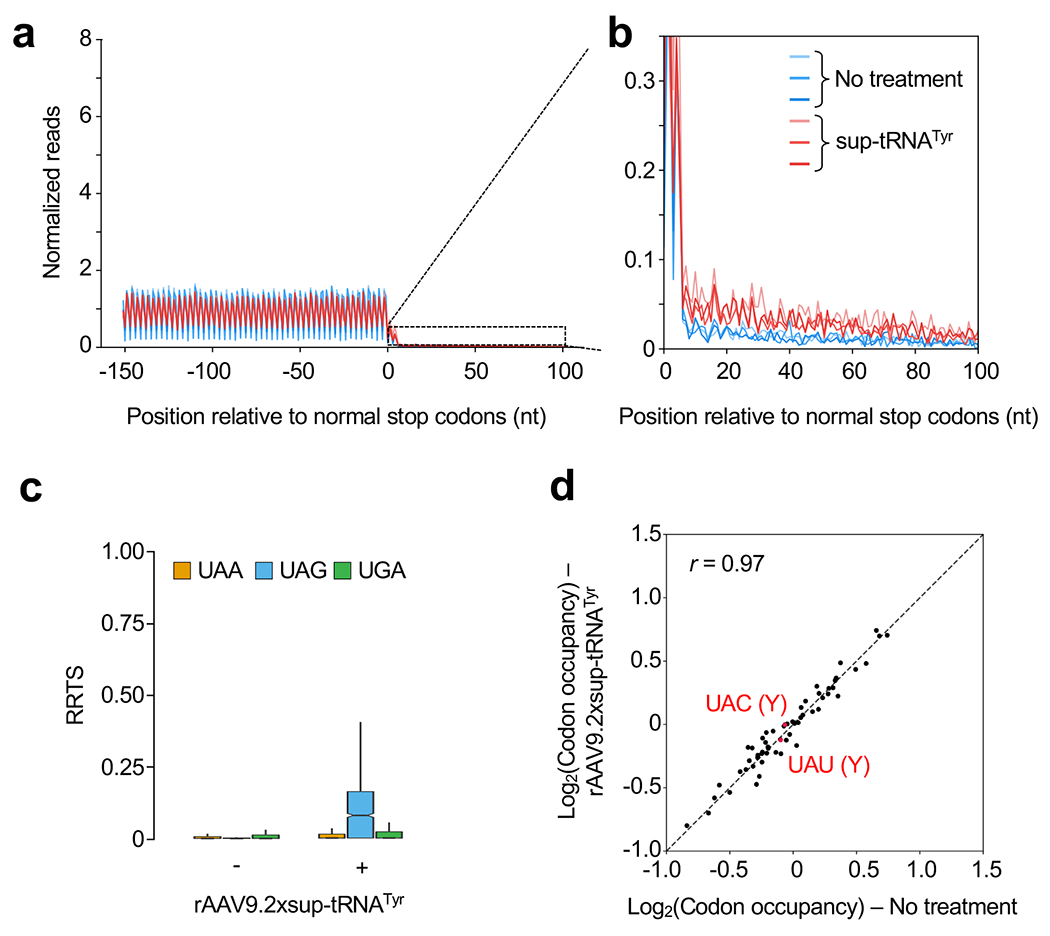
a, Metagene plot showing normalized reads of ribosome protected fragments (RPFs) relative to the distance from the normal stop codon at position 0. RPFs from untreated (blue, n=3 mice), or rAAV9.2xsup-tRNATyr-treated KI/KI male mice (red, n=3 mice) are overlaid. b, Magnified view of the 3′UTR showing increased RPFs in this region in the rAAV9.2xsup-tRNATyr treated mouse livers. c, Box plot of ribosome readthrough score (RRTS) derived from ribosome profiling of KI/KI mouse livers with (+) or without (−) rAAV9.2xsup-tRNATyr treatment (n=3 per group). RRTS values were calculated for transcripts harboring different normal stop codons, namely UAA (orange), UAG (blue), and UGA (green), respectively. Center line indicates the median, the box ends indicate the first and third quartiles, and the whiskers indicate the range of the remaining data excluding outliers. d, Scatter plot showing RPF densities at each codon (codon occupancy) in KI/KI mouse livers with (+) or without (−) rAAV9.2xsup-tRNATyr treatment (n=3 per group). Two tyrosine (Y) codons are highlighted in red.
Extended Data Figure 9. mRNA-seq analysis on human fibroblasts.
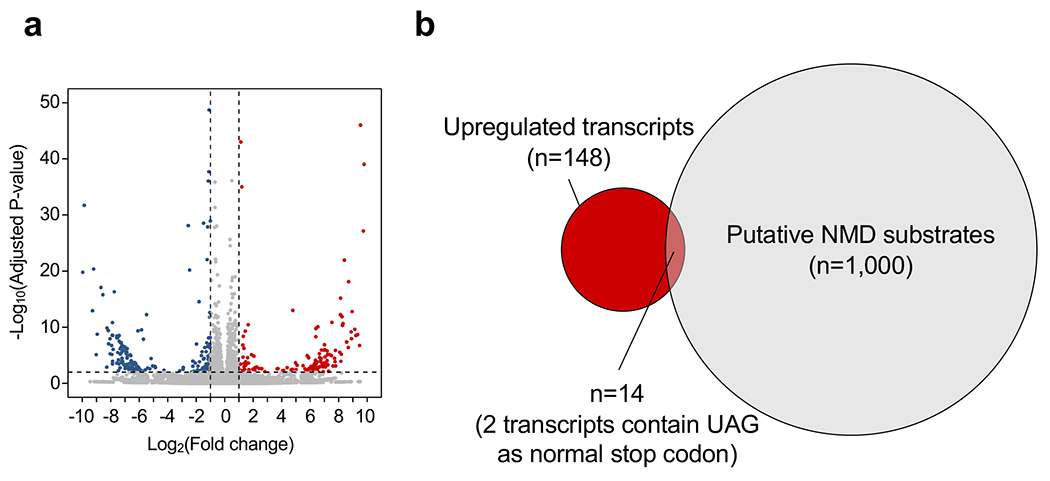
Cells were infected with Lenti.sup-tRNATyr.EGFP or Lenti.EGFP as control for seven days as described in Fig. 2a. a, Volcano plot showing differentially expressed transcripts in Lenti.sup-tRNATyr.EGFP-treated cells compared to control cells. Red and blue dots denote significantly upregulated and downregulated transcripts (adjusted p<0.01 and fold change>2), respectively. b, Venn diagram showing the upregulated transcripts in a and published set of 1,000 human putative NMD substrates.
Extended Data Figure 10. rAAV.2xsup-tRNATyr treatment efficacy correlates with gene delivery efficiency.
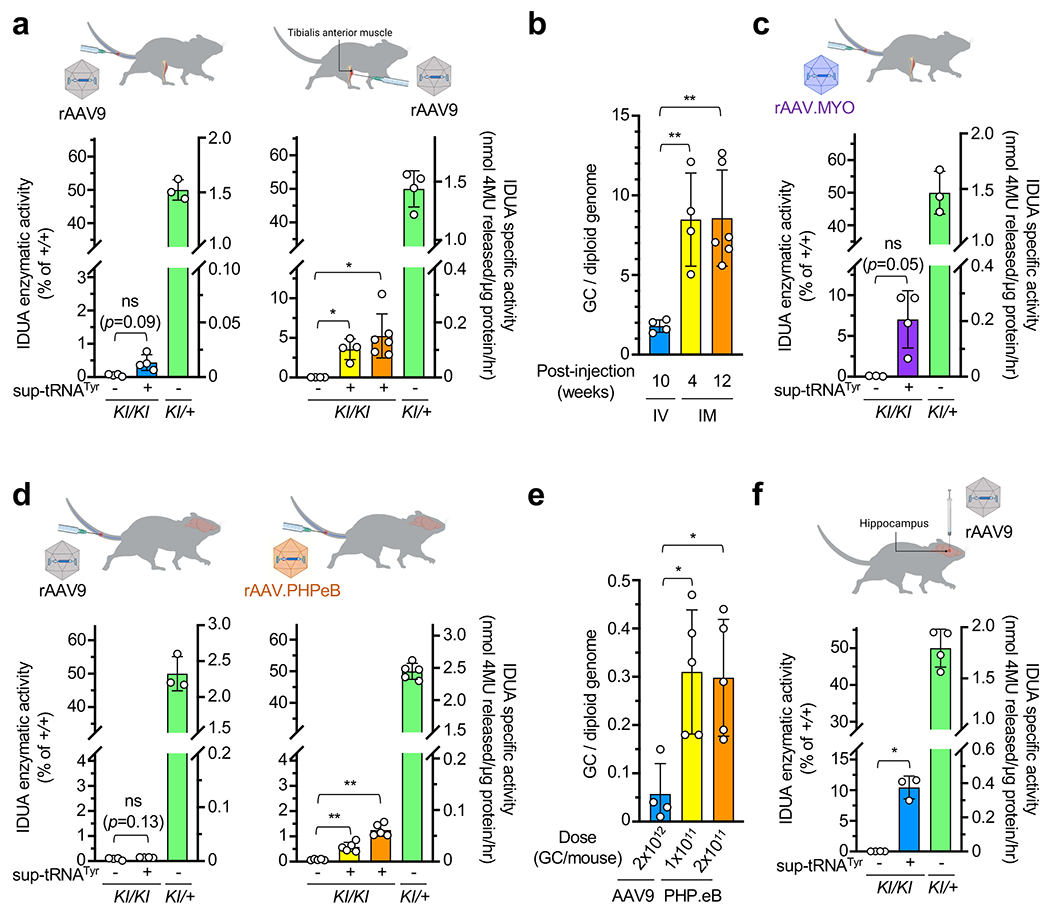
a, IDUA activity in the tibialis anterior (TA) muscle lysates derived from KI/KI mice ± rAAV9.2xsup-tRNATyr treatment via either intravenous (IV) injection of 2x10¹² GC (left panel; n=4 per group) or from KI/KI mice ± rAAV9.2xsup-tRNATyr treatment via intramuscular (IM) injection of 3x10¹¹ GC to the TA muscle (right panel; n=4 or 6 per group). Tissues were harvested at 10 weeks (blue), 4 weeks (yellow), or 12 weeks (orange) post treatment. The right y-axis denotes absolute IDUA specific activity, and the left y-axis denotes relative activity normalized to untreated heterozygous mice as 50% of WT (+/+) level. b, Quantification of AAV vector genome copy numbers in the TA muscle of the mice described in a. c, IDUA enzymatic activity in the TA muscle lysates derived from KI/KI mice ± rAAVMYO.2xsup-tRNATyr treatment via IV injection at 2x10¹² GC (n=4 or 3 per group), and euthanized at 4 weeks post treatment. d, IDUA activity in the brain lysates derived from KI/KI mice ± rAAV.2xsup-tRNATyr treatment via intravenous (IV) injection. Mice were treated with either rAAV9 (left panel; n=4) at 2x10¹² GC or rAAV.PHPeB (right panel; n=5 per group) at 1x10¹¹ GC (yellow) or 2x10¹¹ GC (orange). e, Quantification of AAV vector genome copy numbers in the brain of the mice described in d. f, IDUA activity in the hippocampus lysates derived from KI/KI mice ± rAAV9.2xsup-tRNATyr treatment via intrahippocampal injection of 2.2x10¹⁰ GC (n=4 or 3 per group). Mice were euthanized at 4 weeks post treatment. Data are mean ± s.d. of individual animals (circles). Statistical analysis was performed by one-way Brown-Forsythe and Welch ANOVA followed by two-sided Dunnett T3’s multiple comparisons test (a, c, d, f), or ANOVA followed by two-sided Dunnett’s multiple comparison test (b, e). *p < 0.05, **p < 0.01, ***p < 0.001, ns: not significant.
Supplementary Material
ACKNOWLEDGEMENTS
We are grateful to Drs. Phillip D. Zamore, Oliver J. Rando, Danny D. Nedialkova, and the members of Wang Lab and Gao Lab for helpful discussions. We sincerely thank the Viral Vector Core at University of Massachusetts Chan Medical School for producing the AAV vectors used in this study. The Wang Lab is supported by grants from the National Institutes of Health (NIH) (P01HL158506), Grace Science Foundation, Pitt-Hopkins Research Foundation, and Believe in a Cure. The Gao Lab is supported by grants from the NIH (R01NS076991-01, P01AI100263-01, P01HL131471-02, 35 R01AI121135, UG3HL147367-01, R01HL097088, and U19AI149646-01) and Cystic Fibrosis Foundation. O.Y. and A.K. are supported by the National Center for Advancing Translational Sciences (UL1TR001453-01).
Footnotes
COMPETING INTERESTS
J.W., Y.Z., C.A.M., G.G. and D.W. are inventors of a patent application filed by University of Massachusetts Chan Medical School concerning the design and applications of suppressor tRNAs described in this study. G.G. is a scientific co-founder of Voyager Therapeutics, Adrenas Therapeutics and Aspa Therapeutics and holds equity in the companies. G.G. and D.W. are inventors on patents related to AAV-based gene therapy, some of which were licensed to commercial entities. Other authors have no competing interest.
CODE AVAILABILITY
Bioinformatic analysis was performed using publicly available programs and parameters described in Methods. Code for Ribo-seq is available at https://github.com/dolphinnext/ribosome-profiling. Code for tRNA-seq is available at https://github.com/dolphinnext/trnaseq.
DATA AVAILABILITY
Amplicon NGS sequencing, ribosome profiling, tRNA sequencing, and RNA-seq data can be found in the NCBI’s Gene Expression Omnibus (GEO), using GEO Series accession number GSE179275. Other data are available in the Source Data files.
REFERENCES
- 1.Wang D, Tai PWL & Gao G Adeno-associated virus vector as a platform for gene therapy delivery. Nat Rev Drug Discov. (2019). [DOI] [PMC free article] [PubMed] [Google Scholar]
- 2.Li C & Samulski RJ Engineering adeno-associated virus vectors for gene therapy. Nat Rev Genet. 21, 255–272 (2020). [DOI] [PubMed] [Google Scholar]
- 3.Mendell JR et al. Current Clinical Applications of In Vivo Gene Therapy with AAVs. Mol Ther. (2020). [DOI] [PMC free article] [PubMed] [Google Scholar]
- 4.Hordeaux J et al. Adeno-Associated Virus-Induced Dorsal Root Ganglion Pathology. Hum Gene Ther. 31, 808–818 (2020). [DOI] [PubMed] [Google Scholar]
- 5.Van Alstyne M et al. Gain of toxic function by long-term AAV9-mediated SMN overexpression in the sensorimotor circuit. Nat Neurosci. (2021). [DOI] [PMC free article] [PubMed] [Google Scholar]
- 6.Golebiowski D et al. Direct Intracranial Injection of AAVrh8 Encoding Monkey beta-N-Acetylhexosaminidase Causes Neurotoxicity in the Primate Brain. Hum Gene Ther. 28, 510–522 (2017). [DOI] [PMC free article] [PubMed] [Google Scholar]
- 7.Wang D, Zhang F & Gao G CRISPR-Based Therapeutic Genome Editing: Strategies and In Vivo Delivery by AAV Vectors. Cell. 181, 136–150 (2020). [DOI] [PMC free article] [PubMed] [Google Scholar]
- 8.Chang JC, Temple GF, Trecartin RF & Kan YW Suppression of the nonsense mutation in homozygous beta 0 thalassaemia. Nature. 281, 602–603 (1979). [DOI] [PubMed] [Google Scholar]
- 9.Temple GF, Dozy AM, Roy KL & Kan YW Construction of a functional human suppressor tRNA gene: an approach to gene therapy for beta-thalassaemia. Nature. 296, 537–540 (1982). [DOI] [PubMed] [Google Scholar]
- 10.Porter JJ, Heil CS & Lueck JD Therapeutic promise of engineered nonsense suppressor tRNAs. Wiley Interdiscip Rev RNA. 12, e1641 (2021). [DOI] [PMC free article] [PubMed] [Google Scholar]
- 11.Wang D et al. Characterization of an MPS I-H knock-in mouse that carries a nonsense mutation analogous to the human IDUA-W402X mutation. Mol Genet Metab. 99, 62–71 (2010). [DOI] [PMC free article] [PubMed] [Google Scholar]
- 12.Bigger BW, Begley DJ, Virgintino D & Pshezhetsky AV Anatomical changes and pathophysiology of the brain in mucopolysaccharidosis disorders. Mol Genet Metab. 125, 322–331 (2018). [DOI] [PubMed] [Google Scholar]
- 13.Hampe CS et al. Mucopolysaccharidosis Type I: Current Treatments, Limitations, and Prospects for Improvement. Biomolecules. 11 (2021). [DOI] [PMC free article] [PubMed] [Google Scholar]
- 14.Ingolia NT, Ghaemmaghami S, Newman JR & Weissman JS Genome-wide analysis in vivo of translation with nucleotide resolution using ribosome profiling. Science. 324, 218–223 (2009). [DOI] [PMC free article] [PubMed] [Google Scholar]
- 15.Wangen JR & Green R Stop codon context influences genome-wide stimulation of termination codon readthrough by aminoglycosides. Elife. 9 (2020). [DOI] [PMC free article] [PubMed] [Google Scholar]
- 16.Behrens A, Rodschinka G & Nedialkova DD High-resolution quantitative profiling of tRNA abundance and modification status in eukaryotes by mim-tRNAseq. Molecular cell. 81, 1802–1815 e1807 (2021). [DOI] [PMC free article] [PubMed] [Google Scholar]
- 17.Koukuntla R, Ramsey WJ, Young WB & Link CJ U6 promoter-enhanced GlnUAG suppressor tRNA has higher suppression efficacy and can be stably expressed in 293 cells. J Gene Med. 15, 93–101 (2013). [DOI] [PubMed] [Google Scholar]
- 18.Keeling KM, Xue X, Gunn G & Bedwell DM Therapeutics based on stop codon readthrough. Annu Rev Genomics Hum Genet. 15, 371–394 (2014). [DOI] [PMC free article] [PubMed] [Google Scholar]
- 19.Manuvakhova M, Keeling K & Bedwell DM Aminoglycoside antibiotics mediate context-dependent suppression of termination codons in a mammalian translation system. RNA. 6, 1044–1055 (2000). [DOI] [PMC free article] [PubMed] [Google Scholar]
- 20.Phillips-Jones MK, Hill LS, Atkinson J & Martin R Context effects on misreading and suppression at UAG codons in human cells. Molecular and cellular biology. 15, 6593–6600 (1995). [DOI] [PMC free article] [PubMed] [Google Scholar]
- 21.Roy B et al. Ataluren stimulates ribosomal selection of near-cognate tRNAs to promote nonsense suppression. Proc Natl Acad Sci U S A. 113, 12508–12513 (2016). [DOI] [PMC free article] [PubMed] [Google Scholar]
- 22.Xue X et al. Identification of the amino acids inserted during suppression of CFTR nonsense mutations and determination of their functional consequences. Hum Mol Genet. 26, 3116–3129 (2017). [DOI] [PMC free article] [PubMed] [Google Scholar]
- 23.Lueck JD et al. Engineered transfer RNAs for suppression of premature termination codons. Nature communications. 10, 822 (2019). [DOI] [PMC free article] [PubMed] [Google Scholar]
- 24.Giege R, Sissler M & Florentz C Universal rules and idiosyncratic features in tRNA identity. Nucleic Acids Res. 26, 5017–5035 (1998). [DOI] [PMC free article] [PubMed] [Google Scholar]
- 25.Bunge S et al. Genotype-phenotype correlations in mucopolysaccharidosis type I using enzyme kinetics, immunoquantification and in vitro turnover studies. Biochim Biophys Acta. 1407, 249–256 (1998). [DOI] [PubMed] [Google Scholar]
- 26.Oussoren E et al. Residual alpha-L-iduronidase activity in fibroblasts of mild to severe Mucopolysaccharidosis type I patients. Mol Genet Metab. 109, 377–381 (2013). [DOI] [PubMed] [Google Scholar]
- 27.Parker DJ et al. Growth-Optimized Aminoacyl-tRNA Synthetase Levels Prevent Maximal tRNA Charging. Cell Syst. 11, 121–130 e126 (2020). [DOI] [PMC free article] [PubMed] [Google Scholar]
- 28.Hinnebusch AG Translational regulation of GCN4 and the general amino acid control of yeast. Annu Rev Microbiol. 59, 407–450 (2005). [DOI] [PubMed] [Google Scholar]
- 29.Buvoli M, Buvoli A & Leinwand LA Suppression of nonsense mutations in cell culture and mice by multimerized suppressor tRNA genes. Molecular and cellular biology. 20, 3116–3124 (2000). [DOI] [PMC free article] [PubMed] [Google Scholar]
- 30.Xie J et al. Short DNA Hairpins Compromise Recombinant Adeno-Associated Virus Genome Homogeneity. Mol Ther. 25, 1363–1374 (2017). [DOI] [PMC free article] [PubMed] [Google Scholar]
- 31.Davidoff AM, Ng CY, Zhou J, Spence Y & Nathwani AC Sex significantly influences transduction of murine liver by recombinant adeno-associated viral vectors through an androgen-dependent pathway. Blood. 102, 480–488 (2003). [DOI] [PubMed] [Google Scholar]
- 32.Keeling KM et al. Leaky termination at premature stop codons antagonizes nonsense-mediated mRNA decay in S. cerevisiae. RNA. 10, 691–703 (2004). [DOI] [PMC free article] [PubMed] [Google Scholar]
- 33.Kim YK, Furic L, Desgroseillers L & Maquat LE Mammalian Staufen1 recruits Upf1 to specific mRNA 3’UTRs so as to elicit mRNA decay. Cell. 120, 195–208 (2005). [DOI] [PubMed] [Google Scholar]
- 34.Maquat LE, Tarn WY & Isken O The pioneer round of translation: features and functions. Cell. 142, 368–374 (2010). [DOI] [PMC free article] [PubMed] [Google Scholar]
- 35.van Tol H & Beier H All human tRNATyr genes contain introns as a prerequisite for pseudouridine biosynthesis in the anticodon. Nucleic Acids Res. 16, 1951–1966 (1988). [DOI] [PMC free article] [PubMed] [Google Scholar]
- 36.Dong J, Qiu H, Garcia-Barrio M, Anderson J & Hinnebusch AG Uncharged tRNA activates GCN2 by displacing the protein kinase moiety from a bipartite tRNA-binding domain. Molecular cell. 6, 269–279 (2000). [DOI] [PubMed] [Google Scholar]
- 37.Fechter P, Rudinger-Thirion J, Theobald-Dietrich A & Giege R Identity of tRNA for yeast tyrosyl-tRNA synthetase: tyrosylation is more sensitive to identity nucleotides than to structural features. Biochemistry. 39, 1725–1733 (2000). [DOI] [PubMed] [Google Scholar]
- 38.Kurosaki T, Popp MW & Maquat LE Quality and quantity control of gene expression by nonsense-mediated mRNA decay. Nat Rev Mol Cell Biol. 20, 406–420 (2019). [DOI] [PMC free article] [PubMed] [Google Scholar]
- 39.Colombo M, Karousis ED, Bourquin J, Bruggmann R & Muhlemann O Transcriptome-wide identification of NMD-targeted human mRNAs reveals extensive redundancy between SMG6- and SMG7-mediated degradation pathways. RNA. 23, 189–201 (2017). [DOI] [PMC free article] [PubMed] [Google Scholar]
- 40.Huang L et al. Targeting Translation Termination Machinery with Antisense Oligonucleotides for Diseases Caused by Nonsense Mutations. Nucleic Acid Ther. 29, 175–186 (2019). [DOI] [PMC free article] [PubMed] [Google Scholar]
- 41.Wang J et al. In Vivo Delivery of Suppressor tRNA Overcomes a Pathogenic Nonsense Mutation in Mice. Molecular Therapy. 29, 128 (2021). [Google Scholar]
- 42.Chan KY et al. Engineered AAVs for efficient noninvasive gene delivery to the central and peripheral nervous systems. Nat Neurosci. 20, 1172–1179 (2017). [DOI] [PMC free article] [PubMed] [Google Scholar]
- 43.Moreno AM et al. Immune-orthogonal orthologues of AAV capsids and of Cas9 circumvent the immune response to the administration of gene therapy. Nat Biomed Eng. 3, 806–816 (2019). [DOI] [PMC free article] [PubMed] [Google Scholar]
- 44.Li A et al. AAV-CRISPR Gene Editing Is Negated by Pre-existing Immunity to Cas9. Mol Ther. 28, 1432–1441 (2020). [DOI] [PMC free article] [PubMed] [Google Scholar]
- 45.Gadalla KK et al. Improved survival and reduced phenotypic severity following AAV9/MECP2 gene transfer to neonatal and juvenile male Mecp2 knockout mice. Mol Ther. 21, 18–30 (2013). [DOI] [PMC free article] [PubMed] [Google Scholar]
- 46.Kramarski L & Arbely E Translational read-through promotes aggregation and shapes stop codon identity. Nucleic Acids Res. 48, 3747–3760 (2020). [DOI] [PMC free article] [PubMed] [Google Scholar]
- 47.Hashimoto S, Nobuta R, Izawa T & Inada T Translation arrest as a protein quality control system for aberrant translation of the 3’-UTR in mammalian cells. FEBS Lett. 593, 777–787 (2019). [DOI] [PubMed] [Google Scholar]
- 48.Arribere JA et al. Translation readthrough mitigation. Nature. 534, 719–723 (2016). [DOI] [PMC free article] [PubMed] [Google Scholar]
- 49.Lombardi S et al. Translational readthrough of GLA nonsense mutations suggests dominant-negative effects exerted by the interaction of wild-type and missense variants. RNA biology. 17, 254–263 (2020). [DOI] [PMC free article] [PubMed] [Google Scholar]
- 50.Kuzmin DA et al. The clinical landscape for AAV gene therapies. Nat Rev Drug Discov. 20, 173–174 (2021). [DOI] [PubMed] [Google Scholar]
- 51.Keller A, Nesvizhskii AI, Kolker E & Aebersold R Empirical statistical model to estimate the accuracy of peptide identifications made by MS/MS and database search. Analytical Chemistry. 74, 5383–5392 (2002). [DOI] [PubMed] [Google Scholar]
- 52.Nesvizhskii AI, Keller A, Kolker E & Aebersold R A statistical model for identifying proteins by tandem mass spectrometry. Analytical Chemistry. 75, 4646–4658 (2003). [DOI] [PubMed] [Google Scholar]
- 53.Ingolia NT, Brar GA, Rouskin S, McGeachy AM & Weissman JS The ribosome profiling strategy for monitoring translation in vivo by deep sequencing of ribosome-protected mRNA fragments. Nature protocols. 7, 1534–1550 (2012). [DOI] [PMC free article] [PubMed] [Google Scholar]
- 54.Dobin A et al. STAR: ultrafast universal RNA-seq aligner. Bioinformatics. 29, 15–21 (2013). [DOI] [PMC free article] [PubMed] [Google Scholar]
- 55.Yukselen O, Turkyilmaz O, Ozturk AR, Garber M & Kucukural A DolphinNext: a distributed data processing platform for high throughput genomics. BMC Genomics. 21, 310 (2020). [DOI] [PMC free article] [PubMed] [Google Scholar]
- 56.Clarke LA et al. Murine mucopolysaccharidosis type I: targeted disruption of the murine alpha-L-iduronidase gene. Hum Mol Genet. 6, 503–511 (1997). [DOI] [PubMed] [Google Scholar]
- 57.Wang D et al. The designer aminoglycoside NB84 significantly reduces glycosaminoglycan accumulation associated with MPS I-H in the Idua-W392X mouse. Mol Genet Metab. 105, 116–125 (2012). [DOI] [PMC free article] [PubMed] [Google Scholar]
- 58.Wang D et al. Cas9-mediated allelic exchange repairs compound heterozygous recessive mutations in mice. Nat Biotechnol. 36, 839–842 (2018). [DOI] [PMC free article] [PubMed] [Google Scholar]
- 59.Crowe AR & Yue W Semi-quantitative Determination of Protein Expression using Immunohistochemistry Staining and Analysis: An Integrated Protocol. Bio Protoc. 9 (2019). [DOI] [PMC free article] [PubMed] [Google Scholar]
- 60.Bolger AM, Lohse M & Usadel B Trimmomatic: a flexible trimmer for Illumina sequence data. Bioinformatics. 30, 2114–2120 (2014). [DOI] [PMC free article] [PubMed] [Google Scholar]
- 61.Evans ME, Clark WC, Zheng G & Pan T Determination of tRNA aminoacylation levels by high-throughput sequencing. Nucleic Acids Res. 45, e133 (2017). [DOI] [PMC free article] [PubMed] [Google Scholar]
Associated Data
This section collects any data citations, data availability statements, or supplementary materials included in this article.
Supplementary Materials
Data Availability Statement
Amplicon NGS sequencing, ribosome profiling, tRNA sequencing, and RNA-seq data can be found in the NCBI’s Gene Expression Omnibus (GEO), using GEO Series accession number GSE179275. Other data are available in the Source Data files.


