

Abstract
Background
Anaemia is a condition where the number of red blood cells (and consequently their oxygen‐carrying capacity) is insufficient to meet the body's physiologic needs. Fortification of wheat flour is deemed a useful strategy to reduce anaemia in populations.
Objectives
To determine the benefits and harms of wheat flour fortification with iron alone or with other vitamins and minerals on anaemia, iron status and health‐related outcomes in populations over two years of age.
Search methods
We searched CENTRAL, MEDLINE, Embase, CINAHL, and other databases up to 4 September 2019.
Selection criteria
We included cluster‐ or individually randomised controlled trials (RCT) carried out among the general population from any country aged two years and above. The interventions were fortification of wheat flour with iron alone or in combination with other micronutrients. Trials comparing any type of food item prepared from flour fortified with iron of any variety of wheat were included.
Data collection and analysis
Two review authors independently screened the search results and assessed the eligibility of studies for inclusion, extracted data from included studies and assessed risk of bias. We followed Cochrane methods in this review.
Main results
Our search identified 3048 records, after removing duplicates. We included nine trials, involving 3166 participants, carried out in Bangladesh, Brazil, India, Kuwait, Phillipines, Sri Lanka and South Africa. The duration of interventions varied from 3 to 24 months. One study was carried out among adult women and one trial among both children and nonpregnant women. Most of the included trials were assessed as low or unclear risk of bias for key elements of selection, performance or reporting bias.
Three trials used 41 mg to 60 mg iron/kg flour, two trials used less than 40 mg iron/kg and three trials used more than 60 mg iron/kg flour. One trial employed various iron levels based on type of iron used: 80 mg/kg for electrolytic and reduced iron and 40 mg/kg for ferrous fumarate.
All included studies contributed data for the meta‐analyses. Seven studies compared wheat flour fortified with iron alone versus unfortified wheat flour, three studies compared wheat flour fortified with iron in combination with other micronutrients versus unfortified wheat flour and two studies compared wheat flour fortified with iron in combination with other micronutrients versus fortified wheat flour with the same micronutrients (but not iron). No studies included a 'no intervention' comparison arm.
None of the included trials reported any other adverse side effects (including constipation, nausea, vomiting, heartburn or diarrhoea).
Wheat flour fortified with iron alone versus unfortified wheat flour (no micronutrients added)
Wheat flour fortification with iron alone may have little or no effect on anaemia (risk ratio (RR) 0.81, 95% confidence interval (CI) 0.61 to 1.07; 5 studies; 2200 participants; low‐certainty evidence). It probably makes little or no difference on iron deficiency (RR 0.43, 95% CI 0.17 to 1.07; 3 studies; 633 participants; moderate‐certainty evidence) and we are uncertain about whether wheat flour fortified with iron increases haemoglobin concentrations by an average 3.30 (g/L) (95% CI 0.86 to 5.74; 7 studies; 2355 participants; very low‐certainty evidence).
No trials reported data on adverse effects in children, except for risk of infection or inflammation at the individual level. The intervention probably makes little or no difference to risk of Infection or inflammation at individual level as measured by C‐reactive protein (CRP) (moderate‐certainty evidence).
Wheat flour fortified with iron in combination with other micronutrients versus unfortified wheat flour (no micronutrients added)
Wheat flour fortified with iron, in combination with other micronutrients, may or may not decrease anaemia (RR 0.95, 95% CI 0.69 to 1.31; 2 studies; 322 participants; low‐certainty evidence). It makes little or no difference to average risk of iron deficiency (RR 0.74, 95% CI 0.54 to 1.00; 3 studies; 387 participants; moderate‐certainty evidence) and may or may not increase average haemoglobin concentrations (mean difference (MD) 3.29, 95% CI ‐0.78 to 7.36; 3 studies; 384 participants; low‐certainty evidence).
No trials reported data on adverse effects in children.
Wheat flour fortified with iron in combination with other micronutrients versus fortified wheat flour with same micronutrients (but not iron)
Given the very low certainty of the evidence, the review authors are uncertain about the effects of wheat flour fortified with iron in combination with other micronutrients versus fortified wheat flour with same micronutrients (but not iron) in reducing anaemia (RR 0.24, 95% CI 0.08 to 0.71; 1 study; 127 participants; very low‐certainty evidence) and in reducing iron deficiency (RR 0.42, 95% CI 0.18 to 0.97; 1 study; 127 participants; very low‐certainty evidence). The intervention may make little or no difference to the average haemoglobin concentration (MD 0.81, 95% CI ‐1.28 to 2.89; 2 studies; 488 participants; low‐certainty evidence).
No trials reported data on the adverse effects in children. Eight out of nine trials reported source of funding with most having multiple sources. Funding source does not appear to have distorted the results in any of the assessed trials.
Authors' conclusions
Eating food items containing wheat flour fortified with iron alone may have little or no effect on anaemia and probably makes little or no difference in iron deficiency. We are uncertain on whether the intervention with wheat flour fortified with iron increases haemoglobin concentrations improve blood haemoglobin concentrations.
Consuming food items prepared from wheat flour fortified with iron, in combination with other micronutrients, has little or no effect on anaemia, makes little or no difference to iron deficiency and may or may not improve haemoglobin concentrations.
In comparison to fortified flour with micronutrients but no iron, wheat flour fortified with iron with other micronutrients, the effects on anaemia and iron deficiency are uncertain as certainty of the evidence has been assessed as very low. The intervention may make little or no difference to the average haemoglobin concentrations in the population. None of the included trials reported any other adverse side effects. The effects of this intervention on other health outcomes are unclear.
Plain language summary
Does adding iron to wheat flour reduce anaemia and increase iron levels in the general population?
Why is this question important?
Anaemia is a common condition usually caused by low iron levels in the body. Iron is important because it is the main component of haemoglobin, the protein in red blood cells that carries oxygen around the body. If the body cannot produce enough healthy red blood cells to provide the body with sufficient oxygen, people may suffer from problems such as tiredness and inability to concentrate, children may have learning difficulties, and pregnant women and their babies may be at risk of death or developmental problems. People in low‐income countries often have diets that are low in iron, resulting in anaemia or low blood iron levels. Such countries attempt to tackle this problem at the population level by adding iron and other minerals and vitamins (micronutrients) to staple foods, such as wheat flour.
We wanted to know whether adding iron to wheat flour, alone or with additional micronutrients, reduces anaemia and iron deficiency in the general population. We also wanted to know if it causes any unwanted effects, for example diarrhoea, infection or inflammation, constipation, nausea, or death.
How did we identify and assess the evidence?
We searched medical databases for randomised controlled trials (RCTs) that assessed the effects on the general population, aged over two years, of wheat flour with added iron and other micronutrients compared to wheat flour alone or wheat flour with the same added nutrients but no additional iron. RCTs are medical studies where people are chosen at random to receive a treatment (the intervention), or a different treatment or no treatment (the control). RCTs provide the most reliable evidence.
Based on factors such as how studies were conducted and consistency of findings across studies, we categorised the evidence as high, moderate, low or very low certainty. High certainty means we are confident in the evidence, moderate certainty means we are fairly confident, low or very low certainty means that we are unsure or very unsure of the reliability of the evidence.
What did we find?
We found nine relevant RCTs. The study participants were 3166 children, adolescent girls and adult women living in Bangladesh, Brazil, India, Kuwait, the Philippines, Sri Lanka and South Africa. The studies assessed the effects of wheat flour with different forms of iron alone or combined with other micronutrients, compared with wheat flour alone or wheat flour with the same added micronutrients but no iron. Studies lasted from 3 to 24 months and reported anaemia, haemoglobin concentrations, iron deficiency and iron status. Two studies assessed infection and inflammation. None of the included studies assessed diarrhoea, respiratory infections, death, or other unwanted effects. Eight studies clearly reported their source of funding, including three with industry funding.
Key results
Wheat flour with iron may have little or no effect on anaemia and probably makes little or no difference in iron deficiency compared to wheat flour alone. We are uncertain whether wheat flour with iron increases haemoglobin concentrations. Wheat flour with iron probably makes little or no difference to individual risk of infection or inflammation.
Wheat flour with iron plus other micronutrients, may make little or no difference to anaemia, probably makes little or no difference to iron deficiency and may or may not improve haemoglobin concentrations compared to wheat flour alone.
We are very uncertain about the effects of wheat flour with iron plus other micronutrients compared to wheat flour with the same micronutrients but no iron on anaemia and iron deficiency, as the certainty of the evidence was very low. Wheat flour with iron may make little or no difference to haemoglobin concentrations.
What this means
We judged the evidence as very low to moderate certainty, which means we are not certain of the effect of wheat flour with added iron on the reduction of anaemia and iron deficiency on people in countries that add iron to wheat flour. We do not know whether adding iron to wheat flour causes unwanted effects because none of the studies reported unwanted effects.
How up to date is this review?
The review is up to date to September 2019.
Summary of findings
Background
Description of the condition
Anaemia is a condition in which the number of red blood cells (and consequently their oxygen‐carrying capacity) is insufficient to meet the body's physiologic needs. Specific physiologic needs vary with a person's age, sex, residential elevation above sea level (altitude), smoking behaviour, and different stages of pregnancy. Haemoglobin concentrations are used for the diagnosis of anaemia and assessment of its severity (WHO 2011a; WHO 2017). Anaemia results when there is an imbalance between production and the destruction of erythrocytes (Schnall 2000; Chaparro 2019). Similarly, iron deficiency occurs when physiological demands for iron are not met due to inadequate intake, absorption or utilization, or due to excessive losses. Several processes lead to iron‐deficiency anaemia, starting with a decrease in body iron stores, an impaired supply of iron to tissues, a sustained shortage of iron leading to iron‐deficient erythropoiesis, and finally an inadequate supply of ferrous iron for haemoglobin synthesis (Cook 1999; Camaschella 2017; Chaparro 2019).
Although iron deficiency is the most common cause of anaemia globally, other nutritional deficiencies (particularly folate, vitamin B12, vitamin A, copper); parasitic infections (including malaria, helminthes, schistosomes (i.e. hookworms and others)); chronic infection associated inflammation; and genetic disorders, such as common haemoglobinopathies like sickle cell disease, can all cause anaemia (WHO 2017). A high prevalence of anaemia is often found in low‐income countries, especially where infections such as malaria or hookworm are common. In addition, infection with HIV affects millions of people in the low‐ and middle‐income countries and may influence their iron status, but little is known about the acute phase response during HIV infection in the absence of opportunistic infection (WHO/CDC 2007; WHO 2017). In most settings, the relative contributions of these interacting factors is often unknown (Osorio 2002; WHO 2017). The red blood cell indices (mean corpuscular volume, mean corpuscular haemoglobin) are reduced in iron deficiency and can therefore help distinguish iron deficiency anaemia from some other causes, but they are not specific to iron deficiency, and can also be affected in the thalassaemic syndromes, which are common in many countries, and to some extent in the anaemia of infection and inflammation (Lynch 2012; Ganz 2019).
Haemoglobin concentrations alone cannot be used to diagnose iron deficiency. However, the concentration of haemoglobin should be measured, even though not all anaemia is caused by iron deficiency. For diagnosis of earlier stages of iron deficiency (before anaemia onset) several indicators are used. Currently available iron indicators permit a specific diagnosis of iron deficiency and iron deficiency anaemia in the clinical setting where other patient‐related information is available. However, these indicators are more difficult to interpret in populations from low‐ and middle‐income countries because anaemia is a multifactorial disease (Lynch 2012; Chaparro 2019). For example, the concentration of serum ferritin is positively correlated with the size of the total body iron stores in the absence of inflammation. Ferritin concentration is low in iron deficient individuals, regardless of confounding clinical conditions (Garcia‐Casal 2018b) and the laboratory methods most used to determine ferritin concentrations have comparable accuracy and performance (Garcia‐Casal 2018c). The WHO has recently updated their global, evidence‐informed recommendations on the use of ferritin concentration for assessing iron status in a population and for monitoring and evaluating iron interventions (WHO 2020). A low serum ferritin value reflects depleted iron stores, but not necessarily the severity of the depletion as iron deficiency progresses (WHO 2011b; Lynch 2017). Serum ferritin concentrations are proportional to stainable marrow iron in healthy individuals and are an indicator of depleted iron stores in liver, spleen, and bone marrow (Dallman 1986; Lynch 2017). Serum ferritin is also an acute phase protein and therefore values may not reflect iron status accurately in the presence of infection, limiting its usefulness in developing countries where malaria, HIV disease and tuberculosis are prevalent (Thurnham 2012).
Transferrin receptor is primarily expressed on cell surfaces to allow uptake of circulating iron bound to transferrin into cells and it is increased when tissue iron supply is reduced (Lynch 2007; Lynch 2017). However, this marker can also be an indicator of erythropoietic drive, as it is increased in conditions of haemolysis during acute and chronic asymptomatic malaria infection (Verhoef 2001; Stoltzfus 2017) and in conditions like sickle cell disease (Lulla 2010).
Transferrin saturation, which is less affected by inflammation status, is widely used to assess inadequate iron supply to tissue despite its diurnal variation (Umbreit 2005; Lynch 2017). Iron‐deficient erythropoiesis can be measured using zinc protoporphyrin, a relatively simple and valid technique (Gibson 2005; Lynch 2017), which may differentiate between infants who benefit from iron supplementation versus those who do not in a malaria‐endemic settings (Sazawal 2006).
Finally, the ratio of logged serum ferritin to soluble transferrin receptor concentration allows for the combination of iron status and tissue iron supply to determine body iron stores (Cook 2003), and is reported in one study to reflect bone marrow iron stores even in the presence of malaria and other infections (Phiri 2009). Since most of these indicators to assess iron status are susceptible to inflammation, markers of the acute phase, such as C‐reactive protein or alpha‐1‐acid‐glycoprotein (Wieringa 2002), should be measured concomitantly (Lynch 2017; Stoltzfus 2017; WHO 2017).
Ferritin concentrations increase in response to iron‐related interventions and may be used to monitor and assess the impact of interventions on iron status (WHO 2020) and should be measured with the haemoglobin concentration in all programme evaluations (WHO 2017).
Epidemiology
The population groups most vulnerable to anaemia, as of 2016, include children under 5 years of age (41.7% with anaemia worldwide), particularly infants and children under 2 years; non‐pregnant women (15 to 49 years; 32.5% with anaemia worldwide); and pregnant women (40.1% with anaemia worldwide) (WHO 2019a; Stevens 2013). Iron deficiency, a primary cause of anaemia in many settings, is estimated to affect an even larger number of people – two billion (WHO 2019b, Chaparro 2019). For severe anaemia, the aetiology of this condition is 50% in non‐pregnant women and children and 60% for pregnant women (Stevens 2013), reflecting the increased iron requirements during pregnancy. However, since iron deficiency can occur without concomitant anaemia, population iron deficiency rates may be greater than those of anaemia (Zimmermann 2007). Furthermore, while the early stages of iron deficiency are often asymptomatic, functional consequences in absence of anaemia may include increased maternal and perinatal mortality, low birth weight, impaired cognitive performance and poorer educational achievement as well as reduced work capacity (Beard 2006; Khan 2006), with serious economic impact on families and populations (Horton 2007; Garcia‐Casal 2019).
In low‐ and middle‐income countries, populations may experience a greater infectious burden and greater systemic inflammation, both of which can increase iron loss and concomitantly reduce iron absorption and utilisation (Prentice 2007; Weiss 2005). Moreover, in resource‐poor settings, demands for iron are less likely to be met through the diet, which is commonly plant‐based and low in bioavailable iron (Hurrell 2000; WHO 2017).
Description of the intervention
There are several strategies to prevent and/or treat iron deficiency and iron‐deficiency anaemia: dietary modification and diversification that aims to increase the content and bioavailability of iron in the diet (FAO/CAB International 2011); preventive or intermittent iron supplementation through tablets, syrups or drops; blood transfusion, indicated only for very severe anaemia; biofortification through conventional plant breeding or genetic engineering that increases the iron content or its bioavailability in edible plants and vegetables; and fortification with iron compounds of staple foods (typically maize, soy and wheat flour) at the point of production or milling (WHO/FAO 2006; WHO 2017). These are complementary interventions, some of which are population‐based while others are targeted at specific age groups or consumer groups. Deworming in conjunction with other interventions, such as malaria control interventions can be effective in some situations in reducing anaemia and in increasing the efficacy of interventions that increase iron intakes (Spottiswoode 2012).
Mass large‐scale fortification of staple foods or condiments is a preventive strategy aimed at reducing the risk of developing iron deficiency and iron‐deficiency anaemia through increased dietary iron. This intervention aims to reduce pre‐existing iron deficiency and iron‐deficiency anaemia prevalence and is designed and implemented to reach a large proportion of the population ‐ the one that consumes the industrialised fortified product. Iron fortification can be, and often is, accompanied by fortification with other micronutrients (i.e. folic acid, vitamin B12 or vitamin C), which may or may not enhance the effectiveness of the intervention (Zimmermann 2007).
Mass, targeted or market‐driven food fortification with iron has been used with various vehicles: soy sauce, fish sauce, salt, milk, sugar, beverages, bouillon cubes, maize flour, and complementary foods (WHO/FAO 2006). Iron fortification of foods is associated with increased haemoglobin, improved iron status, and reduced anaemia across populations (Gera 2012; Barkley 2015).
Wheat flour is a staple food for bread baking and by far the most commonly used medium in large‐scale iron‐fortification programmes. There are over 80 countries with legislation to fortify wheat flour produced in industrial mills with vitamins and minerals (FFI 2017). In all countries where it is mandatory to fortify wheat flour it is required that the flour includes at least iron and folic acid. The exceptions are Australia, which does not require iron, and Congo, Philippines, United Kingdom and Venezuela, which do not require folic acid (FFI 2014). Mandatory fortification of wheat flour was a key success in Morocco and Uzbekistan (Wirth 2012). Uzbekistan has wheat flour enriched with iron and folic acid at 50% of the nation's flour milling enterprises, with support provided by the Global Alliance for Improved Nutrition (GAIN) grant administered by the World Bank. Through the national wheat flour fortification programme, ferrous sulphate and folic acid are added to all wheat flour produced under the national food subsidy programme for baladi bread, a traditional bread in Egypt reaching an estimated 50 million Egyptians on a daily basis (Elhakim 2012). In 2009, Kyrgyzstan introduced the law 'On the Enrichment of Bread Flour' that envisages a phased transition of all mills to mandatory production of enriched flour (UNICEF 2009).
The benefit from and sustainability of an iron fortification programme depends not only on factors such as regular consumption of the chosen vehicle across the entire population, the quantity of added iron and its bioavailability, but also on the organization of the industrial sector in a given country. The choice of the food vehicle should be based on consumption data to ensure that the vehicle is consumed throughout the population and in sufficient quantity such that a suitable and affordable fortificant can be added with respect to bioavailability, sensorial stability, mixing properties, and cost constraints. More specifically, there must also be a balance between intake of the vehicle (wheat flour) and the amount of iron added to achieve an estimated effective daily iron absorption of about 1 to 2 mg per day (WHO 2009).
Wheat production, processing and flour preparation
Wheat is the third largest cereal crop produced in the world, after maize and rice, and the second most consumed in the diet after rice. It is estimated that about 65% of the global wheat crop is used for food, 17% is used for animal feed and 12% is used in industrial applications including bio‐fuel production (FAO 2013). Wheat varieties including hard/soft, winter/spring, and red, white, or durum are grown at a variety of altitudes and in various soil types throughout the world (FAO 2009). All types belong to the genus Triticum aestivum, subspecies vulgare. In addition, three other species are cultivated and traded: the Triticum durum, compactum and spelta. Because of its quality, durum wheat is used by the pasta industry, and non‐durum is used by either the milling, livestock feed or for ethanol production. Wheat kernels are composed of three components: the bran, the germ, and the endosperm.
The Food and Agriculture Organization of the United Nations (FAO) is forecasting global wheat output at 766.4 million tonnes for 2019 (a 4.8% increase from 2018) (FAO 2019). Consumption of wheat is forecast to register 758 million tonnes in 2019/20 (FAO 2019). International wheat prices declined slightly over the course of 2019, with the benchmark United States wheat (No.2 hard red winter) ending around USD 220 per tonne (FAO 2019b). The United States, the European Union, Canada, Australia and the former Soviet Union were the five top wheat exporters between 1980 and 2013. Developing countries consume 77% of wheat produced globally and are generally wheat importers, with wheat accounting for 24% of imported food commodities in these countries (Enghiad 2017).
The majority of wheat is milled into flour through the mechanical extraction of the endosperm, the core part of the kernel. The endosperm contains the bulk portion of the kernel's protein and carbohydrates (FAO 2009). The cost of grain accounts for about 81% of the total cost of flour, while the rest of the cost is for electricity (6.5%), labour (4%), expendable materials and other costs (8.5%), according to the International Association of Operative Millers (FAO 2009). Wheat flour is then used to prepare different breads that use methods for breadmaking that have been developed and adapted to consumer demands, such as conventional bread making, retarded proofing, interrupted proofing, frozen dough, frozen fermented dough and bake‐off technology (Rosell 2011). Breadmaking involves continuous biochemical, microbiological and organoleptic changes that result from the mechanical and thermal action as well as the activity of the yeast, lactic acid bacteria and the endogenous enzymes.
The production of wheat flour is a complex, multi‐step process that depends up on the physical grinding and separation of the kernel components of wheat (more specifically to isolate the protein‐ and carbohydrate‐containing endosperm) and subsequent sifting into flour (Van Der Borght 2005). The extent to which the flour is sifted to separate the fine‐grain endosperm is known as extraction rate, with higher extraction rate indicating higher retention of the bran and germ. Most of the vitamins and minerals from wheat are found in the bran or germ, and flours of 80% or lower extraction rates have a significantly reduced nutrient content. However, high‐extraction flour contains higher levels of phytates, which chelate minerals and thus interfere with intestinal absorption of iron (Kumar 2010).
Some products made with wheat flour may be leavened or unleavened. In India, wheat flour is used to produce unleavened flat bread such as the South Indian parotta, naan and batura (Indrani 2011). Sourdough breads are also produced primarily in retail and artisan bakeries with wheat flour and water using baker's yeast for dough leavening. Lactic acid, bacteria and yeast are responsible for the fermentation as well as for the aromatic precursors of bread (Catzeddu 2011). Composite wheat flours that include plantains, soybeans, tiger nuts, and breadfruits can be relevant for places with scarce resources for bread production, but at least 70% of wheat flour is required for good dough formation (Olaoye 2011).
How the intervention might work
The more the industrial sector of wheat flour is centralised, formalised and has established an efficient distribution system, the lower the costs associated with mass fortification. Local governments have a central role in regulatory enforcement, good manufacturing practices, distribution and control of the fortificant premix (Dary 2002). Together with an effective distribution system for wheat flour, this increases the accessibility and affordability of appropriately fortified wheat flour to the at‐risk population. It also limits the need to promote an active role for individuals to maintain adherence to the intervention itself.
The challenges of wheat flour fortification with iron relate to the bioavailability of the iron compound used, the sensory effects of the compound in the final product produced with the wheat flour, and/or the shelf stability of the compound in the flour and/or final product. For example, ferrous fumarate and ferrous sulphate are relatively bioavailable, but ferrous sulphate can affect product flavour, especially after long‐term storage and in presence of fat (Dary 2002; Hurrell 2010). It is also important to consider wheat consumption patterns and the cost/feasibility of the fortification scheme when determining optimal iron fortificant levels in flour (Hurrell 2010). Although sodium iron ethylenediaminetetraacetate is protected from chelation by phytates in high extraction rate wheat flour, it is considerably more costly than the other iron forms used for fortification (Hurrell 2010).
For wheat flour fortification, several iron compounds have been used over the years, but recently published recommendations suggest the following iron fortificants and levels, which also take into account wheat flour extraction rates and consumption levels (Hurrell 2010;WHO 2009).
For high extraction wheat flour (that has a high content of iron absorption inhibitors), the only recommended compound is sodium iron ethylenediaminetetraacetate. Levels of addition depend on the daily per capita consumption: 15 ppm iron as sodium iron ethylenediaminetetraacetate if daily consumption is over 300 g of wheat flour/day, 20 ppm if daily consumption is between 150 and 300 g per day, and 40 ppm if consumption is below 150 g/day.
Ferrous sulphate and fumarate can be used with low extraction rate flour: 20 ppm iron for flour intakes >300 g/day; 30 ppm iron for flour intakes 150‐300 g/day and 60 ppm iron for intakes < 150 g/day.
Sodium iron ethylenediaminetetraacetate, ferrous sulphate and ferrous fumarate are first choices as iron fortificants. The use of electrolytic iron, which can be used for low extraction flours, is now discouraged (Hurrell 2010).
This review aims to assess the effects of wheat flour fortification with iron as a public health intervention. The World Health Organization and Centers for Disease Control and Prevention (WHO/CDC) logic model for micronutrient interventions in public health depicts the programme theory and plausible relationships between inputs and expected improvement in 'Sustainable Development Goals' (WHO 2018). This model can be adapted to different contexts (De‐Regil 2014). The effectiveness of wheat flour fortification with iron in public health depends on several factors related to policies and legislation regulations; production and supply of the fortified maize flour; the development of delivery systems for the fortified wheat flour; the development and implementation of external and internal food quality control systems; and the development and implementation of strategies for information, education and communication for behaviour change among consumers (WHO 2011c). A generic logic model for micronutrient interventions that depicts these processes and outcomes is presented in Figure 1.
1.
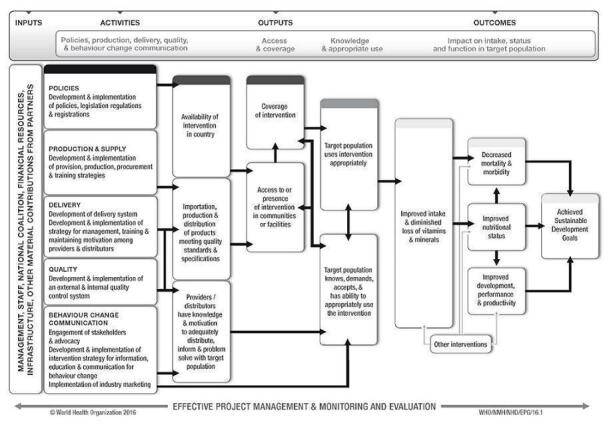
WHO/CDC generic logic model for micronutrient interventions (with permission from WHO)
Risks of wheat flour fortification with iron
As is the case with any fortification or supplementation programme involving iron, the largest potential risk of the programme is secondary iron overload in certain individuals of the given fortified population (Pasricha 2012). Iron overload is observed in individuals who have heritable iron metabolism disorders which cause perturbed iron absorption and/or storage, leading to iron accumulation to subsequent tissue damage most commonly in the liver, pancreas and endocrine organs (Sousa 2019). The most common iron overload disorder is associated with mutations in the HFE gene, the gene for hereditary haemochromatosis. Other physiological conditions are also associated with iron overload including, thalassaemia, pyruvate kinase deficiency, and glucose‐6‐phosphate dehydrogenase deficiency, among others (Andrews 2000; Garcia‐Casal 2018). A generic logic model for micronutrient interventions depicting the processes and outcomes along with the interconnected factors being considered in this review is presented in Figure 1.
Why it is important to do this review
Iron deficiency is one of the most common micronutrient deficiencies worldwide, and iron‐deficiency anaemia affects billions of people in all countries (Zimmermann 2007; Chaparro 2019). Food fortification of staple foods with iron is thought to be a feasible, well tolerated and potentially very effective strategy to prevent and reduce iron deficiency and iron‐deficiency anaemia (WHO/FAO 2006; Garcia‐Casal 2018). Wheat flour is a staple food for baking in a large number of countries, and therefore is considered one of the most optimal vehicles for fortification with iron and other vitamins and minerals. Since wheat flour fortification is a complex intervention, a variety of study designs across a range of settings and amongst diverse populations are needed to adequately measure success and to develop policies for improving the health of diverse populations. The generalisability of findings remains crucial. Several studies have been conducted to determine the efficacy and effectiveness of wheat flour fortification with iron to reduce iron deficiency and iron‐deficiency anaemia (Darnton‐Hill 1999; Hurrell 2000; Mannar 2002; Nestel 2004; Zimmermann 2005a), but results from both experimental and observational studies have not been systematically summarised.
Objectives
To determine the benefits and harms of wheat flour fortification with iron alone or with other vitamins and minerals (vitamin A, zinc, folic acid, others) on anaemia, iron status and health‐related outcomes in populations over two years of age.
Methods
Criteria for considering studies for this review
Types of studies
We included the following study designs.
Randomised‐controlled trials (RCTs), with randomization at either the individual or cluster level
Quasi‐RCTs (where allocation of treatment has been made, for example, by alternate allocation, date of birth, alphabetical order, or other means).
RCTs can provide information on whether iron‐fortified wheat flour can effectively achieve changes in health outcomes and anaemia, iron deficiency, or vitamin and mineral status for those receiving the intervention. Food fortification is, however, an intervention that aims to reach large sections of the population and is frequently delivered through the market system. We anticipated, therefore, that we would not be able to assess the benefits and risks of wheat flour fortification by only including randomised trials. We thus considered including other study designs (Higgins 2019). Initially we intended to include non‐RCTs and observational studies, with an aim to cover evidence from designs other than RCTs. However, considering the limited information provided and the narrative aspects of conclusions drawn from non‐RCTs, only RCTs were used to assess the efficacy of wheat fortification in reducing the prevalence of anaemia. Hence we excluded non‐RCTs and observational studies from this review, and they were not used to complement the discussions or draw any conclusions.
Types of participants
General population of all age groups (including pregnant women) from any country over two years of age. If any study included participants in the age range of less than 2 years and also had more than half of its population in the 2 years and above category, we included such studies in this review. We excluded studies of interventions targeted toward participants with a pre‐diagnosed critical illness or severe co‐morbidities.
Types of interventions
Any form of wheat flour iron fortification, with or without other micronutrients, compared to no fortification, fortification without iron or no intervention.
Standard criteria and terminology for fortification interventions has been used since January 1970 (Finch 1972). We thus considered any form of wheat flour iron fortification independently of length of intervention, extraction rate of wheat flour, iron compounds used, preparation of the iron‐flour premix, and fortification levels achieved in the wheat flour or derivative foods.
We considered any wheat flour for direct human consumption prepared from common wheat, Triticum aestivum L., or club wheat, Triticum compactum Host., or mixtures thereof (Codex Alimentarius 1995); durum wheat semolina, including whole durum wheat semolina and durum wheat flour prepared from durum wheat (Triticum durum Desf.) (Codex Alimentarius 1991) as well as products prepared with these flours. We included composite flours that contained more than 70% wheat flour within the definition of wheat flour in this review.
We excluded studies with wheat flour destined for use as a brewing adjunct or for the manufacture of starch and/or gluten or flours whose protein content had been reduced or which had been submitted after the milling process to a special treatment other than drying or bleaching.
We only included studies where the fortification occurred at the production stage of food items (e.g. biscuits, bread rolls) made with the fortified wheat flour (fortification at flour stage).
We only included studies with co‐interventions (i.e. such as education, deworming) if the comparison group also received the same co‐intervention in addition to the unfortified wheat flour.
Comparisons included the following:
wheat flour fortified with iron alone versus unfortified wheat flour (no micronutrients added);
wheat flour fortified with iron in combination with other micronutrients versus unfortified wheat flour (no micronutrients added);
wheat flour fortified with iron in combination with other micronutrients versus fortified wheat flour with same micronutrients (but not iron);
wheat flour fortified with iron alone versus no intervention; and
wheat flour fortified with iron in combination with other micronutrients versus no intervention.
We excluded studies comparing iron‐fortified wheat flour with other forms of micronutrient interventions (that is supplementation, dietary diversification, point‐of‐use fortification of foods with multiple micronutrient powders, biofortification of crops) or the effects of the fortification of other food vehicles (Garcia‐Casal 2018; Peña‐Rosas 2019). We also excluded fortification of wheat flours with other micronutrients (Centeno Tablante 2019; Das 2012; Hombali 2019; Santos 2019; Shah 2016) as these topics are covered in other systematic reviews.
Types of outcome measures
Primary outcomes
The primary outcomes considered across all populations in this review are the presence of anaemia, iron deficiency and haemoglobin concentrations.
Anaemia (defined as haemoglobin below WHO cut‐off for age and adjusted for altitude as appropriate).
Iron deficiency (as defined by trialists, based on a biomarker of iron status).
Haemoglobin concentration (g/L).
For children aged 2 to 11 years, we also included the following primary outcomes.
Diarrhoea (three liquid stools in a single day).
Respiratory infections (as measured by trialists).
All‐cause death.
Infection or inflammation at individual level (as measured by urinary neopterin, C‐reactive protein or alpha‐1‐acid glycoprotein variant A).
Secondary outcomes
We considered the following secondary outcomes.
Anthropometric measures (height‐for‐age z‐score and weight‐for‐height z‐score for children, body mass index (BMI) for adults).
Risk of iron overload (defined as serum ferritin higher than 150 µg/L in females and higher than 200 µg/L in men) (WHO 2011b).
Cognitive development in children aged 2 to 11 years (as defined by trialists).
Motor skill development in children aged 2 to 11 years (as defined by trialists).
Clinical malaria (as defined by trialists).
Severe malaria (as defined by trialists).
Adverse side effects (including constipation, nausea, vomiting, heartburn or diarrhoea, as defined by trialists).
Search methods for identification of studies
We designed and piloted a structured search strategy. We carried out this search strategy to date, in electronic databases and handsearched relevant journals and publications to identify relevant primary studies and, where necessary, we contacted authors for unpublished/ongoing studies. We consulted institutions, agencies and experts in the fields regarding the results of our search and for any additional data (Dealing with missing data).
Electronic searches
We searched the following electronic databases:
International databases
MEDLINE (OVID; 1946 to 27 September 2019)
MEDLINE (R) In Process (OVID) 1946 to September week 4 2019 (27/09/2019)
Web of Science; Social Science Citation Index (SSCI) and Science Citation Index (SCI) (27/09/2019)
Cochrane Central Register of Controlled Trials (CENTRAL) via Cochrane Register of Studies Online (CRSO) (27/09/2019)
EMBASE (OVID; 1947 to 27 September 2019)
CINAHL EBSCOhost (1982 to 27 Septmeber 2019)
POPLINE (http://www.popline.org/; 16 April 2018) ‐ Database no longer exists
BIOSIS (ISI; Previews to January 2020)
AGRICOLA (Ebsco; 1970 to 27/09/2019)
Food Science and Technology Abstracts (FSTA) 1969 to present (16/04/2018)
OpenGrey 1960 to present (16/04/2018)
Trials Register of Promoting Health Interventions (TRoPHI) (16/04/2018)
ClinicalTrials.gov (searched 27/09/2019)
The International Clinical Trials Registry Platform (ICTRP; apps.who.int/trialsearch; searched 27 September 2019), and we also contacted relevant organisations (September 2019) for the identification of ongoing and unpublished studies.
Regional databases
Índice Bibliográfico Español en Ciencias de la Salud (IBECS); ibecs.isciii.es; searched 27 September 2019
Scientific Electronic Library Online (SciELO); www.scielo.br; searched 27 September 2019
Global Index Medicus ‐ WHO African Region (AFRO) (includes African Index Medicus (AIM); www.globalhealthlibrary.net/php/index.php?lang=en); WHO Eastern Mediterranean Region (EMRO) (includes Index Medicus for the Eastern Mediterranean Region (IMEMR); www.globalhealthlibrary.net/php/index.php?lang=en); searched 27 September 2019
LILACS (Latin American and Caribbean Health Sciences Literature); lilacs.bvsalud.org/en; searched 27 September 2019
WHO Pan American Health Organization (PAHO) Library; www1.paho.org/english/DD/IKM/LI/library.htm; searched 27 September 2019
WHO Library and Information Networks for Knowledge online catalogue (WHOLIS (WHO Library); dosei.who.int/); searched 27 September 2019
WPRIM (Western Pacific Region Index Medicus; www.wprim.org/); searched 27 September 2019
Index Medicus for South‐East Asia Region (IMSEAR; imsear.hellis.org); searched 27 September 2019
IndMED, Indian medical journals; medind.nic.in/imvw/; searched to September 2019 (27/09/2019)
Native Health Research Database; hslic-nhd.health.unm.edu; searched to September 2019 (27/09/2019)
For dissertations or theses, we searched WorldCat, Networked Digital Library of Theses and Dissertations and ProQuest‐Desertations and Theses. We also contacted the Trials Search Co‐ordinator of the Cochrane Public Health Group to search the Group's Specialised Register. The search used keywords and controlled vocabulary (when available), using the search strategy set out in the Appendix 1 and adapting them as appropriate for each database. As wheat flour fortification technologies are relatively novel, we limited the search, from 1960 to present, for all databases.
We did not apply any language restrictions. If we identified articles written in a language other than English, we had commissioned their translation into English. If this was not possible, we aimed to seek advice from the Cochrane Public Health Group. We aimed to categorise such articles as 'Studies awaiting classification' until the availability of English translation. However we did not find any studies screened for full text published in other languages.
Searching other resources
For assistance in identifying ongoing or unpublished studies, we contacted headquarters and regional offices of the WHO, the nutrition section of the United Nations Children's Fund (UNICEF), the World Food Programme (WFP), the U.S. Centers for Disease Control and Prevention (CDC), US Agency for International Development (USAID), Nutrition International (NI), the Global Alliance for Improved Nutrition (GAIN), Hellen Keller International (HKI), Sight and Life Foundation, PATH, the Wright Group, premix producers DSM and BASF, and the Food Fortification Initiative (FFI) (September 2019).
Data collection and analysis
Selection of studies
Two review authors (MF, DE) independently screened the titles and abstracts of articles retrieved by each search to assess eligibility, as determined by the inclusion and exclusion criteria listed above in the initial search. Two review authors (PM, JPPR) independently screened the updated search results in September 2019 using the Covidence platform (Covidence 2018). We retrieved full‐text copies of all eligible papers for further evaluation when a title or abstract could not be rejected with certainty. If full‐text articles could not be obtained, we attempted to contact the authors to obtain further details of the study. Failing this, we classified such studies as 'Studies awaiting classification' until further information is published or made available to us. We resolved any disagreements at any stage of the eligibility assessment process through discussion and consultation with a third author (JPPR) in the initial search and (MF) in the updated search in 2018, where necessary. An author (JPPR) checked the excluded titles. We used a Preferred Reporting Items for Systematic Reviews and Meta‐Analyses (PRISMA) flow diagram to summarise our study selection processes (Liberati 2009).
Data extraction and management
Two review authors (MF, DE) independently extracted data using the data extraction forms released by the Cochrane Public Health Group and the Cochrane Effective Practice and Organisation of Care (EPOC) Group (Cochrane EPOC Group 2013; Cochrane Public Health Group 2011).
All review authors were involved in piloting the form using a subset of articles in order to enhance consistency amongst reviewers; based on this, we modified the form. We collected information on study design, study setting, participants (number and characteristics) and provide a full description of the interventions examined. We also collected details of outcomes measured (including a description of how and when outcomes were measured) and study results.
The form was designed so that we were able to record results for our prespecified outcomes as well as for other (non‐specified) outcomes (although such outcomes did not underpin any of our conclusions). We extracted additional items relating to study recruitment and the implementation of the intervention, including number of sites for an intervention, whether recruitment was similar at different sites, levels of compliance and use of condiments in different sites within studies, resources required for implementation, and whether a process evaluation was conducted. We used the PROGRESS plus (Place of Residence, Race/Ethnicity, Occupation, Gender, Religion, Education, Socioeconomic Status, and Social Capital) checklist (O'Neill 2013) to record whether or not outcome data had been reported by sociodemographic characteristics known to be important from an equity perspective. We also recorded whether or not studies included specific strategies to address diversity or disadvantage. We documented the sources of study funding (marked as 'unknown' if this information was not available and we were unable to obtain it on request from the authors).
We entered all data into the Cochrane statistical software, Review Manager 2020, and the data were checked for accuracy.
Assessment of risk of bias in included studies
We used the Cochrane EPOC Group 'RIsk of bias' tool for studies with a separate control group to assess the risk of bias of all studies (Cochrane EPOC Group 2013). This includes five domains of bias: selection, performance, attrition, detection and reporting; as well as an 'other bias' category to capture other potential threats to validity. The risk of bias assessment was made at the study level. We assessed each item to be at low, high, or unclear risk of bias (unclear bias corresponding to studies with insufficient information for judgement despite all efforts to gather the information related to that domain), as set out in the Cochrane Handbook for Systematic Reviews of Interventions (Higgins 2011). While justifying the judgement, we provided quote from the study for each item in the 'Risk of bias' tables. In case of unclear data or missing information, the authors of included studies were contacted for clarification.
Two review authors (JPPR, MF) independently assessed risk of bias for each study and any disagreement was resolved by discussion or by involving an additional review team member (PM).
Assessing risk of bias in randomised trials and quasi‐randomised trials
(1) Random sequence generation (checking for possible selection bias)
We assessed studies as:
low risk of bias if there is a random component in the sequence generation process (e.g. random number table; computer random number generator);
high risk of bias if a non‐random approach has been used (e.g. odd or even date of birth; hospital or clinic record number). Non‐randomised studies should be scored 'high';
unclear risk of bias if not specified in the paper.
(2) Allocation concealment (checking for possible selection bias)
We assessed studies as:
low risk of bias if participants and investigators enrolling participants could not foresee assignment because an appropriate method was used to conceal allocation (e.g. telephone or central randomization; consecutively numbered sealed opaque envelopes). This rating will be given to studies where the unit of allocation was by institution and allocation was performed on all units at the start of the study;
high risk of bias if participants of investigators enrolling participants could possibly foresee assignments and potentially introduce selection bias (e.g. open random allocation; unsealed or non‐opaque envelopes);
unclear.
(3) Blinding of participants and personnel (checking for possible performance bias)
We assessed the risk of performance bias associated with blinding as:
low risk of bias if there was blinding of participants and key study personnel and it was unlikely to have been broken
high risk of bias if there was no blinding or incomplete blinding or if there was blinding that was likely to have been broken
unclear risk of bias.
(4) Blinding of outcome assessment (checking for possible detection bias)
We assessed the risk of detection bias associated with blinding as low, high or unclear risk of bias for outcome assessment.
low risk of bias if there was blinding of the outcomes.
high risk of bias if there was no blinding or incomplete blinding or if there was blinding that was likely to have been broken and the outcome or outcome assessment was likely to be influenced by a lack of blinding;
unclear risk of bias.
(5) Incomplete outcome data (checking for possible attrition bias through withdrawals, dropouts and protocol deviations)
We assessed outcomes in each included study as:
low risk of bias due to incomplete outcome data, which could be either that there were no missing outcome data or the missing outcome data were unlikely to bias the results based on the following considerations: study authors provided transparent documentation of participant flow throughout the study, the proportion of missing data was similar in the intervention and control groups, the reasons for missing data were provided and balanced across the intervention and control groups, the reasons for missing data were not likely to bias the results (e.g. moving house).
high risk of bias if missing outcome data was likely to bias the results. Studies will also receive this rating if an 'as‐treated' (per protocol) analysis is performed with substantial differences between the intervention received and that assigned at randomization, or if potentially inappropriate methods for imputation have been used;
unclear risk of bias.
(6) Selective reporting bias
We assessed studies as:
low risk of bias if it is clear, either by availability of the study protocol or otherwise, that all prespecified outcomes that are of interest in the review have been reported;
high risk of bias if it is clear that not all of the study's prespecified outcomes have been reported, or reported outcomes were not prespecified (unless justification for reporting is provided), or outcomes of interest are reported incompletely and cannot be used, or where one or more of the primary outcomes is reported using measurements or analysis methods that were not prespecified, or finally if the study report fails to include an important outcome that would be expected to have been reported;
unclear risk of bias.
(7) Other sources of bias
We detail other possible sources of bias (if any, for e.g. source of funding, protocol quality etc) for each included study and give a rating of low, high or unclear risk of bias for this item.
Assessing risk of bias in cluster‐randomised trials
In addition to the domains mentioned above, the domains of risk of bias assessed for cluster‐randomised trials included recruitment bias, baseline imbalance, loss of clusters, incorrect analysis, and comparability with individually randomised trials. We assessed each domain to be at low, high, or unclear risk of bias.
We assessed included studies as follows.
(1) Recruitment Bias
We assessed the risk of recruitment bias as:
low risk of bias if individuals were recruited to the trial before the clusters were randomised
high risk of bias if individuals were recruited to the trial after the clusters were randomised
unclear risk of bias
(2) Baseline imbalance
We assessed the risk of baseline imbalance bias as:
low risk of bias if baseline characteristics were reported and were similar across clusters or if authors used stratified or pair matched randomization of clusters.
high risk of bias if baseline characteristics were not reported or if there were differences across clusters.
unclear risk of bias.
(3) Loss of clusters
We assessed the risk of loss of clusters bias as:
low risk of bias if no complete clusters were lost or omitted from the analysis.
high risk of bias if complete clusters were lost or omitted from the analysis.
unclear risk of bias.
(4) Incorrect analysis
We assessed the risk of in correct analysis bias as:
low risk of bias if study authors appropriately accounted for clusters in the analysis or provided enough information for review authors to account for clusters in the meta‐analysis.
high risk of bias if study authors have not appropriately accounted for clusters in the analysis or did not provide enough information for review authors to account for clusters in the meta‐analysis.
unclear risk of bias
(5) Compatibility with individual RCT
We assessed the risk of compatibility with individual RCT as:
low risk of bias if effects of the intervention were likely not altered by the unit of randomization.
high risk of bias if effects of the intervention were likely altered by the unit of randomization.
unclear risk of bias.
Overall risk of bias
For each of the included study, we summarised the overall risk of bias by primary outcomes within that study. Studies were deemed to be at low risk of bias if they were assessed as low risk of bias in all of the following domains: allocation concealment, similarity of baseline outcome measurements, and incomplete outcome data. When the risk of bias in any of the domains was either high or unclear, we classified that study at high overall risk of bias. Judgements also considered the likely magnitude and direction of bias and whether it was likely to impact on the findings of the study.
Overall certainty of evidence
We used the Grading of Recommendations Assessment, Development and Evaluation (GRADE) approach to interpret findings (Langendam 2013), and we used the GRADEprofiler software to import data from Review Manager 2020 to create 'Summary of findings' tables (GRADEpro GDT 2015). The GRADE approach included risk of bias, directness of evidence, inconsistency (heterogeneity), precision of effect estimates and risk of publication bias across the included studies.
We listed the primary outcomes for each comparison with estimates of relative effects along with the number of participants and studies contributing data for those outcomes. These tables provide outcome‐specific information concerning the overall certainty of evidence from studies included in the comparison, the magnitude of effect of the interventions examined, and the sum of available data on the outcomes we considered. We included only primary outcomes in the 'Summary of findings' tables. For each individual outcome, two review authors (JPPR, LMD) independently assessed the certainty of the evidence using the GRADE approach (Balshem 2011).
For each outcome that included pooled data from included RCTs, we presented the number of participants and studies for each outcome and certainty of the body of evidence, using the GRADE approach (GRADEpro GDT 2015), as stated above. We downgraded the certainty of evidence on the basis of risk of bias (reporting bias and overall risk of bias), inconsistency, substantial heterogeneity (I²), overlapping 95% confidence intervals between studies and large between‐study variance (tau²). We considered the extent of consistency towards direction of point estimates from individual studies. We expressed the certainty of evidence at one of the four levels of certainty (high, moderate, low, or very low).
Measures of treatment effect
For dichotomous outcomes, we presented proportions and, for two‐group comparisons, we presented results as risk ratios (RRs) with 95% confidence intervals (CIs).
For continuous outcomes, we used the mean differences (MDs) with 95% CIs if outcomes were measured in the same way between trials. Where some studies have reported endpoint data and others have reported changes from baseline data (with errors), we combined these in the meta‐analyses if the outcomes had been reported using the same scale.
We used standardized mean differences (SMDs) with 95% CIs to combine trials that measured the same outcome (for example haemoglobin) but used different methods.
Unit of analysis issues
Cluster‐randomised trials
We combined results from both cluster‐ and individually randomised studies if there was little heterogeneity between the studies. If the authors of cluster‐randomised trials (CRTs) conducted their analyses at a different level to that of allocation, and they had not appropriately accounted for the cluster design in their analyses, we calculated trials' effective sample sizes to account for the effect of clustering in those data. Whenever available, we utilised the intra‐cluster correlation coefficient (ICC) derived from the trial. However, the Nestel 2004 (C) study did not report ICC; hence it was taken as 0.02 from other sources (Gulliford 1999; Adams 2004) as recommended by Cochrane Handbook for Systematic Reviews of Interventions based on the cluster size, adjusted for baseline characteristics, at 75th centile and then calculated the design effect with the formula provided in the Cochrane Handbook for Systematic Reviews of Interventions (Higgins 2019). We reported these adjusted values and then undertook sensitivity analysis to investigate the effect of variations in ICC.
We extracted these parameters from the CRT articles: type of outcome (haemoglobin, anaemia, and iron deficiency (ID)); number of control and intervention participants as well as sample size; mean and standard deviation (for continuous variables) or number of events and prevalence (dichotomous variables); description of methods used and study design; description of the clusters including average cluster size (M). The following assumptions were made: 1) the ICC for the outcome 'anaemia' was taken as the ICC for the outcome 'haemoglobin' (in the absence of a specific haemoglobin ICC); 2) the cluster type 'not‐for‐profit daycare' was taken as the same as 'postal code cluster' (in the absence of an specific not‐for‐profit daycare specific ICC) for the Barbosa 2012 (C) trial; and 3) for Rahman 2015 (C), the average number of children aged six years or above in the bari was considered as mean cluster size. Finally, we corrected all quantities affected by the effective sample size (number of control and intervention samples, sample size etc.) due to cluster‐randomisation by dividing the corresponding quantity by the design effect. The details of adjustments for the design effect related to each of the included CRTs are given in Characteristics of included studies.
Studies with more than two treatment groups
Where we identified studies with more than two intervention groups (multi‐arm studies), we combined groups where possible to create a single pair‐wise comparison or use the methods set out in the Cochrane Handbook for Systematic Reviews of Interventions to avoid double‐counting study participants (Higgins 2019). If the control group was shared by two or more study arms, we divided the control group over the number of relevant subgroup categories to avoid double‐counting the participants (for dichotomous data, we divided the events and the total population while for continuous data we assumed the same mean and standard deviation but divided the total population). We illustrate these details in the 'Characteristics of included studies' tables. For the Nestel 2004 (C) trial, which had multiple arms of interventions and different study populations; the continuous variables were reported separately for each group within the population, so we computed the weighted average and included this in the pair‐wise analysis.
Dealing with missing data
We aimed to record missing outcome data and levels of attrition for included studies on the data extraction form. We explored the impact of including studies with high levels of missing data in the overall assessment of treatment effect by using sensitivity analysis. For all outcomes, we carried out analyses, as far as possible, on an intention‐to‐treat basis, that is include all participants randomised to each group in the analyses, and analyse in the group to which they were allocated regardless of whether or not they received the allocated intervention. The denominator for each outcome in each trial is the number randomised minus any participants whose outcomes are known to be missing.
Assessment of heterogeneity
We examined forest plots from a meta‐analyses to visually determine the level of heterogeneity (in terms of the size or direction of treatment effect) between studies. We used T2, I2 and Chi2 statistics to quantify the level of heterogeneity among the trials in each analysis. We regard substantial or considerable heterogeneity as T2 > 0 and either I2 > 30% or a low P value (< 0.10) in the Chi2 test. We noted this in the text and explored it using prespecified subgroup analyses mentioned below. Caution was taken in the interpretation of those results with high levels of unexplained heterogeneity.
Assessment of reporting biases
Where we suspected reporting bias, we attempted to contact study authors and asked them to provide missing outcome data. Where this was not possible, and the missing data were thought to introduce serious bias, we explored the impact of including such studies in the overall assessment of results using a sensitivity analysis.
We did not anticipate that there would be sufficient studies contributing data for any particular outcome for us to examine possible publication bias; if more than 10 studies reporting the same outcome of interest were available, we planned to generate funnel plots in Review Manager 2020 and visually examine them for asymmetry. Where we pooled studies in a meta‐analysis, we ordered studies in terms of weight so that a visual examination of forest plots allowed us to assess whether the results from smaller and larger studies were similar or if there were any apparent differences according to study size.
Data synthesis
We carried out meta‐analyses to provide an overall estimate of treatment effect when more than one study examined the same intervention, provided that studies used similar methods and measured the same outcome in similar ways and in similar populations. We used random‐effects model meta‐analyses (Borenstein 2009) for combining data, as we anticipated that there may be natural heterogeneity among studies attributable to the different doses, durations, populations, and implementation or delivery strategies. For continuous variables, we used the inverse‐variance method while for dichotomous variables, we used the one proposed by Mantel‐Haenzel.
Guided by the data extraction form in terms of the ways in which studies may be grouped and summarised as well as by an equity perspective based on the PROGRESS framework (Oliver 2008), we used narrative synthesis to describe the outcomes, explore intervention processes, and describe the impact of interventions by sociodemographic characteristics.
Subgroup analysis and investigation of heterogeneity
Subgroup analyses address whether the summary effects vary in relation to specific (usually clinical) characteristics of the included studies or their participants.
We considered the following subgroups:
prevalence of anaemia at baseline in the target group: less than 20% versus 20% to 39% versus 40% or higher versus mixed/unknown.
type of iron compound: high relative bioavailability (e.g. iron ethylenediaminetetraacetic acid) versus ferrous sulphate and comparable relative bioavailability (e.g. fumarate) versus low relative bioavailability (e.g. reduced iron, electrolytic iron, others).
estimated wheat flour available per capita: less than 75 g/day versus 75 to 149 g/day versus 150 to 300 g/day versus more versus unknown/unreported.
malaria endemicity at the time that the trial was conducted: malaria setting versus non/unknown malaria setting.
duration of intervention: less than six months versus six months to one year versus more than one year.
flour extraction rate: 80% or less versus more than 80% versus unknown/unreported.
amount of elemental iron added to flour:40 mg/kg or less versus 41 to 60 mg/kg versus more than 60 mg/kg versus unreported/unknown.
We examined differences between subgroups by visual inspection of the CIs; non‐overlapping CIs suggesting a statistically significant difference in treatment effect between the subgroups. We conducted analyses in Review Manager 2020. We limited our subgroup analyses to those primary outcomes for which three or more trials contributed data.
Sensitivity analysis
We carried out sensitivity analysis to examine:
The effects of removing trials at high risk of bias (trials with poor or unclear allocation concealment and either blinding or high/imbalanced loss to follow‐up) from the analysis;
The effects of different intra‐cluster correlation (ICC) values for cluster randomised control trials on the overall effect estimate (Table 4);
Source of funding (industry versus non‐industry funding of study)
1. Sensitivity analysis of the cluster RCTs with different ICCs.
| Outcome (all studies included in the analysis) | Study (ICC) | RR (95% CI) | Tau² | Chi² | P value | I² (%) |
| Anaemia ‐ Comparison 1 (Barbosa 2012 (C); Cabalda 2009; Dad 2017; Muthayya 2012; Nestel 2004 (C)) |
Barbosa 2012 (C) (0) | 0.81 [0.61, 1.07] | 0.05 | 9.07 | 0.14 | 55 |
| Barbosa 2012 (C) (0.001) | 0.81 [0.61, 1.07] | 0.05 | 9.12 | 0.14 | 56 | |
| Barbosa 2012 (C) (0.002) | 0.81 [0.61, 1.07] | 0.05 | 9.07 | 0.14 | 55 | |
| Barbosa 2012 (C) (0.005) | 0.81[0.61, 1.07 ] | 0.05 | 9.06 | 0.14 | 55 | |
| Barbosa 2012 (C) (0.01) | 0.81 [0.61, 1.07] | 0.05 | 9.09 | 0.14 | 55 | |
| Barbosa 2012 (C) (0.02723) | 0.81 [0.61, 1.07] | 0.05 | 9.14 | 0.14 | 56 | |
| Barbosa 2012 (C) (0.1) | 0.80 [0.58, 1.08] | 0.06 | 9.28 | 0.14 | 56 | |
| Nestel 2004 (C) (0) | 0.80 [0.61, 1.06] | 0.05 | 9.08 | 0.14 | 55 | |
| Nestel 2004 (C) (0.001) | 0.80 [0.61, 1.06] | 0.05 | 9.09 | 0.14 | 55 | |
| Nestel 2004 (C) (0.002) | 0.80 [0.61, 1.06] | 0.05 | 8.93 | 0.15 | 55 | |
| Nestel 2004 (C) (0.005) | 0.80 [0.61, 1.06] | 0.05 | 9.04 | 0.14 | 56 | |
| Nestel 2004 (C) (0.01) | 0.81 [0.61, 1.07] | 0.05 | 9.14 | 0.14 | 56 | |
| Nestel 2004 (C) (0.02723) | 0.81 [0.61, 1.07] | 0.05 | 9.14 | 0.14 | 56 | |
| Nestel 2004 (C) (0.1) | 0.80 [0.61, 1.07] | 0.05 | 8.93 | 0.15 | 55 | |
| Anaemia ‐ Comparison 2 (Cabalda 2009; Rahman 2015 (C)) | Rahman 2015 (C) (0) | 0.97 [0.74, 1.29] | 0 | 0.29 | 0.59 | 0 |
| Rahman 2015 (C) (0.001) | 0.97 [0.74, 1.29] | 0 | 0.28 | 0.59 | 0 | |
| Rahman 2015 (C) (0.002) | 0.96 [0.73, 1.28] | 0 | 0.22 | 0.64 | 0 | |
| Rahman 2015 (C) (0.005) | 0.96 [0.73, 1.28] | 0 | 0.23 | 0.63 | 0 | |
| Rahman 2015 (C) (0.01) | 0.97 [0.73, 1.29] | 0 | 0.27 | 0.61 | 0 | |
| Rahman 2015 (C) (0.10) | 0.95 [0.69, 1.31] | 0 | 0.21 | 0.65 | 0 | |
| Rahman 2015 (C) (0.20) | 0.95 [0.67, 1.33] | 0 | 0.21 | 0.65 | 0 | |
| Outcome (all studies included in the analysis) | Study (ICC) | Mean Difference (95% CI) | Tau² | Chi² | P value | I² (%) |
| Haemoglobin concentration ‐ Comparison 1 (Amalrajan 2012; Barbosa 2012 (C); Biebinger 2009; Cabalda 2009; Dad 2017; Muthayya 2012; Nestel 2004 (C)) (MD 3.30, 95% CI 0.86 to 5.74; 7 studies; 2355 participants; I2 = 83%)(Tau² = 8.24; Chi² = 35.92, df = 6 ; I2 = 83%; p <0.00001) |
Barbosa 2012 (C) (0) | 3.28 [0.93, 4.72] | 8.0 | 35.68 | < 0.00001 | 83 |
| Barbosa 2012 (C) (0.001) | 3.30 [0.92, 4.73] | 8.0 | 35.66 | < 0.00001 | 83 | |
| Barbosa 2012 (C) (0.002) | 3.30 [0.92, 4.73] | 8.05 | 35.62 | < 0.00001 | 83 | |
| Barbosa 2012 (C) (0.005) | 3.30 [0.91, 4.74] | 8.08 | 35.58 | < 0.00001 | 83 | |
| Barbosa 2012 (C) (0.01) | 3.30 [0.90, 4.75] | 8.14 | 35.58 | < 0.00001 | 83 | |
| Barbosa 2012 (C) (0.02723) | 3.30 [0.86, 5.74] | 8.24 | 35.92 | < 0.00001 | 83 | |
| Barbosa 2012 (C) (0.1) | 3.30 [0.90, 4.75] | 8.14 | 35.58 | < 0.00001 | 83 | |
| Nestel 2004 (C) (0) | 3.30 [0.87, 4.79] | 8.34 | 36. | < 0.00001 | 83 | |
| Nestel 2004 (C) (0.001) | 3.30 [0.87, 4.79] | 8.34 | 36.09 | < 0.00001 | 83 | |
| Nestel 2004 (C) (0.002) | 3.30 [0.87, 4.79] | 8.32 | 36.08 | < 0.00001 | 83 | |
| Nestel 2004 (C) (0.005) | 3.30 [0.87, 4.78] | 8.31 | 35.90 | < 0.00001 | 83 | |
| Nestel 2004 (C) (0.01) | 3.30 [0.87, 4.78] | 8.3 | 35.94 | < 0.00001 | 83 | |
| Nestel 2004 (C) (0.02723) | 3.30 [0.87, 4.78] | 8.26 | 35.92 | < 0.00001 | 83 | |
| Nestel 2004 (C) (0.1) | 3.28 [0.90, 4.75] | 8.02 | 33.48 | < 0.00001 | 82 | |
| Haemoglobin concentration ‐ Comparison 2 (Biebinger 2009; Cabalda 2009; Rahman 2015 (C)) |
Rahman 2015 (C) (0) | 3.22 [‐1.06, 7.50] | 11.4 | 10.83 | 0.004 | 82 |
| Rahman 2015 (C) (0.001) | 3.22 [‐1.06, 7.50] | 11.39 | 10.82 | 0.004 | 82 | |
| Rahman 2015 (C) (0.002) | 3.22 [‐1.05, 7.50] | 11.38 | 10.79 | 0.005 | 81 | |
| Rahman 2015 (C) (0.005) | 3.22 [‐1.05, 7.50] | 11.35 | 10.74 | 0.005 | 81 | |
| Rahman 2015 (C) (0.01) | 3.23 [‐1.04, 7.49] | 11.3 | 10.66 | 0.005 | 81 | |
| Rahman 2015 (C) (0.10) | 3.25 [‐0.91, 7.42] | 10.45 | 9.24 | 0.01 | 78 | |
| Rahman 2015 (C) (0.20) | 3.29 [‐0.78, 7.36] | 9.61 | 8.09 | 0.02 | 75 |
Results
Description of studies
Results of the search
We identified a total of 3263 references through database searching and 33 records through additional searching. After de‐duplication, there was a total of 3048 references for possible inclusion. We considered 83 full‐text articles (including three dissertations and three unpublished RCTs) eligible after screening the titles and abstracts. We excluded 70 records (from 60 studies) with reasons for their exclusion. We confirmed that there were two ongoing studies (Arcot 2017; Tetanye 2018). We included a total of nine trials (11 records) in the meta‐analyses. We described the study selection process in a PRISMA chart (Figure 2).
2.
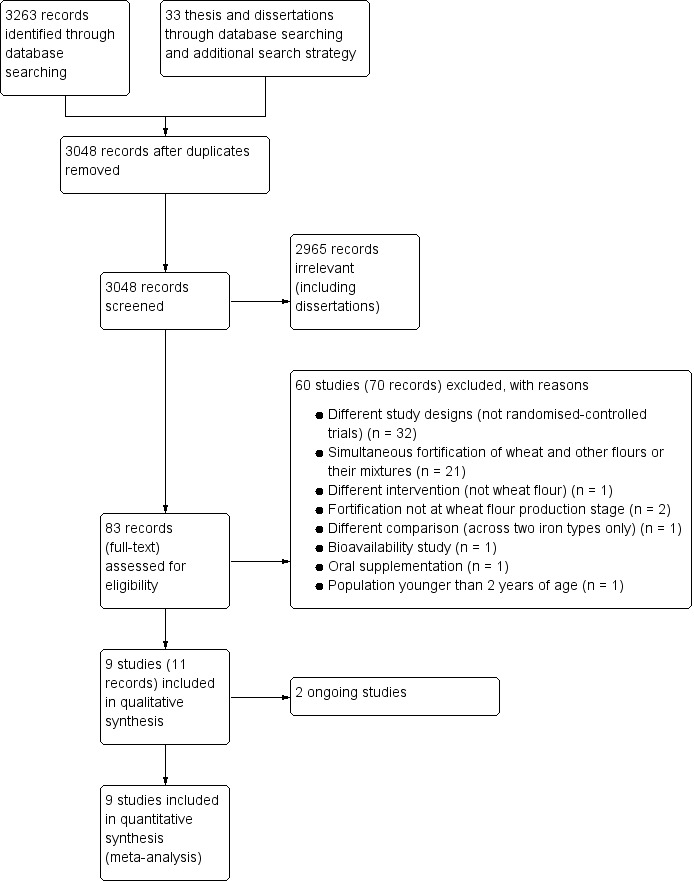
Study flow diagram.
Included studies
All nine included trials were reported in the English language. These studies were published between 2004 and 2017. Most of the included trials had interventions to improve the status of anaemia and haemoglobin concentrations, along with reducing iron deficiency, and few trials reported secondary outcomes. We present the details of included studies, including participants, intervention, outcomes, source of funding, and results of contact with the authors, in Characteristics of included studies.
Study designs
We included nine RCTs (involving 3166 participants) in this review (Amalrajan 2012; Barbosa 2012 (C); Biebinger 2009; Cabalda 2009; Dad 2017; Muthayya 2012; Nestel 2004 (C); Rahman 2015 (C); van Stuijvenberg 2008). Among them, three studies were CRTs (Barbosa 2012 (C); Nestel 2004 (C); Rahman 2015 (C)). CRTs are denoted with a '(C)' in their reference names. Six studies included randomisation at individual level (Amalrajan 2012; Biebinger 2009; Cabalda 2009; Dad 2017; Muthayya 2012; van Stuijvenberg 2008). Detailed study descriptions are shown in Characteristics of included studies.Table 5 shows the summary characteristics of the included studies. All nine trials contributed to data to the meta analyses.
2. Summary of characteristics of included studies.
| Study | Location | Intervention | Duration of intervention | Age and sample size | Outcomes | Overall risk of bias | Study design |
| Amalrajan 2012 | Urban schools of Bangalore, Capital city of Karnataka State, India | Participants were randomised into one of two arms: 86 children in group 1 who received a lunch meal (wheat flour‐based chapati, poori or dosa) made with NaFeEDTA‐fortified wheat flour at the level of 6 mg iron/100g and 93 children in group 2 received identical but unfortified wheat‐flour based meal during 7 months. | 7 months | Children aged 6‐13 years | Haemoglobin, soluble transferrin receptor, serum ferritin, C‐reactive protein, zinc protoporphyrin and, urinary zinc | High | Randomised‐controlled trial with 2 arms |
| Barbosa 2012 (C) | 4 not for profit day cares in Sao Paulo ‐ Brazil. | Participants were randomly assigned to one of two groups: group 1 (n = 88) were given rolls with fortified wheat flour (4 mg iron/day); group 2 (n = 85) were provided with unfortified rolls. The period of the intervention was 24 weeks considering 5 days a week. The rolls weighted 20 g and were programmed for a 4 mg elemental iron content per unit (as microencapsulated iron sulphate). The micro capsules with iron sulphate micro‐particles were covered with sodium alginate using spray drying technique. | 6 months | 173 children in the age group of 2 to 6 years | haemoglobin and prevalence of anaemia. | Low | Cluster randomised‐controlled trial with 2 arms |
| Biebinger 2009 | 2 colleges in Kuwait: College for women, Kuwait University and the Nursing college public authority for applied education and training | Participants were assigned to one of 3 groups: group 1 (n = 93) received wheat‐based biscuits produced with wheat flour fortified with 20 mg elemental iron (as reduced iron) NutraFineTM RS) ; group 2 (n = 93) received biscuits fortified with 10 mg of elemental iron (as encapsulated ferrous sulphate) and 150 µg iodine; group 3 (n = 93) received unfortified biscuits. | 6 months (22 weeks) | 279 non‐pregnant women aged 18 to 35 years | Serum ferritin, iron stores, and iron deficiency | High | Randomised‐controlled trial with 3 arms |
| Cabalda 2009 | 2 elementary schools in Compostela, Cebu, Phillipines | Participants were randomly assigned to one of four groups, consuming two 60 g pandesal per day: group 1 (n = 86) consumed pandesal fortified with iron (hydrogen‐reduced iron at 80 mg/kg, or electrolytic iron at 80 mg/kg, or ferrous fumarate at 40 mg/kg); group 2 (n = 91) consumed iron and vitamin A (at 490 RE/100g) fortified pandesal; group 3 (n = 31) received vitamin A‐fortified pandesal; and group 4 (n = 30) consumed pandesal made from non‐fortified flour. | 8 months | 250 anaemic children aged 6 to 12 years | Anaemia, iron deficiency, haemoglobin and zinc protoporphyrin concentrations. | High | Double blind randomised‐controlled trial with 4 groups |
| Dad 2017 | District Buner in Khyber Pakhtunkhwa province of Pakistan. | Participants were randomly divided into one of two groups: group 1 (n = 100) was fed with iron fortified wheat flour; group 2 (n = 100) was fed with non‐fortified wheat flour. For composite‐flour preparation, the flour was collected from one flour shop of the same flour mill, brand and with 75% extraction rate to maintain the same level of phytic acid concentration naturally found in wheat flour. | 3 months | 200 adolescent girls | Dietary intake, haemoglobin concentrations at baseline and anaemia at 1, 2 and 3 months | High | Randomised‐controlled trial with 2 arms |
| Muthayya 2012 | School children in 2 locations in India: an urban primary school in Bangalore city, Karnataka state, and 2 primary schools in rural Vadu in Maharashtra state. | The intervention group (n = 200) consumed chapatis made with wheat flour fortified with 60 mg/kg NaFeEDTA, the control group (n = 201) consumed chapatis prepared using unfortified flour. | 7 months | 401 children aged 6 to 15 years | Anaemia, iron deficiency, haemoglobin, sTfR, serum ferritin, anthropometric measures, cognitive development. | Low | Randomised‐controlled trial with 2 arms |
| Nestel 2004 (C) | Tea estates in Sri Lanka. | Participants were randomly assigned to one of 3 groups within the six estates; group 1 received wheat flour fortified with electrolytic iron (n = 1011); group 2 received wheat flour fortified with reduced iron (n = 1103); group 3 received unfortified flour (n = 1114). Each of the intervention arm was further divided depending on the age characteristics as pre‐school, primary school and adult non‐pregnant women. | 24 months | 3229 participants in preschool‐age group (9 ‐ 71 months of age); school‐age (6‐11 years of age); adult, non‐pregnant women. | Anaemia and haemoglobin concentrations | High | Randomised‐controlled trial with 3 age groups and each age group with 3 arms |
| Rahman 2015 (C) | 43 "bari" (with 5 to 6 adjoining households having a population of about 30–35 relatives) in Bangladesh. | The intervention group received chapatti made of wheat flour fortified with added micronutrients, while the control group received chapatti made of wheat flour without added micronutrients for 6 months. | 6 months | 352 children in households | Vitamin A, haemoglobin and iron status. | High | Double‐blind cluster randomised‐controlled trial with 2 arms |
| van Stuijvenberg 2008 | A primary school serving a low socioeconomic community in the Western Cape, South Africa. | Participants were randomly assigned to one of 4 groups: group 1 (n = 90), the control group received brown bread with no fortification of iron; group 2 (n = 90) received brown bread fortified with NaFeEDTA; group 3 (n = 91) received brown bread fortified with ferrous fumarate; group 4 (n = 90) received brown bread fortified with electrolytic iron. Each child received 4 slices of bread (total of 140g) distributed over 2 meal periods per school day. The study duration was 34 weeks. All participants were de wormed four weeks prior to the baseline assessment. | 8 months (34 weeks) | 361 children aged between 6 and 11 years | Anaemia, iron deficiency prevalence, CRP (inflammation), haemoglobin, serum ferritin, serum iron, transferrin saturation, serum transferrin receptor. | High | Randomised‐controlled trial with 4 arms |
Five trials had two arms in their interventions (Amalrajan 2012; Barbosa 2012 (C); Dad 2017; Muthayya 2012; Rahman 2015 (C)). Two trials among them (Amalrajan 2012, Muthayya 2012) included sodium iron ethylenediaminetetraacetic acid (NaFeEDTA)‐fortified wheat flour in the intervention arm and unfortified wheat flour in control arm. One trial (Barbosa 2012 (C)) used rolls prepared with fortified wheat flour in the intervention arm and rolls prepared without fortification as the control group. Other trials included ferrous sulphate fortified wheat flour in the intervention group while the control group being fed with non‐fortified wheat flour (Dad 2017) and wheat flour fortified with added micronutrients (hydrogen‐reduced elemental iron + retinyl palmitate) & the control group receiving wheat flour with retinyl palmitate only (Rahman 2015 (C)).
Two trials included three arms (Biebinger 2009; Nestel 2004 (C)). In one study (Biebinger 2009), one group received wheat biscuits fortified with 20 mg Fe per day as reduced iron, the second received wheat biscuits with 10 mg iron per day as encapsulated ferrous sulphate along with 150 mg iodine, and the third group consumed unfortified wheat biscuits. Another study with three arms (Nestel 2004 (C)), included two intervention arms with one arm receiving wheat flour fortified with reduced iron and another arm receiving electrolytic iron (un‐annealed A‐131). One control arm included unfortified wheat flour. Each of the arm was further divided based on the age of the population as pre‐school children, primary school children and non‐pregnant adult women.
Two trials included four arms (Cabalda 2009; van Stuijvenberg 2008). The four arms in Cabalda 2009 study were: iron‐fortified (with hydrogen‐reduced iron, electrolytic iron, or ferrous fumarate); iron and Vitamin A‐fortified; vitamin A‐fortified; and un‐fortified flour administered through Pandesal. In another trial (van Stuijvenberg 2008) four groups received four slices of brown bread supplying no fortification iron, NaFeEDTA, ferrous fumarate or electrolytic iron per intervention day.
Settings
Four studies specified urban settings (Amalrajan 2012; Barbosa 2012 (C); Biebinger 2009; Muthayya 2012;). One study took place in both urban and rural settings in Bangalore and Vadu, India (Muthayya 2012), one was carried out in Bangalore, India (Amalrajan 2012), one in day care centres of Sao Paulo, Brazil (Barbosa 2012 (C)) and one study was performed in Kuwait (Biebinger 2009). In addition, one study described rural settings (Cabalda 2009) in the Phillipines, one in Sri Lanka (Nestel 2004 (C)), one study in Bangladesh (Rahman 2015 (C)), and one in Western Cape, South Africa (van Stuijvenberg 2008).
The PROGRESS‐Plus equity parameters are shown in Table 6 for all included trials. Five of the included trials were carried out in areas where individuals were of a "low socioeconomic status" or in "poor communities" (Barbosa 2012 (C); Cabalda 2009; Muthayya 2012; Nestel 2004 (C); van Stuijvenberg 2008). Socioeconomic status was described as "high standard of living" in one trial (Biebinger 2009), but not specified in the remaining trials. None of the trials included data on participant religion, disability, or sexual orientation (Table 6).
3. PROGRESS‐Plus equity checklist of included studies.
| Study | Place | Race/ethnicity | Occupation | Gender | Religion/culture/education | Socio‐economic status | Social status | Others/disability/age/ | Overall Progress+ |
| Amalrajan 2012 | Urban, Bangalore/India | Not specified | School children | Both | Not specified | Not specified | Not specified | Iron‐depleted children aged 6 to 13 years | 179 children of both genders aged 6‐13 who were iron‐depleted in an urban school setting |
| Barbosa 2012 (C) | Urban, Sao Paulo/ Brazil | Not specified | school children | both | not specified | Children known to be from families of low socioeconomic status | non‐for‐profit day cares | Children aged 2 to 6 years with baseline haemoglobin exceeding 9 g/dL | 173 children of both genders and low socioeconomic status in an urban setting |
| Biebinger 2009 | Two colleges in Kuwait: College for Women, Kuwait University and, Nursing College, Public Authority for Applied Education Training | Not specified | Students | Females only | Not specified/college and nursing students | "high standard of living" | School setting | Women aged between 18 and 35 years | 124 female college students with high socioeconomic status |
| Cabalda 2009 | Estaca and Magay Elemetary schools in Compostela, Cebu, Philippines | Rural | School children | Both | School children | 36% of poverty index in the region | Not specified | Children aged 6 to 12 years | 116 school children of both genders in a rural area of the Phillipines with relatively high poverty rates |
| Dad 2017 | District Buner in Khyber Pakhtunkhwa province of Pakistan | Union council of the District | Adolescent girls | Females | Education varied from being illiterate to above high grade | Not specified | Not specified | Average age of 15 years, free from chronic diseases and disability | 200 adolescent females of varying education levels that were free of chronic disease or disability |
| Muthayya 2012 | Urban primary school in Bangalore city, Karnataka state/India and 2 rural primary schools in Vadu, Maharashtra state/India | Not specified | School children | Both | Children attending these schools were taught in Kannada and Marathi, the local languages spoken in Bangalore and Vadu respectively | Poor communities | Not specified | Children of 6‐13 years in Bangalore and 7‐15 years in Vadu | 379 school children ranging in age from 6‐15 years living in poor communities in two urban areas in India |
| Nestel 2004 (C) | Tea states in Sri Lanka | Not specified | Preschool children, school aged children and women in reproductive age | Both genders in children, adult females | Not specified | Low socioeconomic status | Not specified | Preschool children, school aged children and women in reproductive age | 1545 children of box sexes and adult females of low economic status working in tea estates in Sri Lanka |
| Rahman 2015 (C) | Rural areas in the Mirsarai sub‐district in the south‐eastern Bangladesh | Not specified | School going children aged 6 years and above | Both genders in | Culture and religion was not specified, except for the residence in a unit called "Bari" | Not specified | Not specified | No disability and age above 6 years | 334 school children of both sexes living in two areas of Bangladesh and who had no known disabilities |
| van Stuijvenberg 2008 | Western Cape, South Africa | Not specified | School children | Both | Not specified | "serving a low socioeconomic status community" | Unclear | Children aged 6 to 11 years with haemoglobin ≤ 125 g/L | 361 school children of both genders with low socioeconomic status living in the Western Cape of South Africa |
Malaria endemicity
Two studies reported that their study area was malaria non‐endemic (Cabalda 2009 ‐ Compostela, Cebu, Philippines; Muthayya 2012 ‐ urban Bangalore, Karnataka and Vadu in Maharashtra, India). No other included trials reported the status of malaria endemicity in their study area (Amalrajan 2012; Barbosa 2012 (C); Biebinger 2009; Dad 2017; Rahman 2015 (C); van Stuijvenberg 2008)
Prevalence of anaemia at baseline
The prevalence of anaemia at baseline varied among the trials. Anaemia prevalence was low (< 20%) in two trials (Biebinger 2009; van Stuijvenberg 2008), moderate in four trials (Barbosa 2012 (C); Muthayya 2012; Nestel 2004 (C); Rahman 2015 (C)), and high in two trials (Cabalda 2009,39%; Dad 2017, 50%). One trial did not specify the prevalence of anaemia at baseline (Amalrajan 2012).
Participants
Age
Six trials included children (Amalrajan 2012; Barbosa 2012 (C); Cabalda 2009; Muthayya 2012; Rahman 2015 (C); van Stuijvenberg 2008). Among these six trials, one trial included children aged 6 to 11 (van Stuijvenberg 2008), one trial included children aged 6 to12 (Cabalda 2009), one trial included children aged 6 to13 (Amalrajan 2012), and two studies had subjects aged between 6 and 15 years (Muthayya 2012; Rahman 2015 (C)). Another trial among children included aged 9 months to 11 years, primary school going children‐ aged 6 to 11 years old, and nonpregnant women (Nestel 2004 (C)). Two studies were carried out among adult women: (Biebinger 2009) aged 18 to 35 years; Nestel 2004 (C)) women aged 15 to 49 years (average 32 ± 9 years). One trial (Dad 2017) was carried out among adolescent girls aged 15.2 ± 2.4 years.
Sex
Most of the included trials carried out in children and adolescents included both sexes. One trial carried out among adolescents included only girls (Dad 2017) Two trials were performed in adult women (Biebinger 2009; Nestel 2004 (C)). No trials included pregnant women.
Interventions
Five trials compared wheat flour fortified with iron alone versus unfortified wheat flour (Amalrajan 2012; Barbosa 2012 (C); Dad 2017; Muthayya 2012 andNestel 2004 (C)). Two trials compared wheat flour fortified with iron and other nutritional component versus unfortified wheat flour (Biebinger 2009; Rahman 2015 (C)) and one trial compared wheat flour fortified with iron and other nutritional component versus unfortified wheat flour with the other nutritional component (Cabalda 2009).
Type of iron compound: high relative bioavailability (e.g. iron ethylenediaminetetraacetic acid) versus comparable relative bioavailability (e.g. ferrous sulphate and fumarate) versus low relative bioavailability (e.g. reduced iron, electrolytic iron, others)
Two trials included iron compounds with high relative bioavailability (Amalrajan 2012; Muthayya 2012). Both these trials used NaFeEDTA fortified wheat flour. Four trials included compounds with comparable to low relative bioavailability (Barbosa 2012 (C)); Dad 2017; Nestel 2004 (C) and Rahman 2015 (C) The Barbosa 2012 (C) study used ferrous sulphate (sodium alginate micro capsule covered) and Dad 2017 used ferrous sulphate. Also, Nestel 2004 (C) included two types of interventions, reduced iron and electrolytic iron; both were of low bioavailability. The intervention arm in Rahman 2015 (C) trial was low bioavailability iron in the form of hydrogen reduced iron along with retinol.
The remaining trials included more than one iron compound and with different relative bioavailabilities (Biebinger 2009; Cabalda 2009; van Stuijvenberg 2008). In the Biebinger 2009 study, the two intervention arms received reduced elemental iron (low bioavailability) and encapsulated ferrous sulphate (comparable bioavailability) and the Cabalda 2009 study had three groups of interventions with hydrogen‐reduced iron, electrolytic iron (both low bioavailability) and ferrous fumarate (comparable bioavailability). In the van Stuijvenberg 2008 trial, one intervention arm each received NaFeEDTA (high bioavailability), ferrous fumarate (comparable bioavailability) and electrolytic iron (low bioavailability), along with other micronutrients (vitamin A, thiamine, riboflavin, niacin, pyridoxine, folic acid and zinc) being added to all the arms as per the national food fortification policy of South Africa.
Amount of elemental iron added to flour: 40 mg/kg or less versus 41 to 60 mg/kg versus more than 60 mg/kg versus unreported/unknown.
Three trials used 41 to 60 mg iron/kg flour (Amalrajan 2012; Barbosa 2012 (C); Muthayya 2012). Two trials used less than 40 mg iron/kg flour (Dad 2017; van Stuijvenberg 2008), and two trials used more than 60 mg iron/kg flour (Biebinger 2009; Rahman 2015 (C)). The Cabalda 2009 trial varied iron levels according to the two different forms of iron used: 80 mg/kg for electrolytic iron and reduced iron and 40 mg/kg for ferrous fumarate. The amount of iron added was unknown for the Nestel 2004 (C) study. The fortification details of each included trial are given in Table 7.
4. Fortification profile per 100 grams of wheat flour groups in included studies.
| Study | Product |
Elemental iron (mg) |
Vitamin Aa (Retinol Equivalent) |
Zinc (mg) |
Folic acid (µg) |
Vitamin B1 (thiamin) (mg) |
Vitamin B2 (riboflavin) (mg) |
Vitamin B3 (niacin) (mg) |
Vitamin B6 (pyridoxine) (mg) |
Iodine (µg) |
| Amalrajan 2012 | wheat flour‐based chapati, poori or dosa | 6 (as NaFeEDTA) | ‐ | ‐ | ‐ | ‐ | ‐ | ‐ | ‐ | ‐ |
| ‐ | ‐ | ‐ | ‐ | ‐ | ‐ | ‐ | ‐ | ‐ | ||
| Barbosa 2012 (C) | wheat‐flour rolls | 20 (as microencapsulated iron sulphate) | ‐ | ‐ | ‐ | ‐ | ‐ | ‐ | ‐ | ‐ |
| ‐ | ‐ | ‐ | ‐ | ‐ | ‐ | ‐ | ‐ | ‐ | ||
| Biebinger 2009 | wheat‐based biscuits | 20 (as reduced iron) | ‐ | ‐ | ‐ | ‐ | ‐ | ‐ | ‐ | ‐ |
| 10 (as encapsulated‐ferrous sulphate) | ‐ | ‐ | ‐ | ‐ | ‐ | ‐ | ‐ | 150 | ||
| ‐ | ‐ | ‐ | ‐ | ‐ | ‐ | ‐ | ‐ | ‐ | ||
| Cabalda 2009 | Pandesal (wheat‐based bread roll) | 8 (as hydrogen‐reduced iron) | ‐ | ‐ | ‐ | ‐ | ‐ | ‐ | ‐ | ‐ |
| 8 (as hydrogen‐reduced iron) | 490 | |||||||||
| 8 (as electrolytic iron) | ‐ | |||||||||
| 8 (as electrolytic iron) | 490 | ‐ | ‐ | ‐ | ‐ | ‐ | ‐ | ‐ | ||
| 4 (as ferrous fumarate) | ‐ | |||||||||
| 4 (as ferrous fumarate) | 490 | ‐ | ‐ | ‐ | ‐ | ‐ | ‐ | ‐ | ||
| ‐ | 490 | ‐ | ‐ | ‐ | ‐ | ‐ | ‐ | ‐ | ||
| ‐ | ‐ | ‐ | ‐ | ‐ | ‐ | ‐ | ‐ | |||
| Dad 2017 | provided as wheat flour for home bread preparation | 2 (as ferrous sulphate) | ‐ | ‐ | ‐ | ‐ | ‐ | ‐ | ‐ | ‐ |
| ‐ | ‐ | ‐ | ‐ | ‐ | ‐ | ‐ | ‐ | ‐ | ||
| Muthayya 2012 | wheat flour‐based chapatis | 6 (as NaFeEDTA) | ‐ | ‐ | ‐ | ‐ | ‐ | ‐ | ‐ | ‐ |
| ‐ | ‐ | ‐ | ‐ | ‐ | ‐ | ‐ | ‐ | ‐ | ||
| Nestel 2004 (C) | provided as wheat flour | 6.6 (as Hidrogen‐reduced iron) | ‐ | ‐ | ‐ | ‐ | ‐ | ‐ | ‐ | ‐ |
| 6.6 (as A131‐electrolitic iron) | ‐ | ‐ | ‐ | ‐ | ‐ | ‐ | ‐ | ‐ | ||
| ‐ | ‐ | ‐ | ‐ | ‐ | ‐ | ‐ | ‐ | ‐ | ||
| Rahman 2015 (C) | wheat flour‐based chapati | 6.6 (as Hidrogen‐reduced iron) | 303 (as retinyl palmitate) | 3.3 (as zinc oxide) | 0.15 | 0.64 | 0.40 | 5.3 (as niacinamide) | ‐ | ‐ |
| ‐ | ‐ | ‐ | ‐ | ‐ | ‐ | ‐ | ‐ | ‐ | ||
| van Stuijvenberg 2008* | wheat flour‐based brown bread | 1 (as NaFeEDTA) | 179 (as retinyl palmitate) | 1.5 | 1.43 | 0.19 | 0.17 | 2.36 | 0.26 | ‐ |
| 2 (as ferrous fumarate) | 179 (as retinyl palmitate) | 1.5 | 1.43 | 0.19 | 0.17 | 2.36 | 0.26 | ‐ | ||
| 3.5 (as electrolytic iron) | 179 (as retinyl palmitate) | 1.5 | 1.43 | 0.19 | 0.17 | 2.36 | 0.26 | ‐ | ||
| ‐ | 179 (as retinyl palmitate) | 1.5 | 1.43 | 0.19 | 0.17 | 2.36 | 0.26 | ‐ | ||
| C: cluster randomised, NaFeEDTA: Sodium iron ethylene diamine tetraacetic acid (iron‐EDTA) | ||||||||||
aOne international unit (IU) vitamin A is equivalent to 0.0003 mg of retinol, 0.0006 mg of beta‐carotene and 0.0012 mg of other pro‐vitamin A carotenoids. * in this study the micronutrients other than iron were according to South Africa fortification regulations.
Duration of intervention
Eight interventions lasted less than 24 months (Amalrajan 2012; Barbosa 2012 (C); Biebinger 2009; Cabalda 2009; Muthayya 2012; Rahman 2015 (C); van Stuijvenberg 2008; Zimmermann 2005). The duration of interventions varied between three to eight months: Amalrajan 2012 was seven months, Barbosa 2012 (C) was six months, Biebinger 2009 was 22 weeks, Cabalda 2009 was eight months, Dad 2017 was three months, Muthayya 2012 was seven months, Rahman 2015 (C) was six months and van Stuijvenberg 2008 was 34 weeks. The Nestel 2004 (C) trial lasted for 24 months.
Flour extraction rate: 80% or less versus more than 80% versus unknown or unreported.
In five trials, the flour extraction rate was not specified (Amalrajan 2012; Barbosa 2012 (C); Biebinger 2009; Cabalda 2009; Nestel 2004 (C)). Flour extraction rate was < 80% in two trials (Dad 2017; Rahman 2015 (C)) and >80% in two trials (Muthayya 2012; van Stuijvenberg 2008).
Outcomes
Primary outcomes
Six trials reported anaemia based on the cut off levels for haemoglobin (defined as haemoglobin below WHO cut‐off for age and adjusted for altitude as appropriate) (Barbosa 2012 (C); Cabalda 2009; Dad 2017; Muthayya 2012; Nestel 2004 (C); Rahman 2015 (C)). Iron deficiency (as defined by trialists, based on a biomarker of iron status) was measured in five studies (Biebinger 2009; Cabalda 2009; Muthayya 2012; Rahman 2015 (C); van Stuijvenberg 2008). Haemoglobin concentration (g/L) was assessed by all nine studies (Amalrajan 2012; Barbosa 2012 (C); Biebinger 2009; Cabalda 2009; Dad 2017; Muthayya 2012; Nestel 2004 (C); Rahman 2015 (C); van Stuijvenberg 2008). No included study assessed diarrhoea (three liquid stools in a single day ‐ only in children 2 to 11 years of age). Two studies reported infection or inflammation at the individual level (as measured by urinary neopterin, C‐reactive protein or alpha‐1‐acid glycoprotein variant A ‐ only in children 2 to 11 years of age) (Amalrajan 2012; van Stuijvenberg 2008). No studies assessed respiratory infections (as measured by trialists ‐ only in children 2 to 11 years of age) and all‐cause death (only in children 2 to 11 years of age). Various serum iron indices were reported by Amalrajan 2012; Biebinger 2009; Muthayya 2012; van Stuijvenberg 2008 , zinc indices by Amalrajan 2012 and Cabalda 2009, serum vitamin A levels by Rahman 2015 (C), and dietary intake by Dad 2017 studies.
Secondary outcomes
No studies reported anthropometric measures (height‐for‐age z‐score and weight‐for‐height z‐score for children, body mass index (BMI)) for adults. However, in children, one study assessed weight and height, weight‐for‐age z‐score, body mass index‐for‐age z‐score, and height‐for‐age z‐score (Cabalda 2009). No studies assessed risk of iron overload (defined as serum ferritin higher than 150 µg/L in females and higher than 200 µg/L in men (WHO 2011b). One study measured cognitive development in children age 2 to 11.9 (as defined by trialists) (Muthayya 2012). There were no studies measuring motor skill development in children age 2 to 11.9 (as defined by trialists), clinical malaria (as defined by trialists), severe malaria (as defined by trialists) or adverse side effects (including constipation, nausea, vomiting, heartburn, as defined by trialists).
In addition to the above outcomes, the trials also measured other outcomes: serum ferritin and urinary zinc excretion (Amalrajan 2012); serum ferritin concentrations, transferrin receptor, urinary iodine, and body iron stores (Biebinger 2009); zinc protoporphyrin concentrations (Cabalda 2009); iron deficiency (ID), various body iron biomarkers including serum ferritin, serum transferrin receptor, and zinc protoporphyrin (Muthayya 2012); retinol concentration, iron status (Rahman 2015 (C)); iron status, transferrin saturation, serum ferritin, iron, and transferrin receptor concentrations (van Stuijvenberg 2008). However we have not reported these outcomes in this review.
Funding
Eight of the nine included trials reported clearly the source of funding. Most of them had multiple sources of funding. Among them, three trials included industries in their list of funding agencies (Amalrajan 2012; Biebinger 2009; Muthayya 2012). Most of the funding agencies were ministries, other governmental departments or international organisations. Two trials (Amalrajan 2012; Muthayya 2012) were funded by Department of Biotechnology, Ministry of Science & Technology, Government of India, Akzo Nobel chemicals & St. John's National Academy of Health Sciences, Bangalore, India. The Secretaria da Ciência, Tecnologia e Desenvolvimento Econômico do Estado de São Paulo funded Barbosa 2012 (C). Biebinger 2009 was funded by Kuwaiti flour mills and bakeries, the International Atomic Energy Agency (IAEA), ETH Zurich, the Medicore Company and the Kuwait Institute for Scientific Research. Cabalda 2009 received funds from the Early Childhood Development Project of the Philippines government.
The USAID Opportunities for Micronutrient Interventions (OMNI) project and the International Life Sciences Insitute (ILSI)‐managed Micronutrient Global Leadership (MGL) project were the funding agencies for Nestel 2004 (C). A grant from the MOST project (Contract No. HRN‐AA‐00–98‐00047‐00) and by support to the Mirsarai field area by US Cooperation Agreement No. 388‐A‐00‐97‐00032‐00 funded Rahman 2015 (C).
For one trial, the source of funding was not clear (van Stuijvenberg 2008). However, NaFeEDTA (Ferrazone) in the van Stuijvenberg 2008 trial was supplied by Akzo Nobel Functional Chemicals and ferrous fumarate and electrolytic iron by DSM Nutritional Products SA. The source of funding was unknown for Dad 2017.
Excluded studies
We excluded 58 studies (70 records) after full‐text screening. We describe these in Characteristics of excluded studies. We excluded several studies because the type of fortified flour used as the intervention was not wheat flour or the intervention was not at the wheat flour production stage. Most such studies took place in countries where multiple types of flours or foods were fortified simultaneously: Argentina, Brazil, Venezuela (Abreu 2009; Assunçao 2007; Bokhari 2012; Chavez 1998; Costa 2008; Da Silva 2012; De Souza 2011; Fujimori 2009; Fujimori 2011; Heijblom 2007; Layrisse 1996; Layrisse 2002; Malpeli 2013; Sato 2008) or South Africa (Modjadji 2007; Zimmermann 2005). Studies reported both wheat and rye flours (Milman 1999; Osler 1999), wheat and maize flour (Sato 2008; Sato 2015) and it was not specified if the fortified flour was wheat flour (Sun 2008). Six studies were excluded because they did not report an intervention (Bothwell 1978; Brown 2011; Kendrick 2015; Rohner 2013Simmons 1994; Varea 2011); three studies reported only pre‐fortification or post‐fortification data (Hund 2013; Pouraram 2010). Four studies were excluded because they did not have a control group, but compared different types of iron fortificant from a programmatic point of view (Elwood 1971; Grimm 2012; Varea 2011; Varea 2012). One study was excluded because it assessed only bioavailability and was not an intervention (Hallberg 1989), and one was excluded because the intervention population was infants less than six months of age (Zavaleta 2004). Four studies were non‐randomised trials (Huang 2009; Huo 2011 (C); Huo 2012 (C); Natvig 1973 (C)). One was a repeat survey after sifted flour fortification ‐ Sjoberg 2015, some were before‐and‐after comparison studies without a control group (Al 2016; Kendrick 2015; Papathakis 2012; Pouraram 2012; Sadighi 2009; Stuetz 2012; Tazhibayev 2008) or used a cross‐over study design (Zimmermann 2011).
We also identified two ongoing studies (Arcot 2017; Tetanye 2018). The details of these studies are given in Characteristics of ongoing studies. One study (Arcot 2017) is being carried out to assess the efficacy of multi‐micronutrient fortified wheat‐based biscuit on the nutrition status of primary school children aged between 6 and 12 years in Papua New Guinea. This study has two arms, an intervention arm and a control arm. The intervention arm will receive biscuits fortified with food‐grade vitamins and minerals (vitamin B1, vitamin B2, vitamin B3, folic acid, vitamin B12, vitamin A, ferrous fumarate, and zinc) and the control arm will receive unfortified biscuits. The dose of vitamins in each biscuit is calculated to provide the equivalent to daily consumption of 75g fortified wheat flour. Each child will receive one biscuit per day of attendance throughout the study period. Researchers and assistants will be blinded to intervention product code identities throughout the trial from allocation until statistical analysis. Another study (Tetanye 2018) intends to assess the efficacy of an iron‐fortified wheat flour for the correction and the prevention of iron deficiency anaemia in children aged 18 to 59 months in eastern Cameroon with haemoglobin ranging from 70 to 110 g/L. The authors report an intention to include an intervention arm and control arm being randomised using coin tossing. We did not identify any studies to be awaiting classification.
Risk of bias in included studies
We used the domains for ‘Risk of bias’ to evaluate included studies (Cochrane EPOC Group 2013), including individually randomised and cluster‐randomised designs. We also included additional domains related to cluster‐randomisation in the ’Risk of bias’ table in the Characteristics of included studies section. The Characteristics of included studies presents risk of bias for each of the included trials and Figure 3 and Figure 4 provide the details of judgement and overall summary of the risk of bias.
3.
Risk of bias graph: review authors' judgements about each risk of bias item presented as percentages across all included studies.
4.
Risk of bias summary: review authors' judgements about each risk of bias item for each included study.
Allocation
Sequence generation
Five trials were deemed to be at low risk of bias for random sequence generation (Cabalda 2009; Dad 2017; Muthayya 2012; Rahman 2015 (C); van Stuijvenberg 2008). Among them, two trials used statistician‐generated random numbers (Cabalda 2009; van Stuijvenberg 2008), one study used book‐based random numbers (Rahman 2015 (C)) and two studies used randomisation by computer‐generated blocks (Dad 2017; Muthayya 2012). The sequence generation technique allocating the study participants into the interventions was not specified by four trials (Amalrajan 2012; Barbosa 2012 (C); Biebinger 2009; Nestel 2004 (C)). Four of these studies report the words "random assignment" (Amalrajan 2012; Barbosa 2012 (C); Biebinger 2009). Nestel 2004 (C) without further detail. Hence these four studies were judged to be at unclear risk of bias ((Amalrajan 2012; Barbosa 2012 (C); Biebinger 2009; Nestel 2004 (C)).
Allocation concealment
Five trials (Barbosa 2012 (C); Cabalda 2009; Muthayya 2012; Nestel 2004 (C); Rahman 2015 (C)) exhibited low risk of allocation concealment bias. Among them, three studies were cluster RCTs (Barbosa 2012 (C); Nestel 2004 (C); Rahman 2015 (C)). One trial had the investigators (peripheral Lady Health Worker (LHW) in the field) being aware of the entire list of participants in the intervention and control arms; hence, it was judged to be at high risk of bias (Dad 2017). Three trials were at unclear risk of bias (Amalrajan 2012; Biebinger 2009; van Stuijvenberg 2008), since they did not specify the technique for allocation concealment.
Similarity in baseline outcome measurements
Five trials were determined to be at low risk of bias (Amalrajan 2012; Biebinger 2009; Dad 2017; Muthayya 2012; van Stuijvenberg 2008). Among these trials, Amalrajan 2012; Biebinger 2009; Muthayya 2012; van Stuijvenberg 2008 specified all their study participants to be iron‐depleted or with low haemoglobin concentrations at the time of recruitment to the trial as inclusion criteria. Dad 2017 reported similar levels of mean haemoglobin concentrations and other outcome characteristics across the groups. One trial was at unclear risk of bias (Cabalda 2009), considering the authors reported a different proportion of iron deficiency across the groups and mentioned that there were no "statistically significant difference across the groups."
Three trials were judged to be at high risk of bias (Barbosa 2012 (C); Nestel 2004 (C); Rahman 2015 (C)), because of difference in baseline anaemia prevalence across the arms in Barbosa 2012 (C); Nestel 2004 (C) studies, and both anaemia and iron deficiency levels across the arms in the Rahman 2015 (C) trial.
Similarity in baseline characteristics
Seven trials had low risk of bias (Barbosa 2012 (C); Biebinger 2009; Cabalda 2009; Dad 2017; Muthayya 2012; Rahman 2015 (C); van Stuijvenberg 2008). They reported similarity across the groups in terms of most of the demographic characteristics. Two studies were judged to be at high risk of bias (Amalrajan 2012; Nestel 2004 (C)). among them, Amalrajan 2012 did not describe the baseline characteristics of the study population and Nestel 2004 (C) had various differences across the arms in three types of age groups as described in Characteristics of included studies.
Blinding
Blinding of participants and personnel
Seven studies (Barbosa 2012 (C); Biebinger 2009; Cabalda 2009; Muthayya 2012; Nestel 2004 (C); Rahman 2015 (C); van Stuijvenberg 2008) declared that field personnel and participants were not aware of the interventions delivered and described methods to avoid the violation of the blinding, such as providing identical meals (colour, taste and texture) and were assessed to be at low risk. One trial did not mention the type of blinding, apart from making the interventions being identical (Amalrajan 2012) and so was at unclear risk of bias. One study did not follow any blinding (Dad 2017) and was assessed to be at high risk of bias.
Blinding of outcome assessment
Eight trials were assessed to be at low risk of bias for blinding of outcome assessment (Amalrajan 2012; Barbosa 2012 (C); Biebinger 2009; Cabalda 2009; Muthayya 2012; Nestel 2004 (C); Rahman 2015 (C); van Stuijvenberg 2008). One trial was graded to be at high risk of bias (Dad 2017)
Incomplete outcome data
Six studies (Amalrajan 2012; Cabalda 2009; Dad 2017; Muthayya 2012; Rahman 2015 (C); van Stuijvenberg 2008) were judged to have low risk of bias with respect to incomplete outcome data reporting. Three trials were assessed to be at high risk of bias for incomplete outcome data (Barbosa 2012 (C); Biebinger 2009; Nestel 2004 (C)).
Selective reporting
Two trials were assessed at low risk of bias (Muthayya 2012; Rahman 2015 (C)) and seven trials were at unclear risk of bias (Amalrajan 2012; Barbosa 2012 (C); Biebinger 2009; Cabalda 2009; Dad 2017; Nestel 2004 (C); van Stuijvenberg 2008). Most of the studies presented in the results the outcomes that were reported in the methods. However, in some cases this could not be assessed because reporting was not available due to lack of trial registry or due to inadequate description in the trial publication.
Other potential sources of bias
Other sources of bias were not apparent in eight studies included in this review (Amalrajan 2012; Barbosa 2012 (C); Biebinger 2009; Cabalda 2009; Muthayya 2012; Nestel 2004 (C); Rahman 2015 (C); van Stuijvenberg 2008) and were assessed to be at low risk of bias. One study (Dad 2017) did not specify the source of funding and protocol registration was not reported. Hence this trial was judged to be at unclear risk of bias.
We considered additional criteria for risk of bias in cluster‐randomised studies (recruitment bias, baseline imbalance, loss of clusters, incorrect analysis, compatibility with individual RCTs). Recruitment bias was low for all the three CRTs (Barbosa 2012 (C); Nestel 2004 (C); Rahman 2015 (C)). Baseline imbalance risk was low for Rahman 2015 (C) study and other two studies were assessed to be at high risk of bias (Barbosa 2012 (C); Nestel 2004 (C)). For loss of clusters, Nestel 2004 (C) study was at unclear risk and other two were at low risk (Barbosa 2012 (C); Rahman 2015 (C)). For incorrect analysis bias Barbosa 2012 (C); Nestel 2004 (C) studies were at unclear risk of bias and Rahman 2015 (C) study was assessed to be at low risk. Compatibility with individual RCTs was at low risk for two CRTs (Barbosa 2012 (C); Rahman 2015 (C) and Nestel 2004 (C) was graded to be at unclear risk.
Two studies were at low overall risk of bias (Barbosa 2012 (C); Muthayya 2012) seven studies were at high risk (Amalrajan 2012; Biebinger 2009; Cabalda 2009; Dad 2017; Nestel 2004 (C); Rahman 2015 (C); van Stuijvenberg 2008). Study characteristics along with overall risk of bias is given in Table 5.
Effects of interventions
See: Table 1; Table 2; Table 3
Summary of findings 1. Wheat flour fortified with iron alone compared to unfortified wheat flour (no micronutrients added) for reducing anaemia and improving iron status in populations.
| Wheat flour fortified with iron alone compared to unfortified wheat flour (no micronutrients added) for reducing anaemia and improving iron status in populations | ||||||
| Patient or population: general population of all age groups (including pregnant women) from any country over two years of age Setting: any country (studies providing data for this comparison: Brazil, India, Kuwait, Pakistan, Philippines, South Africa, Sri Lanka) Intervention: wheat flour fortified with iron alone Comparison: unfortified wheat flour (no micronutrients added) | ||||||
| Outcomes | Anticipated absolute effects* (95% CI) | Relative effect (95% CI) | № of participants (studies) | Certainty of the evidence (GRADE) | Comments | |
| Risk with unfortified wheat flour (no micronutrients added) | Risk with wheat flour fortified with iron alone | |||||
|
Anaemia (defined as haemoglobin below WHO cut‐off for age and adjusted for altitude as appropriate) follow up: range 3 months to 24 months |
Study population | RR 0.81 (0.61 to 1.07) | 2200 (5 RCTs) | ⊕⊕⊝⊝ LOW 1,2 | Included studies: Barbosa 2012 (C); Cabalda 2009; Dad 2017; Muthayya 2012; Nestel 2004 (C); data for Barbosa 2012 (C); Nestel 2004 (C) are adjusted for clustering effect | |
| 231 per 1,000 | 187 per 1,000 (141 to 247) | |||||
|
Iron deficiency (as defined by study authors, based on a biomarker of iron status) follow up: range 5.5 months to 8 months |
Study population | RR 0.43 (0.17 to 1.07) | 633 (3 RCTs) | ⊕⊕⊕⊝ MODERATE 3 | Included studies: Biebinger 2009; Cabalda 2009; Muthayya 2012; | |
| 570 per 1,000 | 245 per 1,000 (97 to 610) | |||||
|
Haemoglobin concentration (g/L) follow up: range 3 months to 24 months |
The mean haemoglobin concentration (g/L) was MD 3.3 higher (0.86 higher to 5.74 higher) |
‐ | 2355 (7 RCTs) | ⊕⊝⊝⊝ VERY LOW 4,5,6 | Included studies: Amalrajan 2012; Barbosa 2012 (C); Biebinger 2009; Cabalda 2009; Dad 2017; Muthayya 2012; Nestel 2004 (C); ; data for Barbosa 2012 (C); Nestel 2004 (C) are adjusted for clustering effect | |
| Diarrhoea (three liquid stools in a single day) (only in children 2 to 11 years of age) | Study population | ‐ | (0 studies) | ‐ | No study reported on this outcome. | |
| ‐ | ‐ | |||||
| Respiratory infections (as measured by trialists) (only in children 2 to 11 years of age) | Study population | ‐ | (0 studies) | ‐ | No study reported on this outcome. | |
| ‐ | ‐ | |||||
| All‐cause death (only in children 2 to 11 years of age) | Study population | ‐ | (0 studies) | ‐ | No study reported on this outcome. | |
| ‐ | ‐ | |||||
| Infection or inflammation at individual level as measured by C‐reactive protein (CRP) (only in children 2 to 11 years of age) follow up: mean 7 months | The mean difference in infection or inflammation (CRP) was MD 0.04 higher (0.02 lower to 0.11 higher) | ‐ | 558 (2 RCTs) | ⊕⊕⊕⊝ MODERATE 7 | Included studies: Amalrajan 2012; Muthayya 2012 | |
| *The risk in the intervention group (and its 95% confidence interval) is based on the assumed risk in the comparison group and the relative effect of the intervention (and its 95% CI). CI: Confidence interval; RR: Risk ratio; OR: Odds ratio; | ||||||
| GRADE Working Group grades of evidence High certainty: We are very confident that the true effect lies close to that of the estimate of the effect Moderate certainty: We are moderately confident in the effect estimate: The true effect is likely to be close to the estimate of the effect, but there is a possibility that it is substantially different Low certainty: Our confidence in the effect estimate is limited: The true effect may be substantially different from the estimate of the effect Very low certainty: We have very little confidence in the effect estimate: The true effect is likely to be substantially different from the estimate of effect | ||||||
1 Downgraded 1 level for limitations in the study design or execution (risk of bias). Two studies included for this outcome were at low overall risk of bias and three studies were at high risk.
2 Downgraded 1 level for indirectness. Of the five studies contributing data for this outcome, three trials conducted on children or adolescents. Only one study was conducted among preschool‐age children (9 ‐ 71 months of age); school‐age children (6‐11 years of age); adult, non‐pregnant women.
3 Downgraded 1 level for limitations in the study design and execution (risk of bias). The proportion of information from results came from studies with overall risk of bias, which lowers the confidence in the estimate of the effect.
4 Downgraded 1 level for limitations in the study design or execution (risk of bias). The majority of the information for this outcome came from studies considered to have an overall high risk of bias sufficient to affect the interpretation. Two studies were at low overall risk of bias but five studies were at high risk.
5 Downgraded 1 level for indirectness. The prevalence of anaemia at baseline varied among the trials, being low (<20%) in one trial; moderate 20‐39%) in three trials and high in two trials. One trial did not specify the prevalence of anaemia at baseline. Mos studies were conducted in children.
6 Downgraded 1 level for imprecision. The only study that provided information for this outcome included few participants and few events.
7 Downgraded 1 level for limitations in the study design and execution. only two studies provided information for this assessment and one was considered to have overall high risk of bias, lowering the confidence in the results.
Summary of findings 2. Wheat flour fortified with iron in combination with other micronutrients compared to unfortified wheat flour (no micronutrients added) for reducing anaemia and improving iron status in populations.
| Wheat flour fortified with iron in combination with other micronutrients compared to unfortified wheat flour (no micronutrients added) for reducing anaemia and improving iron status in populations | ||||||
| Patient or population: general population of all age groups (including pregnant women) from any country over two years of age Setting: any country (studies providing data for this comparison: Bangladesh, Kuwait and Philippines) Intervention: wheat flour fortified with iron in combination with other micronutrients Comparison: unfortified wheat flour (no micronutrients added) | ||||||
| Outcomes | Anticipated absolute effects* (95% CI) | Relative effect (95% CI) | № of participants (studies) | Certainty of the evidence (GRADE) | Comments | |
| Risk with unfortified wheat flour (no micronutrients added) | Risk with wheat flour fortified with iron in combination with other micronutrients | |||||
|
Anaemia (defined as haemoglobin below WHO cut‐off for age and adjusted for altitude as appropriate) follow up: range 6 months to 8 months |
Study population | RR 0.95 (0.69 to 1.31) | 322 (2 RCTs) | ⊕⊕⊝⊝ LOW 1 2 | Included studies: Cabalda 2009; Rahman 2015 (C) | |
| 313 per 1,000 | 297 per 1,000 (216 to 410) | |||||
|
Iron deficiency (as defined by study authors, based on a biomarker of iron status) follow up: range 5.5 months to 8 months |
Study population | RR 0.74 (0.54 to 1.00) | 387 (3 RCTs) | ⊕⊕⊕⊝ MODERATE 3 | Included studies: Biebinger 2009; Cabalda 2009; Rahman 2015 (C) | |
| 353 per 1,000 | 261 per 1,000 (191 to 353) | |||||
|
Haemoglobin concentration (g/L) follow up: range 5.5 months to 8 months |
The mean haemoglobin concentration (g/L) was MD 3.29 higher (0.78 lower to 7.36 higher) |
‐ | 384 (3 RCTs) | ⊕⊕⊝⊝ LOW 3 4 | Included studies: Biebinger 2009; Cabalda 2009; Rahman 2015 (C) | |
| Diarrhoea (three liquid stools in a single day) (only in children 2 to 11 years of age) | Study population | ‐ | (0 studies) | ‐ | No study reported on this outcome. | |
| ‐ | ‐ | |||||
| Respiratory infections (as measured by trialists) (only in children 2 to 11 years of age) | Study population | ‐ | (0 studies) | ‐ | No study reported on this outcome. | |
| ‐ | ‐ | |||||
| All‐cause death (only in children 2 to 11 years of age) | Study population | ‐ | (0 studies) | ‐ | No study reported on this outcome. | |
| ‐ | ‐ | |||||
| Infection or inflammation at individual level (as measured by urinary neopterin, C‐reactive protein or alpha‐1‐acid glycoprotein variant A) | Study population | ‐ | (0 studies) | ‐ | No study reported on this outcome. | |
| ‐ | ‐ | |||||
| *The risk in the intervention group (and its 95% confidence interval) is based on the assumed risk in the comparison group and the relative effect of the intervention (and its 95% CI). CI: Confidence interval; RR: Risk ratio; OR: Odds ratio; | ||||||
| GRADE Working Group grades of evidence High certainty: We are very confident that the true effect lies close to that of the estimate of the effect Moderate certainty: We are moderately confident in the effect estimate: The true effect is likely to be close to the estimate of the effect, but there is a possibility that it is substantially different Low certainty: Our confidence in the effect estimate is limited: The true effect may be substantially different from the estimate of the effect Very low certainty: We have very little confidence in the effect estimate: The true effect is likely to be substantially different from the estimate of effect | ||||||
1 Downgraded 1 level for limitations in the study design or execution (risk of bias). The two studies contributing information were considered as having overall high risk of bias.
2 Downgraded 1 level for indirectness. The studies were conducted in children, in settings with high or moderate prevalence of anaemia.
3 Downgraded 1 level for limitations in the study design or execution (risk of bias). All three studies contributing information were considered to have overall high risk of bias sufficient to affect the interpretation of the results.
4 Downgraded 1 level for indirectness. One study included adult participants who were already iron deficient and another on children who were already anaemic.
Summary of findings 3. Wheat flour fortified with iron in combination with other micronutrients compared to fortified wheat flour with same micronutrients (but not iron) for reducing anaemia and improving iron status in populations.
| Wheat flour fortified with iron in combination with other micronutrients compared to fortified wheat flour with same micronutrients (but not iron) for reducing anaemia and improving iron status in populations | ||||||
| Patient or population: general population of all age groups (including pregnant women) from any country over two years of age Setting: any country (studies providing data for this comparison: Phillipines, South Africa) Intervention: wheat flour fortified with iron in combination with other micronutrients Comparison: fortified wheat flour with same micronutrients (but not iron) | ||||||
| Outcomes | Anticipated absolute effects* (95% CI) | Relative effect (95% CI) | № of participants (studies) | Certainty of the evidence (GRADE) | Comments | |
| Risk with fortified wheat flour with same micronutrients (but not iron) | Risk with wheat flour fortified with iron in combination with other micronutrients | |||||
|
Anaemia (defined as haemoglobin below WHO cut‐off for age and adjusted for altitude as appropriate) follow up: 8 months |
Study population | RR 0.24 (0.08 to 0.71) | 127 (1 RCT) | ⊕⊝⊝⊝ VERY LOW 1 2 3 | Included trial: Cabalda 2009 | |
| 219 per 1,000 | 53 per 1,000 (18 to 155) | |||||
|
Iron deficiency (as defined by study authors, based on a biomarker of iron status) follow up: 8 months |
Study population | RR 0.42 (0.18 to 0.97) | 127 (1 RCT) | ⊕⊝⊝⊝ VERY LOW 1 2 3 | Included trial: Cabalda 2009 | |
| 250 per 1,000 | 105 per 1,000 (45 to 243) | |||||
|
Haemoglobin concentration (g/L) follow up: range 8 months to 8.5 months |
The mean haemoglobin concentration (g/L) was MD 0.81 higher (1.28 lower to 2.89 higher) |
‐ | 488 (2 RCTs) | ⊕⊕⊝⊝ LOW 4 5 | Included trials: Cabalda 2009;van Stuijvenberg 2008 | |
| Diarrhoea (three liquid stools in a single day) (only in children 2 to 11 years of age) | Study population | ‐ | (0 studies) | ‐ | No study reported on this outcome. | |
| ‐ | ‐ | |||||
| Respiratory infections (as measured by trialists) (only in children 2 to 11 years of age) | Study population | ‐ | (0 studies) | ‐ | No study reported on this outcome. | |
| ‐ | ‐ | |||||
| All‐cause death (only in children 2 to 11 years of age) | Study population | ‐ | (0 studies) | ‐ | No study reported on this outcome. | |
| ‐ | ‐ | |||||
| Infection or inflammation at individual level (as measured by urinary neopterin, C‐reactive protein or alpha‐1‐acid glycoprotein variant A) | Study population | ‐ | (0 studies) | ‐ | No study reported on this outcome. | |
| ‐ | ‐ | |||||
| *The risk in the intervention group (and its 95% confidence interval) is based on the assumed risk in the comparison group and the relative effect of the intervention (and its 95% CI). CI: Confidence interval; RR: Risk ratio; OR: Odds ratio; | ||||||
| GRADE Working Group grades of evidence High certainty: We are very confident that the true effect lies close to that of the estimate of the effect Moderate certainty: We are moderately confident in the effect estimate: The true effect is likely to be close to the estimate of the effect, but there is a possibility that it is substantially different Low certainty: Our confidence in the effect estimate is limited: The true effect may be substantially different from the estimate of the effect Very low certainty: We have very little confidence in the effect estimate: The true effect is likely to be substantially different from the estimate of effect | ||||||
1 Downgraded for limitations in the study design or execution (risk of bias). The only study that contributed information for this outcome was assessed as having overall high risk of bias.
2 Downgraded 1 level for indirectness. The only study included was conducted among anaemic 6 to 12 year old Filipino children in two elementary schools.
3 Downgraded 1 level for imprecision. The only study included had very few participants and few events.
4 Downgraded by 1 level. The two studies contributing information for this outcome were assessed as having overall high risk of bias.
5 Downgraded by 1 level for indirectness. The two studies providing data for this outcome were conducted among anaemic children aged 6‐12 years in Philippines, and the other was on children aged 6 to 11 years attending a primary school serving a low socioeconomic community in South Africa.
Nine RCTs were included in this review. The results are highlighted in the summary of findings tables. Seven trials (Amalrajan 2012; Barbosa 2012 (C); Biebinger 2009; Cabalda 2009; Dad 2017; Muthayya 2012; Nestel 2004 (C)) compared wheat flour fortified with iron versus unfortified wheat flour (Comparison 1, Table 1), three trials (Biebinger 2009; Cabalda 2009; Rahman 2015 (C)) compared wheat flour fortified with iron plus other micronutrients versus unfortified wheat flour (Comparison 2, Table 2), and two studies (Cabalda 2009; van Stuijvenberg 2008) compared wheat flour fortified with iron plus other micronutrients versus wheat flour fortified with other micronutrients but not iron (Comparison 3, Table 3). There were no studies comparing wheat flour fortified with iron versus no intervention or wheat flour fortified with iron in combination with other micronutrients versus no intervention. We carried out sensitivity analyses for three cluster‐randomised trials (Barbosa 2012 (C); Nestel 2004 (C); Rahman 2015 (C)), with different ICC values and examined their effect on RR for anaemia and MD for haemoglobin concentrations. We observed that change in ICC did not change the direction of effects of interventions significantly for both the outcomes. We have reported the details of sensitivity analyses in Table 4.
Comparisons
1. Wheat flour fortified with iron alone versus unfortified wheat flour (no micronutrients added)
Anaemia (defined as haemoglobin concentrations below WHO cut‐off for age and adjusted for altitude as appropriate)
Five RCTs (Barbosa 2012 (C); Cabalda 2009; Dad 2017; Muthayya 2012; Nestel 2004 (C)) involving 2200 participants (after adjusting for the effective sample size in cluster RCTs) contributed data in this comparison of assessing the effects of wheat flour fortified with iron alone on the prevalence of anaemia (See Table 1). Wheat flour fortification with iron alone (versus unfortified wheat flour) may have little or no effect on anaemia (RR 0.81, 95% CI 0.61 to 1.07; 5 studies; 2200 participants; low‐certainty evidence). Heterogeneity was high (Tau² = 0.05; Chi² = 9.14, df = 4, p = 0.14; I² = 56%). Details of the analysis are given in Analysis 1.1. Different ICC values of cluster RCTs, did not alter the overall effect estimates and heterogeneity in any manner (Table 4). Sensitivity analysis by removal of one of the trial with high risk of bias (Dad 2017) from the analysis reduced the heterogeneity (I² = 46%) and removal of Nestel 2004 (C) study reduced I² to 41%. However, removal of these two trials which had high risk of bias in more domains as compared to other included trials did not alter the effect estimate (RR).
1.1. Analysis.
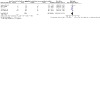
Comparison 1: Wheat flour fortified with iron alone versus unfortified wheat flour (no micronutrients added), Outcome 1: Anaemia (defined as haemoglobin below WHO cut‐off for age and adjusted for altitude as appropriate)
In the subgroup analyses, there was no clear difference in the level of anaemia among fortification and control groups except for: 1) bioavailability of iron (high and comparable bioavailability fortification had higher rates of anaemia reduction compare to that of low bioavailability); and 2) amount of elemental iron added (41 to 60 mg/kg of flour had lesser anaemia than 40 mg or less and higher than 60 mg). The Muthayya 2012 trial was driving the trend or significant difference, which made interpreting subgroup comparisons challenging. The details of the subgroup analyses are as follows.
Prevalence of anaemia at baseline less than 20% (RR 1.06, 95% CI 0.66 to 1.72; 1 study; 878 participants; I2 = 0%); between 20% and 39% (RR 0.81, 95% CI 0.52 to 1.24; 3 studies; 999 participants; I2 = 55%) and > 40% (RR 0.79, 95% CI 0.49 to 1.29; 2 studies; 323 participants; I2 = 69%) (Analysis 1.2).
There was a trend toward a reduction in the prevalence of anaemia in the subgroup of trials using iron fortificants that exhibit high relative bioavailability (RR 0.64, 95% CI 0.37 to 1.12; 2 studies; 460 participants; I2 = 13%). The fortification using comparable bioavailability also tended to reduce anaemia (RR 0.66, 95% CI 0.49 to 0.90; 2 studies; 248 participants; I2 = 0%). However there was no clear benefit from low bioavailability iron compound fortification (RR 1.03, 95% CI 0.82 to 1.30; 2 studies; 1492 participants; I2 = 0%) (Analysis 1.3).
Wheat available per capita < 75 g/day (RR 1.03, 95% CI 0.67 to 1.58; 1 study; 123 participants); more than 300 g/day (RR 0.63, 95% CI 0.44 to 0.89; 1 study; 200 participants); and unknown or unreported (RR 0.83, 95% CI 0.52 to 1.32; 3 studies; 1877 participants; I2 = 62%) (Analysis 1.4).
Malaria endemicity, unreported or unknown (RR 0.81, 95% CI 0.61 to 1.07; 5 studies; 2200 participants; I2 = 56%) (Analysis 1.5).
Duration of intervention < 6 months ‐ (RR 0.65, 95% CI 0.47 to 0.91; 2 studies; 281 participants; I2 = 0%), 6 months to 1 year (RR 0.77, 95% CI 0.43 to 1.39; 2 studies; 502 participants; I2 = 73%) (Analysis 1.6).
Flour extraction rate < 80% (RR 0.63, 95% CI 0.44 to 0.89; 200 participants = 200; 1 study), > 80% (RR 0.78, 95% CI 0.45 to 1.36; 2 studies; 1796 participants; I2 = 80%); unknown or unreported (RR 1.05, 95% CI 0.70 to 1.58; 2 studies; 204 participants; I2 = 0%) (Analysis 1.7).
Amount of elemental iron added to the flour < 40 mg/kg of flour (RR 0.68, 95% CI 0.51 to 0.92; 329 participants; 3 studies; I2 = 0%); 41 to 60 mg/kg of flour (RR 0.57, 95% CI 0.37 to 0.89; 1 study; 379 participants; I2 = 0%); and > 61 mg/kg (RR 1.03, 95% CI 0.82 to 1.30; 2 studies; 1492 participants; I2 = 0%) (Analysis 1.8).
1.2. Analysis.
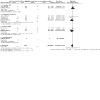
Comparison 1: Wheat flour fortified with iron alone versus unfortified wheat flour (no micronutrients added), Outcome 2: Anaemia (subgroup: by prevalence of anaemia at baseline)
1.3. Analysis.
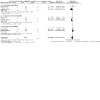
Comparison 1: Wheat flour fortified with iron alone versus unfortified wheat flour (no micronutrients added), Outcome 3: Anaemia (subgroup: by type or iron compound)
1.4. Analysis.
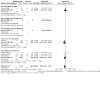
Comparison 1: Wheat flour fortified with iron alone versus unfortified wheat flour (no micronutrients added), Outcome 4: Anaemia (subgroup: by wheat flour available per capita)
1.5. Analysis.
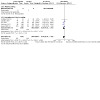
Comparison 1: Wheat flour fortified with iron alone versus unfortified wheat flour (no micronutrients added), Outcome 5: Anaemia (subgroup: by malaria endemicity)
1.6. Analysis.
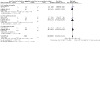
Comparison 1: Wheat flour fortified with iron alone versus unfortified wheat flour (no micronutrients added), Outcome 6: Anaemia (subgroup: by duration of intervention)
1.7. Analysis.
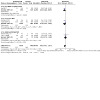
Comparison 1: Wheat flour fortified with iron alone versus unfortified wheat flour (no micronutrients added), Outcome 7: Anaemia (subgroup: by flour extraction rate)
1.8. Analysis.
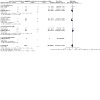
Comparison 1: Wheat flour fortified with iron alone versus unfortified wheat flour (no micronutrients added), Outcome 8: Anaemia (subgroup: by amount of elemental iron added to flour)
Iron deficiency (as defined by trialists, based on a biomarker of iron status)
Three trials (Biebinger 2009; Cabalda 2009; Muthayya 2012) comprising 633 participants contributed data to this comparison. Fortification of wheat flour with iron probably makes little or no difference on iron deficiency (RR 0.43, 95% CI 0.17 to 1.07; 3 studies; 633 participants; moderate‐certainty evidence). Heterogeneity was high (Tau² = 0.55; Chi² = 26.69, df = 2, P < 0.0001; I2 = 93%). Details of this analysis are given in Analysis 1.9. The subgroup analyses for iron deficiency are presented in Analysis 1.10 to Analysis 1.16. The decrease in iron deficiency was better among individuals with higher prevalence of anaemia at baseline (more than 20%), iron compounds with high and comparable bioavailability, 40 to 60 mg/kg of elemental iron added to flour as compared to less than 40 and more than 60 mg/kg of flour. There were no clear differences across other subgroups as given below.
1.9. Analysis.
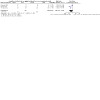
Comparison 1: Wheat flour fortified with iron alone versus unfortified wheat flour (no micronutrients added), Outcome 9: Iron deficiency (as defined by study authors, based on a biomarker of iron status)
1.10. Analysis.
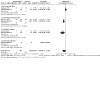
Comparison 1: Wheat flour fortified with iron alone versus unfortified wheat flour (no micronutrients added), Outcome 10: Iron deficiency (subgroup: by prevalence of anaemia at baseline)
1.16. Analysis.
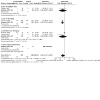
Comparison 1: Wheat flour fortified with iron alone versus unfortified wheat flour (no micronutrients added), Outcome 16: Iron deficiency (subgroup: by amount of elemental iron added to flour)
Prevalence of anaemia at the baseline less than 20% (RR 0.92, 95% CI 0.68 to 1.26; 1 study; 131 participants); 20% to 39% (RR 0.33, 95% CI 0.24 to 0.44; 1 study; 379 participants); and > 40% (RR 0.20, 95% CI 0.06 to 0.64; 1 study; 123 participants) (Analysis 1.10).
High bioavailability (RR 0.33, 95% CI 0.24 to 0.44; 1 study; 379 participants); comparable bioavailability (RR 0.20, 95% CI 0.06 to 0.64; 1 study; 123 participants); low bioavailability (RR 0.92, 95% CI 0.68 to 1.26; 1 study; 131 participants) (Analysis 1.11).
Wheat flour available per capita < 75mg/day (RR 0.20, 95% CI 0.06 to 0.64; 1 study; 123 participants); 150 to 300 mg/day (RR 0.92, 95% CI 0.68 to 1.26; 1 study; 131 participants); unknown or unreported (RR 0.33, 95% CI 0.24 to 0.44; 1 study; 379 participants) (Analysis 1.12).
Malaria endemicity unreported or unknown (RR 0.43, 95% CI 0.17 to 1.07; 3 studies; 633 participants; I2 = 93%) (Analysis 1.13).
Duration of intervention < 6 months (RR 0.92, 95% CI 0.68 to 1.26; 1 study; 131 participants); 6 months to 1 year (RR 0.32, 95% CI 0.24 to 0.42; 2 studies; 502 participants; I2 = 0%) (Analysis 1.14).
Flour extraction rate > 80% (RR 0.33, 95% CI 0.24 to 0.44; 1 study; 379 participants); unknown or unreported (RR 0.48, 95% CI 0.10 to 2.17; 2 studies; 254 participants; I2 = 85%) (Analysis 1.15).
Amount of elemental iron added to flour, 40mg/kg or less (RR 0.36, 95% CI 0.07 to 1.91; 1 study; 46 participants); 41 to 60 mg/kg (RR 0.33, 95% CI 0.24 to 0.44; 1 study; 379 participants); > 60 mg /kg (RR 0.41, 95% CI 0.06 to 2.76; 2 studies; 208 participants; I2 = 82%) (Analysis 1.16).
1.11. Analysis.
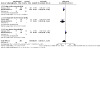
Comparison 1: Wheat flour fortified with iron alone versus unfortified wheat flour (no micronutrients added), Outcome 11: Iron deficiency (subgroup: by type of iron compound)
1.12. Analysis.
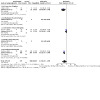
Comparison 1: Wheat flour fortified with iron alone versus unfortified wheat flour (no micronutrients added), Outcome 12: Iron deficiency (subgroup: by wheat flour available per capita)
1.13. Analysis.
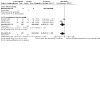
Comparison 1: Wheat flour fortified with iron alone versus unfortified wheat flour (no micronutrients added), Outcome 13: Iron deficiency (subgroup: by malaria endemicity)
1.14. Analysis.
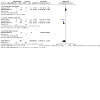
Comparison 1: Wheat flour fortified with iron alone versus unfortified wheat flour (no micronutrients added), Outcome 14: Iron deficiency (subgroup: by duration of intervention)
1.15. Analysis.
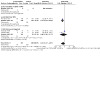
Comparison 1: Wheat flour fortified with iron alone versus unfortified wheat flour (no micronutrients added), Outcome 15: Iron deficiency (subgroup: by flour extraction rate)
Haemoglobin concentration (g/L)
Seven trials (Amalrajan 2012; Barbosa 2012 (C); Biebinger 2009; Cabalda 2009; Dad 2017; Muthayya 2012; Nestel 2004 (C)) were included in the analysis. We are uncertain whether the intervention with wheat flour fortified with iron alone increases haemoglobin concentrations in blood by an average 3.30 (g/L) (95% CI 0.86 to 5.74; 7 studies; 2355 participants; very low‐certainty evidence) as compared to unfortified wheat flour. Heterogeneity was high (Tau² = 8.24; Chi² = 35.92, df = 6 ; I2 = 83%; p <0.00001). The results have to be interpreted with caution. The details of the analysis are given in Analysis 1.17 and the subgroup analyses in Analysis 1.18 to Analysis 1.24. The mean difference in haemoglobin concentrations was better for intervention duration more than six months and also in conditions with baseline anaemia level of more than 40%. However, we are uncertain whether fortification of wheat flour as compared to unfortified flour improves the haemoglobin concentrations because certainty of evidence is very low and heterogeneity is high. The subgroup analysis findings are as given below.
1.17. Analysis.
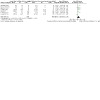
Comparison 1: Wheat flour fortified with iron alone versus unfortified wheat flour (no micronutrients added), Outcome 17: Haemoglobin concentration (g/L)
1.18. Analysis.
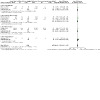
Comparison 1: Wheat flour fortified with iron alone versus unfortified wheat flour (no micronutrients added), Outcome 18: Haemoglobin concentration (subgroup: by prevalence of anaemia at baseline (g/L))
1.24. Analysis.
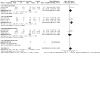
Comparison 1: Wheat flour fortified with iron alone versus unfortified wheat flour (no micronutrients added), Outcome 24: Haemoglobin concentration (subgroup: by amount of elemental iron added to flour (g/L))
Prevalence of anaemia at the baseline, less than 20% (MD 1.15, 95% CI ‐3.93 to 6.24; 2 studies; 893 participants; I2 = 85%); 20% to 39% (MD 2.95, 95% CI ‐1.35 to 7.25; 3 studies; 960 participants; I2 = 81%); > 40% (MD 2.56, 95% CI 0.89 to 4.23; 2 studies; 323 participants; I2 = 0%) (Analysis 1.18).
Type of iron compound, high bioavailability (MD 5.56, 95% CI 3.71 to 7.40; 3 studies; 639 participants; I2 = 0%); comparable bioavailability (MD 3.02, 95% CI 0.12 to 5.92; 2 studies; 248 participants; I2 = 22%); low bioavailability (MD 1.39, 95% CI ‐2.24 to 5.02; 3 studies; 1468 participants; I2 = 70%) (Analysis 1.19).
Wheat flour available per capita < 75mg/day (MD 3.77, 95% CI ‐0.73 to 8.27; 1 study; 123 participants; I2 = 0%); 150 to 300 g/day (MD 4.00, 95% CI 0.30 to 7.70; 1 study; 124 participants); > 300 g / day (MD 2.37, 95% CI 0.57 to 4.17; 1 study; 200 participants); unknown or unreported (MD 3.43, 95% CI ‐0.92 to 7.78; 4 studies; 1908 participants; I2 = 91%) (Analysis 1.20).
Malaria endemicity, unreported or unknown (MD 3.30, 95% CI 0.86 to 5.74; 7 studies; 2355 participants; I2 = 83%) (Analysis 1.21).
Duration of intervention < 6 months (MD 2.73, 95% CI 1.21 to 4.25; 3 studies; 405 participants; I2 = 0%); 6 months to 1 year (MD 5.63, 95% CI 3.81 to 7.46; 3 studies; 681 participants; I2 = 0%); more than 1 year (MD ‐0.87, 95% CI ‐2.17 to 0.43; 1 study; 1269 participants) (Analysis 1.22).
Flour extraction rate, less than or equal to 80% (MD 2.37, 95% CI 0.57 to 4.17; 1 study); 200 participants; more than 80% (MD 2.49, 95% CI ‐4.24 to 9.22; 2 studies; 1648 participants; I2 = 96%); unknown or unreported (MD 4.42, 95% CI 2.41 to 6.44; 4 studies; 507 participants; I2 = 0%) (Analysis 1.23).
Amount of elemental iron to flour, 40 mg/kg or less (MD 3.02, 95% CI 0.12 to 5.92; 2 studies; 248 participants; I2 = 22%); 41 to 60 mg/kg (MD 5.56, 95% CI 3.71 to 7.40; 3 studies; 639 participants; I2 = 0%); > 60 mg/kg (MD 1.39, 95% CI ‐2.24 to 5.02; 3 studies; 1468 participants; I2 = 70%) (Analysis 1.24).
1.19. Analysis.
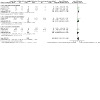
Comparison 1: Wheat flour fortified with iron alone versus unfortified wheat flour (no micronutrients added), Outcome 19: Haemoglobin concentration (subgroup: by type of iron compound (g/L))
1.20. Analysis.
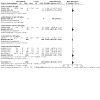
Comparison 1: Wheat flour fortified with iron alone versus unfortified wheat flour (no micronutrients added), Outcome 20: Haemoglobin concentration (subgroup: by wheat flour available per capita (g/L))
1.21. Analysis.
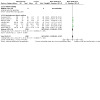
Comparison 1: Wheat flour fortified with iron alone versus unfortified wheat flour (no micronutrients added), Outcome 21: Haemoglobin concentration (subgroup: by malaria endemicity (g/L))
1.22. Analysis.
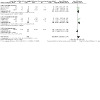
Comparison 1: Wheat flour fortified with iron alone versus unfortified wheat flour (no micronutrients added), Outcome 22: Haemoglobin concentration (subgroup: by duration of intervention (g/L))
1.23. Analysis.
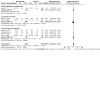
Comparison 1: Wheat flour fortified with iron alone versus unfortified wheat flour (no micronutrients added), Outcome 23: Haemoglobin concentration (subgroup: by flour extraction rate (g/L))
Diarrhoea
No studies reported on diarrhoea in children.
Respiratory infections
No studies reported on respiratory infections in children.
All‐cause death
No studies reported on all‐cause death in children.
Infection of inflammation at an individual level
Two trials consisting of 558 individuals (Amalrajan 2012; Muthayya 2012) reported infection or inflammation using as biomarker C‐reactive protein in this comparison. There is little or no effect of fortification of wheat flour with iron on infection or inflammation measures (MD 0.04, 95% CI ‐0.02 to 0.11; 2 studies; 558 participants; I2 = 0%, moderate‐certainty evidence). The analysis details are given in Analysis 1.28.
1.28. Analysis.
Comparison 1: Wheat flour fortified with iron alone versus unfortified wheat flour (no micronutrients added), Outcome 28: Infection or inflammation (CRP) (only in children 2 to 11 years of age)
Height for age z‐score
One trial (Amalrajan 2012) reported height for age z‐score and there was no difference in the z‐score in the fortification and control arms (MD 1.90, 95% CI ‐2.42 to 6.22; 1 study; 179 participants). See Analysis 1.29 for details.
1.29. Analysis.
Comparison 1: Wheat flour fortified with iron alone versus unfortified wheat flour (no micronutrients added), Outcome 29: Height‐for‐age z‐score (in children)
Weight for age z‐score
No trials reported weight for age z‐score among children.
Risk of iron overload (defined as serum ferritin higher than 150 µg/L in females and higher than 200 µg/L in men)
No trials reported risk of iron overload.
Cognitive development in children
One trial (Muthayya 2012) reported cognitive outcomes (MD 0.33, 95% CI ‐0.29 to 0.95; 850 participants) as depicted in Analysis 1.30. Fortification of wheat flour with iron had no effect on cognitive outcomes.The trial authors reported conducting series of neuropsychological tests for school‐aged children and under relevant cognitive domains. These domains included short‐term memory, retrieval ability, cognitive speed and fluid reasoning (Muthayya 2012).
1.30. Analysis.
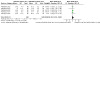
Comparison 1: Wheat flour fortified with iron alone versus unfortified wheat flour (no micronutrients added), Outcome 30: Cognitive development (in children)
Motor skill development in children
No studies reported on motor skill development in children
Clinical malaria (as defined by trialists)
No studies reported clinical malaria.
Severe malaria (as defined by trialists)
No studies reported severe malaria.
Adverse side effects (including constipation, nausea, vomiting, heartburn or diarrhoea, as defined by trialists)
No studies reported adverse side effects.
2. Wheat flour fortified with iron in combination with other micronutrients versus unfortified wheat flour (no micronutrients added)
Anaemia (defined as haemoglobin concentrations below WHO cut‐off for age and adjusted for altitude as appropriate)
Two trials (322 participants) were included in this analysis (Cabalda 2009; Rahman 2015 (C)). Wheat flour fortified with iron in combination with other micronutrients may or may not decrease anaemia (RR 0.95, 95% CI 0.69 to 1.31; 2 studies; 322 participants; low‐certainty evidence) (Table 2) . Heterogeneity was low (Tau² = 0.00; Chi² = 0.21, df = 1, p = 0.65, I² = 0%). Details of the analysis are given in Analysis 2.1.
2.1. Analysis.
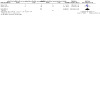
Comparison 2: Wheat flour fortified with iron in combination with other micronutrients versus unfortified wheat flour (no micronutrients added), Outcome 1: Anaemia (defined as haemoglobin below WHO cut‐off for age and adjusted for altitude as appropriate)
Iron deficiency (as defined by trialists, based on a biomarker of iron status)
Three trials (Biebinger 2009; Cabalda 2009; Rahman 2015 (C)) with 387 participants contributed data for this comparison. Fortification of wheat flour with iron in combination with other micronutrients makes little or no difference to iron deficiency (RR 0.74, 95% CI 0.54 to 1.00; 3 studies; 387 participants; moderate‐certainty evidence). Heterogeneity was low (Tau² = 0.00; Chi² = 1.14, df = 2, p= 0.57, I² = 0%). The details of this analysis are given in Analysis 2.2. There were no significant differences in iron deficiency across any of the following subgroups (Analysis 2.3 to Analysis 2.9).
2.2. Analysis.
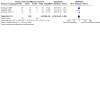
Comparison 2: Wheat flour fortified with iron in combination with other micronutrients versus unfortified wheat flour (no micronutrients added), Outcome 2: Iron deficiency (as defined by study authors, based on a biomarker of iron status)
2.3. Analysis.
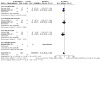
Comparison 2: Wheat flour fortified with iron in combination with other micronutrients versus unfortified wheat flour (no micronutrients added), Outcome 3: Iron deficiency (subgroup: by prevalence of anaemia at baseline)
2.9. Analysis.
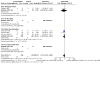
Comparison 2: Wheat flour fortified with iron in combination with other micronutrients versus unfortified wheat flour (no micronutrients added), Outcome 9: Iron deficiency (subgroup: by amount of elemental iron added to flour)
Prevalence of anaemia at the baseline, less than 20% (RR 0.73, 95% CI 0.51 to 1.07; 1 study; 118 participants; I2 = 0%); 20% to 39% (RR 0.93, 95% CI 0.47 to 1.84; 1 study; 143 participants; I2 = 0%); and more than 40% (RR 0.51, 95% CI 0.22 to 1.21; 1 study; 126 participants; I2 = 0%) (Analysis 2.3).
Type of iron compound, comparable bioavailability (RR 0.50, 95% CI 0.14 to 1.74; 1 study; 48 participants; I2 = 0%); low bioavailability (RR 0.76, 95% CI 0.55 to 1.04; 3 studies; 339 participants; I2 = 0%) (Analysis 2.4).
Wheat flour available per capita, less than 75 g/day (RR 0.51, 95% CI 0.22 to 1.21; 1 study; 126 participants; I2 = 0%); between 150 and 300 g/day (RR 0.73, 95% CI 0.51 to 1.07; 1 study; 118 participants; I2 = 0%); unknown or unreported (RR 0.93, 95% CI 0.47 to 1.84; 1 study; 143 participants; I2 = 0%) (Analysis 2.5).
Malaria endemicity, unreported or unknown (RR 0.74, 95% CI 0.54 to 1.00; 3 studies; 387 participants; I2 = 0%) (Analysis 2.6).
Duration of intervention < 6 months (RR 0.73, 95% CI 0.51 to 1.07; 1 study; 118 participants; I2 = 0%); six months to one year (RR 0.73, 95% CI 0.41 to 1.30; 2 studies; 269 participants; I2 = 12%) (Analysis 2.7)
Flour extraction rate, unknown or unreported (RR 0.74, 95% CI 0.54 to 1.00; 3 studies; 387 participants; I2 = 0%) (Analysis 2.8)
Amount of elemental iron added to flour, less than 40 mg/kg (RR 0.63, 95% CI 0.16 to 2.45; 1 study; 47 participants; I2 = 0%), more than 60 mg/kg (RR 0.74, 95% CI 0.54 to 1.01; 3 studies; 340 participants; I2 = 0%) (Analysis 2.9)
2.4. Analysis.
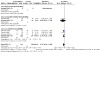
Comparison 2: Wheat flour fortified with iron in combination with other micronutrients versus unfortified wheat flour (no micronutrients added), Outcome 4: Iron deficiency (subgroup: by type of iron compound)
2.5. Analysis.
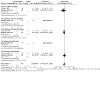
Comparison 2: Wheat flour fortified with iron in combination with other micronutrients versus unfortified wheat flour (no micronutrients added), Outcome 5: Iron deficiency (subgroup: by wheat flour available per capita)
2.6. Analysis.
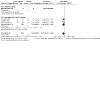
Comparison 2: Wheat flour fortified with iron in combination with other micronutrients versus unfortified wheat flour (no micronutrients added), Outcome 6: Iron deficiency (subgroup: by malaria endemicity)
2.7. Analysis.
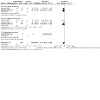
Comparison 2: Wheat flour fortified with iron in combination with other micronutrients versus unfortified wheat flour (no micronutrients added), Outcome 7: Iron deficiency (subgroup: by duration of intervention)
2.8. Analysis.
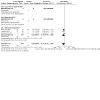
Comparison 2: Wheat flour fortified with iron in combination with other micronutrients versus unfortified wheat flour (no micronutrients added), Outcome 8: Iron deficiency (subgroup: by flour extraction rate)
Haemoglobin concentration (g/L)
Haemoglobin concentration (g/L) in blood was reported in three trials with 384 participants (Biebinger 2009; Cabalda 2009; Rahman 2015 (C)). Fortification of wheat flour with iron in combination with other micronutrients in comparison to unfortified flour may or may not increase average haemoglobin concentrations (g/L) in the population (MD 3.29, 95% CI ‐0.78 to 7.36; 3 studies; 384 participants; low‐certainty evidence). Heterogeneity was high (Tau² = 9.61; Chi² = 8.09, df = 2, p = 0.02, I² = 75%). The results should be interpreted with caution. Details of this analysis are given in Analysis 2.10.
2.10. Analysis.
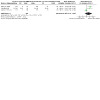
Comparison 2: Wheat flour fortified with iron in combination with other micronutrients versus unfortified wheat flour (no micronutrients added), Outcome 10: Haemoglobin concentration (g/L)
Prevalence of anaemia at the baseline, less than 20% (MD 6.00, 95% CI 2.38 to 9.62; 1 study; 118 participants; I2 = 0%); between 20 and 39% (MD 0.00, 95% CI ‐2.54 to 2.54; 1 study; 140 participants); more than 40% (MD 4.54, 95% CI ‐0.00 to 9.08; 1 study; 126 participants; I2 = 0%) (Analysis 2.11).
Type of iron compound added to flour, comparable bioavailability (MD 2.91, 95% CI ‐1.35 to 7.16; 3 studies; 306 participants; I2 = 72%); low bioavailability (MD 5.15, 95% CI ‐1.31 to 11.61; 1 study; 78 participants) (Analysis 2.12).
Wheat flour available per capita, less than 75 g/day (MD 4.54, 95% CI ‐0.00 to 9.08; 1 study; 126 participants), between 150 and 300 g/day (MD 6.00, 95% CI 2.38 to 9.62; 1 study; 118 participants); unknown or unreported (MD 0.00, 95% CI ‐2.54 to 2.54; 1 study; 140 participants) (Analysis 2.13).
Malaria endemicity unreported or unknown (MD 3.29, 95% CI ‐0.78 to 7.36; 3 studies; 384 participants; I2 = 75%) (Analysis 2.14).
Duration of intervention, less than 6 months (MD 6.00, 95% CI 2.38 to 9.62; 1 study; 118 participants); six months to one year (MD 1.86, 95% CI ‐2.51 to 6.24; 2 studies; 266 participants; I2 = 66%) (Analysis 2.15).
Flour extraction rate, unknown or unreported (MD 3.29, 95% CI ‐0.78 to 7.36; 3 studies; 384 participants; I2 = 75%) (Analysis 2.16).
Amount of elemental iron added to flour less than 40 mg/kg (MD 3.28, 95% CI ‐2.96 to 9.52; 1 study; 48 participants); more than 60 mg/kg (MD 3.37, 95% CI ‐1.13 to 7.86; 3 studies; 336 participants; I2 = 75%) (Analysis 2.17).
2.11. Analysis.
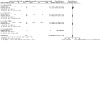
Comparison 2: Wheat flour fortified with iron in combination with other micronutrients versus unfortified wheat flour (no micronutrients added), Outcome 11: Haemoglobin concentration (subgroup: by prevalence of anaemia at baseline(g/L))
2.12. Analysis.
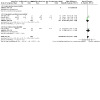
Comparison 2: Wheat flour fortified with iron in combination with other micronutrients versus unfortified wheat flour (no micronutrients added), Outcome 12: Haemoglobin concentration (subgroup: by type of iron compound (g/L))
2.13. Analysis.
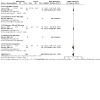
Comparison 2: Wheat flour fortified with iron in combination with other micronutrients versus unfortified wheat flour (no micronutrients added), Outcome 13: Haemoglobin concentration (subgroup: by wheat flour available per capita (g/L))
2.14. Analysis.
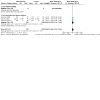
Comparison 2: Wheat flour fortified with iron in combination with other micronutrients versus unfortified wheat flour (no micronutrients added), Outcome 14: Haemoglobin concentration (subgroup: by malaria endemicity (g/L))
2.15. Analysis.
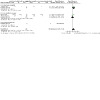
Comparison 2: Wheat flour fortified with iron in combination with other micronutrients versus unfortified wheat flour (no micronutrients added), Outcome 15: Haemoglobin concentration (subgroup: by duration of intervention (g/L))
2.16. Analysis.
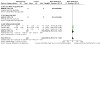
Comparison 2: Wheat flour fortified with iron in combination with other micronutrients versus unfortified wheat flour (no micronutrients added), Outcome 16: Haemoglobin concentration (subgroup: by flour extraction rate (g/L))
2.17. Analysis.
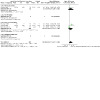
Comparison 2: Wheat flour fortified with iron in combination with other micronutrients versus unfortified wheat flour (no micronutrients added), Outcome 17: Haemoglobin concentration (subgroup: by amount of elemental iron added to flour (g/L))
Diarrhoea (three liquid stools in a single day)
No studies reported on diarrhoea in children.
Respiratory infections (as measured by trialists)
No studies reported on respiratory infections in children.
All‐cause death
No studies reported on all cause death in children.
Infection or inflammation at individual level (as measured by urinary neopterin, C‐reactive protein or alpha‐1‐acid glycoprotein variant A)
No studies reported on infection or inflammation in children.
Anthropometric measures (height‐for‐age z‐score and weight‐for‐height z‐score for children, BMI for adults)
No studies reported on anthropometric measures.
Risk of iron overload (defined as serum ferritin higher than 150 µg/L in females and higher than 200 µg/L in men)
No studies reported on risk of iron overload.
Cognitive development in children aged 2 to 11 years (as defined by trialists)
No studies reported on cognitive development in children.
Motor skill development in children aged 2 to 11 years (as defined by trialists)
No studies reported on motor skill development in children.
Clinical malaria (as defined by trialists)
No studies reported on clinical malaria.
Severe malaria (as defined by trialists)
No studies reported on severe malaria.
Adverse side effects (including constipation, nausea, vomiting, heartburn or diarrhoea, as defined by trialists)
No studies reported adverse side effects.
3. Wheat flour fortified with iron in combination with other micronutrients versus fortified wheat flour with same micronutrients (but not iron)
Two trials contributed data to this comparison (Cabalda 2009; van Stuijvenberg 2008) including 488 participants (children aged 6 to 12 years)(See Table 3) .
Anaemia (defined as haemoglobin concentrations below WHO cut‐off for age and adjusted for altitude as appropriate)
Given the very‐low certainty of the evidence, the review authors are uncertain on the effects of wheat flour fortified with iron in combination with other micronutrients versus fortified wheat flour with same micronutrients (but not iron) in reducing anaemia (RR 0.24, 95% CI 0.08 to 0.71; 1 study; 127 participants; very low‐certainty evidence).
Iron deficiency (as defined by trialists, based on a biomarker of iron status)
Given the very‐low certainty of the evidence we are uncertain on whether fortification of wheat flour with iron in combination with other micronutrients reduces iron deficiency (RR 0.42, 95% CI 0.18 to 0.97; 1 study; 127 participants; very low‐certainty evidence).
Haemoglobin concentration (g/L)
Given the low certainty of the evidence, wheat flour fortified with iron in combination with other micronutrients (compared to wheat flour fortified with the same micronutrients, but not iron) may make little or no difference to the average haemoglobin concentration (MD 0.81, 95% CI ‐1.28 to 2.89; 2 studies; 488 participants; low‐certainty evidence), as depicted in Analysis 3.3.
3.3. Analysis.
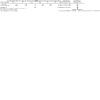
Comparison 3: Wheat flour fortified with iron in combination with other micronutrients versus fortified wheat flour with same micronutrients (but not iron), Outcome 3: Haemoglobin concentration (g/L)
Diarrhoea
No studies reported on diarrhoea.
Respiratory infections
No studies reported on respiratory infections.
All‐cause death
No studies reported on all‐cause death.
Infection or inflammation at individual level (as measured by urinary neopterin, C‐reactive protein or alpha‐1‐acid glycoprotein variant A)
No studies reported on infection or inflammation in children.
Anthropometric measures (height‐for‐age z‐score and weight‐for‐height z‐score for children, BMI for adults)
No studies reported on anthropometric measures.
Risk of iron overload (defined as serum ferritin higher than 150 µg/L in females and higher than 200 µg/L in men)
No studies reported on risk of iron overload.
Cognitive development in children aged 2 to 11 years (as defined by trialists)
No studies reported on cognitive development in children.
Motor skill development in children aged 2 to 11 years (as defined by trialists)
No studies reported on motor skill development in children.
Clinical malaria (as defined by trialists)
No studies reported on clinical malaria.
Severe malaria (as defined by trialists)
No studies reported on severe malaria.
Adverse side effects (including constipation, nausea, vomiting, heartburn or diarrhoea, as defined by trialists)
No studies reported adverse side effects.
4. Wheat flour fortified with iron alone versus no intervention
No studies assessed this comparison.
5. Wheat flour fortified with iron in combination with other micronutrients versus no intervention
No studies assessed this comparison.
Discussion
Summary of main results
We included nine RCTs in this review. Seven trials compared wheat flour fortified with iron versus unfortified wheat flour (comparison 1); three trials compared wheat flour fortified with iron in combination with other micronutrients versus unfortified wheat flour (comparison 2); and two trials compared wheat flour fortified with iron in combination with other micronutrients versus fortified wheat flour with same micronutrients but not iron (comparison 3).
Wheat flour fortification with iron alone may have little or no effect on anaemia (low‐certainty evidence), and has little or no effect on iron deficiency (moderate‐certainty evidence). We are uncertain on whether the intervention with wheat flour fortified with iron increases haemoglobin concentrations (very low‐certainty evidence), as compared to unfortified flour.
Wheat flour fortified with iron in combination with other micronutrients, probably makes little or no difference to anaemia (low‐certainty evidence), iron deficiency (moderate‐certainty evidence), or haemoglobin concentrations (low‐certainty evidence) in comparison to unfortified flour.
Given the very low certainty of the evidence, we are uncertain on whether wheat flour fortified with iron in combination with other micronutrients versus fortified wheat flour with same micronutrients (but not iron) reduces anaemia (very low‐certainty evidence), or reduces iron deficiency (very low‐certainty evidence). Given the low certainty of the evidence, wheat flour fortified with iron in combination with other micronutrients (compared to wheat flour fortified with the same micronutrients, but not iron) may make little or no difference to the average haemoglobin concentration (low‐certainty evidence).
The majority of the included trials reported source of funding, with many of them having multiple sources of funding received from government agencies or international non‐government organizations.
Most of the studies included in this review had low random‐sequence generation and allocation concealment bias (selection bias) and low risk from blinding of participants, personnel and outcome assessment (performance and detection bias). Six out of nine studies had low or unclear risk for incomplete outcome data (attrition bias), and all the studies but one had unclear selective reporting bias due to not including studies in the protocol registry of randomised control trials databases (reporting bias). Some trials provided different interventions and were included in the corresponding comparisons.
Overall completeness and applicability of evidence
Wheat flour is consumed across diverse populations and fortification of wheat flour with iron is one strategy that is used to improve iron status in populations. The ultimate goal of improving iron intake in children and adults is to decrease the prevalence of iron deficiency and anaemia to limit the adverse heath outcomes associated with these conditions.
We divided this review's nine RCT into three comparison groups. Though the differences in interventions and comparisons make this division necessary, this inherently limits not only statistical power, but also the applicability and generalisability of the findings. There was good agreement among the comparisons that the prevalence of iron deficiency is reduced as a result of wheat flour fortification, but that this did not extend to a decrease in the prevalence of anaemia.
The bioavailability of iron varies considerably among the forms of iron fortificant identified in the analysed trials. We carried out subgroup analysis based on the bio availability of the iron compounds used in wheat flour fortification. We observed that higher bio availability compounds had slightly better effects on anaemia, iron deficiency and haemoglobin concentrations,as compared to iron compounds with lower bio availability. However, there was difference in the duration of interventions, study population characteristics across the studies, which limits the applicability of the evidence. Unfortunately, several studies were excluded because the flour fortification programmes used both wheat and maize flour, and the focus of this review was fortification of wheat flour with iron. It is likely that these trials offer evidence that was not evaluated here and may offer further insight into the true efficacy of iron fortification programmes. Adherence was measured in some studies through 24‐hour recalls and in some cases weighing of foods remains in the meals. Adherence poses in this type of studies a challenge as the fortified food, prepared with the fortified flour is consumed usually as part of a meal provided, which may affect its interpretation. Coverage and utilization of the fortified food is complex in food fortification studies (Neufeld 2017).
Quality of the evidence
We assessed the certainty of evidence with the GRADE methodology. The evidence was primarily of very low‐, low‐ and moderate‐certainty. The decrease in the certainty of the evidence was largely due to limitations in the study design or execution, or to indirectness or imprecision.
Potential biases in the review process
In this review, two review authors (JPPR and MF) performed the database searches. Two review authors (MF and DE) independently assessed eligibility for inclusion, carried out data extraction using a standardized extraction file and assessed risk of bias following the Chapter 8 Cochrane Manual: Assessing risk of bias in included studies. When there was disagreement of risk of bias categorization, issues were settled through discussion and consensus. New authors were trained in the WHO/Cochrane Collaboration/Cornell University Summer Institute for Systematic Reviews in Nutrition for Global Policy Making in order to ensure the review process followed a systematic approach.
Agreements and disagreements with other studies or reviews
A recent systematic review assessing the effectiveness of fortification of both wheat and maize flour with iron found that there was little evidence in support of a decrease in the prevalence of anaemia due to flour fortification with iron, but that there was stronger evidence in support of iron fortification on improving iron status (increasing serum ferritin) in women of reproductive age (Pachon 2015). Overall, the results found in our analysis (which consisted of many of the same trials) are in agreement with those of Pachon 2015; iron fortification of wheat flour was much more successful at decreasing the prevalence of iron deficiency than in decreasing the prevalence of anaemia. A systematic review (Sadighi 2015) which examined flour fortification with iron and its effectiveness in controlling anaemia and iron deficiency included 44 studies. Those studies consisted of trials evaluating the effectiveness of wheat flour fortification. They reported mixed findings on the effectiveness of flour fortification in improving iron indicators and also they found various findings in different countries. Another meta‐analysis (Sadighi 2017) looked at the effectiveness of iron‐fortified flour on haemoglobin and anaemia. The study authors reported that the fortification of flour had no effect on iron deficiency anaemia. They also noted that the quality and degree of effect varied with the type of iron compound used for fortification.
Another systematic review (Das 2013) included 201 studies with fortification of staple food items, condiments and processed food items with micronutrients like iron, zinc, calcium and vitamin D. They classified the staple food items as rice, wheat and oils. The authors of the systematic review reported significant increase in serum micronutrient concentrations based on their included studies. Iron fortification led to a significant increase in serum ferritin and haemoglobin levels in women of reproductive age and pregnant women. Folate fortification significantly reduced the incidence of congenital abnormalities like neural tube defects without increasing the incidence of twinning. The number of studies pooled for zinc and multiple micronutrients for women were few, though the evidence suggested benefit. There was a dearth of evidence for the impact of fortification strategies on morbidity and mortality outcomes in women and children. Combined effect: RR 0.68, 95% CI 0.49 to 0.93; processed food: RR 0.51, 95% CI 0.21 to 1.25; staple food: RR 0.67, 95% CI 0.39 to 1.17); condiments: RR 0.74, 95% CI 0.61 to 0.90 (low‐certainty evidence).
Gera 2012 carried out a systematic review on the effect of iron‐fortified foods on haematologic and biological outcomes in the population. However, they included all food items that were fortified with iron and examined the effect on the above‐stated parameters. Wheat flour fortification was one of the components of their comparisons. They concluded overall that iron‐fortified foods resulted in an improvement in haemoglobin, serum ferritin and there was evidence of reduced risk of anaemia and iron deficiency.
One recent systematic review (Sadighi 2019) included effects of fortification of flours (wheat, maize, rice, soy and beans) with iron on iron status in the population. The review included 94 trials from 30 countries belonging to all socioeconomic strata in their meta‐analysis. The target groups in included studies were women, children, and infants/toddlers. They reported significant increases of mean haemoglobin level, serum ferritin level, significant decreases of anaemia and iron deficiency and a non‐significant change in iron deficiency anaemia (IDA). Sadighi 2019 concluded that at the global level, fortification of flours with iron is an effective strategy to improve the iron status of populations.
Another Cochrane review (Das 2019) assessed the impact of fortification of various food items (rice and flour; dairy products; non‐dairy beverages; biscuits; spreads and salt) with multiple micronutrients on health outcomes in the population. The review authors included RCTs, cluster‐RCTs, quasi‐randomised trials, controlled before‐after studies (CBA) and interrupted‐time series (ITS) studies, irrespective of income status of the countries. The review included a total of 43 studies with 19,585 participants and it reported based on the RCTs that in comparison to placebo or no intervention. Multiple micronutrients fortification may reduce anaemia, iron deficiency anaemia and micronutrient deficiencies (iron, vitamin A, vitamin B2 and vitamin B6) and may improve weight‐for‐age z‐scores (WAZ). The review also reported uncertainty about the effect of multiple micronutrients fortification on zinc deficiency and anthropometric measures (HAZ/LAZ, WAZ and WHZ/WLZ). However as the food matrix plays an important role in the bioavailability of the fortificants and particularly of the iron compounds it is important to have the effects in the wheat flour specifically with the attributes of extraction rate, and iron compounds used at the flour stage.
Authors' conclusions
Implications for practice.
Despite the availability of RCTs assessing various types of wheat flour fortifications on anaemia, haemoglobin and other parameters, there is very low‐, low‐ and moderate certainty evidence of the effect. To a certain extent there is uncertainty on whether there are any differences in the haemoglobin concentrations (a biomarker of anaemia) among those who received iron‐fortified wheat flour compared to those who did not consume iron‐fortified flour. However it is uncertain that fortification of wheat flour with iron and other vitamins and minerals in comparison to unfortified wheat flour reduces the risk of iron deficiency in populations aged 2 years and above. There was also a high degree of heterogeneity across the included studies with respect to anaemia, making the effect estimation difficult.
No studies reported on any adverse effects. The presence of industry funding for some of these trials did not appear to positively influence results from these studies.
Implications for research.
The adverse health outcomes and public health burden of anaemia, which may affect up to 4 in 10 children, or millions or individuals worldwide, are well‐characterised and include increased maternal and perinatal mortality, low birth weight, impaired cognitive performance and poorer educational achievement as well as reduced work capacity (Beard 2006; Khan 2006). The prevalence of anaemia is also greater in low‐ and middle‐income countries, where inflammatory states such as HIV or malaria or hookworm infections are also common. Few of the trials reported here measured inflammatory markers such as CRP. It is unclear whether this is a modifier of the effectiveness of iron fortification programmes, and this is one area in which not more research, but more consistent research (in terms of biomarkers measured) is needed. Isolating the effects of this population‐based intervention on anaemia and iron deficiency, at the same time that co‐interventions that have an known effect on these outcomes are provided, makes it difficult to disentangle the individual effect of fortification with iron, from fortification with iron and other micronutrients (also affecting these outcomes).
Iron deficiency is just one cause of anaemia; other causes include infection or inflammation and deficiencies in other vitamins including folate and vitamin B12. Vitamin B12 deficiency is more common in populations that consume plant‐based diets and in the elderly.
Iron deficiency may not be the only cause of the anaemia observed in the trial populations, and understanding the interactions between iron and other micronutrients in these populations is an area for further research. Impaired cognitive development and impaired motor skill development are two common consequences of anaemia in children, and none of the trials identified in this review measured motor development and one study assessed cognitive development. The ability of programmes using iron fortification of wheat flour on these outcomes could not be assessed, and this is a another key area for further research.
Therefore, well‐designed and implemented RCTs in this regard would be useful in providing the exact nature of the effect of fortification of wheat flour with iron and or minerals on haematological indices. The effects can vary depending on the geographical locations and dietary habits of populations. Areas with high use of wheat‐based food products will naturally have more compliance and adherence, reflecting different effects of fortification on populations belonging to different settings. Both the cost effectiveness and effects of usage of iron compounds with different extents of bio‐availability among different age groups need to be evaluated.
History
Protocol first published: Issue 9, 2014 Review first published: Issue 7, 2020
Acknowledgements
The protocol was completed during the WHO/Cochrane Collaboration/Cornell University Summer Institute for Systematic Reviews in Nutrition for Global Policy Making hosted at the Division of Nutritional Sciences, Cornell University, Ithaca, USA from 27 July to 7 August, 2015. The World Health Organization has partially supported this programme since 2014.
The World Health Organization retains copyright and all other rights in their respective contributions to the manuscript of this review as submitted for publication.
We would like to thank Cochrane Public Health and the Cochrane Public Health and Heatlh Systems Network for their editorial support in the preparation of this review. As part of the pre‐publication editorial process, this review was commented on by external peers (two referees who are external to the editorial team) a Cochrane Public Health statistician, methods editor and information specialist, and an allocated contact editor.
We would like to especially acknowledge the careful and thoughtful technical and editorial feedback provided by Lorainne Tudor Car (Methods editor), Ruth Dundas (Statistical editor), Valerie Wells (Information specialist), Solange Durao (contact editor), Lee‐Yee Chong (Cochrane Public Health and Health Services Network editor), as well as Luke Wolfenden, Hilary Thomson and Jodie Doyle from Cochrane Public Health. We would also like to acknowledge Denise Mitchell, Senior Copy Editor from the Editorial and Methods Department, Cochrane Central Executive for the support with the Plain Language Summary in this review.
We would also like to thank Belinda J Burford and Luz Maria De‐Regil for their contributions to the protocol of this review, as well as Luz Maria De‐Regil and Maria Nieves Garcia‐Casal for a technical review of the final version of this review.
Diana Estevez thanks all the support of the first multidisciplinary training programme on global nutrition policy for sustainable development in 2015 designed by the Latin American Society of Nutrition (SLAN), World Health Organization (WHO), Pan American Health Organization (PAHO), the United Nations' World Food Programme (WFP) and Nutrition International (formerly Micronutrient Initiative).
Appendices
Appendix 1. Search strategy
CENTRAL
#1 MESH DESCRIPTOR Iron
#2 MESH DESCRIPTOR Ferrous Compounds
#3 MESH DESCRIPTOR Anemia, Iron‐Deficiency
#4 MESH DESCRIPTOR Iron, Dietary
#5 ((iron or ferrous* or ferric* or fe)):TI,AB,KY
#6 #1 OR #2 OR #3 OR #4 OR #5
#7 MESH DESCRIPTOR Flour
#8 MESH DESCRIPTOR Triticum
#9 ((wheat or flour*)):TI,AB,KY
#10 #7 OR #8 OR #9
#11 ((fortif* or enrich* or enhanc* or boost*)):TI,AB,KY
#12 MESH DESCRIPTOR Food, Fortified
#13 #11 OR #12
#14 #6 AND #10 AND #13
MEDLINE and Medline in Progress(OVID)
1 Iron/ or Ferrous Compounds/ or Anemia, Iron‐Deficiency/
2 Iron, Dietary/
3 (iron or ferrous* or ferric* or fe).tw.
4 or/1‐3
5 Flour/ or Triticum/
6 (wheat or flour*).tw.
7 or/5‐6
8 (fortif* or enrich* or enhanc* or boost*).tw.
9 Food, Fortified/
10 8 or 9
11 4 and 7 and 10
12 exp animals/ not humans/
13 11 not 12
EMBASE (OVID)
1 Iron/ or Ferrous ion/ or Anemia, Iron‐Deficiency/
2 Iron intake/
3 (iron or ferrous* or ferric* or fe).tw.
4 or/1‐3
5 Flour/ or Wheat/
6 (wheat or flour*).tw.
7 or/5‐6
8 (fortif* or enrich* or enhanc* or boost*).tw.
9 Food, Fortified/
10 8 or 9
11 4 and 7 and 10
12 (animal/ or nonhuman/) not human/
13 11 not 12
CINAHL (EBSCO)
S12 (S5 AND S8 AND S11)
S11 S9 OR S10
S10 (MH "Food, Fortified")
S9 (fortif* or enrich* or enhanc* or boost*)
S8 S6 OR S7
S7 (wheat or flour*)
S6 (MH "Wheat")
S5 S1 OR S2 OR S3 OR S4
S4 (iron or ferrous* or ferric* or fe)
S3 (MH "Anemia, Iron Deficiency")
S2 (MH "Ferrous Compounds")
S1 (MH "Iron")
Web of Science (SCI, SSCI, CPCI & CRCI‐SSH)
#4 #3 AND #2 AND #1
Indexes=SCI‐EXPANDED, SSCI, CPCI‐S, CPCI‐SSH Timespan=All years
#3TOPIC: ((iron or ferrous* or ferric* or fe))
Indexes=SCI‐EXPANDED, SSCI, CPCI‐S, CPCI‐SSH Timespan=All years
#2TOPIC: ((wheat or flour* or Triticum))
Indexes=SCI‐EXPANDED, SSCI, CPCI‐S, CPCI‐SSH Timespan=All years
#1 TOPIC: ((fortif* or enrich* or enhanc* or boost*))
Indexes=SCI‐EXPANDED, SSCI, CPCI‐S, CPCI‐SSH Timespan=All years
BIOSIS (ISI)
#5 #3 AND #2 AND #1
Refined by: MAJOR CONCEPTS: ( NUTRITION OR FOODS )
Indexes=BCI Timespan=All years
#4 #3 AND #2 AND #1
Indexes=BCI Timespan=All years
#3 TOPIC: ((fortif* or enrich* or enhanc* or boost*))
Indexes=BCI Timespan=All years
#2 TOPIC: ((wheat or flour* or Triticum))
Indexes=BCI Timespan=All years
#1 TOPIC: ((iron or ferrous* or ferric* or fe))
Indexes=BCI Timespan=All years
Popline
(iron or ferrous* or ferric* or fe)
and
(wheat or flour*)
and
(fortif* or enrich* or enhanc* or boost*)
IBECS, PAHO, WHOLIS and LILACS (BIREME)
(iron or ferrous$ or ferric$ or fe)
and
(wheat or flour$)
and
(fortif$ or enrich$ or enhanc$ or boost$)
SCIELO
(iron or ferrous$ or ferric$ or fe) and (wheat or flour$) and (fortif$ or enrich$ or enhanc$ or boost$)
WPRO, IMSEAR, AFRO and EMRO (GLOBAL INDEX MEDICUS)
(iron or ferrous* or ferric* or fe) and (wheat or flour*) and (fortif* or enrich* or enhanc* or boost*)
INDMED
wheat or flour or flours
and
(iron or ferrous or ferric or fe)
and
(fortify or fortified or enrich or enriched or enhance or enhanced or boost or boosted or boosts)
Native Health Research database
(iron or ferrous* or ferric or fe) and (wheat or flour)
clinicaltrials.gov
(iron and wheat flour)
(ferrous and wheat flour)
(ferric and wheat flour)
(iron and wheat and fortification)
International Clinical Trials Registry Platform
(iron and wheat)
(ferrous and wheat)
(ferric and wheat)
Data and analyses
Comparison 1. Wheat flour fortified with iron alone versus unfortified wheat flour (no micronutrients added).
| Outcome or subgroup title | No. of studies | No. of participants | Statistical method | Effect size |
|---|---|---|---|---|
| 1.1 Anaemia (defined as haemoglobin below WHO cut‐off for age and adjusted for altitude as appropriate) | 5 | 2200 | Risk Ratio (M‐H, Random, 95% CI) | 0.81 [0.61, 1.07] |
| 1.2 Anaemia (subgroup: by prevalence of anaemia at baseline) | 5 | 2200 | Risk Ratio (M‐H, Random, 95% CI) | 0.83 [0.66, 1.05] |
| 1.2.1 Less than 20% | 1 | 878 | Risk Ratio (M‐H, Random, 95% CI) | 1.06 [0.66, 1.72] |
| 1.2.2 Between 20% and 39% | 3 | 999 | Risk Ratio (M‐H, Random, 95% CI) | 0.81 [0.52, 1.24] |
| 1.2.3 40% or higher | 2 | 323 | Risk Ratio (M‐H, Random, 95% CI) | 0.79 [0.49, 1.29] |
| 1.2.4 Mixed/unknown | 0 | 0 | Risk Ratio (M‐H, Random, 95% CI) | Not estimable |
| 1.3 Anaemia (subgroup: by type or iron compound) | 5 | 2200 | Risk Ratio (M‐H, Random, 95% CI) | 0.81 [0.62, 1.06] |
| 1.3.1 High relative bioavailability | 2 | 460 | Risk Ratio (M‐H, Random, 95% CI) | 0.64 [0.37, 1.12] |
| 1.3.2 Comparable relative bioavailability | 2 | 248 | Risk Ratio (M‐H, Random, 95% CI) | 0.66 [0.49, 0.90] |
| 1.3.3 Low relative bioavailability | 2 | 1492 | Risk Ratio (M‐H, Random, 95% CI) | 1.03 [0.82, 1.30] |
| 1.4 Anaemia (subgroup: by wheat flour available per capita) | 5 | 2200 | Risk Ratio (M‐H, Random, 95% CI) | 0.81 [0.61, 1.07] |
| 1.4.1 Less than 75 g/day | 1 | 123 | Risk Ratio (M‐H, Random, 95% CI) | 1.03 [0.67, 1.58] |
| 1.4.2 Between 75 and 149 g/day | 0 | 0 | Risk Ratio (M‐H, Random, 95% CI) | Not estimable |
| 1.4.3 Between 150 and 300 g/day | 0 | 0 | Risk Ratio (M‐H, Random, 95% CI) | Not estimable |
| 1.4.4 More than 300 g/day | 1 | 200 | Risk Ratio (M‐H, Random, 95% CI) | 0.63 [0.44, 0.89] |
| 1.4.5 Unknown/unreported | 3 | 1877 | Risk Ratio (M‐H, Random, 95% CI) | 0.83 [0.52, 1.32] |
| 1.5 Anaemia (subgroup: by malaria endemicity) | 5 | 2200 | Risk Ratio (M‐H, Random, 95% CI) | 0.81 [0.61, 1.07] |
| 1.5.1 Malaria setting | 0 | 0 | Risk Ratio (M‐H, Random, 95% CI) | Not estimable |
| 1.5.2 Non/unknown Malaria setting | 5 | 2200 | Risk Ratio (M‐H, Random, 95% CI) | 0.81 [0.61, 1.07] |
| 1.6 Anaemia (subgroup: by duration of intervention) | 5 | 2200 | Risk Ratio (M‐H, Random, 95% CI) | 0.81 [0.61, 1.07] |
| 1.6.1 Less than six months | 2 | 281 | Risk Ratio (M‐H, Random, 95% CI) | 0.65 [0.47, 0.91] |
| 1.6.2 Six months to one year | 2 | 502 | Risk Ratio (M‐H, Random, 95% CI) | 0.77 [0.43, 1.39] |
| 1.6.3 More than one year. | 1 | 1417 | Risk Ratio (M‐H, Random, 95% CI) | 1.01 [0.79, 1.29] |
| 1.7 Anaemia (subgroup: by flour extraction rate) | 5 | 2200 | Risk Ratio (M‐H, Random, 95% CI) | 0.81 [0.61, 1.07] |
| 1.7.1 Less than or equal to 80% | 1 | 200 | Risk Ratio (M‐H, Random, 95% CI) | 0.63 [0.44, 0.89] |
| 1.7.2 More than 80% | 2 | 1796 | Risk Ratio (M‐H, Random, 95% CI) | 0.78 [0.45, 1.36] |
| 1.7.3 Unknown/Unreported | 2 | 204 | Risk Ratio (M‐H, Random, 95% CI) | 1.05 [0.70, 1.58] |
| 1.8 Anaemia (subgroup: by amount of elemental iron added to flour) | 5 | 2200 | Risk Ratio (M‐H, Random, 95% CI) | 0.81 [0.62, 1.06] |
| 1.8.1 40 mg/kg or less | 3 | 329 | Risk Ratio (M‐H, Random, 95% CI) | 0.68 [0.51, 0.92] |
| 1.8.2 41‐60 mg/kg | 1 | 379 | Risk Ratio (M‐H, Random, 95% CI) | 0.57 [0.37, 0.89] |
| 1.8.3 More than 60 mg/kg | 2 | 1492 | Risk Ratio (M‐H, Random, 95% CI) | 1.03 [0.82, 1.30] |
| 1.8.4 Unreported/unknown | 0 | 0 | Risk Ratio (M‐H, Random, 95% CI) | Not estimable |
| 1.9 Iron deficiency (as defined by study authors, based on a biomarker of iron status) | 3 | 633 | Risk Ratio (M‐H, Random, 95% CI) | 0.43 [0.17, 1.07] |
| 1.10 Iron deficiency (subgroup: by prevalence of anaemia at baseline) | 3 | 633 | Risk Ratio (M‐H, Random, 95% CI) | 0.43 [0.17, 1.07] |
| 1.10.1 Less than 20% | 1 | 131 | Risk Ratio (M‐H, Random, 95% CI) | 0.92 [0.68, 1.26] |
| 1.10.2 Between 20% and 39% | 1 | 379 | Risk Ratio (M‐H, Random, 95% CI) | 0.33 [0.24, 0.44] |
| 1.10.3 40% or higher | 1 | 123 | Risk Ratio (M‐H, Random, 95% CI) | 0.20 [0.06, 0.64] |
| 1.10.4 Mixed/unknown | 0 | 0 | Risk Ratio (M‐H, Random, 95% CI) | Not estimable |
| 1.11 Iron deficiency (subgroup: by type of iron compound) | 3 | 633 | Risk Ratio (M‐H, Random, 95% CI) | 0.43 [0.17, 1.07] |
| 1.11.1 High relative bioavailability | 1 | 379 | Risk Ratio (M‐H, Random, 95% CI) | 0.33 [0.24, 0.44] |
| 1.11.2 Comparable relative bioavailability | 1 | 123 | Risk Ratio (M‐H, Random, 95% CI) | 0.20 [0.06, 0.64] |
| 1.11.3 Low relative bioavailability | 1 | 131 | Risk Ratio (M‐H, Random, 95% CI) | 0.92 [0.68, 1.26] |
| 1.12 Iron deficiency (subgroup: by wheat flour available per capita) | 3 | 633 | Risk Ratio (M‐H, Random, 95% CI) | 0.43 [0.17, 1.07] |
| 1.12.1 Less than 75 g/day | 1 | 123 | Risk Ratio (M‐H, Random, 95% CI) | 0.20 [0.06, 0.64] |
| 1.12.2 Between 75 and 149 g/day | 0 | 0 | Risk Ratio (M‐H, Random, 95% CI) | Not estimable |
| 1.12.3 Between 150 and 300 g/day | 1 | 131 | Risk Ratio (M‐H, Random, 95% CI) | 0.92 [0.68, 1.26] |
| 1.12.4 More than 300 g/day | 0 | 0 | Risk Ratio (M‐H, Random, 95% CI) | Not estimable |
| 1.12.5 Unknown/unreported | 1 | 379 | Risk Ratio (M‐H, Random, 95% CI) | 0.33 [0.24, 0.44] |
| 1.13 Iron deficiency (subgroup: by malaria endemicity) | 3 | 633 | Risk Ratio (M‐H, Random, 95% CI) | 0.43 [0.17, 1.07] |
| 1.13.1 Malaria setting | 0 | 0 | Risk Ratio (M‐H, Random, 95% CI) | Not estimable |
| 1.13.2 Non/unknown Malaria setting | 3 | 633 | Risk Ratio (M‐H, Random, 95% CI) | 0.43 [0.17, 1.07] |
| 1.14 Iron deficiency (subgroup: by duration of intervention) | 3 | 633 | Risk Ratio (M‐H, Random, 95% CI) | 0.43 [0.17, 1.07] |
| 1.14.1 Less than six months | 1 | 131 | Risk Ratio (M‐H, Random, 95% CI) | 0.92 [0.68, 1.26] |
| 1.14.2 Six months to one year | 2 | 502 | Risk Ratio (M‐H, Random, 95% CI) | 0.32 [0.24, 0.42] |
| 1.14.3 More than one year | 0 | 0 | Risk Ratio (M‐H, Random, 95% CI) | Not estimable |
| 1.15 Iron deficiency (subgroup: by flour extraction rate) | 3 | 633 | Risk Ratio (M‐H, Random, 95% CI) | 0.43 [0.17, 1.07] |
| 1.15.1 Less than or equal to 80% | 0 | 0 | Risk Ratio (M‐H, Random, 95% CI) | Not estimable |
| 1.15.2 More than 80% | 1 | 379 | Risk Ratio (M‐H, Random, 95% CI) | 0.33 [0.24, 0.44] |
| 1.15.3 Unknown/unreported | 2 | 254 | Risk Ratio (M‐H, Random, 95% CI) | 0.48 [0.10, 2.17] |
| 1.16 Iron deficiency (subgroup: by amount of elemental iron added to flour) | 3 | 633 | Risk Ratio (M‐H, Random, 95% CI) | 0.41 [0.17, 0.97] |
| 1.16.1 40 mg/kg or less | 1 | 46 | Risk Ratio (M‐H, Random, 95% CI) | 0.36 [0.07, 1.91] |
| 1.16.2 41‐60 mg/kg | 1 | 379 | Risk Ratio (M‐H, Random, 95% CI) | 0.33 [0.24, 0.44] |
| 1.16.3 More than 60 mg/kg | 2 | 208 | Risk Ratio (M‐H, Random, 95% CI) | 0.41 [0.06, 2.76] |
| 1.16.4 Unreported/unknown | 0 | 0 | Risk Ratio (M‐H, Random, 95% CI) | Not estimable |
| 1.17 Haemoglobin concentration (g/L) | 7 | 2355 | Mean Difference (IV, Random, 95% CI) | 3.30 [0.86, 5.74] |
| 1.18 Haemoglobin concentration (subgroup: by prevalence of anaemia at baseline (g/L)) | 7 | 2355 | Mean Difference (IV, Random, 95% CI) | 2.79 [0.62, 4.97] |
| 1.18.1 Less than 20% | 2 | 893 | Mean Difference (IV, Random, 95% CI) | 1.15 [‐3.93, 6.24] |
| 1.18.2 Between 20% and 39% | 3 | 960 | Mean Difference (IV, Random, 95% CI) | 2.95 [‐1.35, 7.25] |
| 1.18.3 40% or higher | 2 | 323 | Mean Difference (IV, Random, 95% CI) | 2.56 [0.89, 4.23] |
| 1.18.4 Mixed/unknown | 1 | 179 | Mean Difference (IV, Random, 95% CI) | 6.00 [2.46, 9.54] |
| 1.19 Haemoglobin concentration (subgroup: by type of iron compound (g/L)) | 7 | 2355 | Mean Difference (IV, Random, 95% CI) | 3.41 [1.02, 5.80] |
| 1.19.1 High relative bioavailability | 3 | 639 | Mean Difference (IV, Random, 95% CI) | 5.56 [3.71, 7.40] |
| 1.19.2 Comparable relative bioavailability | 2 | 248 | Mean Difference (IV, Random, 95% CI) | 3.02 [0.12, 5.92] |
| 1.19.3 Low relative bioavailability | 3 | 1468 | Mean Difference (IV, Random, 95% CI) | 1.39 [‐2.24, 5.02] |
| 1.20 Haemoglobin concentration (subgroup: by wheat flour available per capita (g/L)) | 7 | 2355 | Mean Difference (IV, Random, 95% CI) | 3.30 [0.86, 5.74] |
| 1.20.1 Less than 75 g/day | 1 | 123 | Mean Difference (IV, Random, 95% CI) | 3.77 [‐0.73, 8.27] |
| 1.20.2 Between 75 and 149 g/day | 0 | 0 | Mean Difference (IV, Random, 95% CI) | Not estimable |
| 1.20.3 Between 150 and 300 g/day | 1 | 124 | Mean Difference (IV, Random, 95% CI) | 4.00 [0.30, 7.70] |
| 1.20.4 More than 300 g/day | 1 | 200 | Mean Difference (IV, Random, 95% CI) | 2.37 [0.57, 4.17] |
| 1.20.5 Unknown/unreported | 4 | 1908 | Mean Difference (IV, Random, 95% CI) | 3.43 [‐0.92, 7.78] |
| 1.21 Haemoglobin concentration (subgroup: by malaria endemicity (g/L)) | 7 | 2355 | Mean Difference (IV, Random, 95% CI) | 3.30 [0.86, 5.74] |
| 1.21.1 Malaria setting | 0 | 0 | Mean Difference (IV, Random, 95% CI) | Not estimable |
| 1.21.2 Non/unknown Malaria setting | 7 | 2355 | Mean Difference (IV, Random, 95% CI) | 3.30 [0.86, 5.74] |
| 1.22 Haemoglobin concentration (subgroup: by duration of intervention (g/L)) | 7 | 2355 | Mean Difference (IV, Random, 95% CI) | 3.30 [0.87, 5.74] |
| 1.22.1 Less than six months | 3 | 405 | Mean Difference (IV, Random, 95% CI) | 2.73 [1.21, 4.25] |
| 1.22.2 Six months to one year | 3 | 681 | Mean Difference (IV, Random, 95% CI) | 5.63 [3.81, 7.46] |
| 1.22.3 More than one year | 1 | 1269 | Mean Difference (IV, Random, 95% CI) | ‐0.87 [‐2.17, 0.43] |
| 1.23 Haemoglobin concentration (subgroup: by flour extraction rate (g/L)) | 7 | 2355 | Mean Difference (IV, Random, 95% CI) | 3.30 [0.86, 5.74] |
| 1.23.1 Less than or equal to 80% | 1 | 200 | Mean Difference (IV, Random, 95% CI) | 2.37 [0.57, 4.17] |
| 1.23.2 More than 80% | 2 | 1648 | Mean Difference (IV, Random, 95% CI) | 2.49 [‐4.24, 9.22] |
| 1.23.3 Unknown/unreported | 4 | 507 | Mean Difference (IV, Random, 95% CI) | 4.42 [2.41, 6.44] |
| 1.24 Haemoglobin concentration (subgroup: by amount of elemental iron added to flour (g/L)) | 7 | 2355 | Mean Difference (IV, Random, 95% CI) | 3.41 [1.02, 5.80] |
| 1.24.1 40 mg/kg or less | 2 | 248 | Mean Difference (IV, Random, 95% CI) | 3.02 [0.12, 5.92] |
| 1.24.2 41‐60 mg/kg | 3 | 639 | Mean Difference (IV, Random, 95% CI) | 5.56 [3.71, 7.40] |
| 1.24.3 More than 60 mg/kg | 3 | 1468 | Mean Difference (IV, Random, 95% CI) | 1.39 [‐2.24, 5.02] |
| 1.24.4 Unreported/unknown | 0 | 0 | Mean Difference (IV, Random, 95% CI) | Not estimable |
| 1.25 Diarrhoea (three liquid stools in a single day) (only in children 2 to 11 years of age) | 0 | 0 | Risk Ratio (M‐H, Random, 95% CI) | Not estimable |
| 1.26 Respiratory infections (as measured by trialists) (only in children 2 to 11 years of age) | 0 | 0 | Risk Ratio (M‐H, Random, 95% CI) | Not estimable |
| 1.27 All‐cause death (only in children 2 to 11 years of age) | 0 | 0 | Risk Ratio (M‐H, Random, 95% CI) | Not estimable |
| 1.28 Infection or inflammation (CRP) (only in children 2 to 11 years of age) | 2 | 558 | Mean Difference (IV, Random, 95% CI) | 0.04 [‐0.02, 0.11] |
| 1.29 Height‐for‐age z‐score (in children) | 1 | 179 | Mean Difference (IV, Random, 95% CI) | 1.90 [‐2.42, 6.22] |
| 1.30 Cognitive development (in children) | 1 | 850 | Mean Difference (IV, Random, 95% CI) | 0.33 [‐0.29, 0.95] |
1.25. Analysis.

Comparison 1: Wheat flour fortified with iron alone versus unfortified wheat flour (no micronutrients added), Outcome 25: Diarrhoea (three liquid stools in a single day) (only in children 2 to 11 years of age)
1.26. Analysis.

Comparison 1: Wheat flour fortified with iron alone versus unfortified wheat flour (no micronutrients added), Outcome 26: Respiratory infections (as measured by trialists) (only in children 2 to 11 years of age)
1.27. Analysis.

Comparison 1: Wheat flour fortified with iron alone versus unfortified wheat flour (no micronutrients added), Outcome 27: All‐cause death (only in children 2 to 11 years of age)
Comparison 2. Wheat flour fortified with iron in combination with other micronutrients versus unfortified wheat flour (no micronutrients added).
| Outcome or subgroup title | No. of studies | No. of participants | Statistical method | Effect size |
|---|---|---|---|---|
| 2.1 Anaemia (defined as haemoglobin below WHO cut‐off for age and adjusted for altitude as appropriate) | 2 | 322 | Risk Ratio (M‐H, Random, 95% CI) | 0.95 [0.69, 1.31] |
| 2.2 Iron deficiency (as defined by study authors, based on a biomarker of iron status) | 3 | 387 | Risk Ratio (M‐H, Random, 95% CI) | 0.74 [0.54, 1.00] |
| 2.3 Iron deficiency (subgroup: by prevalence of anaemia at baseline) | 3 | 387 | Risk Ratio (M‐H, Random, 95% CI) | 0.74 [0.54, 1.00] |
| 2.3.1 Less than 20% | 1 | 118 | Risk Ratio (M‐H, Random, 95% CI) | 0.73 [0.51, 1.07] |
| 2.3.2 Between 20% and 39% | 1 | 143 | Risk Ratio (M‐H, Random, 95% CI) | 0.93 [0.47, 1.84] |
| 2.3.3 40% or higher | 1 | 126 | Risk Ratio (M‐H, Random, 95% CI) | 0.51 [0.22, 1.21] |
| 2.3.4 Mixed/unknown | 0 | 0 | Risk Ratio (M‐H, Random, 95% CI) | Not estimable |
| 2.4 Iron deficiency (subgroup: by type of iron compound) | 3 | 387 | Risk Ratio (M‐H, Random, 95% CI) | 0.74 [0.54, 1.00] |
| 2.4.1 High relative bioavailability | 0 | 0 | Risk Ratio (M‐H, Random, 95% CI) | Not estimable |
| 2.4.2 Comparable relative bioavailability | 1 | 48 | Risk Ratio (M‐H, Random, 95% CI) | 0.50 [0.14, 1.74] |
| 2.4.3 Low relative bioavailability | 3 | 339 | Risk Ratio (M‐H, Random, 95% CI) | 0.76 [0.55, 1.04] |
| 2.5 Iron deficiency (subgroup: by wheat flour available per capita) | 3 | 387 | Risk Ratio (M‐H, Random, 95% CI) | 0.74 [0.54, 1.00] |
| 2.5.1 Less than 75 g/day | 1 | 126 | Risk Ratio (M‐H, Random, 95% CI) | 0.51 [0.22, 1.21] |
| 2.5.2 Between 75 and 149 g/day | 0 | 0 | Risk Ratio (M‐H, Random, 95% CI) | Not estimable |
| 2.5.3 Between 150 and 300 g/day | 1 | 118 | Risk Ratio (M‐H, Random, 95% CI) | 0.73 [0.51, 1.07] |
| 2.5.4 More than 300 g/day | 0 | 0 | Risk Ratio (M‐H, Random, 95% CI) | Not estimable |
| 2.5.5 Unknown/unreported | 1 | 143 | Risk Ratio (M‐H, Random, 95% CI) | 0.93 [0.47, 1.84] |
| 2.6 Iron deficiency (subgroup: by malaria endemicity) | 3 | 387 | Risk Ratio (M‐H, Random, 95% CI) | 0.74 [0.54, 1.00] |
| 2.6.1 Malaria setting | 0 | 0 | Risk Ratio (M‐H, Random, 95% CI) | Not estimable |
| 2.6.2 Non/unknown Malaria setting | 3 | 387 | Risk Ratio (M‐H, Random, 95% CI) | 0.74 [0.54, 1.00] |
| 2.7 Iron deficiency (subgroup: by duration of intervention) | 3 | 387 | Risk Ratio (M‐H, Random, 95% CI) | 0.74 [0.54, 1.00] |
| 2.7.1 Less than six months | 1 | 118 | Risk Ratio (M‐H, Random, 95% CI) | 0.73 [0.51, 1.07] |
| 2.7.2 Six months to one year | 2 | 269 | Risk Ratio (M‐H, Random, 95% CI) | 0.73 [0.41, 1.30] |
| 2.7.3 More than one year | 0 | 0 | Risk Ratio (M‐H, Random, 95% CI) | Not estimable |
| 2.8 Iron deficiency (subgroup: by flour extraction rate) | 3 | 387 | Risk Ratio (M‐H, Random, 95% CI) | 0.74 [0.54, 1.00] |
| 2.8.1 Less than or equal to 80% | 0 | 0 | Risk Ratio (M‐H, Random, 95% CI) | Not estimable |
| 2.8.2 More than 80% | 0 | 0 | Risk Ratio (M‐H, Random, 95% CI) | Not estimable |
| 2.8.3 Unknown/unreported | 3 | 387 | Risk Ratio (M‐H, Random, 95% CI) | 0.74 [0.54, 1.00] |
| 2.9 Iron deficiency (subgroup: by amount of elemental iron added to flour) | 3 | 387 | Risk Ratio (M‐H, Random, 95% CI) | 0.73 [0.54, 1.00] |
| 2.9.1 40 mg/kg or less | 1 | 47 | Risk Ratio (M‐H, Random, 95% CI) | 0.62 [0.16, 2.45] |
| 2.9.2 41‐60 mg/kg | 0 | 0 | Risk Ratio (M‐H, Random, 95% CI) | Not estimable |
| 2.9.3 More than 60 mg/kg | 3 | 340 | Risk Ratio (M‐H, Random, 95% CI) | 0.74 [0.54, 1.01] |
| 2.9.4 Unreported/unknown | 0 | 0 | Risk Ratio (M‐H, Random, 95% CI) | Not estimable |
| 2.10 Haemoglobin concentration (g/L) | 3 | 384 | Mean Difference (IV, Random, 95% CI) | 3.29 [‐0.78, 7.36] |
| 2.11 Haemoglobin concentration (subgroup: by prevalence of anaemia at baseline(g/L)) | 3 | 384 | Mean Difference (IV, Random, 95% CI) | 3.29 [‐0.78, 7.36] |
| 2.11.1 less than 20% | 1 | 118 | Mean Difference (IV, Random, 95% CI) | 6.00 [2.38, 9.62] |
| 2.11.2 20% to 39% | 1 | 140 | Mean Difference (IV, Random, 95% CI) | 0.00 [‐2.54, 2.54] |
| 2.11.3 40% or higher | 1 | 126 | Mean Difference (IV, Random, 95% CI) | 4.54 [‐0.00, 9.08] |
| 2.11.4 mixed/unknown | 0 | 0 | Mean Difference (IV, Random, 95% CI) | Not estimable |
| 2.12 Haemoglobin concentration (subgroup: by type of iron compound (g/L)) | 3 | 384 | Mean Difference (IV, Random, 95% CI) | 3.27 [‐0.27, 6.80] |
| 2.12.1 High relative bioavailability | 0 | 0 | Mean Difference (IV, Random, 95% CI) | Not estimable |
| 2.12.2 Comparable relative bioavailability | 3 | 306 | Mean Difference (IV, Random, 95% CI) | 2.91 [‐1.35, 7.16] |
| 2.12.3 Low relative bioavailability | 1 | 78 | Mean Difference (IV, Random, 95% CI) | 5.15 [‐1.31, 11.61] |
| 2.13 Haemoglobin concentration (subgroup: by wheat flour available per capita (g/L)) | 3 | 384 | Mean Difference (IV, Random, 95% CI) | 3.29 [‐0.78, 7.36] |
| 2.13.1 Less than 75 g/day | 1 | 126 | Mean Difference (IV, Random, 95% CI) | 4.54 [‐0.00, 9.08] |
| 2.13.2 Between 75 and 149 g/day | 0 | 0 | Mean Difference (IV, Random, 95% CI) | Not estimable |
| 2.13.3 Between 150 and 300 g/day | 1 | 118 | Mean Difference (IV, Random, 95% CI) | 6.00 [2.38, 9.62] |
| 2.13.4 More than 300 g/day | 0 | 0 | Mean Difference (IV, Random, 95% CI) | Not estimable |
| 2.13.5 Unknown/unreported | 1 | 140 | Mean Difference (IV, Random, 95% CI) | 0.00 [‐2.54, 2.54] |
| 2.14 Haemoglobin concentration (subgroup: by malaria endemicity (g/L)) | 3 | 384 | Mean Difference (IV, Random, 95% CI) | 3.29 [‐0.78, 7.36] |
| 2.14.1 Malaria setting | 0 | 0 | Mean Difference (IV, Random, 95% CI) | Not estimable |
| 2.14.2 Non/unknown Malaria setting | 3 | 384 | Mean Difference (IV, Random, 95% CI) | 3.29 [‐0.78, 7.36] |
| 2.15 Haemoglobin concentration (subgroup: by duration of intervention (g/L)) | 3 | 384 | Mean Difference (IV, Random, 95% CI) | 3.29 [‐0.78, 7.36] |
| 2.15.1 less than six months | 1 | 118 | Mean Difference (IV, Random, 95% CI) | 6.00 [2.38, 9.62] |
| 2.15.2 six months to one year | 2 | 266 | Mean Difference (IV, Random, 95% CI) | 1.86 [‐2.51, 6.24] |
| 2.15.3 more than one year | 0 | 0 | Mean Difference (IV, Random, 95% CI) | Not estimable |
| 2.16 Haemoglobin concentration (subgroup: by flour extraction rate (g/L)) | 3 | 384 | Mean Difference (IV, Random, 95% CI) | 3.29 [‐0.78, 7.36] |
| 2.16.1 Less than or equal to 80% | 0 | 0 | Mean Difference (IV, Random, 95% CI) | Not estimable |
| 2.16.2 More than 80% | 0 | 0 | Mean Difference (IV, Random, 95% CI) | Not estimable |
| 2.16.3 Unknown/unreported | 3 | 384 | Mean Difference (IV, Random, 95% CI) | 3.29 [‐0.78, 7.36] |
| 2.17 Haemoglobin concentration (subgroup: by amount of elemental iron added to flour (g/L)) | 3 | 384 | Mean Difference (IV, Random, 95% CI) | 3.27 [‐0.27, 6.80] |
| 2.17.1 40 mg/kg or less | 1 | 48 | Mean Difference (IV, Random, 95% CI) | 3.28 [‐2.96, 9.52] |
| 2.17.2 41‐60 mg/kg | 0 | 0 | Mean Difference (IV, Random, 95% CI) | Not estimable |
| 2.17.3 more than 60 mg/kg | 3 | 336 | Mean Difference (IV, Random, 95% CI) | 3.37 [‐1.13, 7.86] |
| 2.17.4 unreported/unknown | 0 | 0 | Mean Difference (IV, Random, 95% CI) | Not estimable |
| 2.18 Diarrhoea (three liquid stools in a single day) (only in children 2 to 11 years of age) | 0 | 0 | Risk Ratio (M‐H, Random, 95% CI) | Not estimable |
| 2.19 Respiratory infections (as measured by trialists) (only in children 2 to 11 years of age) | 0 | 0 | Risk Ratio (M‐H, Random, 95% CI) | Not estimable |
| 2.20 All‐cause death (only in children 2 to 11 years of age) | 0 | 0 | Risk Ratio (M‐H, Random, 95% CI) | Not estimable |
| 2.21 Infection or inflammation at individual level (as measured by urinary neopterin, C‐reactive protein or alpha‐1‐acid glycoprotein variant A) | 0 | 0 | Risk Ratio (M‐H, Random, 95% CI) | Not estimable |
2.18. Analysis.

Comparison 2: Wheat flour fortified with iron in combination with other micronutrients versus unfortified wheat flour (no micronutrients added), Outcome 18: Diarrhoea (three liquid stools in a single day) (only in children 2 to 11 years of age)
2.19. Analysis.

Comparison 2: Wheat flour fortified with iron in combination with other micronutrients versus unfortified wheat flour (no micronutrients added), Outcome 19: Respiratory infections (as measured by trialists) (only in children 2 to 11 years of age)
2.20. Analysis.

Comparison 2: Wheat flour fortified with iron in combination with other micronutrients versus unfortified wheat flour (no micronutrients added), Outcome 20: All‐cause death (only in children 2 to 11 years of age)
2.21. Analysis.

Comparison 2: Wheat flour fortified with iron in combination with other micronutrients versus unfortified wheat flour (no micronutrients added), Outcome 21: Infection or inflammation at individual level (as measured by urinary neopterin, C‐reactive protein or alpha‐1‐acid glycoprotein variant A)
Comparison 3. Wheat flour fortified with iron in combination with other micronutrients versus fortified wheat flour with same micronutrients (but not iron).
3.1. Analysis.
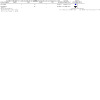
Comparison 3: Wheat flour fortified with iron in combination with other micronutrients versus fortified wheat flour with same micronutrients (but not iron), Outcome 1: Anaemia (defined as haemoglobin below WHO cut‐off for age and adjusted for altitude as appropriate)
3.2. Analysis.
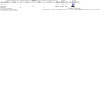
Comparison 3: Wheat flour fortified with iron in combination with other micronutrients versus fortified wheat flour with same micronutrients (but not iron), Outcome 2: Iron deficiency
3.4. Analysis.

Comparison 3: Wheat flour fortified with iron in combination with other micronutrients versus fortified wheat flour with same micronutrients (but not iron), Outcome 4: Diarrhoea (three liquid stools in a single day) (only in children 2 to 11 years of age)
3.5. Analysis.

Comparison 3: Wheat flour fortified with iron in combination with other micronutrients versus fortified wheat flour with same micronutrients (but not iron), Outcome 5: Respiratory infections (as measured by trialists) (only in children 2 to 11 years of age)
3.6. Analysis.

Comparison 3: Wheat flour fortified with iron in combination with other micronutrients versus fortified wheat flour with same micronutrients (but not iron), Outcome 6: All‐cause death (only in children 2 to 11 years of age)
3.7. Analysis.
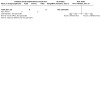
Comparison 3: Wheat flour fortified with iron in combination with other micronutrients versus fortified wheat flour with same micronutrients (but not iron), Outcome 7: Infection or inflammation at individual level (as measured by urinary neopterin, C‐reactive protein or alpha‐1‐acid glycoprotein variant A)
Characteristics of studies
Characteristics of included studies [ordered by study ID]
Amalrajan 2012.
| Study characteristics | ||
| Methods | Double‐blind individually‐randomised controlled trial investigating the effect of NaFeEDTA‐fortified wheat flour on iron status in iron‐depleted schoolchildren. | |
| Participants | A total of 179 iron‐depleted (serum ferritin less 20 µg/L and/or iron deficient soluble transferrin receptor > 7.6 mg/L) children 6 to 13 years of age, attending to school in urban region of Bangalore, India. | |
| Interventions | Participants were randomised into one of two groups: group 1 (n = 86) received a lunch meal (wheat flour‐based chapati, poori or dosa) made with NaFeEDTA‐fortified wheat flour at the level of 6 mg iron/100g; group 2 (n = 93) received identical but unfortified wheat‐flour based meal during 7 months. | |
| Outcomes | Haemoglobin, soluble transferrin receptor, serum ferritin, C‐reactive protein, zinc protoporphyrin and, urinary zinc. Adherence: not reported. |
|
| Notes |
Source of funding: Department of biotechnology, Ministry of Science and Technology, Government of India; AkzoNobel chemicals; St. John's National Academy of Health Sciences, Bangalore, India. Dates of the study and conflict of interest: Not reported by the trial authors. |
|
| Risk of bias | ||
| Bias | Authors' judgement | Support for judgement |
| Random sequence generation (selection bias) | Unclear risk | Method of random sequence generation was not specified. "After baseline screening, children aged 6 to 13 years were selected into the study based on their iron status as iron depleted (serum ferritin [SF] < 20 μg/L) and/or iron deficient (soluble transferrin receptor [sTfR] > 7.6 mg/L) and randomised into two groups" |
| Allocation concealment (selection bias) | Unclear risk | The allocation concealment was not specified. |
| Similarity of baseline outcome measurements (checking for confounding, a potential consequence of selection bias) | Low risk | All children included in the study were iron depleted. Quote "After baseline screening, children aged 6 to 13 years were selected into the study based on their iron status as iron depleted (serum ferritin [SF] < 20 µg/L) and/or iron deficient soluble transferrin receptor [sTfR] > 7.6 mg/L)" |
| Similarity of baseline characteristics (checking for confounding, a potential source of selection bias) | High risk | The trialists do not define baseline characteristics of participants. |
| Blinding of participants and personnel (performance bias) All outcomes | Unclear risk | The control group received an identical but unfortified meal. Authors report "Iron group that received a lunch meal made with NaFeEDTA‐fortified wheat flour (wheat flour‐based chapati, poori, or dosa),... and a control group that received an identical but unfortified meal". |
| Blinding of outcome assessment (detection bias) All outcomes | Low risk | The outcome analysis was carried out in the lab using specific methods. Quote "Hemoglobin was analysed on a hematology analyser (Beckman Coulter). Serum and plasma samples were separated by centrifugation at 3,500 rpm for 10 minutes, and aliquots were frozen at –80°C until analysis. SF was measured by electro chemiluminescence (Elecsys 2010, Roche Diagnostics) and sTfR by immuno turbidimetry (Hitachi‐902, Roche Diagnostics). C‐reactive protein was measured by immuno turbidimetry (Hitachi‐902, Roche Diagnostics) to rule out subclinical infections." |
| Incomplete outcome data (attrition bias) All outcomes | Low risk | No drop outs were reported in this trial. |
| Selective reporting (reporting bias) | Unclear risk | The protocol registry is not available. |
| Other bias | Low risk | No evidence of other risk of biases. |
| Recruitment bias | Unclear risk | Not applicable. We evaluated this domain in cluster‐randomised studies only. |
| Baseline imbalance | Unclear risk | Not applicable. We evaluated this domain in cluster‐randomised studies only. |
| Loss of clusters | Unclear risk | Not applicable. We evaluated this domain in cluster‐randomised studies only. |
| Incorrect analysis | Unclear risk | Not applicable. We evaluated this domain in cluster‐randomised studies only. |
| Comparability with individually Randomised Trials | Unclear risk | Not applicable. We evaluated this domain in cluster‐randomised studies only. |
Barbosa 2012 (C).
| Study characteristics | ||
| Methods | Double‐blind institutional cluster‐randomised controlled trial. | |
| Participants | A total of 173 children from 2 to 6 years of age with initial haemoglobin exceeding 90 g/L from four not for profit day cares in Sao Paulo ‐ Brazil. | |
| Interventions | Participants were randomly assigned to one of two groups: group 1 (n = 88) were given rolls with fortified wheat flour (4 mg iron/day); group 2 (n = 85) were provided with unfortified rolls. The period of the intervention was 24 weeks considering 5 days a week. The rolls weighted 20 g and were programmed for a 4 mg elemental iron content per unit (as microencapsulated iron sulphate). The micro capsules with iron sulphate micro‐particles were covered with sodium alginate using spray drying technique. | |
| Outcomes | Haemoglobin and prevalence of anaemia. Adherence: The individual consumption of rolls was properly registered on a card everyday by a member of the field team of each daycare centre. |
|
| Notes | We made adjustment for design effect in this cluster randomised trial to present the outcomes of anaemia and haemoglobin concentrations and estimated the effective sample size. This trial included two clusters each receiving fortified wheat and unfortified wheat bread. The total number of participants who provided complete outcome data was 173 (88 + 85), and therefore mean cluster size was 43.25. With ICC as 0.02723 for the cluster not‐for‐profit daycare, same as postal code cluster (in the absence of an specific not‐for‐profit daycare specific ICC) reported in other studies for outcome haemoglobin (Adams 2004; Gulliford 1999), the computed design effect was 2.15 for both anaemia and haemoglobin concentrations. For anaemia, in the intervention arm receiving iron fortified wheat rolls, sample size adjustment was made to 4 events (from n = 8) out of 41 participants (from n = 88) and in control arm with un fortified wheat rolls, numbers were adjusted to 3 events (from n = 7) out of 40 participants (from n = 85). However, for haemoglobin concentrations, only the total numbers in both intervention and control groups were adjusted as above without changing the mean and standard deviation, thus making total number of participants in fortified group as 41 and control group as 40. Regarding the acceptance, children under 36 months old ingested minor amounts in relation to older children, both in the fortified rolls and the unfortified rolls. Authors concluded that this food (prepared with wheat flour) as a fortification vehicle shows better results in older children.
Source of funding: Secretaria da Ciência, Tecnologia e Desenvolvimento Econômico do Estado de São Paulo. Dates of the study: 2007 (24 weeks duration). Conflict of interest: Trial authors have declared that there were no conflicts of interest. |
|
| Risk of bias | ||
| Bias | Authors' judgement | Support for judgement |
| Random sequence generation (selection bias) | Unclear risk | Cluster‐randomised by site "double‐blind randomisation by cluster (two nurseries were randomly assigned to receive enriched bread and two to receive non‐enriched bread)" |
| Allocation concealment (selection bias) | Low risk | This is a cluster‐randomised trial. Allocation concealment risk is low. Personnel and participants from knowing the allocation sequence before and until assignment. |
| Similarity of baseline outcome measurements (checking for confounding, a potential consequence of selection bias) | High risk | All children included in the study had haemoglobin concentrations over 9 g/dL. The baseline mean Haemoglobin concentration (g/dL) was similar across both the arms (EG ‐ 11.7 (SD: 1.0), CG ‐ 11.1 (SD:1.1)). However, the level of anaemia in the intervention group was 22% and in the control group 47% at the baseline. EG = Exposure Group, CG = Control Group. |
| Similarity of baseline characteristics (checking for confounding, a potential source of selection bias) | Low risk | Quote "The children from the day cares had similar baseline socioeconomic characteristics and EG and CG presented no statistical differences for the means of age, gender and iron content in diets." |
| Blinding of participants and personnel (performance bias) All outcomes | Low risk | Authors report "We emphasize that the destination of the fortified bread was unknown by all which could lead to undesirable individual initiatives encouraging a greater consumption". "The head of the department of nutrition and the preparation and delivery of bread participated in the randomisation of the subjects and had knowledge of the groups until the end of the study." |
| Blinding of outcome assessment (detection bias) All outcomes | Low risk | The outcome analysis was carried out in the lab using specific methods. Specifically, "The capillary blood samples were obtained by digital puncture of right hand's ring fingertip...A portable Hemocue photometer was used to measure haemoglobin." |
| Incomplete outcome data (attrition bias) All outcomes | High risk | Authors report, "The studied population was comprised of 324 children." However, only 53.4% of participants concluded the study. |
| Selective reporting (reporting bias) | Unclear risk | Not protocol or clinical trial register reported. It is unclear if the study reported all the outcome variables measured/intended to be measured. |
| Other bias | Low risk | Methods well described. No evidence of other risk of biases. |
| Recruitment bias | Low risk | Authors report "The studied population consisted of children aged 2 to 6 years who attended day cares from 7 a.m. to 5 p.m. during working days and received five meals per day" and then "The trial population was stratified so that the children of the two day cares receiving fortified rolls with ferrous sulphate microencapsulated with sodium alginate formed the Exposed Group (EG) and the children of the other two day cares receiving the rolls without fortified wheat flour formed the Control Group (CG). " |
| Baseline imbalance | High risk | Level of anaemia in the intervention arm was 10% and in control arm 25%; other characteristics were reported to be similar across both the arms (age, sex and socioeconomic status) |
| Loss of clusters | Low risk | No reported loss of clusters except for the exclusion of participants consuming <1 roll per day |
| Incorrect analysis | Unclear risk | There is no mention as to how clustering effect was taken care at the time of analysis. |
| Comparability with individually Randomised Trials | Low risk | The sample size calculated incorporated the clustering effect. Effrots were made to prevent lost to follow up or any cluster loss |
Biebinger 2009.
| Study characteristics | ||
| Methods | Double‐blind, RCT. | |
| Participants | 279 women, low body iron stores (serum ferritin less than 25 µg/L), aged 18‐35 year from two colleges in Kuwait: College for women, Kuwait University and the Nursing college public authority for applied education and training. | |
| Interventions | Participants were assigned to one of three groups randomly: group 1 (n = 93) received wheat‐based biscuits produced with wheat flour fortified with 20 mg elemental iron (as reduced iron) NutraFineTM RS) ; group 2 (n = 93) received biscuits fortified with 10 mg of elemental iron (as encapsulated ferrous sulphate) and 150 µg iodine; group 3 (n = 93) received unfortified biscuits. Biscuits were consumed five days per week for 22 weeks. | |
| Outcomes | Serum ferritin, iron stores, and iron deficiency. Adherence: consumption of fortified biscuits was not controlled, and authors report: "it may have been less than expected" |
|
| Notes | The FeSO4 treatment group exhibited increased serum ferritin by 88% compared to the control and body iron stores increased from ‐0.96 to 2.24 mg/kg. Reduced iron did not significantly increase serum ferritin or body iron stores. Urinary iodine concentrations increased from 140 to 213 µg/L.
Source of funding: Kuwaiti Flour Mills and Bakeries Company (Kuwait City, Kuwait). , the International Atomic Energy Agency (Vienna, Austria), ETH Zurich (Switzerland), The Medicore Foundation (Liechtenstein), Kuwait Institute for Scientific Research (Kuwait City, Kuwait). Dates of the study: December 2006 to May 2007. Conflict of interest: The authors reported that none of them had conflict of interest. |
|
| Risk of bias | ||
| Bias | Authors' judgement | Support for judgement |
| Random sequence generation (selection bias) | Unclear risk | Authors state, "Subjects meeting the inclusion criteria were randomly assigned to three groups receiving biscuits." Random sequence generation was not specified. |
| Allocation concealment (selection bias) | Unclear risk | Allocation concealment is not described. |
| Similarity of baseline outcome measurements (checking for confounding, a potential consequence of selection bias) | Low risk | Authors report " Subjects were invited to join the intervention trial if:(1) they had low Fe stores, defined as a SF concentration < 25 mg/L; (2) were not pregnant or planning pregnancy; (3) had no chronic medical illnesses; (4) did not use vitamin and mineral supplements." Also, baseline overall anaemia level was 15% in the study population. Baseline mean Haemoglobin concentrations (g/dl) were similar across the three arms: Control ‐ 128 g/dl (SD:11), Encapsulated FeSO4 arm ‐ 131 g/dl (SD: 10) and NutraFine arm ‐ 131 g/dl (SD:10). |
| Similarity of baseline characteristics (checking for confounding, a potential source of selection bias) | Low risk | Authors state that there were no significant differences between control and intervention groups with respect to haemoglobin, anthropometric measures, serum ferritin, or serum transferrin receptor. |
| Blinding of participants and personnel (performance bias) All outcomes | Low risk | Quote "in the flour storage trial, no significant difference in colour could be detected after 3 months at different temperatures and humidity conditions". "In the triangle testing in both Kuwait and Switzerland, the fortified biscuits were indistinguishable from the non‐fortified biscuits in colour, taste and texture". |
| Blinding of outcome assessment (detection bias) All outcomes | Low risk | Authors report "Blood samples were transported on ice to Al‐Sabah Hospital in Kuwait City." |
| Incomplete outcome data (attrition bias) All outcomes | High risk | A total of 65% of the screened subjects completed the Fe fortification efficacy study. Drop outs were due to time constraints, changing residence, Illness, pregnancy. |
| Selective reporting (reporting bias) | Unclear risk | Changes in Hb, SF, sTfR, body Fe stores, anthropometric reported, however no clinical trial registry available. |
| Other bias | Low risk | No evidence of other risk of biases. |
| Recruitment bias | Unclear risk | Not applicable. We evaluated this domain in cluster‐randomised studies only. |
| Baseline imbalance | Unclear risk | Not applicable. We evaluated this domain in cluster‐randomised studies only. |
| Loss of clusters | Unclear risk | Not applicable. We evaluated this domain in cluster‐randomised studies only. |
| Incorrect analysis | Unclear risk | Not applicable. We evaluated this domain in cluster‐randomised studies only. |
| Comparability with individually Randomised Trials | Unclear risk | Not applicable. We evaluated this domain in cluster‐randomised studies only. |
Cabalda 2009.
| Study characteristics | ||
| Methods | Double‐blind RCT. | |
| Participants | 250 anaemic 6 to 12 year old Filipino children in two elementary schools in Compostela, Cebu, Phillipines. | |
| Interventions | Participants were randomly assigned to one of four groups, consuming two 60 g pandesal per day for 8 months: group 1 (n = 86) consumed pandesal fortified with iron (hydrogen‐reduced iron at 80 mg/kg, or electrolytic iron at 80 mg/kg, or ferrous fumarate at 40 mg/kg); group 2 (n = 91) consumed iron and vitamin A (at 490 RE/100g) fortified pandesal; group 3 (n = 31) received vitamin A‐fortified pandesal; and group 4 (n = 30) consumed pandesal made from non‐fortified flour. Among this group of children, around 21% were currently taking vitamin/mineral supplements at the time of the study. All children were dewormed with an albendazole tablet (400 mg; Kopran Limited, Mumbai, India) at 4‐month intervals to rule out the possible effect of helminth infection on iron status. |
|
| Outcomes | Anaemia, iron deficiency, haemoglobin and zinc protoporphyrin concentrations. Adherence: The article indicates that field staff observed the feeding and recorded each child’s consumption per day. |
|
| Notes | In all participants anaemia decreased to 26%, but there was no effect of intervention on anaemia. Iron deficiency decreased from 58% to 12%. Mean Hb concentrations for all children increased by 13 g/L and mean zinc protoporphyrin concentrations decreased by 24.4 µmol/mol. Haemoglobin concentration was significantly higher in the iron and vitamin A group than the non fortified group.
Source of funding: Early Childhood Development Project of the Philippines government. Dates of the study: May 2003 to March 2004. Conflict of interest: Trial authors declared that there were no conflicts of interest. |
|
| Risk of bias | ||
| Bias | Authors' judgement | Support for judgement |
| Random sequence generation (selection bias) | Low risk | The project statistician generated a random number for each child. The children were grouped in groups of 33. |
| Allocation concealment (selection bias) | Low risk | Quote "A letter and colour code was assigned to each of the treatment groups. Participants were randomised to 1 of 8 groups after baseline data were collected. The project statistician generated a random number for each child. Numbers 1 – 33 were pre assigned to group A; 34 – 66 to B; 67–99 to C; 100–132 to D; 133 – 165 to E; 166 – 198 to F; 199 – 231 to G; and 232 – 264 to H." |
| Similarity of baseline outcome measurements (checking for confounding, a potential consequence of selection bias) | Unclear risk | Quote "there are no statistically significant differences between the groups. However, the % of participants that were iron deficient in the control group was 77, compared to 55% or 58% in some of the intervention groups." |
| Similarity of baseline characteristics (checking for confounding, a potential source of selection bias) | Low risk | Baseline characteristics are described in Table 3, there are no statistically significant differences between the groups. |
| Blinding of participants and personnel (performance bias) All outcomes | Low risk | "Field personnel and participants were not aware of treatment assignment for the duration of the study". "Every month, 62.5 kg of each type of fortified flour was prepared at the nutrition centre of the Philippines food plant in Taguig City... Pandesal was baked at the bakery in Magay Elementary school every day... approximately 66 pieces of each type of pandesal were prepared daily... each pandesal was packed in a plastic bag with the child's name and identification number". |
| Blinding of outcome assessment (detection bias) All outcomes | Low risk | "Venous blood specimens were collected by trained phlebotomists and Hb concentration was instantaneously measured using a B‐haemoglobin photometer and zinc protoporphyrin (ZnPP) concentration with a hematofluorometer machine". |
| Incomplete outcome data (attrition bias) All outcomes | Low risk | In total, 95.2% of patients completed the trial. From the original included study population, two children were found to be less than 6 years of age and ten children were lost to follow‐up due to transferred residence (n = 2), school drop out (n = 6), or refused participation (n = 2). |
| Selective reporting (reporting bias) | Unclear risk | Not protocol or register of clinical trial reported. |
| Other bias | Low risk | Well described methodology. No evidence of other risk of biases. |
| Recruitment bias | Unclear risk | Not applicable. We evaluated this domain in cluster‐randomised studies only. |
| Baseline imbalance | Unclear risk | Not applicable. We evaluated this domain in cluster‐randomised studies only. |
| Loss of clusters | Unclear risk | Not applicable. We evaluated this domain in cluster‐randomised studies only. |
| Incorrect analysis | Unclear risk | Not applicable. We evaluated this domain in cluster‐randomised studies only. |
| Comparability with individually Randomised Trials | Unclear risk | Not applicable. We evaluated this domain in cluster‐randomised studies only. |
Dad 2017.
| Study characteristics | ||
| Methods | 2‐arms RCT in district Buner in Khyber Pakhtunkhwa province of Pakistan. | |
| Participants | 200 adolescent girls selected randomly from different union councils of district Buner who were free of chronic infectious diseases and were not taking any medication or iron supplementation. | |
| Interventions | Participants were randomly divided into one of two groups: group 1 (n = 100) was fed with iron fortified wheat flour; group 2 (n = 100) was fed with non‐fortified wheat flour. For composite‐flour preparation, the flour was collected from one flour shop of the same flour mill, brand and with 75% extraction rate to maintain the same level of phytic acid concentration naturally found in wheat flour. One kg of the composite‐wheat flour based on 143 g small bags was given to each individual of the study group for 7 days. Similarly one kg of non‐fortified wheat flour based on 143 g small bags was provided to each individual of control group. Participants from both groups were instructed to consume one bag per day through preparing bread without sharing to other family members and was provided on weekly basis to both groups for 3 months to see the effect of iron fortified wheat flour consumption on the haemoglobin status of the adolescent girls. |
|
| Outcomes | Dietary intake, haemoglobin concentrations at baseline and anaemia at 1, 2 and 3 months. Adherence: Authors indicate that the participants were interviewed for dietary assessment and recorded 4 times from each study group on each month to know about the pattern of dietary intake of iron. | |
| Notes | The authors report that "there was no significant difference in the nutrient intake of the subjects participated in the study at 5% level of significance as determined by analysis of variance during the time frame of the study."
Source of funding: not reported. Dates of the study: not reported. Conflict of interest: not reported by the trial authors. |
|
| Risk of bias | ||
| Bias | Authors' judgement | Support for judgement |
| Random sequence generation (selection bias) | Low risk | Randomisation was based on computer generated random number table for randomly selection of study and control utilizing the Lady Health Workers (LHWs) of Department of Health (author communication, 2017) |
| Allocation concealment (selection bias) | High risk | The Lady Health Workers (LHWs) of Department of Health served as a researchers, The LHWs usually have their catchment area (approximately having 700‐800 population) which she usually visits their houses on monthly basis), each LHW/researcher were well aware about her assigned group. The list of LHWs were well maintained according to the study and control adolescent individuals’ involved (author communication, 2017). |
| Similarity of baseline outcome measurements (checking for confounding, a potential consequence of selection bias) | Low risk | Baseline values of haemoglobin concentrations and prevalence of anaemia were similar among the two groups as reported by the Authors. Quote "Table 4 shows mean values of haemoglobin at 0 month (baseline) which was 11.878 ±0.46 and 11.754 ± 0.61........" |
| Similarity of baseline characteristics (checking for confounding, a potential source of selection bias) | Low risk | There was no significant difference in the nutrient intake of the subjects participated in the study. Both groups were of similar age, weight, height and body mass index. |
| Blinding of participants and personnel (performance bias) All outcomes | High risk | Each and every individual involved in the trails were well aware about the objectives and processes involved. The assignment of study and controls were based on coding for each LHW name and Union Counsel she belong to, (i.e. Shahzia‐Gagra‐S, Shahzia is the name of LHW, Gagra is the name of Union Council and S is used for Study, similarly were the case of control) (author communication, 2017). |
| Blinding of outcome assessment (detection bias) All outcomes | High risk | Each and every individual involved in the trial were well aware about the objectives and processes involved. The assignment of study and controls were based on coding for each LHW name and Union Counsel she belong to, (i.e. Shahzia‐Gagra‐S, Shahzia is the name of LHW, Gagra is the name of Union Council and S is used for Study, similarly were the case of control) (author communication, 2017). |
| Incomplete outcome data (attrition bias) All outcomes | Low risk | No losses to follow up are reported. |
| Selective reporting (reporting bias) | Unclear risk | No protocol or register of clinical trial reported. |
| Other bias | High risk | The study guidelines and protocols was evidence and reference based, no prior registration took place but consent form were signed from each individual explaining the purpose and objective of the study and with full participation (author communication, 2017). |
| Recruitment bias | Unclear risk | Not applicable. We evaluated this domain in cluster‐randomised studies only. |
| Baseline imbalance | Unclear risk | Not applicable. We evaluated this domain in cluster‐randomised studies only. |
| Loss of clusters | Unclear risk | Not applicable. We evaluated this domain in cluster‐randomised studies only. |
| Incorrect analysis | Unclear risk | Not applicable. We evaluated this domain in cluster‐randomised studies only. |
| Comparability with individually Randomised Trials | Unclear risk | Not applicable. We evaluated this domain in cluster‐randomised studies only. |
Muthayya 2012.
| Study characteristics | ||
| Methods | School‐based RCT which was double‐blinded, carried out among iron‐depleted children. | |
| Participants | School children in 2 locations in India: an urban primary school in Bangalore city, Karnataka state, and 2 primary schools in rural Vadu in Maharashtra state and they were fed wheat‐flour chapatis for 7 months. | |
| Interventions | The intervention group (n = 200) consumed chapatis made with wheat flour fortified with 60 mg/kg NaFeEDTA, the control group (n = 201) consumed chapatis prepared using unfortified flour. | |
| Outcomes | Anaemia, iron deficiency, haemoglobin, sTfR, serum ferritin, anthropometric measures, cognitive development (short‐term memory and retrieval ability, cognitive speed, and fluid reasoning). Authors state "The cognitive measures consisted of a series of neuropsychological tests applicable for use in school‐aged children related to specific cognitive domains (shortterm memory and retrieval ability, cognitive speed, and fluid reasoning) consistent with the Carroll model. The cognitive battery included 3 core tests from the Kaufman Assessment Battery for Children and additional tests that underwent an extensive adaptation process to ensure their applicability in the local cultural context. The specific tests used were Atlantis (learning ability/long‐term storage and retrieval scale), KOHS Block Design (visuo‐spatial ability), Word Order (sequential processing/short‐term memory scale), Pattern Reasoning (planning/ fluid reasoning scale), Verbal Fluency (broad retrieval ability), and Coding‐WISC‐III (cognitive speed). The tests were adapted for use in 7‐ to 15‐y‐old Kannada‐speaking children of low socioeconomic status in Bangalore, India through an iterative process of translating, piloting, and modifying. These cognitive measures were previously shown to be sensitive to the effects of nutritional interventions and were administered by trained masters‐level psychologists in the local Kannada language." Adherence: "The research staff ensured that the study children consumed their standard meals (3 chapathis and vegetable/lentil accompaniments) under their direct supervision. The staff at both the study sites were given adequate training on the measurement of leftovers on a visual scale to ensure standardization." |
|
| Notes | After 7 months, the prevalence of anaemia in the intervention group decreased from 20.5% to 14.1 % (P < 0.05), but did not change in the control group. Similary the prevalence of iron deficiency decreased in the treatment group from 62.5% to 20.5% (P < 0.001) without a change in the control group. Iron‐deficiency anaemia in the intervention group significantly decreased from 17.7% to 8.6% (P < 0.001). There was a time x treatment interaction for Hb, serum ferritin, transferrin receptor, zinc protoporphyrin, and BIS (all P < 0.0001). There were no significant differences in cognitive performance tests between the groups. Authors report that "Compliance was estimated based on the mean consumption of the cooked meal per day per child throughout the study period. The mean compliance with the intervention in the Bangalore and Vadu sites was estimated to be 85 and 78%, respectively. While compliance in the treatment and control groups at the Bangalore site was 84.3 and 85.7% respectively, the figures for Vadu were 78.7 and 76.5%, respectively. The level of compliance between the intervention groups was comparable throughout the study period."
Source of funding: Department of Biotechnology, Ministry of Science and Technology, Government of India; AkzoNobel, India; St. John's National Academy of Health Sciences, Bangalore, India. Dates of the study: July 2007‐May 2008. Conflict of interest: the trial authors have declared that there were no conflicts of interest. |
|
| Risk of bias | ||
| Bias | Authors' judgement | Support for judgement |
| Random sequence generation (selection bias) | Low risk | Quote "Randomisation was performed by means of a computer‐generated list in blocks of 8. the enrolled children." |
| Allocation concealment (selection bias) | Low risk | Quote "The enrolled children who were ranged in descending order by grade at school and age in years were assigned intervention codes in sequence." |
| Similarity of baseline outcome measurements (checking for confounding, a potential consequence of selection bias) | Low risk | No significant differences in baseline outcome characteristics between the groups. Also Authors report " Children were eligible for inclusion into the study if they were: 1) apparently healthy, without any chronic illness and physical/mental handicaps; 2) not severely anaemic (Hb <80 g/L); 3) Fe depleted (SF <20 mg/L or TfR >7.6 mg/L and ZnPP concentration >40 mmol/mol heme); 4) not intending to use micronutrient supplements during the study; and 5) planning to reside in the study area during the next 12 mo." |
| Similarity of baseline characteristics (checking for confounding, a potential source of selection bias) | Low risk | No significant differences in baseline characteristics. |
| Blinding of participants and personnel (performance bias) All outcomes | Low risk | "The study investigators, assessors of cognitive tests, and study children were all unaware of the group assignments until the study was completed, all data were entered, and the analyses were performed." |
| Blinding of outcome assessment (detection bias) All outcomes | Low risk | Blood samples were analysed at the Core Biochemistry Laboratory Facility at St. John's research institute. "The study investigators, assessors of cognitive tests, and study children were all unaware of the group assignments until the study was completed, all data were entered, and the analyses were performed." |
| Incomplete outcome data (attrition bias) All outcomes | Low risk | Of the 401 children, 379 completed the study. For those that completed the study, very few missing data point (table 3), less than 1% missing. Very small dropout rate (about 5%). |
| Selective reporting (reporting bias) | Low risk | All outcomes that study was designed to measure were reported. |
| Other bias | Low risk | No evidence of other risk of biases. |
| Recruitment bias | Unclear risk | Not applicable. We evaluated this domain in cluster‐randomised studies only. |
| Baseline imbalance | Unclear risk | Not applicable. We evaluated this domain in cluster‐randomised studies only. |
| Loss of clusters | Unclear risk | Not applicable. We evaluated this domain in cluster‐randomised studies only. |
| Incorrect analysis | Unclear risk | Not applicable. We evaluated this domain in cluster‐randomised studies only. |
| Comparability with individually Randomised Trials | Unclear risk | Not applicable. We evaluated this domain in cluster‐randomised studies only. |
Nestel 2004 (C).
| Study characteristics | ||
| Methods | Cluster RCT, randomised by tea estates in Sri Lanka. | |
| Participants | There were 3229 total participants: preschool‐age children (9 ‐ 71 months of age); school‐age children (6‐11 years of age); adult, non‐pregnant women. | |
| Interventions | Participants were randomly assigned to one of 3 groups within the six estates; group 1 received wheat flour fortified with electrolytic iron (n = 1011); group 2 received wheat flour fortified with reduced iron (n = 1103); group 3 received unfortified flour (n = 1114). Each of the intervention arm was further divided depending on the age characteristics as pre‐school, primary school and adult non‐pregnant women. | |
| Outcomes | Anaemia and haemoglobin concentrations. Adherence: dietary assessment were collected every six months using a 24h recall. | |
| Notes | In this cluster‐randomised trial, we made adjustment towards design effect while presenting the outcomes anaemia and haemoglobin concentration by estimating the effective sample size. The randomisation was done at the level of tea estates, however there is no mention of the average population size of these tea estates. Further authors also report the identification of study population in the eligible age groups at the household level. Hence for calculation purposes, average household size of 3 was taken as the mean cluster size. The trial did not report any ICC and hence its value was considered as 0.02723, from ICC for postal code reported in other studies for outcome haemoglobin (Adams 2004; Gulliford 1999) and we computed a design effect of 1.054. Using this, we calculated effective sample size after combining individual arms of electrolytic and reduced iron interventions across pre‐school children, primary school children and adult women of reproductive age groups, as pair wise intervention and control arms. To report the outcome of anaemia, we calculated the effective sample size as 155 with anaemia (from n=163) out of 920 participants (from n=970) in the intervention arm and 83 with anaemia (from n=88) out of 497 (from n=524) participants in the control arm. While reporting the level of anaemia based on the baseline prevalence of anaemia in the study population, it was revised as 45 out of 569 participants in the intervention arm and 23 out of 309 participants in the group with baseline anaemia prevalence <20%. For the group with baseline anaemia prevalence of 20‐39%, the effective sample size was calculated as 110 with anaemia out of 351 participants in the intervention arm and 61 out of 188 in the control arm. However, for haemoglobin concentrations, only the total numbers in both intervention and control groups were adjusted as above without changing the mean and standard deviation, thus making total number of participants in fortified rice group as 152 and control group as 146. Authors report that "Over 90% of the preschool children ate flour‐containing foods: 96%, 93% and 85% in the control, electrolytic and reduced iron flour groups, respectively. These children ate the equivalent of 118.6 ±91.5 g flour/day and those in the electrolytic iron flour group ate significantly more flour‐containing foods than those in the other two groups." "For primary‐school children, under 95% of the, ate flour‐containing foods: 96%, 93% and 93% in the control;. Electrolytic and reduce iron flour groups respectively. These children ate the equivalent to 150.5 ± 100.4 g flour/day." "Over 90% of the women ate flour‐containing foods: 96%, 93% and 89% in the control, electrolytic and reduced‐iron flour groups, respectively. These women ate the equivalent to 189.5 ±158 g flour/day."
Source of funding: USAID Opportunities for Micronutrient Interventions (OMNI) project and the International Life Sciences Insitute (ILSI)‐managed Micronutrient Global Leadership (MGL) project. Dates of the study: January 1998 to December 1999. Conflict of interest: trial authors have not reported the conflict of interest. |
|
| Risk of bias | ||
| Bias | Authors' judgement | Support for judgement |
| Random sequence generation (selection bias) | Unclear risk | The technique of random sequence generation is not specified except for the mention of random assignment. Quote: "Random assignment of the estates." |
| Allocation concealment (selection bias) | Low risk | Quote: "The mill assigned the flour code and kept it confidential" cluster randomised by estate, six estates not necessarily adjacent to one another, variation between distances of estates to nearest towns." |
| Similarity of baseline outcome measurements (checking for confounding, a potential consequence of selection bias) | High risk | There were significant differences across the arms in baseline haemoglobin concentrations among primary school children, anaemia among groups of women as reported by the authors; which may have affected haemoglobin outcomes. |
| Similarity of baseline characteristics (checking for confounding, a potential source of selection bias) | High risk | There were significant differences in various baseline characteristics including mean age in the group of women, baseline body weight and weight for age, height for age z‐scores among primary school children. |
| Blinding of participants and personnel (performance bias) All outcomes | Low risk | Quote "The three trial flours were identifiable by a clearly visible number (1, 2 or 3) on the jute bag. The mill manager assigned the flour code and kept it confidential. The only other person who know the flour code was the scientist who conducted the iron assays and sent the results directly to the mill". |
| Blinding of outcome assessment (detection bias) All outcomes | Low risk | Blood sample analysis was carried out. |
| Incomplete outcome data (attrition bias) All outcomes | High risk | More than 50% dropout over 2 years. |
| Selective reporting (reporting bias) | Unclear risk | All outcomes described in methods were reported, however no clinical trial registry identified. |
| Other bias | Low risk | No evidence of other risk of biases. |
| Recruitment bias | Low risk | Initial survey was carried out to identify the study participants in three age groups followed by assignment of "tea estates" as clusters into three arms |
| Baseline imbalance | High risk | The clusters varied in terms of geographical location, access to health care and utilization of health services. There is no information as to which intervention these types of clusters belonged to; however the Authors report similarity of other social and demographic characteristics |
| Loss of clusters | Unclear risk | Auhors report loss of follow up of individual participants from each of the clusters, but the clusters per say were retained. |
| Incorrect analysis | Unclear risk | Analysis explained in detail incorporating the multivariate models, but no details about clustering effect taken into consideration |
| Comparability with individually Randomised Trials | Unclear risk | The three groups of clusters and three separate age group of study population along with the loss to follow up do not reflect the comparability with an individually randomised trial. |
Rahman 2015 (C).
| Study characteristics | ||
| Methods | This double‐blind cluster RCT where "bari" (with 5 to 6 adjoining households having a population of about 30–35 relatives) was taken as a cluster was carried out in a rural community of Bangladesh. | |
| Participants | Total of 43 baris were randomly assigned to either intervention or control group, wherein 352 children were enrolled in the trial, 203 in the intervention group and 149 in the control group. Finally 191 in the intervention group and 143 in the control group were included in the analysis.The study was carried out among school going children aged 6 years and above. | |
| Interventions | The intervention group received chapati made of wheat flour fortified with added micronutrients, while the control group received chapati made of wheat flour without added micronutrients for 6 months. | |
| Outcomes | Vitamin A, haemoglobin and iron status. The trial measured that micronutrient‐fortified wheat‐flour chapati significantly increased serum retinol concentration at 6 months by 0.12 mmol/L. Adherence: "The pre‐test revealed high compliance [97.6% (n = 43)] of chapatti consumption by the participating children." |
|
| Notes | Considering the total number of children in the eligible age group in all the included 43 baris as 352 (191 + 143 + 12 + 6), giving the mean cluster size of 8. For Rahman 2015 (C), the ICC for anaemia reported was 0.1 and a design effect of 1.7 was calculated. The effective sample size was calculated using this design effect as 29 with anaemia (from n=50) out of 112 (from n = 191) in the intervention arm and 21 (from n = 36) out of 84 participants (from n = 143). For reporting haemoglobin concentrations, we revised the total number of participants in both the intervention and control arms keeping the same mean and SD; while using ICC = 0.2 as reported by the trial authors. The total effective sample size in the intervention arm was revised to 80 (from n = 191) and in the control arm was revised to 60 (from n = 143) with the calculated design effect of 2.4. The ICC reported for iron deficiency was 0.19 using serum ferritin concentration (cut off SF 20mg L‐1) and using this ICC we calculated a design effect of 2.33 for iron deficiency. The effective sample size was adjusted to 15 children with iron deficiency (from n = 36) among 82 children in intervention arm (from n = 191) and 12 children with iron deficiency (from n = 27) out of 61 children in control arm (from n = 143). Authors report that "Considering the highest possible intake of 366 chapattis, equal or greater than 90% (329 chapattis) compliance were achieved by 89% and 93% of the children in fortified and control groups, respectively, and there were no statistical differences in the mean chapatti intake or compliance between the groups."
Source of funding: This study was funded by a grant from the MOST project (Contract No. HRN‐AA‐00–98‐00047‐00) and by support to the Mirsarai field area by US cooperation Agreement No. 388‐A‐00‐97‐00032‐00. Dates of the study: February 2002 to April 2002 (Recruitment to beginning of interventions, followed by 6 month follow up. Flour distribution commenced during the last week of March and the consumption of chapatti started during the first week of April 2002 Conflict of interest: The authors reported that no researcher in the study had conflicts of interest. |
|
| Risk of bias | ||
| Bias | Authors' judgement | Support for judgement |
| Random sequence generation (selection bias) | Low risk | Quote "assuming that 7–9 eligible children (6–15years) would be available from each bari and using a statistics book generated random number table, a total of 44 baris were randomly selected from the total listed baris for distribution of the flour" |
| Allocation concealment (selection bias) | Low risk | Authors report "A person not involved with the study assigned the baris to six different codes of flour (A, B, C, D, E and F) for distribution of the flour bags to the baris." |
| Similarity of baseline outcome measurements (checking for confounding, a potential consequence of selection bias) | High risk | The baseline outcome measurements across intervention and control groups were different 24.3% (intervention group) and 30.3% (control group). |
| Similarity of baseline characteristics (checking for confounding, a potential source of selection bias) | Low risk | The baseline characteristics were similar across the two groups with respect to age, nutritional status and gender. |
| Blinding of participants and personnel (performance bias) All outcomes | Low risk | Quote "A person not involved with the study assigned the baris to six different codes of flour (A, B, C, D, E and F) for distribution of the flour bags to the baris. During analysis of data, the principal investigator was informed that codes A, C and F were lumped into ‘group A’; and B, D and E into ‘group B’. It was only after completion of the analysis, the groups were unblinded." |
| Blinding of outcome assessment (detection bias) All outcomes | Low risk | The principal investigator was blinded to the intervention until the analysis stage |
| Incomplete outcome data (attrition bias) All outcomes | Low risk | Out of 203 children who were enrolled in to intervention group and 149 into control group, 334 children completed the study (191 in the intervention and 143 in the control group). |
| Selective reporting (reporting bias) | Low risk | The authors reported all the indicators in their results as per the reported plan. |
| Other bias | Low risk | No evidence of other risk of biases. |
| Recruitment bias | Low risk | Authors report "assuming that 7–9 eligible children (6–15 years) would be available from each bari and using a statistics book generated random number table, a total of 44 baris were randomly selected from the total listed baris for distribution of the flour. Among the 44 selected baris, 22 baris were randomly assigned to the intervention group and 22 baris to the control group (control)." |
| Baseline imbalance | Low risk | Authors report "there was no significant difference between groups with respect to age, sex, weight, height and the outcome variables (SR, SF, STfR,Hb, VAD, anaemia and iron deficiency based on SF), except for iron deficiency based on STfR and nutritional status (BAZ)." |
| Loss of clusters | Low risk | As per the Authors' report, during baseline data collection, one of the selected clusters (baris) withdrew their consent, and leaving a total of 43 baris in the study. |
| Incorrect analysis | Low risk | Authors report "As the assumption of independence among the subjects was violated due to clustering effect of the individuals nested within baris, multi‐level analyses were performed by incorporating the cluster (bari) as random effects in the mixed‐model analyses. All models were adjusted for child’s sex, age and baseline values." |
| Comparability with individually Randomised Trials | Low risk | During sample size calculation, conduct of the study and at analysis stage the clustering effect was taken into account, to make the study findings comparable to an individually randomised trial. |
van Stuijvenberg 2008.
| Study characteristics | ||
| Methods | RCT. | |
| Participants | Children attending a primary school aged 6 to 11 years serving a low socioeconomic community in the Western Cape, South Africa. | |
| Interventions | Participants were randomly assigned to one of 4 groups: group 1 (n = 90), the control group received brown bread with no fortification of iron; group 2 (n = 90) received brown bread fortified with NaFeEDTA; group 3 (n = 91) received brown bread fortified with ferrous fumarate; group 4 (n = 90) received brown bread fortified with electrolytic iron. Each child received 4 slices of bread (total of 140g) distributed over 2 meal periods per school day. The study duration was 34 weeks. All participants were de wormed four weeks prior to the baseline assessment. | |
| Outcomes | Anaemia, iron deficiency prevalence, CRP (inflammation), haemoglobin, serum ferritin, serum iron, transferrin saturation, serum transferrin receptor. Adherence: "Children ate the bread under supervision and the school teacher recorded compliance daily using colour‐coded record sheets". | |
| Notes | This study evaluated the efficacy of NaFeEDTA and ferrous fumarate as fortificants in brown bread at levels that are compatible with the food matrix, not inducing colour changes. These two compounds were not efficacious in improving haemoglobin or iron status in schoolchildren. This study showed that electrolytic iron, at the level currently used in the South African food fortification programme, also does not improve the Hb concentrations or iron status. Despite the high relative bioavailability of NaFeEDTA and ferrous fumarate, neither compound therefore appears to be suitable for use as a fortificant in brown bread baked under conditions commonly used in South Africa. Authors report that "Compliance, assessed as the amount of bread consumed as a percentage of the total amount provided during the study period, was 91.3%in the control group, 91.5%in the NaFeEDTA group, 89.6% in the ferrous fumarate group, and 88.4%, in the electrolytic iron group."
Source of funding: unclear. However, NaFeEDTA (Ferrazone) was supplied by Akzo Nobel Functional Chemicals and ferrous fumarate and electrolytic iron (particle size, 45 mm; 325 mesh) by DSM Nutritional Products SA. Dates of the study: March 2006 to October 2006. Conflict of interest: Trial authors have declared that there were no conflicts of interest. |
|
| Risk of bias | ||
| Bias | Authors' judgement | Support for judgement |
| Random sequence generation (selection bias) | Low risk | Quote "Children within each school grade (grades 1–6) were stratified by 3 Hb levels (116 g/L, 116–121 g/L, and 122–125 g/L) and then randomly assigned to 4 groups using a random list generated by a statistician". |
| Allocation concealment (selection bias) | Unclear risk | There is no description of any procedure followed for Allocation concealment except for the statement by the Authors "this process was performed away from the school by a member of the research team." |
| Similarity of baseline outcome measurements (checking for confounding, a potential consequence of selection bias) | Low risk | No significant differences in baseline outcome measurements among groups. Quote "those with Hb < 125 g/L (n = 362) were selected to take part in the study" |
| Similarity of baseline characteristics (checking for confounding, a potential source of selection bias) | Low risk | No significant differences in baseline characteristics among groups. "Baseline characteristics with regard to age, gender, anthropometric, and iron status were similar for the control and intervention groups" |
| Blinding of participants and personnel (performance bias) All outcomes | Low risk | "The 4 groups were linked to specific colour codes to ensure that teachers, field workers, and participants were unaware of the treatment assignment." |
| Blinding of outcome assessment (detection bias) All outcomes | Low risk | "All measurements were conducted without knowledge of the treatments and only the project leader was aware of group allocation". |
| Incomplete outcome data (attrition bias) All outcomes | Low risk | Dropout rate was lower than 5% in the study |
| Selective reporting (reporting bias) | Unclear risk | All iron indicators that they indicated to measure in the methods were reported, however not clinical trial registry identified. |
| Other bias | Low risk | No evidence of other risk of biases. |
| Recruitment bias | Unclear risk | Not applicable. We evaluated this domain in cluster‐randomised studies only. |
| Baseline imbalance | Unclear risk | Not applicable. We evaluated this domain in cluster‐randomised studies only. |
| Loss of clusters | Unclear risk | Not applicable. We evaluated this domain in cluster‐randomised studies only. |
| Incorrect analysis | Unclear risk | Not applicable. We evaluated this domain in cluster‐randomised studies only. |
| Comparability with individually Randomised Trials | Unclear risk | Not applicable. We evaluated this domain in cluster‐randomised studies only. |
Characteristics of excluded studies [ordered by study ID]
| Study | Reason for exclusion |
|---|---|
| Abreu 2009 | This dissertation is a subproject from "The impact of iron and folic acid fortification in wheat and corn flours in pregnant haemoglobin concentration attended in health public services" using secondary data collected through pregnant women individual medical chart at a prenatal attention programme in Sao Bernardo do Campo city at Sao Paulo State, Brazil. It assessed haemoglobin concentrations in two groups: group 1 (n = 384) women who attended prenatal services and gave birth before June 2004 and received no flour fortification; group 2 (n = 384) women with a date from the last menstrual period after June 2005 who received flour fortification. It was excluded due to simultaneous wheat and maize flours fortification with iron in Brazil. |
| Al 2016 | This was a retrospective analysis of a study carried out in Jordan from two repeated national cross‐sectional surveys among pre‐school age children to evaluate changes in the prevalence of anaemia after implementation of wheat flour fortification with multiple micronutrients. The two surveys were conducted in 2007 and 2009. But since this study did not report a control group, it was excluded. |
| Araujo 2013 | This before‐and‐after study was carried out in independent population samples in 366 pregnant women before mandatory fortification of flours and 419 pregnant women after mandatory fortification. It was excluded due to simultaneous fortification of wheat and maize flours in Brazil. |
| Assunçao 2007 | This time‐series study was carried out in Pelotas, southern Brazil, and consisted of three assessments with 12 month intervals. The first one in May 2004, before mandatory wheat and maize flour fortification in Brazil, including 453 pre‐school children in the before group, 923 after 12 months and 863 after 24 months. It was excluded due to simultaneous fortification of wheat and maize flour in Brazil. A similar study used population‐based surveys conducted in 2004 (baseline, before mandatory wheat and maize flour fortification in Brazil), 2005, 2006 and 2008, including children under 6 years of age residing in the urban area of the city of Pelotas, southern Brazil. It was excluded due to simultaneous fortification of wheat and maize flours in Brazil. |
| Biemi 2013 | This study was a before‐and‐after study without a control group. It was conducted at the paediatric unit of the university hospital of Treichville, one of the three main hospitals of Abidjan, the largest city of Ivory Coast. The medical records of 467 children from 5 to 14 years old were analysed. The period from 1 January 2004 to 31 December 2006 was considered as pre‐fortification period and the period from 1 January 2008 to 31 December 2010 was regarded as the post‐fortification period. Data for anaemia, haemoglobin, haematocrit, red blood cell count, and mean corpuscular volume were compared between pre‐ and post‐fortification periods. |
| Bokhari 2012 | This double‐blind, randomised trial included 34 Caucasian, primiparous antenatal patients during six weeks intervention with iron‐rich bread; however the flour used for the preparation of such bread was eragrostis and not wheat flour. |
| Bothwell 1978 | This study described potential risk of iron overload in individuals with idiopathic haemochromatosis and beta‐thalassaemia if iron fortification levels in flour were increased in the United States. It was excluded because it was not an intervention study. |
| Bouhouch 2016 | This 2 × 2 factorial, double‐blind, placebo‐controlled trial evaluated effects of iron and EDTA, alone and in combination, on blood lead concentration, iron status, and cognition of 457 lead‐exposed Moroccan children. This study was excluded because the fortification was not at flour stage. |
| Bromage 2018 | This study evaluated the effectiveness and safety of Industrial fortification of wheat flour alone and in combination with edible oil and milk in reducing the prevalence of multiple micronutrient intake deficiencies among healthy non‐pregnant adults in Mongolia (n=320). Here summer and winter bioavailable micronutrient intake and intake deficiency under different fortification guidelines were assessed. Since it was not an RCT and objectives of the study was to assess the micronutrient intake status of the participants, this study was excluded. |
| Brown 2011 | This article presents some results from a national survey: prevalence of vitamin A, iron deficiency and intakes of fortifiable foods in Cameroon to assess baseline biomarkers before applying a mass food‐fortification programme. |
| Chavez 1998 | This survey was carried out in the metropolitan zone of Caracas in 1994 and reported the average consumption of fortified corn and wheal flours in Venezuela. |
| Costa 2008 | This study was not an intervention trial and was excluded because it presented only the prevalence of anaemia in pre‐school children attending public day cares in Sao Paulo, Brazil and assessed whether the school menu provided enough iron considering the iron fortification program that included fortification of both maize and wheat flours. |
| Da Silva 2012 | This before‐and‐after study of 778 pregnant women attending prenatal care (n = 391) in the pre‐fortification group; (n = 387) in the post‐fortification group) was excluded because it assessed the effect of simultaneous iron fortification of wheat and maize flours in Brazil. In addition, this study lacked a control group. |
| De Souza 2011 | This before‐and‐after study in 854 pregnant women in Teresina, Brazil was excluded due to simultaneous iron fortification of wheat and maize flours in Brazil. In addition, this study lacked a control group. |
| de Vasconcelos 2014 | This study reported data from two health and nutrition surveys as time trends observed in anaemia prevalence and other associated factors among children 6‐23 and 24‐59 months of age in Pernambuco State, Brazil after fortification of wheat and maize flour with iron. This study was excluded because it provided only post‐fortification data and lacked a control group. |
| El Hamoduchi 2010 | This study evaluated the prevalence of iron‐deficiency anaemia after wheat flour fortification with elemental iron in Morocco. This study was performed as two separate post‐fortification surveys with target populations of women aged 15‐49 years and preschool aged (2 ‐ 5 years of age) children and involved a total of 2495 children and 3034 women. This study was excluded because it provided only post‐fortification data and lacked a control group. |
| Elwood 1971 | This study enrolled 304 women in "therapeutic trial," in which women were supplied either with bread containing "powdered iron" or bread containing ferric ammonium citrate. Therefore, this was excluded because both groups were fortified with iron. SImilarly, in the "prophylactic trial" presented in this study women were also provided with oral iron supplements, which is also an exclusion criteria for this review. |
| Engle‐Stone 2017 | This study included two representative surveys 2 years before and 1 year after the introduction of fortified wheat flour in Yaound´e and Douala, Cameroon. The study authors assessed Indicators of inflammation, malaria, anaemia, and micronutrient status (plasma ferritin, soluble transferrin receptor (sTfR), zinc, folate, and vitamin B‐12) among women in15 to 49 years age group and children between 12 and 59 months of age in a total of 300 households (10 households from the same 30 clusters). However, they did not report any control group in this repeat survey and hence it was excluded. |
| Fallahi 2003 | This is a before‐and‐after study without a control group, although it is described in the publication as a "double‐blind randomised controlled trial." A total of 30 subjects were surveyed, 15 received bread fortified with FeSO4 only and 15 subjects received bread fortified with FeSO4 + Na2EDTA, however data for 13 subjects in the first group and 12 in the second group completed the study. Therefore, 25 university female students judged iron deficient on haemoglobin concentration of less than 120 g/L and either low transferrin saturation (<16%) or serum ferritin (< 12ug/L). Subjects consumed one loaf bread (78g wheat flour) per day containing 10 mg of iron for 2 months. They were divided in two groups: group 1 (n=13) received fortified bread with 50 mg FeSO4; group 2 (n=12) received fortified bread with 50 mg FeSO4 + 33.5 mg Na2EDTA. The type of study design is outside the scope of this review. |
| Fujimori 2009 | This before and after study in pregnant women was excluded due to assessing the effect of simultaneous iron fortification of wheat and maize flours in Brazil. |
| Fujimori 2011 | A retrospective, repeated cross‐sectional study of health care centres of municipalities in the five Brazilian regions was conducted from 12,119 medical records of pregnant women distributed in two groups: before fortification (delivery prior to June 2004) and after fortification (date of last period after June 2005). Overall, the prevalence of anaemia fell from 25% to 20% after fortification (p<0.001), though some region‐specific differences were reported. This before and after study was excluded due to assessing the effect of simultaneous iron fortification of wheat and maize flours in Brazil and because it lacked a control group. |
| Giorgini 2001 | The study population was 89 preschool children of low socioeconomic status attending two day nurseries in Sao Paulo, Brazil. It evaluated the efficacy of sweet rolls fortified with iron bis‐glycinate chelate on iron status in preschool children. The intervention lasted for 6 months and the prevalence of iron deficiency anaemia dropped from 62% to 22%. The authors concluded that sweet rolls fortified with 2 mg of iron as bisglycinate chelate was highly effective for the control of iron deficiency and iron‐deficiency anaemia in young children. This before‐and‐after study was excluded because it lacked a control group. |
| Granado 2013 | This before‐and‐after study in children under 2 years of age carried out in western Brazilian Amazonia with 170 children in the pre‐fortification group and 224 children in the post‐fortification group. There were no statistically significant differences in the prevalence of anaemia or iron‐deficiency anaemia. Unexpectedly, the prevalence of iron deficiency increased post‐fortification. This study was excluded due to simultaneous iron fortification of wheat and maize flours in Brazil and because of the lack of a control group. |
| Grimm 2012 | This it is not an intervention study, it assessed the prevalence of iron deficiency in two comparison groups of women of childbearing age in Oman: 1) estimated consumption of fortified wheat flour above 1 kg monthly per capita, and 2) estimated consumption below 1kg monthly per capita. Consumption of iron‐fortified flower was associated with a lower prevalence of iron deficiency. This study did not report a control group and was excluded. |
| Hallberg 1989 | This study was excluded because it assessed only bioavailability and not the outcomes specified in this review. |
| Hassanvand 2015 | This descriptive study investigated the effectiveness of flour enrichment with iron on iron levels in several enriched flour samples in the Lorestan province of Iran. The content of iron was measured in flour samples as well as iron deficiency prevalence among women of reproductive age group. This study did not report a control group and there were no comparisons carried out. Hence it was excluded. |
| Heijblom 2007 | A cross‐sectional survey was conducted in a representative sample of 424 randomly selected first graders (ages 6 to 11 years) from public schools located in the Northern Public Health Region of Brasil. The results of this post‐fortification survey were compared to a survey conducted in a similar region and population pre‐fortification (1998). The prevalence of anaemia was not significantly different between these two surveys. This before and after study with school age children was excluded because of simultaneous fortification in Brazil for wheat and maize flours and because of lack of a control group. |
| Huang 2009 | Study on 409 anaemic students, 11‐18 years old with iron‐deficiency anaemia, divided into four groups, each "supplied" with a different type of fortified flour or control group ("basal flour"): group 1 (n = 109) was the control group (47 males, 62 females); group 2 (n = 96) received electrolytic iron (60 mg Fe/kg flour), 42 males, 54 females); group 3 (n=107) consumed flour fortified with FeSO4 (30 mg Fe/kg flour (44 males,63 females). Group 4 received flour fortified with NaFeEDTA (20mg Fe/kg flour, n=106). This study was excluded because it was not a randomised control trial despite being mentioned in the study design. There is no mention of process of randomisation anywhere in the full‐text article. |
| Hund 2013 | This study shows haemoglobin concentrations after three years of the implementation of a national flour fortification programme but does have a control group or a before intervention description, and was therefore excluded. |
| Huo 2011 (C) | Study carried out in Weichang county, Chende city, China among rural Chinese females from farming community, aged 20‐60. The intervention group received flour fortified with vitamin A, vitamin B1, vitamin B2, niacin, folic acid, zinc, and 20 mg/kg electrolytic iron. This intervention group consisted of 309 participants. The control group (n = 302) received non‐fortified flour. The intervention group showed a significant increase in haemoglobin levels between 24 months to 36 months intervention, and the prevalence of anaemia rate decreased from 15.1% at baseline to 10.8% at 36 m. Serum iron levels of the intervention group significantly increased at 36 months. The study was excluded because it did not specify whether it was randomised control trial. |
| Huo 2012 (C) | Study carried out among female farmers age 20‐60 from two suburbs of Lanzhou, China. The intervention group received flour fortified with multiple nutrients. The control group (n = 277) received non fortified flour. Haemoglobin levels of the intervention group were higher than the control group after 36 months, but anaemia prevalence of both the intervention and control groups was not affected by the intervention.The study was excluded because it did not specify whether it was randomised control trial. |
| Imhoff‐Kunsch 2019 | The study design is beyond the scope of this review. The study authors analysed data from 2012‐2013 Household Income and Expenditure Survey in Solomon Islands to quantify food purchases (as a proxy for food consumption) carried out among 4478 households. They estimated apparent nutrient Intakes through fortified rice and wheat flour along with the study of other food items being consumed together with the staple food items. |
| Kamien 1975 | Before and after study lacking a control group that assessed the nutritional status of 66 aborigines of all ages after a 6.5 month intervention with white bread fortified with iron and vitamins B1 and niacin in Bourke, New South Wales. The first investigations were conducted during August‐October, 1971 and in April 1972 and the follow up study in April 1974. The participants comprised 52 subjects of a previous study and 14 of the members of two families who had agreed to take part in an extensive dietary study. The outcomes measured were anaemia, haemoglobin, microcytic hypochromic blood fill and white cell count. |
| Kendrick 2015 | This was a longitudinal study carried out in Indonesia. The study subjects included 5,828 non‐pregnant women of child‐bearing age with haemoglobin measurements in 1997, 2000, and 2007, which were used in their analyses. This study was excluded because it did not report a control group. |
| Layrisse 1996 | This before‐and‐after study compared the post‐fortification prevalence of iron deficiency and anaemia in 307 children aged 7, 11, and 15 to a previously conducted pre‐fortification survey. The prevalence of both iron deficiency and anaemia were decreased post‐fortification. This study was excluded due to simultaneous fortification with iron of wheat and maize flours in Venezuela and because it lacked a control group. |
| Layrisse 2002 | This study summarized three surveys carried out on children ages aged 7, 11, and 15 in Caracas, Venezuela during the post‐fortification period (surveys were conducted in 1997, 1998, and 1999). The prevalence of iron deficiency and anaemia was compared to previous pre‐ and post‐fortification studies carried out in children of the same age and socioeconomic status. The authors determined that the prevalence of iron deficiency and anaemia initially declined immediately after fortification and that it remained lower several years post‐fortification. This study was excluded due to simultaneous fortification with iron of wheat and maize flours in Venezuela and because it lacked a control group. |
| Malpeli 2013 | This prospective,non experimental, cross‐sectional study evaluating pregnant women in the province of Buenos Aires, Argentina was excluded because it assessed biomarkers of nutritional status at baseline (n = 164) and 1 year after initiation (n = 108) of a food supplementation program. This study was excluded because the food supplementation program provided a supplementary diet consisting of wheat‐ and maize‐fortified flour, rice, sugar, and fortified soup. In addition, this study lacked a control group. |
| Martorell 2015 | This study is an evaluation of the impact of Costa Rica’s fortification programme on anaemia in women aged 15–45 y and children aged 1–7 y. Costa Rica has fortified several staple foods including salt with iodine since 1972, sugar with vitamin A during 1974 through 1981 and then reinitiated in 2003. Wheat and maize flour and rice are fortified with several water‐soluble vitamins, including folic acid but rice is not fortified with iron. Milk is also fortified with folic acid and vitamins A and D. This study was excluded because the fortification was not specific to wheat flour. |
| Milman 1999 | This study assessed iron status in a population survey in 1994 comprising 1332 Caucasian Danish men equally distributed in age cohorts of 40, 50, 60 and 70 years. This study was excluded because it did not consist of an intervention. |
| Modjadji 2007 | This prospective cohort study in women of childbearing age assessed biomarkers of nutritional status in 100 women (pre‐fortification) compared to 80 women (post‐fortification). Low haemoglobin levels were present in 7.5% of women before fortification, and 5% of women after fortification. The percentage of women with low ferritin levels was similar before and after fortification (25%). This study was excluded due to simultaneous fortification of wheat and maize flours with iron in South Africa and because it lacked a control group. |
| Mwangi 2015 | The study reported the effect of oral iron supplementation as a capsule on Malaria and other haematological parameters among 470 rural women aged 15 to 45 years with singleton pregnancies, gestational age of 13 to 23 weeks, and haemoglobin concentration of 90 g/L or greater living in Nyanza Province, Kenya. the women received daily supplementation with 60mg as ferrous fumarate (n = 237) or placebo (n = 233) from randomisation until 1 month postpartum. The primary outcome was maternal Plasmodium infection at birth. In this population administration of daily iron supplementation resulted in no significant differences in overall maternal Plasmodium infection risk and iron supplementation led to increased birth weight. |
| Natvig 1973 (C) | The interventions occurred as a large‐scale, community‐based trial in two separate villages. Females (n=417) ages 25 ‐ 40 from two villages in Western Norway were followed over 20 months. This was not a randomised control trial, hence it was excluded. |
| Osler 1999 | This was a prospective cohort study following 238 Danish men and women (aged 35 ‐ 65 years at baseline) that measured dietary intake and serum ferritin at baseline, both pre‐fortification and post‐fortification. This study was excluded due to simultaneous fortification of wheat and rye flour in Denmark and because it lacked a control group. |
| Papathakis 2012 | This before and after study assessed biomarkers of nutritional status pre‐ and post‐fortification with iron and other micronutrients (n=34 breast‐feeding women) in South Africa. There was no change in iron deficiency comparing rates before and after fortification. This study was excluded due to wheat and maize fortification with iron being established simultaneously in South Africa and because it lacked a control group. |
| Pouraram 2010 | This study was excluded because it only presents baseline data from a study designed to assess the effect of the flour fortification program on oxidative stress biomarkers and iron status among non‐anaemic 40 to 65‐year‐old adults from Damgan and Semnan provinces in Iran. |
| Pouraram 2012 | This study was excluded because it was a before and after study that did not contain a control group. Included male participants between 40 and 65 years of age. This was a 16 month study comparing wheat flour fortified with iron and other micronutrients. The outcomes measured were haemoglobin, serum ferritin, serum iron, sTfR, and oxidative stress biomarkers. After 16 months, serum iron levels had significantly increased from 102.9 ± 31.5 µg/dl (baseline) to 117.2 ± 29.8 µg/dl (p < 0.001). The mean total antioxidant capacity was significantly lower than that at baseline. The results of this study did not show any symptoms of iron overload after 8 and 16 months intervention with fortified flour. |
| Rohner 2013 | This is a national representative cross‐sectional survey conducted in Cote d'Ivoire in July/August 2007. The study focused on children aged 6‐59 months and non‐pregnant women aged 15‐49 years. The expected sample size was 960 pre‐school aged children and 960 non‐pregnant women. Anaemia prevalence was assessed. This study was excluded because it did not involve an intervention. |
| Sadighi 2009 | This was a before and after study conducted to evaluate the effectiveness of the flour fortification programme, using a cross‐sectional study. They measured blood haemoglobin and ferritin levels in Bushehr (n = 600) and Golestan (n = 652) provinces among women aged 15–49 years. Iron content was measured in samples of flour and bread to evaluate the flour. This study was excluded because it was a before and after intervention observational study without a control group. |
| Sato 2008 | This before‐and‐after study in pregnant woman was excluded due to simultaneous fortification of wheat and maize flour with iron in Brazil. |
| Sato 2015 | This study evaluated the prevalence of anaemia and haemoglobin levels in two independent cross‐sectional samples of pregnant women from Cuiaba‐MT, Brazil (2003 to 2006) before (n = 414) and after (n = 539) mandatory flour fortification with iron. There were no differences between the groups with respect to the prevalence of anaemia or haemoglobin levels. This study was excluded because it occurred in Brazil, where both wheat and maize flours were fortified with iron and because it lacked a control group. |
| Simmons 1994 | This study was excluded because it does not report data for anaemia prevalence nor does it include an intervention. |
| Sjoberg 2015 | The study reported a repeat survey among 15 to 16 year old school going children in 1994 and 2000 in Sweden, assessing food habits with diet history interviews and iron deficiency defined with serum ferritin stores. However the intervention was fortified sifted flour. Since this was a different intervention other than wheat flour fortification at the flour stage, it was excluded. |
| Stuetz 2012 | This study was excluded because it is a before and after without a control group. It consisted of two sequential cross‐sectional studies conducted in different groups of lactating mothers in a Maela refugee camp at 12 weeks postpartum. The first survey was before and the second 4 ‐ 5 months after micronutrient fortified flour had been provided to the camp (in addition to the regular food basket). Iron status and micronutrients were measured in serum, whole blood and breast milk samples. Iron and zinc deficiency were associated with anaemia, and their proportions were significantly lower after the introduction of micronutrient fortified flour. |
| Sun 2008 | This is a before‐and‐after survey describing nutritional status and dietary patterns among rural Chinese women, aged 20 to 60 years that was carried out in Weichang in Hebei province. This study was excluded because it was a before and after study that lacked a control group. |
| Tazhibayev 2008 | This is a before‐and‐after study that lacked a control group and hence was excluded. It was limited to 40 households and 120 individuals (80 children between 2 and 15 years of age and 40 women in reproductive age) in each country: Azerbaijan, Kazakhstan, Kyrgystan, Tajikistan, Uzbekistan and Mongolia. Fortification of wheat flour with iron and other micronutrients as well as salt with iodine resulted in significant increases in levels of blood haemoglobin, serum ferritin, serum folate, and urinary iodine. |
| Varea 2011 | This study was excluded because it presented the effect of a food program and not an intervention of wheat flour fortification in Argentina. |
| Varea 2012 | This article presents the effect of a food program and not an intervention of wheat flour fortification in Argentina. Hence this study was excluded. |
| Zavaleta 2004 | This sub sample of 250 infants, selected from a double‐blind longitudinal study assessing the effects of wheat flour fortified with iron plus zinc, vitamin A and/or folic acid on biomarkers of nutritional status was excluded because the population was limited to infants aged six months or less. |
| Zimmermann 2005 | This double‐blind randomised controlled trial was carried out among Thai women (non‐pregnant, aged 18‐50) working in factories. They were randomised into one of four groups, receiving wheat‐based sweetened‐butter cookies or sweetened white bread prepared with three different forms of iron (ferrous sulphate, electrolytic iron, hydrogen‐reduced iron) versus wheat‐based snacks prepared with unfortified wheat flour. The iron for a particular day’s dough was first dry‐mixed into sugar by hand in a small plastic bag. Since the fortification did not happen at the wheat flour stage, this study was excluded. |
| Zimmermann 2011 | This double blind randomised‐controlled trial with cross over design carried out among school and preschool children living in a lead‐exposed environment with high levels of iron deficiency measured the effects of iron fortification with and without NaEDTA on lead burden, iron status, and cognition. Because of the cross‐over design, this study was excluded. |
Characteristics of ongoing studies [ordered by study ID]
Arcot 2017.
| Study name | Efficacy of multi‐micronutrient fortified wheat‐based food on the nutrition status of primary school children aged 6‐12 years in Lae, Papua New Guinea |
| Methods | Generally healthy male and female children, from Lae in the Morobe Province of Papua New Guinea. |
| Participants | Aged 6 years to 12 years including both genders. Exclusion criteria will include severe anaemia (haemoglobin concentration less than 70 g/L), signs of xerophthalmia and evidence of serious chronic disease as observed by clinical nurses. |
| Interventions | This study will be assessing the efficacy of micronutrient fortified biscuits on improving the nutrition status of children aged between 6 and 12 years in schools within the city of Lae for two terms of the school year. Each child will receive wheat flour‐based biscuits. In the case of the 'Intervention Group', these biscuits will be fortified with food‐grade vitamins and minerals (thiamin mononitrate (vitamin B1), riboflavin (vitamin B2), nicotinamide (vitamin B3), folic acid (vitamin B9), cyanocobalamin (vitamin B12), retinyl palmitate (vitamin A), iron (ferrous fumarate), and zinc (zinc oxide)). Therefore, the dose of vitamins in each biscuit has been calculated to provide the equivalent intake as would be found in the daily consumption of 75g of fortified wheat flour. Each child will receive one biscuit per day of attendance throughout the study period except school and public holidays. Researchers and assistants will also be blinded to intervention product code identities throughout the trial from allocation to after statistical analysis. |
| Outcomes | Plasma B12 MMA, plasma ferritin, plasma retinol, plasma zinc. |
| Starting date | Two schools will be selected from urban Lae for the study, planned to commence at the end of January 2018 and conclude in June 2018. |
| Contact information | A/Prof Jayashree Arcot UNSW Australia School of Chemical Engineering Room 711, F10 Chemical Sciences Building Faculty of Engineering Sydney NSW 2052, Australia +61 2 9385 5360 j.arcot@unsw.edu.au |
| Notes | Source of funding ‐ Goodman Fielder |
Tetanye 2018.
| Study name | Efficacy of an iron fortified wheat flour for the correction and the prevention of iron deficiency anaemia in 18 to 59 months old children in Salapoumbe (East‐Cameroon) |
| Methods | Interventional study with simple randomisation done using coin ‐tossing |
| Participants | Inclusion criteria: ‐ Apparent good health, age ranging 18 to 59 months (both genders), haemoglobin rate ranging 7 to 11 g/dl Exclusion criteria: ‐ Current iron supplementation; Apparent signs of severe malnutrition; An observed chronic pathology (tuberculosis, AIDS, cycle cell disease?); Severe acute infection (serious malaria, pneumonia, meningitis?); Blood transfusion of less than 3 months; Allergy to the cow's milk and/or to the gluten |
| Interventions | iron fortification vs placebo |
| Outcomes | Haemoglobin rate, serum ferritin, serum iron, transferrin saturation, anaemia rate, iron deficiency rate,iron deficiency rate, height and weight. |
| Starting date | |
| Contact information | Jean Louis Essame Oyono Carrefour Emia Yaounde Cameroon +237 677 70 88 88 essame.oyono@gmail.com Emeritus professor of pathology/ general manager IMPM |
| Notes | Source of funding: Ministry of Health and Public Assistance, Nestle, Nutrition Institute of Africa. |
Differences between protocol and review
The review protocol was followed with the following exceptions:
We were not able to update the search up to 2019 in the following databases as we did not have access to these: BIOSIS (ISI; Previews to April 2018); Food Science and Technology Abstracts (FSTA) 1969 to present (16/04/2018); OpenGrey 1960 to present (16/04/2018); Trials Register of Promoting Health Interventions (TRoPHI) (16/04/2018). Thus the updated search to 2019 did not include updates in these databases.
Although the protocol states that children aged 2‐11.9 years‐old would be included, the Nestel 2004 (C) trial included two groups of children, aged 9‐71 months and 6‐10.9 years. Data from both groups of this study were included in the analysis.
We included clinicaltrials.gov in the databases searched.
We re‐organized the primary outcomes altogether, specifying that diarrhoea (three liquid stools in a single day), respiratory infections (as measured by trialists), all‐cause death, and Infection or inflammation at individual level (as measured by urinary neopterin, C‐reactive protein or alpha‐1‐acid glycoprotein variant A) would be included only in children 2 to 11 years of age.
In the protocol it was mentioned that we planned to handsearched the five journals with the highest number of included studies in the last 12 months to capture any article that may not have been indexed in the databases at the time of the search. However we decided not to go with this additional strategy as we thought it was sufficiently comprehensive as it was.
Observational studies and non‐RCTs were excluded from this review, due to the limited information these designs would provide for the objectives of this review.
Contributions of authors
Juan Pablo Peña‐Rosas, Martha Field and Diana Estevez screened all the references and extracted the data from included studies in the initial search. Martha Field and Diana Estevez wrote the initial description of the studies and the results section. Prasanna Mithra and Juan Pablo Pena‐Rosas did the screening and eligibility of the updated search. All authors provided input and contributed to drafting the final version of the review.
Disclaimer: Juan Pablo Peña‐Rosas is a full time staff member of the WHO. The authors alone are responsible for the views expressed in this publication and they do not necessarily represent the official position, decisions, policy or views of the World Health Organization.
Sources of support
Internal sources
-
Department of Nutrition and Food Safety, World Health Organization, Switzerland
Dr Juan Pablo Peña‐Rosas is full time staff member of the World Health Organization.
External sources
-
Department of Nutrition and Food Safety, World Health Organization, Switzerland
Dr Martha Field, Dr Prasanna Mithra and Dr Belinda Burford received partial financial support from the Department of Nutrition and Food Safety for this work. Diana Estevez received financial support for the first multidisciplinary training programme on global nutrition policy for sustainable development in 2015 designed by the Latin American Society of Nutrition (SLAN), World Health Organization (WHO), Pan American Health Organization (PAHO), the United Nations' World Food Programme (WFP) and Nutrition International.
-
Global Alliance for Improved Nutrition (GAIN), Switzerland
The World Health Organization gratefully acknowledges the financial contribution of GAIN towards systematic reviews of nutrition interventions.
-
The Bill & Melinda Gates Foundation, USA
The World Health Organization gratefully acknowledges the financial contribution of the BIll & Melinda Gates Foundation towards the commisisioning of systematic reviews of nutrition interventions.
-
Nutrition International, Canada
The World Health Organization gratefully acknowledges the financial contribution of Nutrition International towards the commisisioning of systematic reviews of nutrition interventions.
Declarations of interest
Martha Field ‐ received partial financial support from the Department of Nutrition and Food Safety for this work.
Juan Pablo Peña‐Rosas ‐ the WHO receives partial financial support from the Bill & Melinda Gates Foundation, Global Alliance for Improved Nutrition and Nutrition International to support its work in the area of nutrition, including the commissioning of systematic reviews of interventions for health throughout the life course.
Diana Estevez ‐ received a fellowship from the Department of Nutrition and Food Safety for this work. She was supported by the first multidisciplinary training programme on global nutrition policy for sustainable development in 2015 designed by the Latin American Society of Nutrition (SLAN), World Health Organization (WHO), Pan American Health Organization (PAHO), the United Nations' World Food Programme (WFP) and Nutrition International (formerly Micronutrient Initiative).
Prasanna Mithra ‐ received partial financial support from the Department of Nutrition and Food Safety for this work.
New
References
References to studies included in this review
Amalrajan 2012 {published data only}
- Amalrajan V, Thankachan P, Selvam S, Kurpad A. Effect of wheat flour fortified with sodium iron EDTA on urinary zinc excretion in school-aged children. Food and Nutrition Bulletin 2012;33(3):177-9. [DOI] [PubMed] [Google Scholar]
Barbosa 2012 (C) {published data only}
- Barbosa TN, Taddei JA, Palma D, Ancona-Lopez F, Braga JA. Double-blind randomised controlled trial of rolls fortified with microencapsulated iron [Estudo duplo-cego randomizado controlado com pães fortificados com ferro microencapsulado]. Revista da Associacao Medica Brasileira 2012;58(1):118-24. [PubMed] [Google Scholar]
Biebinger 2009 {published data only}
- Biebinger R, Zimmermann MB, Al-Hooti SN, Al-Hamed N, Al-Salem E, Zafar T, et al. Efficacy of wheat-based biscuits fortified with microcapsules containing ferrous sulfate and potassium iodate or a new hydrogen-reduced elemental iron: a randomised, double-blind, controlled trial in Kuwaiti women. British Journal of Nutrition 2009;102(9):1362-9. [DOI] [PubMed] [Google Scholar]
Cabalda 2009 {published data only}
- Cabalda AB, Tengco LW, Solon JAA, Sarol JN Jr, Rayco-Solon P, Solon FS. Efficacy of pandesal baked from wheat flour fortified with iron and vitamin A in improving the iron and anthropometric status of anemic schoolchildren in the Philippines. Journal of the American College of Nutrition 2009;28(5):591-600. [DOI] [PubMed] [Google Scholar]
- Cabalda AB, Tengco LW, Solon JAA, Sarol JN Jr, Rayco-Solon P, Solon FS. Wheat bread fortified with iron and vitamin A improved iron status of anemic schoolchildren. Annals of Nutrition and Metabolism 2009;55:239. [DOI] [PubMed] [Google Scholar]
Dad 2017 {published data only}
- Dad F, Khan S, Habib I, Shah BR, Sohail M. Effect of iron fortified wheat flour consumption on the hemoglobin status of adolescent girls in district Buner. American Journal of Food Science and Health 2017;3(1):1-6. [Google Scholar]
- Dad F. Regards and question on your study [personal communication]. Email to: JP Peña-Rosas 15 March 2017.
Muthayya 2012 {published data only}
- Muthayya S, Thankachan P, Hirve S, Amalrajan V, Thomas T, Lubree H, et al. Iron fortification of whole wheat flour reduces iron deficiency and iron deficiency anemia and increases body iron stores in Indian school-aged children. Journal of Nutrition 2012;142(11):1997-2003. [DOI] [PubMed] [Google Scholar]
Nestel 2004 (C) {published data only}
- Nestel P, Nalubola R, Sivakaneshan R, Wickramasinghe A R, Atukorala S, Wickramanayake T, et al. The use of iron-fortified wheat flour to reduce anemia among the estate population in Sri Lanka. International Journal for Vitamin and Nutrition Research 2004;74(1):35-51. [DOI] [PubMed] [Google Scholar]
Rahman 2015 (C) {published data only}
- Rahman AS, Ahmed T, Ahmed F, Alam MS, Wahed MA, Sack DA. Double-blind cluster randomised controlled trial of wheat flour chapatti fortified with micronutrients on the status of vitamin A and iron in school-aged children in rural Bangladesh. Maternal & Child Nutrition 2015;11(Suppl 4):120-31. [DOI] [PMC free article] [PubMed] [Google Scholar]
van Stuijvenberg 2008 {published data only}
- Stuijvenberg ME, Smuts CM, Lombard CJ, Dhansay MA. Fortifying brown bread with sodium iron EDTA, ferrous fumarate, or electrolytic iron does not affect iron status in South African schoolchildren. Journal of Nutrition 2008;138(4):782-6. [DOI] [PubMed] [Google Scholar]
References to studies excluded from this review
Abreu 2009 {published data only}
- Abreu LC. Impacto da fortificação das farinhas com ferro no controle da anemia em gestantes: estudo em um serviço público de saúde do município de São Bernardo do Campo. Dissertação (Mestrado em Nutrição em Saúde Pública). Sao Paulo: Faculdade de Saúde Pública, Universidade de São Paulo, 2009. [Google Scholar]
Al 2016 {published data only}
- Al Rifai R, Nakamura K, Seino K. Decline in the prevalence of anaemia among children of pre-school age after implementation of wheat flour fortification with multiple micronutrients in Jordan. Public Health Nutrition 2016;19(8):1486-97. [DOI] [PMC free article] [PubMed] [Google Scholar]
Araujo 2013 {published data only}
- Araújo CR, Uchimura TT, Fujimori E, Nishida FS, Veloso GB, Szarfarc SC. Hemoglobin levels and prevalence of anemia in pregnant women assisted in primary health care services, before and after fortification of flour. Revista Brasileira de Epidemiologia [Brazilian Journal of Epidemiology] 2013;16(2):535-45. [DOI] [PubMed] [Google Scholar]
Assunçao 2007 {published data only}
- Assunção MC, Santos IS, Barros AJ, Gigante DP, Victoria CG. Effect of iron fortification of flour on anemia in preschool children in Pelotas Brazil. Revista de Saude Publica 2007;41(4):539-48. [DOI] [PubMed] [Google Scholar]
- Assunção MC, Santos IS. Effect of food fortification with iron on childhood anemia: a review study [Efeito da fortificação de alimentos com ferro sobre anemia em crianças: um estudo de revisão]. Caderno de Saude Publica 2007;23(2):269-81. [DOI] [PubMed] [Google Scholar]
Biemi 2013 {published and unpublished data}
- Biemi FD. Effectiveness of mandated folic acid and iron fortification of wheat flour on anemia in children of Ivory Coast. Thesis. http://scholarworks.gsu.edu/nutrition_theses/44/ (accessed 4 October 2016). Vol. Nutrition Theses. Atlanta: Georgia State University, 2013. [Google Scholar]
Bokhari 2012 {published data only}
- Bokhari F, Derbyshire EJ, Hickling D, Li W, Brennan CS. A randomized trial investigating an iron-rich bread as a prophylaxis against iron deficiency in pregnancy. International Journal of Food Sciences and Nutrition 2012;63(4):461-7. [DOI] [PubMed] [Google Scholar]
Bothwell 1978 {published data only}
- Bothwell TH, Derman D, Bezwoda WR, Torrance JD, Charlton RW. Can iron fortification of flour cause damage to genetic susceptibles (idiopathic haemochromatosis and beta-thalassaemia major)? Human Genetics 1978;Supplement(1):131-7. [DOI] [PubMed] [Google Scholar]
Bouhouch 2016 {published data only}
- Bouhouch R R, El-Fadeli S, Andersson M, Aboussad A, Chabaa L, Zeder C, et al. Effects of wheat-flour biscuits fortified with iron and EDTA, alone and in combination, on blood lead concentration, iron status, and cognition in children: A double-blind randomized controlled trial. The American Journal of Clinical Nutrition 2016;104(5):1318-26. [DOI] [PubMed] [Google Scholar]
Bromage 2018 {published data only}
- Bromage S, Ganmaa D, Rich-Edwards JW, Rosner B, Bater J, Fawzi WW. Projected effectiveness of mandatory industrial fortification of wheat flour, milk, and edible oil with multiple micronutrients among Mongolian adults. PLOS One 2018;13(8)::e0201230. doi: 10.1371/journal.pone.0201230. eCollection 2018.. [DOI] [PMC free article] [PubMed] [Google Scholar]
Brown 2011 {published data only}
- Brown KH, Engle-Stone R, Ndjebayi AO, Erhardt J, Nankap M. Vitamin A and iron status and intake of fortifiable foods among Cameroonian women and preschool child. FASEB Journal 2011;25:108.3. [Google Scholar]
Chavez 1998 {published data only}
- Chavez JF, Gamero EG. Enrichment of precooked corn and wheat flour in Venezuela. A successful experience. Interciencia 1998;23(6):338-343. [Google Scholar]
Costa 2008 {published data only}
- Costa CA, Machado EH, Colli C, Latorre WC, Szarfarc SC. Anemia in pre-school children attending day care centers of São Paulo: perspectives of the wheat and maize flour fortification [Anemia em pré-escolares atendidos em creches de Sâo Paulo (SP): perspectivas decorrentes da fortificação das farinhas de trigo e de milho]. Nutrire Revista da Sociedade Brasileira de Alimentação e Nutrição 2009;34(1):59-74. [Google Scholar]
- Costa CA. Concentração de hemoglobina e prevalência de anemia em pré-escolares atendidos em creches da rede pública do município de São Paulo: perspectivas frente à fortificação das farinhas com ferro (Hemoglobin concentration and prevalence of anemia in pre-school children attending public child day care centers in São Paulo: perspectives concerning flour fortification with iron). Vol. 1. Sao Paulo: Universidade de Sao Paulo, 2008. [Google Scholar]
Da Silva 2012 {published data only}
- Da Silva CL, Saunders C, Szarfarc SC, Fujimori E, Da Veiga GV. Anaemia in pregnant women before and after the mandatory fortification of wheat and corn flours with iron. Public Health Nutrition 2012;15(10):1802-9. [DOI] [PubMed] [Google Scholar]
De Souza 2011 {published data only}
- De Souza MD, Damasceno CVX, Szarfarc SC, Fujimori E, Araujo MAD, Moreira-Araujo RSD. Fortification of flours with iron and control of anemia in pregnant women in Teresina, Piaui, Brazil [Fortificação das farinhas com ferro e controle da anemia em gestantes de Teresina, Piauí, Brasil]. Revista De Nutricao - Brazilian Journal of Nutrition 2011;24(5):679-88. [Google Scholar]
de Vasconcelos 2014 {published data only}
- Vasconcelos P N, Cavalcanti D S, Leal L P, Osorio M M, Batista M. Time trends in anemia and associated factors in two age groups (6-23 and 24-59 months) in Pernambuco State, Brazil, 1997-2006. Cad. Saude Publica 2014;30(8):1777-87. [DOI] [PubMed] [Google Scholar]
El Hamoduchi 2010 {published data only}
- El Hamdouchi A, El Kari K, Rjimati EA, El Mzibri M, Mokhtar N, Aguenaou H. Does flour fortification with electrolytic elemental iron improve the prevalence of iron deficiency anaemia among women in childbearing age and preschool children in Morocco? Mediterranean Journal of Nutrition and Metabolism 2013;6(1):73-8. [Google Scholar]
- El Hamdouchi A, El Kari K, Rjimati L, El Haloui N, El Mzibri M, Aquenaou H, et al. Impact of flour fortification with elemental iron on the prevalence of anaemia among preschool children in Morocco. Eastern Mediterranean Health Journal 2010;16(11):1148-52. [PubMed] [Google Scholar]
Elwood 1971 {published data only}
- Elwood PC, Waters WE, Sweetnam P. The Hematinic effect of iron in flour. Clinical Science (London) 1971;40:31-7. [DOI] [PubMed] [Google Scholar]
Engle‐Stone 2017 {published data only}
- Engle-Stone R, Martin N, Ndjebayi AO, Allen LH, Shahab-Ferdows S, Hampel D, et al. Iron, zinc, folate, and vitamin B-12 status increased among women and children in Yaounde and Douala, Cameroon, 1 year after Introducing fortified wheat flour. The Journal of Nutrition 2017;147(7):1426-36. [DOI] [PMC free article] [PubMed] [Google Scholar]
Fallahi 2003 {published data only}
- Fallahi E, Kimiagar M, Valaei N, Abbasi S. Effect of fortified flour with ferrous sulfate alone and with Na(2)EDTA on iron deficiency anemia and serum zinc. Journal of Food Agriculture & Environment 2003;1(3&4):69-71. [Google Scholar]
Fujimori 2009 {published data only}
- Fujimori E, Szarfarc SCS, Sato APS. Impact of flours fortification with iron in anaemia control of pregnant women attended at Brazilian public health services. Annals of Nutrition and Metabolism 2009;55(1):298. [Google Scholar]
Fujimori 2011 {published data only}
- Fujimori E, Sato AP, Szarfarc SC, Veiga GV, Oliveira VA, Colli C, et al. Anemia in Brazilian pregnant women before and after flour fortification with iron [Anemia em gestantes brasileiras antes e após a fortificação das farinhas com ferro]. Revista de Saude Publica 2011;45(6):1027-35. [DOI] [PubMed] [Google Scholar]
Giorgini 2001 {published data only}
- Giorgini E, Fisber M, De Paula RAC, Ferreira AMA, Valle J, Braga JAP. The use of sweet rolls fortified with iron bis-glycinate chelate in the prevention of iron deficiency anemia in preschool children. Archivos Latinoamericanos de Nutricion 2001;51(Supplement 1):48-53. [PubMed] [Google Scholar]
Granado 2013 {published data only}
- Granado FS, Augusto RA, Muniz PT, Cardoso MA, Action Study Team. Anaemia and iron deficiency between 2003 and 2007 in Amazonian children under 2 years of age: trends and associated factors. Public Health Nutrition 2013;16(10):1751-9. [DOI] [PMC free article] [PubMed] [Google Scholar]
Grimm 2012 {published data only}
- Grimm KA, Sullivan KM, Alasfoor D, Parvanta I, Suleiman AJM, Kaur M, et al. Iron-fortified wheat flour and iron deficiency among women. Food and Nutrition Bulletin 2012;33(3):180-5. [DOI] [PMC free article] [PubMed] [Google Scholar]
Hallberg 1989 {published data only}
- Hallberg L, Rossanderhulthen L, Gramatkovski E. Iron fortification of flour with a complex ferric ortho-phosphate. American Journal of Clinical Nutrition 1989;50(1):129-35. [DOI] [PubMed] [Google Scholar]
Hassanvand 2015 {published data only}
- Hassanvand E, Daraei Garmekhany A. Effect of flour enrichment on anemia prevalence in Lorestan province and its probable inefficiency factors. Minerva Biotecnologica 2015;27(4):159-62. [Google Scholar]
Heijblom 2007 {published data only}
- Heijblom GS, Pacheco-Santos LM. Iron deficiency anemia in first grade students from public schools in a region of Brasília, DF [Anemia ferropriva em escolares da primeira série do ensino fundamental da rede pública de educação de uma região de Brasília, DF]. Revista Brasileira de Epidemiologia 2007;10(2):258-66. [Google Scholar]
Huang 2009 {published data only}
- Huang J, Sun J, Li WX, Wang LJ, Wang AX, Huo JS, et al. Efficacy of different iron fortificants in wheat flour in controlling iron deficiency. Biomedical and Environmental Sciences 2009;22(2):118-21. [DOI] [PubMed] [Google Scholar]
- Sun J, Huang J, Li W, Wang L, Wang A, Huo J, et al. Effects of wheat flour fortified with different iron fortificants on iron status and anemia prevalence in iron deficient anemic students in Northern China. Asia Pacific Journal of Clinical Nutrition 2007;16(1):116-21. [PubMed] [Google Scholar]
Hund 2013 {published data only}
- Hund L, Northrop-Clewes CA, Nazario R, Suleymanova D, Mirzoyan L, Irisova M, et al. A novel approach to evaluating the iron and folate status of women of reproductive age in Uzbekistan after 3 years of flour fortification with. PLos ONE Nov, 2013;8(11):e79726. [DOI] [PMC free article] [PubMed] [Google Scholar]
Huo 2011 (C) {published data only}
- Huo J, Sun J, Huang J, Li W, Wang L, Selenje L, et al. The effectiveness of fortified flour on micro-nutrient status in rural female adults in China. Asia Pacific Journal of Clinical Nutrition 2011;20(1):118-24. [PubMed] [Google Scholar]
Huo 2012 (C) {published data only}
- Huo J, Sun J, Huang J, Li W, Wang L, Selenje L, Gleason GR, Yu X. Effectiveness of fortified flour for enhancement of vitamin and mineral intakes and nutrition status in northwest Chinese villages. Food and Nutrition Bulletin 2012;33(2):161-8. [DOI] [PubMed] [Google Scholar]
Imhoff‐Kunsch 2019 {published data only}
- Imhoff-Kunsch B, Shakya I, Namohunu SAD, Pitaboe A, Wong P, Tsang BL, et al. Potential dietary contributions from rice and wheat flour fortification in the Solomon Islands: Results from the 2012-2013 Household Income and Expenditure Survey. Food and Nutrition Bulletin 2019;40(1):71-86. [DOI: 10.1177/0379572118817179. Epub 2019 Jan 3.] [DOI] [PubMed] [Google Scholar]
Kamien 1975 {published data only}
- Kamien M, Woodhill JM, Nobile S, Cameron P, Rosevear P. Nutrition in the Australian aborigines--effects of the fortification of white flour. Australian & New Zealand Journal of Medicine 1975;5(2):123-33. [DOI] [PubMed] [Google Scholar]
Kendrick 2015 {published data only}
- Kendrick K, Codling K, Muslimatun S, Pachon H. The contribution of wheat flour fortification to reducing anemia in Indonesia. European Journal of Nutrition & Food Safety 2015;5(5):446-447. [Google Scholar]
- Pachon H, Kendrick K, Codling K, Muslimatun S. Analysis of the family life surveys in Indonesia: the contribution of wheat flour fortification to reducing anemia. FASEB Journal 2015;29(Suppl. 1):729.11. [https://legacy-etd.library.emory.edu/view/record/pid/emory:fzgxj] [Google Scholar]
Layrisse 1996 {published data only}
- Layrisse M, Chaves JF, Mendez-Castellano H, Bosch V, Tropper E, Bastardo B, Gonzalez E. Early response to the effect of iron fortification in the Venezuelan population. American Journal of Clinical Nutrition 1996;64(6):903-7. [DOI] [PubMed] [Google Scholar]
Layrisse 2002 {published data only}
- Layrisse M, Garcia-Casal MN, Mendez-Castellano H, Jimenez M, Olavarria CH, Chavez JF, et al. Impact of fortification of flours with iron to reduce the prevalence of anemia and iron deficiency among schoolchildren in Caracas, Venezuela: A follow-up. Food and Nutrition Bulletin 2002;23(4):384-9. [DOI] [PubMed] [Google Scholar]
Malpeli 2013 {published data only}
- Malpeli A, Ferrari MG, Varea A, Falivene M, Etchegoyen G, Vojkovic M, et al. Short-term evaluation of the impact of a fortified food aid program on the micronutrient nutritional status of Argentinian pregnant women. Biological Trace Element Research 2013;155(2):176-83. [DOI] [PubMed] [Google Scholar]
Martorell 2015 {published data only}
- Martorell Reynaldo, Ascencio Melany, Tacsan Luis, Alfaro Thelma, Young Melissa F, Addo O Yaw, et al. Effectiveness evaluation of the food fortification program of Costa Rica: impact on anemia prevalence and hemoglobin concentrations in women and children. American Journal of Clinical Nutrition 2015;101(1):210-7. [DOI] [PMC free article] [PubMed] [Google Scholar]
Milman 1999 {published data only}
- Milman N, Byg K E, Ovesen L. Iron status in Danes 1994. II: Prevalence of iron deficiency and iron overload in 1319 Danish women aged 40-70 years. Influence of blood donation, alcohol intake and iron supplementation. Annals of Hematology 2000;79(11):612-21. [DOI] [PubMed] [Google Scholar]
- Milman N, Byg KE, Ovesen L, Kirchhoff M, Jurgensen KSL. Iron status in Danish women, 1984-1994: A cohort comparison of changes in iron stores and the prevalence of iron deficiency and iron overload. European Journal of Haematology 2003;71(1):51-61. [DOI] [PubMed] [Google Scholar]
- Milman N, Ovesen L, Byg K, Graudal N. Iron status in Danes updated 1994. I: prevalence of iron deficiency and iron overload in 1332 men aged 40-70 years. Influence Of blood donation, alcohol intake, and iron supplementation. Annals of Hematology 1999;78(9):393-400. [DOI] [PubMed] [Google Scholar]
- Milman N, Pedersen AN, Ovesen L, Schroll M. Iron status in 358 apparently healthy 80-year-old Danish men and women: relation to food composition and dietary and supplemental iron intake. Annals of Hematology 2004;83(7):423-9. [DOI] [PubMed] [Google Scholar]
Modjadji 2007 {published data only}
- Modjadji SEP, Alberts M, Mamabolo RL. Folate and iron status of South African non-pregnant rural women of childbearing, age, before and after fortification of foods. South African Journal of Clinical Nutrition 2007;20(3):89-93. [Google Scholar]
Mwangi 2015 {published data only}
- Mwangi MN, Roth JM, Smit MR, Trijsburg L, Mwangi AM et al. Effect of daily antenatal iron supplementation on plasmodium Infection in Kenyan women: a randomized clinical trial. JAMA 2015;314(10):1009-20. [DOI] [PubMed] [Google Scholar]
Natvig 1973 (C) {published data only}
- Natvig H, Vellar OD. Iron fortified bread a long term controlled therapeutic community based experiment with ferrous sulfate enriched flour. Acta Medica Scandinavica 1973;194(5):463-71. [PubMed] [Google Scholar]
Osler 1999 {published data only}
- Osler M, Milman N, Heitmann BL. Consequences of removing iron fortification of flour on iron status among Danish adults: Some longitudinal observations between 1987 and 1994. Preventive Medicine 1999;29(1):32-6. [DOI] [PubMed] [Google Scholar]
Papathakis 2012 {published data only}
- Papathakis PC, Pearson KE. Food fortification improves the intake of all fortified nutrients, but fails to meet the estimated dietary requirements for vitamins A and B-6, riboflavin and zinc, in lactating South African women. Public Health Nutrition 2012;15(10):1810-7. [DOI] [PubMed] [Google Scholar]
Pouraram 2010 {published data only}
- Pouraram H, Elmadfa I, Siassi F, Dorosty Motlagh A, Heshmat R, Abtahi M. Oxidative stress among non-anemic adults following flour fortification with iron: baseline data. Annals of Nutrition & Metabolism 2010;56(4):283-7. [DOI] [PubMed] [Google Scholar]
Pouraram 2012 {published data only}
- Pouraram H, Elmadfa I, Dorosty AR, Abtahi M, Neyestani TR, Sadeghian S. Long-term consequences of iron-fortified flour consumption in nonanemic men. Annals of Nutrition & Metabolism 2012;60(2):115-21. [DOI] [PubMed] [Google Scholar]
Rohner 2013 {published data only}
- Rohner F, Northrop-Clewes C, Raso G, Ake O, Tschannen A, Laillou A, et al. Effect of a fortified oil and flour program in Cote d'Ivoire on micronutrient status of pre-school children and women. In: IUNS 20 International Congress of Nutrition. 2013.
Sadighi 2009 {published data only}
- Sadighi J, Mohammad K, Sheikholeslam R, Amirkhani MA, Torabi P, Salehi F, Abdolahi Z. Anaemia control: Lessons from the flour fortification programme. Public Health Dec 2009;123(12):794-9. [DOI] [PubMed] [Google Scholar]
- Sadighi J, Sheikholeslam R, Mohammad K, Pouraram H, Abdollahi Z, Samadpour K, et al. Flour fortification with iron: a mid-term evaluation. Public Health (Elsevier) 2008;122(3):313-21. [DOI] [PubMed] [Google Scholar]
Sato 2008 {published data only}
- Sato APS, Fujimori E, Szarfarc SC, Araujo CRMA, Queiroz VAD, Moreira-Araujo RSR, et al. Anaemia in pregnant women assisted by public healthcare services of the five Brazilian regions before and after the policy of fortification of flours with iron. Journal of Epidemiology & Community Health 2011;65(1):A376. [Google Scholar]
- Sato APS, Fujimori E, Szarfarc SC, Sato JR, Bonadio IC. Prevalence of anemia in pregnant and iron fortification of flours [Prevalência de anemia em gestantes e a fortificação de farinhas com ferro]. Texto & Contexto Enfermagen 2008;17(3):474-81. [Google Scholar]
- Sato APS, Fujimori E, Szarfarc SC. Hemoglobin level in pregnant women assisted by public prenatal services in the five regions of Brazil. European Journal of Epidemiology 2012;27:S126-S126. [Google Scholar]
Sato 2015 {published data only}
- Sato APS, Porto E, Brunken GS, Fujimori E, Leone C, Szarfarc, et al. Anemia and hemoglobin levels in pregnant women in Cuiabá, Mato Grosso, Brazil, before and after the fortification of meal with iron and folic acid, 2003-2006 [Anemia e nível de hemoglobina em gestantes de Cuiabá, Mato Grosso, Brasil, antes e após a fortificação compulsória de farinhas com ferro e ácido fólico, 2003-2006]. Epidemiologia e Serviços de Saúde 2015;24(3):453-64. [Google Scholar]
Simmons 1994 {published data only}
- Simmons WK, Sinha DP. Reduction in anaemia in pregnant women in three Caribbean countries. possible results of different types of interventions. Ecology of Food & Nutrition 1994;32(3-4):149-55. [DOI] [PubMed] [Google Scholar]
Sjoberg 2015 {published data only}
- Sjoberg A, Hulthen L. Comparison of food habits, iron intake and iron status in adolescents before and after the withdrawal of the general iron fortification in Sweden. European Journal of Clinical Nutrition 2015;69(4):494-500. [DOI] [PubMed] [Google Scholar]
Stuetz 2012 {published data only}
- Stuetz W, Carrara V, McGready R, Lee S, Erhardt J, Breuer J, et al. Micronutrient status in lactating mothers before and after introduction of fortified flour: cross-sectional surveys in Maela refugee camp. European Journal of Nutrition 2012;51(4):425-34. [DOI] [PMC free article] [PubMed] [Google Scholar]
Sun 2008 {published data only}
- Sun J, Huo J, Li W, Wang L, et al. Observation on effectiveness of fortified flour on nutrition status improvement of poor area women in Weichang County of Hebei Province in China. Wei sheng yan jiu - Journal of hygiene research 2008;37(2):199-202. [PubMed] [Google Scholar]
Tazhibayev 2008 {published data only}
- Tazhibayev S, Solmatova O, Ganiyeva G, Khairov K, Ospanova F, Oyunchimeg D, Suleimanova D, Scrimshaw N. Evaluation of the potential effectiveness of wheat flour and salt fortification programs in five Central Asian countries and Mongolia, 2002-2007. Food Nutr Bull 2008 Dec;29(4):255-65. [DOI] [PubMed] [Google Scholar]
Varea 2011 {published data only}
- Varea A, Malpeli A, Etchegoyen G, Vojkovic M, Disalvo L, Apezteguia M, et al. Short-term evaluation of the impact of a food program on the micronutrient nutritional status of Argentinean children under the age of six. Biological Trace Element Research 2011;143(3):1337-48. [DOI] [PubMed] [Google Scholar]
Varea 2012 {published data only}
- Varea A, Malpeli A, Disalvo L, Apezteguia M, Falivene M, Ferrari G, et al. Evaluation of the impact of a food program on the micronutrient nutritional status of Argentinean lactating mothers. Biological Trace Element Research 2012;150(1-3):103-8. [DOI] [PubMed] [Google Scholar]
Zavaleta 2004 {published data only}
- Zavaleta N, Abrams S, Lonnerdal B. Effect of wheat flour fortification with iron and without zinc, vitamin A and folic acid on serum copper in Peruvian infants. In: Latin American Society for Pediatric Research. Vol. 55. 2004:530.
Zimmermann 2005 {published data only}
- Zimmermann MB, Winichiagoon P, Gowachirapant S, Hess SY, Harrington M, Chavasit V, et al. Comparison of the efficacy of wheat-based snacks fortified with ferrous sulfate, electrolytic iron, or hydrogen-reduced elemental iron: randomized, double-blind, controlled trial in Thai women. American Journal of Clinical Nutrition 2005;82(6):1276-82. [DOI] [PubMed] [Google Scholar]
Zimmermann 2011 {published and unpublished data}
- Zimmermann M. Iron fortification trial using NaFeEDTA in iron deficient lead-exposed children. International Clinical Trials Registry Platform unpublished.
References to ongoing studies
Arcot 2017 {unpublished data only}
- Arcot J. Effect of nutrition-improved wheat-based food on the health of primary school children aged 6-12 years in Morobe province. https://www.anzctr.org.au/Trial/Registration/TrialReview.aspx?ACTRN=12616001271493 2016.
Tetanye 2018 {unpublished data only}
- Tetanye E. Efficacy of an iron fortified wheat flour for the correction and the prevention of iron deficiency anaemia of children in Salapoumbe. https://pactr.samrc.ac.za/TrialDisplay.aspx?TrialID=3069 2018.
Additional references
Adams 2004
- Geoffrey Adams, Martin C Gulliford, Obioha C Ukoumunne, Sandra Eldridge, Susan Chinn, Michael J Campbell. Patterns of intra-cluster correlation from primary care research to inform study design and analysis. Journal of Clinical Epidemiology 2004;57:785-794. [DOI] [PubMed] [Google Scholar]
Andrews 2000
- Andrews NC. Iron metabolism: Iron deficiency and iron overload. Annual Review of Genomics and Human Genetics 2000;1:75-98. [DOI] [PubMed] [Google Scholar]
Balshem 2011
- Balshem H, Helfanda M, Schünemann HJ, Oxmand AD, Kunze R, Brozek J, et al. GRADE guidelines: rating the quality of evidence: introduction. Journal of Clinical Epidemiology 2011;64(4):401-6. [DOI] [PubMed] [Google Scholar]
Barkley 2015
- Barkely JS, Wheeler KS, Pachon H. Anaemia prevalence may be reduced among countries that fortify flour. British Journal of Nutrition 2015;114:265-273. [DOI] [PubMed] [Google Scholar]
Beard 2006
- Beard JL, Murray-Kolb LE, Rosales FJ, Solomons NW, Angelilli ML. Interpretation of serum ferritin concentrations as indicators of total-body iron stores in survey populations: the role of biomarkers for the acute phase response. American Journal of Clinical Nutrition 2006;84(6):1498-505. [DOI] [PubMed] [Google Scholar]
Borenstein 2009
- Borenstein M, Hedges LV, Higgins JPT, Rothstein HR. Introduction to Meta-Analysis. 1 edition. Oxford: Wiley, 2009. [DOI: ] [Google Scholar]
Camaschella 2017
- Camaschella C. New insights into iron deficiency and iron deficiency an emia. Blood Reviews 2017;31:225-233. [DOI] [PubMed] [Google Scholar]
Catzeddu 2011
- Catdezzu P. Sourdough breads. In: Preedy VR, Watson RR, Patel VB, editors(s). Flour and breads and their fortification in health and disease prevention. First edition. London: Elsevier, 2011:37-46. [Google Scholar]
Centeno Tablante 2019
- Centeno Tablante E, Pachón H, Guetterman HM, Finkelstein JL. Fortification of wheat and maize flour with folic acid for population health outcomes. Cochrane Database of Systematic Reviews 2019, Issue 7. [DOI: 10.1002/14651858.CD012150.pub2] [DOI] [PMC free article] [PubMed] [Google Scholar]
Chaparro 2019
- Chaparro CM and Suchdev PS. Anemia epidemiology, pathophysiology, and etiology in low- and middle-income countries. Annals of the New York Academy of Sciences 2019;1450:15-31. [DOI] [PMC free article] [PubMed] [Google Scholar]
Cochrane EPOC Group 2013
- Cochrane Effective Practice and Organisation of Care Group. Effective Practice and Organisation of Care (EPOC). EPOC Resources for review authors. Suggested risk of bias criteria for EPOC reviews. Oslo: Norwegian Knowledge Centre for the Health Services; 2013. Available at: http://epocoslo.cochrane.org/epoc-specific-resources-review-authors.
Cochrane Public Health Group 2011
- Cochrane Public Health Group. Guide for developing a Cochrane Protocol. Last updated: 24 November 2011. Available from http://ph.cochrane.org/sites/ph.cochrane.org/files/uploads/Guide%20for%20PH%20protocol_Nov%202011_final%20for%20website.pdf.
Codex Alimentarius 1991
- Codex Alimentarius. Codex standard for durum wheat semolina and durum wheat flour. Codex Standard 178-1991. Adopted 1991. Revision 1995. Available from http://www.codexalimentarius.org/input/download/standards/60/CXS_178e.pdf.
Codex Alimentarius 1995
- Codex Alimentarius. Codex standard for wheat flour. Codex Standard 152-1985. Adopted 1985. Revision 1995. Available from http://www.codexalimentarius.org/input/download/standards/50/CXS_152e.pdf.
Cook 1999
- Cook JD. Defining optimal body iron. Proceedings of the Nutrition Society 1999;58(2):489-95. [DOI] [PubMed] [Google Scholar]
Cook 2003
- Cook JD, Flowers CH, Skikne BS. The quantitative assessment of body iron. Blood 2003;101(9):3359-64. [DOI] [PubMed] [Google Scholar]
Covidence 2018 [Computer program]
- Veritas Health Innovation Covidence [Covidence]. Covidence systematic review software, Version Accessed 24 July 2018. Melbourne, Australia: Veritas Health Innovation, 2018.Available at www.covidence.org.
Dallman 1986
- Dallman PR. Biochemical basis for the manifestations of iron deficiency. Annual Review of Nutrition 1986;6:13-40. [DOI] [PubMed] [Google Scholar]
Darnton‐Hill 1999
- Darnton-Hill I, Mora JO, Weinstein H, Wilbur S, Nalubola PR. Iron and folate fortification in the Americas to prevent and control micronutrient malnutrition: an analysis. Nutrition Reviews 1999;57(1):25-31. [DOI] [PubMed] [Google Scholar]
Dary 2002
- Dary O. Lessons learned with iron fortification in Central America. Nutrition Reviews 2002;60(7):S30-3. [DOI] [PubMed] [Google Scholar]
Das 2012
- Das JK, Salam RA, Lassi ZS, Bhutta ZA. Food fortification with calcium and vitamin D: impact on health outcomes. Cochrane Database of Systematic Reviews 2012, Issue 11. [DOI: 10.1002/14651858.CD010201] [DOI] [PMC free article] [PubMed] [Google Scholar]
Das 2013
- Das JK, Salam RA, Kumar R, Bhutta ZA. Micronutrient fortification of food and its impact on woman and child health: a systematic review. Systematic Reviews 2013;2:67-93. [DOI: ] [DOI] [PMC free article] [PubMed] [Google Scholar]
Das 2019
- Das JK, Salam RA, Mahmood SB, Moin A, Kumar R, Mukhtar K, et al. Food fortification with multiple micronutrients: impact on health outcomes in general population. Cochrane Database of Systematic Reviews 2019, Issue 12. [DOI: 10.1002/14651858.CD011400.pub2] [DOI] [PMC free article] [PubMed] [Google Scholar]
De‐Regil 2014
- De-Regil LM, Peña-Rosas JP, Flores-Ayala R, Socorro Jefferds ME. Development and use of the generic WHO/CDC logic model for vitamin and mineral interventions in public health programmes. Public Health Nutrition 2014;17(3):634-9. [DOI] [PMC free article] [PubMed] [Google Scholar]
Elhakim 2012
- Elhakim N, Laillou A, El Nakeeb A, Yacoub R, Shehata M. Fortifying baladi bread in Egypt: reaching more than 50 million people through the subsidy program. Food and Nutrition Bulletin 2012;33(4 Suppl):S260-71. [DOI] [PubMed] [Google Scholar]
Enghiad 2017
- Enghiad A, Ufer D, Countryman AM, Thilmany DD. An Overview of Global Wheat Market Fundamentals in an Era of Climate Concerns. International Journal of Agronomy 2017;2017:3931897. [DOI: ] [Google Scholar]
FAO 2009
- Food and Agriculture Organization of the United Nations. Wheat Flour. Rome: Food and Agriculture Organization of the United Nations, 2009. [Google Scholar]
FAO 2013
- Food and Agriculture Organization of the United Nations. FAO Statistical Yearbook 2013. World food and agriculture. Available from http://www.fao.org/docrep/018/i3107e/i3107e00.htm.
FAO 2019
- Food and Agriculture Organization of the United Nations. FAO Cereal Supply and Demand Brief. Available from: http://www.fao.org/worldfoodsituation/csdb/en/ May 12, 2019. [http://www.fao.org/worldfoodsituation/csdb/en/; accessed December 2019]
FAO 2019b
- Food and Agriculture Organization of the United Nations. Food Price Monitoring and Analysis. Available from: http://www.fao.org/giews/food-prices/international-prices/detail/en/c/1254992/ October 12, 2019. [http://www.fao.org/giews/food-prices/international-prices/detail/en/c/1254992/; accessed December 2019]
FAO/CAB International 2011
- Food and Agriculture Organization of the United Nations and CAB International. Combating Micronutrient Deficiencies:Food-based Approaches. 2011. Edited by Brian Thompson and Leslie Amoroso. Available from http://www.fao.org/docrep/013/am027e/am027e00.htm.
FFI 2014
- Food Fortification Initiative. Global Progress. 2014. http://www.ffinetwork.org/global_progress/ (accessed 31 July 2014).
FFI 2017
- Food Fortification Initiative. Say hello to a fortified future. 2016 Year In Review 2017.
Finch 1972
- Finch CA, Monsen ER. Iron nutrition and the fortification of food with iron. JAMA 1972;219(11):1462-5. [PubMed] [Google Scholar]
Ganz 2019
- Ganz T. Anemia of Inflammation. The New England Journal of Medicine 2019;381:1148-1157. [DOI] [PubMed] [Google Scholar]
Garcia‐Casal 2018
- Garcia‐Casal MN, Peña‐Rosas JP, De‐Regil LM, Gwirtz JA, Pasricha SR. Fortification of maize flour with iron for controlling anaemia and iron deficiency in populations. Cochrane Database of Systematic Reviews 2018, Issue 12. [DOI: 10.1002/14651858.CD010187.pub2] [DOI] [PMC free article] [PubMed] [Google Scholar]
Garcia‐Casal 2018b
- Garcia-Casal MN, Pasricha SR, Martinez RX, Lopez-Perez L, Peña-Rosas JP. Are current serum and plasma ferritin cut-offs for iron deficiency and overload accurate and reflecting iron status? a systematic review. Archives of Medical Research 2018;49(6):405-417. [DOI] [PubMed] [Google Scholar]
Garcia‐Casal 2018c
- Garcia-Casal MN, Peña-Rosas JP, Urrechaga E, Escanero JF, Huo J, Martinez RX, et al. Performance and comparability of laboratory methods for measuring ferritin concentrations in human serum or plasma: a systematic review and meta-analysis. PloS One 2018;13(5):e0196576. [DOI] [PMC free article] [PubMed] [Google Scholar]
Garcia‐Casal 2019
- Garcia-Casal MN, Pasricha S, Sharma AJ, Pena-Rosas JP. Use and interpretation of hemoglobin concentrations for assessing anemia status in individuals and populations: results from a WHO technical meeting. Annals of the New York Academy of Sciences 2019;1450:5-14. [DOI] [PMC free article] [PubMed] [Google Scholar]
Gera 2012
- Gera T, Sachdev HS, Boy E. Effect of iron-fortified foods on hematologic and biological outcomes: systematic review of randomized controlled trials. American Journal of Clinical Nutrition 2012;96(2):309-24. [DOI] [PubMed] [Google Scholar]
Gibson 2005
- Gibson RS. Principles of Nutritional Assessment. 2 edition. New York: Oxford University Press, 2005. [DOI: ] [Google Scholar]
GRADEpro GDT 2015 [Computer program]
- McMaster University GRADEpro GDT:GRADEpro Guideline Development Tool. McMaster University, 2015 (developed by Evidence Prime, Inc).Available from gradepro.org.
Gulliford 1999
- Gulliford MC, Ukoumunne OC, Chinn S. Components of variance and intraclass correlations for the design of community-based surveys and intervention studies: data from the health survey for england. American Journal of Epidemiology 1999;149(9):876-883. [DOI] [PubMed] [Google Scholar]
Higgins 2019
- Higgins JPT, Thomas J, Chandler J, Cumpston M, Li T, Page MJ, Welch VA (editors). Cochrane Handbook for Systematic Reviews of Interventions. 2nd Edition. Chichester (UK): John Wiley & Sons, 2019. [Google Scholar]
Hombali 2019
- Hombali AS, Solon JA, Venkatesh BT, Nair NS, Peña‐Rosas JP. Fortification of staple foods with vitamin A for vitamin A deficiency. Cochrane Database of Systematic Reviews 2019, Issue 5. [DOI: 10.1002/14651858.CD010068.pub2] [DOI] [PMC free article] [PubMed] [Google Scholar]
Horton 2007
- Horton S, Ross J. The economics of iron deficiency. Food Policy 2007;32(1):141-3. [Google Scholar]
Hurrell 2000
- Hurrell RF, Reddy MB, Burri J, Cook JD. An evaluation of EDTA compounds for iron fortification of cereal-based foods. British Journal of Nutrition 2000;84(6):903-10. [PubMed] [Google Scholar]
Hurrell 2010
- Hurrell R, Ranum P, Pee S, Biebinger R, Hulthen L, Johnson Q, et al. Revised recommendations for the iron fortification of wheat flour and an evaluation of the expected impact of current national wheat flour fortification programs. Food and Nutrition Bulletin 2010;31(1 Suppl):S7-21. [DOI] [PubMed] [Google Scholar]
Indrani 2011
- Indrani D, Rao VG. South Indian parotta: an unleavened flat bread. In: Preedy VR, Ross Watson R, Patel VB, editors(s). Flour and breads and their fortification in health and disease prevention. First edition. London: Elsevier, 2011:27-36. [Google Scholar]
Khan 2006
- Khan KS. WHO analysis of causes of maternal death: a systematic review. Lancet 2007;367(9516):1066-74. [DOI] [PubMed] [Google Scholar]
Kumar 2010
- Kumar V, Sinha AK, Makkar HPS, Becker K. Dietary roles of phytate and phytase in human nutrition: A review. Food Chemistry 2010;120(4):945-59. [Google Scholar]
Langendam 2013
- Langendam MW, Akl EA, Dahm P, Glasziou P, Guyatt G, Schünemann HJ. Assessing and presenting summaries of evidence in Cochrane Reviews. Systematic Reviews 2013;2:81. [DOI] [PMC free article] [PubMed] [Google Scholar]
Liberati 2009
- Liberati A, Altman DG, Tetzlaff J, Mulrow C, Gøtzsche PC, Ioannidis JP, et al. The PRISMA statement for reporting systematic reviews and meta-analyses of studies that evaluate health care interventions: explanation and elaboration. Annals of Internal Medicine 2009;151(4):W6594. [DOI] [PubMed] [Google Scholar]
Lulla 2010
- Lulla RR, Thompson AA, Liem RI. Elevated soluble transferrin receptor levels reflect increased erythropoietic drive rather than iron deficiency in pediatric sickle cell disease. Pediatric Blood & Cancer 2010;55(1):141-4. [DOI: 10.1002/pbc.22471] [PMID: ] [DOI] [PubMed] [Google Scholar]
Lynch 2007
- Lynch S. Iron metabolism. In: Klaus Kraemer, Michael B Zimmermann, editors(s). Nutritional Anemia. Basel: SIGHT AND LIFE Press, 2007:59-76. [Google Scholar]
Lynch 2012
- Lynch S. The rationale for selecting and standardizing iron status indicators. In: World Health Organization. Report: Priorities in the assessment of vitamin A and iron status in populations, Panama City, Panama, 15-17 September 2010. Geneva, World Health Organization, 2012. Available from http://www.who.int/nutrition/publications/micronutrients/background_paper3_report_assessment_vitAandIron_status.pdf.
Lynch 2017
- Lynch S, Pfeiffer CM, Georgieff MK, Brittenham G, Fairweather-Tait S, Hurrell RF, McArdle HJ, and Raiten DJ. Biomarkers of Nutrition for Development (BOND)--Iron Review. The Journal of Nutrition 2017;148:1001S-1067S. [DOI] [PMC free article] [PubMed] [Google Scholar]
Mannar 2002
- Mannar V, Gallego EB. Iron fortification: country level experiences and lessons learned. Journal of Nutrition 2002;132(4 Suppl):856S-8S. [DOI] [PubMed] [Google Scholar]
Nestel 2004
- Nestel P, Nalubola R, Sivakaneshan R, Wickramasinghe AR, Atukorala S, Wickramanayake T. The use of iron-fortified wheat flour to reduce anemia among the estate population in Sri Lanka. International Journal for Vitamin and Nutrition Research 2004;74(1):35-51. [DOI] [PubMed] [Google Scholar]
Neufeld 2017
- Neufeld LM, Baker S, Garrett GS, Haddad H. Coverage and utilization in food fortification programs: critical and neglected areas of evaluation. Journal of Nutrition 2017;147(5):1015S–1019S. [DOI] [PMC free article] [PubMed] [Google Scholar]
O'Neill 2013
- O'Neill J, Tabish H, Welch V, Petticrew M, Pottie K, Clarke M, et al. Applying an equity lens to interventions: using PROGRESS to ensure consideration of socially stratifying factors to illuminate inequities in health. Journal of Clinical Epidemiology 2013;67:56-64. [DOI] [PubMed] [Google Scholar]
Olaoye 2011
- Olaoye OA, Ade-Omowaye BIO. Composite flours and breads: potential of local crops in developing countries. In: Preedy VR, Watson RR, Patel VB, editors(s). Flour and breads and their fortification in health and disease prevention. First edition. London: Elsevier, 2011:183-192. [Google Scholar]
Oliver 2008
- Oliver S, Kavanagh J, Caird J, Lorenc T, Oliver K, Harden A, Thomas J, Greaves A, Oakley A. Health promotion, inequalities and young people’s health: a systematic review of research [Health promotion, inequalities and young people’s health: a systematic review of research]. London: EPPI-Centre, Social Science Research Unit, Institute of Education, University of London. 2008;https://eppi.ioe.ac.uk/cms/Default.aspx?tabid=2410(https://eppi.ioe.ac.uk/cms/Default.aspx?tabid=2410):https://eppi.ioe.ac.uk/cms/Default.aspx?tabid=2410.
Osorio 2002
- Osorio MM. Determinant factors of anemia in children. Jornal de Pediatria 2002;78(4):269-78. [DOI] [PubMed] [Google Scholar]
Pachon 2015
- Pachon H, Spohrer R, Mei Z, Serdula MK. Evidence of the effectiveness of flour fortification programs on iron status and anemia: a systematic review. Nutrition Reviews 2015;73(11):780-95. [DOI] [PMC free article] [PubMed] [Google Scholar]
Pasricha 2012
- Pasricha SR, De-Regil LM, Garcia-Casal MN, Burford BJ, Gwirtz JA, Peña-Rosas JP. Fortification of maize flour with iron for preventing anaemia and iron deficiency in populations. Cochrane Database of Systematic Reviews 2012, Issue 11. [DOI: 10.1002/14651858.CD010187] [DOI] [PMC free article] [PubMed] [Google Scholar]
Peña‐Rosas 2019
- Peña‐Rosas JP, Mithra P, Unnikrishnan B, Kumar N, De‐Regil LM, Nair NS, et al. Fortification of rice with vitamins and minerals for addressing micronutrient malnutrition. Cochrane Database of Systematic Reviews 2019, Issue 10. [DOI: 10.1002/14651858.CD009902.pub2] [DOI] [PMC free article] [PubMed] [Google Scholar]
Phiri 2009
- Phiri KS, Calis JC, Kachala D, Borgstein E, Waluza J, Bates I, et al. Improved method for assessing iron stores in the bone marrow. Journal of Clinical Pathology 2009;62(8):685-9. [DOI: 10.1136/jcp.2009.064451] [PMID: ] [DOI] [PMC free article] [PubMed] [Google Scholar]
Prentice 2007
- Prentice AM, Ghattas H, Doherty C, Cox SE. Iron metabolism and malaria. Food and Nutrition Bulletin 2007;28(4 Suppl):S524-39. [DOI] [PubMed] [Google Scholar]
Review Manager 2020 [Computer program]
- The Cochrane Collaboration Review Manager (RevMan). Version 5.4. The Cochrane Collaboration, 2020.
Rosell 2011
- Rosell CM. The science of doughs and bread quality. In: Preedy VR, Watson RR, Patel VB, editors(s). Flour and breads and their fortification in health and disease prevention. First edition. London: Elsevier, 2011:3-14. [Google Scholar]
Sadighi 2015
- Jila Sadighi, Katayoun Jahangiri, Azita Goshtasebi, Rahele Rostami. Effectiveness of flour fortification with iron on anemia and iron deficiency: a systematic review. Journal of the Iranian Institute for Health Sciences Research 2015;3:269-296. [Google Scholar]
Sadighi 2017
- Jila Sadighi, Saharnaz Nedjat, Rahele Rostami. Effect of flour fortification with iron on biochemical indicators of anemia and iron deficiency: Meta-analysis of interventional studies [Effect of flour fortification with iron on biochemical indicators of anemia and iron deficiency: Meta-analysis of interventional studies]. Payesh Health Monitor 2017;16(6):677-713. [Google Scholar]
Sadighi 2019
- Sadighi J, Nedjat S, Rostami R. Systematic review and meta-analysis of the effect of iron-fortified flour on iron status of populations worldwide [Systematic review and meta-analysis of the effect of iron-fortified flour on iron status of populations worldwide]. Public health nutrition 2019;-:1-20. [DOI: 10.1017/S1368980019002179] [PMID: ] [DOI] [PMC free article] [PubMed] [Google Scholar]
Santos 2019
- Santos JAR, Christoforou A, Trieu K, McKenzie BL, Downs S, Billot L, et al. Iodine fortification of foods and condiments, other than salt, for preventing iodine deficiency disorders. Cochrane Database of Systematic Reviews 2019, Issue 2. [DOI: 10.1002/14651858.CD010734.pub2] [DOI] [PMC free article] [PubMed] [Google Scholar]
Sazawal 2006
- Sazawal S, Black RE, Ramsan M, Chwaya HM, Stoltzfus RJ, Dutta A, et al. Effects of routine prophylactic supplementation with iron and folic acid on admission to hospital and mortality in preschool children in a high malaria transmission setting: community-based, randomised, placebo-controlled trial. Lancet 2006;367(9505):133-43. [DOI] [PubMed] [Google Scholar]
Schnall 2000
- Schnall SF, Berliner N, Duffy TP, Benz EJ Jr. Approach to the adult and child with anemia. In: Hoffman R, Benz EJ Jr, Shattil SJ, Furie B, Cohen HJ, Silberstein LE, McGlave P, editors(s). Hematology: basic principles and practice. 3rd edition. Philadelphia: Churchill Livingstone, 2000. [Google Scholar]
Shah 2016
- Shah D, Sachdev HS, Gera T, De-Regil LM, Peña-Rosas JP. Fortification of staple foods with zinc for improving zinc status and other health outcomes in the general population. Cochrane Database of Systematic Reviews 2016, Issue 6. [DOI: 10.1002/14651858.CD010697.pub2] [DOI] [PMC free article] [PubMed] [Google Scholar]
Sousa 2019
- Sousa L, Oliviera MM, Pessoa MTC, Barbosa LA. Iron overload: Effects on cellular biochemistry. Clinical Chimica Acta 2019;In press:online ahead of print. [DOI: 10.1016/j.cca.2019.11.029] [DOI] [PubMed] [Google Scholar]
Spottiswoode 2012
- Spottiswoode N, Fried M, Drakesmith H, Duffy PE. Implications of malaria on iron deficiency control strategies. Advances in Nutrition 2012;3(4):570-578. [DOI] [PMC free article] [PubMed] [Google Scholar]
Stevens 2013
- Stevens GA, Finucane MM, De-Regil LM, Paciorek CJ, Flaxman SR, Branca F, et al. Global, regional, and national trends in haemoglobin concentration and prevalence of total and severe anaemia in children and pregnant and non-pregnant women for 1995-2011: a systematic analysis of population-representative data. Lancet Global Health 2013;1(1):e16-25. [DOI] [PMC free article] [PubMed] [Google Scholar]
Stoltzfus 2017
- Stoltzfus RJ and Klemm R. Research, policy, and programmatic considerations from the Biomarkers Reflecting Inflammation and Nutritional Determinants (BRINDA) project. American Journal of Clinical Nutrition 2017;106:428S-434S. [DOI] [PMC free article] [PubMed] [Google Scholar]
Thurnham 2012
- Thurnham DI, McCabe GP. Influence of infection and inflammation on biomarkers of nutritional status with an emphasis on vitamin A and iron. In: World Health Organization. Report: Priorities in the assessment of vitamin A and iron status in populations, Panama City, Panama, 15-17 September 2010. Geneva, World Health Organization, 2012. Available from http://www.who.int/nutrition/publications/micronutrients/background_paper4_report_assessment_vitAandIron_status.pdf.
Umbreit 2005
- Umbreit J. Iron deficiency: a concise review. American Journal of Hematology 2005;78(3):225-31. [DOI] [PubMed] [Google Scholar]
UNICEF 2009
- UNICEF Regional Office for Central and Eastern Europe and the Commonwealth of Independent States (CEE/CIS). The "Day of Three Laws" in Kyrgyzstan. 2009. Available from http://www.unicef.org/ceecis/media_11364.html.
Van Der Borght 2005
- Van Der Borght A, Goesaert H, Veraverbeke WS, Delcour JA. Fractionation of wheat and wheat flour into starch and gluten: overview of the main processes and the factors involved. Journal of Cereal Science 2005;41(3):221-37. [Google Scholar]
Verhoef 2001
- Verhoef H, West CE, Ndeto P, Burema J, Beguin Y, Kok FJ. Serum transferrin receptor concentration indicates increased erythropoiesis in Kenyan children with asymptomatic malaria. American Journal of Clinical Nutrition 2001;74(6):767-75. [PMID: ] [DOI] [PubMed] [Google Scholar]
Weiss 2005
- Weiss G, Goodnough LT. Anemia of chronic disease. New England Journal of Medicine 2005;352(10):1011-23. [DOI] [PubMed] [Google Scholar]
WHO 2009
- World Health Organization. Recommendations on wheat and maize flour fortification. Meeting report: Interim consensus statement. 2009. WHO reference number:WHO/NMH/NHD/MNM/09.1. Available from http://www.who.int/nutrition/publications/micronutrients/wheat_maize_fortification/en/. [PubMed]
WHO 2011a
- World Health Organization. Haemoglobin concentrations for the diagnosis of anaemia and assessment of severity. 2011. WHO reference number:WHO/NMH/NHD/MNM/11.1. Available from http://www.who.int/vmnis/indicators/haemoglobin/en/.
WHO 2011b
- World Health Organization. Serum ferritin concentrations for the assessment of iron status and iron deficiency in populations. 2011. WHO reference number:WHO/NMH/NHD/MNM/11.2. Available from http://www.who.int/vmnis/indicators/ferritin/en/.
WHO 2011c
- World Health Organization. WHO/CDC logic model for micronutrient interventions in public health. 2011. WHO reference number:WHO/NMH/NHD/MNM/11.5. Available from http://www.who.int/vmnis/toolkit/logic_model/en/.
WHO 2017
- World Health Organization. Nutritional anaemias: tools for effective prevention and control. 2017: World Health Organization, 2017. [Google Scholar]
WHO 2018
- World Health Organization. World health statistics 2018: monitoring health for the SDGs, sustainable development goals. https://www.who.int/gho/publications/world_health_statistics/2018/en/ edition. Vol. -. Geneva,Switzerland: World Health Organization, 2018. [Google Scholar]
WHO 2019a
- World Health Organization. Essential nutrition actions: mainstreaming nutrition through the life-course. Geneva: World Health Organization, 2019. [Google Scholar]
WHO 2019b
- World Health Organization. Data. Global Health Observatory (https://www.who.int/gho/en/, accessed 11 July 2019).
WHO 2020
- World Health Organization. WHO guideline on use of ferritin concentrations to assess iron status in populations. Geneva: World Health Organization, 2020. [PubMed] [Google Scholar]
WHO/CDC 2007
- Joint World Health Organization/Centers for Disease Control and Prevention Technical Consultation on the Assessment of Iron Status at the Population Level (2004: Geneva, Switzerland). Assessing the iron status of populations: including literature reviews: report of a Joint World Health Organization/Centers for Disease Control and Prevention Technical Consultation on the Assessment of Iron Status at the Population Level, Geneva, Switzerland, 6-8 April 2004, 2nd ed. World Health Organization.. https://apps.who.int/iris/handle/10665/75368 2007;1(1):108 p.
WHO/FAO 2006
- World Health Organization, Food and Agricultural Organization of the United Nations. Guidelines on food fortification with micronutrients. Editors: Lindsay Allen, Bruno de Benoist, Omar Dary, Richard Hurrell. 2006. ISBN: 92 4 159401 2. Available from http://www.who.int/nutrition/publications/micronutrients/9241594012/en/.
Wieringa 2002
- Wieringa FT, Dijkhuizen MA, West CE, Northrop-Clewes CA, Muhilal. Estimation of the effect of the acute phase response on indicators of micronutrient status in Indonesian infants. Journal of Nutrition 2002;132(10):3061-6. [DOI] [PubMed] [Google Scholar]
Wirth 2012
- Wirth JP, Laillou A, Rohner F, Northrop-Clewes CA, Macdonald B, Moench-Pfanner R. Lessons learned from national food fortification projects: Experiences from Morocco, Uzbekistan and Vietnam. Food and Nutrition Bulletin 2012;33(4 Suppl):S281-92. [DOI] [PubMed] [Google Scholar]
Zimmermann 2005a
- Zimmermann MB, Molinari L, Staubli-Asobayire F, Hess SY, Chaouki N, Adou P, et al. Serum transferrin receptor and zinc protoporphyrin as indicators of iron status in African children. American Journal of Clinical Nutrition 2005;81(3):615-23. [DOI] [PubMed] [Google Scholar]
Zimmermann 2007
- Zimmermann MB, Hurrell RF. Nutritional iron deficiency. Lancet 2007;370(9586):511-20. [DOI] [PubMed] [Google Scholar]