

Summary
Excess visceral adiposity contributes to elevated cardiometabolic risk, and waist circumference is commonly used as a surrogate measure of visceral adipose tissue. Although regular aerobic exercise is known to improve abdominal obesity, its effect on waist circumference is unclear. A systematic review and meta‐analysis was performed to determine (1) the effect of aerobic exercise on waist circumference in adults with overweight or obesity; (2) the association between any change in waist circumference and change in visceral adipose tissue and/or bodyweight with aerobic exercise interventions; and (3) if reductions in waist circumference with exercise are moderated by clinical characteristics or components of aerobic exercise prescription. Twenty‐five randomized controlled trials (1686 participants) were included. Regular aerobic exercise significantly reduced waist circumference by 3.2 cm (95% confidence interval [CI] −3.86, −2.51, p ≤ 0.001) versus control. Change in waist circumference was associated with change in visceral adipose tissue (β = 4.02; 95% CI 1.37, 6.66, p = 0.004), and vigorous intensity produced superior reduction (−4.2 cm, 95% CI −4.99, −3.42, p < 0.0001) in waist circumference compared with moderate intensity (−2.50 cm, 95% CI −3.22, −1.79, p = 0.058). These findings suggest regular aerobic exercise results in modest reductions in waist circumference and associated visceral adipose tissue and that higher intensity exercise may offer superior benefit to moderate intensity.
Keywords: abdominal obesity, physical activity, visceral adiposity, weight loss
Abbreviations
- ACSM
American College of Sports Medicine
- AEx
aerobic exercise
- BW
bodyweight
- CON
control group
- CRF
cardiorespiratory fitness
- CT
computed tomography
- ESSA
Exercise and Sport Science Australia
- FITT
frequency, intensity, time, type
- GRADE
Grading of Recommendations, Assessment, Development and Evaluations
- HIIT
high‐intensity interval training
- HRmax
maximum heart rate
- HRpeak
peak heart rate
- HRR
heart rate reserve
- IL‐6
interleukin‐6
- METs
metabolic equivalents
- MOD
moderate intensity
- MRI
magnetic resonance imaging
- PRISMA
Preferred Reporting Items for Systematic Reviews and Meta‐analyses
- PROSPERO
International Prospective Register of Systematic Reviews
- RCT
randomized controlled trial
- REML
restricted maximum‐likelihood estimation
- REx
resistance exercise
- RMD
raw mean difference
- RoB
Risk of Bias
- RPE
rate of perceived exertion
- TNF‐α
tumor necrosis factor‐alpha
- VAT
visceral adipose tissue
- VIG
vigorous intensity
- VO2max
maximum oxygen uptake
- VO2peak
peak oxygen uptake
- WC
waist circumference
1. INTRODUCTION
Obesity is a threat to global population health, both in prevalence and in disease burden. Recent estimates suggest that over 2 billion people have overweight or obesity. 1 People with overweight or obesity have an elevated cardiovascular 2 , 3 and metabolic disease, 4 musculoskeletal, 5 , 6 , 7 and cancer risk profile. 8 , 9 , 10 However, evidence suggests that abdominal obesity, specifically excess adipose tissue stored around the viscera as visceral adipose tissue (VAT), is a stronger predictor of cardiovascular 11 and metabolic 12 morbidity and mortality than obesity. 13 Mechanisms proposed for the increased risk of morbidity and mortality include maladaptive changes to macrophages, reduced production of anti‐inflammatory adipokines (e.g., adiponectin), an increase in inflammatory cytokines (e.g., tumor necrosis factor‐alpha [TNF‐α] and interleukin‐6 [IL‐6]), and abnormal hypertrophy of adipocytes, all contributing to an inflammatory state. 14
Clinically, magnetic resonance imaging (MRI) and computed tomography (CT) imaging remain the most valid estimates of abdominal adiposity and VAT. 15 , 16 , 17 , 18 , 19 However, these imaging resources are rarely available to health professionals outside of research settings. Therefore, waist circumference (WC) is commonly used as a surrogate measure for VAT 20 , 21 and, as such, makes changes in inferred abdominal adiposity and VAT more feasible outcomes to monitor clinically.
Several treatment approaches exist to reduce bodyweight (BW) or VAT. Surgery 22 , 23 and pharmaceutical therapy 24 are considered suitable, particularly for individuals with morbid obesity and/or comorbidities. However, cost, healthcare coverage, 25 and safety concerns 26 are common barriers to their uptake. Evidence shows that lifestyle modification, through diet and/or exercise, is effective for reducing BW and VAT and is the first line of therapy for most people. 27
Current obesity management guidelines emphasize the importance of exercise volume (a function of the weekly frequency and exercise bout time) rather than intensity and recommend that a minimum of 250–300 min 28 , 29 and as much as 300–420 min 30 of moderate–vigorous aerobic exercise (AEx) needs to be accumulated each week for meaningful weight loss in adults. Several reviews suggest that a reduction in energy intake 31 and/or AEx 32 , 33 , 34 , 35 , 36 is associated with a decrease in VAT. 37 , 38 In a recent review, Neeland and colleagues estimated potential VAT reductions of ~15%–25%, when weight loss of ~5% is achieved via such lifestyle interventions. 39
In the absence of weight loss, a reduction of VAT through exercise alone also appears to be typical. The current evidence confirms that VAT reduction is generally achieved with regular AEx, 33 , 34 , 35 , 40 , 41 although the data concerning resistance exercise (REx) training are less conclusive. 34 , 35 , 41 , 42 , 43 Recent reviews also suggest that AEx of moderate or vigorous intensity appears efficacious for reducing VAT 41 , 44 and that there may also be positive effects of aerobic high‐intensity interval training (HIIT) interventions, 40 , 41 , 45 suggesting that intensity of AEx may be important in determining a VAT benefit. However, the evidence to support the use of HIIT for reducing WC appears positive but remains uncertain. 46 Further, WC is frequently measured as a secondary outcome in exercise intervention studies, yet consensus on the effect of regular AEx alone on WC for individuals who are overweight or obese is yet to be reached. 30 The components of exercise (frequency, intensity, time, type [FITT]) that are important for achieving WC reduction are also unclear. This leaves health professionals without clear understanding of which components are more important when prescribing AEx for individuals managing overweight or obesity, where reduction in abdominal adiposity (particularly VAT) is the goal.
Therefore, the aim of this systematic review was to determine (1) the effect of regular AEx on WC in adults with overweight or obesity; (2) the association between any change in WC and change in VAT and/or BW with exercise; and (3) if reductions in WC following exercise are moderated by clinical characteristics or components of AEx prescription.
2. METHODS
This review is reported in accordance with the Preferred Reporting Items for Systematic Reviews and Meta‐analyses (PRISMA) (2009) statement guidelines 47 and was registered via the International Prospective Register of Systematic Reviews (PROSPERO). Minor revisions were made to the initial PROSPERO protocol, submitted in December 2021, which were not available at the time of submission (see Supporting Information S1).
A systematic search of five online databases (Medline, Embase, Cochrane [via OvidSP], Scopus, and SPORTDiscus) was conducted from the earliest record until March 10, 2021. Search terms and MeSH headings relating to “obesity,” “aerobic exercise,” “weight loss,” “waist circumference,” and “visceral adiposity” were combined (see Supporting Information S2 for all search strategies used). Search results were compiled for duplicate removal using EndNote (Version X9.3.2, Thompson Reuters, San Francisco, CA), before importation into Covidence (v1636) for title/abstract screening. This systematic review was limited to randomized controlled trials (RCTs) in human adults, with no language restrictions. Reference lists of all included papers and relevant reviews were manually searched for potentially eligible studies.
2.1. Inclusion and exclusion criteria
2.1.1. Inclusion
Population
Adults (female and male: ≥18 years): overweight (Caucasian: body mass index [BMI] 25–29.9 kg/m2; Asian and South Asian: BMI ≥ 23–24.9 kg/m2) 48 or obese (Caucasian: BMI ≥ 30 kg/m2; Asian and South Asian: BMI ≥ 25 kg/m2). 48
Intervention/s
Studies were eligible for inclusion if they included an AEx only intervention of ≥8‐week duration. Interventions had to be structured, either supervised (i.e., research center and gym based) OR unsupervised (e.g., self‐directed).
Comparator
Comparator groups, at minimum, required an inactive OR unchanged activity‐level control group. Trials, including a specific dietary intervention (i.e., low carbohydrate), were only included if the diet was not given to the AEx and control groups (i.e., Diet and AEx vs. AEx vs. CON). However, studies attempting to standardize participant energy intake using an isocaloric diet were included. Control groups with sham/placebo exercise were also included, whereby the exercise stimulus provided was not sufficient to produce physiological changes.
Outcomes
For inclusion, studies must have included WC 20 and at least one direct measure of visceral adiposity, 49 that is, MRI 50 or CT. 51
2.1.2. Exclusion
Trials were excluded if participants were less than 18 years of age; had a BMI of “normal” weight (Caucasian: BMI 18.5–24.9 kg/m2 or Asian and South Asian: BMI 18.5–22.9 kg/m2) 48 or “underweight” (Caucasian: BMI < 18.5 kg/m2 or Asian and South Asian: BMI < 18.5 kg/m2) 48 ; were allocated to a REx alone OR combined AEx and REx exercise intervention, where there was no “AEx” only AND “CON” group; or were receiving a structured dietary intervention for the duration of the study for purpose of an alternative intervention group (i.e., “diet” vs. “AEx”). Studies where participants received “diet” versus “diet + AEx” intervention; a surgical intervention (i.e., bariatric surgery); or drug therapy (including supplementation) as part of an intervention group were also excluded. Studies were not excluded if participants were taking pre‐prescribed medication, unless it was known to interfere in one of the primary outcomes (i.e., anti‐retroviral drugs).
2.2. Study selection
The initial search was completed by one reviewer (AA). Duplicate removal was completed independently by two researchers (AA and KJR). Title/abstract and full‐text screening were conducted independently by one reviewer (AA). Uncertainty or disagreement during the study screening and selection process was resolved by discussion with a second (SEK) and third (NAJ) reviewer.
2.3. Data extraction
Two researchers (AA and KJR) independently completed data extraction on pre‐designed templates. Data retrieved from each study included participant characteristics (sex, age, baseline BMI, and comorbidities); exercise intervention prescription (frequency, intensity, time, modality, and intervention duration); and WC, visceral adiposity, and BW. Raw numerical data collected from each study were presented as mean, standard deviation (SD), and change scores from pre‐ and post‐intervention. Where values were presented as standard error of the mean, confidence intervals (CIs), or interquartiles, they were converted the data to SD. Where studies contained additional intervention arm that were not included (i.e., REx), only relevant group data were extracted. Two researchers (AA and NAJ) attempted to contact authors via email for missing data.
2.4. Risk of Bias and GRADE assessment
The Cochrane Collaboration's Risk of Bias 2 52 (RoB2) was completed independently in a blinded manner by two reviewers (AA and AS), with discrepancies reviewed by a third (SEK). Studies were graded as having “low,” “some concerns,” or “high” for risk of bias across five domains (randomization, deviations from intervention, missing data, outcome measurement, and selection of reported result), after which an overall bias recommendation was generated by the Risk of Bias Excel tool.
The Grading of Recommendations, Assessment, Development and Evaluations (GRADE) 53 was completed by one reviewer (AA) and reviewed by a second (SEK). A GRADE score was provided based on criteria of certainty (number of studies, study design, risk of bias, inconsistency, indirectness, imprecision, and other considerations) and summary of findings (number of patients, effect, and certainty). The GRADE assessment was conducted in accordance with the GRADE Handbook. 54
2.5. Effect size calculation
Raw mean difference (RMD) values were extracted where reported or when data were provided by authors. Otherwise, the RMD was calculated by subtracting the mean change in the comparator group (CON) from the mean change in the experimental condition (AEx). Standardized effect sizes for VAT were calculated by dividing the RMD by the pooled SD at baseline 55 , 56 and then corrected for small sample bias (Hedges' g).
Data from McTiernan et al. (2007), where male and female data were reported separately, were combined. Where studies used numerous re‐test time‐points 57 , 58 during the intervention, data from the later time‐point were used for the analysis. No studies used a follow‐up and/or maintenance period, post‐intervention. For analysis, the VIG–MOD intervention group from Zhang et al. (2016) 57 was classified as MOD intensity, using the average exercise intervention intensity, and coded using the American College of Sports Medicine (ACSM) guidelines. 29
2.6. Meta‐analysis
A random effects meta‐analysis was conducted in R (Version 4.1.1., The R Foundation for Statistical Computing, 2004–2021), using the metafor package (Version 3.0‐2). There were 10 studies that included multiple intervention groups compared with one control group. 58 , 59 , 60 , 61 , 62 , 63 , 64 , 65 , 66 , 67 Because the same participants in the control group are compared, sampling errors are dependent and thus violate the assumption of independent effects. Thus, a multilevel meta‐analysis was performed with the rma.mv function, with the insertion of a random argument to group effect sizes within levels of a nesting variable (i.e., multiple effects within a study). Effects from the same level/study receive the same random effect, whereas effects from different levels/studies are assumed to be independent. A mixed effects analysis then performed to model clustering or correlation that occurs within a level of the nesting variable. A restricted maximum‐likelihood estimation (REML) was used, and a “t” test was specified.
For the primary analysis, we compared the effect of AEx versus CON on WC, analyzed using the RMD, with variance estimated from the pooled SD. When the SDs of change scores were not reported, these were calculated using reported SE, 95% CI, or p‐values or calculated using pre and post SDs using a correlation of 0.97 (estimated from studies where all SDs were available). Heterogeneity was assessed using Q statistic and I 2. The I 2 describes the percentage of variability due to heterogeneity across studies rather than sampling error (chance). Magnitude of heterogeneity was interpreted in accordance with recommendations from the Cochrane handbook. 68 The multilevel method allows for the estimation of heterogeneity at three levels: (1) at the participant level, (2) within studies, and (3) between studies. Publication bias was evaluated using a visual assessment of funnel plots (see Supporting Information S3 and S4). Consequentially, no studies were removed from the analysis. A p‐value of <0.05 was considered statistically significant.
2.7. Moderator analysis
Potential moderators were selected a priori based on empirical or logical rationale as to why they may moderate the effect of exercise on WC. Baseline age (years), BMI (kg/m2), and cardiorespiratory fitness (CRF) (ml/kg/min) were entered as continuous variables. The moderating effect of sex was investigated as a binary variable in 14 studies that recruited women (n = 9) 61 , 63 , 66 , 67 , 69 , 70 , 71 , 72 , 73 , 74 or men (n = 4) 59 , 75 , 76 , 77 only. To investigate intervention characteristics, intensity was coded as “moderate” or “vigorous” according to the ACSM guidelines 29 using the intensity during the final week of training. Frequency was entered in days per week, whereas weekly total volume was calculated as the intended volume in the final week (final week frequency × session duration). Intervention duration was calculated in weeks, where any interventions reported in months were converted on the assumption that 1 month = 4 weeks. The moderating effects for change in BW (RMD) and change in VAT (standardized mean difference) were analyzed in univariable meta‐regression models. For the moderator analysis of “change in VAT,” L4/L5 VAT was used for data from Heydari et al. (2012), 75 and for Ross et al. (2004), 73 VAT area (cm2) was used instead of volume.
VAT data were extracted from Lee et al. 66 using webplotdigitizer, whereas RMD for Jung et al. (2014) 71 was calculated using the reported percentage change. BW data were reported as median and interquartile range in one study, 69 which was excluded from BW calculations. Data from Blond et al. 58 were excluded from the calculation of SMD, as baseline SDs were not available. Data from Ross et al. (2000) 77 and Ross et al. (2004) 73 exercise‐induced weight loss groups were used for analysis.
2.8. Subgroup analyses
Due to a significant moderating effect of exercise intensity, two subgroup analyses were performed post hoc. First, the weighted mean difference for moderate and vigorous intensities was calculated as described above. Finally, where studies allowed for a direct comparison between moderate and vigorous intensities, a meta‐analysis was performed to test for a direct effect of exercise intensity on WC.
3. RESULTS
3.1. Included studies
See Supprting Information S5 for the PRISMA flow chart. Once duplicates were removed, and all screening completed, 17 studies remained. An additional eight studies 63 , 66 , 69 , 74 , 78 , 79 , 80 , 81 were sourced from other reviews, taking the total to 25 RCTs. Two initially included studies 82 , 83 were excluded during data extraction, as we did not receive a response from the authors regarding missing data required for the primary outcome (WC). One other study 84 was excluded as it was a sub‐study of one of the included studies, 79 where the primary and secondary outcomes were previously reported.
3.2. Risk of Bias
See Figure S1 for overall summary and Figure S3 for individual studies of RoB2. High risk of bias was present across numerous studies due to a lack of blinding assessors to group allocation for the primary outcome (WC). There were some concerns of bias regarding details of randomization missing for numerous studies and a lack of detail around prior planned statistical analysis.
3.3. GRADE assessment
See Figure 1 for summary of GRADE recommendations. [Correction added on 3 June 2022, after first online publication: The figure number citation in the preceding sentence was updated from ‘S5’ to ‘1’.] Overall, we graded the evidence with “low” certainty. Reasons for downgrading the certainty were based on a “serious” for risk of bias (multiple studies providing allocation concealment and lack of blinding to the primary WC outcome), inconsistency (high heterogeneity present [>75%] 54 in the primary and sub‐set analysis and variation in patient clinical characteristics), and imprecision (small sample sizes [total n ≤ 300] in most individual studies, and some individual studies had CIs overlapping line of “no effect” and/or wide CIs).
FIGURE 1.
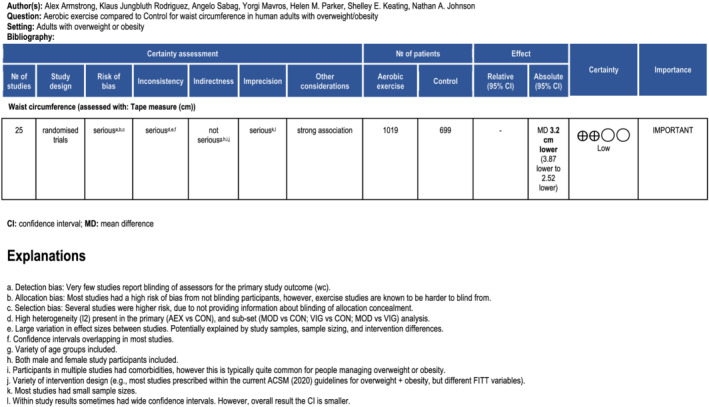
Figure 1 Summary of GRADE recommendations [Correction added on 3 June 2022, after first online publication: Figure 1 has been moved earlier in the article and has a new caption.]
3.4. Participant characteristics
A summary of participant characteristics is detailed in Table 1. Across all 25 studies, 1686 participants were recruited (AEx groups = 1019; CON = 699). Ten studies exclusively recruited females, 61 , 63 , 66 , 67 , 69 , 70 , 71 , 72 , 73 , 74 another four studies only recruited males, 59 , 75 , 76 , 77 and the remaining 11 studies recruited a combination of females and males. 57 , 58 , 60 , 62 , 64 , 65 , 78 , 79 , 80 , 81 , 85 Eight studies 57 , 63 , 66 , 67 , 69 , 71 , 72 , 74 specifically recruited participants of Asian ethnicities. Thirteen studies recruited otherwise apparently healthy participants with abdominal obesity. 58 , 60 , 65 , 66 , 67 , 70 , 72 , 73 , 75 , 76 , 78 , 80 , 85 Twelve studies recruited participants with existing comorbidities of type 2 diabetes, 63 , 64 , 69 , 71 , 74 , 81 non‐alcoholic fatty liver disease, 57 , 79 metabolic syndrome, 61 , 62 non‐dialyzed chronic kidney disease, 59 and hyperlipidemia. 77
TABLE 1.
Participant characteristics
| Study | Participants | Sample (n) | Sex (F/M) | Age (mean ± SD) | BMI (kg/m2) (mean ± SD) |
|---|---|---|---|---|---|
| Baria 2014 | Men; non‐dialyzed chronic kidney disease (Stages 3 and 4) and overweight | MODA: 10 | MODA: 0/10 | MODA: 52.1 ± 11.4 | MODA: 30.8 ± 5.1 |
| MODB: 8 | MODB: 0/8 | MODB: 50.8 ± 7.7 | MODB: 30.9 ± 3.9 | ||
| CON: 9 | CON: 0/9 | CON: 53.4 ± 9.6 | CON: 29.6 ± 1.9 | ||
| Blond 2019 | Adults; healthy, physically inactive, overweight, or obese | CON: 14 | CON: 6/8 | CON: 35 ± 7 | CON: 30.1 ± 2.9 |
| MOD: 31 | MOD: 14/17 | MOD: 32 ± 7 | MOD: 29.1 ± 2.0 | ||
| VIG: 24 | VIG: 12/12 | VIG: 36 ± 7 | VIG: 29.8 ± 2.5 | ||
| Choi 2012 | Asian women; sedentary, type 2 diabetes | MOD: 38 | MOD: 38/0 | MOD: 53.8 ± 7.2 | Total: 26.8 ± 2.4 a |
| CON: 37 | CON: 37/0 | CON: 55.0 ± 6.0 | |||
| Cowan 2018 | Adults; abdominal obesity, sedentary | MODC: 24 | MODC: 14/10 | MODC: 52.5 ± 8.0 | MODC: 33.2 ± 4.3 |
| MODD: 31 | MODD: 20/11 | MODD: 51.8 ± 8.3 | MODD: 32.6 ± 4.1 | ||
| VIG: 30 | VIG: 19/11 | VIG: 52.8 ± 7.4 | VIG: 32.5 ± 3.7 | ||
| CON: 20 | CON: 10/10 | CON: 55.1 ± 6.6 | CON: 30.5 ± 3.6 | ||
| DiPietro 1998 | Healthy; older adults | MOD: 9 | MOD: 7/2 | MOD: 72 ± 3 | MOD: 27.5 ± 8.1 |
| CON: 7 | CON: 6/1 | CON: 73 ± 5.3 | CON: 26.8 ± 4.5 | ||
| Friedenreich 2011 | Women; post‐menopause, sedentary, weight range: normal to obese | VIG: 155 | VIG: 155/0 | VIG: 61.2 ± 5.4 | VIG: 29.1 ± 4.5 |
| CON: 156 | CON: 156/0 | CON: 60.6 ± 5.7 | CON: 29.2 ± 4.3 | ||
| Heydari 2012 | Young men; inactive, overweight | HIIT: 20 | HIIT: 0/20 | HIIT: 24.7 ± 24 | HIIT: 28.4 ± 2.5 |
| CON: 18 | CON: 0/18 | CON: 25.1 ± 17.9 | CON: 29 ± 4.1 | ||
| Irving 2008 | Middle‐aged women; obese, metabolic syndrome, sedentary | CON: 7 | CON: 7/0 | Total sample: 51 ± 9 | CON: 32.7 ± 3.8 |
| MOD: 11 | MOD: 11/0 | MOD: 34.7 ± 7.5 | |||
| VIG: 9 | VIG: 9/0 | VIG: 34.7 ± 6.8 | |||
| Irving 2009 | Middle‐aged adults; sedentary, obese, metabolic syndrome | CON: 10 | CON: 6/4 | CON: 49.2 ± 15.2 | CON: 32.0 ± 3.5 |
| MOD: 13 | MOD: 10/3 | MOD: 49.2 ± 6.5 | MOD: 35.5 ± 7.9 | ||
| VIG: 11 | VIG: 8/3 | VIG: 49.0 ± 9.6 | VIG: 34.2 ± 6.0 | ||
| Jung 2012 | Overweight women; type 2 diabetes | CON: 12 | CON: 12/0 | CON: 55.5 ± 7.6 | CON: 27.7 ± 3.4 a |
| MOD: 8 | MOD: 8/0 | MOD: 56.8 ± 8.2 | MOD: 25.5 ± 1.5 a | ||
| VIG: 8 | VIG: 8/0 | VIG: 48.4 ± 6.1 | VIG: 25.9 ± 1.6 a | ||
| Jung 2014 | Obese women; type 2 diabetes | MOD: 17 | MOD: 17/0 | MOD: 55.4 ± 3.5 | MOD: 26.0 ± 1.5 a |
| CON: 18 | CON: 18/0 | CON: 57.6 ± 3.5 | CON: 27.2 ± 2.1 a | ||
| Karstoft 2013 | Adults; type 2 diabetes | CON: 8 | CON: 3/5 | CON: 57.1 ± 8.5 | CON: 29.7 ± 5.4 |
| MOD: 12 | MOD: 4/8 | MOD: 60.8 ± 7.6 | MOD: 29.9 ± 5.5 | ||
| HIIT: 12 | HIIT: 5/7 | HIIT: 57.5 ± 8.3 | HIIT: 29.0 ± 4.5 | ||
| Keating 2015 | Adults; sedentary, overweight or obese | CON: 12 | CON: 9/3 | CON: 39.1 ± 10.0 | CON: 32.2 ± 4.8 |
| VIG: 12 | VIG: 6/6 | VIG: 44.2 ± 9.7 | VIG: 36.3 ± 5.9 | ||
| MODE: 12 | MODE: 7/5 | MODE: 45.5 ± 8.0 | MODE: 33.9 ± 3.1 | ||
| MODF: 12 | MODF: 9/3 | MODF: 45.6 ± 12.5 | MODF: 31.3 ± 2.8 | ||
| Ku 2010 | Overweight Korean women with type 2 diabetes | CON: 16 | CON: 16/0 | CON: 57.8 ± 8.1 | CON: 27.4 ± 2.8 |
| MOD: 15 | MOD: 15/0 | MOD: 55.7 ± 7.0 | MOD: 27.1 ± 2.4 | ||
| Lee 2012 | Adults; Korean women, middle‐aged, “healthy,” pre‐menopausal, overweight, or obese, untrained | CON: 7 | CON: 7/0 | CON: 38.3 ± 4.9 | CON: 27.3 ± 2.7 a |
| MOD: 8 | MOD: 8/0 | MOD: 41.6 ± 4.5 | MOD: 27.4 ± 2.7 a | ||
| VIG: 7 | VIG: 7/0 | VIG: 41.7 ± 4.3 | VIG: 25.4 ± 2.7 a | ||
| Lesser 2016 | Women; post‐menopause, inactive, abdominal obesity | CON: 26 | CON: 26/0 | CON: 57.7 ± 6.1 | CON: 28.9 ± 3.5 a |
| VIG: 23 | VIG: 23/0 | VIG: 56.4 ± 6.9 | VIG: 29.9 ± 3.5 a | ||
| McTiernan 2007 | Adults; sedentary | VIG: 100 | VIG: 49/51 | VIG: 54.4 ± 7.1 (F); 56.2 ± 6.7 (M) | VIG: 28.9 ± 5.5 (F); 29.7 ± 3.7 (M) |
| CON: 102 | CON: 51/51 | ||||
| CON: 53.7 ± 5.6 (F); 56.6 ± 7.6 (M) | CON: 28.5 ± 4.8 (F); 30.1 ± 4.8 (M) | ||||
| Moghadasi 2012 | Middle‐age men; sedentary; overweight or obese | VIG: 8 | VIG: 0/8 | Total sample: 41.18 ± 6.1 | VIG: 30.96 ± 2.1 |
| CON: 8 | CON: 0/8 | CON: 32.03 ± 53 | |||
| Pugh 2014 | Adults; obese; sedentary; NAFLD | VIG: 13 | VIG: 6/7 | VIG: 48 (44, 51) b | VIG: 31 (30, 32) b |
| CON: 8 | CON: 4/4 | CON: 47 (43, 51) b | CON: 30 (28, 31) b | ||
| Ross 2000 | Men; obese; hyperlipidemia | VIG: 14 | VIG: 0/14 | VIG: 44.7 ± 7.6 | VIG: 31.3 ± 2.3 |
| CON: 8 | CON: 0/8 | CON: 46.0 ± 10.9 | CON: 30.7 ± 1.6 | ||
| Ross 2004 | Women; menopause | VIG: 12 | VIG: 12/0 | VIG: 41.3 ± 7.2 | VIG: 32.9 ± 3.2 |
| CON: 10 | CON: 10/0 | CON: 43.7 ± 6.4 | CON: 32.4 ± 2.8 | ||
| Short 2003 | Adults; healthy; sedentary | VIG: 41 | VIG: 41 | VIG: NR as group mean | VIG: 26.6 ± 2.4 |
| CON: 38 | CON: 38 | CON: NR as group mean | CON: 25.7 ± 1.8 | ||
| Sigal 2007 | Adults; type 2 diabetes, inactive | MOD: 60 | MOD: 21/39 | MOD: 53.9 ± 6.6 | MOD: 35.6 ± 10.1 |
| CON: 63 | CON: 22/41 | CON: 54.8 ± 7.2 | CON: 35.0 ± 9.5 | ||
| Zhang 2015 | Women; overweight | HIIT: 12 | HIIT: 12/0 | HIIT: 21.0 ± 1.0 | HIIT: 25.8 ± 2.7 a |
| MOD: 12 | MOD: 12/0 | MOD: 20.6 ± 1.2 | MOD: 26.0 ± 1.6 a | ||
| CON: 11 | CON: 11/0 | CON: 20.9 ± 1.0 | CON: 25.4 ± 1.5 a | ||
| Zhang 2016 | Adults; NAFLD, central obesity | MOD: 73 | MOD: 51/22 | MOD: 54.4 ± 7.4 | MOD: 28.1 ± 3.3 a |
| VIG–MOD: 73 | VIG–MOD: 52/21 | VIG–MOD: 53.2 ± 7.1 | VIG–MOD: 27.9 ± 2.7 | ||
| CON: 74 | CON: 46/28 | CON: 54.0 ± 6.8 | CON: 28.0 ± 2.7 a |
Abbreviations: BMI, body mass index; CON, control group; F, female; HIIT, high‐intensity interval training group; M, male; MOD, moderate intensity group; NAFLD, non‐alcoholic fatty liver disease; SD, standard deviation; VIG, vigorous intensity group.
BMI (Asian ethnicities): overweight = 23.0–24.9; obese ≥ 25.0.
BMI (Caucasian): overweight = 25.0–29.9; obese ≥ 30.0.
3.5. Exercise characteristics
See Table 2 for a detailed summary of exercise intervention characteristics.
TABLE 2.
Exercise intervention characteristics
| Study | Intervention duration | Modality | Intensity | Frequency (days/week) | Session time (min) | Control | Exercise adherence (%) |
|---|---|---|---|---|---|---|---|
| Baria 2014 | 12 weeks |
MODA: Treadmill MODB: At home, backyard, or street locations. Guidance from EP |
MODA: VT (~40%–60% VO2max) MODB: VT (~40%–60% VO2max) Progressed monthly by EP |
3 (alternate days) |
MODA, B WU: 5 Ex: 30 initially, ↑ by 10 every 4 weeks CD: 5 |
Complete no physical activity | NR |
| Blond 2019 | 6 months | MOD and VIG: Varied gym equipment |
Weekly EE (all groups): 1600 kcal (F) 2100 kcal (M) MOD: 50% VO2peak‐reserve VIG: 70% VO2peak‐reserve |
2 initially, ↑ to 5 |
MOD and VIG: Varied on time to achieve daily EE: 320 kcal (F) 420 kcal (M) |
Maintain sedentary lifestyle |
0–3 months MOD: 100 VIG: 102 0–6 months MOD: 94 VIG: 92 |
| Choi 2012 | 12 weeks | Walking | MOD: Moderate exercise capacity (3.6–6.0 METs) | 5 | MOD: 60 | Maintain usual activities | NR |
| Cowan 2018 | 24 weeks | Treadmill: Walk and/or jog |
MODC: 50% VO2peak 180 kcal (F); 300 kcal (M) MODD: 50% VO2peak 360 kcal (F); 600 kcal (M) VIG: 75% VO2peak 360 kcal (F); 600 kcal (M) |
5 | All training groups: Time to reach EE goal |
No exercise All groups: Maintain induction period energy intake |
MODC: 88.1 ± 17.8 MODD: 95.1 ± 5.1 VIG: 92.3 ± 7.4 |
| DiPietro 1998 | 4 months | MOD: Mini trampoline |
MOD: Trampoline walking: Initially 55% HRmax, ↑ to 60% HRmax Trampoline running: 75% HRmax from Week 8 onward |
4 |
MOD: WU: 5 Initially 20–30, ↑ to 40, then 50 |
Sessions of stretching, yoga, and stretch band exercises. Continue lifestyle habits | NR |
| Friedenreich 2011 | 1 year |
VIG: Individualized: Facility‐based (FB)/home‐based (HB) |
VIG: 50%–60% HRR (0–3 months), then ↑ 70%–80% HRR |
5 (3FB/2HB days) |
WU: 5 Ex: Initially 15–20, ↑ to 45 CD: 5–10 |
Maintain usual lifestyle All groups: Usual diet |
NR |
| Heydari 2012 | 12 weeks | HIIT: Cycle ergometer |
HIIT: 8‐s work/12‐s recovery Work: 80%–90% HRpeak @ 120–130 RPM Recovery: 40 RPM at same resistance |
3 |
WU: 5 HIIT: 20 CD: 5 |
No exercise All groups: Usual eating habits |
NR |
| Irving 2008 | 16 weeks | MOD and VIG: Walking/running |
MOD: ≤LT (RPE ~ 10–12) VIG: <LT (2/7 days) RPE ~ 10–12; between LT and VO2peak (3/7 days) RPE ~ 15–17 |
3, ↑ to 5 (Week 5) |
MOD and VIG: All individualized. Weeks 1–2: 300 kcal per session (3/7 days) Weeks 3–4: 350 kcal per session (4/7 days) Weeks 5–16: 400 kcal (5/7 days) |
Maintain current physical activity |
MOD: 79.3 ± 3 VIG: 83 ± 3 |
| Irving 2009 | 16 weeks | MOD and VIG: Walking/running |
MOD: ≤LT (RPE ~ 10–12) VIG: <LT (2/7 days) RPE ~ 10–12; between LT and VO2peak (3/7 days) RPE ~ 15–17 |
3, ↑ to 5 (Week 5) |
MOD and VIG: Weeks 1–2: 300 kcal per session (3/7 days) Weeks 3–4: 350 kcal per session (4/7 days) Weeks 5–16: 400 kcal (5/7 days) |
Maintain current physical activity |
MOD: 76 ± 3 VIG: 83 ± 3 |
| Jung 2012 | 12 weeks | NR |
MOD: 3.5–5.2 METs VIG: >5.3 METs |
5 |
MOD: 60 VIG: 30 |
Did not participate in exercise program and education | NR |
| Jung 2014 | 12 weeks | MOD: Walking | MOD: 3.6–5.2 METs (~500 kcal/day) | 3 | MOD: 60 |
No exercise programs All groups: 1× dietary education program at start |
NR |
| Karstoft 2013 | 4 months | MOD and HIIT: Walking |
MOD: >55% EEpeak HIIT: ≥5× sets of 3‐min fast walking @ >70% EEpeak/3‐min slow walking @ <70% EEpeak |
5 |
MOD: 60 HIIT: 60 |
Continue lifestyle habits |
MOD: 94 ± 6 HIIT: 85 ± 4 |
| Keating 2015 | 8 weeks | All: Cycle erg (C) + brisk walk (W) |
MODE: 50% VO2peak VIG: 60%–70% VO2peak MODF: 50% VO2peak |
3C/1WE 2C/1W 2C/1WF |
MODE: 45, ↑ to 60 (Week 3) VIG: 30, ↑ to 45 (Week 3) MODF: 30, ↑ to 45 (Week 3) |
Stretching, massage, fit ball 1/14 supervised sessions (new exercises, 5‐min cycling @ 30 W) |
MODE: 90 VIG: 94 MODF: 96 CON: 82 |
| Ku 2010 | 12 weeks | MOD: Walking | MOD: 3.6–5.2 METs | 5 | MOD: 60 | Diabetes education. Maintain sedentary lifestyle | NR |
| Lee 2012 | 14 weeks | MOD and VIG: Running |
MOD: 50% VO2max VIG: 70% VO2max |
3, ↑5 |
Based on individual VO2max, and EE: MOD and VIG: 13.5 METs/h/week (Weeks 1–4) 18 METs/h/week (Weeks 5–9) 22.5 METs/h/week (Weeks 10–14) |
No exercise All groups: Maintain diet and lifestyle habits |
NR |
| Lesser 2016 | 12 weeks | VIG: Treadmill, cycle | VIG: 55% HRmax, ↑ 10% every 3 weeks (max. 85% HRmax) | 3 |
WU: 10 Ex: 40 CD: 10 |
Maintain physical activity and diet |
67 ± 25 |
| McTiernan 2007 | 12 months |
VIG: Facility‐based (FB): Treadmill, cycle, elliptical, rower Home‐based (HB): NR |
VIG: 60%–85% HRmax | 3FB + 3HB |
VIG: WU: 5–10 Ex: 60 CD: 5–10 |
Maintain exercise or diet habits |
80% adherence + 360 min/week goal: 71% |
| Moghadasi 2012 | 12 weeks | VIG: Treadmill | VIG: HR corresponding to 75%–80% VO2max | 4 | VIG: 45 | Maintain normal diet and physical activity habits | NR |
| Pugh 2014 | 16 weeks | VIG: Treadmill and cycle ergometer |
VIG: Weeks 1–4: 30% HRR Weeks 4–8: 45% HRR Weeks 8–12: 45% HRR Weeks 12–16: 60% HRR |
3, ↑5 (Week 12) |
VIG: Weeks 1–4: 30 Weeks 4–8: 30 Weeks 8–12: 45 Weeks 12–16: 45 |
Lifestyle advice from clinic nurse or hepatologist to modify lifestyle | 92 |
| Ross 2000 | 3 months | VIG: Walking or jogging | VIG: ≤70% VO2peak (~80% HRmax) | 7 |
VIG: Time to expend 700 kcal |
Maintain bodyweight All exercise: Maintain baseline period energy intake |
98 |
| Ross 2004 | 14 weeks | VIG: Walking or light jogging (motorized treadmill) | VIG: ~80% HRmax | 7 |
VIG: Time to expend 500 kcal |
Maintain bodyweight All groups: Maintain baseline period energy intake |
96 |
| Short 2003 | 16 weeks | VIG: Stationary bike | VIG: Initially 70% HRmax, ↑ to 80% HRmax (final month) | 3, ↑4 | VIG: Initially 20, ↑ to 40 (final month) |
Flexibility exercises, maintain lifestyle All groups: Maintain bodyweight |
Session and workload compliance: >90 |
| Sigal 2007 | 22 weeks | MOD: Treadmills or bicycle ergometers | MOD: Initially 60% HRmax, ↑ 75% HRmax | 3 | MOD: Initially 15–20, ↑ 45 | Asked to revert to pre‐study activity levels | 80 (interquartile range, 46% to 93%) |
| Zhang 2015 | 12 weeks |
HIIT: Treadmill running (W)/walking (R) MOD: Treadmill running |
HIIT: 4 min @ 85%–95% HRpeak 3 min @ 50%–60% HRpeak 7‐min rest MOD: 60%–70% HRpeak |
4 |
Both WU: 10 CD: 5 HIIT: 4× (W) 4 min/(R) 3 min MOD: ~33 |
No training All groups: Maintain daily activity and diet habits |
HIIT: 94 ± 3 MOD: 90 ± 2 |
| Zhang 2016 | 12 months |
MOD: Brisk walking VIG–MOD: Treadmill jogging |
MOD: 45%–55% HRmax (3.0–6.0 METs) VIG–MOD: 1st 6 months @ 65%–80% HRmax (8.0–10.0 METs), then same as MOD group |
5 |
MOD: 30 VIG–MOD: 30 |
Maintain physical activity habits All groups: Maintain diet habits |
At least 80% adherence: MOD: 97.1 (6 months) 95.7 (12 months) |
Abbreviations: CD, cool down; CON, control; EE, energy expenditure; F, female; HIIT, high‐intensity interval training; HRmax, heart rate maximum; HRpeak, heart rate peak; HRR, heart rate reserve; LT, lactate threshold; M, male; METs, metabolic equivalents; MOD, moderate intensity; NR, not reported; R, rest; RPE, rate of perceived exertion; VIG, vigorous intensity; W, work; WU, warm up.
Exercise frequency varied from 3 to 7 days, with the 5 being the most commonly used (7/25 studies). Six studies 58 , 61 , 62 , 66 , 79 , 80 progressed the exercise frequency throughout the intervention (e.g., completed 3 days initially and progressively increased to 5 days by the end of the intervention). One study 65 had two different frequencies across three intervention arms (e.g., used 3 days/week in two intervention groups and 4 days in another). Overall, intensity measures were highly heterogeneous, using percentage of maximum oxygen uptake (%VO2max), %VO2peak‐reserve, percentage of peak oxygen uptake (%VO2peak), metabolic equivalents (METs), percentage of maximum heart rate (%HRmax), %heart rate reserve (HRR), %heart rate peak (HRpeak), and rate of perceived exertion (RPE). %HRmax (9/25 studies), METs (5/25 studies), and %VO2max (3/25 studies) were the most commonly used units to prescribe exercise intensity. Three studies used energy expenditure alone to prescribe exercise volume. 58 , 60 , 64 Across the 25 included studies, there were 19 “moderate” and 15 “vigorous” intensity AEx groups, 29 with another 3 studies including HIIT protocols. 64 , 67 , 75 Exercise intensities prescribed ranged from 40% to 80% VO2max, 50% to 70% VO2peak‐reserve, 50% to 75% VO2peak, 3.6 to 6.0 METs, 55% to 85% HRmax, 50% to 80% HRR, 10 to 17 RPE, and 50% to 95% HRpeak. Walking, treadmill (walking, jogging, or running), and cycle ergometry were the most common exercise modalities. Using final week exercise prescription, only five 63 , 64 , 69 , 74 , 85 of the 24 studies complied with current (ACSM) 29 and Exercise and Sport Science Australia's (ESSA) 30 recommendations for weekly exercise volume for overweight and obesity.
Prescription for exercise duration ranged from 15 to 60 min (excluding warm‐up and cool‐down). The most common exercise session durations were 45 min 65 , 70 , 76 , 79 , 81 and 60 min. 63 , 64 , 65 , 69 , 71 , 74 , 85 The most frequent intervention length was 3 months (10/24 studies), followed by 4 months (6/25 studies), 12 months (3/25 studies), and 6 and 3.5 months (2/25 studies each). The majority of AEx groups in the included studies were supervised. Exercise adherence was reported in 15/25 studies, with 14 studies reporting an average of >85% adherence. 57 , 58 , 60 , 61 , 64 , 65 , 67 , 73 , 77 , 79 , 80 Nine studies did not report exercise adherence. 59 , 63 , 66 , 69 , 70 , 71 , 75 , 76 , 78
3.6. Effect of AEx versus CON on WC
See Figure 2 for a summary of the effect of AEx versus CON on WC. Data from all 25 studies (38 comparisons) were available. [Correction added on 3 June 2022, after first online publication: The figure number citation in the preceding sentence was updated from ‘1’ to ‘2’.] Pooled analysis found a mean reduction of 3.2 cm (95% CI −3.87, −2.51, t = −9.5, p ≤ 0.0001) from AEx compared with CON. The upper bound 95% CI of −2.51 cm suggests the data are compatible with a range of effects that represent a clinically meaningful reduction in WC. 86 , 87 However, high heterogeneity was present (Q [37] = 348, p < 0.0001 and I 2 = 92.4%), with 62.7% of heterogeneity coming from within the study clusters (Level 2), and 29.5% from between the study clusters (Level 3).
FIGURE 2.
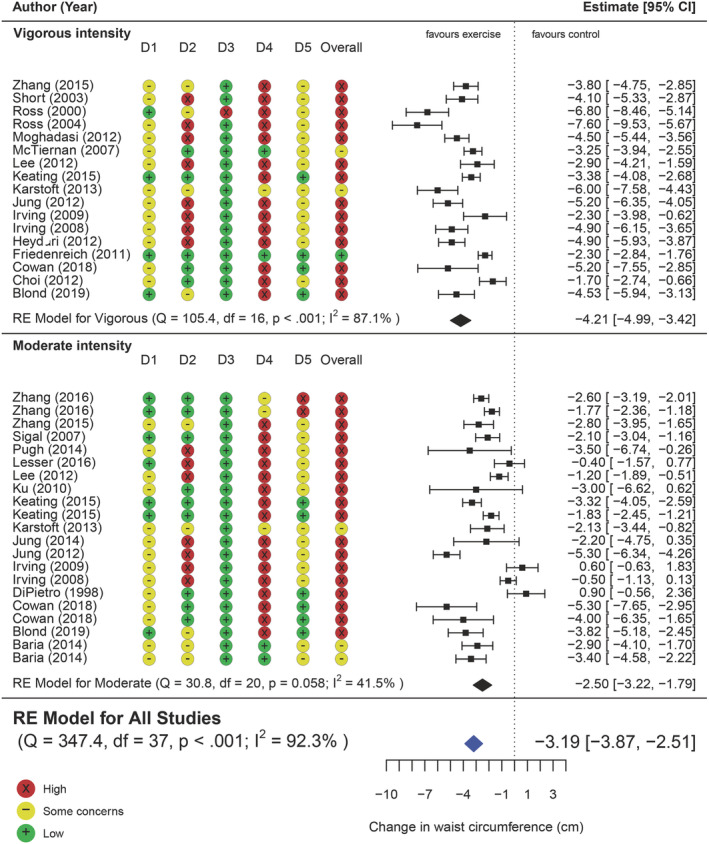
Forest plot of the pooled effect of AEx versus CON on WC, including subgroup analysis of moderate intensity versus control and vigorous intensity versus control; D1: Randomization, D2: Deviation for intended interventions, D3: Missing outcome data, D4: Measurement of the outcome, D5: Selection of reported result [Correction added on 3 June 2022, after first online publication: A new image for Figure 2 has been inserted earlier in the article and the caption originally published with Figure 1 is being used with this new Figure 2 image.]
3.7. Moderator analysis
There was a significant moderating effect of change in VAT (k = 36, β = 4.02, 95% CI 1.37, 6.66, p = 0.004) (Figure S2B) and change in BW (k = 37, β = 0.7 kg, 95% CI 0.38, 1.04, p = 0.0001) (Figure S2A) on change in WC, whereby reductions in BW and VAT were associated with a reduction in WC.
Exercise intensity was a significant moderator for WC change, where vigorous intensity interventions led to greater reduction in WC compared with moderate intensity (k = 38, β = −1.86 cm, 95% CI −2.73, −1.00, F [1, 36] = 19.10, p = 0.0001). Exercise frequency also had a moderating effect on WC (k = 38, β = −0.68 cm, 95% CI −1.30, −0.06, p = 0.03), whereby every extra day of exercise per week was associated with a 0.68‐cm greater reduction in WC. However, there was no moderating effect on WC from weekly exercise volume (k = 25, β = −0.002 cm, 95% CI −0.012, 0.006, p = 0.586) or intervention duration (k = 38, β = 0.01 cm, 95% CI −0.04, 0.06, p = 0.60).
Age had a moderating effect on change in WC (k = 36, β = 0.06, 95% CI −0.0002, 0.12, p = 0.05), such that for every 10 years of age older is associated with an attenuated response (0.6 cm). Similarly, baseline CRF also had a moderating effect on change in WC (k = 26, β = −0.1, 95% CI −0.21, 0.0005, p = 0.04), where for every 10 ml/kg, there is a difference of 1 cm. However, baseline BMI (k = 36, β = −0.0004, 95% CI −0.004, 0.003, p = 0.86), sex (k = 14, β = −1.5, 95% CI −3.78, 0.69, p = 0.16), and baseline WC (k = 36, β = 0.28, 95% CI −0.46, 1.03, p = 0.44) did not moderate change in WC.
3.8. Subgroup analysis
Only seven studies (nine comparisons) allowed for a direct comparison between vigorous and moderate intensities, where there was a modest, yet significant reduction in WC favoring vigorous intensity (−1.49 cm, 95% CI −2.82, −0.16, t = −2.59, p = 0.03), with high heterogeneity (Q [8] = 55.3, p ≤ 0.0001 and I 2 = 86.73%) (Figure 3). [Correction added on 3 June 2022, after first online publication: The figure number citation in the preceding sentence was updated from ‘2’ to ‘3’.].
FIGURE 3.
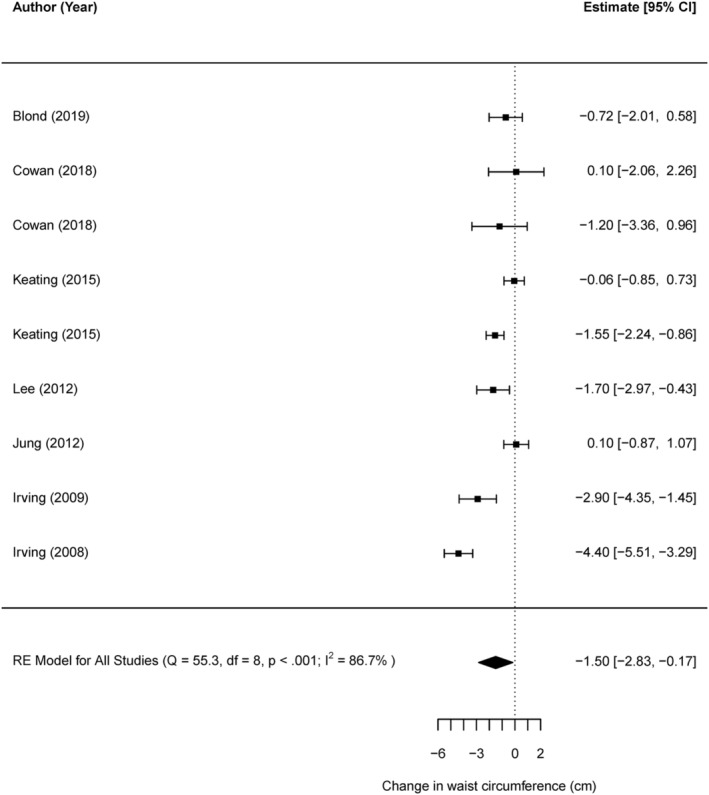
Direct comparison of vigorous versus moderate aerobic exercise on WC [Correction added on 3 June 2022, after first online publication: The preceding figure was renumbered from Figure 2 to Figure 3 in this version.]
4. DISCUSSION
The purpose of this systematic review and meta‐analysis was to provide clear evidence on the effect of regular AEx on WC and the associated change in VAT, in order to inform practice of health professionals managing adults with overweight or obesity. The findings from the 25 available RCTs clearly demonstrate that compared with non‐exercise control, regular AEx reduces WC, with an average effect of 3.2 cm. Furthermore, change in WC is associated with statistically significant change in VAT but not significant weight loss. Despite the emphasis on achieving high weekly AEx volume and frequency for weight loss in current exercise recommendations, 29 , 30 there was no clear association between AEx volume and frequency on WC reduction. Rather, the current evidence suggests that exercise intensity may be a significant determinant of WC reduction in adults undertaking AEx programs, where vigorous intensity may lead to superior WC reduction compared with moderate intensity programs.
It is now widely acknowledged that excess visceral adiposity is associated with significant risk of cardiometabolic disease, independently of BW. However, in routine clinical practice, measurement of risk associated with obesity has historically relied on determination of BMI, although WC is increasingly advocated. 88 , 89 , 90 Importantly, in this study, we have demonstrated that change in WC from serial measurement is associated with change in visceral adiposity levels even when BW change is negligible and that beneficial reduction in WC (and VAT) can be achieved with regular AEx. Moreover, the current data suggest a modest benefit even with the limitations of WC measurement, 91 and uncertainty, with the upper limit 95% CI of WC reduction of 2.5 cm. Our findings on WC reduction are generally consistent with those of previous reviews that have reported average reductions between 2 and 3 cm. 42 , 44 , 92 , 93 , 94 However, it is important to recognize that although these findings demonstrate that change in waist may provide some insight into change in VAT, it should not be considered a perfect proxy for this purpose. 73 , 90 , 95 , 96 Further, the findings of previous studies were limited by the small number of studies they included measuring AEx and WC. Moreover, none of the above studies used gold standard measures of VAT (CT and MRI) to substantiate the change in WC with a change in VAT. Previous findings from a large meta‐regression found that a 1‐cm increase of WC is associated with an approximately 2% increased risk of cardiovascular disease (CVD). 97 Moreover, data from Cerhan et al. 87 suggest that each increase of 5 cm in WC was associated with increase in mortality risk of 7% and 9%, for men and women, respectively. Inference from both studies could be made that the reverse is true, such that the observed current reduction of 3.2 cm (95% CI −3.86, −2.51) with aerobic interventions could be associated with a mean CVD risk reduction of 6% (ranging 7%–4%) and a reduced mortality risk of ~4.5% in men and ~5.7% in women.
There is uncertainty around the components of exercise prescription that influence the change in WC with exercise interventions and consequentially a lack of clear direction for exercise professionals aiming to improve abdominal adiposity. Data from our moderator analysis and indirect subgroup analysis suggest a superior benefit on WC with AEx of a “vigorous” intensity, compared with “moderate” intensity training. However, where direct comparisons were available, there was insufficient evidence. These collective data are similar to recent findings by O'Donoghue and colleagues, 42 who found vigorous AEx to offer greater benefits than moderate when both were separately compared with control, although their review was limited by fewer studies that used AEx and measured WC. By contrast, Wewege et al. 44 directly compared AEx based on moderate intensity (MICT) and HIIT and observed no difference in WC improvement, with a mean reduction of ~3 cm with each. However, that analysis only included a relatively small number of studies that measured WC (n = 5). Similarly, findings from Ross et al. 98 found no difference between energy‐matched high‐volume high‐intensity, high‐volume low‐intensity, and low‐volume low‐intensity training groups. Unlike Ross and colleagues, 98 only a handful of the included studies within the current review and in Wewege et al. (2017) 44 were matched for energy expenditure. Moreover, we were limited in the number of studies that directly compared moderate to vigorous AEx (k = 7). As such, it is difficult to determine whether the reductions in WC are influenced by intensity when energy expenditure is similar (or whether the superiority of high intensity partly reflects higher energy expenditure). Data from the current review did not find a clear influence of exercise volume on change in WC. This is in contrast to weight loss outcomes in current exercise guidelines to manage overweight/obesity, which recommend participating in as much as 250–300 min 28 , 29 to 300–420 min. 30 Although the findings from the current data are promising, there remains uncertainty around which components of AEx prescription are most influential in changing WC.
There are some limitations within the current review and, as such, the authors advise caution with interpretation of the findings. Firstly, the number of individual included studies with small sample sizes, limiting the strength of GRADE assessment, and reducing the ability to validly explore other practical considerations such as sex‐specific effects of exercise on WC, and relationships between exercise dose and WC. Moreover, this review has limited scope in which to distinguish the contribution of change in VAT, from subcutaneous adipose tissue 99 , 100 change, which may partially account for some of the variance with associated WC reductions. 90 Secondly, although exercise interventions are known to be difficult to blind, 101 future exercise trials should, where possible, employ placebo/sham control groups and use intervention groups that meet the current guidelines. 29 , 30 Importantly, as identified in the RoB2, there are limitations arising from the lack of assessor blinding to group allocation of the primary outcome. In light of the established error in measurement and potential assessor bias, 91 future studies using WC as an outcome should employ blinding of assessors to treatment allocation and use a standardized method of measurement. 102 Similarly, the application of our primary finding of a modest reduction in WC (~3.2 cm) may be somewhat limited, as this magnitude of change falls within the typical error of measurement for WC. 91 However, the addition of “gold standard” measures (CT and MRI) add strength to the validity of the observed reduction of WC and VAT. We acknowledge that although this approach adds important biological evidence corroborating the benefit of AEx on abdominal adiposity, a limitation of this approach is that it does not capture the full published evidence on exercise and WC per se. Whereas there appeared to be no benefit of volume on moderator analysis, there were few studies that used volumes consistent with current recommendations for obesity management. 29 , 30 Given the apparent importance of exercise volume (and energy expenditure) in weight loss outcomes, 30 yet the apparent independent influence of exercise intensity on WC improvement, studies are needed which aim to clearly delineate the effects of intensity and volume/energy expenditure, for example, via energy‐matched but intensity contrasted groups, and vice versa. Despite the current findings suggesting a superior benefit of higher intensity exercise for reducing WC, this review lacks power to support these conclusions with longer term exercise interventions. Moreover, the lack of longer duration studies included in this review are not able to accurately discern long‐term changes in WC from regular exercise or inactivity. Some reports were not able to be retrieved (n = 171) using the university catalogue, and publicly available domain during the search process, and therefore may have impacted the final number of included studies. Lastly, to further improve quality of future research, studies should include the use of an intention‐to‐treat analysis, provide details around the randomization process, and report adherence for both supervised and unsupervised interventions.
This systematic review and meta‐analysis provides evidence that participation in regular AEx may induce a modest reduction in WC (and VAT) in adults with overweight or obesity, and this can occur with negligible weight loss. Additionally, AEx programs performed at a vigorous intensity may offer superior benefit to moderate intensity exercise. Although these findings are promising, further research is needed to corroborate these data for practitioners working with clients with weight management problems.
CONFLICT OF INTEREST
The authors declare no conflict of interest.
Supporting information
Supporting Information S1 PROSPERO amendments
Supporting Information S2 Search strategies
Supporting Information S3 Contour funnel plot
Supporting Information S4 Funnel plot
Supporting Information S5 PRISMA Flow chart of screening and study selection
Figure S1 Risk of Bias Summary
Figure S2 (A) Regression relationship between change in WC and change in bodyweight. (B) Regression relationship between change in WC and change in VAT
Supporting info item
ACKNOWLEDGMENTS
Thanks to Kanchana Ekanayake, librarian for the University of Sydney School of Health Sciences, for her assistance with developing the search strategy and conducting database searches. We want to acknowledge and thank the contacted authors for their assistance.
Miss Alex Armstrong is supported by the Australian Government Research Training Program (RTP) Scholarship, in the form of a tuition fee offset. Open access publishing facilitated by The University of Sydney, as part of the Wiley ‐ The University of Sydney agreement via the Council of Australian University Librarians.
Armstrong A, Jungbluth Rodriguez K, Sabag A, et al. Effect of aerobic exercise on waist circumference in adults with overweight or obesity: A systematic review and meta‐analysis. Obesity Reviews. 2022;23(8):e13446. doi: 10.1111/obr.13446
Funding information Australian Government Research Training Program (RTP) Scholarship
Contributor Information
Alex Armstrong, Email: aarm3531@uni.sydney.edu.au.
Nathan A. Johnson, Email: nathan.johnson@sydney.edu.au.
REFERENCES
- 1. Ng M, Fleming T, Robinson M, et al. Global, regional, and national prevalence of overweight and obesity in children and adults during 1980–2013: a systematic analysis for the Global Burden of Disease Study 2013. The Lancet. 2014;384(9945):766‐781. doi: 10.1016/S0140-6736(14)60460-8 [DOI] [PMC free article] [PubMed] [Google Scholar]
- 2. Manson JE, Colditz GA, Stampfer MJ, et al. A prospective study of obesity and risk of coronary heart disease in women. N Engl J Med. 1990;322(13):882‐889. doi: 10.1056/NEJM199003293221303 [DOI] [PubMed] [Google Scholar]
- 3. Rimm EB, Stampfer MJ, Giovannucci E, et al. Body size and fat distribution as predictors of coronary heart disease among middle‐aged and older US men. Am J Epidemiol. 1995;141(12):1117‐1127. doi: 10.1093/oxfordjournals.aje.a117385 [DOI] [PubMed] [Google Scholar]
- 4. Singh GM, Danaei G, Farzadfar F, et al. The age‐specific quantitative effects of metabolic risk factors on cardiovascular diseases and diabetes: a pooled analysis. PloS One. 2013;8(7):e65174. doi: 10.1371/journal.pone.0065174 [DOI] [PMC free article] [PubMed] [Google Scholar]
- 5. Felson DT, Anderson JJ, Naimark A, Walker AM, Meenan RF. Obesity and knee osteoarthritis: the Framingham Study. Ann Intern Med. 1988;109(1):18‐24. doi: 10.7326/0003-4819-109-1-18 [DOI] [PubMed] [Google Scholar]
- 6. Felson DT, Zhang Y, Hannan MT, et al. Risk factors for incident radiographic knee osteoarthritis in the elderly. The Framingham Study. Arthritis Rheumatism: Off J Am Coll Rheumatol. 1997;40(4):728‐733. doi: 10.1002/art.1780400420 [DOI] [PubMed] [Google Scholar]
- 7. Blagojevic M, Jinks C, Jeffery A, Jordan KP. Risk factors for onset of osteoarthritis of the knee in older adults: a systematic review and meta‐analysis. Osteoarthr Cartil. 2010;18(1):24‐33. doi: 10.1016/j.joca.2009.08.010 [DOI] [PubMed] [Google Scholar]
- 8. Calle EE, Rodriguez C, Walker‐Thurmond K, Thun MJ. Overweight, obesity, and mortality from cancer in a prospectively studied cohort of US adults. N Engl J Med. 2003;348(17):1625‐1638. doi: 10.1056/NEJMoa021423 [DOI] [PubMed] [Google Scholar]
- 9. Calle EE, Kaaks R. Overweight, obesity and cancer: epidemiological evidence and proposed mechanisms. Nat Rev Cancer. 2004;4(8):579‐591. doi: 10.1038/nrc1408 [DOI] [PubMed] [Google Scholar]
- 10. Renehan AG, Tyson M, Egger M, Heller RF, Zwahlen M. Body‐mass index and incidence of cancer: a systematic review and meta‐analysis of prospective observational studies. The Lancet. 2008;371(9612):569‐578. doi: 10.1016/S0140-6736(08)60269-X [DOI] [PubMed] [Google Scholar]
- 11. Larsson B, Svärdsudd K, Welin L, Wilhelmsen L, Björntorp P, Tibblin G. Abdominal adipose tissue distribution, obesity, and risk of cardiovascular disease and death: 13 year follow up of participants in the study of men born in 1913. Br Med J (Clin Res Ed). 1984;288(6428):1401‐1404. doi: 10.1136/bmj.288.6428.1401 [DOI] [PMC free article] [PubMed] [Google Scholar]
- 12. Ohlson L‐O, Larsson B, Svärdsudd K, et al. The influence of body fat distribution on the incidence of diabetes mellitus: 13.5 years of follow‐up of the participants in the study of men born in 1913. Diabetes. 1985;34(10):1055‐1058. doi: 10.2337/diab.34.10.1055 [DOI] [PubMed] [Google Scholar]
- 13. Neeland IJ, Ayers CR, Rohatgi AK, et al. Associations of visceral and abdominal subcutaneous adipose tissue with markers of cardiac and metabolic risk in obese adults. Obesity. 2013;21(9):E439‐E447. doi: 10.1002/oby.20135 [DOI] [PMC free article] [PubMed] [Google Scholar]
- 14. Ouchi N, Parker JL, Lugus JJ, Walsh K. Adipokines in inflammation and metabolic disease. Nat Rev Immunol. 2011;11(2):85‐97. doi: 10.1038/nri2921 [DOI] [PMC free article] [PubMed] [Google Scholar]
- 15. Borkan GA, Gerzof SG, Robbins AH, Hults DE, Silbert CK, Silbert JE. Assessment of abdominal fat content by computed tomography. Am J Clin Nutr. 1982;36(1):172‐177. doi: 10.1093/ajcn/36.1.172 [DOI] [PubMed] [Google Scholar]
- 16. Sjostrom L, Kvist H, Cederblad A, Tylen U. Determination of total adipose tissue and body fat in women by computed tomography, 40K, and tritium. Am J Physiol‐Endocrinol Metabolism. 1986;250(6):E736‐E745. doi: 10.1152/ajpendo.1986.250.6.E736 [DOI] [PubMed] [Google Scholar]
- 17. Lee RC, Wang Z, Heymsfield SB. Skeletal muscle mass and aging: regional and whole‐body measurement methods. Can J Appl Physiol. 2001;26(1):102‐122. doi: 10.1139/h01-008 [DOI] [PubMed] [Google Scholar]
- 18. Tokunaga K, Matsuzawa Y, Ishikawa K, Tarui S. A novel technique for the determination of body fat by computed tomography. Int J Obes (Lond). 1983;7(5):437‐445. [PubMed] [Google Scholar]
- 19. Lemieux S, Lesage M, Bergeron J, Prud'Homme D, Despré JP. Comparison of two techniques for measurement of visceral adipose tissue cross‐sectional areas by computed tomography. American Journal of Human Biology: The Official Journal of the Human Biology Association. 1999;11(1):61‐68. doi:10.1002/(SICI)1520‐6300(1999)11:1<61::AID‐AJHB6>3.0.CO;2‐3 [DOI] [PubMed] [Google Scholar]
- 20. Ashwell M, Cole TJ, Dixon AK. Obesity: new insight into the anthropometric classification of fat distribution shown by computed tomography. Br Med J (Clin Res Ed). 1985;290(6483):1692‐1694. doi: 10.1136/bmj.290.6483.1692 [DOI] [PMC free article] [PubMed] [Google Scholar]
- 21. Snijder M, van Dam R, Visser M, Seidell JC. What aspects of body fat are particularly hazardous and how do we measure them? Int J Epidemiol. 2006;35(1):83‐92. doi: 10.1093/ije/dyi253 [DOI] [PubMed] [Google Scholar]
- 22. Buchwald H, Estok R, Fahrbach K, et al. Weight and type 2 diabetes after bariatric surgery: systematic review and meta‐analysis. Am J Med. 2009;122(3):248, e5‐256. doi: 10.1016/j.amjmed.2008.09.041 [DOI] [PubMed] [Google Scholar]
- 23. Sharples AJ, Mahawar K. Systematic review and meta‐analysis of randomised controlled trials comparing long‐term outcomes of Roux‐en‐Y gastric bypass and sleeve gastrectomy. Obes Surg. 2020;30(2):664‐672. doi: 10.1007/s11695-019-04235-2 [DOI] [PubMed] [Google Scholar]
- 24. O'Neil PM, Birkenfeld AL, McGowan B, et al. Efficacy and safety of semaglutide compared with liraglutide and placebo for weight loss in patients with obesity: a randomised, double‐blind, placebo and active controlled, dose‐ranging, phase 2 trial. The Lancet. 2018;392(10148):637‐649. doi: 10.1016/S0140-6736(18)31773-2 [DOI] [PubMed] [Google Scholar]
- 25. Iuzzolino E, Kim Y. Barriers impacting an individuals decision to undergo bariatric surgery: a systematic review. Obes Res Clin Pract. 2020;14(4):310‐320. doi: 10.1016/j.orcp.2020.07.001 [DOI] [PubMed] [Google Scholar]
- 26. Bray GA. Medical treatment of obesity: the past, the present and the future. Best Pract Res Clin Gastroenterol. 2014;28(4):665‐684. doi: 10.1016/j.bpg.2014.07.015 [DOI] [PubMed] [Google Scholar]
- 27. Garvey WT, Mechanick JI, Brett EM, et al. American Association of Clinical Endocrinologists and American College of Endocrinology comprehensive clinical practice guidelines for medical care of patients with obesity. Endocr Pract. 2016;22:1‐203. doi: 10.4158/EP161365.GL [DOI] [PubMed] [Google Scholar]
- 28. Donnelly JE, Blair SN, Jakicic JM, et al. American College of Sports Medicine Position Stand. Appropriate physical activity intervention strategies for weight loss and prevention of weight regain for adults. Med Sci Sports Exerc. 2009;41(2):459‐471. doi: 10.1249/MSS.0b013e3181949333 [DOI] [PubMed] [Google Scholar]
- 29. Liguori G, Medicine ACoS . ACSM's Guidelines for Exercise Testing and Prescription. Lippincott Williams & Wilkins; 2020. [Google Scholar]
- 30. Johnson NA, Sultana RN, Brown WJ, Bauman AE, Gill T. Physical activity in the management of obesity in adults: a position statement from Exercise and Sport Science Australia. J Sci Med Sport. 2021;24(12):1245‐1254. doi: 10.1016/j.jsams.2021.07.009 [DOI] [PubMed] [Google Scholar]
- 31. Chaston TB, Dixon J. Factors associated with percent change in visceral versus subcutaneous abdominal fat during weight loss: findings from a systematic review. Int J Obes (Lond). 2008;32(4):619‐628. doi: 10.1038/sj.ijo.0803761 [DOI] [PubMed] [Google Scholar]
- 32. Kay S, Fiatarone Singh M. The influence of physical activity on abdominal fat: a systematic review of the literature. Obes Rev. 2006;7(2):183‐200. doi: 10.1111/j.1467-789X.2006.00250.x [DOI] [PubMed] [Google Scholar]
- 33. Ohkawara K, Tanaka S, Miyachi M, Ishikawa‐Takata K, Tabata I. A dose–response relation between aerobic exercise and visceral fat reduction: systematic review of clinical trials. Int J Obes (Lond). 2007;31(12):1786‐1797. doi: 10.1038/sj.ijo.0803683 [DOI] [PubMed] [Google Scholar]
- 34. Ismail I, Keating S, Baker M, Johnson NA. A systematic review and meta‐analysis of the effect of aerobic vs. resistance exercise training on visceral fat. Obes Rev. 2012;13(1):68‐91. doi: 10.1111/j.1467-789X.2011.00931.x [DOI] [PubMed] [Google Scholar]
- 35. Sabag A, Way KL, Keating SE, et al. Exercise and ectopic fat in type 2 diabetes: a systematic review and meta‐analysis. Diabetes Metab. 2017;43(3):195‐210. doi: 10.1016/j.diabet.2016.12.006 [DOI] [PubMed] [Google Scholar]
- 36. Hammond BP, Brennan AM, Ross R. Exercise and adipose tissue redistribution in overweight and obese adults. Body Composition: CRC Press; 2017:109–128. doi 10.1201/9781351260008‐7 [Google Scholar]
- 37. Verheggen R, Maessen M, Green DJ, Hermus ARMM, Hopman MTE, Thijssen DHT. A systematic review and meta‐analysis on the effects of exercise training versus hypocaloric diet: distinct effects on body weight and visceral adipose tissue. Obes Rev. 2016;17(8):664‐690. doi: 10.1111/obr.12406 [DOI] [PubMed] [Google Scholar]
- 38. Merlotti C, Ceriani V, Morabito A, Pontiroli AE. Subcutaneous fat loss is greater than visceral fat loss with diet and exercise, weight‐loss promoting drugs and bariatric surgery: a critical review and meta‐analysis. Int J Obes (Lond). 2017;41(5):672‐682. doi: 10.1038/ijo.2017.31 [DOI] [PubMed] [Google Scholar]
- 39. Neeland IJ, Ross R, Després J‐P, et al. Visceral and ectopic fat, atherosclerosis, and cardiometabolic disease: a position statement. Lancet Diabetes Endocrinol. 2019;7(9):715‐725. doi: 10.1016/S2213-8587(19)30084-1 [DOI] [PubMed] [Google Scholar]
- 40. Vissers D, Hens W, Taeymans J, Baeyens JP, Poortmans J, van Gaal L. The effect of exercise on visceral adipose tissue in overweight adults: a systematic review and meta‐analysis. PloS One. 2013;8(2):e56415. doi: 10.1371/journal.pone.0056415 [DOI] [PMC free article] [PubMed] [Google Scholar]
- 41. Chang Y‐H, Yang H‐Y, Shun S‐C. Effect of exercise intervention dosage on reducing visceral adipose tissue: a systematic review and network meta‐analysis of randomized controlled trials. Int J Obes (Lond). 2021;45(5):982‐997. doi: 10.1038/s41366-021-00767-9 [DOI] [PubMed] [Google Scholar]
- 42. O'Donoghue G, Blake C, Cunningham C, Lennon O, Perrotta C. What exercise prescription is optimal to improve body composition and cardiorespiratory fitness in adults living with obesity? A network meta‐analysis. Obes Rev. 2021;22(2):e13137. doi: 10.1111/obr.13137 [DOI] [PMC free article] [PubMed] [Google Scholar]
- 43. Wewege MA, Desai I, Honey C, et al. The effect of resistance training in healthy adults on body fat percentage, fat mass and visceral fat: a systematic review and meta‐analysis. Sports Med. 2021;52(2):1‐14. doi: 10.1007/s40279-021-01562-2 [DOI] [PubMed] [Google Scholar]
- 44. Wewege M, Van Den Berg R, Ward R, van den Berg R, Keech A. The effects of high‐intensity interval training vs. moderate‐intensity continuous training on body composition in overweight and obese adults: a systematic review and meta‐analysis. Obes Rev. 2017;18(6):635‐646. doi: 10.1111/obr.12532 [DOI] [PubMed] [Google Scholar]
- 45. Maillard F, Pereira B, Boisseau N. Effect of high‐intensity interval training on total, abdominal and visceral fat mass: a meta‐analysis. Sports Med. 2018;48(2):269‐288. doi: 10.1007/s40279-017-0807-y [DOI] [PubMed] [Google Scholar]
- 46. Andreato L, Esteves J, Coimbra D, Moraes AJP, Carvalho T. The influence of high‐intensity interval training on anthropometric variables of adults with overweight or obesity: a systematic review and network meta‐analysis. Obes Rev. 2019;20(1):142‐155. doi: 10.1111/obr.12766 [DOI] [PubMed] [Google Scholar]
- 47. Moher D, Liberati A, Tetzlaff J, Altman DG, The PRISMA Group . Preferred Reporting Items for Systematic Reviews and Meta‐Analyses: the PRISMA statement. PLoS Med. 2009;6(7):e1000097. doi: 10.1371/journal.pmed.1000097 [DOI] [PMC free article] [PubMed] [Google Scholar]
- 48. Consultation WE. Appropriate body‐mass index for Asian populations and its implications for policy and intervention strategies. Lancet (London, England). 2004;363(9403):157‐163. doi: 10.1016/S0140-6736(03)15268-3 [DOI] [PubMed] [Google Scholar]
- 49. Shuster A, Patlas M, Pinthus J, Mourtzakis M. The clinical importance of visceral adiposity: a critical review of methods for visceral adipose tissue analysis. Br J Radiol. 2012;85(1009):1‐10. doi: 10.1259/bjr/38447238 [DOI] [PMC free article] [PubMed] [Google Scholar]
- 50. Seidell JC, Bakker C, van der Kooy K. Imaging techniques for measuring adipose‐tissue distribution—a comparison between computed tomography and 1.5‐T magnetic resonance. Am J Clin Nutr. 1990;51(6):953‐957. doi: 10.1093/ajcn/51.6.953 [DOI] [PubMed] [Google Scholar]
- 51. Ferland M, J‐p DÉS, Tremblay A, et al. Assessment of adipose tissue distribution by computed axial tomography in obese women: association with body density and anthropometric measurements. Br J Nutr. 1989;61(2):139‐148. doi: 10.1079/BJN19890104 [DOI] [PubMed] [Google Scholar]
- 52. Higgins JP, Altman DG, Gøtzsche PC, et al. The Cochrane Collaboration's tool for assessing risk of bias in randomised trials. BMJ. 2011;343(oct18 2):343. doi: 10.1136/bmj.d5928 [DOI] [PMC free article] [PubMed] [Google Scholar]
- 53. Schünemann HJ, Higgins JP, Vist GE, et al. Completing ‘Summary of findings’ tables and grading the certainty of the evidence. Cochrane Handbook Syst Reviews of Interventions. 2019;375‐402. doi: 10.1002/9781119536604.ch14 [DOI] [Google Scholar]
- 54. Schünemann HBJ, Guyatt G, Oxman A (Eds). GRADE Handbook for Grading Quality of Evidence and Strength of Recommendations. Updated October. The GRADE Working Group; 2013. 2013 2013 Available from: www.guidelinedevelopment.org/handbook.editors [Google Scholar]
- 55. Morris SB, DeShon RP. Combining effect size estimates in meta‐analysis with repeated measures and independent‐groups designs. Psychol Methods. 2002;7(1):105‐125. doi: 10.1037/1082-989X.7.1.105 [DOI] [PubMed] [Google Scholar]
- 56. Morris SB. Estimating effect sizes from pretest‐posttest‐control group designs. Org Res Methods. 2008;11(2):364‐386. doi: 10.1177/1094428106291059 [DOI] [Google Scholar]
- 57. Zhang H‐J, He J, Pan L‐L, et al. Effects of moderate and vigorous exercise on nonalcoholic fatty liver disease: a randomized clinical trial. JAMA Intern Med. 2016;176(8):1074‐1082. doi: 10.1001/jamainternmed.2016.3202 [DOI] [PubMed] [Google Scholar]
- 58. Blond MB, Rosenkilde M, Gram AS, et al. How does 6 months of active bike commuting or leisure‐time exercise affect insulin sensitivity, cardiorespiratory fitness and intra‐abdominal fat? A randomised controlled trial in individuals with overweight and obesity. Br J Sports Med. 2019;53(18):1183‐1192. doi: 10.1136/bjsports-2018-100036 [DOI] [PubMed] [Google Scholar]
- 59. Baria F, Kamimura MA, Aoike DT, et al. Randomized controlled trial to evaluate the impact of aerobic exercise on visceral fat in overweight chronic kidney disease patients. Nephrol Dial Transplant. 2014;29(4):857‐864. doi: 10.1093/ndt/gft529 [DOI] [PubMed] [Google Scholar]
- 60. Cowan TE, Brennan AM, Stotz PJ, Clarke J, Lamarche B, Ross R. Separate effects of exercise amount and intensity on adipose tissue and skeletal muscle mass in adults with abdominal obesity. Obesity. 2018;26(11):1696‐1703. doi: 10.1002/oby.22304 [DOI] [PubMed] [Google Scholar]
- 61. Irving BA, Davis CK, Brock DW, et al. Effect of exercise training intensity on abdominal visceral fat and body composition. Med Sci Sports Exerc. 2008;40(11):1863‐1872. doi: 10.1249/MSS.0b013e3181801d40 [DOI] [PMC free article] [PubMed] [Google Scholar]
- 62. Irving BA, Weltman J, Patrie JT, et al. Effects of exercise training intensity on nocturnal growth hormone secretion in obese adults with the metabolic syndrome. J Clin Endocrinol Metabol. 2009;94(6):1979‐1986. doi: 10.1210/jc.2008-2256 [DOI] [PMC free article] [PubMed] [Google Scholar]
- 63. Jung JY, Han KA, Ahn HJ, et al. Effects of aerobic exercise intensity on abdominal and thigh adipose tissue and skeletal muscle attenuation in overweight women with type 2 diabetes mellitus. Diabetes Metab J. 2012;36(3):211‐221. doi: 10.4093/dmj.2012.36.3.211 [DOI] [PMC free article] [PubMed] [Google Scholar]
- 64. Karstoft K, Winding K, Knudsen SH, et al. The effects of free‐living interval‐walking training on glycemic control, body composition, and physical fitness in type 2 diabetic patients: a randomized, controlled trial. Diabetes Care. 2013;36(2):228‐236. doi: 10.2337/dc12-0658 [DOI] [PMC free article] [PubMed] [Google Scholar]
- 65. Keating SE, Hackett DA, Parker HM, et al. Effect of aerobic exercise training dose on liver fat and visceral adiposity. J Hepatol. 2015;63(1):174‐182. doi: 10.1016/j.jhep.2015.02.022 [DOI] [PubMed] [Google Scholar]
- 66. Lee M‐G, Park K‐S, Kim D‐U, Choi SM, Kim HJ. Effects of high‐intensity exercise training on body composition, abdominal fat loss, and cardiorespiratory fitness in middle‐aged Korean females. Appl Physiol Nutr Metab. 2012;37(6):1019‐1027. doi: 10.1139/h2012-084 [DOI] [PubMed] [Google Scholar]
- 67. Zhang HK, Tong T, Qiu W, et al. Effect of high‐intensity interval training protocol on abdominal fat reduction in overweight Chinese women: a randomized controlled trial. Kinesiology. 2015;47(1):57‐66. [Google Scholar]
- 68. Higgins JP, Thomas J, Chandler J, et al. Cochrane Handbook for Systematic Reviews of Interventions. John Wiley & Sons; 2021. [Google Scholar]
- 69. Choi KM, Han KA, Ahn HJ, et al. Effects of exercise on sRAGE levels and cardiometabolic risk factors in patients with type 2 diabetes: a randomized controlled trial. J Clin Endocrinol Metabol. 2012;97(10):3751‐3758. doi: 10.1210/jc.2012-1951 [DOI] [PubMed] [Google Scholar]
- 70. Friedenreich CM, Woolcott C, McTiernan A, et al. Adiposity changes after a 1‐year aerobic exercise intervention among postmenopausal women: a randomized controlled trial. Int J Obes (Lond). 2011;35(3):427‐435. doi: 10.1038/ijo.2010.147 [DOI] [PMC free article] [PubMed] [Google Scholar]
- 71. Jung JY, Min KW, Ahn HJ, et al. Arterial stiffness by aerobic exercise is related with aerobic capacity, physical activity energy expenditure and total fat but not with insulin sensitivity in obese female patients with type 2 diabetes. Diabetes Metab J. 2014;38(6):439‐448. doi: 10.4093/dmj.2014.38.6.439 [DOI] [PMC free article] [PubMed] [Google Scholar]
- 72. Lesser IA, Singer J, Hoogbruin A, et al. Effectiveness of exercise on visceral adipose tissue in older South Asian women. Med Sci Sports Exerc. 2016;48(7):1371‐1378. doi: 10.1249/MSS.0000000000000906 [DOI] [PubMed] [Google Scholar]
- 73. Ross R, Janssen I, Dawson J, et al. Exercise‐induced reduction in obesity and insulin resistance in women: a randomized controlled trial. Obes Res. 2004;12(5):789‐798. doi: 10.1038/oby.2004.95 [DOI] [PubMed] [Google Scholar]
- 74. Ku Y, Han K, Ahn H, et al. Resistance exercise did not alter intramuscular adipose tissue but reduced retinol‐binding protein‐4 concentration in individuals with type 2 diabetes mellitus. J Int Med Res. 2010;38(3):782‐791. doi: 10.1177/147323001003800305 [DOI] [PubMed] [Google Scholar]
- 75. Heydari M, Freund J, Boutcher SH. The effect of high‐intensity intermittent exercise on body composition of overweight young males. Journal of Obesity. 2012;2012:1‐8. doi: 10.1155/2012/480467 [DOI] [PMC free article] [PubMed] [Google Scholar]
- 76. Moghadasi M, Mohebbi H, Rahmani‐Nia F, Hassan‐Nia S, Noroozi H, Pirooznia N. High‐intensity endurance training improves adiponectin mRNA and plasma concentrations. Eur J Appl Physiol. 2012;112(4):1207‐1214. doi: 10.1007/s00421-011-2073-2 [DOI] [PubMed] [Google Scholar]
- 77. Ross R, Dagnone D, Jones PJ, et al. Reduction in obesity and related comorbid conditions after diet‐induced weight loss or exercise‐induced weight loss in men: a randomized, controlled trial. Ann Intern Med. 2000;133(2):92‐103. doi: 10.7326/0003-4819-133-2-200007180-00008 [DOI] [PubMed] [Google Scholar]
- 78. DiPietro L, Seeman TE, Stachenfeld NS, Katz LD, Nadel ER. Moderate‐intensity aerobic training improves glucose tolerance in aging independent of abdominal adiposity. J Am Geriatr Soc. 1998;46(7):875‐879. doi: 10.1111/j.1532-5415.1998.tb02722.x [DOI] [PubMed] [Google Scholar]
- 79. Pugh CJ, Sprung VS, Kemp GJ, et al. Exercise training reverses endothelial dysfunction in nonalcoholic fatty liver disease. Am J Physiol‐Heart Circul Physiol. 2014;307(9):H1298‐H1306. doi: 10.1152/ajpheart.00306.2014 [DOI] [PubMed] [Google Scholar]
- 80. Short KR, Vittone JL, Bigelow ML, et al. Impact of aerobic exercise training on age‐related changes in insulin sensitivity and muscle oxidative capacity. Diabetes. 2003;52(8):1888‐1896. doi: 10.2337/diabetes.52.8.1888 [DOI] [PubMed] [Google Scholar]
- 81. Sigal RJ, Kenny GP, Boulé NG, et al. Effects of aerobic training, resistance training, or both on glycemic control in type 2 diabetes: a randomized trial. Ann Intern Med. 2007;147(6):357‐369. doi: 10.7326/0003-4819-147-6-200709180-00005 [DOI] [PubMed] [Google Scholar]
- 82. Donges CE, Duffield R, Guelfi KJ, Smith GC, Adams DR, Edge JA. Comparative effects of single‐mode vs. duration‐matched concurrent exercise training on body composition, low‐grade inflammation, and glucose regulation in sedentary, overweight, middle‐aged men. Appl Physiol Nutr Metab. 2013;38(7):779‐788. doi: 10.1139/apnm-2012-0443 [DOI] [PubMed] [Google Scholar]
- 83. Cooper JH, Collins BE, Adams DR, Robergs RA, Donges CE. Limited effects of endurance or interval training on visceral adipose tissue and systemic inflammation in sedentary middle‐aged men. Journal of Obesity. 2016;2016:1‐10. doi: 10.1155/2016/2479597 [DOI] [PMC free article] [PubMed] [Google Scholar]
- 84. Pugh CJ, Cuthbertson DJ, Sprung VS, et al. Exercise training improves cutaneous microvascular function in nonalcoholic fatty liver disease. Am J Physiol‐Endocrinol Metab. 2013;305(1):E50‐E58. doi: 10.1152/ajpendo.00055.2013 [DOI] [PubMed] [Google Scholar]
- 85. McTiernan A, Sorensen B, Irwin ML, et al. Exercise effect on weight and body fat in men and women. Obesity. 2007;15(6):1496‐1512. doi: 10.1038/oby.2007.178 [DOI] [PubMed] [Google Scholar]
- 86. Hosseinpanah F, Barzin M, Mirmiran P, Azizi F. Effect of changes in waist circumference on metabolic syndrome over a 6.6‐year follow‐up in Tehran. Eur J Clin Nutr. 2010;64(8):879‐886. doi: 10.1038/ejcn.2010.79 [DOI] [PubMed] [Google Scholar]
- 87. Cerhan JR, Moore SC, Jacobs EJ, et al. A pooled analysis of waist circumference and mortality in 650,000 adults. Mayo Clinic Proceedings, 2014. Elsevier. 89(3):335–345. doi: 10.1016/j.mayocp.2013.11.011 [DOI] [PMC free article] [PubMed] [Google Scholar]
- 88. Balkau B, Deanfield JE, Després J‐P, et al. International Day for the Evaluation of Abdominal Obesity (IDEA) a study of waist circumference, cardiovascular disease, and diabetes mellitus in 168 000 primary care patients in 63 countries. Circulation. 2007;116(17):1942‐1951. doi: 10.1161/CIRCULATIONAHA.106.676379 [DOI] [PMC free article] [PubMed] [Google Scholar]
- 89. Neamat‐Allah J, Wald D, Hüsing A, et al. Validation of anthropometric indices of adiposity against whole‐body magnetic resonance imaging—a study within the German European Prospective Investigation into Cancer and Nutrition (EPIC) cohorts. PloS One. 2014;9(3):e91586. doi: 10.1371/journal.pone.0091586 [DOI] [PMC free article] [PubMed] [Google Scholar]
- 90. Ross R, Neeland IJ, Yamashita S, et al. Waist circumference as a vital sign in clinical practice: a Consensus Statement from the IAS and ICCR Working Group on Visceral Obesity. Nat Rev Endocrinol. 2020;16(3):177‐189. doi: 10.1038/s41574-019-0310-7 [DOI] [PMC free article] [PubMed] [Google Scholar]
- 91. Verweij LM, Terwee CB, Proper KI, Hulshof CTJ, van Mechelen W. Measurement error of waist circumference: gaps in knowledge. Public Health Nutr. 2013;16(2):281‐288. doi: 10.1017/S1368980012002741 [DOI] [PMC free article] [PubMed] [Google Scholar]
- 92. Thorogood A, Mottillo S, Shimony A, et al. Isolated aerobic exercise and weight loss: a systematic review and meta‐analysis of randomized controlled trials. Am J Med. 2011;124(8):747‐755. doi: 10.1016/j.amjmed.2011.02.037 [DOI] [PubMed] [Google Scholar]
- 93. Schwingshackl L, Dias S, Strasser B, Hoffmann G. Impact of different training modalities on anthropometric and metabolic characteristics in overweight/obese subjects: a systematic review and network meta‐analysis. PloS One. 2013;8(12):e82853. doi: 10.1371/journal.pone.0082853 [DOI] [PMC free article] [PubMed] [Google Scholar]
- 94. Morze J, Rücker G, Danielewicz A, et al. Impact of different training modalities on anthropometric outcomes in patients with obesity: a systematic review and network meta‐analysis. Obes Rev. 2021;22(7):e13218. doi: 10.1111/obr.13218 [DOI] [PMC free article] [PubMed] [Google Scholar]
- 95. Janiszewski PM, Ross R. Physical activity in the treatment of obesity: beyond body weight reduction. Appl Physiol Nutr Metab. 2007;32(3):512‐522. doi: 10.1139/H07-018 [DOI] [PubMed] [Google Scholar]
- 96. Kuk JL, Lee S, Heymsfield SB, Ross R. Waist circumference and abdominal adipose tissue distribution: influence of age and sex. Am J Clin Nutr. 2005;81(6):1330‐1334. doi: 10.1093/ajcn/81.6.1330 [DOI] [PubMed] [Google Scholar]
- 97. de Koning L, Merchant AT, Pogue J, Anand SS. Waist circumference and waist‐to‐hip ratio as predictors of cardiovascular events: meta‐regression analysis of prospective studies. Eur Heart J. 2007;28(7):850‐856. doi: 10.1093/eurheartj/ehm026 [DOI] [PubMed] [Google Scholar]
- 98. Ross R, Hudson R, Stotz PJ, Lam M. Effects of exercise amount and intensity on abdominal obesity and glucose tolerance in obese adults: a randomized trial. Ann Intern Med. 2015;162(5):325‐334. doi: 10.7326/M14-1189 [DOI] [PubMed] [Google Scholar]
- 99. Ross R, Janssen I. Is abdominal fat preferentially reduced in response to exercise‐induced weight loss? Med Sci Sports Exerc. 1999;31(11 Suppl):S568‐S572. doi: 10.1097/00005768-199911001-00014 [DOI] [PubMed] [Google Scholar]
- 100. Abe T, Song JS, Bell ZW, et al. Comparisons of calorie restriction and structured exercise on reductions in visceral and abdominal subcutaneous adipose tissue: a systematic review. Eur J Clin Nutr. 2021;76(2):1‐12. doi: 10.1038/s41430-021-00942-1 [DOI] [PubMed] [Google Scholar]
- 101. Boutron I, Tubach F, Giraudeau B, Ravaud P. Blinding was judged more difficult to achieve and maintain in nonpharmacologic than pharmacologic trials. J Clin Epidemiol. 2004;57(6):543‐550. doi: 10.1016/j.jclinepi.2003.12.010 [DOI] [PubMed] [Google Scholar]
- 102. Marfell‐Jones MJ, Stewart A, De Ridder J. International standards for anthropometric assessment 2012.
Associated Data
This section collects any data citations, data availability statements, or supplementary materials included in this article.
Supplementary Materials
Supporting Information S1 PROSPERO amendments
Supporting Information S2 Search strategies
Supporting Information S3 Contour funnel plot
Supporting Information S4 Funnel plot
Supporting Information S5 PRISMA Flow chart of screening and study selection
Figure S1 Risk of Bias Summary
Figure S2 (A) Regression relationship between change in WC and change in bodyweight. (B) Regression relationship between change in WC and change in VAT
Supporting info item