Abstract
Epigenetic clocks are widely used aging biomarkers calculated from DNA methylation data, but this data can be surprisingly unreliable. Here we show technical noise produces deviations up to 9 years between replicates for six prominent epigenetic clocks, limiting their utility. We present a computational solution to bolster reliability, calculating principal components from CpG-level data as input for biological age prediction. Our retrained principal-component versions of six clocks show agreement between most replicates within 1.5 years, improved detection of clock associations and intervention effects, and reliable longitudinal trajectories in vivo and in vitro. This method entails only one additional step compared to traditional clocks, requires no replicates or prior knowledge of CpG reliabilities for training, and can be applied to any existing or future epigenetic biomarker. The high reliability of principal component-based clocks is critical for applications to personalized medicine, longitudinal tracking, in vitro studies, and clinical trials of aging interventions.
Keywords: aging, biomarker, reliability, epigenetic clock, longitudinal analysis
Introduction
Biological age estimation has been pursued to study the aging process, predict disease risk, and evaluate aging interventions1. Epigenetic clocks based on DNA methylation are among the most studied aging biomarkers1–3. In humans, these primarily utilize Illumina Infinium BeadChips measuring hundreds of thousands of CpG methylation sites. Most existing clocks were trained by applying supervised machine learning techniques to select a subset of CpGs (usually a few hundred) for a weighted linear prediction model of age or aging phenotypes.
Alas, previous studies show the majority of individual CpGs are unreliable. Technical variance generates surprisingly noisy methylation values when the same biological specimens are measured multiple times4–6. This variation can stem from sample preparation, number of beads per CpG, probe hybridization issues, probe chemistry, and batch effects5–8. Reliability metrics are similar using M-values or heteroscedastic beta-values4. Various processing methods may reduce technical variance, including normalization, batch correction, stringent detection thresholds, or discarding low-quality probes7,9,10. However, significant unreliability remains post-processing4,9.
Ultimately, there is a signal (biological variation) vs. noise (technical variation) problem for epigenetic clocks. CpGs with high biological variance tend to be more reliable, reflecting a greater signal-to-noise ratio4,6. Sugden and colleagues showed technical variance is large enough relative to biological variance to cause wide-ranging consequences for epigenetic studies4. They reported the Horvath, Hannum, and PhenoAge clocks contain many unreliable CpGs, though the reliability values were calculated from a cohort where all participants were 18 years old, limiting the biological variance one could observe. A study examining 12 samples indicated that the Horvath multi-tissue predictor deviates between technical replicates by a median of 3 years and a maximum of 8 years, and deviations remain high regardless of preprocessing method11. Thus, it is important to characterize how age-related variance quantitatively compares to technical variance for clock CpGs and epigenetic clocks overall3,12.
The threat of technical noise has major implications for utilizing epigenetic clocks in basic and translational research. In cross-sectional studies, noise could lead to mistaken measurements for many individuals. Short-term longitudinal studies, such as clinical trials that aim to improve health by modifying biological age, may be particularly vulnerable to noise. For example, if a treatment hypothetically decreases epigenetic age by an average of 2 years relative to placebo, technical variation of 8 years at both baseline and follow-up would likely obfuscate this effect.
Here, we describe how technical variation leads to significant deviations between replicates for epigenetic clocks, substantially limiting their utility for multiple applications. To address this issue, we provide a computational solution to bolster reliability by extracting the shared aging signal across many CpGs while minimizing noise from individual CpGs.
Results
Technical noise reduces epigenetic clock reliability
To investigate the reliability of epigenetic clock predictions, we examined a publicly available dataset9 comprising 36 whole blood samples with 2 technical replicates each and an age range of 37.3 to 74.6. The data was processed to eliminate systematic bias between batches (Methods). Ideally, the same sample measured twice would yield the same value. Deviations from this ideal can be quantified using the intraclass correlation coefficient (ICC), a descriptive statistic of the measurement agreement for multiple estimates from the same sample (within-sample variation) relative to other samples (between-sample variation)13.
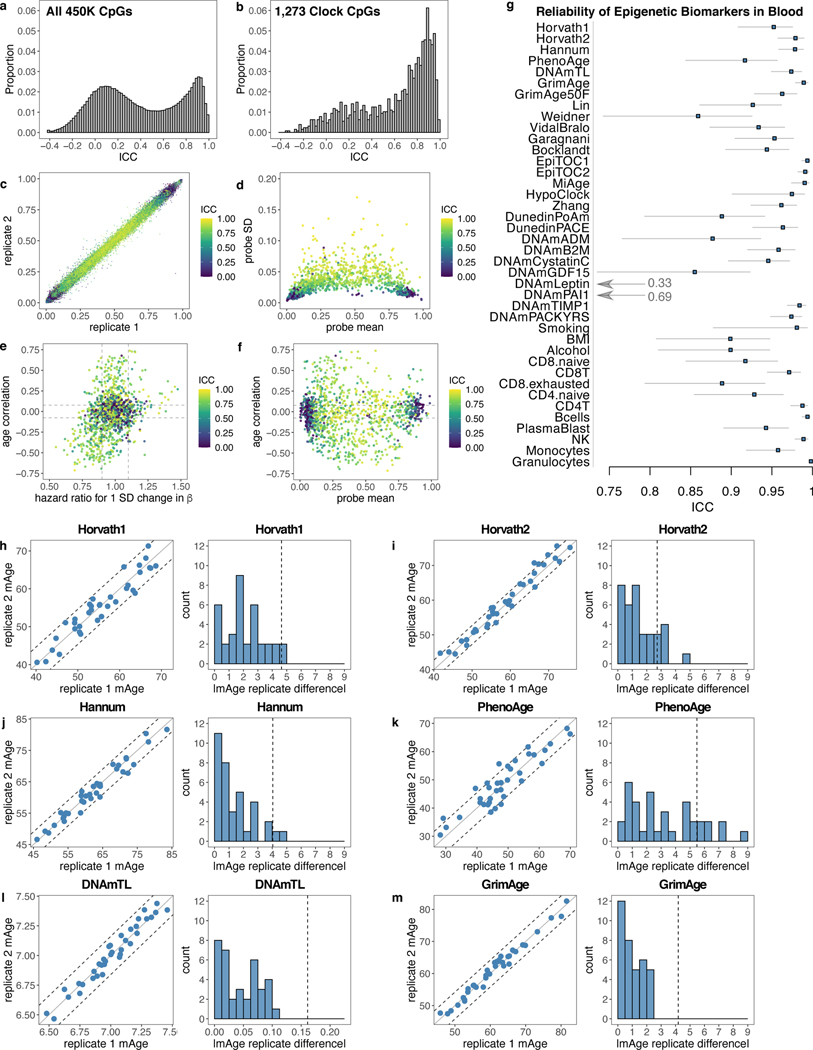
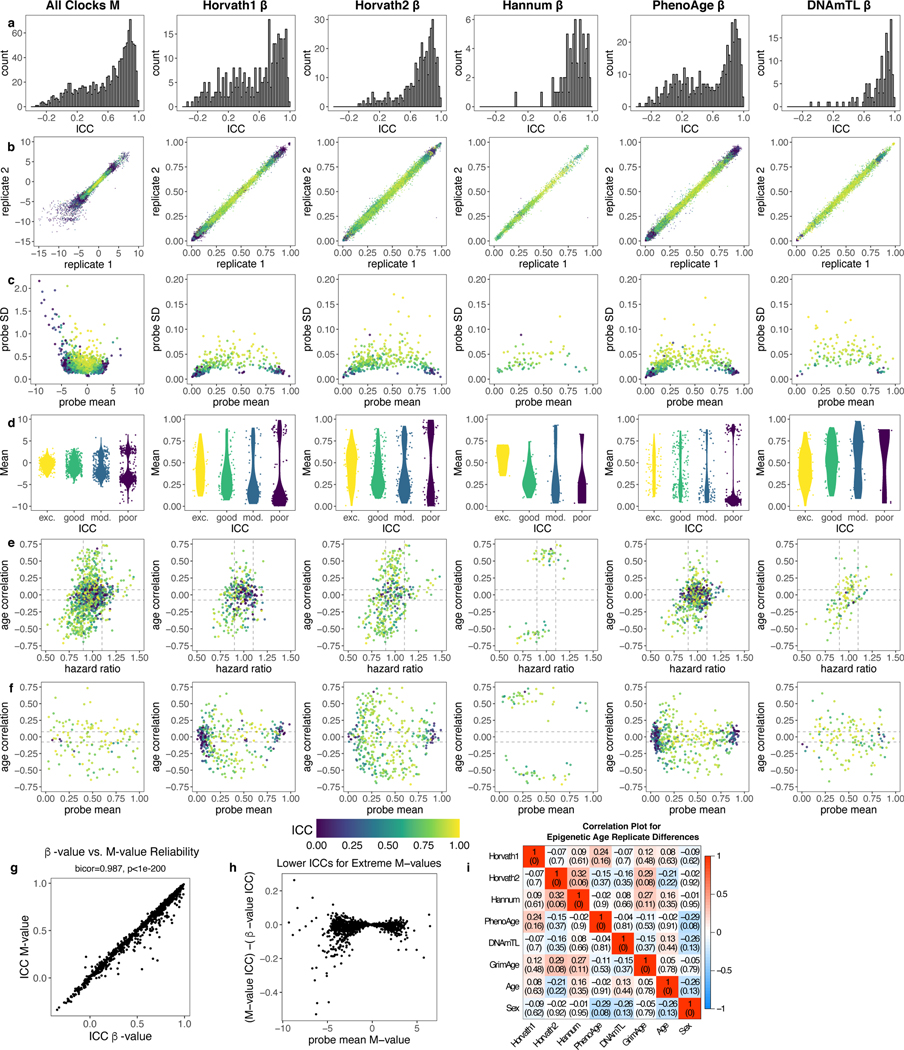
We calculated ICCs for all 450K CpGs and compared them to the subset of 1,273 CpGs from five existing clocks— the Horvath1 multi-tissue predictor, Horvath2 skin-and-blood clock, Hannum blood clock, Levine PhenoAge clock, and Lu DNAmTL telomere length predictor (Fig. 1a-b, Supplementary Tables 1-2)14–18. 450K CpGs show a bimodal distribution of ICCs while clock CpGs are more reliable. Low-reliability clock CpGs have more extreme values (near 0 or 1) and lower variance (Fig. 1c-d). These findings are consistent with prior genome-wide analyses4,6. CpGs strongly associated with mortality or chronological age have higher ICCs (Fig. 1e-f).
Fig. 1. Low reliability of CpGs reduces reliability of epigenetic age prediction.
a, ICCs for all 450K CpGs, analyzed in 36 pairs of technical replicates in blood (GSE55763). b, Intraclass correlation coefficients (ICCs) for 1,273 CpGs in the Horvath1, Horvath2, Hannum, PhenoAge, or DNAmTL clocks. c, Clock CpG ICCs versus beta values for all samples. Each point corresponds to one pair of replicates for one CpG. d-f, Comparisons of clock CpG ICCs to CpG mean beta value, standard deviation, age correlation (in GSE40279), and mortality hazard ratio (in the Framingham Heart Study, after adjusting for age and sex). Each point corresponds to one CpG. g, ICCs for epigenetic biomarkers (raw score not adjusted for age), calculated from 36 pairs of technical replicates in blood (GSE55763). Data are presented as ICC estimate with 95% confidence interval. ICCs for biomarkers adjusted for age are listed in Supplementary Table 4. GrimAge50F is GrimAge setting age to 50 and sex to female for all samples. h-m, Scatterplots and histograms for deviations between replicates for each clock. In scatterplots, each point corresponds to one sample, center line indicates perfect agreement, dashed lines indicate agreement within 1 SD of age acceleration. Histograms show absolute deviation between technical replicates, with 1 SD of age acceleration denoted by dotted grey line calculated in the Framingham Heart Study.
Horvath1 and PhenoAge contain a larger proportion of low-reliability CpGs but otherwise individual clocks show similar patterns (Extended Data Fig. 1). ICCs for beta-values and M-values are strongly correlated (r = 0.987) and show similar patterns (Extended Data Fig. 1), consistent with prior studies4.
We calculated ICCs for various epigenetic clocks and other DNA methylation-based biomarkers for cell proportions, smoking, alcohol, and BMI (Fig. 1g, Supplementary Tables 3-4)14–30. Mitotic clocks and some cell proportion predictions have particularly high ICCs, but otherwise noise affects nearly all epigenetic biomarkers. Epigenetic age acceleration (i.e. after adjusting for chronological age) is often used to relate the clocks to outcomes. Age acceleration residuals have lower ICCs because of reduced biological variance compared to epigenetic age.
Focusing additional analyses on 6 clocks, we found they all demonstrated substantial discrepancies between technical replicates (Fig. 1h-m), even those that utilize few poor-reliability CpGs. The widely used Horvath1 multi-tissue clock14 shows a median deviation of 1.8 years between replicates, and a maximum of 4.8 years. For other clocks, median deviations range from 0.9 to 2.4 years and maxima range from 4.5 to 8.6 years. Because variance differs by clock, we used 1 SD of age acceleration as a comparable metric between clocks. Horvath1, Horvath2, Hannum, and PhenoAge maximum deviations exceeded 1 SD of age acceleration, while GrimAge and DNAmTL maximum deviations were 0.57 and 0.69 SD respectively. The high reliability of GrimAge (ICC = 0.989) is related to its two-step calculation26 from 7 DNAm-based components, age, and sex (Supplementary Results).
The discrepancies of different clocks are not correlated with each other, age or sex (Extended Data Fig. 1i), consistent with their origin in noise. There is no systematic batch effect (i.e. no bias in direction of deviation), and all samples show substantial deviations in at least one clock (Supplementary Table 5).
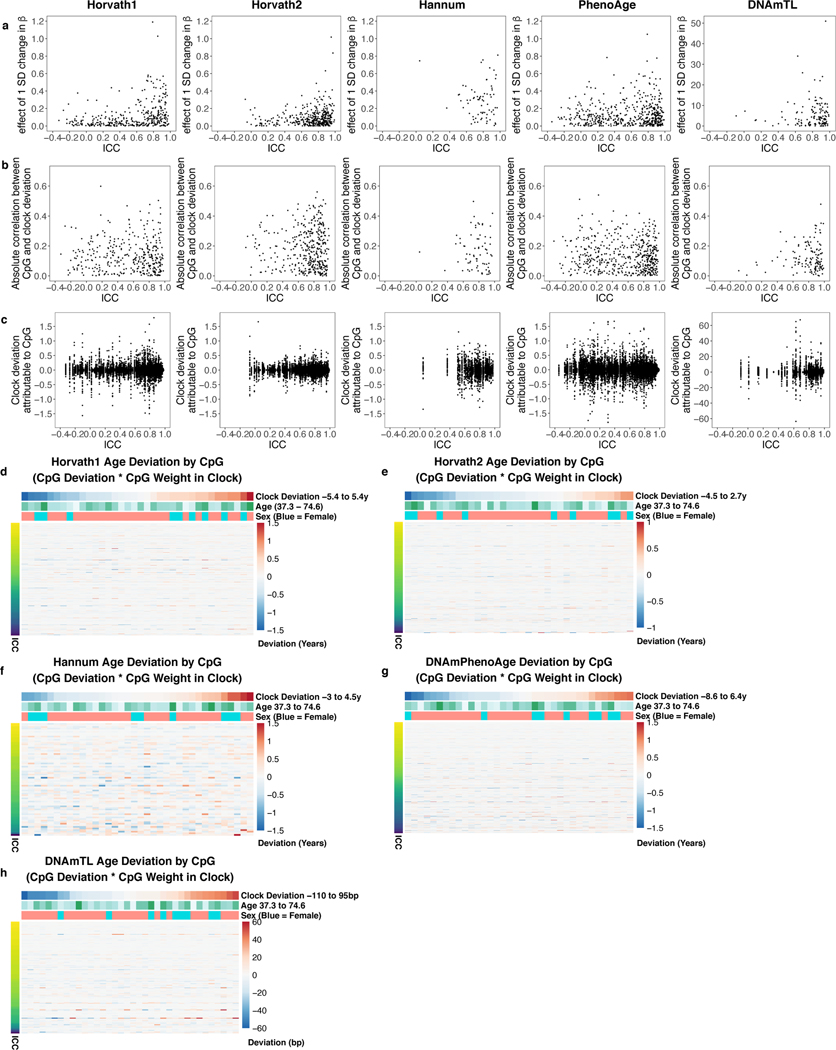
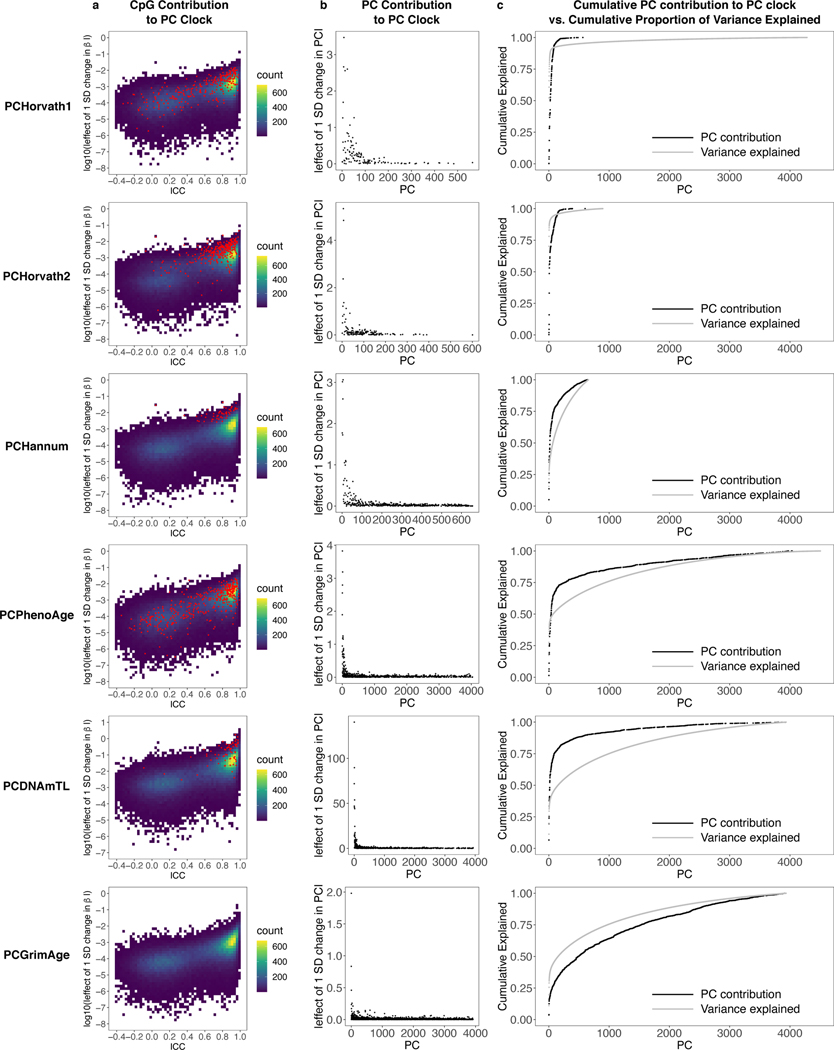
The majority of CpGs contribute some noise to the overall clocks (Extended Data Fig. 2). CpGs with higher ICCs tend to be weighted more heavily, with a 1 SD change leading to a larger change in the overall clock. Consequently, even though high-reliability CpGs are less noisy, their higher weighting amplifies noise. Heatmaps demonstrate that clock deviations for individual samples are the summation of deviations in many CpGs, though different subsets of CpGs may contribute noise in different samples. Even samples that do not show overall clock deviations still demonstrate significant noise from individual CpGs, which happen to cancel each other out. Thus, epigenetic clock reliability issues are not limited to specific samples or CpGs.
Filtering CpGs by ICC only modestly improves reliability
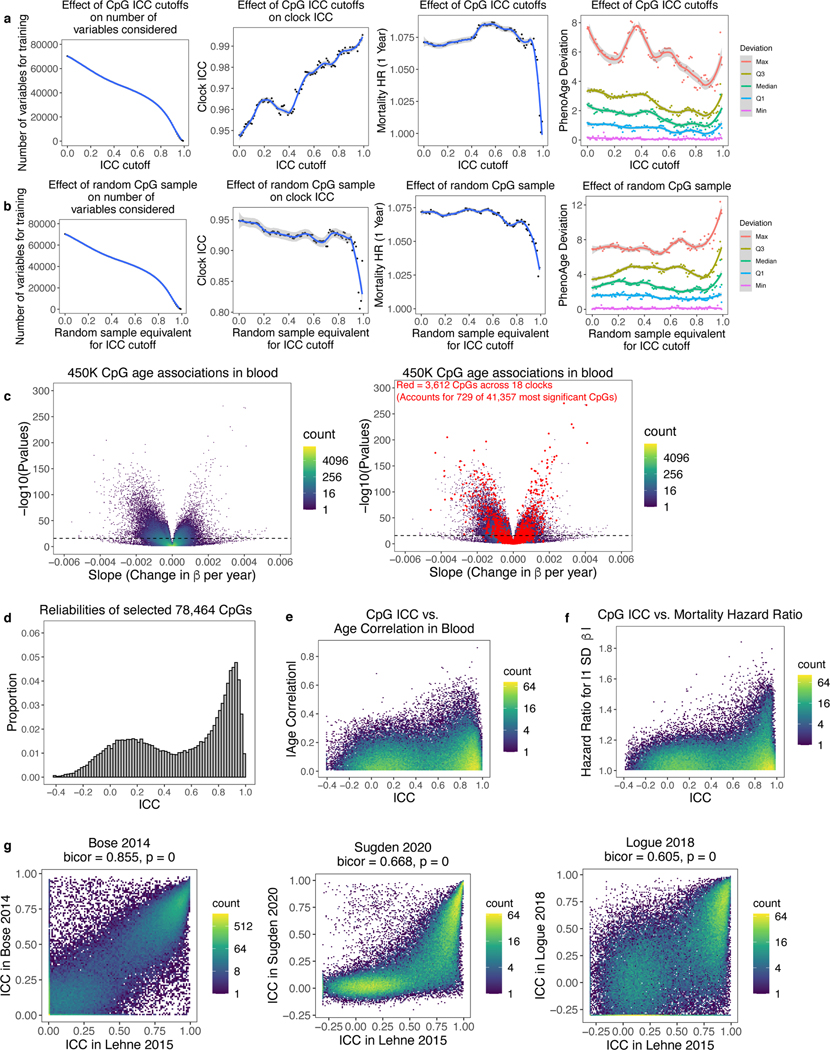
An intuitive solution for noise is to filter out unreliable CpGs before re-training epigenetic clocks. We systematically tested the effects of various ICC cutoffs when considering which CpGs to include in supervised learning for PhenoAge. Reliability improved modestly when training clocks using CpG subsets with progressively higher ICC cutoffs, whereas no improvement occurred with equivalent numbers of random CpGs (Extended Data Fig. 3a-b). An optimum ICC cutoff occurs at 0.9 after discarding 80% of CpGs, as mortality prediction drops off sharply above this cutoff. However, maximum deviations remain 4+ years. Furthermore, filtering approaches are not generalizable, because they require a priori knowledge of CpG reliabilities, which is often not known for a given tissue or sample population. Discarded CpGs likely contain important information about aging in non-blood tissues, smoking, and other relevant phenotypes. Epigenetic clocks trained on individual CpGs come with inherent noise that is not easily discarded, and other methods are needed.
Reliable epigenetic clocks trained from principal components
Many CpGs change together with age in a multicollinear manner, including far more CpGs than those in existing clocks3,12,31. For example, over 40,000 CpGs on the 450K array are strongly associated with age in blood at a strict Bonferroni corrected p-value of 1.057E-7 (Extended Data Fig. 3c). The set of CpGs present in any of 18 existing clocks only includes 1.76% of these CpGs. This is because elastic net regression, commonly used to build clocks, uses model penalties to select a limited number of CpGs to represent a set of collinear CpGs while avoiding overfitting. However, these models retain technical noise from individual CpGs. We hypothesized that information from the numerous age-related CpGs not present in the clocks could be used to bolster reliability. Principal component analysis (PCA) can extract the covariance between multicollinear CpGs, including age-related covariance. Use of many CpGs for each PC would minimize the effect of noise from any single CpG. Furthermore, age-related signals and technical noise are highly unlikely to covary across many CpGs, allowing PCA to separate signal from noise.
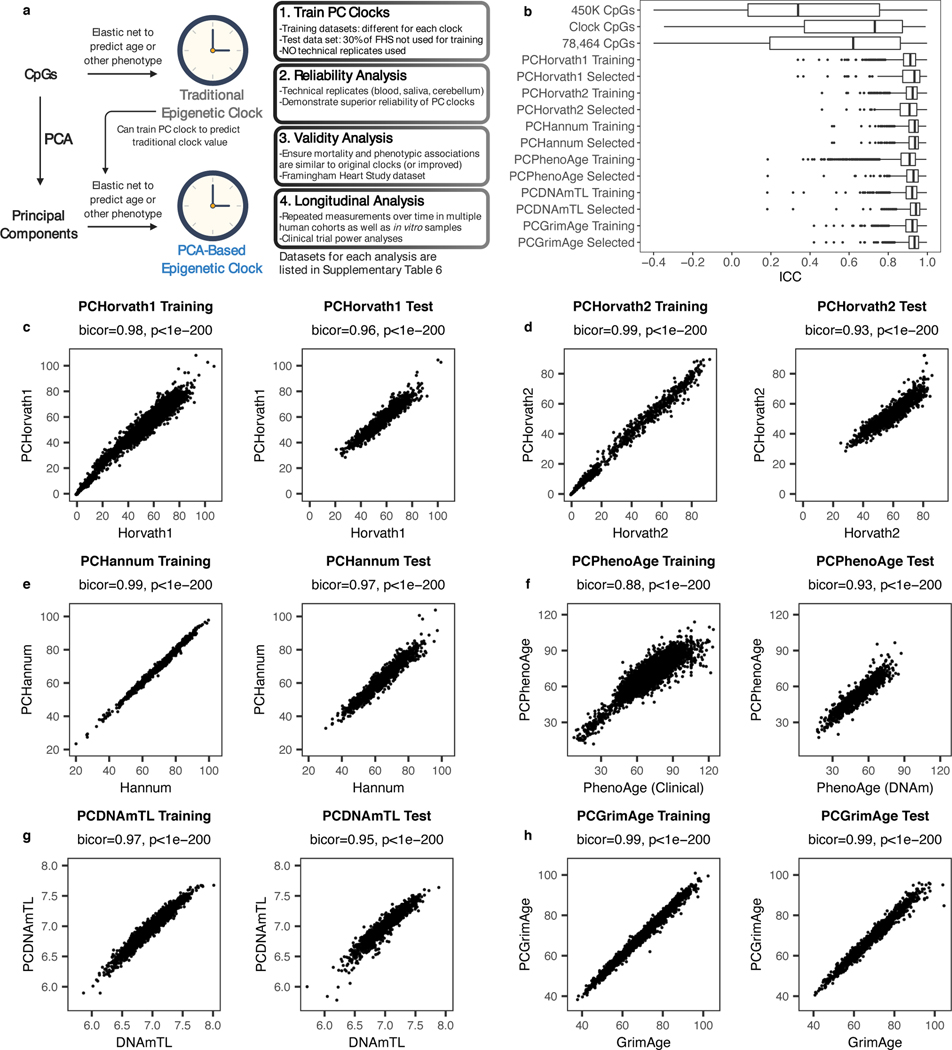
Thus, we trained clocks based on principal components rather than individual CpGs (Fig. 2a). To develop these “PC clocks,” we assembled a variety of DNAm datasets comprising technical replicates, multiple tissues, in-depth aging phenotyping, in vitro experiments, and longitudinal DNAm collection (Supplementary Table 6). We then selected all CpGs that were present in all these datasets, as well as on the EPIC and 450K Illumina arrays. This resulted in 78,464 CpGs. ICCs in this subset are well-correlated with published values from 3 prior studies, and poor-reliability CpGs show reduced age and mortality correlations (Extended Data Fig. 3d-g, Supplementary Table 7)4–6.
Fig. 2. Epigenetic clocks trained from principal components.
a, Strategy for training PC clocks compared to traditional epigenetic clocks. Datasets can be found in Supplementary Table 6. Image created with Biorender.com. b, ICC distributions for PCs in test data compared to CpGs, calculated using 36 pairs of technical replicates in blood. In box-and-whisker plots, boxes correspond to IQR, and whiskers extend to 1.5 x IQR. Outliers are shown as individual points. c-h, Correlations between the original clocks and their PC clock proxies in both training and test data. Test data shown is the Framingham Heart Study methylation data for all clocks, using samples that were not used to train PCDNAmTL or PCGrimAge. Correlation test p-values based on Student’s t distribution (two-tailed) are provided, without multiple testing correction.
PCs were estimated from the 78,464 CpGs in the datasets used to train epigenetic clocks (Supplementary Tables 6-7). Importantly, training datasets did not include any technical replicates. Since each clock was trained using different data, we calculated a separate set of PCs for each clock. The ICCs of PCs are far higher than those of individual CpGs, despite being derived from those same CpGs (Fig. 2b). We applied elastic net regression to retrain 6 epigenetic clocks from each clock’s set of all available PCs (Fig. 2a), and projected test datasets onto the training PCA space to calculate and then validate these PC clocks in independent data. We did not filter PCs by variance explained as it is known that low-variance PCs can be useful for prediction and machine learning32–35, and elastic net regression can remove PCs that do not contribute to prediction. We found it is possible to predict either the original outcome variable (e.g. age), or the original CpG-based epigenetic clock score from PCs. This latter option is useful in cases where not all original training data is available, to maintain consistency with existing studies utilizing CpG-based clocks (Methods). We ultimately chose to train such PC clock proxies of Horvath1, Horvath2, Hannum, DNAmTL, and GrimAge. PCPhenoAge was trained directly on phenotypic age scores calculated from clinical biomarkers17. Elastic net regression selected 121 of 4280 Horvath1 PCs, 140 of 894 Horvath2 PCs, 390 of 655 Hannum PCs, 652 of 4504 PhenoAge PCs, 599 of 3934 DNAmTL PCs, and 1936 of 3934 GrimAge PCs. These PC clocks were highly correlated with the original clocks within both training and test datasets (Fig. 2c-h).
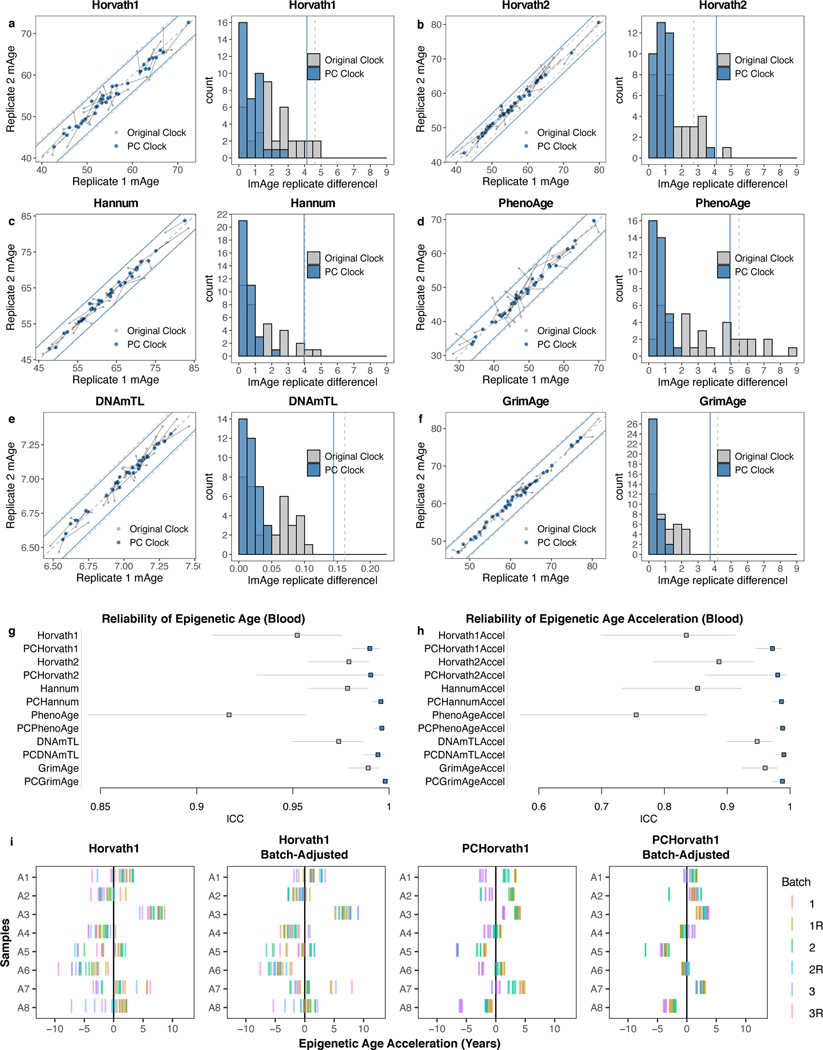
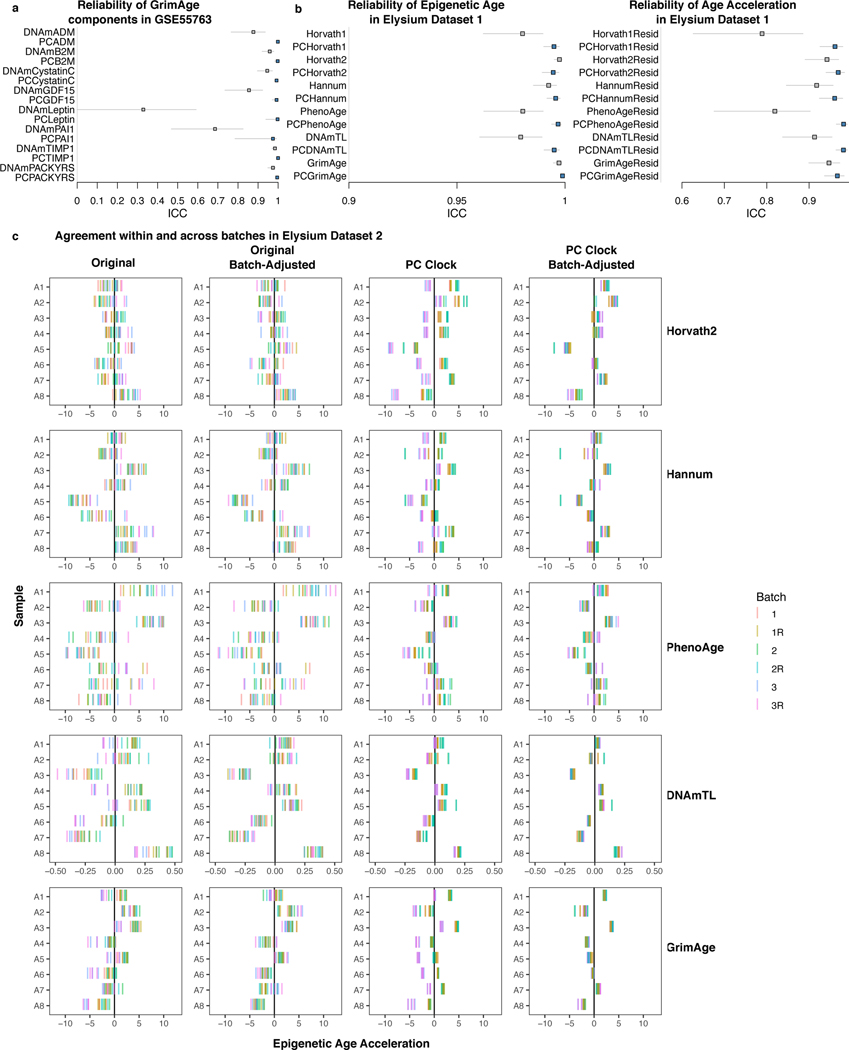
Though the PC-based clocks were trained naïve to any reliability information, they demonstrate greatly improved agreement between technical replicates (Fig. 3a-f). Most replicates (>90%) show agreement within 1–1.5 years. The median deviation ranges from 0.3–0.8 years (improvement from 0.9–2.4 years for CpG clocks). This improved agreement occurs despite having similar variance in age acceleration as the original clocks. Accordingly, all PC clocks show ICC>0.99 for epigenetic age and ICC>0.97 for age acceleration (Fig. 3g-h). GrimAge component ICCs are also increased (e.g. DNAmLeptin 0.329 vs. PCLeptin 0.997) (Extended Data Fig. 4a). PhenoAge displays the most dramatic improvement. CpG-trained PhenoAge has a median deviation of 2.4 years and maximum of 8.6 years. In contrast, PCPhenoAge has a median deviation of 0.6 years, and maximum of 1.6 years.
Fig. 3. Epigenetic clocks trained from principal components are highly reliable.
a-f, Epigenetic clock agreement between technical replicates in blood test data (GSE55763). Grey indicates the original clock while blue indicates the PC clock. In scatterplots, lines connect the same pair of samples as measured by the original clock and the corresponding PC clock. Also, each point corresponds to one sample, center line indicates perfect agreement, and peripheral grey and blue lines indicate agreement within 1 SD of age acceleration. Histograms show absolute deviation between technical replicates, with 1 SD of age acceleration denoted by grey and blue lines calculated in the Framingham Heart Study. g-h, ICCs for epigenetic clock scores without residualization (g) and epigenetic age acceleration (h) in GSE55763. Data are presented as ICC estimate with 95% confidence interval. Note that for PCHorvath2, the lower bound is decreased substantially by a single outlier. i, Horvath1 epigenetic clock agreement between 18 technical replicates (3 batches, 3 replicates per batch, 2 scans per batch) for 8 samples, before and after batch correction. Other clocks are shown in Extended Data Fig. 4c. Batch correction was performed using a linear model using batch as a categorical variable.
We confirmed the superior reliability of PC clocks using two additional blood datasets. First, a dataset with 37 samples measured in duplicate with age range 25.4–73.5 showed greatly improved ICCs for the PC clocks (Extended Data Fig. 4b). Second, we used a nested design dataset to test if PC clocks could improve agreement both within and between batches. Batch correction is a standard DNAm preprocessing step10, but many datasets have residual batch effects after processing. PC clocks remain vulnerable to batch effects that influence many CpGs systematically. However, because PC clocks have lower variance among within-batch technical replicates, we hypothesized that between-batch variation should be easier to correct for. To test this, we examined blood from 8 individuals with age range 26–68 on the EPIC array. Each individual had 18 total replicates: 3 blood samples were collected simultaneously, each processed as a separate batch; each batch was split into 3 technical replicates; each technical replicate was scanned twice. Similar batch effects were found for both original and PC clocks but were far more statistically significant for PC clocks (Supplementary Table 9). Correcting for batch in a linear model leads to strong agreement between replicates regardless of batch for PC clocks, but not for CpG clocks (Fig. 3i, Extended Data Fig. 4c).
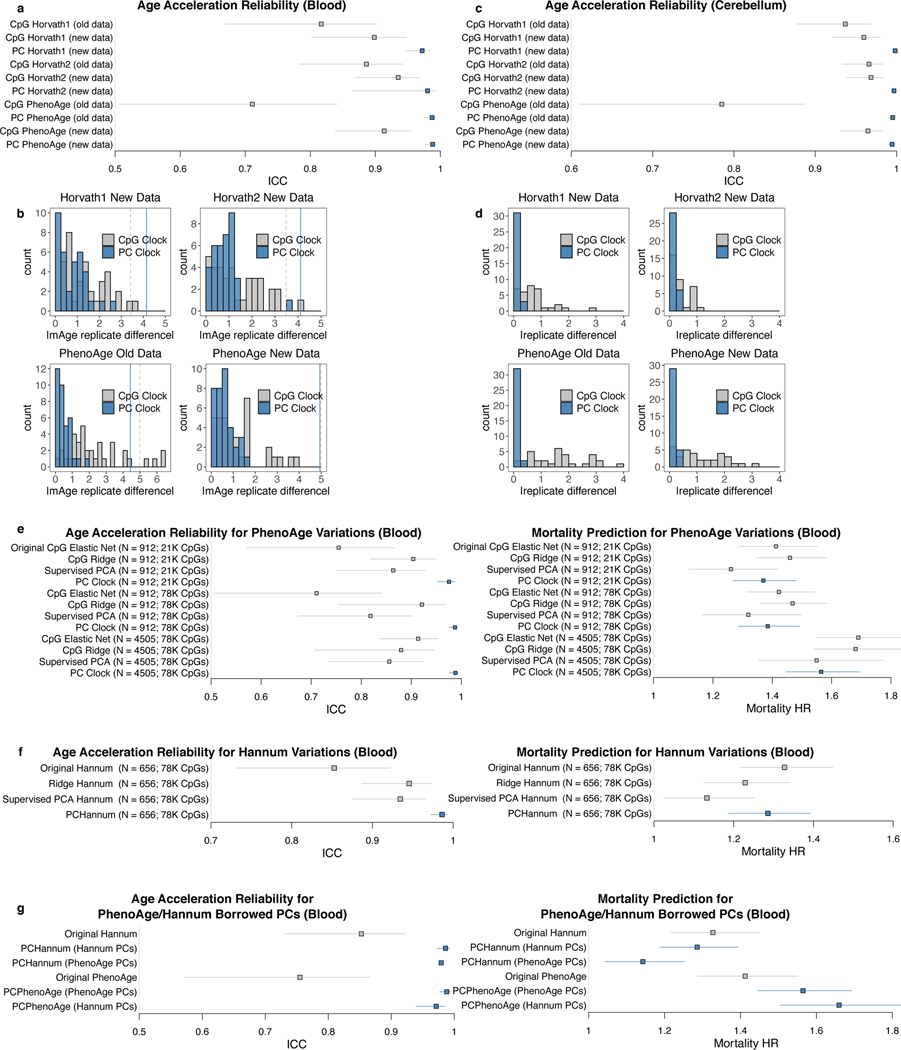
Although some substitutions were made in terms of training samples and CpGs, we confirmed that the improvement in reliability primarily stems from the PC clock methodology rather than differences in training data (Supplementary Results; Extended Data Fig. 5a-f). We also tested whether technical noise could be reduced by other methods, but these did not substantially improve reliability compared to CpG-based clock (Supplementary Results; Extended Data Fig. 5e-f). Finally, PCs from one dataset can be projected to a separate dataset for elastic net regression to form reliable PC clocks, suggesting PCs are largely consistent between datasets (Extended Data Fig. 5g).
Information requirements for PC clocks
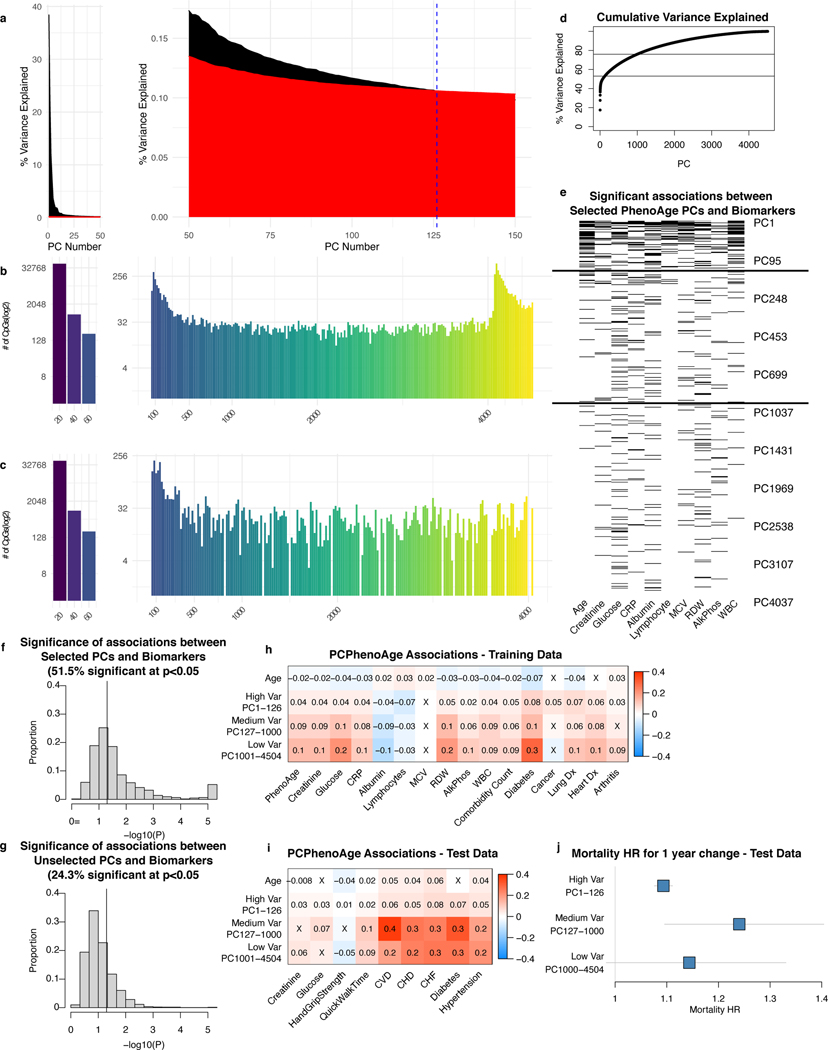
We characterized contributions of CpGs and PCs to PC clocks. Median and maximum effects of a 1-SD change in β for PC clocks were 0.003 years and 0.1 years respectively, compared to 0.07 years and 1 year for CpG clocks (Extended Data Fig. 2a, 6a, Supplementary Table 10). Thus, technical noise or otherwise idiosyncratic behavior for individual CpGs would have minimal effect on the overall PC clock. For PC clocks, top weighted PCs tended to be PCs 2–8, with single PCs contributing up to 2 to 5 years for a 1 SD change in PC score (Extended Data Fig. 6b). For clocks predicting chronological age, most of the overall clock signal stems from the 100–200 highest variance PCs (Extended Data Fig. 6c). However, for clocks predicting mortality (PCPhenoAge, PCGrimAge), lower variance PCs also contribute substantially. Although it is often customary to select only the highest-variance PCs for further analysis, low-variance PCs can contain important signals32–34. Our results suggest that many low-variance PCs in DNA methylation data may capture heterogeneity in aging (e.g. age-related diseases and physiological dysregulation that affect subsets of the population), and elastic net regression can efficiently remove or minimize low-variance PCs that primarily represent noise or otherwise do not contribute to prediction (Supplementary Results, Extended Data Fig. 7).
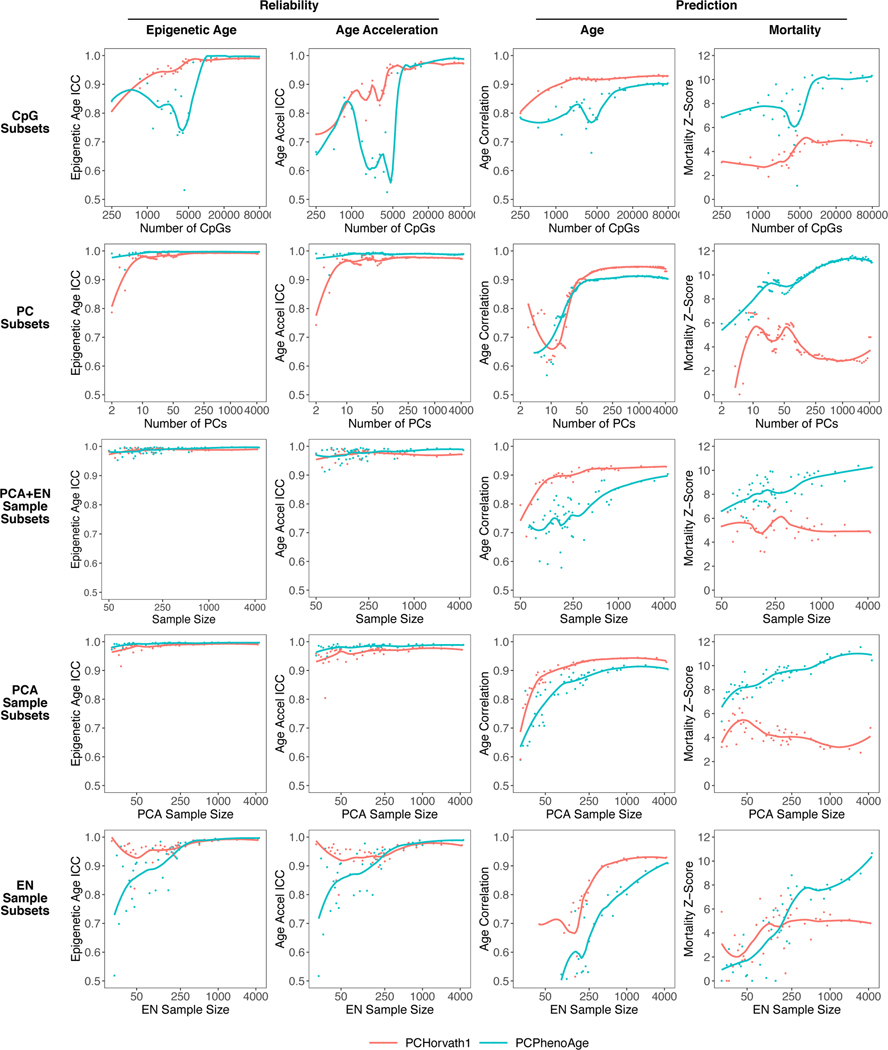
To test the information requirements needed to construct PC clocks for chronological age and mortality respectively, we retrained PCHorvath1 and PCPhenoAge using varying numbers of CpGs, PCs, and sample sizes (Fig. 4). For CpG requirements, we utilized random subsets of the 78,464 CpGs as inputs into elastic net penalized regression. PCHorvath1 required 5,000 CpGs as input to generate a measure with both maximum reliability and age prediction. Conversely, PCPhenoAge required 50,000 CpGs as input. For PC requirements, we performed PCA in the full sample and selected varying numbers of the top PCs (i.e. highest variance explained) for input into elastic net models. 50 available Horvath1 or PhenoAge PCs produce reliable PC clocks with age correlation r = 0.9 in test data. Use of 200 Horvath1 PCs maximizes prediction of chronological age, while 1,000 PhenoAge PCs maximizes mortality prediction.
Fig. 4. Information requirements for age and mortality prediction.
PCHorvath1 and PCPhenoAge were re-trained using varying numbers of CpGs (randomly selected), PCs (consecutive top-ranked by variance), or sample sizes (for PCA, elastic net regression, or both). The resulting epigenetic age ICCs and age acceleration ICCs (calculated in 36 pairs of technical replicates), as well as age correlation and mortality prediction in test data (n = 3935 with 319 deaths) were visualized. Though we did not repeat each iteration multiple times with different random samples, we performed sufficient iterations to visualize the variation between models as well as the general trend as the number of variables increases. For example, a random sample of N=100 is similar to a sample of N=105. A LOESS smoothing function was used to plot the overall trend. Note that the x-axes are on a log base 2 scale.
Sample size requirements are complex for PC clocks because 1) there are two separate steps (PCA and elastic net regression), and 2) when the number of samples N is less than the number of CpGs, the maximum number of available PCs for prediction is N-1. Thus, we trained PC clocks either by performing PCA and elastic net regression in the same random subsamples, or by performing one step in a random subsample and the other step in the full sample. 250 samples are needed to maximize reliability, especially for elastic net regression. At least 500 samples for both elastic net and PCA were required to maximize age prediction for PCHorvath1. To maximize mortality prediction for PCPhenoAge, 1000 samples are needed for PCA (consistent with PC requirements). Mortality prediction did not plateau for elastic net regression suggesting the model can continue to improve with more samples.
To avoid arbitrary cutoffs, we included all training CpGs, PCs, and samples for our final PC clocks.
PC clocks are reliable in saliva and brain
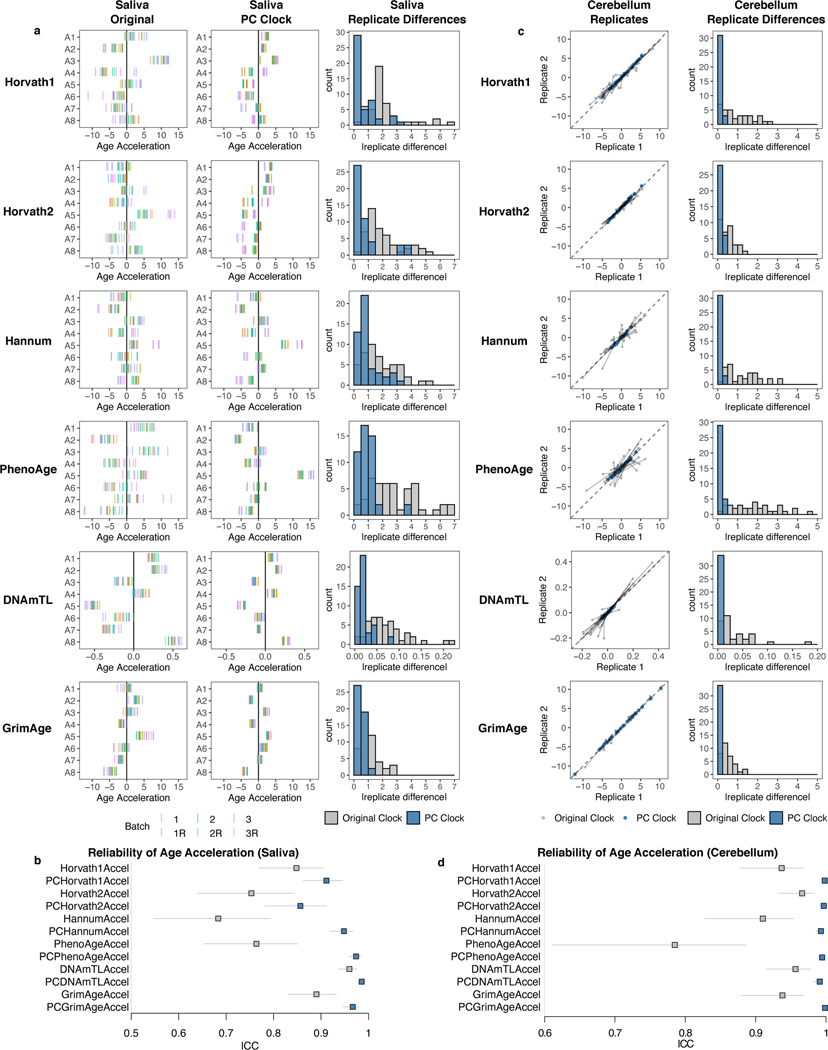
We tested if PC clocks show enhanced reliability in non-blood tissues. We measured DNAm in saliva from the same 8 individuals we obtained blood from, with the same design of 3 consecutive samples, 3 technical replicates each, and 2 scans. While there were epigenetic age offsets between saliva batches similar to blood, the direction of offsets was not consistent between samples, and therefore a linear batch correction could not be performed (Fig. 5a, Supplementary Table 9). Saliva may change in cell composition (epithelial cells vs. leukocytes) with repeated sampling. Regardless, PC clocks still show improved ICCs (Fig. 5ab).
Fig. 5. PC clocks are reliable in saliva and brain.
a, The original clocks and corresponding PC clocks were calculated for 8 saliva samples with 18 technical replicates each (3 batches, 3 replicates per batch, 2 scans per batch). Note that we did not plot standard deviation of epigenetic age acceleration because there were insufficient samples to reliably calculate this value, and we found that much of the variation in the original clocks stemmed primarily from noise. b, Clock ICC values derived for 8 saliva samples with 18 technical replicates each, treating each batch and scan separately. Data are presented as ICC estimate with 95% confidence interval. c, Agreement between technical replicates in cerebellum test data (GSE43414). Because of a systematic shift in epigenetic age between replicates, mean-centered epigenetic age values were used for both the original clocks and PC clocks. Grey indicates the original clock while blue indicates the PC clock. In scatterplots, grey lines connect the same pair of samples as measured by the original clock and the corresponding PC clock. d, Clock ICC values derived from 34 pairs of technical replicates in cerebellum. Data are presented as ICC estimate with 95% confidence interval.
We examined 34 individuals with 2 scans each in cerebellum36. The two cohorts in this study display a batch shift in the original clock scores, though the PC clocks are far more resilient against this effect (Extended Data Fig. 8a). Thus, we analyzed the distance between each clock’s batch-mean centered prediction values. All PC clocks demonstrate an absolute disagreement of less than 0.25 years for most samples and very high ICCs (Fig. 5c-d).
PC clocks preserve relevant aging and mortality signals
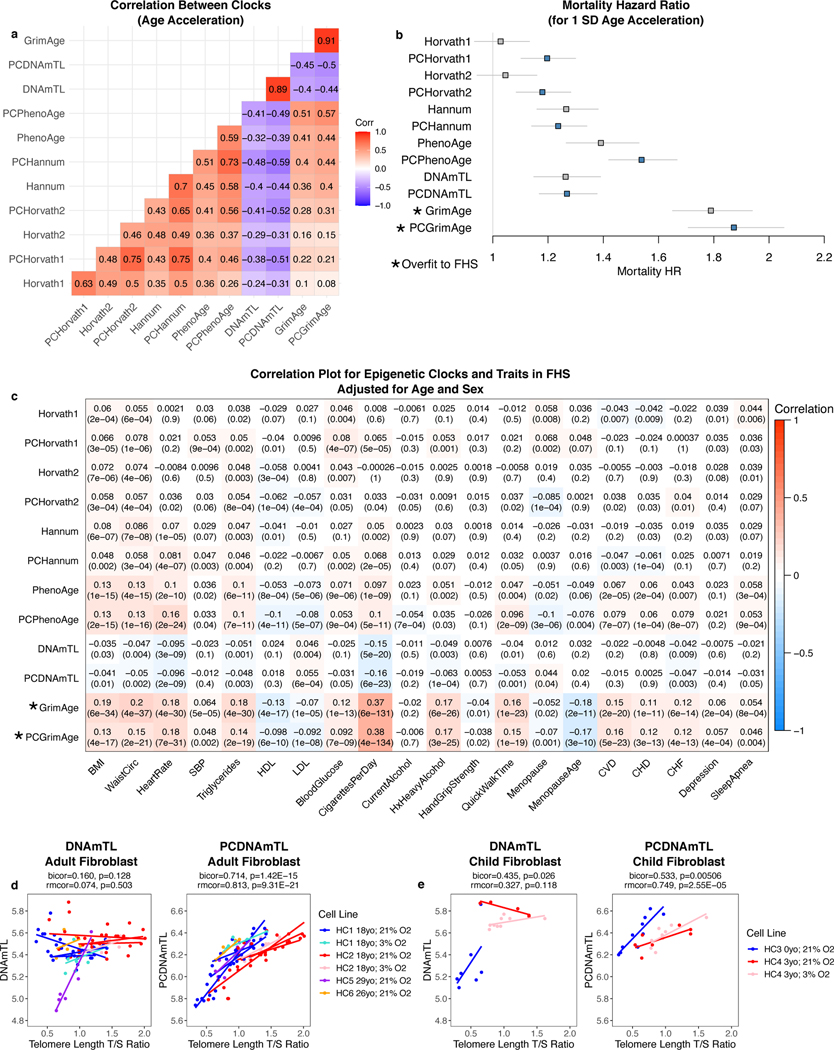
The various original clocks have unique sets of associations and may capture distinct aspects of aging3,12,17,26. To test if any validity in epigenetic clocks was sacrificed to boost reliability, we examined clock associations with various sociodemographic, behavioral, and health characteristics using data from the Framingham Heart Study. The age acceleration values are highly correlated between PC clocks and their CpG counterparts (Fig. 6a). The correlations between different PC clocks are stronger than between CpG clocks, consistent with reduced noise. The PC clocks demonstrate equivalent or improved prediction of mortality and similar associations with a wide range of other factors (Fig. 6b-c).
Fig. 6. PC clocks preserve relevant aging and mortality signals.
a, Correlation between age acceleration values for original and PC clocks in Framingham Heart Study (FHS) blood data. b, Mortality hazard ratios were calculated in FHS after adjusting for chronological age and sex, n = 3935 with 319 deaths. Data are presented as HR estimate with 95% confidence interval. c, Correlations with various traits were calculated in FHS after adjusting for chronological age and sex. Note that GrimAge was trained to predict smoking, serum proteins, and mortality in FHS, and therefore associations are elevated compared to other clocks due to overfitting. d-e, Relative telomere length was compared to DNAmTL and PCDNAmTL for passaged fibroblasts from adults (d) and children (e). Each regression line refers to one biological replicate where the same cell line was measured at multiple passages. Some cell lines were utilized for multiple biological replicates. For each cell line, the age of the donor when the cell line was isolated is shown in the legend. Correlation test p-values are based on Student’s t distribution (two-tailed) without multiple testing correction.
We examined data from the Cellular Lifespan Study37 which measured relative telomere length in passaged fibroblasts derived from both children and adults of both sexes. PCDNAmTL was better correlated with telomere length than DNAmTL (Fig. 6d-e).
Longitudinal trajectories of PC clocks
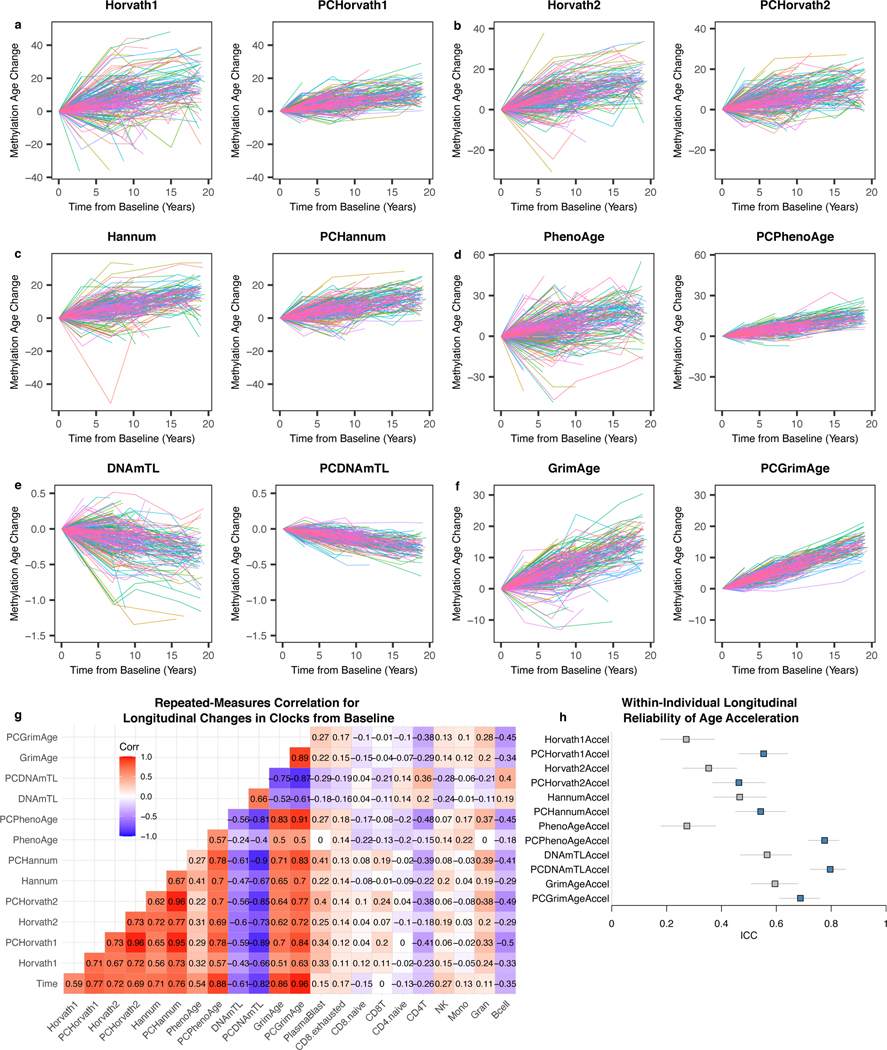
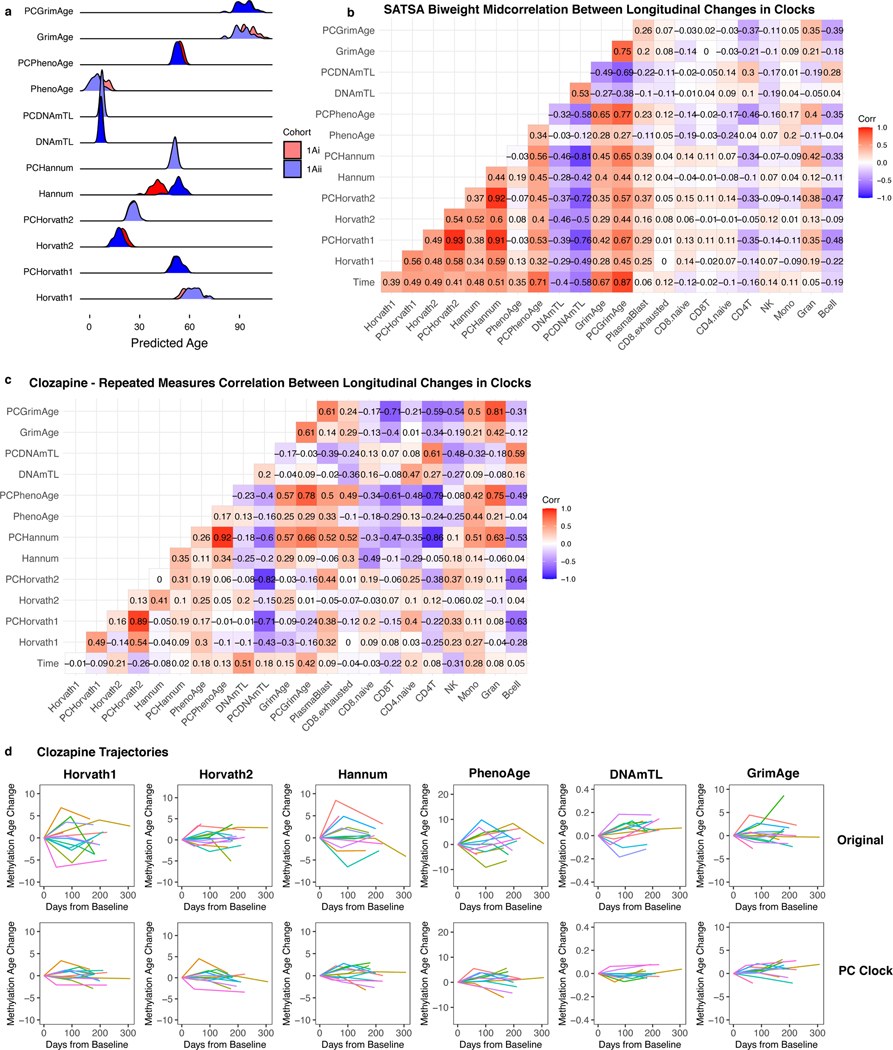
Longitudinal fluctuations in epigenetic age have previously been observed38. However, if epigenetic clocks are influenced by noise, it may be difficult to disentangle biologically meaningful fluctuations from technical variation. In longitudinal data from the Swedish Adoption Twin Study of Aging (SATSA) for 294 individuals (baseline age range 48 to 91) spanning up to 20 years of follow-up and 2 to 5 time points per person38,39, the original CpG clocks show trajectories that fluctuate dramatically, deviating up to 22–57 years off the average trajectory depending on the clock (Fig. 7a-f, Supplementary Table 11). By contrast, the equivalent PC clocks all showed improved stability, deviating a maximum of 10–21 years from the average trajectory. We calculated longitudinal clock changes from baseline for all time points and individuals. To account for varying measurement intervals, we performed repeated measures correlation40. All clocks except PCHorvath2 show improved correlation with time elapsed from baseline compared to their CpG counterparts (Fig. 7g). Compared to the CpG clocks, PC clocks show stronger, directionally identical correlations, consistent with reduced noise. Chronological age clocks (PCHorvath1, PCHorvath2, PCHannum) are particularly strongly correlated with each other, as were mortality clocks (PCPhenoAge, PCGrimAge). We found similar improvements using correlation without considering repeated measures (Extended Data Fig. 8b). ICC values for within-individual measurements increased (Fig. 7h) but not to the same extent as with technical replicates (Fig. 3), reflecting biological variance in individuals’ longitudinal aging trajectories.
Fig. 7. PC clocks show trajectories with improved stability in longitudinal data.
(a-f) Each line shows the trajectory of an individual’s epigenetic age relative to their baseline during the follow-up period. Colors are included primarily to help distinguish between different individuals. (g) Repeated measures correlation to compare longitudinal changes in each clock and cell composition estimates. (h) ICC values reflecting within-individual variance relative to total variance for each clock, n = 941 measurements for 294 individuals (2–5 measurements per individual). Data are presented as ICC estimate with 95% confidence interval.
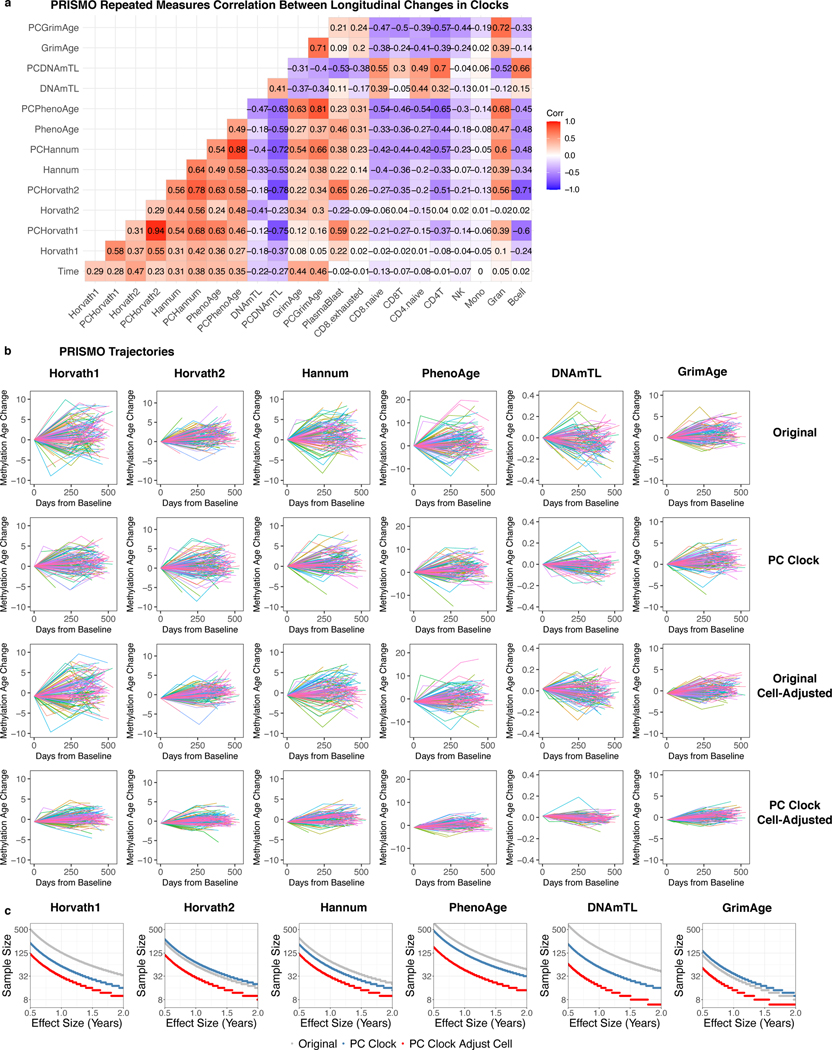
PC clocks showed improved stability in their trajectories on time scales less than 2 years for two other cohorts (Supplementary Results; Extended Data Fig. 8-9). Interestingly, we detected significant longitudinal cell composition shifts affecting both CpG and PC clocks in one cohort, and it was only possible to adjust for these shifts using PC clocks.
PC clocks for clinical trials and in vitro assays
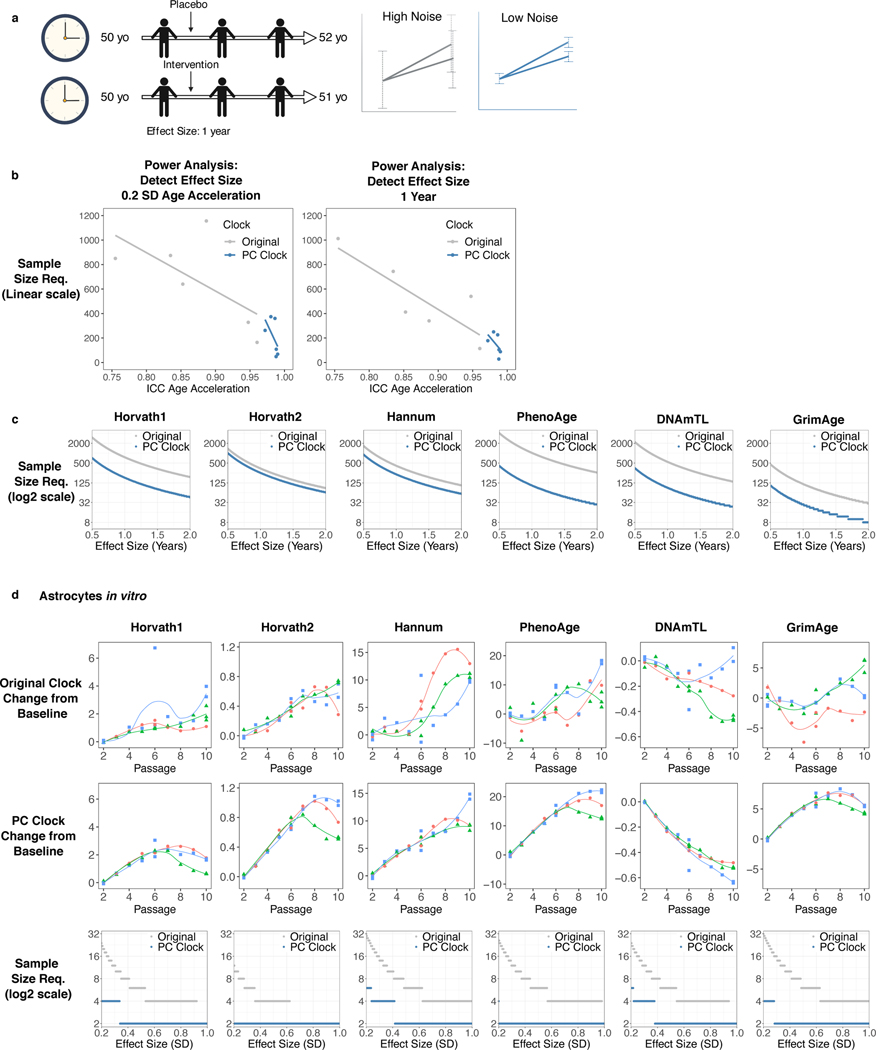
We reasoned the utility of PC clocks is amplified in longitudinal studies because noise reduction applies to baseline and follow-up DNAm measurements (Fig. 8a). This would reduce sample size requirements to detect longitudinal changes. To formally assess this, we performed power analyses41 for randomized clinical trials targeting epigenetic age.
Fig. 8. PC clocks reduce sample size requirements for clinical trials and in vitro assays.
a, Design of a randomized controlled trial lasting 2 years to target epigenetic aging through an intervention. Biomarkers with reduced noise are more sensitive to effects on epigenetic age. Image created with Biorender.com. b-c, Power analysis for a trial evaluating an intervention in an aging population, based on parameters estimated from the SATSA study (Fig. 7). b, Relationship between reliability and sample size requirements (linear scale) for a given effect size. c, Relationship between effect size (in years) and sample size requirements (log2 scale) for each clock. d, DNAm from astrocytes was measured at every passage in cell culture for 3 replicates. Each curve shows the trajectory of one replicate over time from baseline. Zero on the y-axis is defined as the mean between the replicates at the first DNAm measurement. Power analysis was performed using parameters estimated from the first 6 passages, with plots showing the relationship between effect size (in SD) and sample size requirements (log2 scale).
Sample size requirements depend not only on test-retest reliability, but also on the variance and covariance of epigenetic age intercept and slope. These parameters were calculated in SATSA and used to model interventions in an aging population (Supplementary Table 13). Reliability demonstrates a negative linear relationship to sample size requirements (Fig. 8b-c). The sample size required to detect effects was reduced 1.35 to 10-fold by the PC clock method (approximately Horvath1 4-fold reduction; Horvath2 1.35; Hannum 1.8; PhenoAge 10; DNAmTL 6; GrimAge 4). While GrimAge/PCGrimAge showed the lowest sample size needed, their calculation includes chronological age (about 0.65 years added for each chronological year) which is not modifiable. These improvements also occurred when using parameters from a second longitudinal cohort (Supplementary Results; Extended Data Fig. 9c).
Some patterns of epigenetic aging are shared by in vitro and in vivo contexts, suggesting epigenetic clocks can be readouts for aging in cell culture12,42–44. We derived 3 lines of primary astrocytes from one fetal donor, cultured them for 10 passages and measured DNAm at each passage (Fig. 8d). The original CpG-based clocks displayed substantial deviation among replicates and fluctuations between time points. In contrast, the PC clocks showed strong agreement between replicates and smooth increases in epigenetic age up to passage 6. Beyond passage 6 the replicates diverge, and the rate of change decreases, which may be biologically significant. Thus, we performed power analysis using data up to passage 6. While the original clocks require 3–16 replicates for small-to-moderate effect sizes, the PC clocks only require 1–2 replicates per condition.
Discussion
Accessible data and methodology have led to a boom in studies investigating associations between epigenetic age and aging outcomes or risk factors3,45. Recent studies suggest epigenetic clocks may be modifiable by aging interventions46–48. However, the reliability of these clocks is often overlooked. We find significant unreliability in epigenetic clock measurements, resulting in up to 3 to 9 years difference between technical replicates depending on the clock. For comparison, the standard deviation of epigenetic age acceleration is 3 to 5 years. This acceleration value predicts aging outcomes such as mortality above and beyond what chronological age can predict. However, age acceleration is contaminated by technical variation, hampering the utility of epigenetic clocks and potentially leading to both false positive and false negative results.
Training clocks using principal components instead of individual CpGs can greatly improve clock reliability, consistently producing clock ICCs 0.99–0.998 and age acceleration ICCs 0.97–0.99. Improvement occurs due to three main reasons. First, PCA separates noise from age-related signals as they are highly unlikely to covary across many CpGs, and elastic net regression then removes or minimizes noisy PCs that do not contribute to prediction. Second, the PC clocks utilize information from numerous CpGs (while still avoiding overfitting), effectively diluting noise from single CpGs. Third, applying a second machine learning step may generally filter out noise. Methods that share some but not all of these features, such as two-step elastic net regression (e.g. GrimAge)26, supervised PCA, or ridge regression do not improve reliability to the same extent as PC clocks. This suggests all 3 factors are important for PC clock reliability.
The resulting PC clocks are highly reliable despite not requiring technical replicate data or other a priori knowledge of CpG ICCs for their construction. This is useful because replicate data does not exist for many cohorts, tissues, and aging phenotypes. This method can even increase reliability for clocks that already have high ICCs (e.g. GrimAge). PCA is commonly used and does not require specialized knowledge. Thus, this approach is accessible and readily adaptable to any existing or future epigenetic biomarker.
Chronological age is captured primarily by methylation PCs with greatest variance explained, while mortality signals are more distributed, including across low-variance PCs. Low-variance PCs are often discarded for the purposes of dimensionality reduction, but they can still contain useful information for prediction and machine learning32–35. Elastic net regression can efficiently remove or minimize low-variance PCs that do not contribute to prediction. In DNA methylation data, low-variance PCs may be important for capturing aging heterogeneity: physiological dysregulation and age-related diseases that affect subsets of the population.
Importantly, the PC clocks show either comparable or superior prediction of aging phenotypes and mortality compared to the original clocks. By minimizing technical noise, the PC clocks may allow for improved detection of other factors that influence epigenetic age. This includes batch effects and cell composition shifts which may need to be corrected for. Clock reliability will be critical for employing the epigenetic clocks for personalized medicine, longitudinal tracking, in vitro high-throughput screening, and clinical trials. It would be misleading for a conventional CpG-based epigenetic clock to indicate that a person has aged 9 years if the difference is solely attributable to technical variation. Changes in an individual’s measured biological age after starting a treatment or lifestyle change would be suspect. The PC clocks exhibit far more stable and predictable trajectories to monitor individuals’ longitudinal aging processes. By minimizing noise in both baseline and follow-up DNAm measurements, the PC clocks greatly reduce the sample size needed to detect changes in epigenetic age in vivo and in vitro. Considering the substantial resources needed for clinical trials, the PC clocks may allow for many more trials of aging interventions where epigenetic age is assessed pre- and post-treatment. Moving forward, it will be important to determine if, and when, a longitudinal decrease in epigenetic age reflects a bona fide reduction in age-related morbidity or mortality risk.49,50
Our study has other implications for aging studies. First, reliability should be examined for other types of aging biomarkers1. Second, noise can lead to both false positive and false negative results, especially for small studies and longitudinal studies. These results should be re-examined using PC clocks. Also, the original clocks may exclude some individual CpGs simply because they are harder to measure, even if they contain important signal. This issue may be mitigated by focusing on concerted changes across many CpGs, rather than studying one at a time. Finally, the specific CpG identities (and associated genes) included in CpG-based epigenetic clocks may be less important than previously supposed, given that elastic net regression selects a small subset of CpGs to represent a larger group of multicollinear CpGs. We could instead conceptualize the epigenetic clock as measuring global processes affecting many CpGs in concert, reflected in the covariance captured by PCA.
Overall, we drastically improved the reliability of epigenetic clocks, while maintaining or even increasing their validity. These measures may be instrumental for assessing aging interventions, measuring longitudinal trajectories, and understanding the role of global shifts in DNAm patterns in the aging process.
Methods
Study information – reliability datasets
A table of all datasets used in this study can be found in Supplementary Table 6, organized by use. GSE55763 consisted of 36 whole blood samples measured in duplicate from the London Life Sciences Prospective Population (LOLIPOP) study9. We selected this sample because it had the widest age range (37.3 to 74.6 years) of publicly available replicate datasets, which is important for assessing epigenetic clock performance. Using a dataset with a wide age range is critical for comparing age-related variance to technical variance. The sample size was sufficient, as Sugden et al. found that running just 25 pairs of replicates was sufficient to identify 80% of reliable probes4, and our individual CpG ICCs were broadly in agreement with a larger sample of 130 sets of replicates with a narrower age range6. The replicates in GSE55763 were done in separate batches to maximize the impact of technical factors. The dataset had been processed using quantile normalization which Lehne et al. found showed the best agreement between technical replicates out of 10 normalization methods. It was also adjusted using control probes to remove systematic technical bias (e.g. from batches and plates). Note that none of the 78,464 CpGs we analyzed in-depth had any missing values in GSE55763.
All samples in the first Elysium Health study were collected with permission for research use from AKESOgen, Inc. Volunteers were de-identified to two-letter codes along with their chronological age at the one-time collection of blood and saliva. Blood and saliva samples were collected from eight volunteers ranging in age from 26 to 68. Three vials of each specimen were collected per volunteer resulting in a total of 24 samples. Samples were then processed in triplicate in batches of 24 over three days. Blood was collected using BD Whole Blood EDTA tubes. Saliva was stored in DNAGenotek saliva collection kits from Oragene. DNA extraction was performed using an automated DNA extraction methodology using the Biomek i7 & i5 liquid handlers from Beckman in combination with Agencourt DNAdvance extraction chemistry for saliva and Qiagen blood extraction on the KingFisher flex. DNA was quantitated using PicoGreen and Quantit BR technologies. Concentration results were analyzed to ensure sufficient DNA met the requirements of the downstream assay. Bisulfite conversion, pre-hybridization, hybridization to Illumina Bead Arrays, and post-hybridization steps were performed according to the Illumina Infinium HD Methylation Assay protocol. DNA methylation levels were interrogated for each sample using the Illumina HumanMethylationEPIC and custom Elysium Health arrays. Beta values were obtained using the preprocessRaw and preprocessNoob functions within the R package minfi v1.36.052. Samples were excluded from analysis if more than 5% of probes on the array had a detection P-value > 0.01 or failed any of the 17 control metrics using the control_metrics function in R package ewastools v1.753.
The second Elysium Health dataset corresponds to a subset of participants from an observational clinical trial evaluating epigenetic aging and NAD+ levels in healthy volunteers (Clinicaltrials.gov Identifier NCT04220658). Blood was collected from 37 individuals with age range 25 to 74, with two separate vials collected per volunteer for a total of 74 samples and processed on separate days. DNA extraction, sample processing, DNA methylation measurement, quality control, and data analysis was performed as above.
Cerebellum reliability analysis was done using GSE43414, using technical replicates labeled as Cohort 1ai (original scan) and Cohort 1aii (re-scan), respectively. Age residuals were calculated using independent linear models in each batch. Details of this dataset have previously been reported36.
Study information – training datasets for PC clocks
Most datasets used for PC clock training are publicly available on NCBI GEO, ArrayExpress, or TCGA, and have previously been described (Supplementary Table 6). Some datasets were downloaded using R packages GEOquery v2.56.0 or TCGAbiolinks v2.16.4 if needed.
The InCHIANTI epidemiological study evaluates factors influencing mobility in the older adult population living in the Chianti region in Tuscany, Italy. The details of the study have been previously reported54,55. InCHIANTI included two time points with both clinical PhenoAge biomarkers17 and Infinium 450K BeadChip data on 456 participants. In 1998 the age range was 21–91 and PhenoAge range was 7–93. In 2007 the age range was 30–100 and PhenoAge range was 17–123. The study protocol was approved by the Italian National Institute of Research and, in the United States, the protocol was given an exemption status by the Office of Human Subject Research Protection (Exemption #11976), and all participants provided written informed consent.
The Health and Retirement Study (HRS) is a nationally representative sample of Americans over age 50, and has previously been described56. Infinium Methylation EPIC BeadChip data was available for 4,018 individuals, of which 3,593 had clinical PhenoAge data (age range 51–100, PhenoAge range 40–124). The study was approved by the Institutional Review Board at the University of Michigan (HUM00061128) and all participants provided written informed consent.
The Framingham Heart Study (FHS) Offspring and Third Generation cohorts have previously been described57,58. The present study includes 2748 FHS Offspring cohort participants attending the eighth exam cycle (2005–2008) and 1457 Third Generation cohort participants attending the second exam cycle (2005–2008) who consented to provide their DNA for genomic research. DNA methylation was assayed with the Infinium HumanMethylation450 BeadChip and is available in dbGaP, accession number: phs000724.v7.p11. Deaths of FHS participants occurring prior to January 1, 2014 were ascertained by routine contact with participants, surveillance at the local hospital, local obituaries, and queries to the National Death Index Dates. Causes of death were reviewed by an endpoint panel of 3 investigators. All participants provided written informed consent at the time of each examination visit. The study protocol was approved by the Institutional Review Board at Boston University Medical Center.
Study information – longitudinal datasets
The Swedish Adoption Twin Study of Aging (SATSA) was a population-based study of reared-apart and reared-together twin pairs, and has previously been described38,39,59. DNA methylation data was assayed with the Infinium HumanMethylation450 BeadChip and is available in the Array Express database under accession number E-MTAB-7309. DNAm was available for 385 individuals (including 73 MZ and 96 DZ complete twin pairs), and we focused on 294 individuals measured at 2 or more times (88 individuals with 2 time points, 92 with 3 time points, 81 with 4 time points, 33 with 5 time points). The study was approved by the ethics committee at Karolinska Institutet with Dnr 2015/1729–31/5 and all participants provided written informed consent.
The Prospective Research in Stress-related Military Operations (PRISMO study) is a prospective cohort study on stress-related mental health symptoms in Dutch military personnel deployed to Afghanistan for at least four months between 2005 and 2008, and was previously described60,61. Blood samples were obtained one month before deployment and one and six months after deployment, and DNAm was measured using the Infinium Methylation EPIC BeadChip. DNAm data was available for 108 individuals at three time points and 24 individuals at two time points. The study was approved by the Institutional Review Board of the University Medical Center Utrecht and written informed consent was obtained from all participants.
The longitudinal clozapine study was approved by the medical Ethics Committee (METC) of Utrecht and conducted according to the Helsinki Declaration. From 2015 to 2020 patients were included from the following sites: Universitair Medisch Centrum Utrecht (UMCU), GGZ Noord-Holland-Noord, GGZ Rivierduinen, and the Psychiatrische Universitätsklinik der Charité in Berlin. Patients were included if they were diagnosed with schizophrenia, schizoaffective disorder, or psychosis NOS, and about to initiate clozapine treatment. All patients joined voluntarily and after signing the informed consent form. Participants were assessed before initiation with clozapine (time point 1), 4–12 weeks after start (time point 2), and 6 months after start (time point 3). Methylation data was generated from whole blood samples using the Illumina Methylation EPIC BeadChip array, processed using the minfi v1.34.0 and wateRmelon v1.32.0 packages in R. Schizophrenia and clozapine have previously been linked to altered epigenetic aging62.
The Cellular Lifespan Study has been previously described.37 Primary human dermal fibroblasts were obtained under IRB #AAAB0483, and details of informed consent can be obtained from vendors or from Sturm et al. Briefly, dividing fibroblasts were passaged in culture under physiological glucose conditions, untreated (data used in this manuscript) or treated with experimental treatments targeting energy metabolism or neuroendocrine signaling pathways, in parallel with detailed cellular and metabolic phenotyping performed across the replicative lifespan. Relative telomere length was measured by qPCR and quantified as ratio of telomere to single-copy gene abundance (T/S ratio), and DNA methylation data was obtained using the Illumina Methylation EPIC BeadChip array. For our analysis, only fibroblasts from healthy controls were utilized, grown at either 3% or 21% O2. Cell lines from some individuals were passaged through replicative lifespan in 2–3 repeated experiments, for a total of 13 replicates/lifespan from 6 different individuals.
Astrocyte passaging and cell culture
A separate publication is in preparation concerning the astrocyte experiments, and a preprint using this data has also described the methods63. 3 cell lines of fetal astrocytes were derived from cerebral cortex of the same donor (ScienCell #1800). Tissue was received by ScienCell Research Laboratories from non-profit tissue providers, obtained with informed consent of donor’s family aged over eighteen, and under established protocols in compliance with an institutional review board and local, state, and federal laws. No payment, commercial rights or financial rights were provided to the donor family. Further details can be obtained from ScienCell Research Laboratories.
Cells were exhaustively passaged and split a total of 10 times (9–15 cumulative population doublings, depending on replicate). β-gal activity (C12FDG) was measured using flow cytometry or confocal microscopy at each passage to confirm exhaustive replication was achieved. Cells were seeded at 8,000 cells/cm2 with appropriate growth media and supplements (complete astrocyte medium, containing amino acids, vitamins, hormones, trace minerals, 2% fetal bovine serum and 1% PEN/STREP in HEPES pH 7.4 bicarbonate buffer, ScienCell #1801) to promote cell adhesion and growth. Of note, Poly-L-Lysine was not required for adequate cell adhesion. Cells were grown under normoxic conditions (20% O2, 5% CO2) at 37°C.
Cells were split when they reached approximately 90% confluence or when static growth was achieved. Cells were counted using the Invitrogen countess and cell counting chamber slide with trypan blue. Cumulative population doubling was calculated using the initial and final cell density, as determined by the countess (2x=FD/ID, where x=population doubling, FD=final cell density and ID=initial cell density). Longitudinal samples were collected at every passage from passage 2 to 10 for each of three cell lines, for a total of 27 samples. DNA was extracted using the Qiagen DNAeasy Blood and Tissue Kit (69504), with some samples at passages 2, 6, and 10 isolated 2–3 times for a total of 35 DNA samples. Note, samples were treated with proteinase K and RNAse A and eluted with 200 μl elution buffer. Following final elution, DNA was verified using nanodrop (Thermo Scientific). Spin concentration was used as necessary with low DNA content samples. Prior to library preparation we used a Qubit fluorometer (Thermo Scientific) to quantify the extracted genomic DNA. All samples were assigned a single-blinded code and randomized for library preparation and sequencing to control for any batch errors. DNAm data was generated using the Infinium HumanMethylationEPIC BeadChip and preprocessed using minfi v1.36.0 52 and normalized using the noob method64.
Statistical analyses
Statistical analyses were performed in R 4.0.2 and RStudio 1.3.1093. Figures were made using R packages ggplot2 v3.3.3, forestplot v1.10.1, ggcorrplot v0.1.3, pheatmap v1.0.12, or WGCNA v1.70–3. Correlations were calculated using biweight midcorrelation from the WGCNA package, unless otherwise stated. Repeated measures correlation was performed in the rmcorr v0.4.4 R package. Mortality in FHS was calculated using the survival v3.2–7 package. In the longitudinal clozapine dataset, the effect of time on epigenetic clocks was estimated using the lme4 package (v1.1–26). In boxplots, the center line denotes the median, the box limits correspond to the 25th and 75th percentiles, the whiskers extend to the furthest value no more than 1.5x interquartile range from the 25th or 75th percentiles, and outliers are plotted individually as points. Where applicable, data distributions were assumed to be normal, but this was not formally tested. Unless otherwise stated, no adjustment for multiple comparisons was done given that different epigenetic clocks are substantially collinear and not independent.
No statistical methods were used to determine sample sizes. However, for reliability analysis, prior results demonstrated that 25 pairs of replicates were sufficient to identify 80% of reliable probes4, and all of our reliability datasets were of greater size. Sample sizes for training PC clocks were selected to be comparable to the original CpG-based clock- in cases where we increased the sample size or substituted data, we confirmed that the change in data was not the primary reason for improved reliability. For other analyses (validation in FHS, longitudinal analysis in SATSA and PRISMO, in vitro analysis in astrocytes or fibroblasts), we selected datasets that were among the largest available for the use case.
Reliability analyses
We calculated ICC using the icc function in the irr R package version 0.84.1, using a single-rater, absolute-agreement, two-way random effects model, after consulting guidelines from Koo and Li13. Two-way was chosen because all subjects were measured by the same raters (e.g. two batches of replicates). The random effects model allows reliability results to generalize to other DNAm batches. Absolute agreement was used because we aim not only for methylation age to correlate between batches but also for their values to agree. Single rater was used because usually methylation age is based on a single measurement rather than the mean of multiple measurements. ICCs less than 0 were sometimes re-coded as 0, either for figure presentation purposes or to compare the ICCs to previous datasets where this re-coding was done. To evaluate reliability of M-values, we calculated them as follows:
Epigenetic biomarkers
Existing epigenetic biomarkers were calculated using R code to apply model coefficients obtained from the original publication to the methylation beta matrix, published R packages, or Horvath’s online calculator (https://dnamage.genetics.ucla.edu/new). The method used for each clock is listed in Supplementary Table 3. For nomenclature, we referred to clocks that predict chronological age by the last name of the first author of the publication that first reported them. For those that predicted other phenotypes, we used the descriptive name provided by the original publication. Where appropriate, we converted DNAmTL and PCDNAmTL into units of years by assuming that telomere length shortens by 25 base pairs per year65.
Training proxy PC clocks
We trained principal components (PCs) in different datasets for each clock (Supplementary Table 6). Each dataset (beta matrices) was filtered down to 78,464 CpGs that were (1) on the 450K array, EPIC array, and a custom array (Elysium), and (2) shared by our datasets used for PCA training, PC clock training datasets, and reliability analysis. We then performed mean imputation for missing values, as imputation method did not appreciably affect PCs due to the large number of CpGs they incorporate. Beta values were used as they have higher reliabilities than M-values and offer a better correlation structure between CpGs.4,66
PCA was done using the prcomp function in R. The training data was centered but not scaled:
Where is the matrix of training data having dimension N (# of samples) x p (# of features) where N << p, and indicates a vector of mean values of each feature (in this case, the mean % methylation of CpG sites across samples). For simplicity, we will hereafter refer to as for the sake of notational simplicity.
Singular value decomposition was then performed:
Where U is a left singular matrix where columns are eigenvectors of is a diagonal matrix of eigenvalues, and is a right singular matrix where columns are eigenvectors of . For simplicity, hereafter we will use A to denote , the x matrix output of prcomp, such that:
Elastic net regression to predict the outcome variable from the PC scores were done using the glmnet v4.1–1 package. Given the results of SVD for each clock, elastic net regression was performed using the sample matrix for the prediction of age (or the output of the original clock where indicated). This can be represented using the minimization equation used to fit regression beta values67:
Where represents the sample weights, is the original clock output, and β is the vector of regression constants used to fit the input variable , which is the vector of a sample’s principal component values given on the ith row of SVD matrix is the tuning parameter predicted to provide the lowest possible error for the model, as predicted through 10-fold cross validation via an elastic net model. We chose to be 0.5 to allow equal mixing of lasso and ridge regression, as we did not find this parameter appreciably affected reliability or prediction accuracy. Practically, this step was carried out using cv.glmnet on the prcomp sample (x) matrix to discover the value of and the optimal regression coefficients for our model, with standard parameters. The final PC reported by prcomp was excluded from elastic net regression because it is not meaningful in cases where N << p.
Test data were then projected onto the PCs, using the centering from the original training data, allowing for prediction of the outcome variable. This is simply done by finding:
Where is the N x p matrix of new methylation data, is the right singular matrix from SVD in the training data, and indicates the new left singular matrix scaled by the singular values, to be used as inputs to the previously trained linear regression model. Practically, this is achieved using the predict function in R inputting the new methylation data and the prcomp object for the clock of interest. To predict the PC clock scores we use the previously trained elastic net model’s regression coefficients for that clock on the newly generated principal component projection matrix .
Where indicates the predicted clock value for the current sample , and 0, T are the exact regression coefficients obtained from elastic net regression in the original training procedure for each clock.
PCA objects created in R from our training data entail massive matrices that are (1) very computationally expensive to transfer, store, and project onto from new data, and (2) represent a significant number of principal components that go unused in our regression models. Therefore, we reduced the objects down for distribution according to selection from step 3.
Where is a Boolean vector representing the nonzero coefficients of for each clock found in step 3, and then represents the columns selected by vector . In our Github code, we provide for each clock, which is used in place of for step 4 to project new data into the limited PC space. GitHub code can be found at: https://github.com/MorganLevineLab/PC-Clocks. This also includes publicly available instructions and code to calculate all PCs, including those unused in the PC clocks.
We found we could predict either the original outcome variable (e.g. chronological age) or the original CpG clock value. For Horvath1 and Horvath2, we substituted some datasets (Supplementary Table 6) as not all of the original data was available. The original Horvath1 data was obtained on the 27K array, while our PCs utilized 450K or EPIC data. The original Hannum clock was trained adjusting for BMI, diabetes and ethnicity but that data was not available. Exact test/train splits were not available for DNAmTL and GrimAge. Thus, to maintain consistency with existing studies, we trained clocks to predict the original CpG clock value for Horvath1, Horvath2, Hannum, DNAmTL, and GrimAge, calculated using published methods. A few samples were eliminated that showed discrepancies between methylation age and annotated age that suggested they were mislabeled (e.g. annotated age of 6 but a Horvath1 age of 60).
While the predicted ages and age acceleration values for PC clocks and their corresponding CpG clocks always correlated strongly, we found the intercept was sometimes different, leading to a systematic offset in some datasets. However, the CpG clocks themselves often have highly variable intercepts between datasets, which seem to reflect batch effects11,12. Since intercepts are not as interesting for aging studies, compared to slope and age acceleration values, it is not a problem that they do not agree.
To calculate the contribution of each CpG to the final PC clocks, we multiplied the CpG loadings for each PC by the PC weight in the clock, calculated the sum for each CpG, and multiplied by CpG standard deviation from either GSE55763 or the PC clock training data (restricted to ages above 20 to reasonably compare clocks trained with and without developmental samples). To calculate the contribution of each PC to the final clocks, we multiplied the PC weight in the clock by the standard deviation of the PC from either GSE55763 or the PC clock training data (results were similar).
Supervised PCA
Supervised PCA was performed using the superpc R package v1.1268,69. Standard regression coefficients were calculated for each CpG to predict the outcome of interest (e.g. chronological age, phenotypic age), and a threshold for these coefficients was determined by cross-validation in the training data and calculating likelihood ratio statistics in the test data. A reduced data matrix containing only CpGs exceeding that threshold in absolute value was generated, and the first principal components of this reduced data matrix was used in a regression model to predict the outcome. Test data was projected onto these principal components to assess mortality prediction and reliability. Similar to Zhuang and colleagues66, using more than 1 PC in supervised PCA did not improve prediction or reliability.
Mixed models for epigenetic age
Epigenetic age was modeled with mixed models using the lme4 package v1.1–26. For SATSA, PRISMO, and longitudinal clozapine data, we used mixed models with fixed effects for baseline age, and random intercepts and slopes:
where and b denote fixed and random effects, i,j is individual and measurement respectively, Age0 is baseline age, and Time is time since baseline in units of years. We assessed the statistical significance of the effect of time using the Satterthwaite method implemented in the lmerTest package v3.1–370.
For in vitro astrocyte data, we initially tested mixed models as:
where time is number of passages and other parameters are the same as above. However, we found that variance of the random slope was negligible. Thus, we also fit a model without random slopes, which we used for power analyses:
Power Analyses
Power analyses were used to estimate sample size requirements for a range of effect sizes using the method from Liu and Liang41 implemented in the longpower package v1.0.23. The following parameters were estimated from the above mixed models: the variance of random intercept, variance of random slope (not applicable to astrocyte data), residual variance, and correlation between slope and intercept (not applicable to astrocyte data). We assumed a power of 0.8, alpha of 0.05, and a 50/50 placebo/intervention split. For clinical trials modeled using SATSA or PRISMO parameters, we assumed DNAm measurements at baseline, 1, and 2 years, and reported effect sizes for epigenetic age in terms of years instead of standard deviations to improve interpretability. For in vitro models, we assumed DNAm measurements at baseline, passage 3, and passage 6, and calculated effect sizes in terms of standard deviation because the various clocks displayed different scales in vitro. While GrimAge/PCGrimAge showed the lowest sample size, their calculation includes chronological age (about 0.65 years per chronological year) which is not modifiable.
Extended Data
Extended Data Fig. 1. Additional reliability information about clock CpGs.
a-f, Reliability, age correlation, and mortality information for M-values from all clocks and β-values from individual clocks, similar to Fig. 1b-f. ICCs are quantified across 36 samples with 2 technical replicates each. Blood age correlations were calculated in GSE40279. Mortality associations (hazard ratios for 1 SD change in β or M value) were calculated in FHS (n = 3935 with 319 deaths). Shown are histograms of ICC of clock CpGs (a), agreement of technical replicates for CpG values where each point represents one pair of replicates for one CpG (b), and comparisons of ICC values to mean values, standard deviations, age correlations, and mortality associations where each point is one CpG (c-f). g-h, Comparison of M-value and β-value ICCs. Correlation test p-value is based on Student’s t distribution (two-tailed). i, Correlation plot for epigenetic age differences between replicates. Epigenetic age replicate differences were calculated for each clock separately, then the differences were correlated with each other and with age and sex. Data is reported as correlation (p-value). Correlation test p-value is based on Student’s t distribution (two-tailed).
Extended Data Fig. 2. Contributions of CpG deviations to clock deviations between replicates.
a, Contribution of each CpG to overall clock measured in years (except DNAmTL which is measured in base pairs), calculated as weight in clock multiplied by 1 SD in beta value in GSE55763. Each point represents one CpG. b, Correlation of each CpG’s deviation with clock deviation between replicates. Each point represents one CpG. c, Deviation of each CpG multiplied by the CpG weight. Each point represents one CpG for one pair of replicates. d-h, Heatmap of clock deviations attributable to each CpG (CpG deviation multiplied by CpG weight in clock), separated by sample. Rows are CpGs and columns are samples. Clock deviations are measured in years (except DNAmTL which is measured in base pairs).
Extended Data Fig. 3. Many CpGs show associations with age and mortality that could be used by clocks.
a, Filtering out CpGs by ICC leads to modest improvements in clock reliability. PhenoAge has a low ICC yet high mortality prediction, and thus we tested whether ICC could be improved without jeopardizing the latter. 100 models with ICC cutoff 0–0.99 were generated to predict PhenoAge in InCHIANTI when limiting CpGs to those above the ICC cutoff. The resulting epigenetic age ICCs (calculated in 36 pairs of technical replicates) and mortality prediction in test data (n = 3935 with 319 deaths) were visualized. b, Similar to a, except using a random CpG subset selection with an equivalent number of CpGs. c, Volcano plots showing the age associations in blood (GSE40279; 450K array). Red indicates CpGs present in any of 18 existing clocks. Significance was assessed with a two-sided t-test, and the dotted line indicates genome-wide significance calculated by Bonferroni correction (p = 1.057 × 10⁻⁷). d, ICCs for 78,464 CpGs present across all datasets and the 450K and EPIC arrays, listed in Supplementary Table 6. ICCs were calculated in 36 pairs of technical replicates. e-f, Age and mortality correlations for CpG ICCs for selected 78,464 CpGs. Age correlation was calculated in GSE40279, and mortality hazard ratio was calculated in the Framingham Heart Study after adjusting for age and sex. g, Comparison of the 78,464 CpG ICCs to previously published ICC values. Lehne 2015: 450K array, age range 37.3–74.6. Bose 2014: 450K array, age range 45–64. Sugden 2020: 450K and EPIC, age range 18–18. Logue 2018: EPIC array, mean age 31.8 and SD 8.4. Since Bose 2014 published ICCs with floor value of 0, we changed all Lehne 2015 CpGs with ICC<0 to ICC=0 to make comparisons consistent. For Sugden 2020 or Logue 2018, we adjusted the floor to −0.3 for presentation purposes. Correlation test p-value is based on Student’s t distribution (two-tailed).
Extended Data Fig. 4. Additional reliability data on PC clocks in blood.
a, Reliability of GrimAge and PCGrimAge components calculated using 36 pairs of technical replicates (GSE55763). Data are presented as ICC estimates with 95% confidence interval. b, Reliability of epigenetic age and age acceleration in an independent blood DNAm dataset with 37 pairs of technical replicates (Elysium Dataset 1). Data are presented as ICC estimates with 95% confidence interval. c, PC clocks allow for correction for systemic offsets in epigenetic age across batches. Epigenetic age acceleration is shown for 8 individuals with 18 measurements (across 3 batches, 2 scans, and 3 replicates per batch) in Elysium Dataset 2.
Extended Data Fig. 5. Enhanced reliability of PC clocks does not depend on new training data.
a-b, Age acceleration ICC and replicate differences (n = 36 pairs of technical replicates) for Horvath1, Horvath2, and PhenoAge in blood trained using new data (including substitute datasets). Data are presented as ICC estimate with 95% confidence interval. c-d, Same as a-b, for cerebellum (n = 34 pairs of technical replicates). Data are presented as ICC estimate with 95% confidence interval. e-f, Age acceleration reliability in GSE55763 (n = 36 pairs of technical replicates) and mortality prediction in FHS (n = 3935 with 319 deaths) for variations of PhenoAge (e) and Hannum (f) calculated using different CpG sets, sample sizes, and different methods (elastic net, ridge regression, supervised PCA, PC clocks). Data are presented as ICC or HR (1 SD change) estimates with 95% confidence interval. g, PCs from one dataset can be projected to a second dataset for elastic net regression and used to construct reliable PC clocks. PCA was performed in the Hannum GSE40279 dataset then projected to the PhenoAge HRS/InCHIANTI dataset for elastic net regression, and vice versa. These “borrowed” PCs could still be used to reliable age predictors. We plotted age acceleration reliability in GSE55763 (n = 36 pairs of technical replicates) and mortality prediction in FHS (n = 3935 with 319 deaths). Data are presented as ICC or HR (1 SD change) estimates with 95% confidence interval.
Extended Data Fig. 6. Contribution of CpGs and PCs to PC clocks.
a, The effect of a 1 SD change in beta for each CpG on the PC clocks. This was calculated by multiplying the CpG loadings for each PC by the PC weight in the clock, summing these products for each CpG, and multiplying by CpG standard deviation from the GSE55763. Effects are shown on a log base 10 scale. Note that results were similar using standard deviations from the PC clock training data. CpGs present in the original clock are denoted in red. b, Effect of 1 SD change in PC score for each PC on the overall clock. c, Cumulative sum of 1 SD changes in PC scores for each PC (black), plotted against cumulative variance explained for each PC in the original training data (grey).
Extended Data Fig. 7. Low-variance PCs capture aging heterogeneity in physiological systems.
a, Scree plots showing variance explained by PC for PCPhenoAge in training data (black) compared to variance explained for a randomized matrix of the same size as PCPhenoAge training data (red), for the top 150 PCs (split into two graphs for visualization purposes). b-c, Number of new driver CpGs introduced by each PC for all PCs (b) and PCs included in the model (c). d, Cumulative variance plot for PCPhenoAge. e, Plot showing significant univariate linear associations between PhenoAge components and PCPhenoAge PCs, with PCs ordered from highest to lowest variance explained. These were not adjusted for multiple testing as the PCs are meant to be combined by elastic net regression. For d and e, the horizontal lines delineate the selected cutoffs for high-, medium-, and low-variance PCs. f-g, Histograms of the association significance for selected PCPhenoAge PCs (f) and unselected PCs (g), with values reported as -log10(p-value), with significance determined by two-sided t-test, not adjusted for multiple testing. Vertical lines denote p = 0.05. For each PC, we selected the most significant p-value out of the 10 PhenoAge components. h-i, PCPhenoAge was divided into components corresponding to the signal from high-, medium-, and low-variance PCs in both HRS training data (h) and FHS test data (i). Multivariate associations between biomarkers and disease status are shown. Biomarkers were standardized (Z-scores) and modeled using linear regression. Disease status was binary and modeled with logistic regression. PCPhenoAge components were in units of 1 year. For example, a 1-year increase in PCPhenoAge due to medium-variance PCs was associated with a 0.1 SD increase in creatinine in training data and a 0.06 SD increase in test data. Non-significant correlations are denoted by “X”. j, Mortality hazard ratios for a 1-year change in PCPhenoAge components from high-, medium-, and low-variance PCs are shown (n = 3935 with 319 deaths). Data are presented as HR estimate with 95% confidence interval.
Extended Data Fig. 8. PC clocks show improved agreement in cerebellum technical replicates and increased stability in longitudinal blood DNAm data.
a, Ridge plot demonstrating the distributions of clock values for cerebellum technical replicates (GSE43414). b, Biweight midcorrelation between longitudinal changes in clocks for SATSA. c, Repeated measures correlations in longitudinal change in clocks for clozapine dataset. d, Short-term longitudinal blood DNAm data was measured with up to 300 days follow-up after initiation of clozapine. Each line shows the trajectory of an individual’s epigenetic age relative to their baseline during the follow-up period.
Extended Data Fig. 9. PC clocks allow for correction for short-term cell composition shifts.
a, Repeated measures correlations in longitudinal change in clocks for PRISMO dataset. b, Short-term longitudinal blood DNAm data was measured with up to 500 days follow-up in the PRISMO dataset. Each line shows the trajectory of an individual’s epigenetic age relative to their baseline during the follow-up period. Cell-adjusted trajectories were adjusted based on proportions of 5 cell types imputed from DNAm data most correlated with the clocks (granulocytes, plasmablasts, B, CD4T, and CD8T cells). c, Power analysis for a trial evaluating an intervention in a young population to protect from stress-induced pathological aging, based on parameters estimated from the PRISMO study. The red line indicates epigenetic age adjusted for longitudinal changes in granulocytes, plasmablasts, B, CD4T, and CD8T cells.
Supplementary Material
Acknowledgments
This work was supported by the National Institutes of Health NIA 1R01AG068285-01 (MEL), NIA 1R01AG065403-01A1 (MEL), NIA 1R01AG057912-01 (MEL), and NIMH 2T32MH019961-21A1 (AHC). It was also supported by the Thomas P. Detre Fellowship Award in Translational Neuroscience Research from Yale University (AHC) and the Medical Informatics Fellowship Program at the West Haven, CT Veterans Healthcare Administration (AHC). The InCHIANTI study baseline (1998–2000) was supported as a “targeted project” (ICS110.1/RF97.71) by the Italian Ministry of Health and in part by the U.S. National Institute on Aging (Contracts: 263 MD 9164 and 263 MD 821336). The InCHIANTI Follow-up 2 and 3 studies (2004–2010) were financed by the U.S. National Institute on Aging (Contract: N01-AG-5-0002). InCHIANTI was supported in part by the Intramural Research Program of the National Institute on Aging, National Institutes of Health, Baltimore, Maryland, and this work utilized the computational resources of the NIH HPC Biowulf cluster (http://hpc.nih.gov). The HRS study was supported by NIA R01 AG060110 and U01 AG009740. The SATSA study was supported by NIH grants R01 [AG04563, AG10175, AG028555], the MacArthur Foundation Research Network on Successful Aging, the European Union’s Horizon 2020 research and innovation programme [No. 634821], the Swedish Council for Working Life and Social Research (FAS/FORTE) [97:0147:1B, 2009–0795, 2013–2292], the Swedish Research Council [825-2007-7460, 825-2009-6141, 521-2013-8689, 2015-03255]. The recruitment and assessments in the PRISMO study were funded by the Dutch Ministry of Defense, The Netherlands. The longitudinal clozapine study was funded by a personal Rudolf Magnus Talent Fellowship (H150) grant (JJL). The Cellular Lifespan Study was supported by NIA grant R01AG066828 (MP). The funders had no role in study design, data collection and analysis, decision to publish or preparation of the manuscript. We also acknowledge Steve Horvath, Ake Lu, Gregory Hannum, and the many other colleagues who developed the original epigenetic clocks analyzed in this study.
Footnotes
Code Availability Statement
Code to calculate or train PC clocks is available at: https://github.com/MorganLevineLab/PC-Clocks.
Competing Interests Statement
MEL and AHC have built epigenetic aging metrics involving the technology described in the present manuscript, and these metrics are licensed by Elysium Health through Yale University. Elysium provided paired blood and saliva replicate datasets reported in this study, but otherwise did not fund the study and did not play a role in conceptualization, design, decision to publish, or preparation of the manuscript. MEL previously acted as a Scientific Advisor for, and received consulting fees from, Elysium Health, Inc. THS was previously an employee of Elysium Health, Inc. AHC received consulting fees from FOXO Technologies, Inc. for work unrelated to the present manuscript. All other authors report no biomedical financial interests or potential conflicts of interest.
Data Availability Statement
Most datasets used in this study are publicly available on NCBI GEO, ArrayExpress, or TCGA and are listed in Supplementary Table 6 along with accession codes. HRS data contains sensitive health data, and is available by application to researchers at hrsdata.isr.umich.edu. FHS data contains sensitive health data, and researchers can apply at https://dbgap.ncbi.nlm.nih.gov/aa/ (dbGaP, accession number: phs000724.v7.p11). InCHIANTI data contains sensitive health data and is available upon review and subsequent approval of proposals submitted through the study website (inchiantistudy.net). The Elysium datasets are proprietary and owned by Elysium Health, Inc., and inquiries about the data can be made to research@elysiumhealth.com. Owing to military cohort data sharing restrictions, data from the PRISMO study cannot be publicly posted. However, such data may be made available to researchers following an approved analysis proposal and in a de-identified form through a data use agreement following applicable guidelines on data sharing and privacy protection. For additional information on access to these data please contact S.G.Geuze@umcutrecht.nl. Longitudinal clozapine data contains sensitive health data, and researchers can inquire about access to the data by contacting j.luykx@umcutrecht.nl. SATSA methylation data is available on ArrayExpress (accession code E-MTAB-7309). For information on access to additional subject-level SATSA data please contact sara.hagg@ki.se.
References
- 1.Jylhävä J, Pedersen NL & Hägg S. Biological Age Predictors. EBioMedicine 21, 29–36 (2017). [DOI] [PMC free article] [PubMed] [Google Scholar]
- 2.Bell CG et al. DNA methylation aging clocks: Challenges and recommendations. Genome Biol. 20, 249 (2019). [DOI] [PMC free article] [PubMed] [Google Scholar]
- 3.Horvath S. & Raj K. DNA methylation-based biomarkers and the epigenetic clock theory of ageing. Nat. Rev. Genet. 19, 371–384 (2018). [DOI] [PubMed] [Google Scholar]
- 4.Sugden K. et al. Patterns of Reliability: Assessing the Reproducibility and Integrity of DNA Methylation Measurement. Patterns 1, 100014 (2020). [DOI] [PMC free article] [PubMed] [Google Scholar]
- 5.Logue MW et al. The correlation of methylation levels measured using Illumina 450K and EPIC BeadChips in blood samples. Epigenomics 9, 1363–1371 (2017). [DOI] [PMC free article] [PubMed] [Google Scholar]
- 6.Bose M. et al. Evaluation of microarray-based DNA methylation measurement using technical replicates: The atherosclerosis risk in communities (ARIC) study. BMC Bioinformatics 15, 1–10 (2014). [DOI] [PMC free article] [PubMed] [Google Scholar]
- 7.Naeem H. et al. Reducing the risk of false discovery enabling identification of biologically significant genome-wide methylation status using the HumanMethylation450 array. BMC Genomics 15, (2014). [DOI] [PMC free article] [PubMed] [Google Scholar]
- 8.Pidsley R. et al. Critical evaluation of the Illumina MethylationEPIC BeadChip microarray for whole-genome DNA methylation profiling. Genome Biol. 17, 1–17 (2016). [DOI] [PMC free article] [PubMed] [Google Scholar]
- 9.Lehne B. et al. A coherent approach for analysis of the Illumina HumanMethylation450 BeadChip improves data quality and performance in epigenome-wide association studies. Genome Biol. 16, 1–12 (2015). [DOI] [PMC free article] [PubMed] [Google Scholar]
- 10.Morris TJ & Beck S. Analysis pipelines and packages for Infinium HumanMethylation450 BeadChip (450k) data. Methods 72, 3–8 (2015). [DOI] [PMC free article] [PubMed] [Google Scholar]
- 11.McEwen LM et al. Systematic evaluation of DNA methylation age estimation with common preprocessing methods and the Infinium MethylationEPIC BeadChip array. Clin. Epigenetics 10, 1–9 (2018). [DOI] [PMC free article] [PubMed] [Google Scholar]
- 12.Liu Z. et al. Underlying features of epigenetic aging clocks in vivo and in vitro. Aging Cell 1–11 (2020) doi: 10.1111/acel.13229. [DOI] [PMC free article] [PubMed] [Google Scholar]
- 13.Koo TK & Li MY A Guideline of Selecting and Reporting Intraclass Correlation Coefficients for Reliability Research. J. Chiropr. Med. 15, 155–163 (2016). [DOI] [PMC free article] [PubMed] [Google Scholar]
- 14.Horvath S. DNA methylation age of human tissues and cell types. Genome Biol. 14, 3156 (2013). [DOI] [PMC free article] [PubMed] [Google Scholar]
- 15.Horvath S. et al. Epigenetic clock for skin and blood cells applied to Hutchinson Gilford Progeria Syndrome and ex vivo studies. Aging (Albany. NY). 10, 1758–1775 (2018). [DOI] [PMC free article] [PubMed] [Google Scholar]
- 16.Hannum G. et al. Genome-wide Methylation Profiles Reveal Quantitative Views of Human Aging Rates. Mol. Cell 49, 359–367 (2013). [DOI] [PMC free article] [PubMed] [Google Scholar]
- 17.Levine M. et al. An epigenetic biomarker of aging for lifespan and healthspan. Aging (Albany. NY). 10, 276162 (2018). [DOI] [PMC free article] [PubMed] [Google Scholar]
- 18.Lu AT et al. DNA methylation-based estimator of telomere length. Aging (Albany. NY). 11, 5895–5923 (2019). [DOI] [PMC free article] [PubMed] [Google Scholar]
- 19.Bocklandt S. et al. Epigenetic predictor of age. PLoS One 6, e14821 (2011). [DOI] [PMC free article] [PubMed] [Google Scholar]
- 20.Teschendorff AE A comparison of epigenetic mitotic-like clocks for cancer risk prediction. Genome Med. 12, 1–17 (2020). [DOI] [PMC free article] [PubMed] [Google Scholar]
- 21.Youn A. & Wang S. The MiAge Calculator: a DNA methylation-based mitotic age calculator of human tissue types. Epigenetics 13, 192–206 (2018). [DOI] [PMC free article] [PubMed] [Google Scholar]
- 22.Belsky D. et al. Quantification of the pace of biological aging in humans through a blood test: a DNA methylation algorithm. Elife 2020.02.05.927434 (2020) doi: 10.1101/2020.02.05.927434. [DOI] [PMC free article] [PubMed] [Google Scholar]
- 23.McCartney D. et al. Epigenetic prediction of complex traits and death. Genome Biol. 19, 136 (2018). [DOI] [PMC free article] [PubMed] [Google Scholar]
- 24.Houseman EA et al. DNA methylation arrays as surrogate measures of cell mixture distribution. BMC Bioinformatics 13, 86 (2012). [DOI] [PMC free article] [PubMed] [Google Scholar]
- 25.Zhang Y. et al. DNA methylation signatures in peripheral blood strongly predict all-cause mortality. Nat. Commun. 8, 1–11 (2017). [DOI] [PMC free article] [PubMed] [Google Scholar]
- 26.Lu AT et al. DNA methylation GrimAge strongly predicts lifespan and healthspan. Aging (Albany. NY). 11, 303–327 (2019). [DOI] [PMC free article] [PubMed] [Google Scholar]
- 27.Lin Q. & Wagner W. Epigenetic Aging Signatures Are Coherently Modified in Cancer. PLoS Genet. 11, 1–17 (2015). [DOI] [PMC free article] [PubMed] [Google Scholar]
- 28.Weidner CI et al. Aging of blood can be tracked by DNA methylation changes at just three CpG sites. Genome Biol. 15, (2014). [DOI] [PMC free article] [PubMed] [Google Scholar]
- 29.Vidal-Bralo L, Lopez-Golan Y. & Gonzalez A. Simplified assay for epigenetic age estimation in whole blood of adults. Front. Genet. 7, 1–7 (2016). [DOI] [PMC free article] [PubMed] [Google Scholar]
- 30.Garagnani P. et al. Methylation of ELOVL2 gene as a new epigenetic marker of age. Aging Cell 11, 1132–1134 (2012). [DOI] [PubMed] [Google Scholar]
- 31.Higgins-Chen AT, Thrush KL & Levine ME Aging biomarkers and the brain. Semin. Cell Dev. Biol. 116, 180–193 (2021). [DOI] [PMC free article] [PubMed] [Google Scholar]
- 32.Jolliffe IT A Note on the Use of Principal Components in Regression. J. R. Stat. Soc. Ser. C (Applied Stat. 31, 300–303 (1982). [Google Scholar]
- 33.Yan Y, Goodman JM, Moore DD, Solla SA & Bensmaia SJ Unexpected complexity of everyday manual behaviors. Nat. Commun. 11, 1–8 (2020). [DOI] [PMC free article] [PubMed] [Google Scholar]
- 34.Aschard H. et al. Maximizing the power of principal-component analysis of correlated phenotypes in genome-wide association studies. Am. J. Hum. Genet. 94, 662–676 (2014). [DOI] [PMC free article] [PubMed] [Google Scholar]
- 35.Tarashansky AJ, Xue Y, Li P, Quake SR & Wang B. Self-assembling manifolds in single-cell RNA sequencing data. Elife 8, 1–29 (2019). [DOI] [PMC free article] [PubMed] [Google Scholar]
- 36.Pidsley R. et al. A data-driven approach to preprocessing Illumina 450K methylation array data. BMC Genomics 14, (2013). [DOI] [PMC free article] [PubMed] [Google Scholar]
- 37.Sturm G. et al. A Multi-Omics and Bioenergetics Longitudinal Aging Dataset in Primary Human Fibroblasts with Mitochondrial Perturbations. bioRxiv 2021.11.12.468448 (2021) doi: 10.1101/2021.11.12.468448. [DOI] [PMC free article] [PubMed] [Google Scholar]
- 38.Li X. et al. Longitudinal trajectories, correlations and mortality associations of nine biological ages across 20-years follow-up. Elife 9, 1–20 (2020). [DOI] [PMC free article] [PubMed] [Google Scholar]
- 39.Wang Y. et al. Epigenetic influences on aging: a longitudinal genome-wide methylation study in old Swedish twins. Epigenetics 13, 975–987 (2018). [DOI] [PMC free article] [PubMed] [Google Scholar]
- 40.Bakdash JZ & Marusich LR Repeated measures correlation. Front. Psychol. 8, 1–13 (2017). [DOI] [PMC free article] [PubMed] [Google Scholar]
- 41.Liu G. & Liang K-Y Sample Size Calculations for Studies with Correlated Observations. Biometrics 53, 937–947 (1997). [PubMed] [Google Scholar]
- 42.Wagner W. The link between epigenetic clocks for aging and senescence. Front. Genet. 10, 1–6 (2019). [DOI] [PMC free article] [PubMed] [Google Scholar]
- 43.Itahana K, Campisi J. & Dimri GP Mechanisms of cellular senescence in human and mouse cells. Biogerontology 5, 1–10 (2004). [DOI] [PubMed] [Google Scholar]
- 44.Chen H, Li Y. & Tollefsbol TO Cell Senescence Culturing Methods. in Biological Aging: Methods and Protocols (ed. Tollefsbol TO) 1–10 (Humana Press, 2013). doi: 10.1007/978-1-62703-556-9_1. [DOI] [PMC free article] [PubMed] [Google Scholar]
- 45.Oblak L, van der Zaag J, Higgins-Chen AT, Levine ME & Boks MP A systematic review of biological, social and environmental factors associated with epigenetic clock acceleration. Ageing Res. Rev. 69, 101348 (2021). [DOI] [PubMed] [Google Scholar]
- 46.Chen L. et al. Effects of Vitamin D 3 supplementation on epigenetic aging in overweight and obese african americans with suboptimal Vitamin D status: A randomized clinical trial. Journals Gerontol. - Ser. A Biol. Sci. Med. Sci 74, 91–98 (2019). [DOI] [PMC free article] [PubMed] [Google Scholar]
- 47.Fahy GM et al. Reversal of epigenetic aging and immunosenescent trends in humans. Aging Cell 18, 1–12 (2019). [DOI] [PMC free article] [PubMed] [Google Scholar]
- 48.Fitzgerald KN et al. Potential reversal of epigenetic age using a diet and lifestyle intervention: a pilot randomized clinical trial. Aging (Albany. NY). 13, 9419–9432 (2021). [DOI] [PMC free article] [PubMed] [Google Scholar]
- 49.Field AE et al. DNA Methylation Clocks in Aging: Categories, Causes, and Consequences. Mol. Cell 71, 882–895 (2018). [DOI] [PMC free article] [PubMed] [Google Scholar]
- 50.Raj K. & Horvath S. Current perspectives on the cellular and molecular features of epigenetic ageing. Exp. Biol. Med. 245, 1532–1542 (2020). [DOI] [PMC free article] [PubMed] [Google Scholar]
- 51.Robinson O. et al. Determinants of accelerated metabolomic and epigenetic ageing in a UK cohort. Aging Cell 1–28 (2020) doi: 10.1101/411603. [DOI] [PMC free article] [PubMed] [Google Scholar]
- 52.Aryee MJ et al. Minfi: A flexible and comprehensive Bioconductor package for the analysis of Infinium DNA methylation microarrays. Bioinformatics 30, 1363–1369 (2014). [DOI] [PMC free article] [PubMed] [Google Scholar]
- 53.Heiss JA & Just AC Improved filtering of DNA methylation microarray data by detection p values and its impact on downstream analyses. Clin. Epigenetics 11, 1–8 (2019). [DOI] [PMC free article] [PubMed] [Google Scholar]
- 54.Ferrucci L. et al. Subsystems contributing to the decline in ability to walk: Bridging the gap between epidemiology and geriatric practice in the InCHIANTI study. J. Am. Geriatr. Soc. 48, 1618–1625 (2000). [DOI] [PubMed] [Google Scholar]
- 55.Moore AZ et al. Change in Epigenome-Wide DNA Methylation Over 9 Years and Subsequent Mortality: Results From the InCHIANTI Study. Journals Gerontol. - Ser. A Biol. Sci. Med. Sci. 71, 1029–1035 (2016). [DOI] [PMC free article] [PubMed] [Google Scholar]
- 56.Crimmins EM, Thyagarajan B, Levine ME, Weir DR & Faul J. Associations of Age, Sex, Race/Ethnicity, and Education With 13 Epigenetic Clocks in a Nationally Representative U.S. Sample: The Health and Retirement Study. Journals Gerontol. Ser. A 76, 1117–1123 (2021). [DOI] [PMC free article] [PubMed] [Google Scholar]
- 57.Kannel WB, Feinleib M, McNamara PM, Garrison RJ & Castelli WP An Investigation of coronary heart disease in families: The Framingham Offspring Study. Am. J. Epidemiol. 110, 281–290 (1979). [DOI] [PubMed] [Google Scholar]
- 58.Splansky GL et al. The Third Generation Cohort of the National Heart, Lung, and Blood Institute’s Framingham Heart Study: Design, recruitment, and initial examination. Am. J. Epidemiol. 165, 1328–1335 (2007). [DOI] [PubMed] [Google Scholar]
- 59.Finkel D. & Pedersen NL Processing speed and longitudinal trajectories of change for cognitive abilities: The Swedish Adoption/Twin Study of Aging. Aging, Neuropsychol. Cogn. 11, 325–345 (2004). [Google Scholar]
- 60.van der Wal SJ et al. Associations between the development of PTSD symptoms and longitudinal changes in the DNA methylome of deployed military servicemen: A comparison with polygenic risk scores. Compr. Psychoneuroendocrinology 4, 100018 (2020). [DOI] [PMC free article] [PubMed] [Google Scholar]
- 61.Van Der Wal SJ, Gorter R, Reijnen A, Geuze E. & Vermetten E. Cohort profile: The Prospective Research in Stress-Related Military Operations (PRISMO) study in the Dutch Armed Forces. BMJ Open 9, 1–10 (2019). [DOI] [PMC free article] [PubMed] [Google Scholar]
- 62.Higgins-Chen AT, Boks MP, Vinkers CH, Kahn RS & Levine ME Schizophrenia and Epigenetic Aging Biomarkers: Increased Mortality, Reduced Cancer Risk, and Unique Clozapine Effects. Biol. Psychiatry (2020) doi: 10.1016/j.biopsych.2020.01.025. [DOI] [PMC free article] [PubMed] [Google Scholar]
- 63.Levine ME, Higgins-Chen A, Thrush K, Minteer C. & Niimi P. Clock Work: Deconstructing the Epigenetic Clock Signals in Aging, Disease, and Reprogramming. bioRxiv 2022.02.13.480245 (2022) doi: 10.1101/2022.02.13.480245. [DOI] [Google Scholar]
- 64.Triche TJ, Weisenberger DJ, Van Den Berg D, Laird PW & Siegmund KD Low-level processing of Illumina Infinium DNA Methylation BeadArrays. Nucleic Acids Res. 41, 1–11 (2013). [DOI] [PMC free article] [PubMed] [Google Scholar]
- 65.Daniali L. et al. Telomeres shorten at equivalent rates in somatic tissues of adults. Nat. Commun. 4, 1597 (2013). [DOI] [PMC free article] [PubMed] [Google Scholar]
- 66.Zhuang J, Widschwendter M. & Teschendorff AE A comparison of feature selection and classification methods in DNA methylation studies using the Illumina Infinium platform. BMC Bioinformatics 13, 1–14 (2012). [DOI] [PMC free article] [PubMed] [Google Scholar]
- 67.Friedman J, Hastie T. & Tibshirani R. Regularization Paths for Generalized Linear Models via Coordinate Descent. J. Stat. Softw. 33, 1–22 (2010). [PMC free article] [PubMed] [Google Scholar]
- 68.Bair E. & Tibshirani R. Semi-supervised methods to predict patient survival from gene expression data. PLoS Biol. 2, (2004). [DOI] [PMC free article] [PubMed] [Google Scholar]
- 69.Bair E, Hastie T, Paul D. & Tibshirani R. Prediction by supervised principal components. J. Am. Stat. Assoc. 101, 119–137 (2006). [Google Scholar]
- 70.Kuznetsova A, Brockhoff PB & Christensen RHB lmerTest Package: Tests in Linear Mixed Effects Models. J. Stat. Softw 82, (2017). [Google Scholar]
Associated Data
This section collects any data citations, data availability statements, or supplementary materials included in this article.
Supplementary Materials
Data Availability Statement
Most datasets used in this study are publicly available on NCBI GEO, ArrayExpress, or TCGA and are listed in Supplementary Table 6 along with accession codes. HRS data contains sensitive health data, and is available by application to researchers at hrsdata.isr.umich.edu. FHS data contains sensitive health data, and researchers can apply at https://dbgap.ncbi.nlm.nih.gov/aa/ (dbGaP, accession number: phs000724.v7.p11). InCHIANTI data contains sensitive health data and is available upon review and subsequent approval of proposals submitted through the study website (inchiantistudy.net). The Elysium datasets are proprietary and owned by Elysium Health, Inc., and inquiries about the data can be made to research@elysiumhealth.com. Owing to military cohort data sharing restrictions, data from the PRISMO study cannot be publicly posted. However, such data may be made available to researchers following an approved analysis proposal and in a de-identified form through a data use agreement following applicable guidelines on data sharing and privacy protection. For additional information on access to these data please contact S.G.Geuze@umcutrecht.nl. Longitudinal clozapine data contains sensitive health data, and researchers can inquire about access to the data by contacting j.luykx@umcutrecht.nl. SATSA methylation data is available on ArrayExpress (accession code E-MTAB-7309). For information on access to additional subject-level SATSA data please contact sara.hagg@ki.se.


