

Abstract
Physical exercise is generally beneficial to all aspects of human and animal health, slowing cognitive ageing and neurodegeneration1. The cognitive benefits of physical exercise are tied to an increased plasticity and reduced inflammation within the hippocampus2–4, yet little is known about the factors and mechanisms that mediate these effects. Here we show that ‘runner plasma’, collected from voluntarily running mice and infused into sedentary mice, reduces baseline neuroinflammatory gene expression and experimentally induced brain inflammation. Plasma proteomic analysis revealed a concerted increase in complement cascade inhibitors including clusterin (CLU). Intravenously injected CLU binds to brain endothelial cells and reduces neuroinflammatory gene expression in a mouse model of acute brain inflammation and a mouse model of Alzheimer’s disease. Patients with cognitive impairment who participated in structured exercise for 6 months had higher plasma levels of CLU. These findings demonstrate the existence of anti-inflammatory exercise factors that are transferrable, target the cerebrovasculature and benefit the brain, and are present in humans who engage in exercise.
Physical activity evokes profound physiological responses in multiple tissues across the animal kingdom and is accepted to broadly improve human health1,5. The benefits of exercise extend to patients with neurodegeneration and brain trauma6,7, possibly by reducing neuroinflammation2. Long-term voluntary exercise in mouse models of Alzheimer’s disease (AD) and related disorders improve learning and memory, and decrease neuroinflammation3,7,8. How exercise exerts these beneficial effects is poorly understood. It has been proposed that ‘exercise factors’–secreted from muscle and other tissues into the blood–subsequently signal to the brain. Factors including IGF-1 (ref. 9), VEGF10 and PF4 (ref.11) increase hippocampal neurogenesis in young mice, whereas GPDL1 rescues the age-related loss in neurogenesis and cognition in old mice12 (Extended Data Table 1). However, it is unknown whether exercise-conditioned plasma contains factors that benefit the young healthy brain, whether these factors are directly transferrable through the plasma, whether such factors mediate the anti-inflammatory effect of exercise and what the key factors are.
Runner plasma improves cognition
Given these beneficial effects of exercise on the hippocampus, we investigated whether plasma from exercising male mice (runner plasma (RP)) transferred into young non-exercising littermates can mimic running; mice without access to a running wheel in their cage generated control plasma (CP) (Fig. 1a; details of the set-up are provided in the Methods). We observed that 28 d of running was sufficient to increase overall cell survival (BrdU+ cells), including neurons(NeuN+BrdU+ cells), the number of neural stem and progenitor cells (NSPCs; Sox2+GFAP− cells) and astrocytes (GFAP+BrdU+ cells) and that this effect was most prominent in mice aged 3 months (Extended Data Fig. 1a–d). Notably, recipient mice that received RP showed a significant increase in total proliferating cells, DCX+ neuroblasts and surviving cells compared with CP-recipient mice (Fig. 1b, c). Notably, these results are very similar to the direct effects of running described above (Extended Data Fig. 1a–d). Importantly, repeated control injections of saline through the retro-orbital vein under anaesthesia did not significantly alter hippocampal cell proliferation and survival, whereas restraining mice and injecting them through the tail vein reduced proliferation (Extended Data Fig. 1e). Furthermore, RP induced a twofold expansion of surviving NSPCs compared with CP. However, RP did not significantly increase the number of surviving mature neurons and, instead, lead to a twofold increase in the survival of newly produced astrocytes (Fig. 1c). In an independent experiment, RP from mice that had access to a running wheel for 28 d replicated these findings, whereas RP from mice that had access to a running wheel for 7 d or 14 d increased only the neuroblast counts and did not increase cell proliferation and survival (Extended Data Fig. 1f).
Fig. 1 |. RP induces neuroplasticity, improves cognition and reduces inflammation.
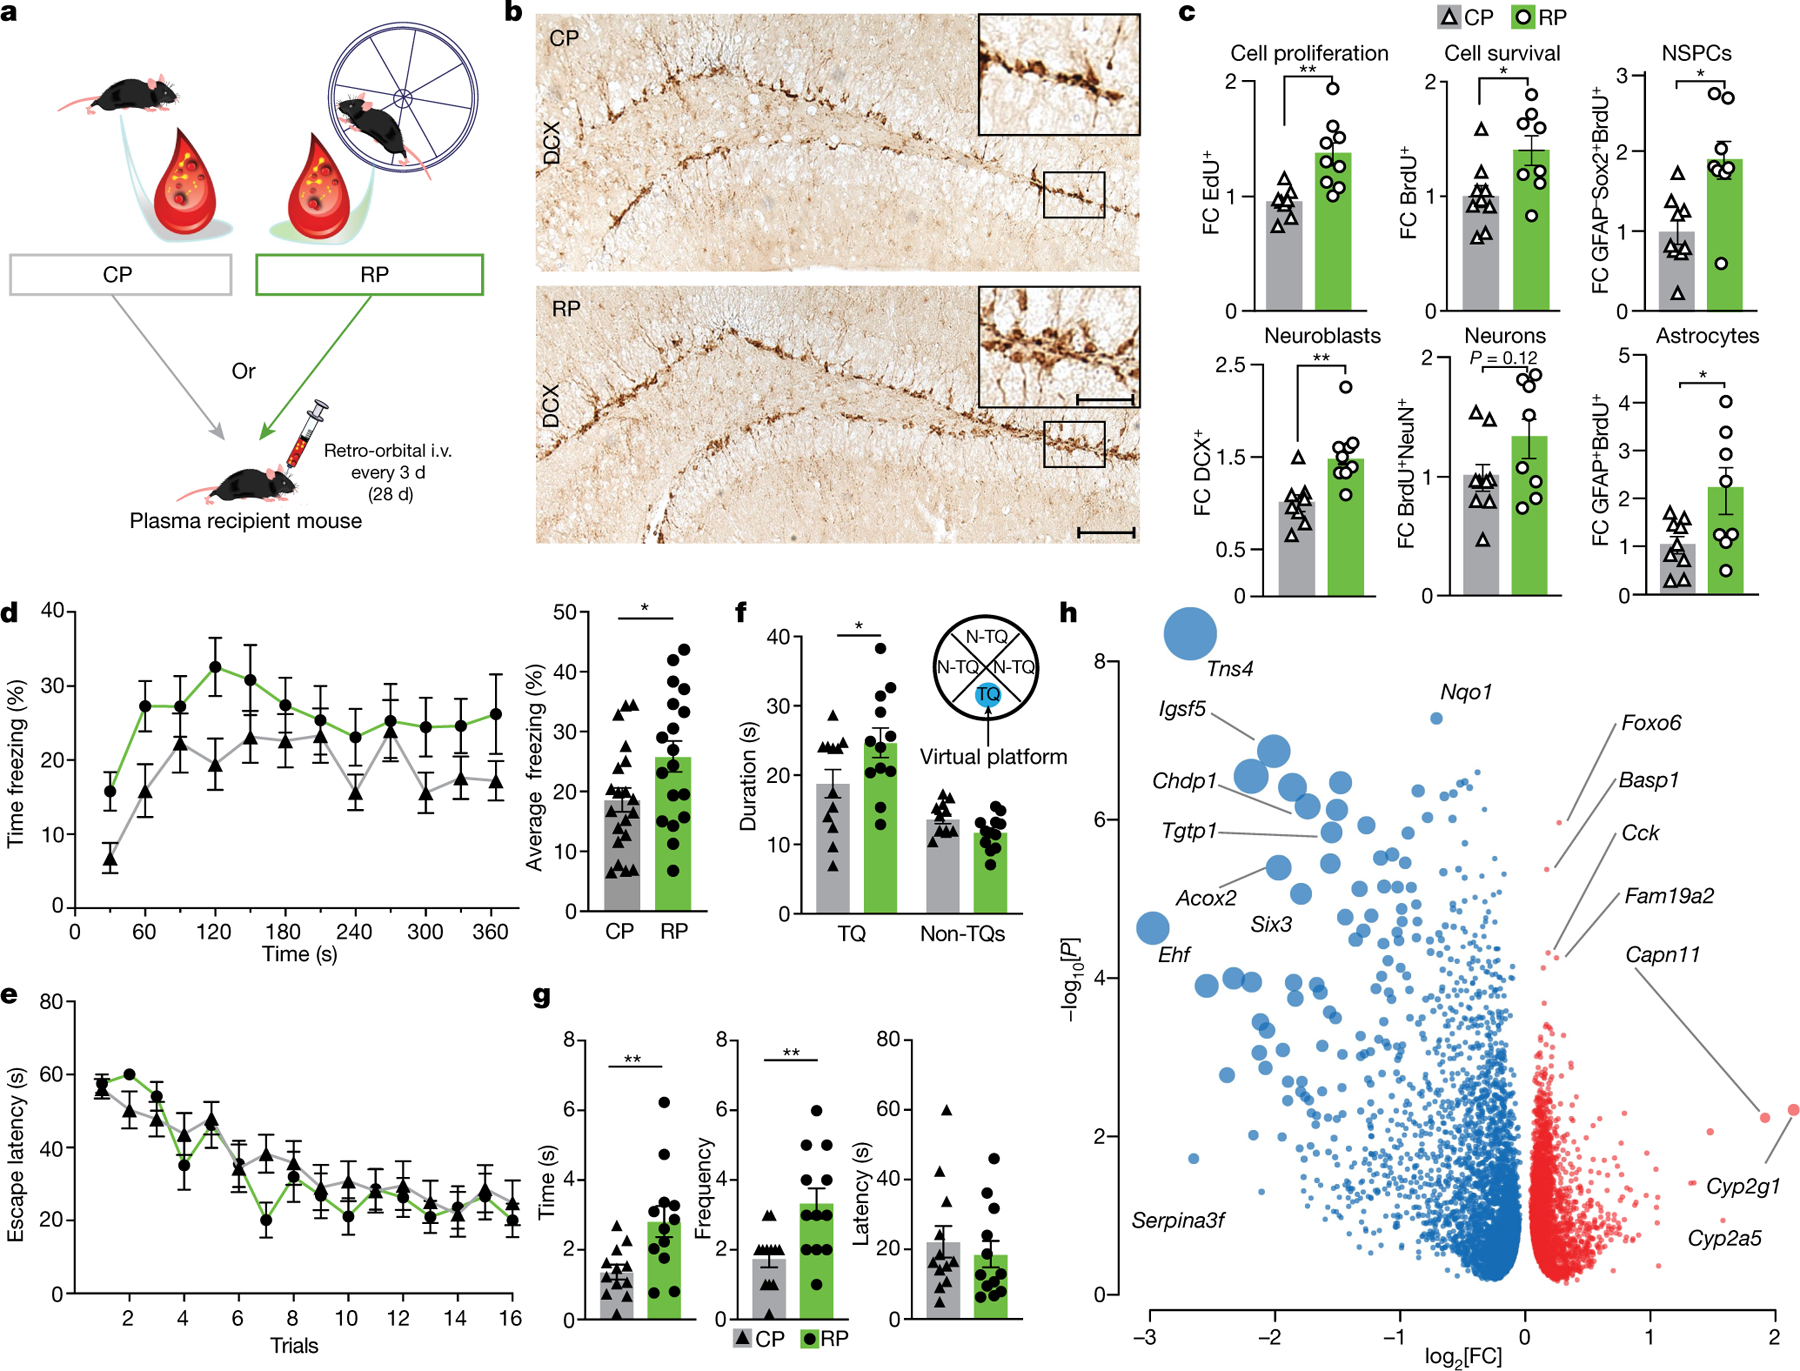
a, Plasma from running male mice was transferred to age- and sex-matched non-running mice. BrdU was administered 3 d before plasma administration and EdU was administered 24 h before euthanasia. The hippocampus was analysed using RNA-seq and immunohistochemistry. i.v., intravenous. b, Representative images of immunolabelled DCX+ cells in the DG of mice that were treated with CP or RP. Scale bars, 100 μm and 50 μm (inset). c, Fold change (FC) in immunolabelled cells per DG. For EdU and DCX, n = 8 (CP), n = 9 (RP); for BrdU, NSPCs, neurons and astrocytes, n = 9 (CP), n = 8 (RP). Data are mean ± s.e.m. Statistical analysis was performed using unpaired Student’s two-tailed t-tests; *P < 0.05, **P < 0.01. d, The percentage of time freezing during the contextual memory test in CP-recipient (n = 20) and RP-recipient (n = 18) mice. Data are mean ± s.e.m. Statistical analysis was performed using unpaired Student’s two-tailed t-tests; *P < 0.05. e, Escape latencies of CP- and RP-infused mice in the Morris water maze test. n = 12 per group. Data are mean ± s.e.m. f, Time spent in the target quadrant (TQ) for CP- and RP-infused mice. n = 12 per group. Data are mean ± s.e.m. Statistical analysis was performed using one-way analysis of variance (ANOVA) and Sidak’s post hoc test; *P < 0.05. N-TQ, non-TQ. g, The time, frequency and latency of CP- and RP-infused mice interacting with the virtual platform. n = 12 per group. Data are mean ± s.e.m. Statistical analysis was performed using unpaired Student’s two-tailed t-tests; **P < 0.01. h, Downregulated (blue) and upregulated (red) genes in the hippocampus of mice injected with CP or RP. The dot size represents the product of log2-transformed fold change and −log10-transformed P values. Statistical analysis was performed using Wald tests; P < 0.05. n = 8 per group. The images in a were generated using MediaLab (https://medialab.biochem.wisc.edu/clip-art/), Servier Medical Art (https://smart.servier.com) and Freepik (https://www.freepik.com).
Consistent with the effects on neurogenesis, injection of RP, but not CP, increased the contextual learning and memory of mice in the fear conditioning paradigm (Fig. 1d) without affecting their response to auditory cues, activity in a light–dark arena or anxiety levels in the activity chamber (Extended Data Fig. 2a, b). Similarly, RP improved their performance in the Morris water maze (Fig. 1e–g and Extended Data Fig. 2c)–a test of spatial learning and memory.
To understand the molecular underpinnings of these effects, we analysed the hippocampal transcriptome of mice treated with CP or RP using RNA sequencing (RNA-seq). We observed 1,952 significant differentially expressed genes (DEGs), of which 61% were downregulated and 39% were upregulated after RP treatment (Fig. 1h and Supplementary Table 1). Genes implicated in cell migration (Tns4), adhesion (Igsf5), and epithelial cell differentiation and proliferation (Ehf) were downregulated, whereas genes implicated in hippocampal learning and memory (Foxo6) and immune system and plasticity (Fam19a2) were upregulated. Interestingly, the top 250 DEGs pointed to a downregulation of the acute inflammatory response as the most significantly affected biological pathway, followed by upregulation of cell junction organization and negative regulation of proteolysis according to Gene Ontology (GO) and REVIGO (Supplementary Table 2 and Extended Data Fig. 2d). These findings indicate that plasma factors from running male mice are largely sufficient to reproduce the effects of running on hippocampal neurogenesis, improve learning and memory, and downregulate the baseline expression of inflammatory genes in the young adult hippocampus.
RP reduces neuroinflammation
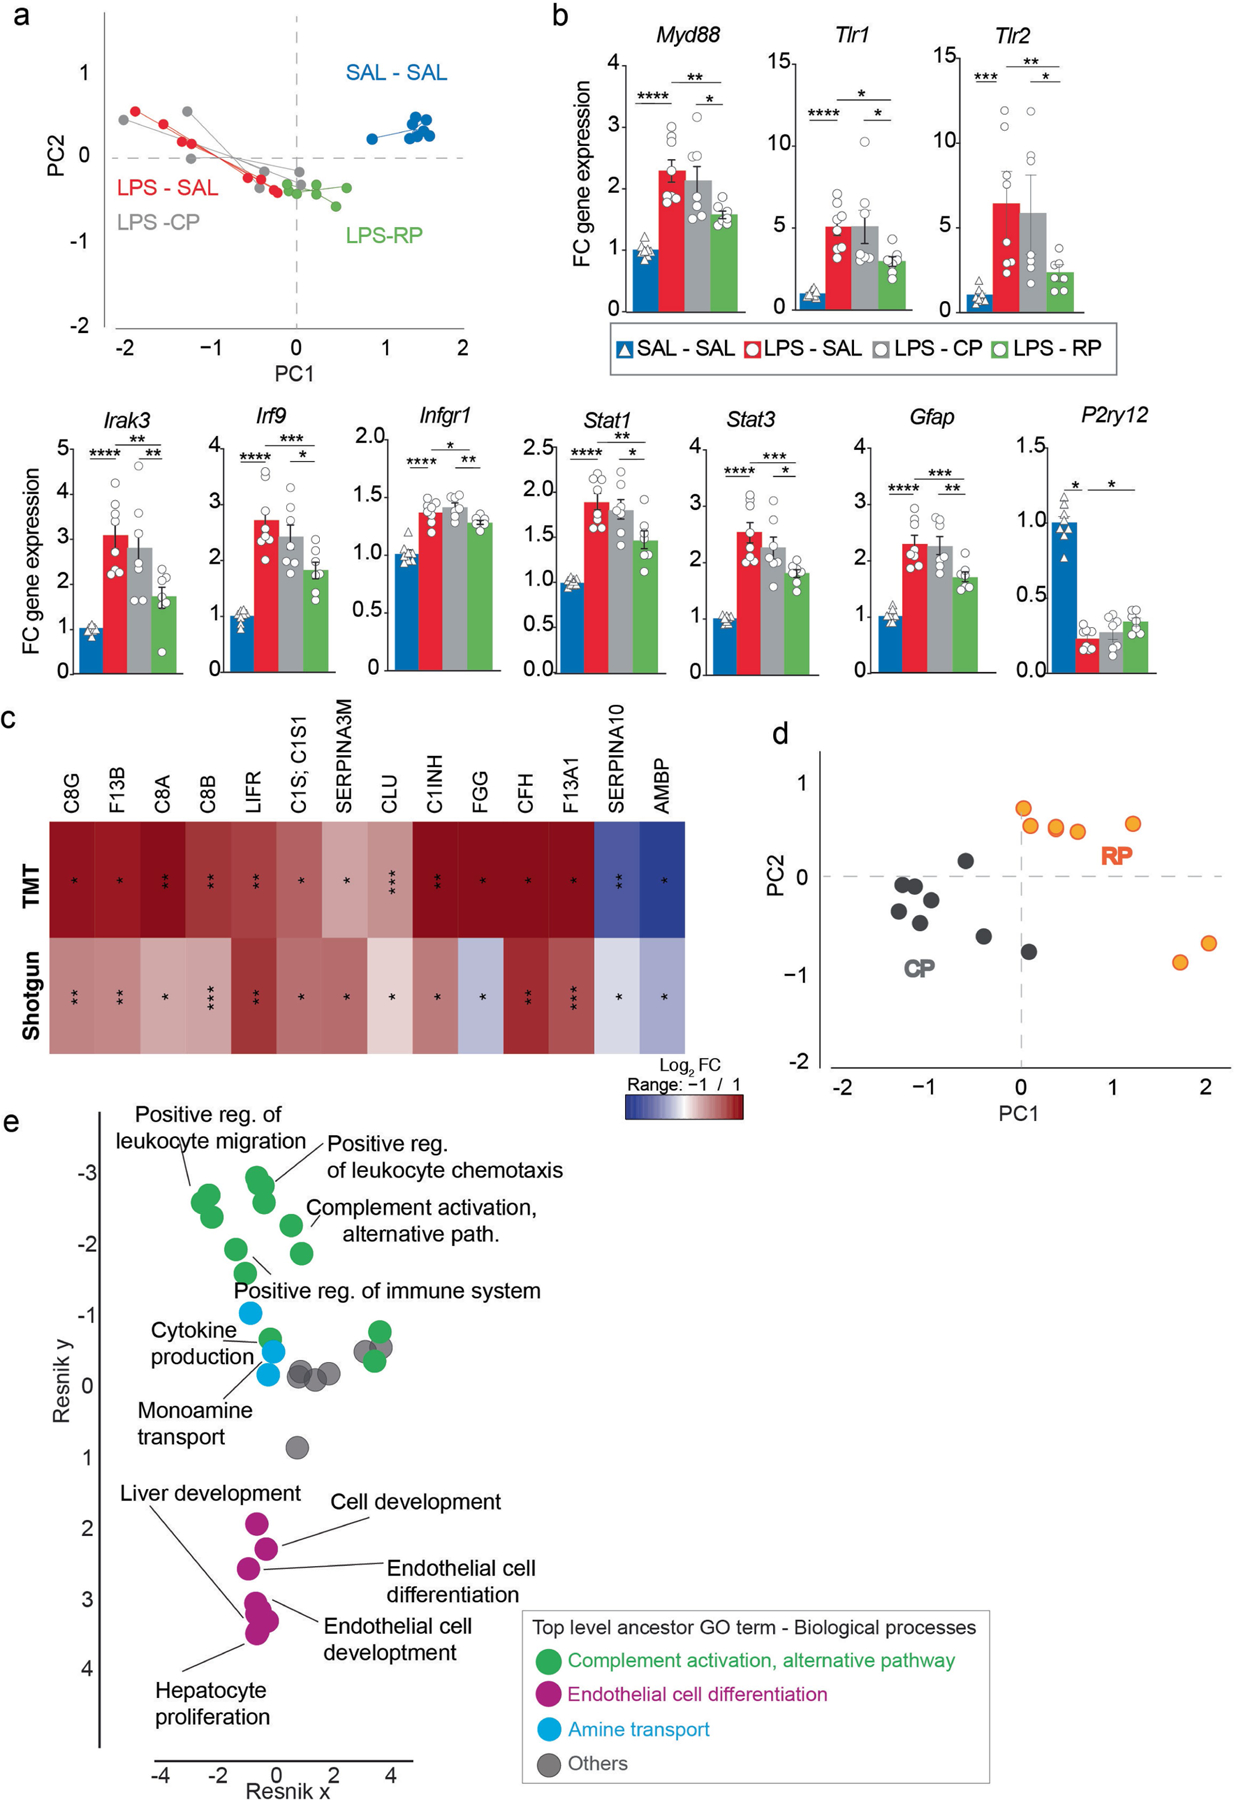
Peripheral administration of lipopolysaccharide (LPS), which is the major component of the outer membrane of Gram-negative bacteria, can model neuroinflammation associated with neurodegenerative diseases by inducing cerebrovascular13 and central neuroinflammation14. As infusion of RP downregulates immune and inflammatory genes (Fig. 1h), we tested whether RP infusions could reduce acutely induced neuroinflammation in mice that were systemically inoculated with LPS (Fig. 2a). Administration of LPS resulted in 4,936 DEGs in the hippocampus. Strikingly, treatment with RP, but not CP, reversed the expression of a large number of these genes (r = −0.78) such that the hippocampal transcriptome of RP-treated mice had greater similarity to that of control mice that did not receive LPS (Fig. 2b, Extended Data Fig. 3a and Supplementary Tables 3 and 4). For example, RP reduced the expression of genes–validated using quantitative PCR (qPCR) (Extended Data Fig. 3b and Supplementary Table 5)–of the toll-like receptor (TLR) signalling pathway (Myd88, Tlr1 and Tlr2, and Irak3), the interferon pathway (Irf9, Infgr1, Stat1 and Stat3) as well as glial fibrillary acidic protein (Gfap), a sensitive indicator of astrocyte activation. Pathway analysis of the most significant 500 DEGs pointed to response to cytokine, regulation of the innate immune response, regulation of the response to stimulus and cytokine production (Fig. 2c and Supplementary Table 6). Together, these results demonstrate that RP effectively antagonizes the neuroinflammatory response to LPS in the hippocampus.
Fig. 2 |. RP counteracts LPS-induced neuroinflammation.
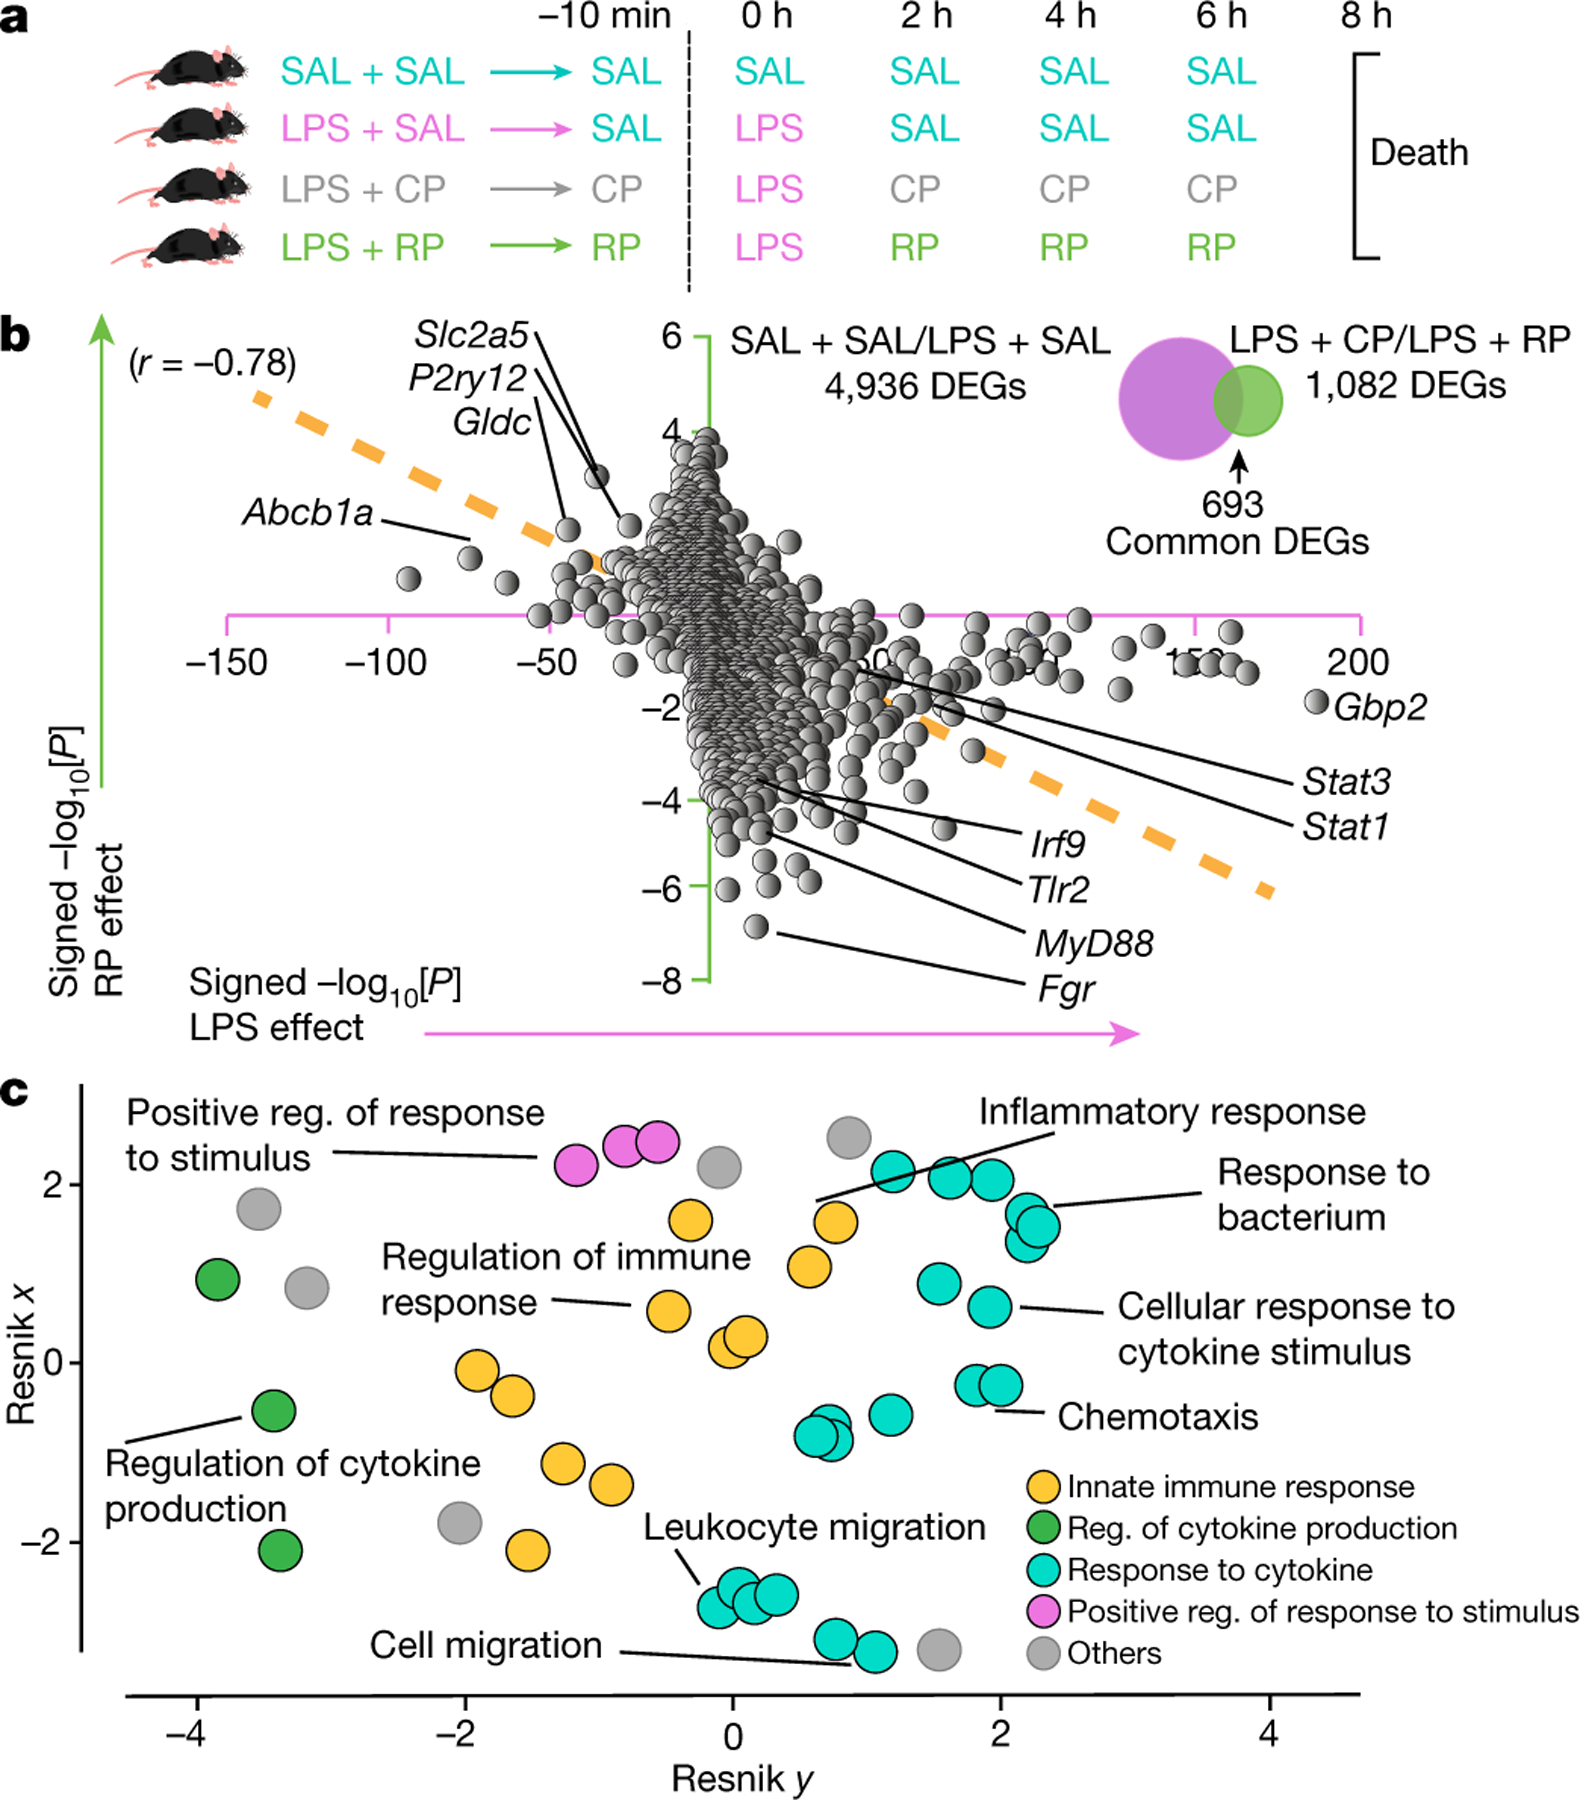
a, Male mice that were injected with LPS were treated with saline (SAL), RP or CP. An additional control group received SAL for all injections. b, Hippocampal DEGs shown as a correlation of the changes in signed −log10-transformed P values (Wald test, P < 0.05) with LPS (SAL + SAL (n = 8) versus LPS + SAL (n = 8)) and RP treatment (LPS + CP (n = 7) versus LPS + RP (n = 8)). c, Hierarchical networks of the abundance of GO terms (Fisher’s exact test, P < 0.05) related to biological processes using REVIGO (Resnik measurement, 0.7 distance). The GO terms correspond to the DEGs shown in b. Reg., regulation. The images in a were generated using MediaLab (https://medialab.biochem.wisc.edu/clip-art/).
Running alters complement pathway proteins
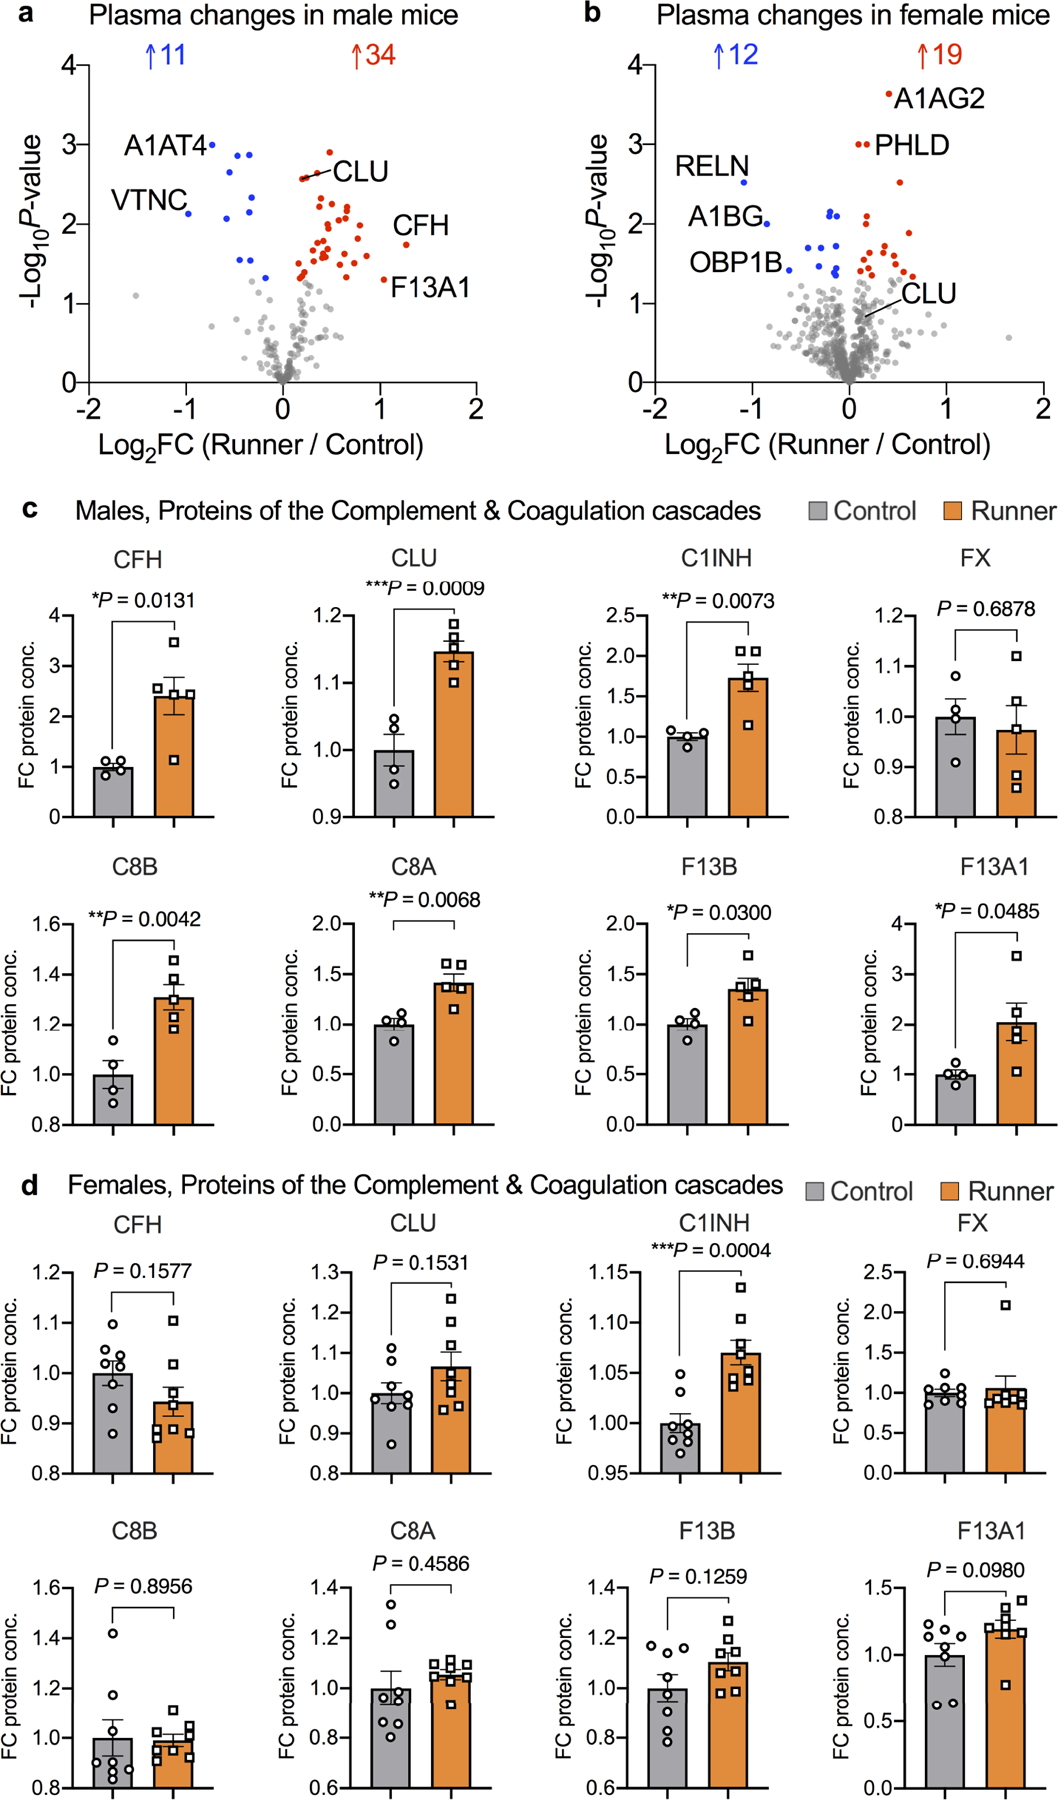
We next investigated how running affects the plasma proteome. We analysed the proteome of RP and CP using unbiased shotgun mass spectrometry (MS) (Fig. 3a), as well as tandem mass tag (TMT) isobaric labelling of proteins and synchronous precursor selection-based MS3 (SPS-MS3) MS (Extended Data Fig. 3c). We identified 235 unique proteins across the two experimental conditions; of these, 23 were downregulated and 26 were upregulated in the plasma of running mice (Fig. 3b, Extended Data Fig. 3c, d and Supplementary Tables 7 and 8). Biological pathway analysis pointed to activation of the alternative pathway of the complement system and endothelial cell differentiation (Extended Data Fig. 3e and Supplementary Table 9). Notably, proteins of the complement and coagulation pathways represent 26% of the significantly changed proteins (Fig. 3c). These two pathways are evolutionarily related to proteins such as factor H (FH), complement factors C3a and C5a, or tissue factors that affect both cascades15,16.
Fig. 3 |. Running alters complement and coagulation proteins.
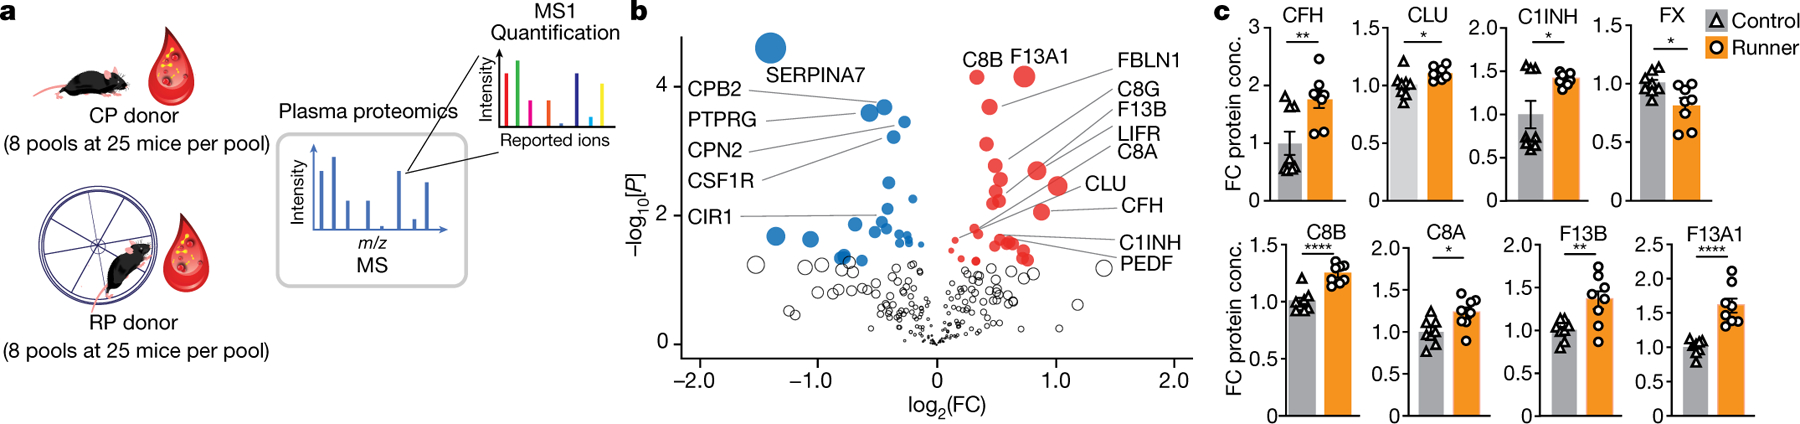
a, Eight pools of RP or CP (n = 25 male mice per pool) were collected, dialysed and analysed using shotgun LC–MS/MS. b, The downregulated (blue) and upregulated (red) proteins (Student’s two-tailed t-test, P < 0.05) in RP versus CP (n = 8 per group). The dot size represents the product of log2-transformed fold change and − log10-transformed P values. c, Complement and coagulation proteins significantly changed with running. Data are mean ± s.e.m. n = 8 per group. Statistical analysis was performed using unpaired Student’s two-tailed t-tests; *P < 0.05, **P < 0.01, ***P < 0.001, ****P < 0.0001. Conc., concentration. The images in a were generated using Freepik (https://www.freepik.com) and MediaLab (https://medialab.biochem.wisc.edu/clip-art/).
The downregulation of FX and CPB2 along with the upregulation of F13A1 and F13B suggest that the clotting cascade is overall inhibited in runners. Indeed, assessment of fibrinolysis and measurement of clot formation over time showed a significant reduction in the maximum clot formed in RP compared with in CP, yet no differences in clot lysis time or the time to half lysis and in vivo blood clotting after tail clipping were found in runner and control mice (Extended Data Fig. 4a, b). Our proteomic analysis also showed increased levels of CLU, complement factor H (FH), complement 1 inhibitor (C1INH), and a concerted increase in the C8 alpha and gamma chains of the C8 component of the terminal pathway for the formation of the membrane attack complex (Fig. 3c). However, we observed no differences in membrane attack complex formation in vitro (measured as soluble C5b-9) when induced by IgM, LPS or mannose-binding lectin in the classical, alternative or lectin complement pathways, respectively, between RP and CP (Extended Data Fig. 4c).
Analysis of female RP and CP using TMT MS identified that 31 out of 567 detected proteins were significantly changed with running (Extended Data Fig. 5a, b), with 4 belonging to the complement and coagulation pathways–C4BPA, F12 and MASP1 were downregulated and C1INH was upregulated with exercise, and several proteins trended in a similar direction to in males (CLU, F13B, F13A) (Extended Data Fig. 5c, d). Differences in physical exertion between sexes17 and direct effects of the oestrous cycle on the complement and coagulation pathways18 may explain some of the differential effects based on sex. These findings implicate the complement and coagulation cascades in the effects of running on the brain, particularly in males.
CLU reduces hippocampal inflammation
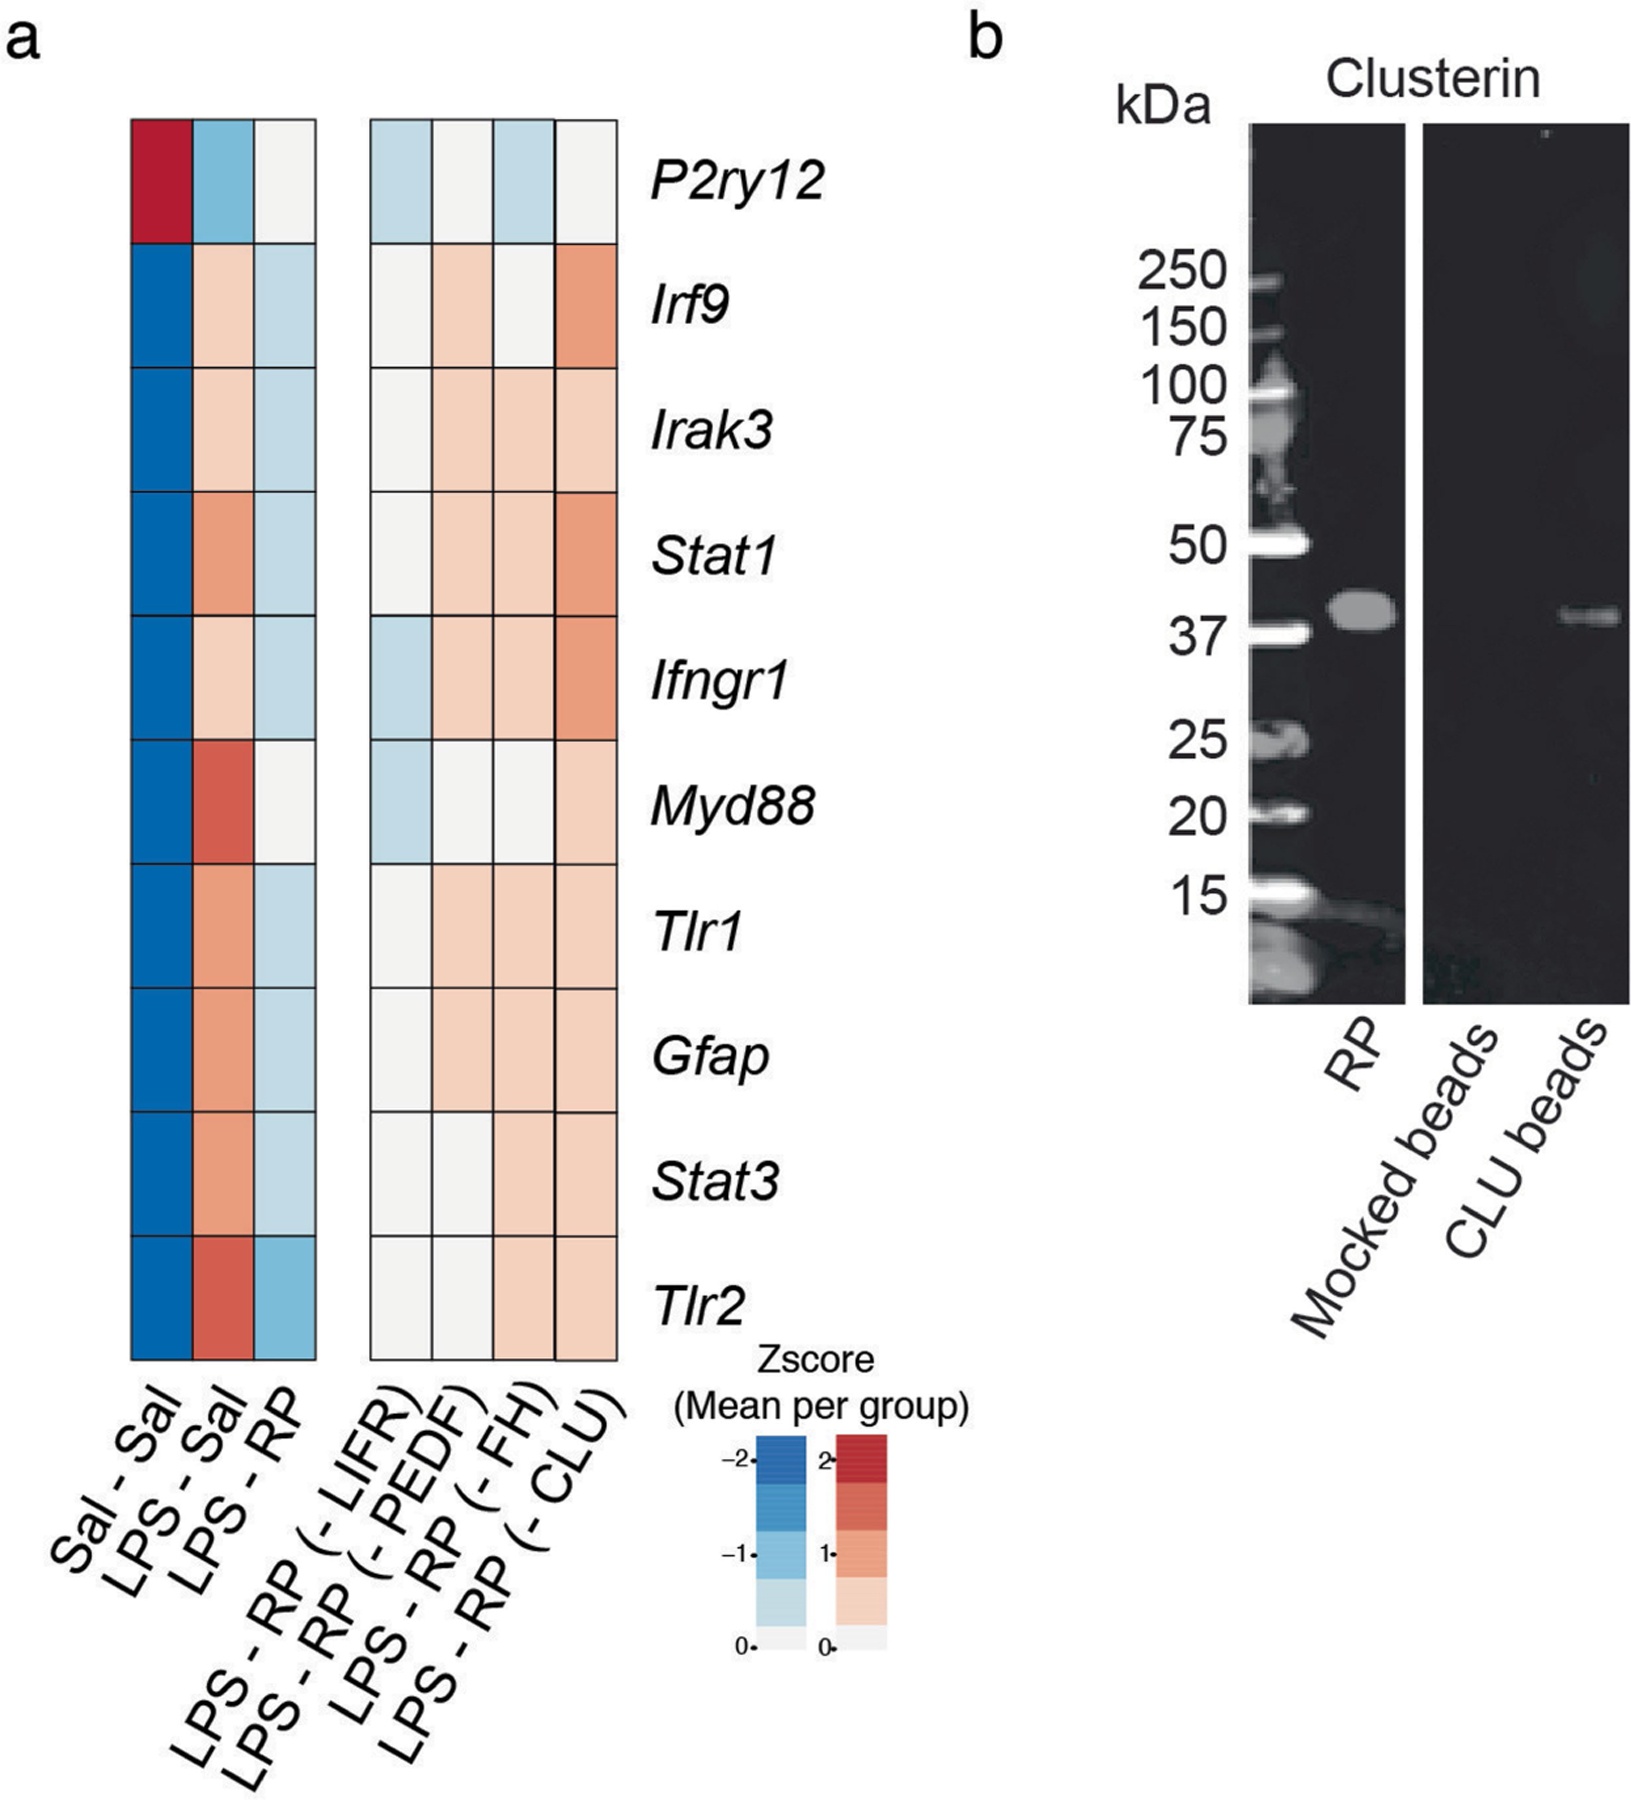
To identify the anti-inflammatory components of RP, we immunodepleted four top differentially expressed proteins from RP: CLU for its anti-inflammatory effects and genetic linkage to AD and its beneficial role in heart disease19–21, FH for its dual role in regulating complement and coagulation cascades15,16,22, and glycoprotein pigment epithelium-derived factor (PEDF) and leukaemia inhibitory factor receptor (LIFR) for their strong anti-inflammatory functions23,24. Mice were injected systemically with LPS and treated with intact RP (mock immunodepleted with IgG control antibodies) or RP lacking CLU, FH, PEDF or LIFR, and the hippocampi of mice were analysed 8 h later using qPCR analysis of the expression of immune and inflammatory genes. Notably, the depletion of CLU largely abrogated the anti-inflammatory properties of RP, whereas depletion of FH, PEDF or LIFR had little or no effect (Fig. 4a and Extended Data Fig. 6a, b).
Fig. 4 |. Clusterin reduces hippocampal inflammation.
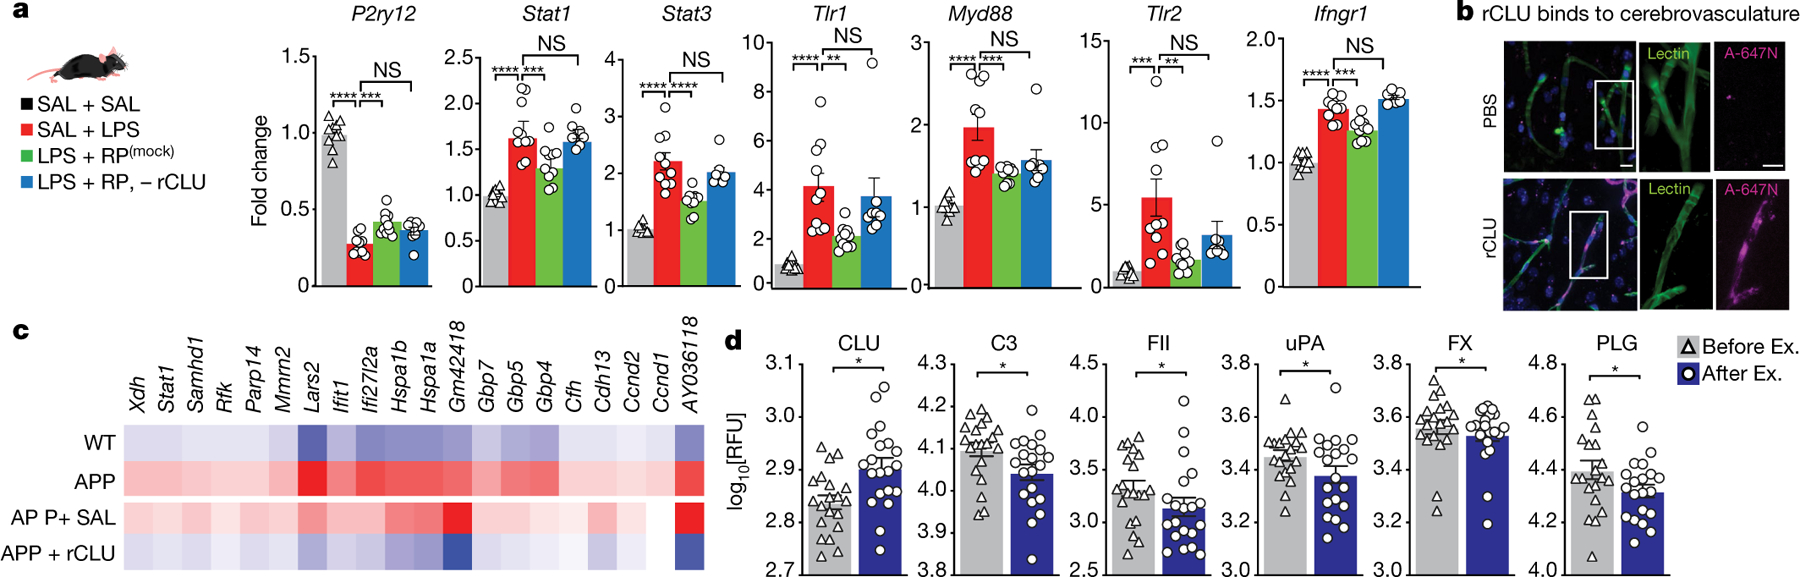
a, Male mice were injected with LPS and treated with saline (n = 10), RP (mock) (mock, immunodepleted with IgG control antibodies) (n = 10) or RP without CLU (n = 8), or saline for all of the injections (n = 10). qPCR analysis for the effect of each treatment on the indicated genes is shown. Data are mean ± s.e.m. Statistical analysis was performed using one-way ANOVA and Bonferroni post hoc test; NS, not significant; **P < 0.01, ***P < 0.001, ****P < 0.0001. b, Representative hippocampal images of mice injected intravenously with Atto-647N–rCLU (A-647N) or control Atto-647N-PBS. rCLU binds to the cerebrovasculature. n = 3 biological replicates. Scale bars, 10 μm. c, Common 20 genes in hippocampal BECs increased in APP mice and reversed by rCLU treatment. BECs were isolated from n = 4–5 mice per group. d, Relative plasma levels of complement and coagulation proteins in humans before (Before Ex.) and after 6 months of exercise (After Ex.), determined by SOMAscan. n = 20 participants. Data are mean ± s.e.m. Statistical analysis was performed using paired Student’s two-tailed t-tests; *P < 0.05. RFU, relative fluorescence units. The images in a were generated using MediaLab (https://medialab.biochem.wisc.edu/clip-art/).
In the brain, CLU is expressed in astrocytes but does not change in response to RP (Supplementary Table 1). The main systemic sources of CLU are probably hepatocytes and cardiomyocytes (Extended Data Fig. 7a, b). Interestingly, LRP8 (also known as APOER2)–the main receptor for CLU25–is most highly expressed in brain endothelial cells (BECs) and neurons (Extended Data Fig. 7c, d) prompting the question of whether BECs may be the immediate target of circulatory CLU. In fact, in mice that were injected intravenously with recombinant clusterin (rCLU) labelled with Atto-647N fluorophore, according to our recently established protocol26, we found a prominent decoration of the cerebrovasculature of the hippocampus with Atto-647N–rCLU, but not in those that received control PBS containing the soluble dye (Fig. 4b and Extended Data Fig. 8a). Moreover, administration of rCLU, but not saline, reversed the expression of multiple transcripts in the hippocampal BECs of mice that were systemically inoculated with LPS (Extended Data Fig. 8b–f and Supplementary Table 10). GO term enrichment analysis of genes that increase after LPS treatment and are reduced by rCLU revealed a strong enrichment in pathways related to protein folding, chaperone-mediated protein folding and response to interferon beta (Extended Data Fig. 8g and Supplementary Tables 11 and 12).
To determine the effects of CLU in a model of chronic neuroinflammation, we analysed the transcriptome of hippocampal BECs of APP mice (mThy1- hAPP751V171I, KM670/671NL; T41 line; aged 17 months) treated with rCLU or saline for 8 h (Extended Data Fig. 9a). At this age, these APP transgenic mice exhibit an advanced disease phenotype with extensive amyloid deposition and microgliosis, neuronal and synaptic degeneration, and functional impairments27. We found that rCLU reversed many of the genes that are abnormally expressed in the BECs of APP transgenic mice (Fig. 4c, Extended Data Fig. 9b–e and Supplementary Table 13), particularly in pathways related to the response to virus and interferon alpha and beta signalling (Extended Data Fig. 9c and Supplementary Tables 14 and 15). Twenty transcripts were commonly increased in BECs exposed to LPS or APP pathology and downregulated after systemic treatment with rCLU (Fig. 4c and Extended Data Fig. 9f, g), and are linked to response to interferon gamma, response to virus and epithelial cell proliferation (Extended Data Fig. 9h and Supplementary Table 16). Collectively, these observations show that peripheral rCLU induced a consistent downregulation of the interferon and cytokine signalling pathways in BECs in models of both chronic and acute neuroinflammation.
Beyond the brain endothelium, systemically injected rCLU significantly lowered the overall expression of genes induced by LPS in the cortex of mice aged 3 months (Extended Data Fig. 10a–d). Consistent with these findings, pathway analysis revealed that LPS DEGs, which are implicated in interferon response, inflammation and macrophage activation, are broadly downregulated after rCLU treatment (Extended Data Fig. 10e, f), supporting the hippocampal anti-inflammatory effect of this protein.
To determine the potential translatability of these observations to humans, we measured 8 out of the top 13 complement/coagulation proteins, including CLU identified in mice, using a commercial aptamer-based proteomic platform in 20 veterans with amnestic mild cognitive impairment before and 6 months after a physical exercise intervention. Consistent with the findings in mice, CLU was significantly increased and FX decreased in the patients who exercised (Fig. 4d and Supplementary Tables 17–20) while complement factor 3 (C3), coagulation factor II (FII/prothrombin), uPA and plasminogen (PLG) were decreased (Fig. 4d), broadly implicating the complement and coagulation cascades in exercise (Extended Data Fig. 11).
Discussion
We show that changes in plasma as a result of physical aerobic exercise are sufficient to recapitulate the beneficial effects of exercise on neurogenesis and memory, and to reduce hippocampal inflammation in non-exercised mice and mice with experimentally induced neuroinflammation. The effects are linked to complement and coagulation pathways including CLU, which can target BECs and broadly reduce interferon signalling. Although we observed some consistent changes and trends between males and females, further studies will be necessary to elucidate the extent to which sex influences the plasma proteome after exercise and running.
Anti-inflammatory effects of exercise have previously been linked to changes in the secretion of immune-modulatory cytokines from muscle and fat tissue, the mobilization of regulatory T cells from lymphoid organs, and the reduction of inflammatory monocytes in the blood2. To our knowledge, changes in the complement and coagulation cascadeshave not been implicated in the effects of exercise and in reducing neuroinflammation within the brain.
Complement and coagulation proteins, including CLU, are largely produced by hepatocytes28, making it tempting to speculate that exercise prompts the liver to induce the changes reported here and produce exercise factors that benefit the brain. Notably, GPDL1–which is an exercise-induced plasma protein that has been reported to improve cognition in old mice12–is also produced in the liver. In neurodegeneration, the complement pathway is activated, and inhibiting the complement proteins C1q or C3 results in less neuroinflammation, Aβ plaques and synapse loss29,30. CLU is a complement inhibitor31, polymorphisms in CLU are linked to AD19,20, and plasma CLU levels are increased in patients with AD and MCI32, possibly as a compensatory mechanism. We also note that the main receptor for CLU, LRP8 (ref. 25), is highly and preferentially expressed in BECs (https://twc-stanford.shinyapps.io/human_bbb/), and that systemically administered CLU binds to BECs and reduces their inflammatory gene expression in experimentally inflamed mouse brains, in part by reducing interferon signalling (Fig. 4 and Extended Data Figs. 8 and 9). Consistent with recent reports suggesting that BECs can transfer signals from the blood to regulate brain inflammation13,33, CLU may similarly reduce brain inflammation by targeting the vasculature, although other mechanisms are probably also involved.
Importantly, RP improves cognitive function and recapitulates the effects of exercise on neural stem cell activity possibly by reducing the baseline negative effects of inflammation on adult neurogenesis and cognition34,35. Collectively, the findings presented here provide new insights into the mechanisms of how exercise benefits the brain. Our results offer new paths to develop therapies based on proteins that are induced by exercise that have the ability to reduce neuroinflammation and improve cognitive function.
Methods
Animals
C57Bl/6J 3-month-old male mice (000664, Jackson Laboratory) were purchased from Jackson Labs and housed in randomized groups of 2–4 mice, before any exercise or plasma injections. The APP 17-month-old male mice (mThy-1-hAPP751V171I, KM670/671NL; T41 line) have been described previously36. The line was maintained on a C57BL/6 genetic background. All of the mice were housed at the Palo Alto VA animal facility under a 12 h–12 h light–dark cycle with dark hours between 18:30–06:30, and housed at 68–73 °F under 40–60% humidity. All of the experiments were performed in accordance with institutional guidelines approved by the VA Palo Alto Committee on Animal Research. Mice were randomly assigned to the experimental conditions.
Voluntary exercise
All exercise experiments were performed using activity cages with a running wheel installed. Activity cages with a computer-monitored running wheel were purchased from Lafayette Instrument (Lafayette). After arrival, mice were housed in groups under standard laboratory conditions for 7 d before the start of exercise. Next, running mice were randomly housed in the activity cages in pairs with free access to unlocked wheels and control mice were housed in pairs in standard animal facility cages.
Processing and administration of plasma
C57Bl/6 male mice (aged 3 to 4 months) were housed in pairs either in activity cages with access to a running wheel or in standard housing cages (controls) for 28 d. Running and control mice were euthanized between 06:30 and 09:00. Mice were anaesthetized with 18 μl of a 2.5% solution of avertin per gram body weight (2,2,2-tribromoethanol (Sigma-Aldrich, T48402), 2-methyl-2-butanol (Sigma-Aldrich, 2404860)) in preparation for perfusion or plasma collection. Blood was collected from the right heart ventricle with 30 μl of 250 mM EDTA (Thermo Fisher Scientific, 15575020) and centrifuged at 4 °C for 15 min at 1,000g to collect the plasma. The plasma from 20–25 exercised or control mice was pooled together and dialysed using cassettes (Slide-A-Lyzer Dialysis Cassettes, 3.5 kDa molecular weight cut-off, 3–12 ml) and then frozen at −80 °C. For plasma transfer experiments, non-running mice were injected retro-orbitally with 200 μl of plasma per injection.
BrdU, EdU, LPS and rCLU preparation and administration
Both 5-bromo-2′-deoxyuridine (BrdU) and 5-ethynyl-2-deoxyuridine (EdU) were resuspended in sterile PBS and injected intraperitoneally at 100 mg kg−1. For long-term cell survival assays, BrdU was administered 72 h, 48 h and 24 h before the start of exercise or plasma treatment. To assay proliferation, EdU was administered 12 h before euthanasia. LPS(Sigma-Aldrich, L4391) was resuspended in sterile saline at 10 μg ml−1 and injected at 100 μg kg−1. Control mice were treated with an equivalent volume of saline. Mouse rCLU (R&D Systems, 2747-HS-050) was resuspended in sterile saline at 250 μg ml−1 and injected at 100 μl per mouse retro-orbitally.
Tissue processing and immunohistochemistry analysis
Mice were anaesthetized as previously described and transcardially perfused with 20 ml of 1 M phosphate-buffered saline (PBS). Right hemispheric hippocampal tissue was snap-frozen in liquid nitrogen and stored at −80 °C for future transcriptomic or proteomic analysis. Left hemispheres were stored in 4% paraformaldehyde at 4 °C for 48 h then switched to 30% sucrose solution for an additional 48 h in preparation for brain sectioning. Serial coronal sections of the hippocampus (thickness, 40 μm) were collected using a freezing microtome (Leica, SM2010R) and stored in cryoprotective medium (40% PBS, 30% glycerol, 30% ethylene glycol) at −20 °C until immunostained. Immunohistochemistry analysis was performed using standard techniques described previously37 using free-floating sections. All of the sections stained for BrdU or EdU were pretreated with 3 M HCl for 15 min at 37 °C before incubation with primary antibodies. The primary antibodies used for immunostaining were; rat anti-BrdU (1:2,500, ab6326, Abcam), mouse anti-GFAP (1:1,000, MAB360, Millipore), goat anti-sox2 (1:1,000, sc-365823, Santa Cruz Biotechnology), mouse anti-NeuN (1:400, MAB377, Millipore), goat anti-DCX (1:500, sc-8066, Santa Cruz Biotechnology), mouse anti-SMA (1:100, F377, Sigma-Aldrich), rat anti-TFRC (1:200, NB100–64979, Novus Biologicals), lectin tomato (1:200, FL-1171–1, Vector Laboratories), rabbit anti-CLU (20 μg antibody per ml of plasma, ab184100, Abcam), goat anti-PEDF(20 μg antibody per ml of plasma, AF1149, R&D Systems), sheep anti-Factor H (20 μg antibody per ml of plasma, ab8842, Abcam), rabbit anti-LIFR (20 μg antibody per ml of plasma, 22779–1-AP, Proteintech). The Click-iT Plus EdU AlexaFluor 555 Imaging Kit (Thermo Fisher Scientific, C10638) was used for EdU detection. For total DCX immunoreactivity cell counts, a biotinylated anti-goat secondary antibody (rabbit, 1:1,000, Vector) was used, and cells were then visualized using a Vectastain Elite ABC kit (Vector, PK-6100) and diaminobenzidine (Sigma-Aldrich, DAB, D5905). All fluorescent secondary antibodies were diluted at a concentration of 1:200 and incubated with sections for 2 h in TBS-T (0.01 M Tris HCl pH 7.4, 0.15 M NaCl and 5 × 10⁴ ml l Tween-20) at room temperature. All fluorescent secondary antibodies were Alexa Fluor 488, 555 or 647 antibodies (Thermo Fisher Scientific) raised in donkey against the appropriate target animal. Nuclei were fluorescently labelled with Hoechst 33342 (1:2,000, Sigma-Aldrich).
Imaging and cell quantification
Images of immunofluorescent sections were obtained, quantified and analysed by an observer who was blinded to the treatment. Fluorescence microscopy was performed using a Zeiss 710 Confocal Laser Scanning Microscope (Carl Zeiss MicroImaging, Zeiss EC Plan-Neofluar, ×20, ×40 and ×63/0.05 NA) with the detection pinhole set at 1 Airy unit. Optical sections were taken at the suggested optimal value interval based on magnification, and the obtained z-stack images were processed and analysed using ImageJ (National Institutes of Health). The number of labelled cells was manually counted in six representative sections. One hundred or more BrdU- or EdU-immunoreactive cells were evaluated per mouse and the total number of cells was corrected for the number of optical slices.
Behaviour
Behavioural testing began the day after the final plasma injections. The experimenters were blinded to the treatment. Sample size was determined using previous literature4,10,12 to estimate an optimal n for our studies on the RP effects on neuroplasticity and behaviour. We also performed preliminary studies that were not included in the manuscript.
Activity chamber.
The activity chamber was used to determine general activity levels, gross locomotor activity and exploration habits in rodents. Assessment took place in an Open Field Activity Arena (Med Associates, ENV-515) mounted with three planes of infrared detectors, within a specially designed sound attenuating chamber (Med Associates, MED-017M-027). The arena was 43 cm (L) × 43 cm (W) × 30 cm (H) and the sound attenuating chamber was 74 cm (L) × 60 cm (W) × 60 cm (H) and behaviour was assessed using Med Associates Open-Field Activity. The animal was placed in the corner of the testing arena and allowed to explore the arena for 10 min while being tracked by an automated tracking system. Parameters including distance moved, velocity, time immobile and times spent in predefined zones of the arena were recorded. The arena was cleaned with 1% Virkon solution at the end of the trial.
Morris water maze.
The Morris water maze was conducted in a circular pool (diameter, 172 cm). Tempera paint was added into the water until it became opaque, and a hidden platform (diameter, 17 cm) was placed 0.75 cm below the water surface. The water temperature was kept at ±1 °C from 22 °C. Privacy blinds surrounded 75% of the water tank and distinct visual cues were hung on the privacy blinds. The mice were monitored using the Ethovision XT (Noldus Information Technology) video tracking system directly above the water tank and parameters were measured using Ethovision software. Pseudorandomized platform locations and drop locations were recorded for each mouse with one trial lasting 60 s. The trial ends either when the subject rests on the hidden platform for 3 s or when the duration of the trial expires. The trial was repeated four times for each mouse during each day of training. Four days of training were performed and a Probe Trial was conducted the next day.
Fear conditioning.
Fear conditioning, contextual testing and cued testing took place in sound-attenuating chambers equipped with steel shocking floor (Coulbourn Instruments). Freezing behaviour in cages was recorded by low-light camera and stimulus, shock and freezing behaviour analysis was automated using the FreezeFrame and FreezeView software (Actimetrics). During fear-conditioning training, the mice were habituated to shock cages for 2 min and then were subjected to two pairings of a 30 s, 2 kHz auditory cue (70 dB, cage enclosed) and a white light cue with a co-terminating 2 s foot shock (0.6 mA). The intertrial interval was 2 min and, 2 min after the final shock, the mice were returned to their home cage. The next day, mice underwent contextual recall testing; contextual testing was performed in the same cages that were used during the training trial. Animal freezing behaviour was tracked over a period of 6 min in the absence of any auditory or visual cues. The next day, day 3, cued testing was performed. A different context was used in the cued testing–cages with altered odour (70% ethanol), floor texture and wall shape were used. Mice were subjected to the same pattern of auditory cues as during training (without a shock pairing) and were returned to the home cages 2 min after the final cues.
SmartCage.
Animals were allowed to explore the cage (AfaSci, SmartCage system) freely for 30 min, and the location, total locomotion and time spent in light and dark areas was evaluated using the CageScore software (AfaSci).
RNA preparation and microfluidics RT–qPCR
RNA was isolated from hippocampal tissue using RNeasy mini kits (Qiagen, 74104) according to the manufacturer’s instruction. A primer pair panel containing ten neuroinflammatory-related genes and ten housekeeping genes for microfluidics qPCR with reverse transcription (RT–qPCR) was designed as previously described38. Creation and pre-amplification of cDNA was performed using 100 ng RNA and reverse transcription and pre-amplification kits from Fluidigm (100–6301) according to the manufacturer’s protocol. Sample and assay mixes were created using cDNA diluted 1:5 and appropriate primer pairs according to the manufacturer instructions. The 96.96 Dynamic Array IFC for Gene Expression chip (Fluidigm, BMK-M-96.96) was then loaded and mixed using a Biomark IFC Controller HX (Fluidigm, BMK-IFC-HX) before processing and data acquisition using a Biomark HD Real-Time PCR System (Fluidigm, BMKHD-BMKHD). Transcript fold change was calculated using ΔΔCt values based on experimental controls.
RNA-seq analysis of the hippocampus
RNA was isolated from hippocampal tissue as previously described and the quality was validated using the Agilent 2100 Bioanalyzer (Stanford PAN Facility). RNA was converted into cDNA using the SMART-seq v4 Ultra Low Input Kit for Sequencing (Takara Bio, 634894) according to the manufacturer’s protocol. cDNA was then fragmented, normalized and pooled using a Nextera XT library preparation kit (Illumina, FC-131–1096) according to the manufacturer’s instructions. Sequencing was performed on Illumina NovaSeq 6000 to obtain pared-end 150 bp reads. Reads were aligned to the mouse genome using the STAR (v.2.5.3a) GeneCounts function and differential expression analysis was performed using the RStudio v.1.2.5033 DESeq2 package v.1.32 (ref. 39) using built-in algorithms.
RNA-seq analysis of the whole cortex
We isolated RNA from whole cortex tissue using the RNeasy 96 kit (Qiagen) and a TissueLyser II(Qiagen).cDNA and library synthesis were performed in house using the Smart-seq2 protocol as previously described40 with several modifications. Extracted RNA (2 μl, at a concentration of 25 ng μl−1) was reverse-transcribed using seven cycles. After bead clean-up using 0.7× ratio with AMPure beads (A63881, Thermo Fisher Scientific), cDNA concentration was measured using the Qubit 1× dsDNA HS kit (Q33231) and normalized to 0.4 ng μl−1 as input for library prep. Then, 0.4 μl of each normalized sample was mixed with 1.2 μl of Tn5 Tagmentation mix (0.64 μl TAPS-PEG buffer (PEG 8000, V3011, PROMEGA and TAPS-NaOH pH 8.5, BB-2375, Boston Bioproducts), 0.46 μl H2O and 0.1 μl Tn5 enzyme (20034198, Illumina)), and then incubated at 55 °C for 10 min. The reaction was stopped by adding 0.4 μl 0.1% sodium dodecyl sulfate (Thermo Fisher Scientific, BP166–500). Indexing PCR reactions were performed by adding 0.4 μl of 5 μM i5 indexing primer (IDT), 0.4 μl of 5 μM i7 indexing primer (IDT) and 1.2 μl of KAPA HiFi Non-Hot Start Master Mix (Kapa Biosystems) using 12 amplification cycles. Libraries were purified using two purification rounds with a ratio of 0.8× and 0.7× AMPure beads. Library quantity and quality was assessed using a Bioanalyzer (Agilent) and Qubit. Pipetting steps were performed using the liquid-handling robots dragonfly or mosquito HV (ttplabtech) using 96-well plates and PCR reactions were carried out on a 96-plate thermal cycler (BioRad). Illumina sequencing of the resulting libraries was performed by Novogene (https://en.novogene.com/). Multiplexed libraries were sequenced with 2 × 150 bp paired-end reads in a single S4 lane on an Illumina NovaSeq S4 (Illumina). Base calling, demultiplexing and generation of FastQ files were conducted by Novogene.
Raw sequence reads were trimmed to remove adaptor contamination and poor-quality reads using Trim Galore! (v.0.4.4, parameters: --paired--length 20--phred33--q 30). Trimmed sequences were aligned using STAR (v.2.5.3, default parameters). Multi-mapped reads were filtered. Data visualization and analysis were performed using SeqMonk v.1.48.0 (http://www.bioinformatics.babraham.ac.uk/projects/seqmonk/) and RStudio v.3.6 (https://www.rstudio.com/) using the following Bioconductor packages39: Deseq2 v.1.32, topGO v.2.44 and org.Mm.eg.db. To account for tissue specific-expression, we defined all genes with an FPKM of >2 in at least five samples as expressed. Unless stated otherwise, the set of expressed genes was used as background for functional enrichment analyses. P values were adjusted for multiple testing and significant DEGs were defined by a cut-off of adjusted P < 0.1, as suggested for analyses using Deseq2 (ref. 39). To analyse a potential dampening effect of Clu on LPS-induced expression patterns, we followed previously described analyses41.
In vivo blood clotting loss
In vivo blood clotting after tail clipping was determined by the amount of blood loss through assessment of haemoglobin concentration in runner and control mice as described previously42. In brief, mice were anaesthetized with 3% isoflurane blended with 30% O2 and 70% N2 at a flow rate of 1 l min−1. Mouse tails were sterilized and inserted into the 3 mm hole of the French catheter scale and the tail was excised. The tail was placed into a 15 ml conical tube containing 10 ml of saline at 37 °C. After 30 min, saline containing blood was collected and processed to determine the amount of blood loss by assessing haemoglobin concentration using spectrophotometric measurements as previously described42.
Euglobulin clot lysis time assay
The assay was performed as previously described43. In brief, blood was collected in citrated tubes at a ratio of 9:1 from control and runner mice that ran for 3 months. After centrifugation, the supernatant fraction was collected and mixed with acetic acid for 20 min on ice. The pellet was resuspended in sodium borate and pipetted into a flat bottom 96-well plate. After the addition of calcium chloride to the wells, absorbance was read at 405 nm every 10 min for 16 h with shaking for 3 s before each read. Clot formation and lysis was calculated as previously described44. Maximum clot formation is defined as the maximum absorbance; clot lysis time is defined as the time at which the curve, corrected for the individual blanks, reaches an absorbance of 0.05 or less; time to half lysis is defined as the time at which the curve, corrected for the individual blanks, reaches 50% of clot lysis.
Enzyme-linked immunosorbent assays
Assessment of clusterin concentration and complement pathway in mouse plasma was determined using enzyme-linked immunosorbent assays (Boster Bio, EK0923 and Hycult Biotech, HIT423) according to the manufacturer’s instructions.
Isolation of primary BECs
BEC isolation was conducted as recently described33,45. In brief, 4–5 mice per group were anaesthetized with avertin and perfused following blood collection. The hippocampi from each group were pooled, minced and digested using the neural dissociation kit according to the kit instructions (Miltenyi, 130–092–628). Brain homogenates were further diluted in dPBS and filtered through a 100 μm strainer. The filtered homogenate was then centrifuged and the pellets were resuspended in 0.9 M sucrose in dPBS followed by centrifugation for 20 min at 850g at 4 °C to separate the myelin. To determine the samples size for the single-cell sequencing studies, we used previous studies13,26 and performed preliminary studies to confirm that we will obtain enough BECs for statistical analysis (not included in the manuscript).
Cell pellets were resuspended in FACS buffer (1% BSA in PBS with 2 mM EDTA) and blocked for 5 min on ice with Fc preblock (CD16/CD32, BD 553141), followed by staining for 30 min with anti-CD31-PE/CF594 (1:75, BD 563616), anti-CD45-PE/Cy7 (1:200, BD 103114) and anti-Cd11b-FITC (1:100, BD 101206) antibodies. Dead cells were excluded by staining with SYTOX Blue Dead Cell Stain (1:2,000, Thermo Fisher Scientific, S34857). Flow cytometry data were acquired and cell sorting was performed on the FACSAria 3.3 (BD Biosciences) system using the FACSDiva software (BD Biosciences). Cells were gated on forward scatter (FSC, size) and side scatter (SSC, internal structure). FSC-A and FSC-W blotting was used to discriminate single cells from cell doublets/aggregates. SYTOX Blue+ dead cells were excluded. CD11b+ and CD45+ cells were gated to exclude monocytes/macrophages and microglia. CD31+CD11b−CD45− cells were defined as the BEC population and were sorted into 0.1% BSA solution in PBS. Cells were then pelleted at 1,000 r.p.m. for 10 min at 4 °C and resuspended in 50 μl 0.1% BSA before proceeding to single-cell RNA-seq.
Single-cell RNA-seq and library preparation
Single-cell RNA capture was performed using the 10x Genomics chromium v3 single cell gene expression kit according to the manufacturer’s instructions. In brief, the single-cell suspensions were counted using the Countess automated cell counter (Thermo Fisher Scientific). After counting, cells were loaded onto the 10x Chromium chip using the recommended loading volumes and run on the 10x chromium v3 controller. For the APP samples, all of the cell suspension was loaded after getting lower than anticipated yields from sorting. For the other samples, 4,000 cells were targeted. Immediately after running the chip, the samples were reverse-transcribed to cDNA according to the manufacturer’s instructions and kept at 4 °C overnight. The next day, sample clean-up and cDNA amplification with 12 PCR cycles were performed according to the manufacturer’s instructions. The amplifiedcDNA was then checked for quality using the Agilent Bioanalyzer (HS DNA kit). Libraries were generated according to the manufacturer’s instructions using unique barcodes for each sample, and the finalized libraries were again checked for quality on the Agilent Bioanalyzer (HS DNA kit). Samples were sent to Novogene for sequencing, where they were first assessed for library quality on a single lane of the HiSeq System followed by deep sequencing on a NovaSeq S4 flow cell to ensure >20,000 reads per cell as recommended.
Single-cell RNA-seq and data analysis
Reads were aligned to the mouse reference transcriptome mm10 using Cell Ranger (v.3.1.0) provided by 10x genomics. The resulting filtered gene by cell matrices of unique molecular identifier (UMI) counts were subsequently analysed using Seurat (v.3.1). Filtering criteria were applied to remove low-quality cells and doublets. Cells that had at least 600 features, a maximum of 6,000 features and 10% mitochondrial RNA were included in the downstream analysis. Counts were then log-normalized and variable features were identified using the FindVariableFeatures function. To integrate the samples from the same experiment into one Seurat object, we used the FindIntegrationAnchors and IntegrateData functions from Seurat. The highly variable genes were used for principal components analysis, and the first 30 components were used for dimensionality reduction(t-distributed stochastic neighbour embedding) and clustering. Differential expression analysis was performed using the MAST statistical test with the FindMarkers function (the log-transformed fold change results obtained represent the natural logarithm of the fold changes; default of Seurat). To identify genes and pathways modified by LPS treatment or by AD and reversed by CLU treatment we used a fold change cut-off of 1.1 (Fig. 4d, e). To further identify genes that were uniquely and commonly changed by LPS or APP and reversed by CLU, we used a cut-off fold change of 1.05 (Fig. 4f). ClusterProfiler (v.3.16.1) was used to conduct the GO Biological Processes pathway analysis on the selected list of genes as well as for data visualization.
rCLU labelling and administration
rCLU or our control PBS was combined with the Atto-647N fluorophore26,46,47, and hippocampal uptake of systemically injected protein was evaluated using a Zeiss 710 Confocal Laser Scanning Microscope (Carl Zeiss MicroImaging, Zeiss EC Plan-Neofluar, ×20, ×40, and ×63/0.05 NA)
Plasma immunodepletion studies
Antibodies against the target proteins were coupled to superparamagnetic beads using the Dynabeads Antibody Coupling Kit (Thermo Fisher Scientific, 14311D) according to the manufacturer’s instructions. Antibodies were conjugated to beads at a ratio of 10 μg antibody per mg beads. Antibody-conjugated beads were stored at 50 mg ml−1 in sterile PBS at 4 °C until use. To deplete the plasma, 32 μl of antibody-conjugated bead suspension was added to 800 μl dialysed plasma (2 mg beads per ml plasma) and incubated for 1 h at room temperature and 23 h at 4 °C. Depleted plasma was separated from the beads using a magnetic rack and stored at −80 °C until use. Detailed information about the antibodies is provided in Supplementary Table 21.
Plasma albumin and IgG depletion
In all of the plasma MS experiments, albumin and immunoglobulin were depleted from 15 μl of dialysed plasma using an immunoaffinity column (PROTIA, Sigma-Aldrich, ProteoPrep Immunoaffinity Albumin & IgG Depletion Kit, PROTIA-1KT). Depleted plasma and albumin/IgG fractions bound to the immunoaffinity columns were eluted separately and stored at −20 °C in Axygen Maxymum Recovery microcentrifuge tubes (Corning, Thermo Fisher Scientific, MCT-175-L-C) until further processing.
MS analysis
Plasma preparation, protein clean-up, reduction, alkylation, digestion and TMT labelling in male mice.
A total of 100 μg protein was diluted in PBS (pH 7.4, Thermo Fisher Scientific, 10010) to a final volume of 300 μl. The diluted samples were denatured at 95 °C for 10 min, cleaned with 5 μl benzonase (Millipore, 70664) for 30 min at 37 °C, reduced for 30 min at 45 °C with 15 μl of 200 mM dithiothreitol (Thermo Fisher Scientific, R0861) and incubated at room temperature for 30 min with 15 μl of 400 mM iodoacetamide (Sigma-Aldrich, I1149). The alkylation reaction was quenched using 30 μl of 200 mM dithiothreitol. The SP3 method used in this study was adapted from previous methods48. Equal parts hydrophobic and hydrophilic Sera-Mag carboxyl magnetic beads (GE Healthcare, GE65152105050250 and GE45152105050250) were added to each sample at a ratio of 15 μg beads per 1 μg protein. Samples were acidified with 10 μl of 1% formic acid (FA, Thermo Fisher Scientific/Pierce, PI28905) and 100% liquid chromatography coupled with MS (LC–MS)-grade acetonitrile (ACN, Thermo Fisher Scientific/Pierce, PI51101) was added to reach at least 50% of the total volume. After mixing and incubating at room temperature for 8 min, protein-laden beads were aggregated and collected using a magnetic rack (Thermo Fisher Scientific, 12321D). Samples were then washed twice with 200 μl of 70% ethanol (Sigma-Aldrich, E7023) and once with 180 μl of ACN. Finally, proteins were incubated overnight (~16 h) at 37 °C in 50 μl of a 0.1 μg μl−1 solution of trypsin/LysC (Thermo Fisher Scientific/Promega,V5073) in 50 mM HEPES buffer (Thermo Fisher Scientific, 15630). After digestion, the samples were sonicated (Thermo Fisher Scientific, 15–337-22) for 10 min.
Samples for subsequent TMT processing (see below) were then magnetically separated from beads and stored at −80 °C until TMT labelling. ACN was added to the samples that were to be used for shotgun MS to reach at least 95% of the total volume. After incubation for 8 min at room temperature, the supernatant was discarded and the beads were washed with 180 μl ACN. The beads were reconstituted in 50 μl of 2% dimethyl sulfoxide (Thermo Fisher Scientific, 85190) and sonicated for 5 min, and the supernatant containing the peptides was retained. Then, 5% of FA was added to the samples and immediately processed through a STAGE tip cleanup49, then lyophilized and stored at −80 °C until resuspension in 0.1% FA for LC–MS/MS analysis. Retention time calibration peptides (Thermo Fisher Scientific, 88321) were spiked into resuspended shotgun samples at 125 fmol μl−1.TMT labelling was achieved using a TMT10plex Isobaric Label Reagent Set (Thermo Fisher Scientific, 90111) according to the kit’s instructions. Portions of each sample were used to check ion distributions and labelling efficiency. The rest was combined in adjusted ratios with the other labelled samples, lyophilized in a centrifugal vacuum concentrator (Labconco, 7810010) and resuspended in 5% FA for STAGE tip clean-up, then lyophilized again and stored at −80 °C until resuspension in 0.1% FA for final LC–MS/MS analysis.
Plasma sample preparation, reduction, alkylation, digestion, peptide clean-up, TMT labelling and fractionation in female mice.
Rapigest SF (Waters, 186001861) was added to each plasma sample for a final concentration of 1 μg μl−1. The proteins were reduced (5 mM dithiothreitol, 56 °C, 30 min) and alkylated (14 mM iodoacetamide, room temperature in the dark, 1 h). The proteins were then digested overnight at 37 °C with trypsin/lysC mix (Promega, V5073) at an enzyme:substrate ratio of 1:20. Trifluoroacetic acid was added to each sample at a final concentration of 0.5%, followed by incubation at 37 °C for 45 min and centrifugation at 16,000 r.c.f. for 10 min. The samples were then desalted on an AssayMap Bravo platform using underivatized polystyrene-divinylbenzene reverse phase S (RP-S) cartridges (Agilent, G5496–60033), and were then dried down using vacuum concentrator (Labconco, 7810010). TMT labelling was achieved using the TMT-10plex Isobaric Label Reagent Set (Thermo Fisher Scientific, 90111) according to the kit’s instructions. A global standard was created to enable a comparison between 10plex sets by taking aliquots of equal volume from each sample and combining them. Portions of each sample were used to check ion distributions and labelling efficiency. The rest was combined in adjusted ratios with the other labelled samples in their respective TMT10plex set, lyophilized in a centrifugal vacuum concentrator and resuspended in 0.1% trifluoroacetic acid, and fractionated and desalted using the High pH Reversed-Phase Peptide Fractionation Kit (Thermo Fisher Scientific, 84868). Finally, the samples were dried down by vacuum centrifugation before being resuspended in 0.1% FA for LC–MS/MS analysis.
MS data acquisition and analysis.
Peptides were analysed on an Orbitrap Fusion Lumos Mass Spectrometer (Thermo Fisher Scientific). Peptides were separated by capillary nanoflow reversed-phase chromatography on a reversed-phase column (100 μm inner diameter, packed in-house with ReproSil-Pur C18-AQ 3.0 μm resin (Dr. Maisch)) using 3 h LC gradients. The LC buffers used were mobile phase A: 0.1 % FA in water; and mobile phase B: 0.1% FA in ACN. Full MS scans were acquired using the Orbitrap mass analyzer at a resolution of 120,000 full width at maximum (FWHM) in a data-dependent mode. The automatic gain control (AGC) targets were 4 × 10⁵ and the maximum injection time for FTMS1 were 50 ms.
For shotgun label-free MS, the most intense ions were then selected for sequencing and fragmented in the Orbitrap mass analyzer using higher-energy collisional dissociation with a normalized collision energy of 30% and resolution of 15,000 (FWHM). Monoisotopic precursor selection was enabled and singly charged ion species and ions with no unassigned charge states were excluded from MS2 analysis. Ions within ±10 p.p.m. m/z window around ions selected for MS2 were excluded from further selection for fragmentation for 30 s. The AGC targets were 5 × 10⁴ and maximum injection time of 250 ms. Shotgun label-free MS2 spectra were analysed using Proteome Discoverer v.2.2.0.388 (Thermo Fisher Scientific) and searched against the UniProt mouse sequence database, including the identification of common contaminants using the SEQUEST algorithm. Precursor mass tolerance was ±10 p.p.m. and fragment mass tolerance was ±0.05 Da. Carbamidomethylation of cysteine was set as a static modification and protein N-acetylation and methionine oxidation were variable modifications. A false-discovery rate of below 1% at the peptide level was set, and only peptides with at least six residues were included. Whenever possible, the matching between runs feature was used to identify peptides that were present in MS1 spectra but not chosen for MS2 fragmentation and sequencing in a given sample based on matching retention times and mass with other samples in which that peptide was identified.
For TMT MS, the most intense ions were selected from full MS scans in top-speed mode (3 s cycle time) for sequencing using collision-induced dissociation and the fragments were analysed in the ion trap. The normalized collision energy for collision-induced dissociation was 35% at 0.25 activation Q. For MS2 the AGC targets were 1 × 10⁴ and the maximum injection time was 30 ms. Monoisotopic precursor selection and include charge state 2–7 were enabled. Singly charged ion species and ions with no unassigned charge states were excluded from MS2 analysis. Ions within the ±10 p.p.m. m/z window around ions selected for MS2 were excluded from further selection for fragmentation for 90 s. After each MS2 analysis, the five most intense fragment ions were selected simultaneously for higher-energy collisional dissociation MS3 analysis. For MS3 analysis, an isolation window of 1.2 m/z (for the MS2 step), normalized collision energy of 65%, resolution of 60,000, m/z scan range 120–500, AGC target of 1 × 10⁵ and maximum injection time of 90 ms were used. Data acquisition for female mice plasma samples was the same except that the MS2 maximum injection time was set to auto, the MS2 dynamic exclusion window was set to 60 s, the MS2 isolation window for the MS3 step was set to 2 m/z, the MS3 resolution was set to 50,000 and the MS3 maximum injection time was set to 150 ms.
The raw data for TMT-labelled samples were analysed using Proteome Discoverer v.2.4.0.305 (Thermo Fisher Scientific). Precursor mass tolerance was ±10 p.p.m. and fragment mass tolerance was ±0.6 Da. Static modifications were carbamidomethylation of cysteine (+57.021 Da) and TMT-labelled N terminus and lysine (+229.163 Da). Differential modifications were oxidation of methionine (+15.995 Da) and acetylation of protein N-terminal (+42.011 Da). Proteome Discoverer searched the spectra against the UniProt mouse database, including the identification of common contaminants using the SEQUEST algorithm. Percolator was applied to filter out false MS2 assignments at a false-discovery rate of 1% at the peptide and protein levels. For quantification, a mass tolerance of ± 20 p.p.m. window was applied to the integration of reporter ions using the most confident centroid method. A co-isolation threshold of 30, and SPS MS3 matches of 65% and an average reporter signal to noise value of 10 threshold were applied.
GO and REVIGO analyses.
For RNA-seq and MS proteomic GO analysis, genes and proteins were ranked by their differential expression and LFQ abundance P values, respectively. For RNA-seq analysis, GO terms were annotated from the top genes and the GO term enrichment was tested using the topGO R package50, and the remaining detected genes were kept in the analysis as background. GO term enrichment analysis for MS proteomics was performed analogously on the top proteins detected. The most significant GO terms were summarized into non-redundant hierarchical terms by their semantic similarity by REVIGO51, using Resnik as the clustering algorithm and 0.7 for allowed similarity measure.
Human exercise regimen.
Twenty veterans with amnestic mild cognitive impairment participated in the experiment. Diagnosis was based on the National Institute on Aging/Alzheimer’s Association criteria52. Human samples were obtained before and after completion of a combined aerobic and resistance exercise training program. Veterans participated in three weekly exercise sessions for six months. All of the exercisesessions included the 5 min warm-up and cool-down periods before and after 30 min of continuous aerobic exercise (including treadmill walking, stationary cycling, cycle ergometry) and 20 min of full-body resistance exercises. Target exercise intensities were 60–70% of maximum heart rate, as determined by cardiopulmonary treadmill testing. These studies were approved by the Stanford University Institutional Review Board and the Palo Alto VA Research and Development Committees. All of the human participants provided informed consent and we complied with all of the relevant ethical regulations.
Human plasma collection and proteome data acquisition.
Human plasma was collected from the upper arm by the Routine Blood Draws in the Clinical Pathology Laboratory at the Veterans Hospital of Palo Alto between July 2013 and 2017 and stored at −80 °C. Samples were processed by SomaLogic using the SOMAscan v.3 assay53. The samples were processed under Good Laboratory Practice54 for intrarun normalization and calibration and passed all quality-control requirements.
Extended Data
Extended Data Fig. 1 |. Changes in cell proliferation and survival with running or runner plasma infusions.
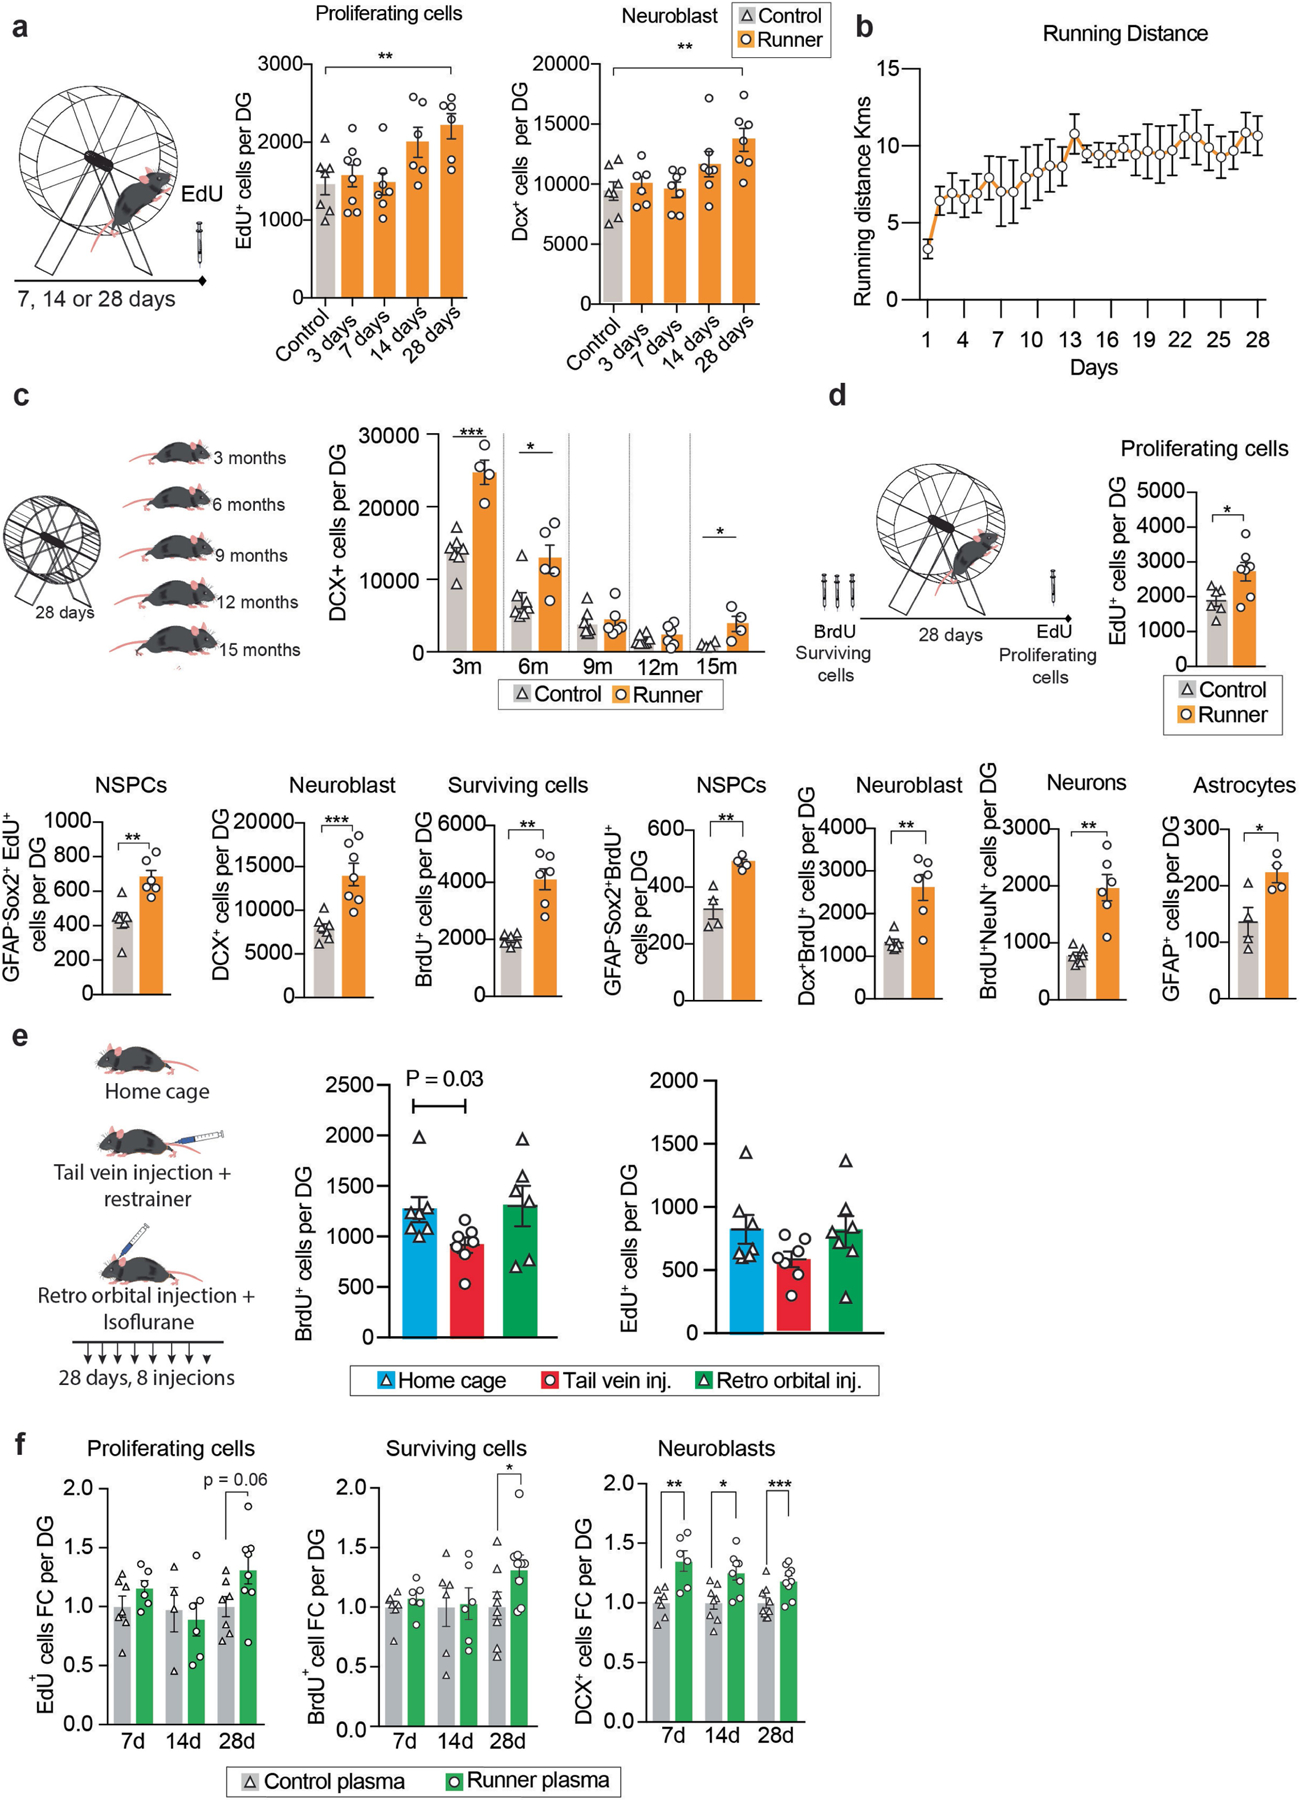
a, Male mice at 3–4 months of age had access to a running wheel for 3, 7, 14 or 28 days while controls remain without access to running wheels. EdU was administered 24 h before sacrifice. Plots show total number of cells per dentate gyrus (DG) of fluorescent immunolabelled EdU+ cells (n = 6–8 per group) and DCX+ cells (n = 6–7 per group). b, Running distance per day by male mice (n = 5) at 3–4 months of age with free access to a running wheel. c, Male mice at 3, 6, 9, 12 and 15 months of age had access to a running wheel for 28 days. Graphs show total number of DCX+ cells per dentate gyrus (n=4–8 per group). Means ± s.e.m; unpaired Student’s two-tailed t test; * P < 0.05, ** P < 0.01, *** P < 0.01. d, Male mice at 3 months of age had access to a running wheel for 28 days. BrdU was administered 3 days before the exercise and EdU 24 h before sacrifice. Graphs show total number of cells per dentate gyrus (DG) of fluorescent immunolabelled cells (n=4–6 per group). Means ± s.e.m; unpaired Student’s two-tailed t test; * P < 0.05. e, Control injections of saline via retro-orbital vein in combination with Isoflurane do not impair neural stem activity. Mice at 3–4 months of age were injected with saline via the tail vein or the retro orbital vein with 200 μl of saline, every 3 days for 28 days. BrdU was administered 3 days before saline administration and EdU 24 h before sacrifice. The hippocampus was dissected and processed for immunohistochemistry. Graphs show total number of cells per dentate gyrus (DG) of fluorescent immunolabelled cells (n=7–8 per group). Means ± s.e.m; Unpaired Student’s two-tailed t test. f, Runner plasma infusions from 28 days runners upregulate proliferation and survival of hippocampal new born cells. Plasma from running mice (3–4 months of age) that run for 7, 14 or 28 days was collected and transferred to matched aged non-running mice, once every 3 days 28 days. BrdU was administered 3 days before plasma administration and EdU 24 h before sacrifice. Graphs show fold change of total number of cells per dentate gyrus (DG) of fluorescent immunolabelled EdU+ cells, BrdU+ cells and DCX+ cells (n = 6–9 per group). Means ± s.e.m; unpaired Student’s two-tailed t test; * P < 0.05, ** P < 0.01 and *** P < 0.001. The images in a, c, d and e were generated using Servier Medical Art (https://smart.servier.com) and MediaLab (https://medialab.biochem.wisc.edu/clip-art/).
Extended Data Fig. 2 |. Changes in behavioural and hippocampal biological processes in response to runner plasma infusions.
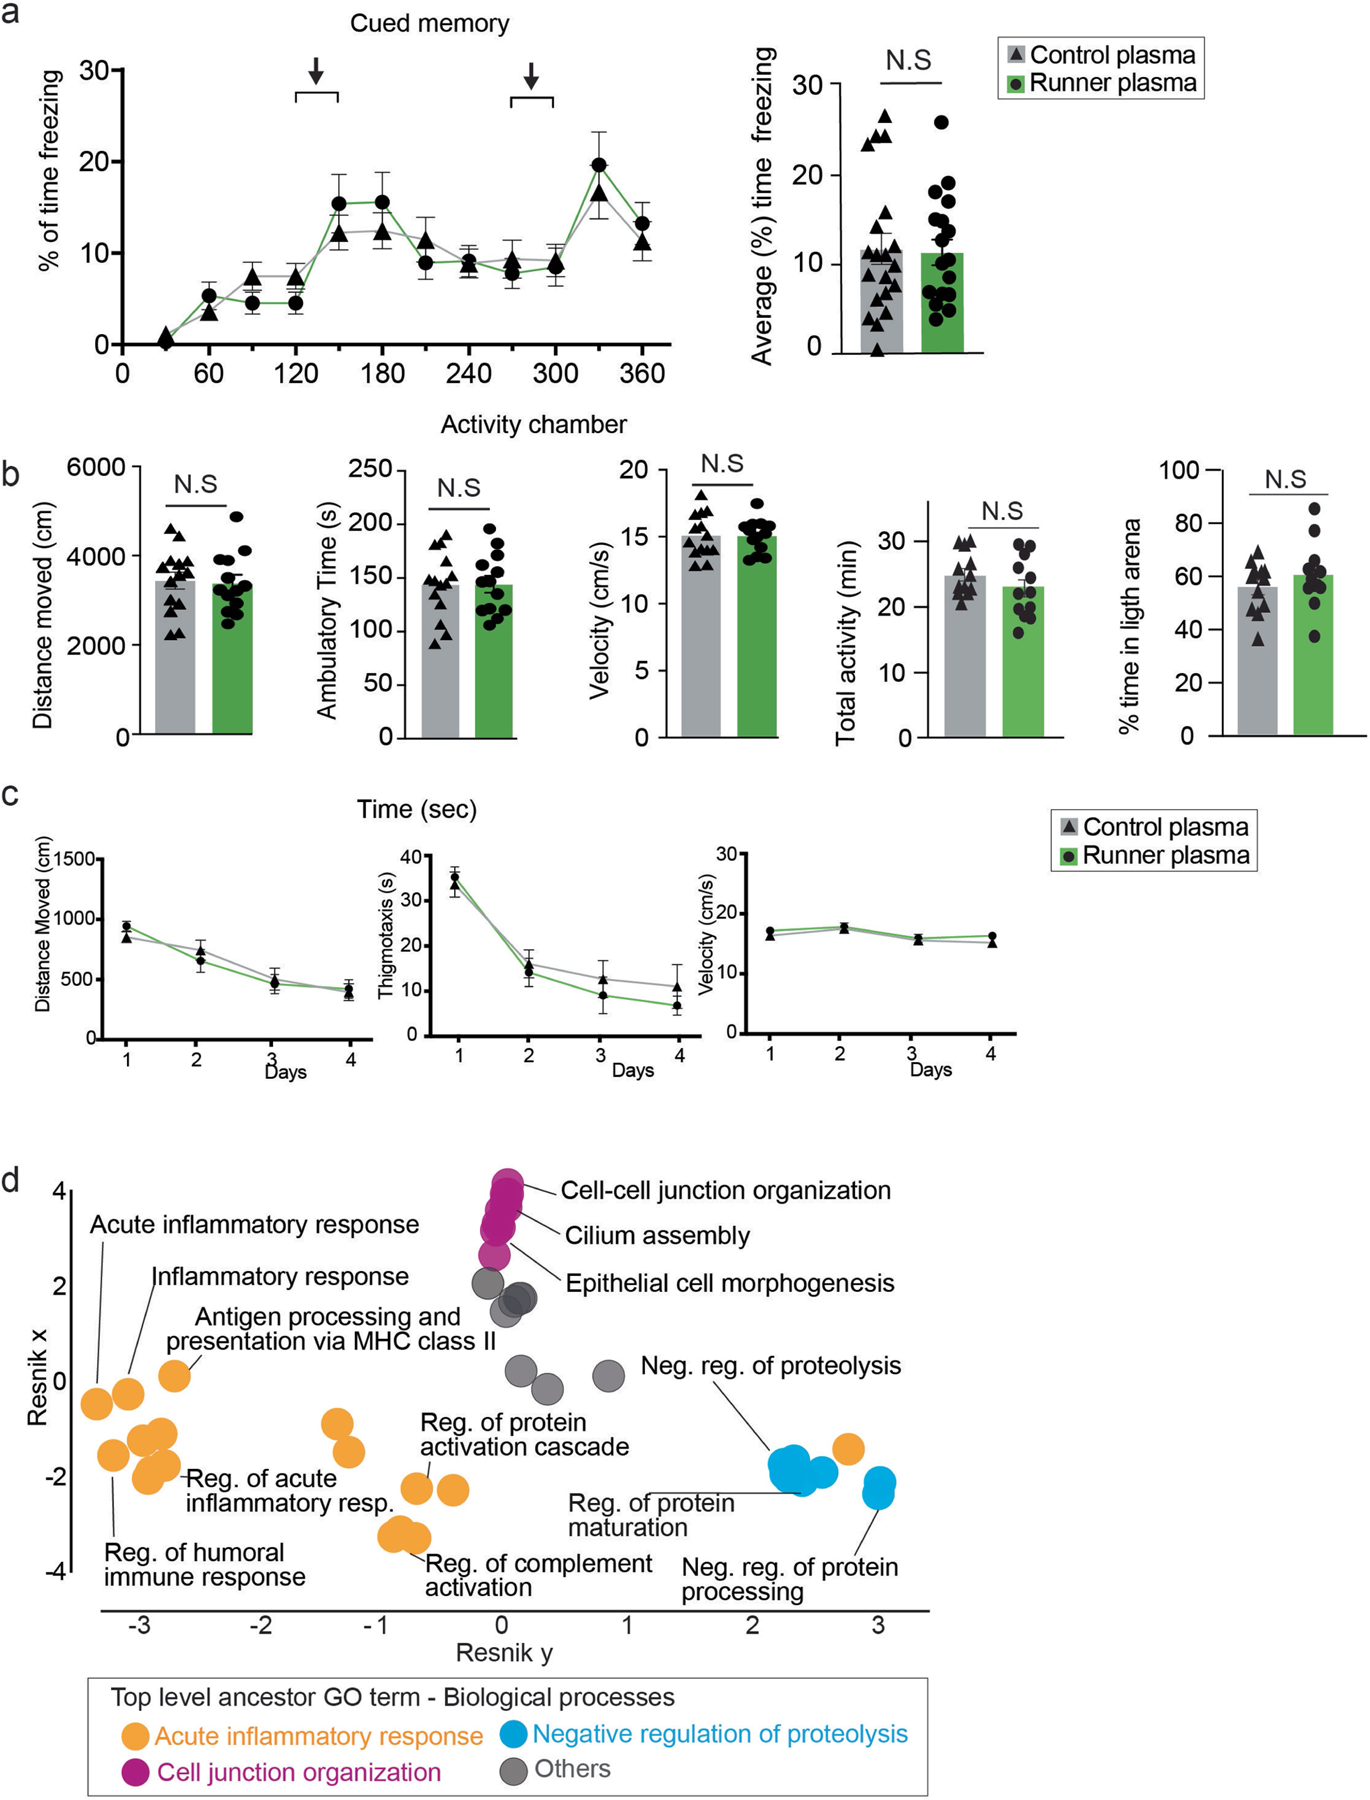
a, Plasma from running mice (3–4 months of age) was collected and transferred to matched aged non-running mice, once every 3 days for 28 days. Mice were then tested for cued memory on the fear conditioning test. Graphs show percentage of freezing behaviour in response to the light/tone cues associated with the fear stimulus in CP and RP recipient mice (n = 18–20 per group). Means ± s.e.m; Unpaired Student’s two-tailed t test, N.S. not significant. b, CP and RP infused mice show comparable activity and velocity in the activity chamber (n = 13–14 per group) and percentage of time spent in the light arena (n = 12 per group). Means ± s.e.m; unpaired Student’s two-tailed t test; N.S., not significant. c, Graphs show distance traveled, thigmotaxis and velocity displayed by mice infused with RP or CP in the water maze test (n = 12 per group). d, Hierarchical networks of the abundance of gene ontology (GO) terms (Fisher’s exact test, P < 0.05) related to biological processes using REVIGO (Resnik measurement, 0.7 distance). GO terms correspond to the DEGs with treatment of CP versus RP shown in Fig. 1h.
Extended Data Fig. 3 |. Validation of changes in gene expression in response to runner plasma infusions and validation of changes in proteins with running.
a, PCA analysis of common DEGs (Wald test, P < 0.05) induced by LPS (SAL-SAL (blue) vs. SAL-LPS (red) and by RP treatment (LPS-CP (grey) vs. LPS-RP (green)) (n = 7–8 per group). b, Graphs show fold changes of relative gene expression of indicated genes measured by qPCR (n = 7–8 per group). Means ± s.e.m; One-way ANOVA and Bonferroni post-hoc; * P < 0.05, ** P < 0.01, *** P < 0.001 and **** P < 0.0001. c, Validation of proteins captured with shotgun-LC MS1 using TMT-LC MS3 detection and analysis. Heat map depicting the relative levels of the top differentially expressed plasma proteins detected. Unpaired Student’s two-tailed t test; * P < 0.05, ** P < 0.01 and *** P < 0.001. d, Classification by PCA analysis using plasma proteins detected by Shotgun-LC-MS1 and significantly changed with running (unpaired Student’s two-tailed t test, P < 0.05). Data are Log2 transformed and missing values imputed by using the mean of each group. Control plasma (grey); runner plasma (orange). (n = 8 per group). e, Hierarchical networks of the abundance of gene ontology (GO) terms (Fisher’s exact test, P < 0.05) related to biological processes using REVIGO (Resnik measurement, 0.7 distance). GO terms correspond to the proteins significantly change with running when comparing CP with RP (unpaired Student’s two-tailed t test, P < 0.05) and shown in Fig. 3b.
Extended Data Fig. 4 |. Assessment of fibrinolysis and measurement of clot formation in runner plasma.
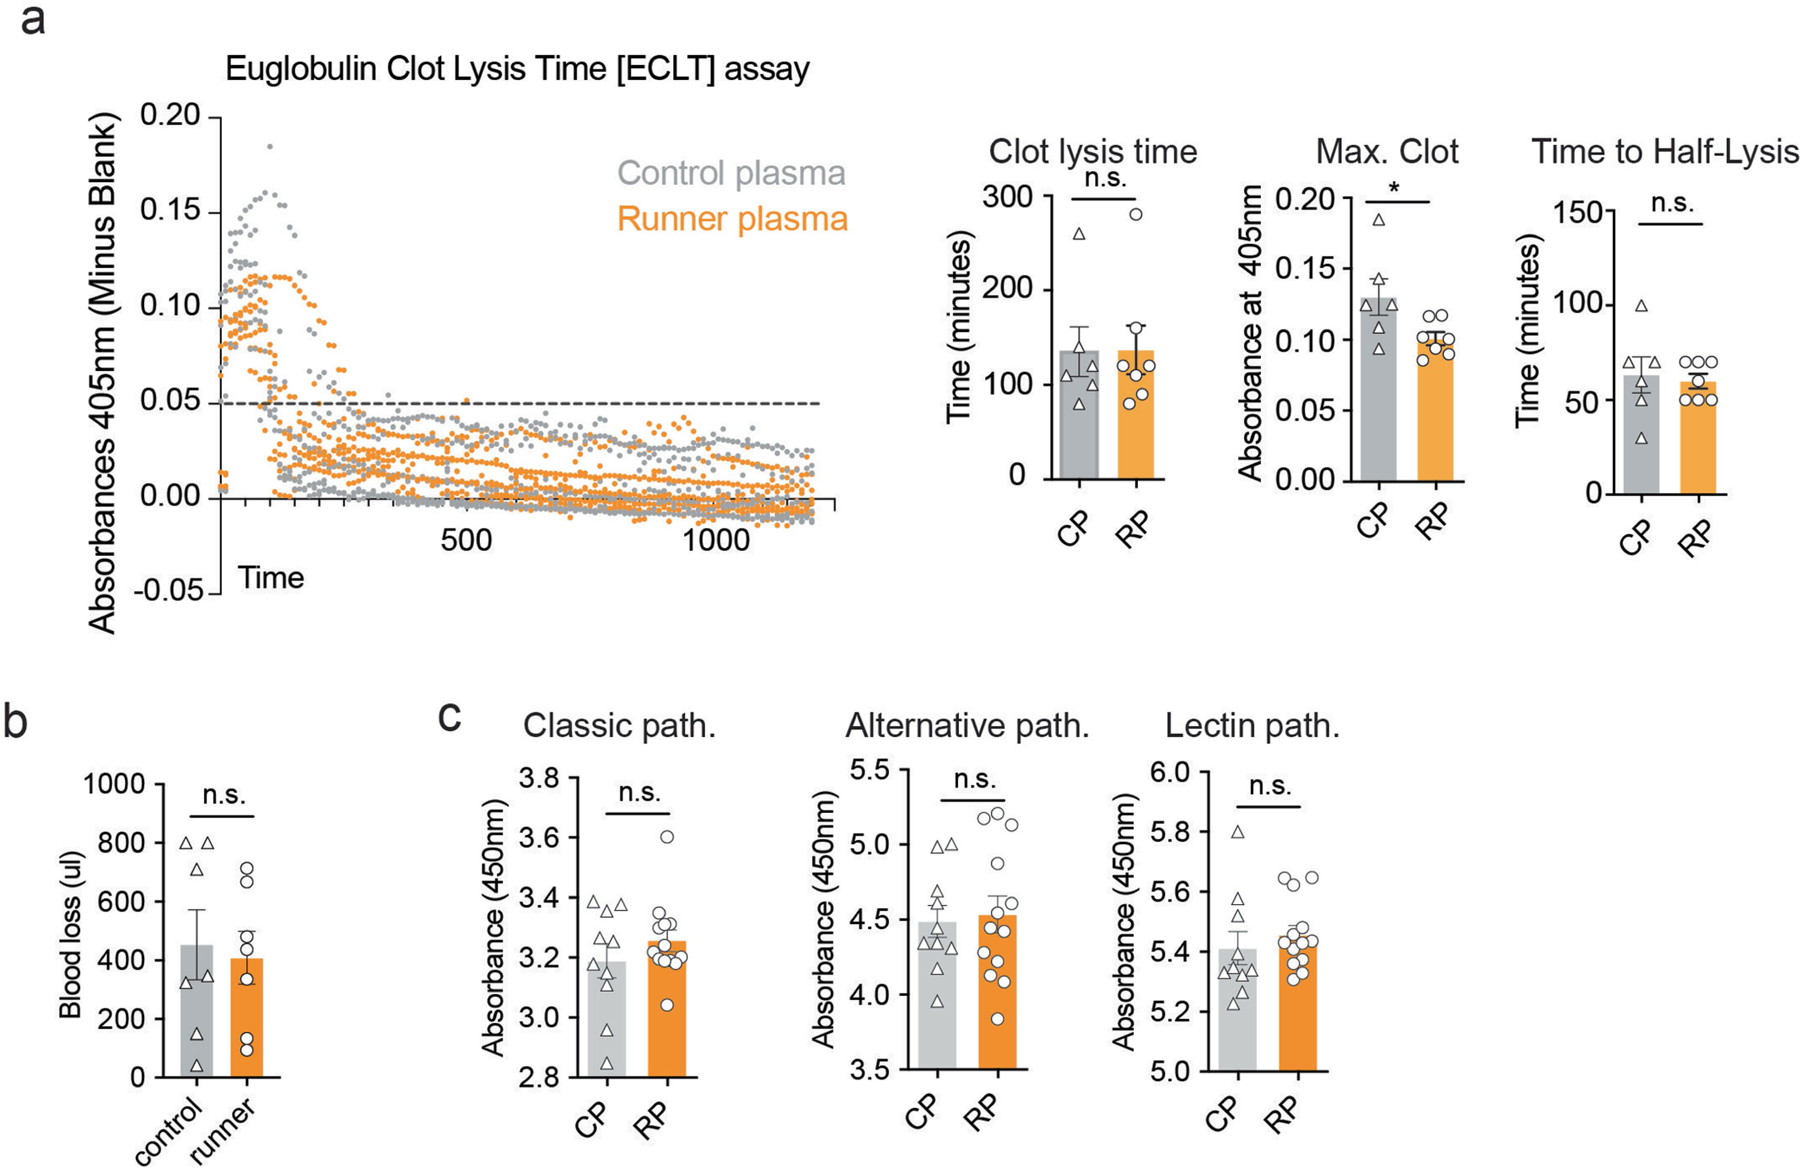
a, The formation and lysis of clots in control and runner’s plasma as measured by the Euglobulin Clot Lysis Time [ECLT] assay. Clot formation and lysis is measured under continuous spectrophotometric absorbance readings at 405nm. (Maximum clot formation is defined as the maximum absorbance; Clot lysis time is defined as the as the time at which the curve reaches an absorbance of 0.05 or less; Time to half lysis is defined as the time at which the curve reaches 50% of clot lysis) (n=6–7 per group). Means ± s.e.m; unpaired Student’s two-tailed t test; n.s., not significant, * P < 0.05. b, Amount of blood lost in runner and control mice after tail clipping as measured by the haemoglobin concentration (n = 7 per group). Means ± s.e.m; unpaired Student’s two-tailed t test; n.s., not significant. c, Measuring the activity of the classical, alternative, and lectin complement pathways in control versus runner’s plasma. Plots show absorbance at 450nm indicative of levels of membrane C5b-9 attack complex formation induced by IgM, LPS, or Mannose Binding Lectin (MBL) respectively (n = 10–13 per group). Means ± s.e.m; Unpaired Student’s two-tailed t test; n.s., not significant.
Extended Data Fig. 5 |. Changes in plasma proteins in female and male mice in response to running.
a - b. Volcano plot showing proteins significantly changed (P < 0.05) in RP versus CP in female or male mice. Downregulated proteins (blue); upregulated proteins (red). Unpaired Student’s two-tailed t test without FDR correction. c – d. Representative plasma proteins of the complement and coagulation pathways in male or female mice with 28 days of running (n = 8 per group). Means ± s.e.m, Unpaired Student’s two-tailed t test.
Extended Data Fig. 6 |. Immunodepletion of clusterin in runner plasma abrogates its anti-inflammatory properties on the hippocampus.
a. Male mice (3–4 months of age) were injected with LPS and treated with saline (LPS – SAL, n=10), runner plasma (LPS – RP, n=10), runner plasma without CLU (LPS – RP – CLU, n=8), runner plasma without FH (LPS – RP – FH, n=8), runner plasma without LIFR (LPS – RP – LIFR, n=8)) or runner plasma without PDEF (LPS – RP – PDEF, n=8). Heat map representing the relative differences between the mean of each group (zscore of means) on selected inflammatory gene markers in the hippocampus. b. Western blotting shows that CLU removal from a plasma sample after depletion via CLU antibody coupled to superparamagnetic beads using a Dynabeads® Antibody Coupling Kit bind to CLU.
Extended Data Fig. 7 |. Expression of Clu and its receptor Lrp8 across different cell types and organs of the adult mouse.
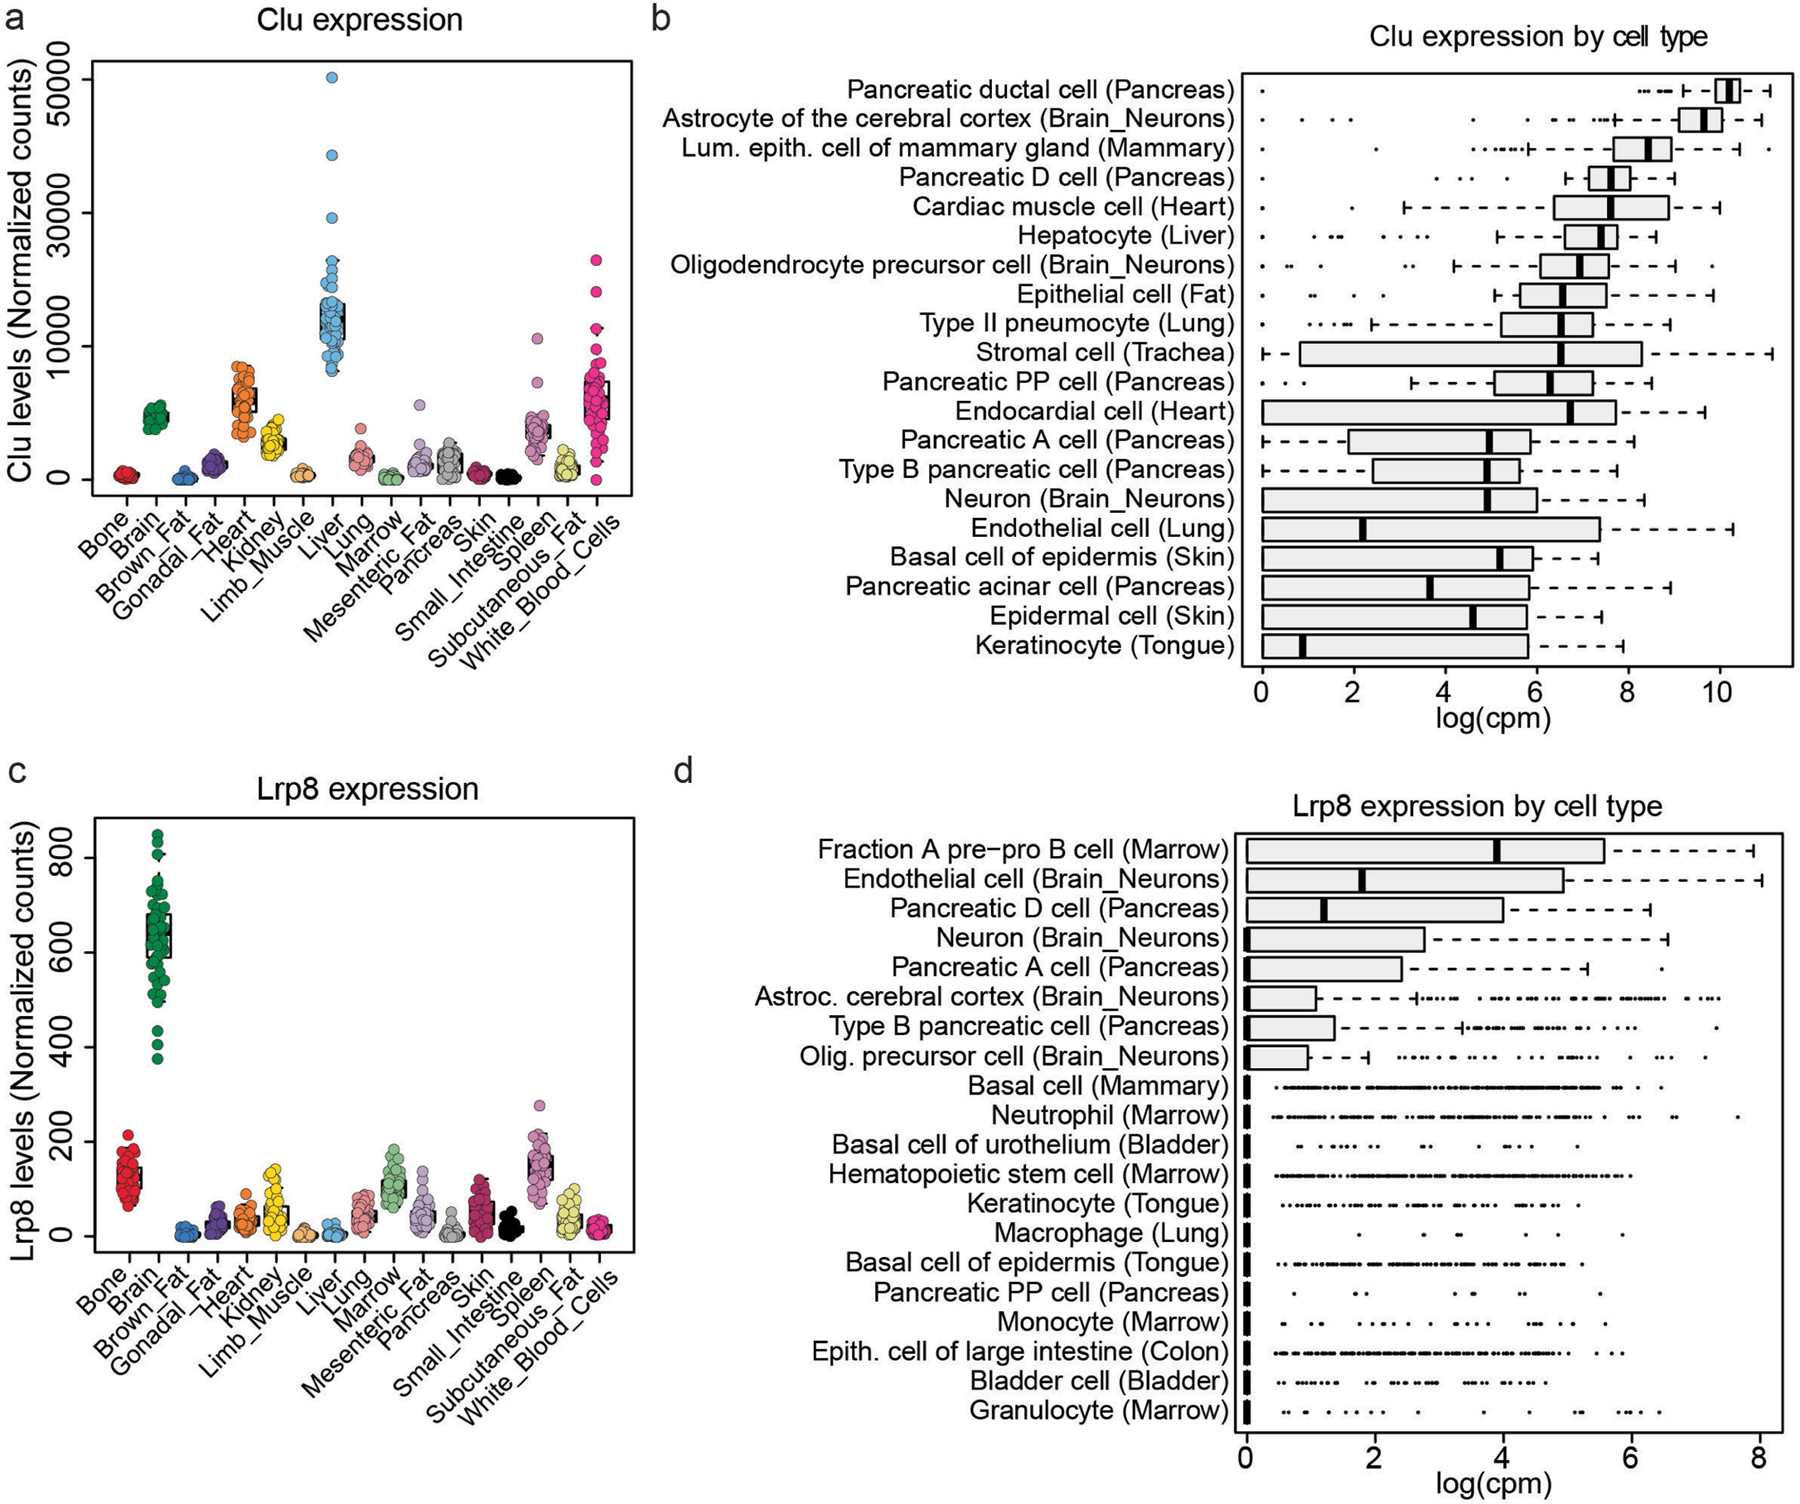
a. Clu mRNA levels across organs quantified from the bulk RNA-seq dataset conducted on different organs of the adult mouse56. b. Bar chart showing the top 20 Clu expressing cells at the mRNA level among >100 different cell types of the adult mouse quantified from the Tabula Muris Atlas dataset40 (n=4 male and n = 4 female biological replicates). c. The mRNA levels of the Clu receptor LRP8/ApoER2 across organs quantified from the bulk RNA-seq dataset conducted on different organs of the adult mouse56. d. Bar chart showing the top 20 Lrp8 expressing cells at the mRNA level among >100 different cell types of the adult mouse quantified from the Tabula Muris Atlas dataset40.
Extended Data Fig. 8 |. Experimental design, cell population consistency, and pathways analysis of the scRNA-seq experiment conducted on hippocampal BEC isolated from LPS and CLU treated mice.
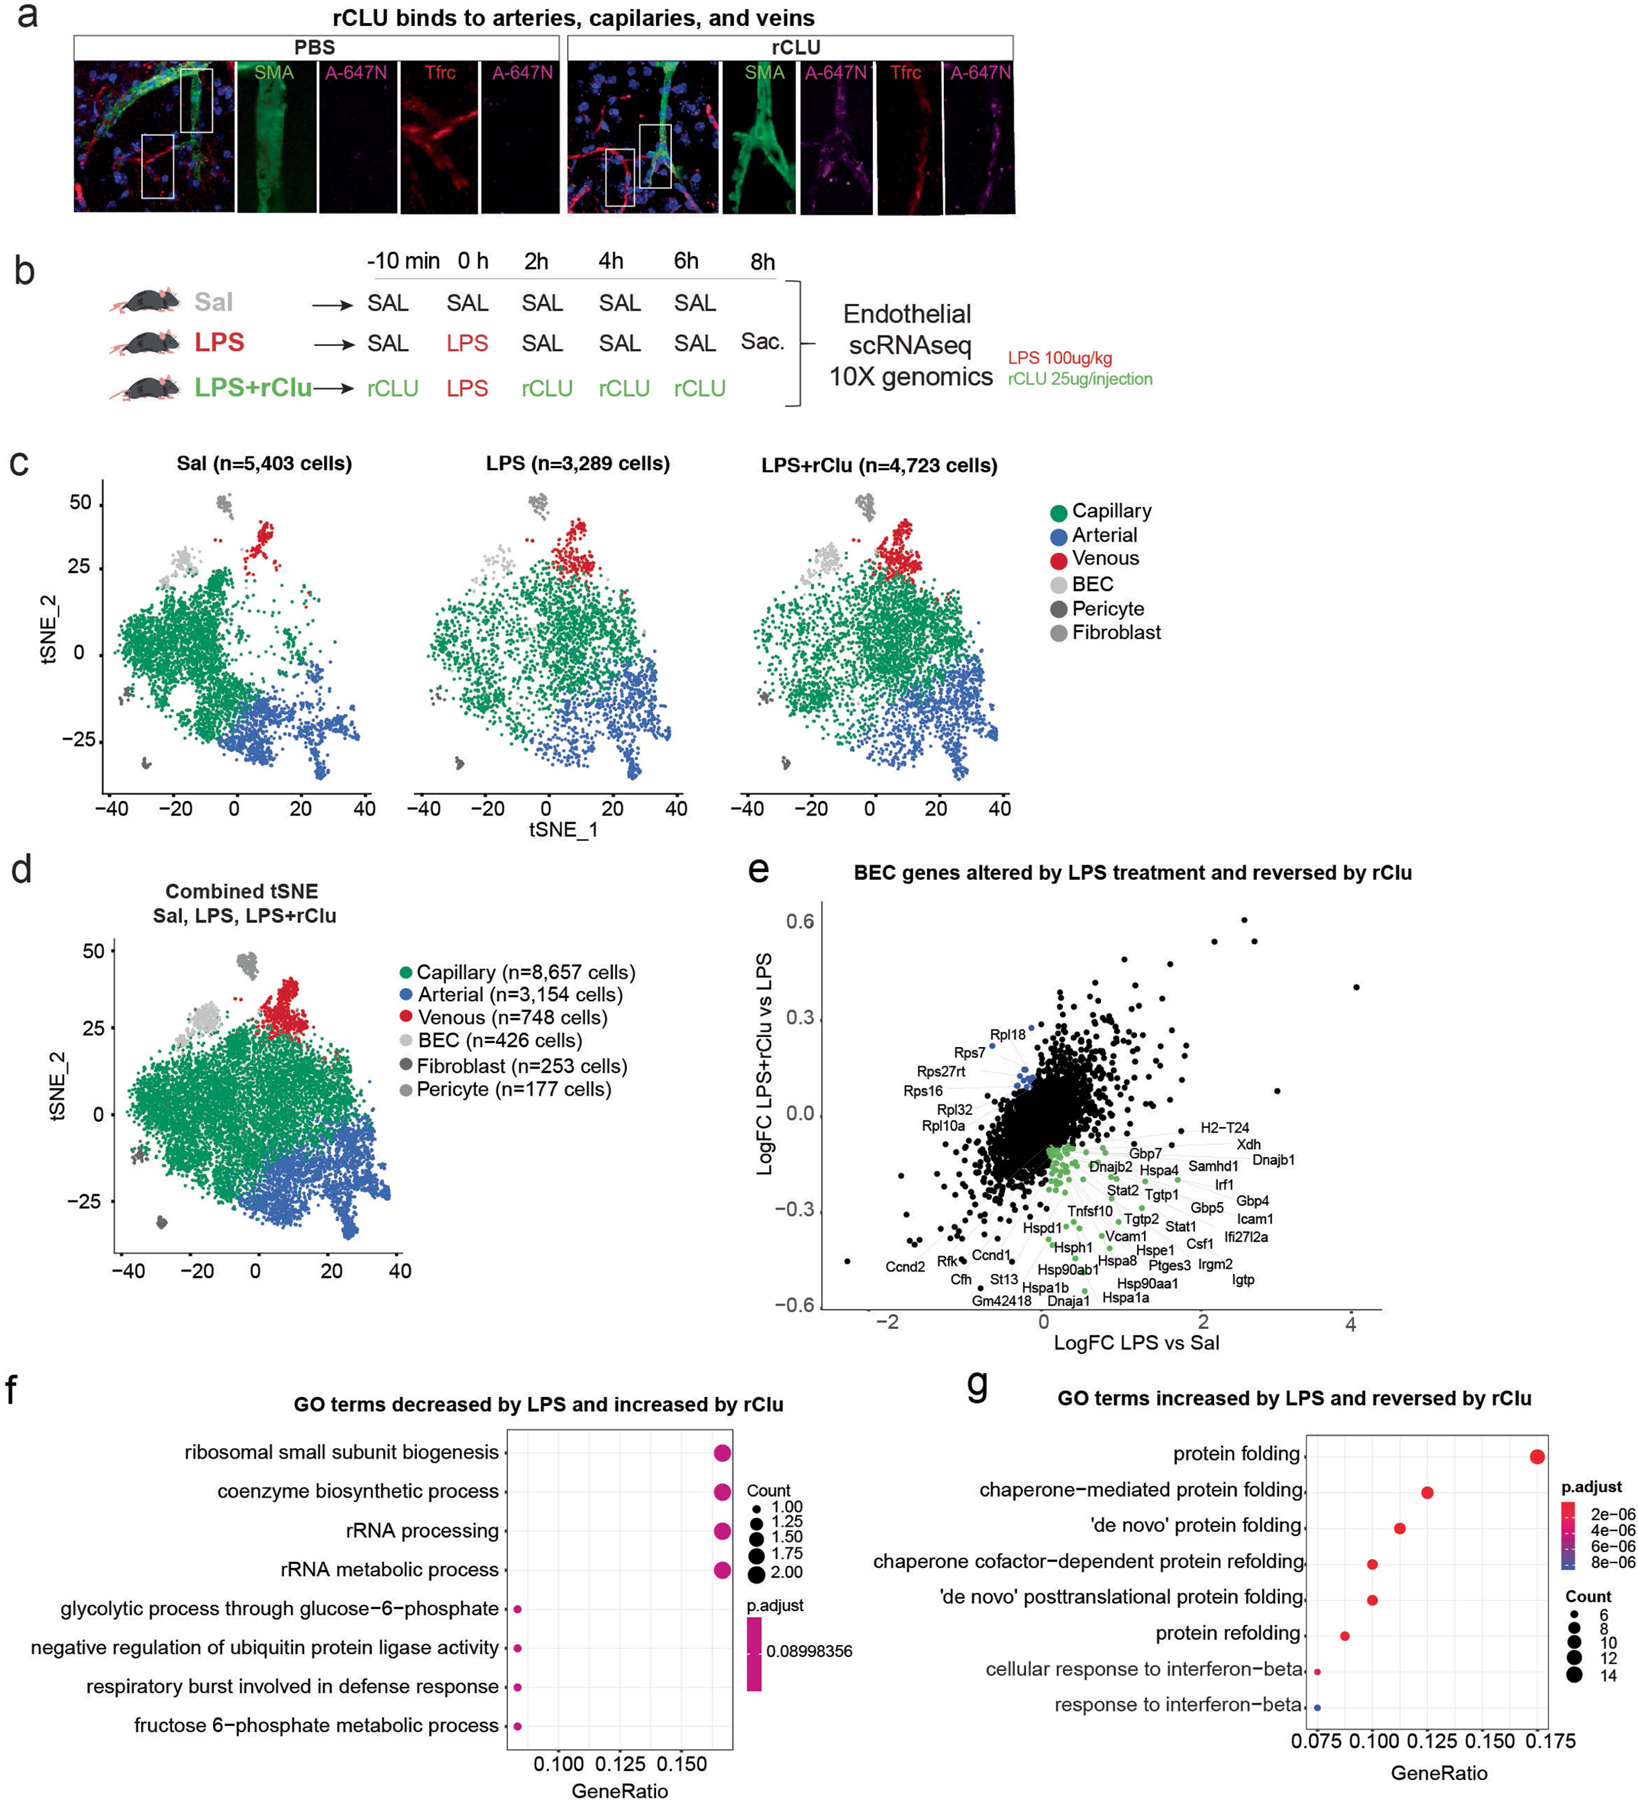
a, Confocal representative images show peripherally injected rCLU tagged with Atto-647N or control PBS containing Atto-647N colocalized with cells of the cerebrovasculature, arteries (SMA), capillaries and veins (Tfrc). Scale bars, 10 μm. b, Schematic depicting the experimental paradigm followed for the injections of the three groups. 3- to 4-month-old male mice received Saline only injections (Sal), LPS plus saline treatments (LPS), or LPS plus recombinant CLU (LPS+Clu). BECs were isolated from n = 4–5 per group. c, tSNE plots showing the cellular proportions, numbers, and distributions in the three experimental groups (Sal, LPS, LPS+Clu). d, tSNE plots show distribution of BECs among arterial, capillary, and venous cells by group. Combined tSNE plot for BECs sorted from 3- to 4-month-old male mice (n = 4–5 mice per group) treated with Saline, LPS, and LPS+CLU. (Cells labelled as BEC are of low quality and were excluded from differential expression analysis.). e, Scatter plots show a list of selected genes altered in BECs (arterial, capillary, and venous) by acute inflammation (LPS) and reversed by CLU treatment. Coloured genes represent genes that pass the cutoff fold change of 1.1. Green: Genes increased by inflammation and reversed by CLU. Blue: Genes reduced by inflammation and reversed by CLU. (Log FC: natural logarithm of fold change). f-g, Dotplot showing Gene Ontology (GO) Biological Processes terms for BEC genes (Benjamini–Hochberg adjustment test, FDR < 0.05) that decrease or increase by LPS treatment and are reversed by CLU. Genes were selected based on the cutoff fold change of 1.1. The images in b were generated using MediaLab (https://medialab.biochem.wisc.edu/clip-art/).
Extended Data Fig. 9 |. Experimental design, cell population consistency, and pathways analysis of the scRNA-seq experiment conducted on hippocampal BEC isolated from APP and CLU treated mice.
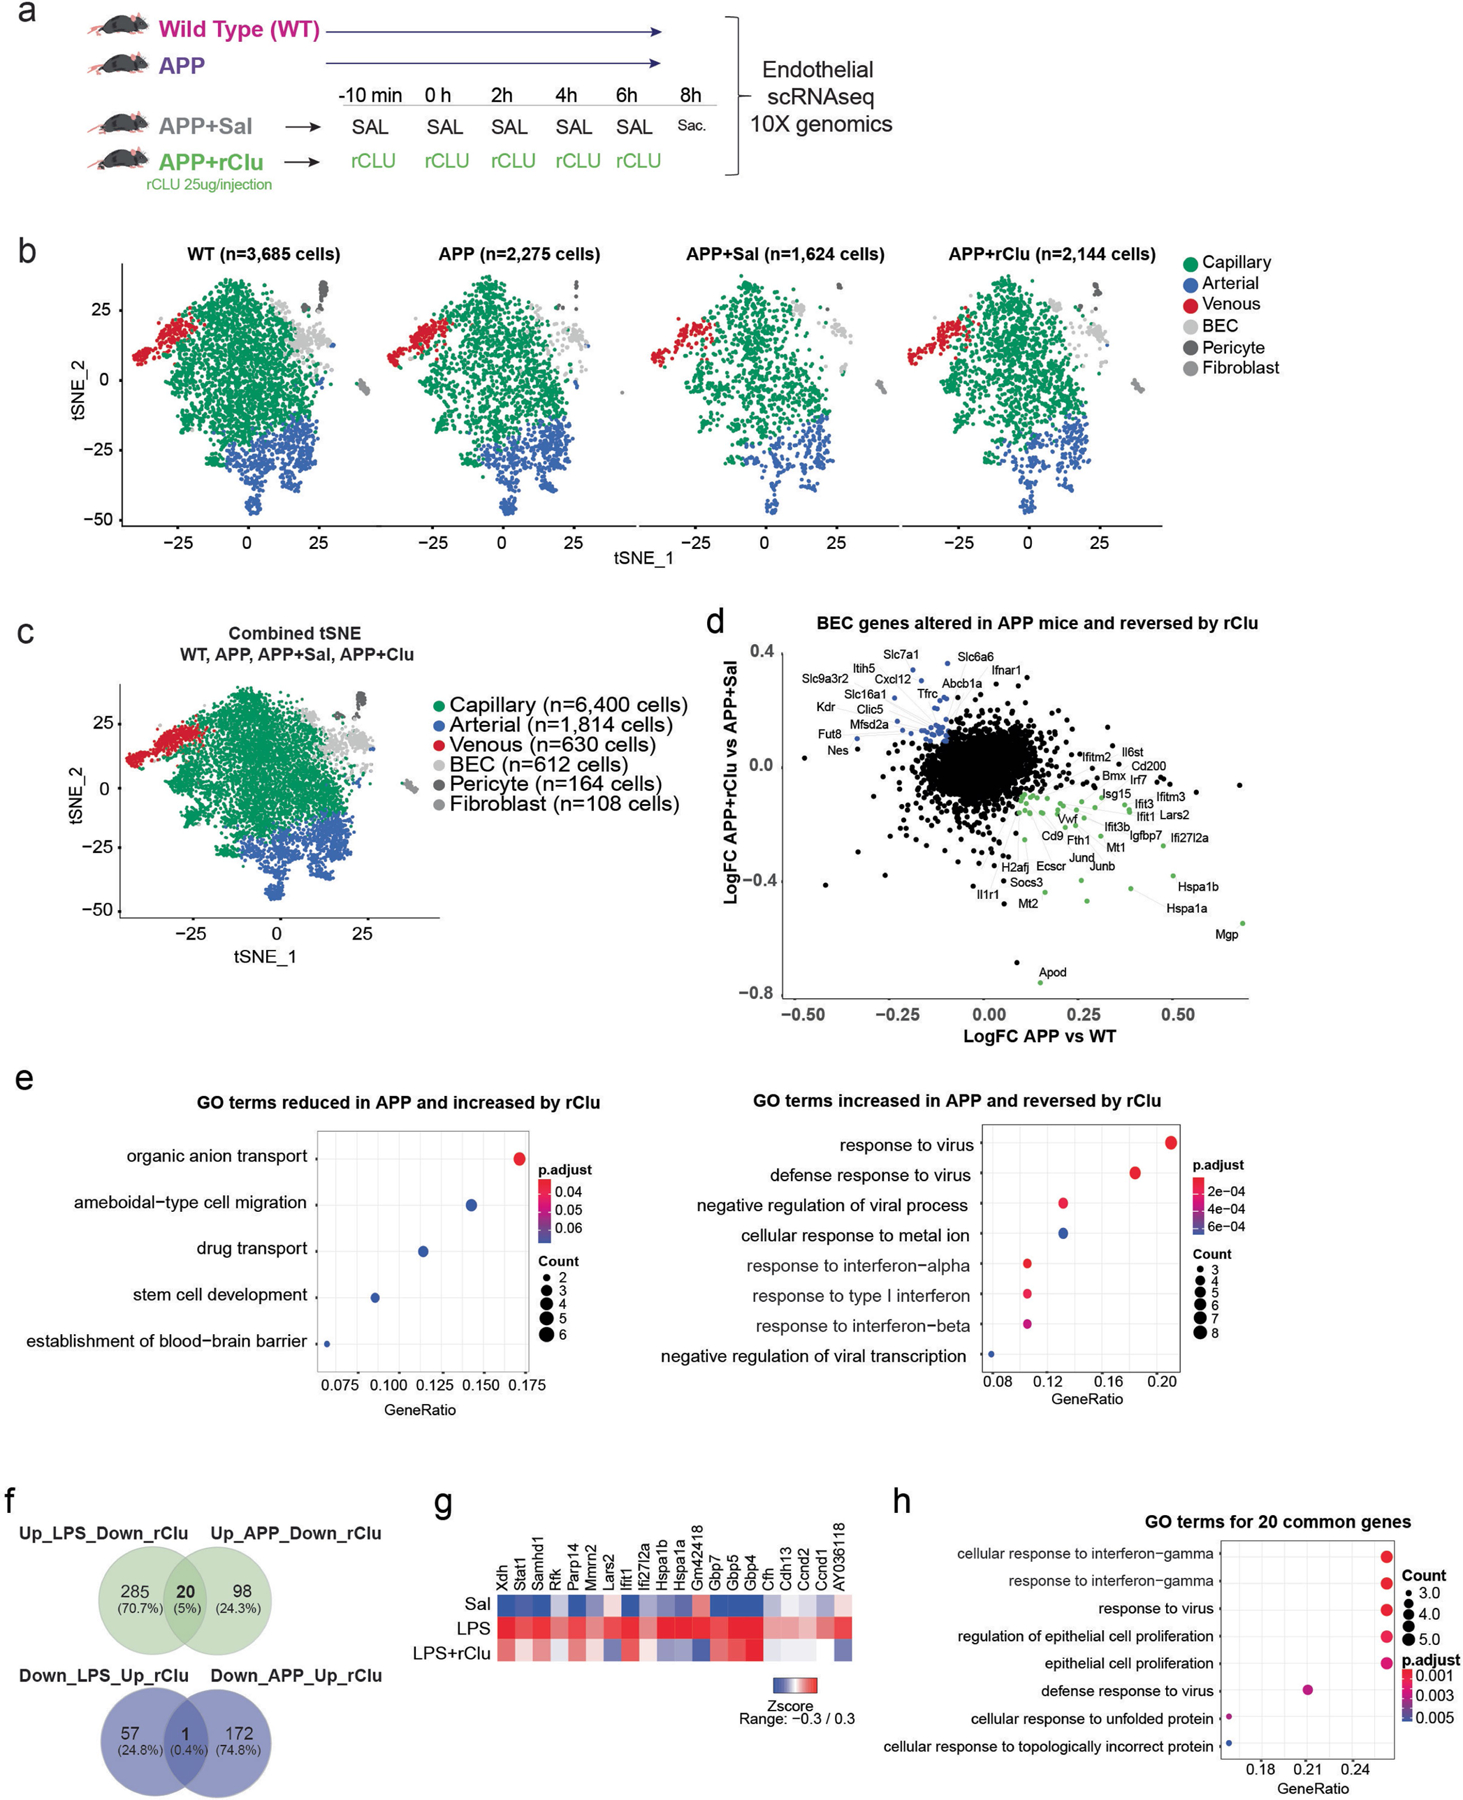
a, Schematic depicting the experimental paradigm followed for the injections of the four groups. 14-months-old male Wild Type (WT) and APP transgenic mice that received no treatment, 17-months-old male APP mice that received saline only injections (APP+Sal) or repetitive CLU injections (APP+Clu) (BECs were isolated from n = 4–5 per group). b, tSNE plots showing the cellular proportions, numbers, and distributions in the four experimental groups (WT, APP, APP+Sal, APP+Clu). c, tSNE plots show distribution of BECs among arterial, capillary, and venous cells by group. Combined tSNE plot for BECs sorted from 14-month-old male wild-type and APP transgenic mice and 17-month-old male APP mice treated with Saline or CLU (BECs sorted from n = 4–5 mice per group). (Cells labelled as BEC are of low quality and were excluded from differential expression analysis.). d, Scatter plots show a list of selected genes altered in BECs (arterial, capillary, and venous) by chronic (APP) inflammation and reversed by CLU treatment. Coloured genes represent genes that pass the cutoff fold change of 1.1. Green: Genes increased by inflammation and reversed by CLU. Blue: Genes reduced by inflammation and reversed by CLU. (Log FC: natural logarithm of fold change). e, Dotplot showing Gene Ontology (GO) Biological Processes terms for BEC genes (Benjamini–Hochberg adjustment test, FDR < 0.05) that decrease or increased in APP mice compared to wild types and are reversed by CLU. Genes were selected based on the cutoff fold change of 1.1. f, Venn Diagram showing the number of unique and common genes that are increased by LPS and APP and reversed by CLU and reduced by LPS and APP and reversed by CLU (Extended Data Fig. 8f,g and 9e). g, Heatmap showing the common 20 genes increased with acute (LPS) inflammation and reversed by rCLU treatment (from Extended Data Fig. 8e panel). h, Dot plot showing Gene Ontology (GO) Biological Processes terms for BEC genes (Benjamini–Hochberg adjustment test, FDR < 0.05) of the common genes (from panel f, left) that increased with acute (LPS) and chronic (APP) inflammation and are reversed by Clu treatment. The images in a were generated using MediaLab (https://medialab.biochem.wisc.edu/clip-art/).
Extended Data Fig. 10 |. Changes in cortical gene expression in response to LPS inoculation and treatment with CLU.
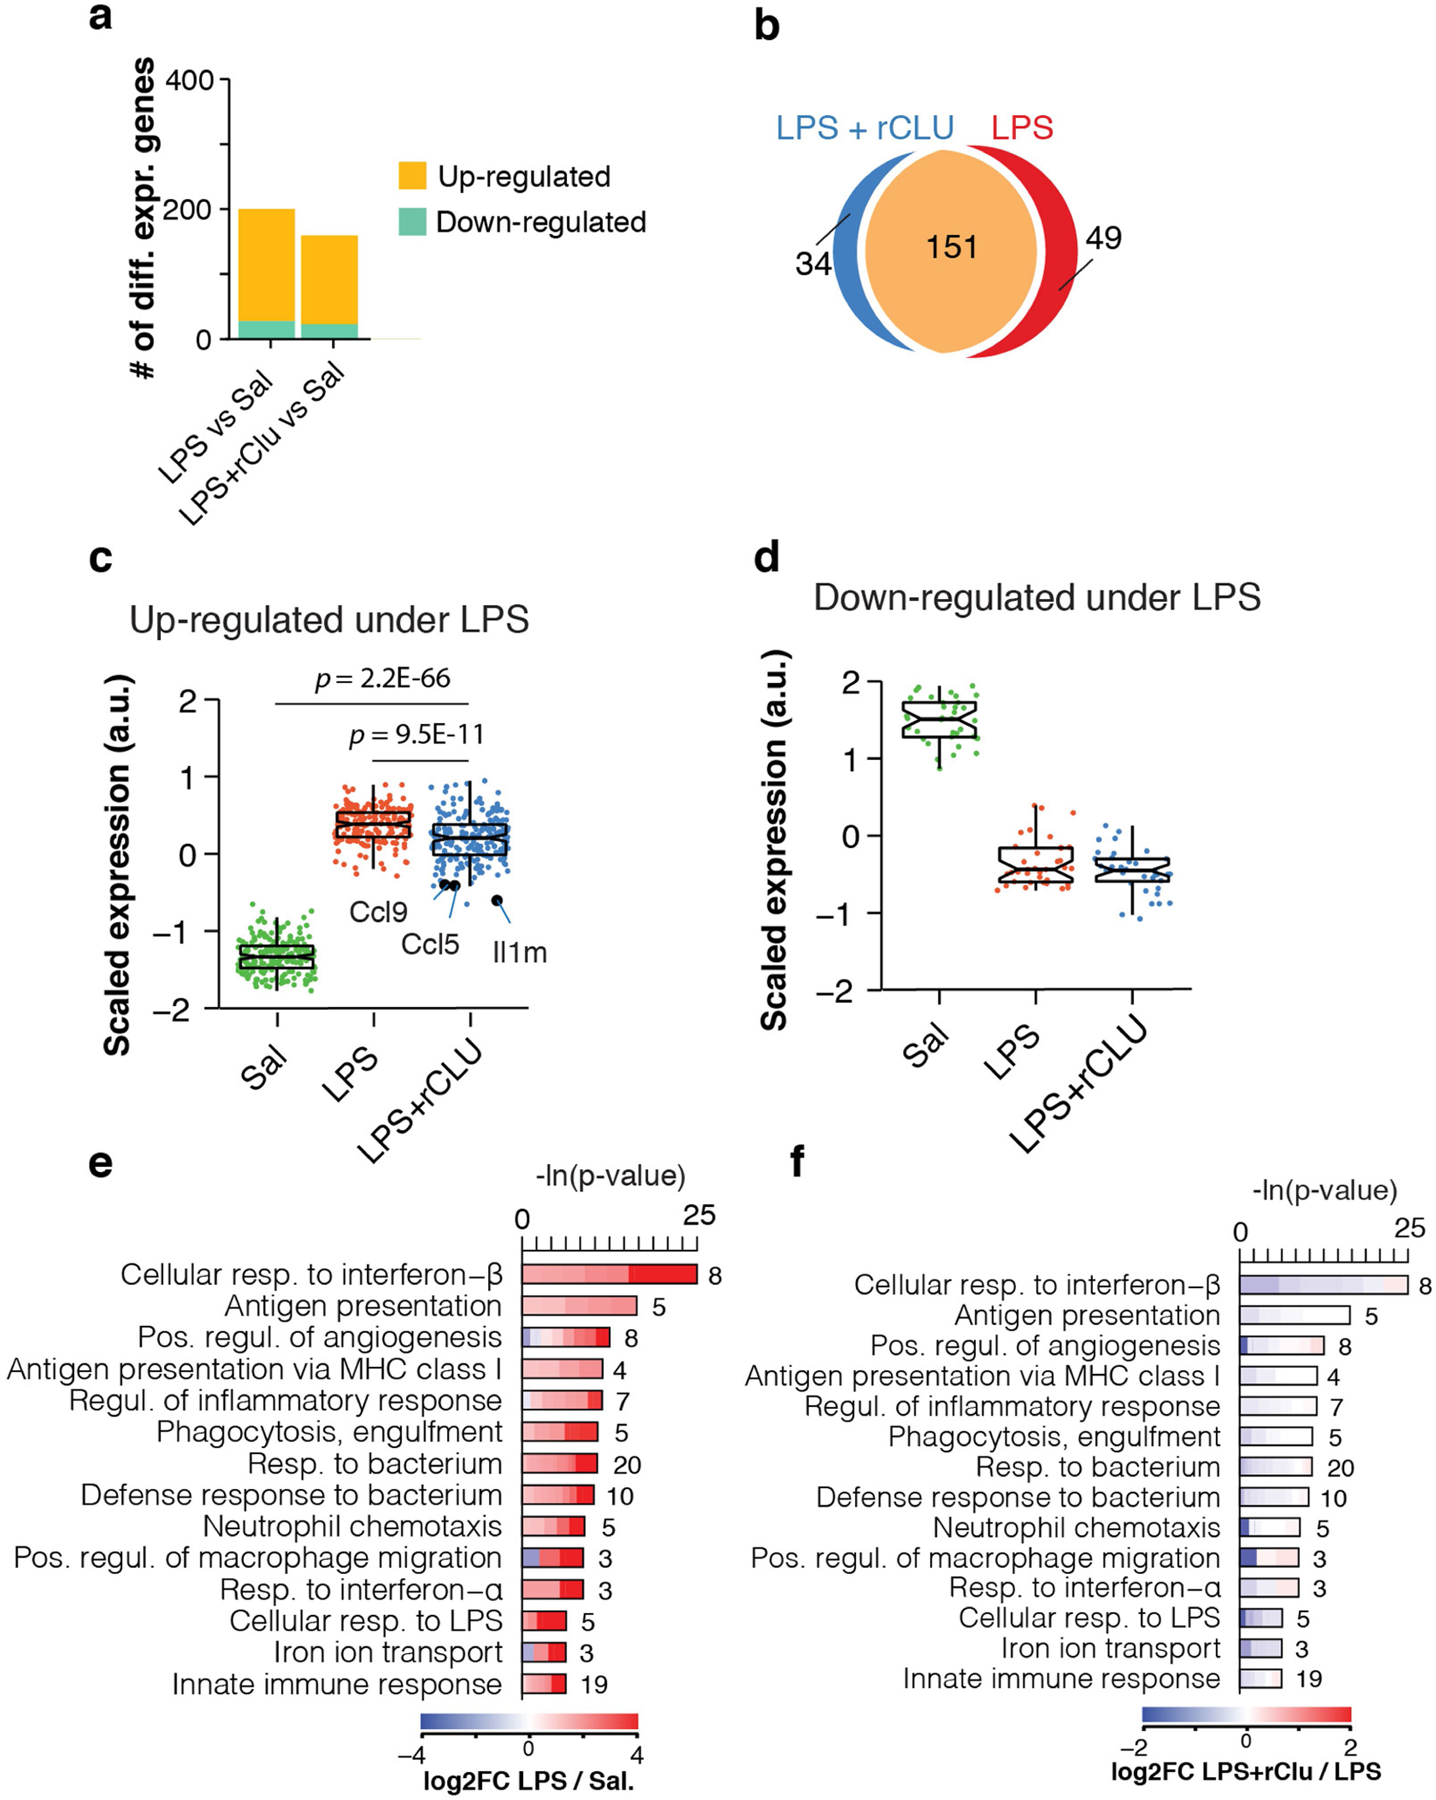
a. Number of DEGs (Wald test; P < 0.1) between Saline-treated mice (n = 4) and either LPS (n =8) or LPS+rCLU (n = 7) injected animals. b. Venn diagrams depicting the overlap of DEGs (shown in panel a) in whole cortex of mice inoculated with LPS or LPS+rCLU, relative to the Saline-injected controls. c – d. Boxplot representation of scaled expression levels of 200 differentially up- and down-regulated genes under LPS as opposed to Saline controls. Whiskers represent the first and fifth quartiles, box edges represent the second and fourth quartiles and the centre line represents the third quartile/median. Two-sided Wilcoxon rank-sum test. e – f. Representative GO enrichment categories of LPS significantly regulated genes. Lengths of bars represent negative ln-transformed P using two-sided Fisher’s exact test. Colours indicate gene-wise log2 fold-changes (log2(FC)) between (e) LPS and Saline treatment or (f) LPS+rCLU and LPS treatment. Numbers beside bars indicate DEGs induced by LPS in that GO category.
Extended Data Fig. 11 |. Changes in plasma proteins of the complement and coagulation pathways in humans and male mice in response to exercise.
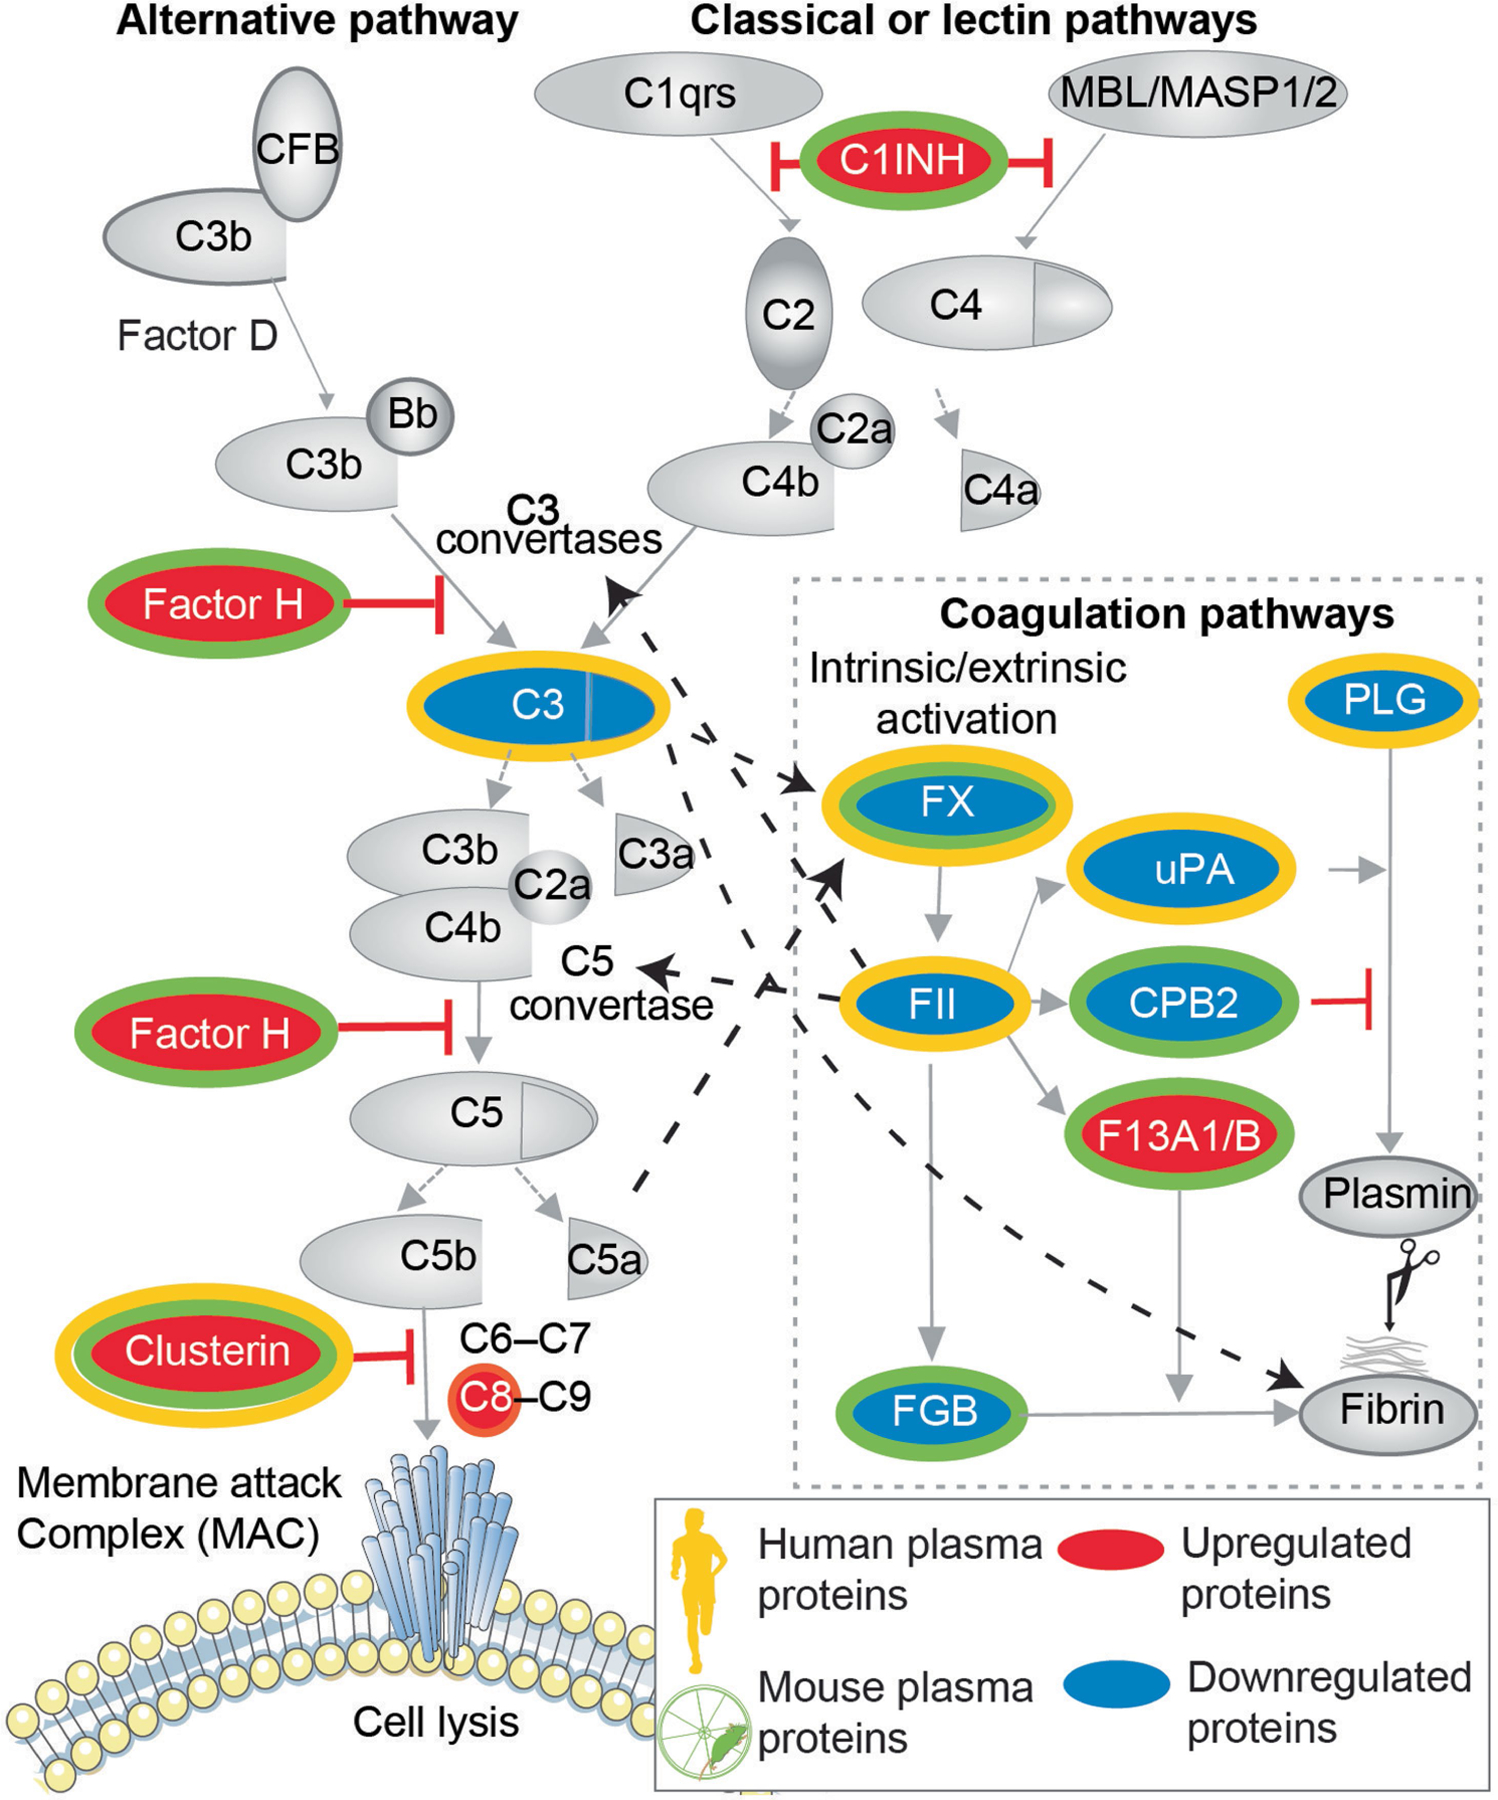
Schematic representation of the significantly changed (P < 0.05) plasma proteins of complement and coagulation cascades in humans and mice after exercise. Dotted black arrows indicate relationship between factors of the complement and the coagulation system. The diagram was generated using Servier Medical Art (https://smart.servier.com), MediaLab (https://medialab.biochem.wisc.edu/clip-art/) and Freepik (https://www.freepik.com).
Extended Data Table 1 |.
Exercise-induced factors that affect the brain
| Name of molecule or cell | Change in the periphery with exercise | Is the molecule sufficient for the effect? | Is the molecule necessary for the effect? | Brain endpoint | Model system | Citation |
|---|---|---|---|---|---|---|
| Insulin-like growth factor 1 (IGF-1) | YES In vivo: IGF-1 subcutaneus infusion increases BrdU+ cells in the HC. |
YES in vivo: IGF-1 antiserum administered subcutaneously during treadmill running reduces BrdU+ cells In the HC |
Neuroplasticity | Rat | Trejo et al. 2001 | |
| ↑ Increased in serum with long term training ↓ Decreased | human |
Koziris, L. P. et al. 1999 Eliakim. A. et al. 1996 and 1998 |
||||
| Vascular endothelial growth factor (VEGF) | Wheel running | YES in vivo: overexpression of VEGF antagonist in the periphery during 7 days of voluntary wheel running decreased BrdU+ cells |
Neuroplasticity | mouse | Fabel et al. 2003 | |
| Cathepsin B (CTSB) | ↑ CTSB plasma levels increase with 3, 14 or 30 day of running | YES in vivo: mice CTSB KO that showed no increase of DCX+ cells in the HC with running |
Neuroplasticity | mouse | Moon et al. 2016 | |
| Irisin (FNDC5) | ↑ In plasma after 3 weeks of free wheel running | YES in vivo: adenoviral overexpression of FNDC5 in the liver increases BDNF in the HC. |
mouse |
Wrann et al. 2013
Bostrom P et al. 2012 |
||
| PF4/platelets | ↑ PF4 plasma levels increase in mice that ran for 1 day | YES in vivo; anti-platelet serum administered during 13 days of voluntary wheel running prevented the increase of Ki67+ cells in the hippocampus |
Neuroplasticity | mouse | Leiter et al. 2019 | |
| β-endorphin | YES in vivo: β-E KO prevents the exercise-induced increase in hippocampal KI67+ cells with 10 and 39 days of running, No Doesn’t affect exercise-induced increases in DCX+ or BrdU+ cells. |
Neuroplasticity | mouse | Koehl et al. 2008 | ||
| ↑ Increase in long distance runners | human | Colt et al. 1981 | ||||
| Lactate | ↑ Increase with treadmill running | YES Intraperitoneal lactate injections increased hippocampal lactate and BDNF gene expression and protein |
YES in vivo: intraperitoneal injections of lactate MCT1/2 inhibitor during exercise abolished exercise-induced BDNF expression in the hippocampus |
Neuroplasticity | mouse |
Hayek et al. 2019
Ferreira et al. 2007 |
| Brain derived neurotrophic factor (BDNF) | YES Intravenous BDNF after focal cerebral ischemia reduces neurological deficit and infarct volume. |
Infarct volume | rat | Schabitz et al. 2000 | ||
| ↑ Increase in plasma with treadmill running | human | Cho et al. 2012 | ||||
| Glycosylphosphatidylinositol specific phospholipase D1 (GPLD1) | ↑ Increase in plasma after 6 weeks of free running wheel | YES in vivo: hydrodynamic tail vein injections of expression constructs for Gpld1 increased mRNA expression of Gpld1 in the liver and protein levels in plasma improve adult neurogenesis and cognitive function. |
YES In vivo: hydrodynamic tail vein injections of expression constructs of catalytically inactive H133N-Gpld1 do not affect adult neurogenesis or cognitive function |
Neuroplasticity | mouse | Horowitz et al. 2020 |
Supplementary Material
Acknowledgements
We thank members of the Wyss-Coray laboratory for their support; D. Berdnik for technical assistance; H. du Bois and S. Shuken for sharing their protocols; H. Zhang and K. Dickey for laboratory management; and members of the Stanford Behavioral and Functional Neuroscience Laboratory for their work on the behavioural assays. This work was funded by the US National Institute on Aging (AG047820 to T.W.-C. and T.A.R. and 1F32AG067652 to N.K.) and the Stanford Alzheimer’s Disease Research Center (P30AG066515), the US Department of Veterans Affairs (Research Career Scientist Award IO1 BX001319 to T.W.-C.), a NOMIS Foundation award to T.W.-C., the Simons Foundation (award to T.W.-C.), the Wu Tsai Neurosciences Institutes’ Brain Rejuvenation Project with support from the Bertarelli Foundation (award to T.W.-C.), the Department of Defense (W81XWH-12–1-0584 to K.J.F.), the Alzheimer’s Association (NIRG-15–362171 to J.K.F.) and the Marie Curie Foundation n-273487 (GCs-CNS-IS) awarded to Z.D.M. The contents supported by this funding do not represent the views of the VA or the US Government. We acknowledge Servier Medical Art (https://smart.servier.com), MediaLab (https://medialab.biochem.wisc.edu/clip-art/) and Freepik (https://www.freepik.com) for providing images of mice and cartoon components.
Footnotes
Online content
Any methods, additional references, Nature Research reporting summaries, source data, extended data, supplementary information, acknowledgements, peer review information; details of author contributions and competing interests; and statements of data and code availability are available at https://doi.org/10.1038/s41586-021-04183-x.
Reporting summary
Further information on research design is available in the Nature Research Reporting Summary linked to this paper.
Code availability
Data analyses and graphing have been carried out using free available software packages. When appropriate, custom code from previous literature was cited in the text and is available from the corresponding authors on request.
Competing interests N.O. is affiliated with Calico Life Sciences and has no financial interests to declare. The other authors declare no competing interests.
Additional information
Supplementary information The online version contains supplementary material available at https://doi.org/10.1038/s41586-021-04183-x.
Peer review information Nature thanks the anonymous reviewers for their contribution to the peer review of this work.
Data availability
The MS proteomics data have been deposited to the ProteomeXchange Consortium via the PRIDE55 partner repository under dataset identifier PXD022262 and PXD027406 for male and female mouse plasma proteins, respectively. Single-cell data and bulk RNA-seq datasets have been deposited at the Gene Expression Omnibus under accession number GSE164401. Source data are provided with this paper.
References
- 1.Prakash RS, Voss MW, Erickson KI & Kramer AF Physical activity and cognitive vitality. Annu. Rev. Psychol 66, 769–797 (2015). [DOI] [PubMed] [Google Scholar]
- 2.Gleeson M et al. The anti-inflammatory effects of exercise: mechanisms and implications for the prevention and treatment of disease. Nat. Rev. Immunol 11, 607–615 (2011). [DOI] [PubMed] [Google Scholar]
- 3.He XF et al. Voluntary exercise promotes glymphatic clearance of amyloid beta and reduces the activation of astrocytes and microglia in aged mice. Front. Mol. Neurosci 10, 144 (2017). [DOI] [PMC free article] [PubMed] [Google Scholar]
- 4.van Praag H, Christie BR, Sejnowski TJ & Gage FH Running enhances neurogenesis, learning, and long-term potentiation in mice. Proc. Natl Acad. Sci. USA 96, 13427–13431 (1999). [DOI] [PMC free article] [PubMed] [Google Scholar]
- 5.Hawley JA, Hargreaves M, Joyner MJ & Zierath JR Integrative biology of exercise. Cell 159, 738–749 (2014). [DOI] [PubMed] [Google Scholar]
- 6.Chin LM, Keyser RE, Dsurney J & Chan L Improved cognitive performance following aerobic exercise training in people with traumatic brain injury. Arch. Phys. Med. Rehabil 96, 754–759 (2015). [DOI] [PMC free article] [PubMed] [Google Scholar]
- 7.Horder H et al. Midlife cardiovascular fitness and dementia: a 44-year longitudinal population study in women. Neurology 90, e1298–e1305 (2018). [DOI] [PMC free article] [PubMed] [Google Scholar]
- 8.da Costa Daniele TM et al. Exercise effects on brain and behavior in healthy mice, Alzheimer’s disease and Parkinson’s disease model—a systematic review and meta-analysis. Behav. Brain Res 383, 112488 (2020). [DOI] [PubMed] [Google Scholar]
- 9.Trejo JL, Carro E & Torres-Aleman I Circulating insulin-like growth factor I mediates exercise-induced increases in the number of new neurons in the adult hippocampus. J. Neurosci 21, 1628–1634 (2001). [DOI] [PMC free article] [PubMed] [Google Scholar]
- 10.Fabel K et al. VEGF is necessary for exercise-induced adult hippocampal neurogenesis. Eur. J. Neurosci 18, 2803–2812 (2003). [DOI] [PubMed] [Google Scholar]
- 11.Leiter O et al. Exercise-induced activated platelets increase adult hippocampal precursor proliferation and promote neuronal differentiation. Stem Cell Rep 12, 667–679 (2019). [DOI] [PMC free article] [PubMed] [Google Scholar]
- 12.Horowitz AM et al. Blood factors transfer beneficial effects of exercise on neurogenesis and cognition to the aged brain. Science 369, 167–173 (2020). [DOI] [PMC free article] [PubMed] [Google Scholar]
- 13.Chen MB et al. Brain endothelial cells are exquisite sensors of age-related circulatory cues. Cell Rep 30, 4418–4432 (2020). [DOI] [PMC free article] [PubMed] [Google Scholar]
- 14.Batista CRA, Gomes GF, Candelario-Jalil E, Fiebich BL & de Oliveira ACP Lipopolysaccharide-induced neuroinflammation as a bridge to understand neurodegeneration. Int. J. Mol. Sci 20, 2293 (2019). [DOI] [PMC free article] [PubMed] [Google Scholar]
- 15.Conway EM Complement-coagulation connections. Blood Coagul. Fibrinolysis 29, 243–251 (2018). [DOI] [PubMed] [Google Scholar]
- 16.Markiewski MM, Nilsson B, Ekdahl KN, Mollnes TE & Lambris JD Complement and coagulation: strangers or partners in crime? Trends Immunol 28, 184–192 (2007). [DOI] [PubMed] [Google Scholar]
- 17.Hicks AL, Kent-Braun J & Ditor DS Sex differences in human skeletal muscle fatigue. Exerc. Sport Sci. Rev 29, 109–112 (2001). [DOI] [PubMed] [Google Scholar]
- 18.Yip KS, Suvorov A, Connerney J, Lodato NJ & Waxman DJ Changes in mouse uterine transcriptome in estrus and proestrus. Biol. Reprod 89, 13 (2013). [DOI] [PMC free article] [PubMed] [Google Scholar]
- 19.Harold D et al. Genome-wide association study identifies variants at CLU and PICALM associated with Alzheimer’s disease. Nat. Genet 41, 1088–1093 (2009). [DOI] [PMC free article] [PubMed] [Google Scholar]
- 20.Lambert JC et al. Genome-wide association study identifies variants at CLU and CR1 associated with Alzheimer’s disease. Nat. Genet 41, 1094–1099 (2009). [DOI] [PubMed] [Google Scholar]
- 21.Pereira RM et al. Protective molecular mechanisms of clusterin against apoptosis in cardiomyocytes. Heart Fail. Rev 23, 123–129 (2018). [DOI] [PubMed] [Google Scholar]
- 22.Thangaraj SS et al. Contact activation-induced complex formation between complement factor H and coagulation factor XIIa. J. Thromb. Haemost 18, 876–884 (2020). [DOI] [PubMed] [Google Scholar]
- 23.Hunt LC, Upadhyay A, Jazayeri JA, Tudor EM & White JD An anti-inflammatory role for leukemia inhibitory factor receptor signaling in regenerating skeletal muscle. Histochem. Cell Biol 139, 13–34 (2013). [DOI] [PubMed] [Google Scholar]
- 24.Yamagishi S et al. Pigment epithelium-derived factor inhibits TNF-alpha-induced interleukin-6 expression in endothelial cells by suppressing NADPH oxidase-mediated reactive oxygen species generation. J. Mol. Cell. Cardiol 37, 497–506 (2004). [DOI] [PubMed] [Google Scholar]
- 25.Pohlkamp T, Wasser CR & Herz J Functional roles of the interaction of APP and lipoprotein receptors. Front. Mol. Neurosci 10, 54 (2017). [DOI] [PMC free article] [PubMed] [Google Scholar]
- 26.Yang AC et al. Physiological blood-brain transport is impaired with age by a shift in transcytosis. Nature 583, 425–430 (2020). [DOI] [PMC free article] [PubMed] [Google Scholar]
- 27.Middeldorp J et al. Preclinical assessment of young blood plasma for Alzheimer disease. JAMA Neurol 73, 1325–1333 (2016). [DOI] [PMC free article] [PubMed] [Google Scholar]
- 28.Zhou Z, Xu MJ & Gao B Hepatocytes: a key cell type for innate immunity. Cell. Mol. Immunol 13, 301–315 (2016). [DOI] [PMC free article] [PubMed] [Google Scholar]
- 29.Yin C et al. ApoE attenuates unresolvable inflammation by complex formation with activated C1q. Nat. Med 25, 496–506 (2019). [DOI] [PMC free article] [PubMed] [Google Scholar]
- 30.Hong S et al. Complement and microglia mediate early synapse loss in Alzheimer mouse models. Science 352, 712–716 (2016). [DOI] [PMC free article] [PubMed] [Google Scholar]
- 31.Kirszbaum L, Bozas SE & Walker ID SP-40,40, a protein involved in the control of the complement pathway, possesses a unique array of disulphide bridges. FEBS Lett 297, 70–76 (1992). [DOI] [PubMed] [Google Scholar]
- 32.Hsu JL et al. Plasma biomarkers are associated with agitation and regional brain atrophy in Alzheimer’s disease. Sci. Rep 7, 5035 (2017). [DOI] [PMC free article] [PubMed] [Google Scholar]
- 33.Yousef H et al. Aged blood impairs hippocampal neural precursor activity and activates microglia via brain endothelial cell VCAM1. Nat. Med 25, 988–1000 (2019). [DOI] [PMC free article] [PubMed] [Google Scholar]
- 34.Lee JW et al. Neuro-inflammation induced by lipopolysaccharide causes cognitive impairment through enhancement of beta-amyloid generation. J. Neuroinflammation 5, 37 (2008). [DOI] [PMC free article] [PubMed] [Google Scholar]
- 35.Monje ML, Toda H & Palmer TD Inflammatory blockade restores adult hippocampal neurogenesis. Science 302, 1760–1765 (2003). [DOI] [PubMed] [Google Scholar]
- 36.Rockenstein E, Mallory M, Mante M, Sisk A & Masliaha E Early formation of mature amyloid-β protein deposits in a mutant APP transgenic model depends on levels of Aβ1–42. J. Neurosci. Res 66, 573–582 (2001). [DOI] [PubMed] [Google Scholar]
- 37.Villeda SA et al. The ageing systemic milieu negatively regulates neurogenesis and cognitive function. Nature 477, 90–94 (2011). [DOI] [PMC free article] [PubMed] [Google Scholar]
- 38.Liddelow SA et al. Neurotoxic reactive astrocytes are induced by activated microglia. Nature 541, 481–487 (2017). [DOI] [PMC free article] [PubMed] [Google Scholar]
- 39.Love MI, Huber W & Anders S Moderated estimation of fold change and dispersion for RNA-seq data with DESeq2. Genome Biol 15, 550 (2014). [DOI] [PMC free article] [PubMed] [Google Scholar]
- 40.Tabula Muris C et al. Single-cell transcriptomics of 20 mouse organs creates a Tabula Muris. Nature 562, 367–372 (2018). [DOI] [PMC free article] [PubMed] [Google Scholar]
- 41.Hahn O et al. A nutritional memory effect counteracts benefits of dietary restriction in old mice. Nat. Metab 1, 1059–1073 (2019). [DOI] [PMC free article] [PubMed] [Google Scholar]
- 42.Brake MA et al. Assessing blood clotting and coagulation factors in mice. Curr. Protoc. Mouse Biol 9, e61 (2019). [DOI] [PMC free article] [PubMed] [Google Scholar]
- 43.Zheng Z et al. An ATF6-tPA pathway in hepatocytes contributes to systemic fibrinolysis and is repressed by DACH1. Blood 133, 743–753 (2019). [DOI] [PMC free article] [PubMed] [Google Scholar]
- 44.Smith AA, Jacobson LJ, Miller BI, Hathaway WE & Manco-Johnson MJ A new euglobulin clot lysis assay for global fibrinolysis. Thromb. Res 112, 329–337 (2003). [DOI] [PubMed] [Google Scholar]
- 45.Yousef H, Czupalla CJ, Lee D, Butcher EC & Wyss-Coray T Papain-based single cell isolation of primary murine brain endothelial cells using flow cytometry. Bio Protoc 8, e3091 (2018). [DOI] [PMC free article] [PubMed] [Google Scholar]
- 46.Han Y, Li M, Qiu F, Zhang M & Zhang YH Cell-permeable organic fluorescent probes for live-cell long-term super-resolution imaging reveal lysosome-mitochondrion interactions. Nat. Commun 8, 1307 (2017). [DOI] [PMC free article] [PubMed] [Google Scholar]
- 47.Dempsey GT, Vaughan JC, Chen KH, Bates M & Zhuang X Evaluation of fluorophores for optimal performance in localization-based super-resolution imaging. Nat. Methods 8, 1027–1036 (2011). [DOI] [PMC free article] [PubMed] [Google Scholar]
- 48.Hughes CS et al. Ultrasensitive proteome analysis using paramagnetic bead technology. Mol. Syst. Biol 10, 757 (2014). [DOI] [PMC free article] [PubMed] [Google Scholar]
- 49.Rappsilber J, Ishihama Y & Mann M Stop and go extraction tips for matrix-assisted laser desorption/ionization, nanoelectrospray, and LC/MS sample pretreatment in proteomics. Anal. Chem 75, 663–670 (2003). [DOI] [PubMed] [Google Scholar]
- 50.Rahnenfuhrer A, A. topGO: enrichment analysis for Gene Ontology. R package version 2.18.0 10.18129/B9.bioc.topGO (2016). [DOI]
- 51.Supek F, Bosnjak M, Skunca N & Smuc T REVIGO summarizes and visualizes long lists of Gene Ontology terms. PLoS ONE 6, e21800 (2011). [DOI] [PMC free article] [PubMed] [Google Scholar]
- 52.Albert MS et al. The diagnosis of mild cognitive impairment due to Alzheimer’s disease: recommendations from the National Institute on Aging-Alzheimer’s Association workgroups on diagnostic guidelines for Alzheimer’s disease. Alzheimers Dement 7, 270–279 (2011). [DOI] [PMC free article] [PubMed] [Google Scholar]
- 53.Gold L et al. Aptamer-based multiplexed proteomic technology for biomarker discovery. PLoS ONE 5, e15004 (2010). [DOI] [PMC free article] [PubMed] [Google Scholar]
- 54.SOMAscan Technical White Paper (Somalogic, 2015); http://www.somalogic.com/wp-content/uploads/2016/08/SSM-002-Rev-3-SOMAscan-Technical-White-Paper.pdf [Google Scholar]
- 55.Perez-Riverol Y et al. The PRIDE database and related tools and resources in 2019: improving support for quantification data. Nucleic Acids Res 47, D442–D450 (2019). [DOI] [PMC free article] [PubMed] [Google Scholar]
- 56.Schaum N, et al. Ageing hallmarks exhibit organ-specific temporal signatures. Nature 583, 596–602 (2020). [DOI] [PMC free article] [PubMed] [Google Scholar]
- 57.Bostrom P et al. A PGC1-α-dependent myokine that drives brown-fat-like development of white fat and thermogenesis. Nature 481, 463–468 (2012). [DOI] [PMC free article] [PubMed] [Google Scholar]
- 58.Cho HC et al. The concentrations of serum, plasma and platelet BDNF are all increased by treadmill VO2max performance in healthy college men. Neurosci. Lett 519, 78–83 (2012). [DOI] [PubMed] [Google Scholar]
- 59.Colt EW, Wardlaw SL & Frantz AG The effect of running on plasma β-endorphin. Life Sci 28, 1637–1640 (1981). [DOI] [PubMed] [Google Scholar]
- 60.El Hayek L et al. Lactate mediates the effects of exercise on learning and memory through sirt1-dependent activation of hippocampal brain-derived neurotrophic factor (BDNF). J. Neurosci 39, 2369–2382 (2019). [DOI] [PMC free article] [PubMed] [Google Scholar]
- 61.Eliakim A et al. Physical fitness, endurance training, and the growth hormone-insulin-like growth factor I system in adolescent females. J. Clin. Endocrinol. Metab 81, 3986–3992 (1996). [DOI] [PubMed] [Google Scholar]
- 62.Eliakim A, Brasel JA, Mohan S, Wong WL & Cooper DM Increased physical activity and the growth hormone-IGF-I axis in adolescent males. Am. J. Physiol 275, R308–R314 (1998). [DOI] [PubMed] [Google Scholar]
- 63.Ferreira JC et al. Maximal lactate steady state in running mice: effect of exercise training. Clin. Exp. Pharmacol. Physiol 34, 760–765 (2007). [DOI] [PubMed] [Google Scholar]
- 64.Koehl M et al. Exercise-induced promotion of hippocampal cell proliferation requires β-endorphin. FASEB J 22, 2253–2262 (2008). [DOI] [PubMed] [Google Scholar]
- 65.Koziris LP et al. Serum levels of total and free IGF-I and IGFBP-3 are increased and maintained in long-term training. J. Appl. Physiol 86, 1436–1442 (1999). [DOI] [PubMed] [Google Scholar]
- 66.Moon HY et al. Running-induced systemic cathepsin B secretion is associated with memory function. Cell Metab 24, 332–340 (2016). [DOI] [PMC free article] [PubMed] [Google Scholar]
- 67.Schabitz WR et al. Intravenous brain-derived neurotrophic factor reduces infarct size and counterregulates Bax and Bcl-2 expression after temporary focal cerebral ischemia. Stroke 31, 2212–2217 (2000). [DOI] [PubMed] [Google Scholar]
- 68.Wrann CD et al. Exercise induces hippocampal BDNF through a PGC-1α/FNDC5 pathway. Cell Metab 18, 649–659 (2013). [DOI] [PMC free article] [PubMed] [Google Scholar]
Associated Data
This section collects any data citations, data availability statements, or supplementary materials included in this article.
Supplementary Materials
Data Availability Statement
The MS proteomics data have been deposited to the ProteomeXchange Consortium via the PRIDE55 partner repository under dataset identifier PXD022262 and PXD027406 for male and female mouse plasma proteins, respectively. Single-cell data and bulk RNA-seq datasets have been deposited at the Gene Expression Omnibus under accession number GSE164401. Source data are provided with this paper.