

SUMMARY
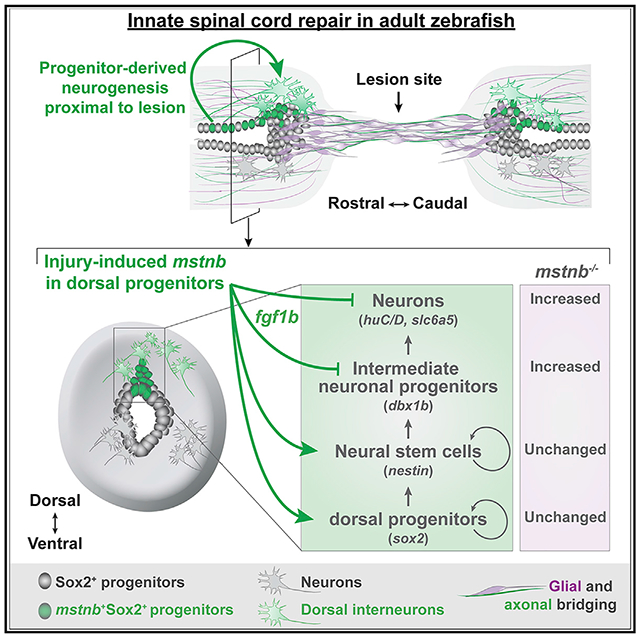
Intrinsic and extrinsic inhibition of neuronal regeneration obstruct spinal cord (SC) repair in mammals. In contrast, adult zebrafish achieve functional recovery after complete SC transection. While studies of innate SC regeneration have focused on axon regrowth as a primary repair mechanism, how local adult neurogenesis affects functional recovery is unknown. Here, we uncover dynamic expression of zebrafish myostatin b (mstnb) in a niche of dorsal SC progenitors after injury. mstnb mutants show impaired functional recovery, normal glial and axonal bridging across the lesion, and an increase in the profiles of newborn neurons. Molecularly, neuron differentiation genes are upregulated, while the neural stem cell maintenance gene fgf1b is downregulated in mstnb mutants. Finally, we show that human fibroblast growth factor 1 (FGF1) treatment rescues the molecular and cellular phenotypes of mstnb mutants. These studies uncover unanticipated neurogenic functions for mstnb and establish the importance of local adult neurogenesis for innate SC repair.
Graphical Abstract
In brief
Saraswathy et al. report that myostatin expression localizes to a subset of progenitor cells during spinal cord regeneration in zebrafish. They found that functional recovery is impaired in myostatin b mutants. They uncovered evidence showing that myostatin-fgf1b signaling regulates the rates of progenitor self-renewal and neuronal differentiation during innate spinal cord repair.
INTRODUCTION
Traumatic spinal cord injury (SCI) causes irreversible neuronal and systemic deficits.1–5 In mammals, axon regrowth and adult neurogenesis are impeded by intrinsic and extrinsic inhibitory mechanisms that obstruct spinal cord (SC) regeneration.4,6–8 Although multiple glial cell types proliferate after SCI, the mammalian SC is incapable of generating mature neurons in vivo.9–11 In contrast to mammals, highly regenerative vertebrates, including teleost fish, spontaneously recover after SCI. Following complete transection of SC tissues, adult zebrafish extend glial and axonal bridges across the lesion and achieve functional recovery within 6–8 weeks of injury. Adult neurogenesis, which refers to generation of neurons from adult stem cells, is concurrently activated after zebrafish SCI. Thus, in addition to axon regrowth from hindbrain neurons, zebrafish regenerate motor neurons and interneurons around the lesion site.12–17 However, the contribution of local adult neurogenesis to functional recovery and the mechanisms that coordinate the regeneration of different neuronal subtypes remain to be determined.
Progenitor cells line the SC central canal, co-express astroglial (gfap and blbp) and progenitor (sox2 and hey) cell markers, and comprise populations of neurogenic stem cells in adult zebrafish.18–23 In uninjured neural tissues, the majority of Sox2+ progenitors are non-dividing, quiescent cells that possess epithelial-like features.19,24,25 Following brain and SC damage, Sox2+ progenitors undergo widespread proliferation and are thought to act as a major source of regenerated neurons.18,24,26,27 Spatially distinct Sox2+ progenitors emerge around the central canal during SC regeneration in zebrafish. Sox2+ progenitors in the progenitor motor neuron (pMN) domain express olig2 and generate isl1/2+ and hb9+ motor neurons after SCI.16 On the dorsal and ventral sides of the pMN, Sox2+ progenitors give rise to vsx1+ V2 interneurons and serotonergic neurons, respectively.14,28 We recently showed that ventral Sox2+ progenitors undergo epithelial-to-mesenchymal transition (EMT) and that EMT is required for glial bridging and functional regeneration.29 Thus, despite their morphological similarities, Sox2+ progenitors elicit compartmentalized injury responses and proliferate into lineage-restricted progenitors during SC regeneration.
Myostatin (Mstn), also known as Growth differentiation factor 8 (Gdf8), is a transforming growth factor β (TGF-β) superfamily member. Upon binding Activin type 2 and type 1 receptors, Mstn induces phosphorylation and nuclear translocation of Smad 2/3 to regulate target gene expression.30–32 Spontaneous and targeted mstn loss-of-function mutations lead to double muscle phenotypes in zebrafish, mice, cattle, and humans.33–36 Mechanistically, Mstn controls lineage progression in myogenic stem cells (satellite cells) and progenitor cells (myoblasts). During muscle development, Mstn inhibits myoblast differentiation via negative regulation of the myogenic transcription factors MyoD and myogenin. Mstn also suppresses satellite cell proliferation, differentiation, and muscle regeneration.37–39 However, it remains unclear whether recombinant MSTN proteins inhibit or stimulate myoblast proliferation.40,41 Equally conflicting effects have been reported for recombinant MSTN proteins on neuronal proliferation and neurite outgrowth in vitro,42,43 suggesting that Mstn functions are dose and context dependent and that in vivo studies are required to decipher the role of Mstn in the nervous system.
TGF-β signaling directs immune, fibrotic, or regenerative injury responses across tissues and species. Because zebrafish SCs regenerate without fibrotic scarring, we postulated that TGF-β signaling is pro-regenerative in adult zebrafish. By surveying the expression of TGF-β ligands after SCI, we found that mstnb is induced in dorsal Sox2+ progenitors of lesioned SC tissues. mstnb mutants showed normal baseline swim capacity but failed to achieve functional recovery following SCI despite having normal axonal and glial bridging across the lesion. Using a series of transgenic lines and bulk RNA sequencing, we show that mstnb loss of function upregulated neuron differentiation genes and increased the profile of regenerating neurons. The neural stem cell maintenance gene fgf1b was downregulated in mstnb mutants, and human Fibroblast growth factor 1 (FGF1) treatment was sufficient to rescue neuronal gene expression and attenuate the number of regenerating neurons in mstnb mutants. Our results indicate that mstnb acts as an essential negative regulator of adult neurogenesis after zebrafish SCI and that injury-induced mstnb expression is required to maintain the potency and self-renewal of neurogenic progenitors during SC regeneration.
RESULTS
TGF-β signaling is activated in a subset of dorsal Sox2+ progenitors after SCI
Injuries to the central and peripheral nervous systems induce TGF-β signaling across vertebrates. In mammals, TGF-β activation directs a range of regenerative and anti-regenerative cell responses, including immune cell activation, neurite outgrowth, and scar formation.44 In zebrafish larvae, the anti-inflammatory effects of Tgfb1a are required for SC regeneration.45 We postulated that TGF-β signaling is pro-regenerative in adult zebrafish. To explore this hypothesis, we first surveyed Smad3 phosphorylation as a readout of TGF-β activity after zebrafish SCI. By immunohistochemistry, phosphorylated Smad3 (pSmad3) was strongly induced in dorsal SC tissues 7 days post injury (dpi) (Figure 1A). pSmad3 expression gradually diminished between 14 and 21 dpi and was minimally expressed in uninjured SCs (Figure 1A). At 7 dpi, pSmad3+ cells accounted for 7% of dorsal SC cells and were reduced by 21 dpi relative to 7 dpi (Figures 1B and S1A). To determine the identity of TGF-β responsive cells after SCI, we co-labelled pSmad3 with the neuronal markers HuC and HuD (HuC/D) or the progenitor marker Sox2. At 7 dpi, we rarely observed pSmad3 expression in some HuC/D+ neurons. However, the majority of HuC/D+ neurons were pSmad3− (Figure S1B). pSmad3 was primarily expressed at high levels in Sox2+ progenitors (Figure 1C). Quantification revealed that 66%–76% of pSmad3+ cells were Sox2+ across time points (Figures 1D and S1C). By EdU incorporation, ~10% of pSmad3+ cells were proliferative at 7 dpi in dorsal SCs, and pSmad3+ cell proliferation decreased to baseline levels by 21 dpi (Figures S1D and S1E). These findings indicate that TGF-β signaling is activated in dorsal Sox2+ progenitors after SCI.
Figure 1. mstnb expression is induced in dorsal Sox2+ progenitors during SC regeneration.
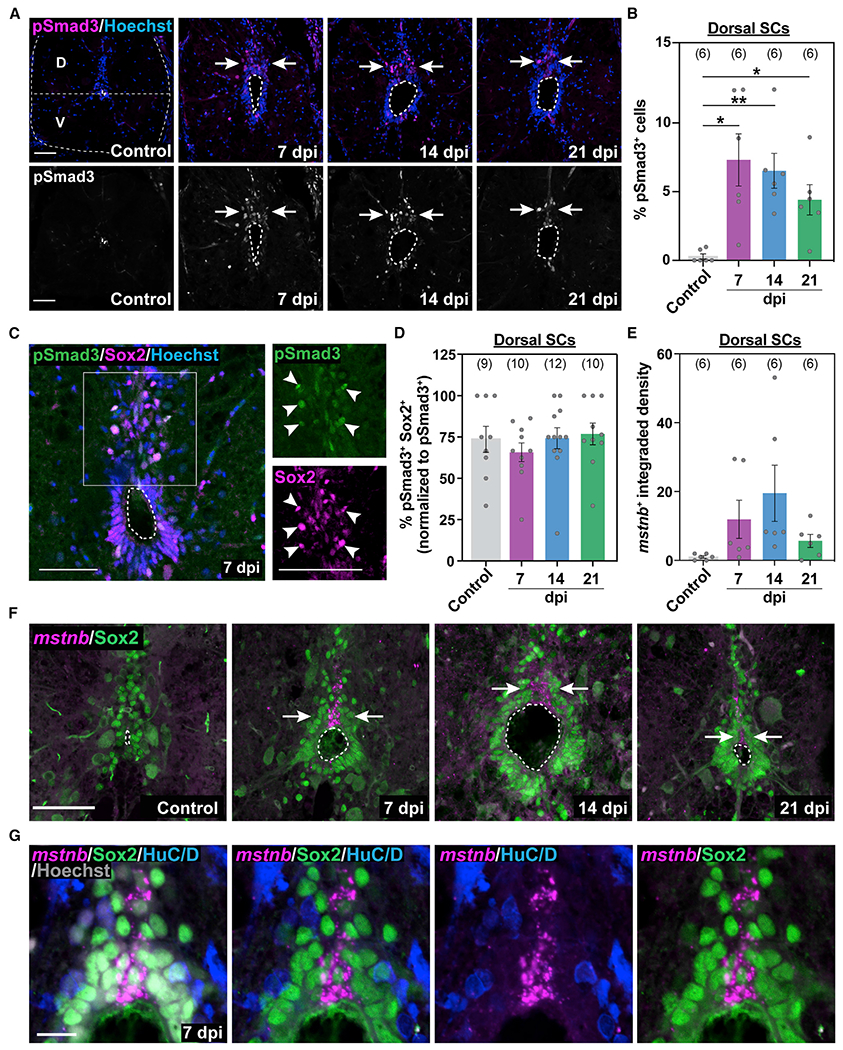
(A) Immunostaining for phosphorylated Smad3 (pSmad3) after SCI. Wild-type SC sections at 7, 14, and 21 dpi and uninjured controls are shown. Cross-sections 450 μm from the lesion are shown. A horizontal dotted line at the center of the central canal demarcates dorsal (D) and ventral (V) SC domains throughout the study. Arrows point to pSmad3+ nuclei in D SC domains.
(B) pSmad3 quantification in D sections of wild-type SCs. The proportions of pSmad3+ cells (percent) were normalized to the total number of nuclei for each section.
(C) pSmad3 and Sox2 immunostaining in wild-type SCs at 7 dpi. Single-channel micrographs are shown in high-magnification views. Arrowheads point to pSmad3+ Sox2+ progenitors.
(D) pSmad3 quantification in D Sox2+ progenitors. The proportions of pSmad3+ Sox2+ cells (percent) were normalized to the numbers of pSmad3+ cells for each section.
(E-G) mstnb expression in wild-type SC sections after SCI. mstnb fluorescence in situ hybridization was followed by immunostaining for Sox2 or HuC/D antibodies. mstnb quantifications in DSC tissues are shown in (E). For these quantifications, the integrated density of mstnb+ signals was quantified for each section and averaged across animals. Cross-sections 450 μm from the lesion are shown at 7, 14, and 21 dpi and for uninjured controls in (F). Arrows in (F) point to domains of mstnb expression in D SCs. Dotted ovals delineate central canal edges. High-magnification views of D progenitor domains at 7 dpi are shown in (G).
For all quantifications, SC sections 450 μm rostral to the lesion were analyzed. Sample sizes represent the number of animals quantified and are indicated in parentheses. Error bars depict SEM, and statistical significance was determined by one-way ANOVA. *p < 0.05, **p < 0.01. Scale bars, 50 μm (A–F) and 10 μm (G).
mstnb expression is upregulated in a subset of dorsal Sox2+ progenitors after SCI
To explore mechanisms of TGF-β activation during SC regeneration, we used a previously published RNA sequencing (RNA-seq) dataset to survey the expression of TGF-β ligands at 14 dpi.15 We found that mstnb, bmp2a/b, and bmp5 are upregulated, whereas gdf3, gdf6a, gdf9, bmp6, and ndr1 are downregulated after injury relative to uninjured SC tissue (Figure S1F). mstna transcripts were not detectable in control or injured SCs (Figure S1G). We thus proceeded to characterize mstnb by fluorescence in situ hybridization and found that mstnb expression was induced in dorsal SC tissue between 7 and 14 dpi and decreased at 21 dpi (Figures 1E–1G and S1H). Although a complete overlap between cytoplasmic mstnb transcripts and nuclear Sox2 is not possible, our co-labeling showed mstnb expression to be restricted to a subset of Sox2+ progenitors in dorsal SC tissue after injury (Figures 1F and 1G). mstnb transcripts were excluded from HuC/D+ neuronal cell bodies (Figures S1H and 1G). These studies reveal that mstnb expression is induced in a subset of dorsal progenitors after SCI and that the majority of mstnb-responding cells are Sox2+ progenitors adjacent to mstnb expressing cells and suggest that mstnb expression correlates with TGF-β activation in dorsal SC tissue during SC regeneration.
mstnb is required for recovery of swim function after SCI
To examine the role of mstnb during SC regeneration, we analyzed the extent of functional and cellular recovery in genetic zebrafish mutants (mstnbbns5)33 (Figure 2A). mstnb mutants harbor a 10-bp frameshift-causing deletion and showed a 45% reduction in mstnb transcript levels, as shown previously (Figure S1I).33 mstnb mutants are adult viable and elicit skeletal and cardiac muscle hyperplasia. The growth phenotypes associated with mstnb mutants are thought to be muscle specific.33 To establish baseline motor function, we first assessed the swim capacities of wild-type, mstnb heterozygous (mstnb+/−), and homozygous (mstnb−/−) siblings in an enclosed swim tunnel under increasing water current velocities15,29,46 (Figure 2B). In this swim endurance assay, wild-type animals swam for 41 min before reaching exhaustion (Figure 2B). mstnb+/− and mstnb−/− fish showed comparable swim functions, with swim times averaging 43 and 39 min, respectively. These results indicate that mstnb mutants show normal swim capacity and suggest that the muscle phenotype of mstnb mutants does not affect swim endurance. Next we performed SC transections on mstnb−/− and control siblings and evaluated their swim endurance between 14 and 42 dpi. mstnb+/− fish displayed normal swim capacity at 14 and 28 dpi, but their performance in this swim endurance assay was partially but non-significantly decreased at 42 dpi (Figure 2C). Relative to wild-type controls, swim endurance was over 50% reduced in mstnb−/− fish at 14, 28, and 42 dpi (Figure 2C).
Figure 2. mstnb is required for recovery of swim function after SCI.
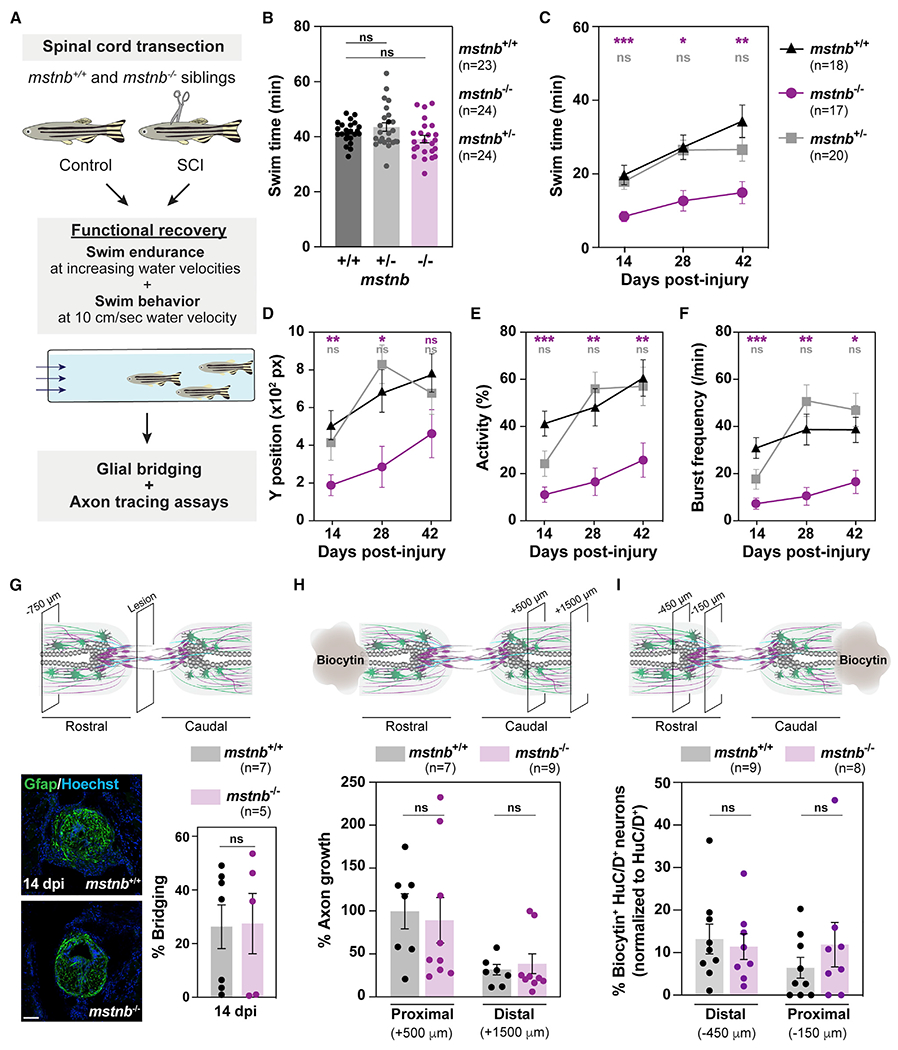
(A) Experimental pipeline to examine regeneration phenotypes after SCI.
(B) Swim endurance assays determined baseline motor function for uninjured mstnb−/+, mstnb−/−, and wild-type fish.
(C) Swim endurance assays for mstnb−/+, mstnb−/−, and wild-type fish at 14, 28, and 42 dpi. Statistical analyses of swim times are shown for mstnb−/+ (gray) and mstnb−/− (magenta) relative to wild types. Recovery of mstnb−/− animals was not significantly different between 14 and 42 dpi.
(D–F) Swim behavior assays assessed the performance of mstnb−/+, mstnb−/−, and wild-type siblings at minimal water current velocity. Average Y position in the tunnel (D), percent activity (E), and burst frequency (F) were quantified at 10 cm/s water current velocity. mstnb−/+, mstnb−/−, and wild-type fish are shown at 14, 28, and 42 dpi. Statistical analyses of swim times are shown for mstnb−/+ (gray) and mstnb−/− (magenta) relative to wild types. Two independent experiments are shown.
(G) Glial bridging in mstnb−/− (magenta) and wild-type siblings (gray) at 14 dpi. Representative immunohistochemistry shows the Gfap+ bridge at the lesion site. Percent bridging represents the cross-sectional area of the glial bridge at the lesion site relative to the intact SC. Percent bridging was quantified for 5–7 animals per group.
(H) Anterograde axon tracing in mstnb−/− (magenta) and wild-type zebrafish (gray) at 28 dpi. The biocytin axon tracer was applied rostrally and analyzed at 500 μm (proximal) and 1,500 μm (distal) caudal to the lesion. Axon growth was normalized to biocytin labeling in wild-type controls at the proximal level. Quantification represents 7–9 animals per group.
(I) Retrograde axon tracing in mstnb−/− (magenta) and wild-type zebrafish (gray) at 21 dpi. The biocytin axon tracer was applied caudally, and biocytin-labeled neuronal cell bodies were analyzed 150 μm (proximal) and 450 μm (distal) rostral to the lesion.
Dots represent individual animals from 2 or 3 independent clutches, and error bars depict SEM. Quantification represents 8–9 animals per group. *p < 0.05; **p < 0.01; ***p < 0.001; ns, p > 0.05. Scale bars, 50 μm.
To further rule out the contribution of skeletal muscle overgrowth to the functional regeneration output of mstnb mutants, we tracked the swim behavior of mstnb mutants under a constant, low current velocity of 10 cm/s (Figures 2D–2F). Unlike the endurance test, which requires fish to swim against increasing current velocities, swim behavior under minimal current velocity is less likely to be dependent on muscle function. In this swim behavior assay, mstnb−/− animals stalled in the back quadrant of the swim tunnel (Figure 2D), were 65% less active than wild-type siblings (Figure 2E), and displayed less frequent bursts under low current velocity (Figure 2F). Consistent with a partial regeneration phenotype in heterozygous fish, mstnb+/− fish were 40% less active with a 35% reduction in burst frequency relative to wild types at 14 dpi. Swim parameters were comparable between mstnb+/− and wild-type siblings at 28 and 42 dpi (Figures 2D–2F).
To date, cellular growth across the lesion site has served as a primary readout of cellular regeneration in zebrafish.15,17,47 Glial bridging and axon-tracing assays were performed to evaluate the extent of glial and axonal regeneration in mstnb mutants (Figure 2A). By Gfap immunostaining, glial bridging was unaffected in mstnb−/− animals compared with wild-type siblings at 14 dpi (Figure 2G). We performed 2 sets of tracing experiments to trace caudally projecting axons using rostral labeling (Figure 2H) and rostral cell bodies proximal to the lesion using caudal labeling (Figure 2I). At 28 dpi, anterograde axon tracing using biocytin showed comparable axon regrowth from hindbrain neurons into the proximal and distal SC sections between mstnb−/− and control animals (Figure 2H). In the second tracing experiment, caudal biocytin treatment labeled neuronal cell bodies 150 and 450 mm rostral to the lesion, indicating that SC neurons proximal to the lesion extended local projections through the lesion after injury. The proportions of biocytin+ HuC/D+ neurons were comparable between mstnb−/− and control animals (Figure 2I). These studies indicate that mstnb is required for functional SC repair but dispensable for glial bridging and axon regrowth. These findings prompted us to investigate mechanisms of SC regeneration that are independent of glial and axonal bridging and to examine the numbers and distribution of locally produced neurons proximal to the lesion.
mstnb loss of function enhances neuronal differentiation after SCI
In addition to glial bridging and axon regrowth, zebrafish regenerate lost motor neurons and interneurons around the lesion.14,16,28 Dorsal Sox2+ progenitors, where we observed increased mstnb expression, are thought to give rise to regenerating interneurons after injury. We thus postulated that mstnb plays a role in adult neurogenesis in zebrafish and that local neurogenesis around the lesion is required for functional SC repair. To test this hypothesis, we first examined the proliferation rates of Sox2+ progenitors and the profiles of newly regenerated HuC/D+ neurons in mstnb mutants using EdU incorporation. Uninjured and injured mstnb−/− and wild-type siblings were subjected to complete SC transections and to a single EdU pulse for 24 h prior to SC collection and histological analysis (Figures 3A–3C and S2A). At 7 dpi, 7.7% of HuC/D+ neurons were EdU+ in wildtype SCs (Figure 3D), accounting for 0.9% of dorsal SC cells (Figures S2C).Conversely, 15.2% of HuC/D+ neurons were EdU+ in mstnb−/− SCs (Figures 3D), accounting for 1.5% of dorsal SC cells (Figures S2C and S2D). The rates of EdU incorporation were attenuated in wild-type SCs at 14 and 21 dpi relative to 7 dpi. However, mstnb mutants showed increased EdU incorporation in HuC/D+ neurons at 21 dpi (Figures 3D and S2C). On the other hand, the profiles of Sox2+ EdU+ progenitors were unchanged in mstnb−/− SCs at 21 dpi (Figures 3E and S2E–S2G). TUNEL staining showed negligible and comparable cell death across genotypes at 7 dpi (Figures S2H–S2K). To confirm whether mstnb−/− animals show increased neuronal differentiation at 7 dpi, we performed SCI on mstnb−/− and wild-type siblings and a single EdU injection at 6 dpi. SC tissues were collected 8 h after EdU injection to capture rapidly cycling Sox2+ progenitors and at 21 dpi to quantify slowly differentiating HuC/D+ neurons (Figure S3A). At 21 dpi, the absolute numbers of dorsal and total HuC/D+ EdU+ neurons were slightly but non-significantly increased in mstnb−/− compared with wild-type controls (Figures S3B and S3E). However, normalization to the total number of cells (Figures S3C and S3F) or to HuC/D+ neurons (Figures S3D and S3G) revealed a significantly higher proportion of neurons incorporated EdU in mstnb−/− animals relative to their wild-type siblings in dorsal and total SC tissues. The profiles of Sox2+ EdU+ progenitors were not significantly changed across genotypes (Figures S3H–S3J). These findings indicate increased EdU incorporation in HuC/D+ neurons at 7 dpi and suggest that the rates of neuronal differentiation are increased in mstnb mutants.
Figure 3. Cell proliferation in mstnb mutant zebrafish.
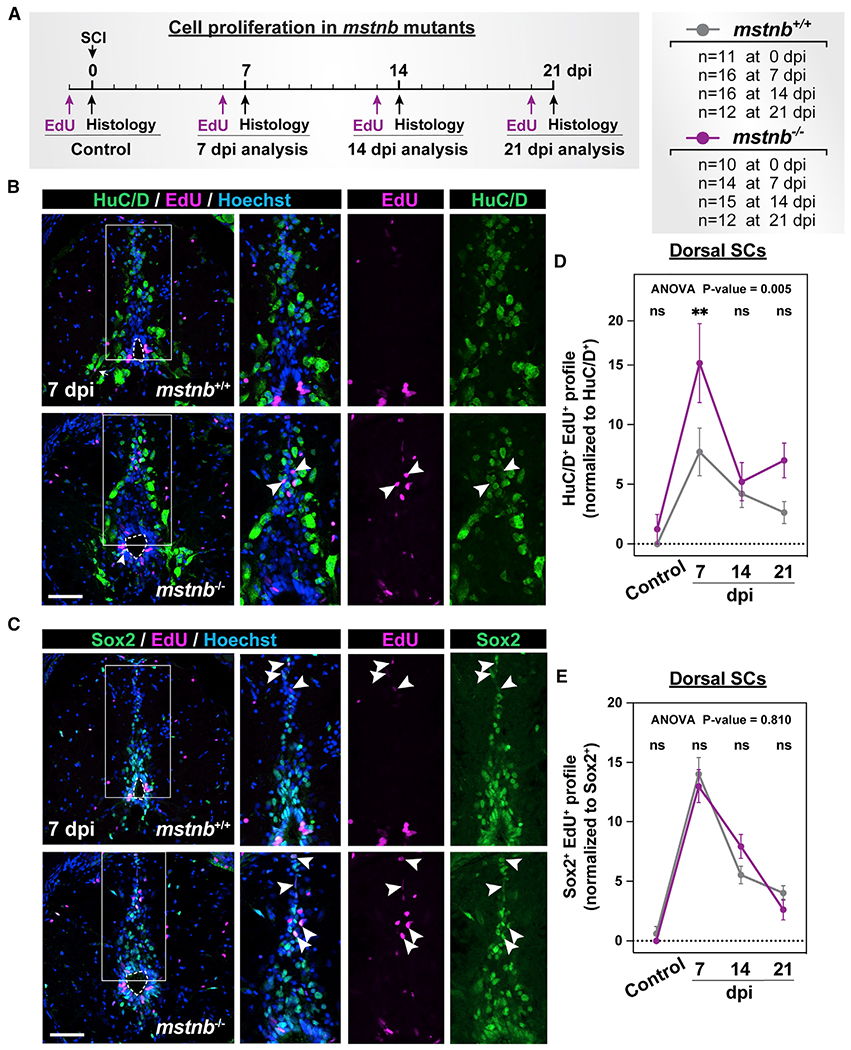
(A) Experimental timeline to assess the rates of cell proliferation. mstnb−/− and wild-type siblings were subjected to SC transections. Animal numbers are indicated for each genotype, and two independent replicates are shown.
(B and C) Immunohistochemistry for EdU, HuC/D, and Sox2 in SC sections of mstnb+/+ and mstnb−/− at 7 dpi. EdU and HuC/D colocalization is shown in (B). EdU and Sox2 colocalization is shown in (C). Dotted ovals delineate central canal edges. Regions in the rectangular boxes are shown at high magnification. Arrowheads indicate HuC/D>+ EdU>+ neurons in (B) and Sox2+ EdU>+ progenitors in (C).
(D) Regenerated HuC/D>+ EdU>+ neurons were quantified in D SC sections at 7, 14, or 21 dpi and uninjured controls. Cross-SC sections 450 μm rostral to the lesion site were quantified. The proportions of HuC/D>+ EdU>+ neurons (%) were normalized to the numbers of HuC/D>+ neurons for each section.
(E) Sox2+ EdU>+ progenitors were quantified in D SC sections at 7, 14, or 21 dpi and uninjured controls. Cross-SC sections 450 μm rostral to the lesion site were quantified. The proportions of Sox2+ EdU>+ progenitors were normalized to the numbers of Sox2+ progenitors for each section.
Error bars depict SEM, and statistical significance was determined by two-way ANOVA. ANOVA p values and multiple-comparisons p values are indicated. **p < 0.01; ns, p > 0.05. Scale bars, 50 μm.
To evaluate how snapshots of increased neuronal differentiation at 7 dpi could affect the overall numbers of regenerating neurons in mstnb mutants, we performed SC transections on mstnb−/− and wild-type fish, followed by daily EdU injections for 7 or 14 dpi (Figures 4A and S4A). Compared with single EdU pulses, daily EdU labeling allowed us to estimate the total and cumulative numbers of regenerating neurons (HuC/D+ EdU+ neurons) and the extent of progenitor cell self-renewal (Sox2+ EdU>+ progenitors) (Figure 4B). At 7 dpi and in SC sections 150 μm rostral to the lesion, the absolute numbers of regenerating HuC/D+ EdU>+ and HuC/D+ neurons were 40% and 50% increased in mstnb mutants, but these differences were not statistically significant (Figures S4B and S4C). At 7 dpi and in wild-type sections 150 μm rostral to the lesion, 2.7% of dorsal SC cells were regenerating HuC/D+ EdU>+ neurons (Figure S4D), and 10.9% of dorsal SC cells were HuC/D+ neurons (Figure S4E). On the other hand, 4.3% of dorsal SC cells were regenerating neurons (HuC/D+ EdU>+) in mstnb−/− SCs (Figure S4D), and 19% of dorsal SC cells were HuC/D+ neurons (Figure S4E). Quantifications from total SC tissue confirmed that the profiles of HuC/D+ neurons were increased in mstnb mutants (Figures S4F and S4G), whereas the proportions of Sox2+ EdU+ and Sox2+ progenitors were comparable across genotypes (Figures S4H and S4I). At 14 dpi, the profiles of HuC/D+ EdU>+ neurons in mstnb mutants increased at 150 and 450 μm rostral to the lesion (Figures 4C, S4J, and S4K). The proportions of HuC/D+ neurons were significantly increased 450 μm rostral to the lesion (Figure 4D). Sox2+ EdU>+ and Sox2+ progenitors were comparable across genotypes (Figures 4E, 4F, S4L, and S4M), suggesting that self-renewal of progenitor cells was maintained at wild-type levels in mstnb mutants. Caudal SC sections did not show changes in neuron or progenitor cell counts (Figures 4 and S4), suggesting that the effects of mstnb loss of function are specific to the rostral portions of lesioned SC tissues. These studies revealed a rostral increase in the profiles of regenerating neurons in mstnb mutants and are consistent with mstnb acting as a negative regulator of neuronal differentiation during SC regeneration in zebrafish.
Figure 4. Regenerative adult neurogenesis in mstnb mutant zebrafish.
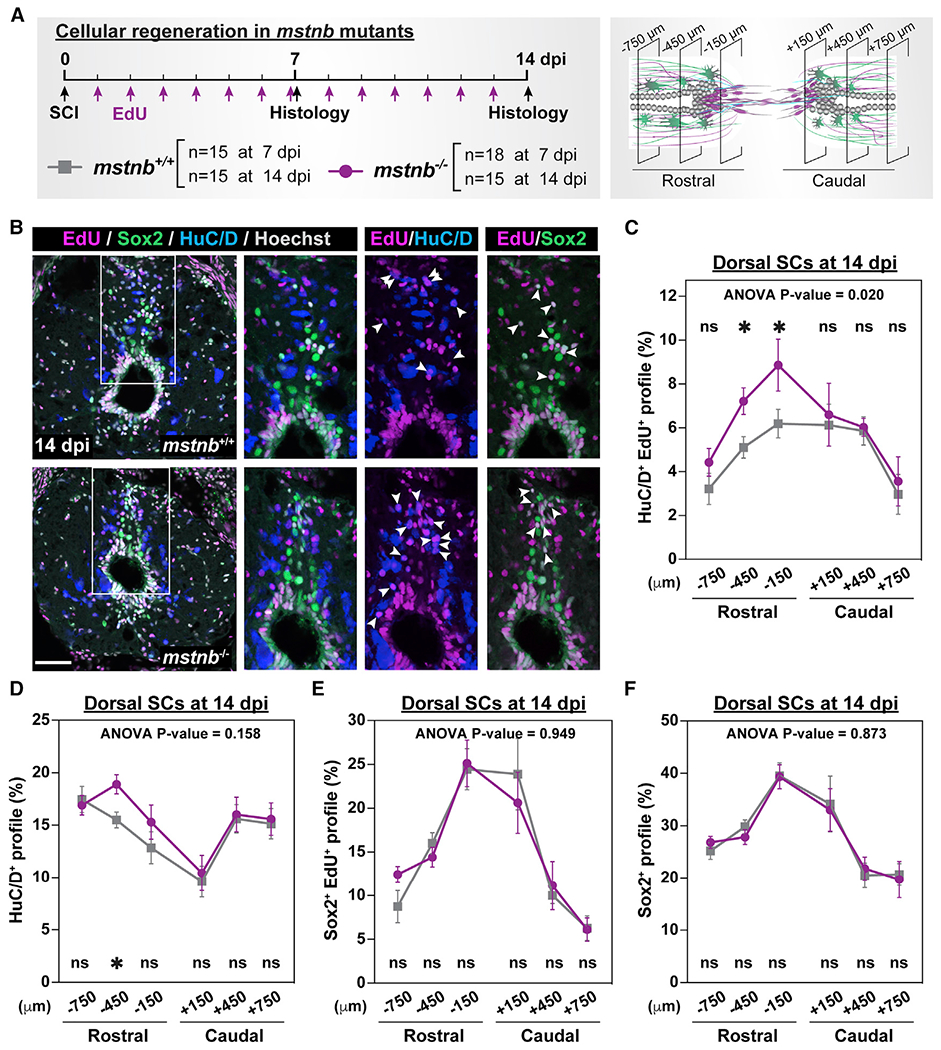
(A) Experimental timeline to assess the rates of neuronal differentiation and progenitor self-renewal. Animal numbers are indicated for each genotype, and two independent replicates are shown.
(B) Immunohistochemistry for EdU (magenta), Sox2 (green), and HuC/D (blue) in SC sections of mstnb+/+ and mstnb−/− at 14 dpi. Regions in the rectangular boxes are shown at high magnification. Arrowheads indicate HuC/D>+ EdU>+ neurons or Sox2+ EdU>+ progenitors.
(C) Regenerated HuC/D>+ EdU>+ neurons were quantified in D SC sections at 14 dpi. The proportions of HuC/D>+ EdU>+ neurons (%) representthe numbers of HuC/D+ EdU+ neurons normalized to the total numbers of nuclei for each section.
(D) HuC/D>+ neurons were quantified in D SC sections at 14 dpi. The proportions of HuC/D>+ neurons (%) represent the numbers of HuC/D>+ neurons normalized to the total numbers of nuclei for each section.
(E) Sox2+ EdU>+ progenitors were quantified in D SC sections at 14 dpi. The proportions of Sox2+ EdU>+ progenitors (%) represent the numbers of Sox2+ EdU>+ progenitors normalized to the total numbers of nuclei for each section.
(F) Sox2+ progenitors were quantified in D SC sections at 14 dpi. The proportions of Sox2+ progenitors represent the numbers of Sox2+ progenitors normalized to the total numbers of nuclei for each section.
Error bars depict SEM, and statistical significance was determined by two-way ANOVA. ANOVA p values and multiple-comparisons p values are indicated. *p < 0.05; ns, p > 0.05. Scale bars, 50 μm.
Because Mstn is a known negative regulator of skeletal muscle growth, we investigated whether and how the global effects of Mstn deletion affect the SC regeneration defects observed in mstnb mutants. Human MSTN proteins are translated as inactive full-length precursors that undergo proteolytic processing into mature MSTN and MSTN proform (pro-MSTN) peptides. Pro-MSTN exhibits high-affinity binding to Mstn and inhibits its function.48 To examine whether the global effects of mstnb mutants could be reproduced by local Mstnb inhibition, we injured wild-type animals and performed daily injections of human recombinant pro-MSTN peptide adjacent to the lesion site (Figure S5A). At 7 dpi, corresponding to 6 days after initial treatment, the numbers of HuC/D+ neurons were increased by 12% upon pro-MSTN treatment, but these differences were not statistically significant (Figure S5B). On the other hand, the numbers of Sox2+ progenitors were decreased by 20% in pro-MSTN-treated fish relative to vehicle controls (Figure 5C). Thus, pharmacological Mstn inhibition at the lesion site disrupted the relative ratios of HuC/D+ neurons and Sox2+ progenitors. To further examine the effects of mstnb loss of function on skeletal muscle regeneration, we performed phalloidin staining and found that the numbers of regenerating muscle fibers dorsal to the lesion were comparable across genotypes in uninjured animals (Figures S5D and S5E). At 21 dpi, wild-type animals had 60% more dorsal myofibers compared with uninjured wild types, indicating regeneration of smaller-diameter myofibers after injury (Figure S5E). At this time point, the numbers of myofibers were 40% increased in mstnb mutants relative to wild-type controls. Thus, consistent with previously reported muscle overgrowth phenotype in mstn mutants, and in contrast to the SC regeneration defects observed in these mutants, mstnb loss of function enhanced skeletal muscle regeneration. These results support new functions for Mstn during innate SC repair, independent of and in addition to its known role as a negative regulator of muscle growth.
Figure 5. Assessment of neuronal progenitors and subtypes in mstnb mutant zebrafish.
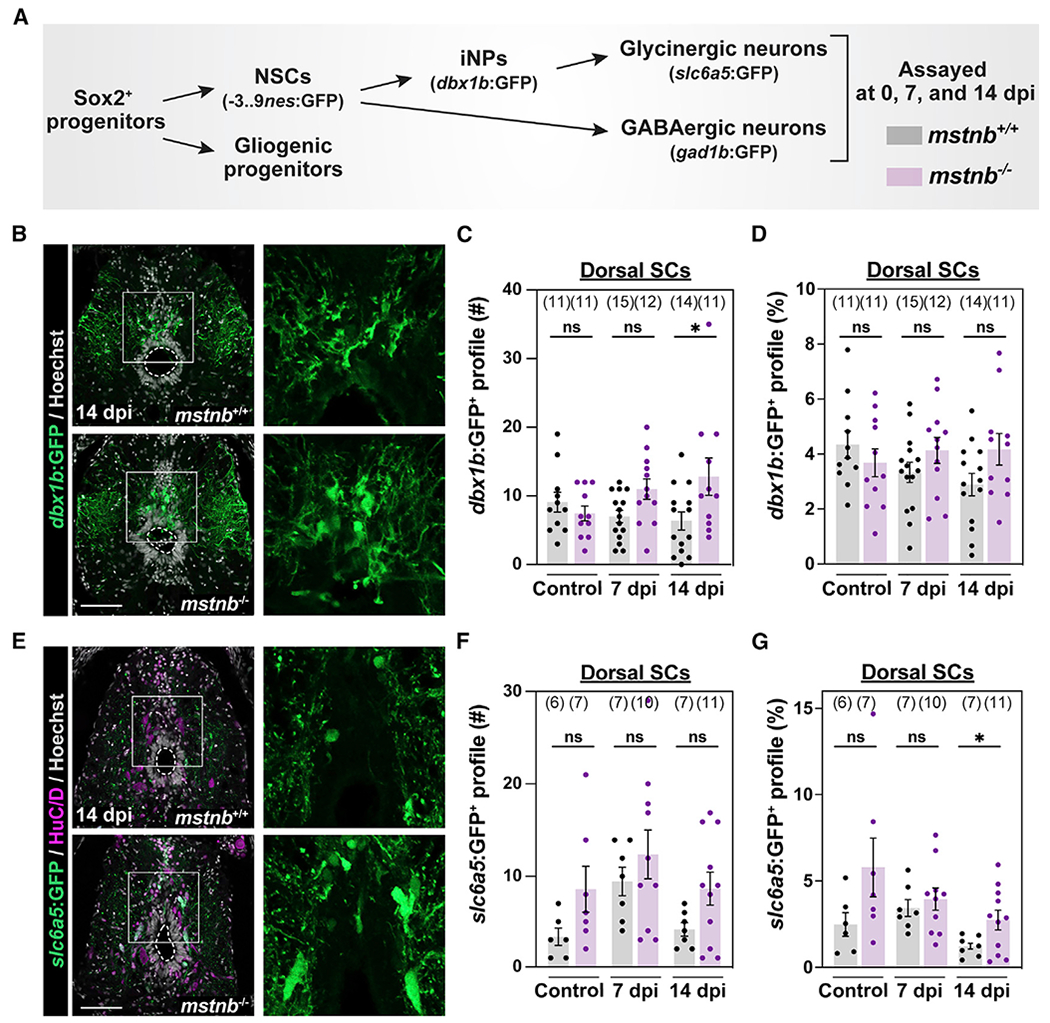
(A) Experimental timeline to elucidate different steps of adult neurogenesis.
(B) GFP staining in dbx1b:GFP;mstnb−/− SC sections at 14 dpi. dbx1b:GFP;mstnb+/+ siblings were used as controls. Dotted ovals delineate central canal edges. Regions in the rectangular boxes are shown at high magnification.
(C and D) The numbers of dbx1b+ iNPs (#) were quantified in D SC sections 450 μm rostral to the lesion (C). The proportions of dbx1b+ iNPs (%) represent the numbers of dbx1b+ iNPs normalized to the total numbers of nuclei for each section (D).
(E) GFP staining in s/c6a5:GFP:GFP;mstnb−/− SC sections at 14 dpi. slc6a5:GFP:GFP;mstnb+/+ siblings were used as controls. Dotted ovals delineate central canal edges. Regions in the rectangular boxes are shown at higher magnification.
(F and G) The numbers of glycinergic s/c6a5:GFP+ neurons (#) were quantified in D SC sections 450 μm rostral to the lesion (F). The proportions of slc6a5:GFP+ neurons (%) represent the numbers of slc6a5:GFP+ neurons normalized to the total numbers of nuclei for each section (G).
Dots represent individual animals from 2 independent clutches. For all quantifications, cross-SC sections 450 μm rostral to the lesion site were quantified. Error bars depict SEM, and statistical significance was determined by one-way ANOVA. Multiple-comparisons p values are shown. *p < 0.05; ns, p > 0.05. Scale bars, 50 μm.
mstnb loss of function alters the relative proportions of regenerating neurons after SCI
Our proliferation assays showed increased neuronal regeneration in the absence of mstnb. We postulated that mstnb loss of function may bias neuronal progenitors toward differentiation. To test this hypothesis, we evaluated the numbers of neural stem cells (NSCs) and intermediate neuronal progenitors (iNPs) in mstnb mutants at baseline and 7 and 14 dpi (Figure 5A). We first quantified NSCs in nes;GFP;mstnb−/− fish49 (Figures S6A and S6B). Noting that GFP expression in this reporter does not fully recapitulate nestin expression, we co-labeled with sox2 to confirm NSC identities. Confirming prior findings,50 nes:GFP+ NSCs were rarely identified in uninjured SC sections from mutant or wild-type animals but were readily detectable after SCI (Figure S6A). The numbers and proportions of nes:GFP+ cells in dorsal SCs were comparable between mstnb−/− and wild-type siblings at 7 and 14 dpi (Figures S6A and S6B).
We next examined the numbers of iNPs using the dbx1b:GFP transgene that was previously shown to label iNPs in the P0 domain of the zebrafish SC51 (Figures 5B–5D, S6C, and S6D). The absolute numbers of dbx1b + iNPs were 58% elevated at 7 dpi and 100% increased at 14 dpi in dorsal mstnb−/− SCs compared with their respective controls (Figure 5C). Total mstnb−/− SCs showed a significant increase in the absolute numbers of dbx1b + iNPs at 14 dpi (Figure S6C). However, when normalized to total cell counts, the proportions of dbx1b+ iNPs showed elevated but non-significant trends in mstnb−/− across time points (Figures 5D and S6D). We posit that an increase in additional dbx1b− cells, ostensibly in differentiated HuC/D>+ neurons, balances the absolute numbers of dbx1b+ iNPs after normalization. These findings indicate increased generation of neuronal progenitors and are consistent with accelerated adult neurogenesis in mstnb mutants.
To elucidate mechanisms of impaired functional SC repair in mstnb mutants, we hypothesized that increased rates of neuron differentiation alter the timing and proportions at which different neuronal subtypes regenerate after injury. To test this hypothesis, we specifically examined the differentiation and relative distribution of inhibitory neurons after SCI. Because dbx1b + iNPs have been shown previously to give rise to glycinergic neurons in the zebrafish SC,52 we quantified glycinergic neurons in slc6a5:GFP;mstnb−/− fish (Figures 5E–5G and S6E–S6G).53 Relative to wild-type controls, the absolute numbers of slc6a5+ neurons increased by 140% and 110% in uninjured and 14 dpi mutants, respectively (Figures 5F and S6F). At 7 dpi, the proportions of glycinergic neurons comprised 3.9% and 3.4% of dorsal SC cells in mstnb−/− and wild-type fish, respectively (Figures 5I and S5F). By 14 dpi, glycinergic neurons accounted for 1.2% of dorsal SC cells in wild-type controls but increased to 2.7% of dorsal cells in mstnb−/− SCs (Figure 5G). By quantifying the proportions of glycinergic neurons in HuC/D>+ neurons, glycinergic neurons accounted for 6.1% and 3.7% of neurons in wild-type SC tissue at 7 and 14 dpi, respectively (Figure S6E). These proportions were significantly amplified in mstnb−/− tissue, accounting for 12% of neurons at 7 dpi and 8.5% of neurons at 14 dpi (Figure S6E). These findings indicate increased generation of glycinergic neurons in mstnb mutants.
We then used GAD1b:GFP reporter line to label GABAergic inhibitory neurons in mstnb mutants.52 Unlike glycinergic neurons, which derive from dbx1b+ iNPs, GAD1b+ neurons have been shown to derive from dbx1b− progenitors.52 We found that the numbers and proportions of GAD1b+ neurons were comparable in dorsal SC sections from mstnb−/− and wild-type controls (Figures S6H and S6I). Consistent with generation of a small number of motor neurons in dorsal SC tissue,54 Hb9 staining labeled 0–4 neurons per section and did not show significant changes in the numbers or proportions of dorsal motor neurons across genotypes (Figures S6J and S6K). These findings support a model in which mstnb loss of function disrupts the relative proportions of glycinergic inhibitory neurons during SC regeneration.
Neuronal genes are upregulated in mstnb mutants
To determine the molecular mechanisms by which mstnb regulates the rates of adult neurogenesis, we deep-sequenced bulk SC tissues from mstnb−/− and wild-type siblings at 7 dpi as well as uninjured controls (Figures 6A–6C). Principal-component analysis confirmed clustering of biological replicates and highlighted four distinct signatures that are injury and genotype induced (Figure 6A). At 7 dpi, 61 genes were downregulated and 359 genes were upregulated in mstnb−/− SCs, suggesting that mstnb may be a negative regulator of gene expression after SCI (Figure 6C). Genes upregulated in mstnb−/− SCs comprised several neuronal or neuron differentiation genes, including birc5b, eloal, elavl2, htr2aa, and pou5f3. These genes were unchanged or downregulated in uninjured mstnb−/− SCs (Figures 6B and 6C). These results were confirmed by qRT-PCR (Figure 6D), indicating that neuronal gene expression changes in mstnb mutants are injury dependent.
Figure 6. mstnb regulates neuronal differentiation after SCI via fgf1b.
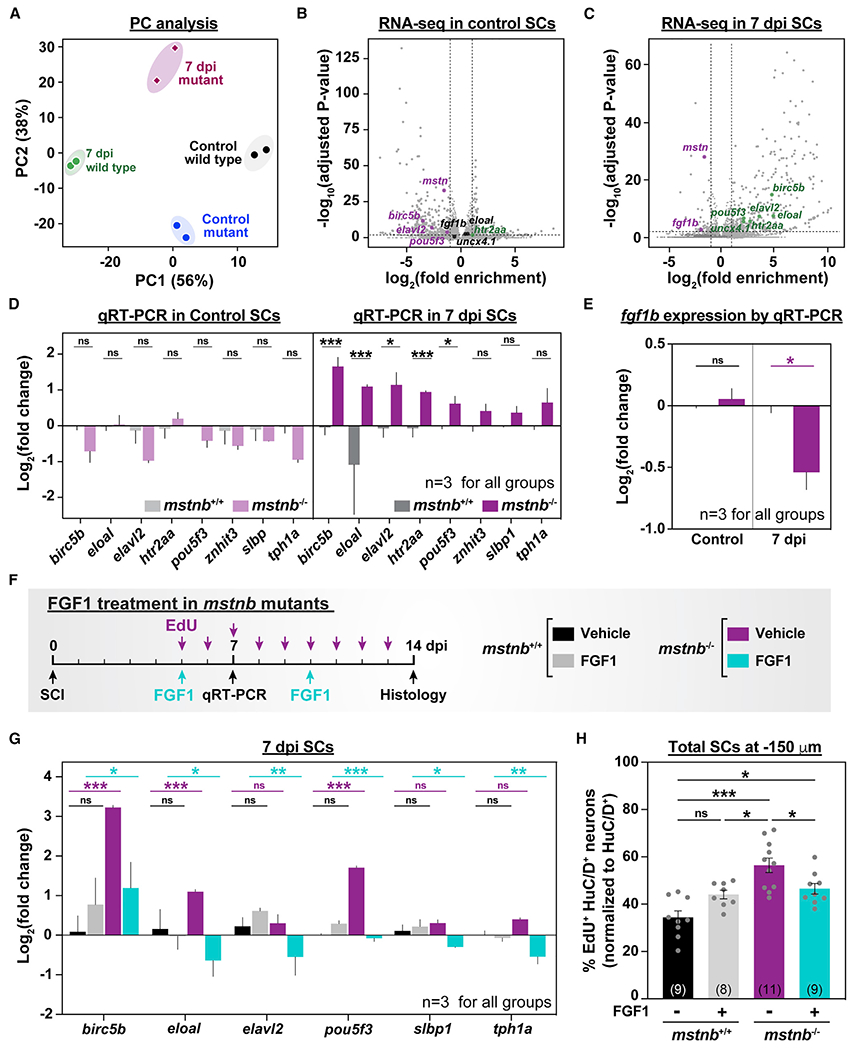
(A) mstnb−/− and wild-type siblings were subjected to complete SC transections and collected at 7 dpi for RNA-seq. Control SC tissues were collected from uninjured fish. Sequencing was performed in independent duplicates from separate fish clutches. Principal-component analysis shows clustering of biological replicates. Principal components 1 and 2 (PC1 and PC2, respectively) show 56% and 38% variance, respectively.
(B and C) Volcano plot representation of genes that are significantly upregulated or downregulated in mstnb−/− SCs relative to wild-type controls. Upregulated genes include genes with log2(fold enrichment) > 1 and adjusted p < 0.01. Downregulated genes include transcripts with log2(fold enrichment) < −1 and adjusted p < 0.01. Selected upregulated (green) and downregulated (magenta) neuronal genes are indicated. Unchanged genes are labeled in black.
(D) qRT-PCR for neuronal genes was performed on mstnb−/− and wild-type SCs at 7 dpi. Uninjured mstnb−/− and wild-type controls were used. For each time point, log2(fold change) was normalized to eif1α and to gene expression levels in mstnb+/+ controls.
(E) fgf1b qRT-PCR was performed on uninjured and injured mstnb−/− and wild-type animals. For each time point, fgf1b expression was normalized to eif1α as a loading control and to fgf1b levels in mstnb+/+ controls.
(F) Experimental timeline for human recombinant FGF1 treatment in mstnb−/− animals.
(G) Neuronal gene expression was analyzed by qRT-PCR from FGF1- and vehicle-treated SC tissues at 7 dpi. For each gene, log2(fold change) was normalized to eif1α as a loading control and to gene expression levels in uninjured mstnb+/+ SCs.
(H) HuC/D and EdU staining was performed on vehicle- and FGF1-treated mstnb−/− and wild-type animals. The numbers of regenerating HuC/D>+ EdU>+ neurons were quantified in SC cross sections 150 μm rostral to the lesion site. The proportions of HuC/D>+ EdU>+ neurons (%) were normalized to the numbers of HuC/D>+ neurons for each section.
Dots represent individual animals from 2 independent clutches. Error bars depict SEM, and statistical significance was determined by one-way ANOVA. Multiple-comparisons p values are shown. ***p < 0.001; **p < 0.01; *p < 0.05; ns, p > 0.05.
Fibroblast growth factors (FGFs) maintain the proliferation and self-renewal capacity of NSC in mammals.55 As seen by RNA-seq and qRT-PCR, fgf1b was downregulated in mstnb−/− SCs at 7 dpi,but unchanged in uninjured SC tissues (Figures 6B, 6C, and 6E), suggesting that mstnb-mediated fgf1b expression inhibits neuronal differentiation by promoting progenitor cell proliferation and self-renewal. To test this hypothesis, we examined whether the neuronal gene expression changes observed in mstnb mutants could be rescued by localized delivery of human recombinant FGF1 into SC lesions. To this end, we injured mstnb−/− and wild-type siblings and applied FGF1 proteins adjacent to the lesion at 5 dpi using a Gelfoam sponge. Gene expression changes were assessed by qRT-PCR at 7 dpi, corresponding to 2 days after treatment (Figure 6F). Consistent with RNA-seq and qRT-PCR data (Figures 6B–6D), birc5b, eloal, and pou5f3 transcript levels were increased in vehicle-treated mstnb−/− relative to vehicle-treated wild types (Figure 6G). However, relative to vehicle-treated mutants, expression of birc5b, eloal, elavl2, pou5f3, slbp1, and tph1a decreased in FGF1-treated mutants, indicating that exogenous FGF1 proteins at the lesion rescued the upregulation of neuronal genes in mstnb−/− SCs (Figure 6G).
To examine whether exogenous FGF1 has a negative regulatory effect on neuronal regeneration, we assessed the numbers of regenerating neurons and self-renewing progenitors after FGF1 treatment in mstnb−/− fish. Consistent with increased rates of neuronal differentiation in mstnb mutants, the proportions of HuC/D>+ EdU>+ neurons relative to the total number of nuclei increased from 6% in vehicle-treated wild types to 11% in vehicle-treated mutants (Figures S7A–S7C). The proportions of HuC/D>+ EdU>+ neurons decreased to 9.8% in FGF1-treated mutants, but this attenuation was not statistically significant (Figure S7C). Quantification of regenerating neurons relative to total neuron numbers 150 μm from the lesion revealed that 34% of neurons incorporated EdU in vehicle-treated wild-type controls (Figure 6H). EdU incorporation increased to 56% in vehicle-treated mutants but decreased to 46% in FGF1-treated mutants (Figure 6H). These changes were not recapitulated 450 μm from the lesion (Figures S7D and S7E), likely because of limited diffusion of exogenous FGF1 from the lesion site and into distal tissues. These findings indicate that exogenous FGF1 partially rescues the numbers of regenerating neurons in mstnb mutants proximal to the lesion and support a model where Mstn-mediated FGF signaling is a negative regulator of adult neurogenesis after zebrafish SCI.
DISCUSSION
This study supports a model where mstnb functions as a negative regulator of neuronal differentiation in rostral SC tissue after injury and suggests that mstnb-dependent FGF signaling promotes self-renewal at the expense of adult neurogenesis.
Successful SC regeneration requires faithful recovery of the excitatory and inhibitory (E/I) balance in regenerating neural circuits. SCI alters the strength and relative locations of E/I inputs by disrupting descending hindbrain connections and promoting waves of axonal degeneration, neuronal death, and demyelination. Injury-induced modulation of neurotransmitter levels promotes neurogenesis after SCI. Neurogenesis-promoting neurotransmitters, including dopamine and serotonin from regenerating tracts, control motor neuron regeneration by boosting proliferation of pMN progenitors in rostral SC tissues.28,47 We found that mstnb mutants display increased neuronal differentiation rostral to the lesion at 7 dpi and that the proportions of glycinergic interneurons are elevated among regenerating neurons. Whether neurotransmitter release from descending axons rostral to the lesion or other rostrally enriched signaling pathways regulate the extent of mstnb-dependent neurogenesis anterior to the lesion remains to be investigated. Glycinergic inhibition plays important roles in coordinating locomotor rhythms in different organisms.56–58 We propose that increased inhibitory neurotransmission disrupts E/I balance and may underlie the behavioral recovery defects observed in mstnb mutants.
Our study highlights a niche of dorsal progenitors that express mstnb and sox2 after SCI. Unlike tissues that undergo constant cell renewal such as skin or blood, the nervous system undergoes little turnover and does not harbor a constitutively active neurogenic niche. Instead, neural progenitors are quiescent and are only activated upon physiological or pathological stimulation. Lineage-restricted progenitors emerge after zebrafish SCI. Previously characterized ependymal progenitors include a ventrolateral domain that gives rise to regenerating motor neurons and a ventral domain that undergoes EMT and is required for glial bridging after SCI.16,29 Our findings support the emergence of a lineage-restricted, neurogenic niche of dorsal progenitors during SC regeneration in zebrafish. Consistent with this model, the extent of glial and axonal bridging across the lesion is unaffected in the absence of mstnb. Instead, mstnb mutants show enhanced rates of neuronal differentiation in dorsal SCs and a preferential increase in the number of dorsal glycinergic neurons.
Niches of progenitor cells require intricate regulatory mechanisms to balance the rates of self-renewal, differentiation, and quiescence.59 At the cellular level, the organization of progenitor cells into localized niches maintains quiescence under homeostatic conditions and triggers progenitor cell activation following niche disruption.60 Molecularly, progenitor cell niches are hubs for Bmp, Wnt, and Notch signaling pathways, which direct specific stem cell fates by controlling the rates of self-renewal, differentiation, and quiescence. Our study supports a model in which Mstn restricts neuronal differentiation and maintains progenitors in a proliferative, undifferentiated cell fate. Similar regulatory mechanisms have been shown in muscle tissue, where Mstn inhibits the muscle differentiation transcription factors MyoD and myogenin. Our findings are also consistent with previously reported functions for Mstn in fat and bone tissue.33,37,38,61–63 Notably, previous findings have shown that Mstn is a regeneration-limiting gene for zebrafish heart or fin regeneration, which are dedifferentiation-based repair mechanisms.33,64,65 In contrast, in the context of SC regeneration, we find that Mstn promotes regeneration by supporting regenerative FGF signaling, revealing a new role of Mstn in this stem cell-based regeneration paradigm. Together, these findings underline how tissue regeneration programs can coopt similar signaling pathways to achieve highly specific regenerative outcomes and indicate a tissue-specific mechanism for Mstn signaling.
The balance between self-renewal and differentiation is essential during neural development and repair. We propose that FGF is a mediator of Mstn functions during SC regeneration and that Mstn limits neuronal differentiation in part by promoting FGF-dependent self-renewal in mstnb+ progenitors. FGF signaling exerts distinct functions at various stages of nervous system development and repair. Multiple regulatory mechanisms control the spread, duration, and levels of FGF activity, underlying the multifunctionality of FGF signaling in the same tissue. (1) A vast collection of FGF ligands exhibit different affinities to FGF receptors, enabling differential FGF signaling activity. (2) Heparan sulfate proteoglycans (HSPGs) confer additional specificity to FGF ligand-receptor interactions by protecting FGFs from degradation and limiting their diffusion. (3) Several signal transduction cascades, feedback loops, and crosstalk with other pathways, such as Wnt, epidermal growth factor (EGF), retinoic acid, and Notch, are activated downstream of FGF. Together, these mechanisms enact a range of FGF-dependent cellular responses, enabling dual and context-dependent FGF roles in the progression from radial glial to intermediate progenitors.66–71 For instance, in the mouse cortex, triple deletion of FGFR1/2/3 results in increased cell specification from radial glial progenitors, resulting in progenitor cell depletion and small cortex development.67 Conversely, in the diencephalon, fgf8a mutant zebrafish fail to initiate or maintain dbx1b expression in dorsal habenular progenitors.72 Our results are in line with the role of FGF during cortical neurogenesis and consistent with a model in which Mstn-dependent FGF signaling limits the progression of sox2+ progenitors into dbx1b+ intermediates and HuC/D>+ neurons. In addition to its role during developmental and adult neurogenesis, FGF signaling modulates glial cell responses to SCI in zebrafish and mice.17,73 In zebrafish, dominant-negative FGF, sprouty mutants, and Fgf8 injection showed that FGF signaling promotes progenitor cell proliferation and is required for glial bridging and axonal regrowth across the lesion.17 Notably, in mice, Fgf2 treatment enhances SC repair by promoting neurogenesis in addition to modulating glial cell morphology and scarring.73 We found Mstn-dependent Fgf1 had a specific effect on neuronal differentiation without affecting glial or axonal bridging. These findings suggest that fgf1 and fgf8 may play distinct roles during neuronal and glial cell regeneration and underline the need for further investigation of the cell-specific mechanisms and regulatory modes of FGF signaling at multiple steps of SC regeneration.
Limitations of the study
Our findings present a number of questions and opportunities for further investigation. First, the mechanisms that underlie E/I balance disruption in mstnb mutants require further investigation into the time course of neuronal regeneration and the contribution of mstnb+ progenitors to specific neuronal populations. On the other hand, the molecular identity and cellular contributions of mstnb+ progenitors to adult neurogenesis and SC repair are to be investigated. Finally, in the absence of a detailed connectivity map for regenerating neurons in the adult SC, the exact mechanisms by which local neurogenesis affects functional regeneration remain unknown.
In mammals, isolated ependymal cells have the capacity to form neurospheres and produce neurons, astrocytes, and oligodendrocytes in vitro.74 However, although the mammalian SCI induces proliferation of ependymal cells lining the central canal,9 mammalian ependymal cells are incapable of forming neurons in vivo.75–78 We propose that comparative studies between zebrafish and mammalian progenitor cells could reveal new insights into their differential regenerative capacity and examine whether Mstn signaling is differentially regulated between zebrafish and mammals.
STAR★METHODS
RESOURCE AVAILABILITY
Lead contact
Further information and request for resources and reagents should be directed to and will be fulfilled by the lead contact, Mayssa Mokalled (mmokalled@wustl.edu).
Materials availability
This study did not generate new unique reagents.
Data and code availability
Bulk RNA sequencing data generated in this study have been deposited at GEO and are publicly available as of the date of publication. Accession numbers are listed in the key resources table.
This study does not report any original code.
Any additional information required to reanalyze the data reported in this paper is available from the lead contact upon request.
KEY RESOURCES TABLE
| REAGENT or RESOURCE | SOURCE | IDENTIFIER |
|---|---|---|
| Antibodies | ||
| Rabbit anti-Smad3(S423/425) | Abcam | Cat#ab52903; RRID:AB_882596 |
| Rabbit anti-PCNA | Genetex | Cat#GTX124496; RRID:AB_11161916 |
| Mouse anti-HuC/D | Thermo Fisher Scientific | Cat# A-21271; RRID: AB_221448 |
| Mouse anti-Gfap | ZIRC | Cat# zrf-1; RRID: AB_10013806 |
| Chicken anti-GFP | AVES | Cat# AS10 1012; RRID:AB_10754353 |
| Rabbit anti-Sox2 | GeneTex | Cat# GTX124477; RRID: AB_11178063 |
| Fab Fragment goat anti-rabbit IgG(H+L) | Jackson ImmunoResearch | Cat# 111-007-003; RRID:AB_2337925 |
| Alexa Fluor 488 goat anti-rabbit | Invitrogen | Cat# A-11008; RRID:AB_143165 |
| Alexa Fluor 594 goat anti-rabbit | Invitrogen | Cat# A-11072; RRID:AB_142057 |
| Alexa Fluor 488 goat anti-chicken | Invitrogen | Cat# A-11039; RRID:AB_142924 |
| Alexa Fluor 488 goat anti-mouse | Invitrogen | Cat# A-21121; RRID:AB_2535764 |
| Alexa Fluor 594 goat anti-mouse | Invitrogen | Cat# A-21125; RRID:AB_141593 |
| Alexa Fluor 647 goat anti-mouse | Jackson ImmunoResearch | Cat# 115-605-003; RRID:AB_2338902 |
| Donkey anti-Goat IgG (H+L) | Thermo Fisher Scientific | Cat# A-11057; RRID:AB_2534104 |
| Alexa Fluor 488 donkey anti-rabbit | Jackson ImmunoResearch | Cat# 711-547-003; RRID:AB_2340620 |
| Chemicals, peptides, and recombinant proteins | ||
| Alexa Fluor™ 488 Phalloidin | Thermo Fisher Scientific | Cat#A123379 |
| Alexa Fluor™ 647 Azide | Thermo Fisher Scientific | Cat#A10277 |
| Alexa Fluor 594-conjugated Streptavidin | Thermo Fisher Scientific | Cat#S11227 |
| Alexa Fluor 488-conjugated Streptavidin | Thermo Fisher Scientific | Cat#S11223 |
| Gelfoam Gelatin Sponge | Pfizer | Cat# 09-0315-08 |
| Biocytin, ≥98% (TLC) | Sigma-Aldrich | Cat# B4261 |
| Taq DNA Polymerase | New England Biolabs | Cat# M0267X |
| 5-Ethynyl-2′-deoxyuridine,95% | Sigma-Aldrich | Cat#900584 |
| Tricaine methanesulfonate (MS-222) | Syndel | Cat# ANADA 200-226 |
| Recombinant Human Myostatin-Proform | BioVision | Cat# 4623P-10 |
| Recombinant Human FGF-acidic | PeproTech | Cat#100-17A |
| Critical commercial assays | ||
| NucleoSpin RNA Plus XS Kit | Clontech | Cat# 740990 |
| Maxima First Strand cDNA Synthesis Kit | ThermoFisher | Cat# K1672 |
| Luna qPCR master mix | New England Biolabs | Cat# M3003 |
| DIG RNA Labeling Mix | Sigma-Aldrich | Cat# 11277073910 |
| Deposited data | ||
| mstnb mutant Bulk RNA seq data | This manuscript | GEO accession# GSE183644 |
| Bulk RNA-seq in wildtype after SCI | (Mokalled et al., 2016)15 | GEO accession# GSE77025 |
| Experimental models: Organisms/strains | ||
| Zebrafish, mstnbbns5 | (Dogra et al., 2017)33 | ZFIN ID: ZDB-ALT-180503-6 |
| Zebrafish, Tg(nes:GFP) | (Lam et al., 2009)49 | ZFIN ID: ZDB-TGCONSTRCT-110309-7 |
| Zebrafish, Tg(dbx1b:GFP) | (Satou et al., 2012)51 | ZFIN ID: ZDB-TGCONSTRCT-110413-1 |
| Zebrafish, Tg(slc6a5:GFP) | (McLean et al., 2007)53 | ZFIN ID: ZDB-TGCONSTRCT-070514-1 |
| Zebrafish, Tg(gad1b:GFP) | (Satou et al., 2013)52 | ZFIN ID: ZDB-TGCONSTRCT-131127-6 |
| Oligonucleotides | ||
| mstnb_ISH_F: 5′-gactcaagcaggctccaaac-3′ | (Mokalled et al., 2016)15 | N/A |
| mstnb_ISH_R: 5′-gggctgttcgacagatgagt-3′ | (Mokalled et al., 2016)15 | N/A |
| mstnb_genotype_F: 5′-ggtccagtgggttatggaga-3′ | This manuscript | N/A |
| mstnb_genotype_R: 5′- cagcttgctgtgttgtctgaa-3′ | This manuscript | N/A |
| qPCR primers (see Table S1 for sequences) | This manuscript | N/A |
| Software and algorithms | ||
| ITCN | Center for Bio-image Informatics at UC Santa Barbara |
https://imagej.nih.gov/ij/plugins/itcn.html |
| AutoSwim software | Loligo Systems | cat# MI10000 |
| R v3.6.3 | (Burris et al., 2021)79 | https://cran.r-project.org |
| R studio v3.6 | (Burris et al., 2021)79 | https://www.rstudio.com/ |
| Swim behavior Analysis | (Burris et al., 2021)79 | https://github.com/MokalledLab/SwimBehavior |
| Other | ||
| 5L swim tunnel respirometer device | Loligo | Cat# SW100605L, 120/60Hz |
| Vannas scissors | World Precision Instruments | Cat# 14003-G |
| Vitrectomy Scissors, Vertical Opening, 60 deg, 20G | World Precision Instruments | Cat# WP504240 |
EXPERIMENTAL MODEL AND SUBJECT DETAILS
Zebrafish
Adult zebrafish of the Ekkwill, Tubingen, and AB strains were maintained at the Washington University Zebrafish Core Facility. All animal experiments were performed in compliance with institutional animal protocols. Male and female animals between 3 and 9 months of ~2 cm in length were used. Experimental fish and control siblings of similar size and equal sex distribution were used for all experiments. SC transection surgeries and regeneration analyses were performed in a blinded manner, and 2 to 4 independent experiments were repeated using different clutches of animals. The following previously published zebrafish strains were used: mstnbbns5,33 Tg(nes:GFP),49 Tg(dbx1b:GFP),51 Tg(slc6a5:GFP),53 and Tg(gad1b:GFP).52
METHOD DETAILS
SC transection and treatment
Zebrafish were anaesthetized using MS-222. Fine scissors were used to make a small incision that transects the SC 4 mm caudal to the brainstem region. Complete transection was visually confirmed at the time of surgery. Injured animals were also assessed at 2 or 3 dpi to confirm loss of swim capacity post-surgery. For sham injuries, animals were anaesthetized, and fine scissors were used to transect skin and muscle tissues without inducing SCI.
For pro-MSTN treatment, lyophilized human MSTN proform peptide (BioVision, 4623P-10) was reconstituted in ddH2O to a concentration 100 ng/mL. Zebrafish were anaesthetized using MS-222. 2 mL (200 ng) of reconstituted peptides were injected daily adjacent and lateral to the SC lesion site. 2 mL of ddH2O was injected for vehicle controls.
For FGF1 treatment, lyophilized human FGF1 protein (PeproTech, 100-17A) was reconstituted in heparin to a concentration 250 ng/mL. Sterile Gelfoam Absorbable Gelatin Sponge (Pfizer, 09-0315-08) was cut into 2 mm3 pieces, soaked with 2 mL of recombinant FGF1, then cut into 10 smaller pieces (50 ng per piece). Vehicle gelfoam pieces were soaked with 2 mL of heparin solution. At 5 dpi, zebrafish were anaesthetized using MS-222 and longitudinal incision lateral and parallel to the SC was made with fine scissors. Injured SC tissues were exposed without causing secondary injuries and gelfoam sponges were places adjacent to the lesion site. The incision was closed and glued using Vetbond tissue adhesive material as previously described.15
Bulk RNA sequencing
Two mm SC sections, including the lesion site plus additional rostral and caudal tissue proximal to the lesion, were collected from mstnb mutants and wild-type siblings at 7 dpi. Uninjured mstnb mutants and wild-type SCs were also collected. Total RNA was prepared using NucleoSpin RNA Plus XS (Clontech, cat# 740990) and sent for bulk RNA sequencing. TruSeq libraries were prepared and sequenced on Illumina HiSeq 3000 using 50 bp single-end reading strategy. Quality QC and trimming of adapters and short sequences were performed using Fastx. Sequencing reads were mapped to the zebrafish genome (Zv11) using Bowtie2, then assembled and quantified using the Cufflinks and Cuffdiff algorithms. Genes with log2(fold enrichment) between −1 and 1 or adjusted p-value ≥ 0.01 were considered insignificant. RNA sequencing was performed at the Genome Technology Access Center at Washington University. Analysis was performed in the Bioinformatics Core at the Center for Regenerative Medicine at Washington University. This dataset is available at GEO (accession number: GSE183644).
RNA-seq data (GEO accession number: GSE77025) was used to evaluate the expression of Tgf-β ligands after complete SC transection. Log2(fold change) is expressed for SCs at 7 dpi relative to the sham injured SCs.15
Histology
16 μm μm cross cryosections of paraformaldehyde-fixed SC tissue were used. Tissue sections were imaged using a Zeiss AxioVision compound microscope for in situ hybridization or a Zeiss LSM 800 confocal microscope for immunofluorescence.
For in situ hybridization, an mstnb probe was subcloned after amplification from 2 dpf zebrafish cDNA into PCR2.1-TOPO vectors (mstnb forward primer 5′-gactcaagcaggctccaaac-3′, mstnb reverse primer 5′-gggctgttcgacagatgagt-3′). Linearized vectors were used to generate the digoxygenin labeled cRNA probes. in situ hybridizations were performed as previously described.15
For immunohistochemistry, tissue sections were rehydrated in PBT (0.1% Tween-20 in PBS), then treated with blocking agent (5% goat serum in PBT) for 1 hr at room temperature. For nuclear antigens, sections were treated with 0.2% TritonX-100 in PBT for 5 minutes and washed thoroughly in PBT prior to the blocking step. Sections were incubated overnight with the indicated primary antibodies, washed in PBT, and treated for 1 hr with secondary antibodies. Following washes, sections were incubated in 1 mg/mL of Hoechst and mounted in Fluoromount-G mounting media. Primary antibodies used in this study were: rabbit anti-Smad3(S423/425) (Abcam, ab52903, 1:50), rabbit anti-PCNA (GeneTex, GTX124496, 1:500), mouse anti-HuC/D (Thermo Fisher Scientific, A-21271, 1:500), mouse anti-Gfap (ZIRC, Zrf1, 1:1000), chicken anti-GFP (Aves Labs, 1020, 1:1000), rabbit anti-Sox2 (GeneTex, GTX124477, 1:250). Secondary antibodies (Invitrogen, 1:200) used in this study were Alexa Fluor 488- or Alexa Fluor 594- or Alexa Fluor 647- conjugated goat anti-rabbit, anti-mouse, or anti-chicken antibodies. Alexa Four 488 Phalloidin (ThermoFisher, A12379, 1:100) was used for F-actin staining.
For simultaneous labeling with rabbit anti-Sox2 (GeneTex, 124477, 1:250) and rabbit anti-pSmad3(S423/425) (abcam, ab52903, 1:50) (Figure 1B), unconjugated Fab Fragment Goat Anti-Rabbit IgG(H+L) (Jackson ImmunoResearch, 111-007-003) and donkey anti-goat 568 (Thermo fisher: A-11057) antibodies were used for pSmad3 labeling. Sox2 was labeled using donkey anti-rabbit-488 (Jackson ImmunoResearch, 711-547-003).
EdU Staining was adapted from a a previously described protocol (Salic and Mitchison, 2008). Briefly, zebrafish were anaesthetized using MS-222 and subjected to intraperitoneal EdU injections. 12.5 mM EdU (Sigma 900584) diluted in PBS was used. A single injection (Figures 3 and S2) or multiple, daily injections (Figures 4 and S3) were performed and paraformaldehyde-fixed cryosections were used. Sections were rehydrated in PBT for 10 min then incubated with freshly prepared staining solution for 30 min (100 mM Tris (Sigma, T6066) pH 8.5; 1 mM CuSO4 (Sigma, C1297); 10 μM fluorescent azide; and 100 mM ascorbic acid (Sigma, A5960)).
Cell counting
Cell counting was performed using a customized Fiji script (adapting ITCN: Image based Tool for counting nuclei- https://imagej.nih.gov/ij/plugins/itcn.html). Orthogonal projections of individual image stacks were generated using Zen software. A Customized Fiji script incorporated user-defined inputs to define channels (including Hoechst), to determine the center of the central canal, and to outline SC perimeters. SC tissues dorsal to the central canal center was considered “dorsal SCs”. Whole SC tissues were considered “total SCs”. To quantify nuclei, the following parameters were set in ITCN counter: width, 15; minimal distance, 7.5; threshold, 0.4. For each staining, thresholds were user-defined. Raw counts from Fiji were processed using a customized R Studio script. Absolute numbers of cells are provided. However, since the total numbers of cells and the diameters of spinal cord tissues are highly variable across animals, time points and along the rostro-caudal axis within the same animal, the absolute numbers of cells were normalized to the total numbers of nuclei for all quantifications. For all cell counts, one or two-way ANOVA and multiple comparisons with appropriate corrections were performed using the Prism software.
Swim endurance assays
Zebrafish were exercised in groups of 8–12 in a 5 L swim tunnel device (Loligo, cat# SW100605L, 120V/60Hz). After 10 minutes of acclimation inside the enclosed tunnel, water current velocity was increased every two minutes and fish swam against the current until they reached exhaustion. Exhausted animals were removed from the chamber without disturbing the remaining fish. Swim time and current velocity at exhaustion were recorded. Results were expressed as means ± SEM. An unpaired two-tailed Student’s t-test with Welch correction was performed using the Prism software to determine statistical significance of swim times between groups.79
Swim behavior assays
Zebrafish were divided into groups of 5 in a 5 L swim tunnel device (Loligo, cat# SW100605L, 120V/60Hz). Each group was allowed to swim for a total of 15 min under zero to low current velocities (5 min at 0 cm/s, 5 min at 10 cm/s, and 5 min at 15 cm/s). The entire swim behavior was recorded using high-speed camera (iDS, USB 3.0 color video camera) with following settings: aspect ratio, 1:4; pixel clock, 344; frame rate, 70 frames/s; exposure time: 0.29; aperture, 1.4 to 2; maximum frames; 63,000. Movies were converted to 20 frames/s and analyzed using a customized Fiji macro. For each frame, animals/objects >1500 px2 were identified, and the XY coordinates were derived for each animal/object. Frame were independently, and animal/object tracking was completed using a customized R Studio script. The script aligned coordinates, calculated swim metrics considering three separate frame windows (Frames 0-6000 at 0 cm/s; frames 6001-12000 at 10 cm/s, and frames 12001-18001 at 20 cm/s).79
Glial bridging
GFAP immunohistochemistry was performed on serial transverse sections. The cross-sectional area of the glial bridge and the area of the intact SC rostral to the lesion were measured using ImageJ software. Bridging was calculated as a ratio of these measurements. Mann Whitney tests were performed using Prism software to determine statistical significance between groups.
Axon tracing
Anterograde axon tracing was performed on adult fish at 28 dpi. Fish were anaesthetized using MS-222 and fine scissors were used to transect the cord 4 mm rostral to the lesion site. Biocytin-soaked Gelfoam Gelatin Sponge was applied at the new injury site (Gelfoam, Pfizer, cat# 09-0315-08; Biocytin, saturated solution, Sigma, cat# B4261). Fish were euthanized 6 hours post-treatment and Biocytin was histologically detected using Alexa Fluor 594-conjugated Streptavidin (Thermo Fisher, cat# S-11227). Biocytin-labeled axons were quantified using the “threshold” and “particle analysis” tools in the Fiji software. Four sections per fish at 0.5 (proximal) and 2 (distal) mm caudal to the lesion core, and 2 sections 1 mm rostral to the lesion, were analyzed. Axon growth was normalized to the efficiency of Biocytin labeling rostral to the lesion for each fish. The axon growth index was then normalized to the control group for each experiment. Similarly for retrograde axon tracing, fish were anaesthetized using MS-222 and fine scissors were used to transect the cord next to the dorsal fin caudal to the lesion site. Biocytin-soaked Gelfoam Gelatin sponge was applied at the new injury site and then, fish were euthanized 3 hours post-treatment. Biocytin was histologically detected using Alexa Fluor 488-conjugated Streptavidin (ThermoFisher, cat# S-11223). After IHC with HuC/D, neurons co-labelled with Biocytin and HuC/D were quantified at 150 and 450 μm rostral to the lesion site.
Quantitative real time PCR
Two mm SC sections, including the lesion site plus additional rostral and caudal tissue proximal to the lesion, were collected for qRT-PCR. Total RNA was prepared using NucleoSpin RNA Plus XS (Clontech, cat# 740990) and cDNA was synthesized using the Maxima First Strand cDNA Synthesis Kit (ThermoFisher, cat# K1672) according to manufacturer’s specifications. Quantitative PCR was completed using the Luna polymerase master mix (NEB, cat# M3003) using gene-specific primers (Table S1). Primers were designed to flank introns and were confirmed to not amplify project from genomic DNA. To determine primer efficiency, a standard curve was generated for each primer set using cDNA pooled from wild-type embryos at 1, 3, and 5 days post-fertilization. qRT-PCR was performed on a Bio-Rad CFX Connect Real-Time System. For each gene, log2(fold change) was calculated using the DCq method and normalized to eif1a as a loading control and to control gene expression for each experiment.
QUANTIFICATION AND STATISTICAL ANALYSIS
All sample sizes (n) are indicated for the number of animals used in each experiment. Surgeries, swims, and analysis were completed after blinding the conditions. Quantification was performed on either orthogonal projections or single-plane images. GraphPad Prism software was used to perform all statistical analysis. Unpaired student’s t-test (with Welch’s correction, whenever appropriate) or Mann Whitney test were used for comparing two groups. One-way or two-way ANOVA with appropriate corrections for multiple comparisons were used for comparing three or more groups. Additional statistical information is mentioned in the respective figure legends. The stars in the graphs represent p-values. ns indicates p-value >0.05; * indicates p-values between 0.05 and 0.01; ** indicates p-values between 0.01 and 0.001; and *** indicates p-values < 0.0001.
Supplementary Material
Highlights.
myostatin b transcripts localize to a subset of spinal cord progenitors after injury
myostatin b mutants show impaired recovery of swim function after injury
myostatin b mutants elicit premature neuronal differentiation after injury
fgf1b is an effector of Myostatin signaling in the spinal cord
ACKNOWLEDGMENTS
We thank V. Cavalli, A. Johnson, K. Poss, and L. Solnica-Krezel for discussions; D. Ornitz and D. Stainier for sharing lines and reagents; S. Higashijima, the National Institutes of Natural Sciences, and the National Bioresource Project of Japan as the source of the dbx1b:GFP line; T. Li and B. Zhang for bioinformatics analysis; and the Washington University Zebrafish Shared Resource for animal care. This research was supported by grants from the NIH (R01 NS113915 to M.H.M.) and the McDonnell Center for Cellular Neuroscience (to M.H.M.).
Footnotes
SUPPLEMENTAL INFORMATION
Supplemental information can be found online at https://doi.org/10.1016/j.celrep.2022.111705.
DECLARATION OF INTERESTS
The authors declare no competing interests.
REFERENCES
- 1.Hachem LD, Ahuja CS, and Fehlings MG (2017). Assessment and management of acute spinal cord injury: from point of injury to rehabilitation. J. Spinal Cord Med 40, 665–675. 10.1080/10790268.2017.1329076. [DOI] [PMC free article] [PubMed] [Google Scholar]
- 2.Silva NA, Sousa N, Reis RL, and Salgado AJ (2014). From basics to clinical: a comprehensive review on spinal cord injury. Prog. Neurobiol. 114, 25–57. 10.1016/j.pneurobio.2013.11.002. [DOI] [PubMed] [Google Scholar]
- 3.Singh A, Tetreault L, Kalsi-Ryan S, Nouri A, and Fehlings MG (2014). Global prevalence and incidence of traumatic spinal cord injury. Clin. Epidemiol 6, 309–331. 10.2147/CLEP.S68889. [DOI] [PMC free article] [PubMed] [Google Scholar]
- 4.Tran AP, Warren PM, and Silver J (2022). New insights into glial scar formation after spinal cord injury. Cell Tissue Res. 387, 319–336. 10.1007/s00441-021-03477-w. [DOI] [PMC free article] [PubMed] [Google Scholar]
- 5.Fouad K, Popovich PG, Kopp MA, and Schwab JM (2021). The neuroanatomical-functional paradox in spinal cord injury. Nat. Rev. Neurol 17, 53–62. 10.1038/s41582-020-00436-x. [DOI] [PMC free article] [PubMed] [Google Scholar]
- 6.Alizadeh A, Dyck SM, and Karimi-Abdolrezaee S (2019). Traumatic spinal cord injury: an overview of pathophysiology, models and acute injury mechanisms. Front. Neurol 10, 282. 10.3389/fneur.2019.00282. [DOI] [PMC free article] [PubMed] [Google Scholar]
- 7.Oyinbo CA (2011). Secondary injury mechanisms in traumatic spinal cord injury: a nugget of this multiply cascade. Acta Neurobiol. Exp 71, 281–299. [DOI] [PubMed] [Google Scholar]
- 8.Sofroniew MV (2018). Dissecting spinal cord regeneration. Nature 557, 343–350. 10.1038/s41586-018-0068-4. [DOI] [PubMed] [Google Scholar]
- 9.Horner PJ, Power AE, Kempermann G, Kuhn HG, Palmer TD, Winkler J, Thal LJ, and Gage FH (2000). Proliferation and differentiation of progenitor cells throughout the intact adult rat spinal cord. J. Neurosci 20, 2218–2228. [DOI] [PMC free article] [PubMed] [Google Scholar]
- 10.Yamamoto S, Yamamoto N, Kitamura T, Nakamura K, and Nakafuku M (2001). Proliferation of parenchymal neural progenitors in response to injury in the adult rat spinal cord. Exp. Neurol 172, 115–127. 10.1006/exnr.2001.7798. [DOI] [PubMed] [Google Scholar]
- 11.Horky LL, Galimi F, Gage FH, and Horner PJ (2006). Fate of endogenous stem/progenitor cells following spinal cord injury. J. Comp. Neurol 498, 525–538. 10.1002/cne.21065. [DOI] [PMC free article] [PubMed] [Google Scholar]
- 12.Becker T, Wullimann MF, Becker CG, Bernhardt RR, and Schachner M (1997). Axonal regrowth afterspinal cord transection inadult zebrafish. J. Comp. Neurol 377, 577–595, 19970127)377:4<577::aid-cne8>3.0.co;2-#. 10.1002/(sici)1096-9861. [DOI] [PubMed] [Google Scholar]
- 13.Becker T, Bernhardt RR, Reinhard E, Wullimann MF, Tongiorgi E, and Schachner M (1998). Readiness of zebrafish brain neurons to regenerate a spinal axon correlates with differential expression of specific cell recognition molecules. J. Neurosci 18, 5789–5803. 10.1523/JNEUROSCI.18-15-05789.1998. [DOI] [PMC free article] [PubMed] [Google Scholar]
- 14.Kuscha V, Frazer SL, Dias TB, Hibi M, Becker T, and Becker CG (2012). Lesion-induced generation of interneuron cell types in specific dorsoventral domains in the spinal cord of adult zebrafish. J. Comp. Neurol 520, 3604–3616. 10.1002/cne.23115. [DOI] [PubMed] [Google Scholar]
- 15.Mokalled MH, Patra C, Dickson AL, Endo T, Stainier DYR, and Poss KD (2016). Injury-induced ctgfa directs glial bridging and spinal cord regeneration in zebrafish. Science 354, 630–634. 10.1126/science.aaf2679. [DOI] [PMC free article] [PubMed] [Google Scholar]
- 16.Reimer MM, Sörensen I, Kuscha V, Frank RE, Liu C, Becker CG, and Becker T (2008). Motor neuron regeneration in adult zebrafish. J. Neurosci 28, 8510–8516. 10.1523/JNEUROSCI.1189-08.2008. [DOI] [PMC free article] [PubMed] [Google Scholar]
- 17.Goldshmit Y, Sztal TE, Jusuf PR, Hall TE, Nguyen-Chi M, and Currie PD (2012). Fgf-dependent glial cell bridges facilitate spinal cord regeneration in zebrafish. J. Neurosci 32, 7477–7492. 10.1523/JNEUROSCI.0758-12.2012. [DOI] [PMC free article] [PubMed] [Google Scholar]
- 18.Kroehne V, Freudenreich D, Hans S, Kaslin J, and Brand M (2011). Regeneration of the adult zebrafish brain from neurogenic radial glia-type progenitors. Development, 138 (Cambridge, England), pp. 4831–4841. 10.1242/dev.072587. [DOI] [PubMed] [Google Scholar]
- 19.März M, Chapouton P, Diotel N, Vaillant C, Hesl B, Takamiya M, Lam CS, Kah O, Bally-Cuif L, and Strähle U (2010). Heterogeneity in progenitor cell subtypes in the ventricular zone of the zebrafish adult telencephalon. Glia 58, 870–888. 10.1002/glia.20971. [DOI] [PubMed] [Google Scholar]
- 20.Than-Trong E, Ortica-Gatti S, Mella S, Nepal C, Alunni A, and Bally-Cuif L (2018). Neural stem cell quiescence and sternness are molecularly distinct outputs of the Notch3 signalling cascade in the vertebrate adult brain. Development, 145 (Cambridge, England), p. dev161034. 10.1242/dev.161034. [DOI] [PMC free article] [PubMed] [Google Scholar]
- 21.Than-Trong E, Kiani B, Dray N, Ortica S, Simons B, Rulands S, Alunni A, and Bally-Cuif L (2020). Lineage hierarchies and stochasticity ensure the long-term maintenance of adult neural stem cells. Sci. Adv 6, eaaz5424. 10.1126/sciadv.aaz5424. [DOI] [PMC free article] [PubMed] [Google Scholar]
- 22.Ogai K, Nakatani K, Hisano S, Sugitani K, Koriyama Y, and Kato S (2014). Function of Sox2 in ependymal cells of lesioned spinal cords in adult zebrafish. Neurosci. Res 88, 84–87. 10.1016/j.neures.2014.07.010. [DOI] [PubMed] [Google Scholar]
- 23.Reimer MM, Kuscha V,Wyatt C, Sörensen I, Frank RE, Knüwer M, Becker T, and Becker CG (2009). Sonic hedgehog is a polarized signal for motor neuron regeneration in adult zebrafish. J. Neurosci 29, 15073–15082. 10.1523/JNEUROSCI.4748-09.2009. [DOI] [PMC free article] [PubMed] [Google Scholar]
- 24.Barbosa J, Sanchez-Gonzalez R, Di Giaimo R, Baumgart E, Theis F, Götz M, and Ninkovic J (2015). Neurodevelopment. Live imaging of adult neural stem cell behavior in the intact and injured zebrafish brain. Science, 348 (New York, N.Y.), pp. 789–793. 10.1126/science.aaa2729. [DOI] [PubMed] [Google Scholar]
- 25.Chapouton P, Skupien P, Hesl B, Coolen M, Moore JC, Madelaine R, Kremmer E, Faus-Kessler T, Blader P, Lawson ND, and Bally-Cuif L (2010). Notch activity levels control the balance between quiescence and recruitment of adult neural stem cells. J. Neurosci 30, 7961–7974. 10.1523/JNEUROSCI.6170-09.2010. [DOI] [PMC free article] [PubMed] [Google Scholar]
- 26.Adolf B, Chapouton P, Lam CS, Topp S, Tannhäuser B, Strähle U, Götz M, and Bally-Cuif L (2006). Conserved and acquired features of adult neurogenesis in the zebrafish telencephalon. Dev. Biol 295, 278–293. 10.1016/j.ydbio.2006.03.023. [DOI] [PubMed] [Google Scholar]
- 27.Grandel H, Kaslin J, Ganz J, Wenzel I, and Brand M (2006). Neural stem cells and neurogenesis in the adult zebrafish brain: origin, proliferation dynamics, migration and cell fate. Dev. Biol 295, 263–277. 10.1016/j.ydbio.2006.03.040. [DOI] [PubMed] [Google Scholar]
- 28.Barreiro-Iglesias A, Mysiak KS, Scott AL, Reimer MM, Yang Y, Becker CG, and Becker T (2015). Serotonin promotes development and regeneration of spinal motor neurons in zebrafish. Cell Rep. 13, 924–932. 10.1016/j.celrep.2015.09.050. [DOI] [PMC free article] [PubMed] [Google Scholar]
- 29.Klatt Shaw D, Saraswathy VM, Zhou L, McAdow AR, Burris B, Butka E, Morris SA, Dietmann S, and Mokalled MH (2021). Localized EMT reprograms glial progenitors to promote spinal cord repair. Dev. Cell 56, 613–626.e7. 10.1016/j.devcel.2021.01.017. [DOI] [PMC free article] [PubMed] [Google Scholar]
- 30.Massagué J (2012). TGFβ signalling in context. Nat. Rev. Mol. Cell Biol 13, 616–630. 10.1038/nrm3434. [DOI] [PMC free article] [PubMed] [Google Scholar]
- 31.Sartori R, Gregorevic P, and Sandri M (2014). TGFβ and BMP signaling in skeletal muscle: potential significance for muscle-related disease. Trends Endocrinol. Metab 25, 464–471. 10.1016/j.tem.2014.06.002. [DOI] [PubMed] [Google Scholar]
- 32.Sharma M, McFarlane C, Kambadur R, Kukreti H, Bonala S, and Srinivasan S (2015). Myostatin: expanding horizons. IUBMB Life 67, 589–600. 10.1002/iub.1392. [DOI] [PubMed] [Google Scholar]
- 33.Dogra D, Ahuja S, Kim HT, Rasouli SJ, Stainier DYR, and Reischauer S (2017). Opposite effects of Activin type 2 receptor ligands on cardiomyocyte proliferation during development and repair. Nat. Commun 8, 1902. 10.1038/s41467-017-01950-1. [DOI] [PMC free article] [PubMed] [Google Scholar]
- 34.Whittemore LA, Song K, Li X, Aghajanian J, Davies M, Girgenrath S, Hill JJ, Jalenak M, Kelley P, Knight A, et al. (2003). Inhibition of myostatin in adult mice increases skeletal muscle mass and strength. Biochem. Biophys. Res. Commun 300, 965–971. [DOI] [PubMed] [Google Scholar]
- 35.Kambadur R, Sharma M, Smith TP, and Bass JJ (1997). Mutations in myostatin (GDF8) in double-muscled Belgian Blue and Piedmontese cattle. Genome Res. 7, 910–916. [DOI] [PubMed] [Google Scholar]
- 36.Schuelke M, Wagner KR, Stolz LE, Hübner C, Riebel T, Kömen W, Braun T, Tobin JF, and Lee SJ (2004). Myostatin mutation associated with gross muscle hypertrophy in a child. N. Engl. J. Med 350,2682–2688. 10.1056/NEJMoa040933. [DOI] [PubMed] [Google Scholar]
- 37.Langley B, Thomas M, Bishop A, Sharma M, Gilmour S, and Kambadur R(2002). Myostatin inhibits myoblast differentiation by down-regulating MyoD expression. J. Biol. Chem 277, 49831–49840. 10.1074/jbc.M204291200. [DOI] [PubMed] [Google Scholar]
- 38.McCroskery S, Thomas M, Maxwell L, Sharma M, and Kambadur R (2003). Myostatin negatively regulates satellite cell activation and self-renewal. J. Cell Biol 162, 1135–1147. 10.1083/jcb.200207056. [DOI] [PMC free article] [PubMed] [Google Scholar]
- 39.McCroskery S, Thomas M, Platt L, Hennebry A, Nishimura T, McLeay L, Sharma M, and Kambadur R (2005). Improved muscle healing through enhanced regeneration and reduced fibrosis in myostatin-null mice. J. Cell Sci 118, 3531–3541. 10.1242/jcs.02482. [DOI] [PubMed] [Google Scholar]
- 40.Taylor WE, Bhasin S, Artaza J, Byhower F, Azam M, Willard DH Jr., Kull FC Jr., and Gonzalez-Cadavid N (2001). Myostatin inhibits cell proliferation and protein synthesis in C2C12 muscle cells. Am. J. Physiol. Endocrinol. Metab 280, E221–E228. 10.1152/ajpendo.2001.280.2.E221. [DOI] [PubMed] [Google Scholar]
- 41.Rodgers BD, Wiedeback BD, Hoversten KE, Jackson MF, Walker RG, and Thompson TB (2014). Myostatin stimulates, not inhibits, C2C12 myoblast proliferation. Endocrinology 155, 670–675. 10.1210/en.2013-2107. [DOI] [PMC free article] [PubMed] [Google Scholar]
- 42.Kerrison JB, Lewis RN, Otteson DC, and Zack DJ (2005). Bone morphogenetic proteins promote neurite outgrowth in retinal ganglion cells. Mol. Vis 11, 208–215. [PubMed] [Google Scholar]
- 43.Wu HH, Ivkovic S, Murray RC, Jaramillo S, Lyons KM, Johnson JE, and Calof AL (2003). Autoregulation of neurogenesis by GDF11. Neuron 37, 197–207. 10.1016/s0896-6273(02)01172-8. [DOI] [PubMed] [Google Scholar]
- 44.Li S, Gu X, and Yi S (2017). The regulatory effects of transforming growth factor-β on nerve regeneration. Cell Transplant. 26, 381–394. 10.3727/096368916X693824. [DOI] [PMC free article] [PubMed] [Google Scholar]
- 45.Keatinge M, Tsarouchas TM, Munir T, Porter NJ, Larraz J, Gianni D, Tsai HH, Becker CG, Lyons DA, and Becker T (2021). CRISPR gRNA phenotypic screening in zebrafish reveals pro-regenerative genes in spinal cord injury. PLoS Genet. 17, e1009515. 10.1371/journal.pgen.1009515. [DOI] [PMC free article] [PubMed] [Google Scholar]
- 46.Klatt Shaw D, and Mokalled MH (2021). Efficient CRISPR/Cas9 mutagenesis for neurobehavioral screening in adult zebrafish. G3, 11 (Bethesda), p.jkab089. 10.1093/g3journal/jkab089. [DOI] [PMC free article] [PubMed] [Google Scholar]
- 47.Reimer MM, Norris A, Ohnmacht J, Patani R, Zhong Z, Dias TB, Kuscha V, Scott AL, Chen YC, Rozov S, et al. (2013). Dopamine from the brain promotes spinal motor neuron generation during development and adult regeneration. Dev. Cell 25, 478–491. 10.1016/j.devcel.2013.04.012. [DOI] [PubMed] [Google Scholar]
- 48.Zhu X, Hadhazy M, Wehling M, Tidball JG, and McNally EM (2000). Dominant negative myostatin produces hypertrophy without hyperplasia in muscle. FEBS Lett. 474, 71–75. 10.1016/s0014-5793(00)01570-2. [DOI] [PubMed] [Google Scholar]
- 49.Lam CS, März M, and Strähle U (2009). Gfap and nestin reporter lines reveal characteristics of neural progenitors in the adult zebrafish brain. Dev. Dyn 238, 475–486. 10.1002/dvdy.21853. [DOI] [PubMed] [Google Scholar]
- 50.Vandestadt C, Vanwalleghem GC, Khabooshan MA, Douek AM, Castillo HA, Li M, Schulze K, Don E, Stamatis SA, Ratnadiwakara M, et al. (2021). RNA-induced inflammation and migration of precursor neurons initiates neuronal circuit regeneration in zebrafish. Dev. Cell 56, 2364–2380.e8. 10.1016/j.devcel.2021.07.021. [DOI] [PubMed] [Google Scholar]
- 51.Satou C, Kimura Y, and Higashijima S.i. (2012). Generation of multiple classes of V0 neurons in zebrafish spinal cord: progenitor heterogeneity and temporal control of neuronal diversity. J. Neurosci 32, 1771–1783. 10.1523/JNEUROSCI.5500-11.2012. [DOI] [PMC free article] [PubMed] [Google Scholar]
- 52.Satou C, Kimura Y, Hirata H, Suster ML, Kawakami K, and Higashijima S.i. (2013). Transgenic tools to characterize neuronal properties of discrete populations of zebrafish neurons. Development 140, 3927–3931. 10.1242/dev.099531. [DOI] [PubMed] [Google Scholar]
- 53.McLean DL, Fan J, Higashijima S.i., Hale ME, and Fetcho JR (2007). A topographic map of recruitment in spinal cord. Nature 446, 71–75. 10.1038/nature05588. [DOI] [PubMed] [Google Scholar]
- 54.Ravanelli AM, and Appel B (2015). Motor neurons and oligodendrocytes arise from distinct cell lineages by progenitor recruitment. Genes Dev. 29, 2504–2515. 10.1101/gad.271312.115. [DOI] [PMC free article] [PubMed] [Google Scholar]
- 55.Hsu YC, Kao CY, Chung YF, Lee DC, Liu JW, and Chiu IM (2016). Activation of Aurora A kinase through the FGF1/FGFR signaling axis sustains the stem cell characteristics of glioblastoma cells. Exp. Cell Res 344, 153–166. 10.1016/j.yexcr.2016.04.012. [DOI] [PubMed] [Google Scholar]
- 56.Hinckley C, Seebach B, and Ziskind-Conhaim L (2005). Distinct roles of glycinergic and GABAergic inhibition in coordinating locomotor-like rhythms in the neonatal mouse spinal cord. Neuroscience 131, 745–758. 10.1016/j.neuroscience.2004.11.034. [DOI] [PubMed] [Google Scholar]
- 57.Jovanović K, Petrov T, and Stein RB (1999). Effects of inhibitory neurotransmitters on the mudpuppy (Necturus maculatus) locomotor pattern in vitro. Exp. Brain Res 129, 172–184. 10.1007/s002210050887. [DOI] [PubMed] [Google Scholar]
- 58.Sibilla S, and Ballerini L (2009). GABAergic and glycinergic interneuron expression during spinal cord development: dynamic interplay between inhibition and excitation in the control of ventral network outputs. Prog. Neurobiol 89, 46–60. 10.1016/j.pneurobio.2009.06.001. [DOI] [PubMed] [Google Scholar]
- 59.Li L, and Clevers H (2010). Coexistence of quiescent and active adult stem cells in mammals. Science 327, 542–545. 10.1126/science.1180794. [DOI] [PMC free article] [PubMed] [Google Scholar]
- 60.Bagheri-Mohammadi S (2021). Adult neurogenesis and the molecular signalling pathways in brain: the role of stem cells in adult hippocampal neurogenesis. Int. J. Neurosci, 1–13. 10.1080/00207454.2020.1865953. [DOI] [PubMed] [Google Scholar]
- 61.Wallner C, Jaurich H, Wagner JM, Becerikli M, Harati K, Dadras M, Lehnhardt M, and Behr B (2017). Inhibition of GDF8 (Myostatin) accelerates bone regeneration in diabetes mellitus type 2. Sci. Rep 7, 9878. 10.1038/s41598-017-10404-z. [DOI] [PMC free article] [PubMed] [Google Scholar]
- 62.Le W, and Yao J(2017). The effect of myostatin (GDF-8) on proliferation and tenocyte differentiation of rat bone marrow-derived mesenchymal stem cells. J. Hand Surg. Asian. Pac Vol. 22, 200–207. 10.1142/S0218810417500253. [DOI] [PubMed] [Google Scholar]
- 63.Lim S, McMahon CD, Matthews KG, Devlin GP, Elston MS, and Conaglen JV (2018). Absence of myostatin improves cardiac function following myocardial infarction. Heart Lung Circ. 27, 693–701. 10.1016/j.hlc.2017.05.138. [DOI] [PubMed] [Google Scholar]
- 64.Uribe V, Ramadass R, Dogra D, Rasouli SJ, Gunawan F, Nakajima H, Chiba A, Reischauer S, Mochizuki N, and Stainier DYR (2018). In vivo analysis of cardiomyocyte proliferation during trabeculation. Development 145, dev164194. 10.1242/dev.164194. [DOI] [PubMed] [Google Scholar]
- 65.Magga J, Vainio L, Kilpiö T, Hulmi JJ, Taponen S, Lin R, Räsänen M, Szabó Z, Gao E, Rahtu-Korpela L, et al. (2019). Systemic blockade of ACVR2B ligands protects myocardium from acute ischemia-reperfusion injury. Mol. Ther 27, 600–610. 10.1016/j.ymthe.2019.01.013. [DOI] [PMC free article] [PubMed] [Google Scholar]
- 66.Hsu Y, Lee D, Chen S, Liao W, Lin J, Chiu W, and Chiu I (2009). Brain-specific 1B promoter of FGF1 gene facilitates the isolation of neural stem/progenitor cells with self-renewal and multipotent capacities. Dev. Dyn 238, 302–314, an official publication of the American Association of Anatomists. 10.1002/dvdy.21753. [DOI] [PubMed] [Google Scholar]
- 67.Kang W, Wong LC, Shi SH, and Hébert JM (2009). The transition from radial glial to intermediate progenitor cell is inhibited by FGF signaling during corticogenesis. J. Neurosci 29, 14571–14580. 10.1523/JNEUROSCI.3844-09.2009. [DOI] [PMC free article] [PubMed] [Google Scholar]
- 68.Rash BG, Lim HD, Breunig JJ, and Vaccarino FM (2011). FGF signaling expands embryonic cortical surface area by regulating Notch-dependent neurogenesis. J. Neurosci 31, 15604–15617. 10.1523/JNEUROSCI.4439-11.2011. [DOI] [PMC free article] [PubMed] [Google Scholar]
- 69.Yoon K, Nery S, Rutlin ML, Radtke F, Fishell G, and Gaiano N (2004). Fibroblast growth factor receptor signaling promotes radial glial identity and interacts with Notch1 signaling in telencephalic progenitors. J. Neurosci 24, 9497–9506. 10.1523/JNEUROSCI.0993-04.2004. [DOI] [PMC free article] [PubMed] [Google Scholar]
- 70.Israsena N, Hu M, Fu W, Kan L, and Kessler JA (2004). The presence of FGF2 signaling determines whether beta-catenin exerts effects on proliferation or neuronal differentiation of neural stem cells. Dev. Biol 268, 220–231. 10.1016/j.ydbio.2003.12.024. [DOI] [PubMed] [Google Scholar]
- 71.Ciccolini F, and Svendsen CN (1998). Fibroblast growth factor 2 (FGF-2) promotes acquisition of epidermal growth factor (EGF) responsiveness in mouse striatal precursor cells: identification of neural precursors responding to both EGF and FGF-2. J. Neurosci 18, 7869–7880. [DOI] [PMC free article] [PubMed] [Google Scholar]
- 72.Dean BJ, Erdogan B, Gamse JT, and Wu SY (2014). Dbx1b defines the dorsal habenular progenitor domain in the zebrafish epithalamus. Neural Dev. 9, 20. 10.1186/1749-8104-9-20. [DOI] [PMC free article] [PubMed] [Google Scholar]
- 73.Goldshmit Y, Frisca F, Pinto AR, Pébay A, Tang JKKY, Siegel AL, Kaslin J, and Currie PD (2014). Fgf2 improves functional recovery-decreasing gliosis and increasing radial glia and neural progenitor cells after spinal cord injury. Brain Behav. 4, 187–200. 10.1002/brb3.172. [DOI] [PMC free article] [PubMed] [Google Scholar]
- 74.Meletis K, Barnabé-Heider F, Carlén M, Evergren E, Tomilin N, Shupliakov O, and Frisén J (2008). Spinal cord injury reveals multilineage differentiation of ependymal cells. PLoS Biol. 6, e182. 10.1371/journal.pbio.0060182. [DOI] [PMC free article] [PubMed] [Google Scholar]
- 75.Barnabé-Heider F, Göritz C, Sabelström H, Takebayashi H, Pfrieger FW, Meletis K, and Frisén J (2010). Origin of new glial cells in intact and injured adult spinal cord. Cell Stem Cell 7, 470–482. 10.1016/j.stem.2010.07.014. [DOI] [PubMed] [Google Scholar]
- 76.Ren Y, Ao Y, O’Shea TM, Burda JE, Bernstein AM, Brumm AJ, Muthusamy N, Ghashghaei HT, Carmichael ST, Cheng L, and Sofroniew MV (2017). Ependymal cell contribution to scar formation after spinal cord injury is minimal, local and dependent on direct ependymal injury. Sci. Rep 7, 41122. 10.1038/srep41122. [DOI] [PMC free article] [PubMed] [Google Scholar]
- 77.Muthusamy N, Brumm A, Zhang X, Carmichael ST, and Ghashghaei HT (2018). Foxj1 expressing ependymal cells do not contribute new cells to sites of injury or stroke in the mouse forebrain. Sci. Rep 8, 1766. 10.1038/s41598-018-19913-x. [DOI] [PMC free article] [PubMed] [Google Scholar]
- 78.Shah PT, Stratton JA, Stykel MG, Abbasi S, Sharma S, Mayr KA, Koblinger K, Whelan PJ, and Biernaskie J (2018). Single-cell transcriptomics and fate mapping of ependymal cells reveals an absence of neural stem cell function. Cell 173, 1045–1057.e9. 10.1016/j.cell.2018.03.063. [DOI] [PubMed] [Google Scholar]
- 79.Burris B, Jensen N, and Mokalled MH (2021). Assessment of swim endurance and swim behavior in adult zebrafish. J. Vis. Exp 10.3791/63240. [DOI] [PMC free article] [PubMed] [Google Scholar]
Associated Data
This section collects any data citations, data availability statements, or supplementary materials included in this article.
Supplementary Materials
Data Availability Statement
Bulk RNA sequencing data generated in this study have been deposited at GEO and are publicly available as of the date of publication. Accession numbers are listed in the key resources table.
This study does not report any original code.
Any additional information required to reanalyze the data reported in this paper is available from the lead contact upon request.
KEY RESOURCES TABLE
| REAGENT or RESOURCE | SOURCE | IDENTIFIER |
|---|---|---|
| Antibodies | ||
| Rabbit anti-Smad3(S423/425) | Abcam | Cat#ab52903; RRID:AB_882596 |
| Rabbit anti-PCNA | Genetex | Cat#GTX124496; RRID:AB_11161916 |
| Mouse anti-HuC/D | Thermo Fisher Scientific | Cat# A-21271; RRID: AB_221448 |
| Mouse anti-Gfap | ZIRC | Cat# zrf-1; RRID: AB_10013806 |
| Chicken anti-GFP | AVES | Cat# AS10 1012; RRID:AB_10754353 |
| Rabbit anti-Sox2 | GeneTex | Cat# GTX124477; RRID: AB_11178063 |
| Fab Fragment goat anti-rabbit IgG(H+L) | Jackson ImmunoResearch | Cat# 111-007-003; RRID:AB_2337925 |
| Alexa Fluor 488 goat anti-rabbit | Invitrogen | Cat# A-11008; RRID:AB_143165 |
| Alexa Fluor 594 goat anti-rabbit | Invitrogen | Cat# A-11072; RRID:AB_142057 |
| Alexa Fluor 488 goat anti-chicken | Invitrogen | Cat# A-11039; RRID:AB_142924 |
| Alexa Fluor 488 goat anti-mouse | Invitrogen | Cat# A-21121; RRID:AB_2535764 |
| Alexa Fluor 594 goat anti-mouse | Invitrogen | Cat# A-21125; RRID:AB_141593 |
| Alexa Fluor 647 goat anti-mouse | Jackson ImmunoResearch | Cat# 115-605-003; RRID:AB_2338902 |
| Donkey anti-Goat IgG (H+L) | Thermo Fisher Scientific | Cat# A-11057; RRID:AB_2534104 |
| Alexa Fluor 488 donkey anti-rabbit | Jackson ImmunoResearch | Cat# 711-547-003; RRID:AB_2340620 |
| Chemicals, peptides, and recombinant proteins | ||
| Alexa Fluor™ 488 Phalloidin | Thermo Fisher Scientific | Cat#A123379 |
| Alexa Fluor™ 647 Azide | Thermo Fisher Scientific | Cat#A10277 |
| Alexa Fluor 594-conjugated Streptavidin | Thermo Fisher Scientific | Cat#S11227 |
| Alexa Fluor 488-conjugated Streptavidin | Thermo Fisher Scientific | Cat#S11223 |
| Gelfoam Gelatin Sponge | Pfizer | Cat# 09-0315-08 |
| Biocytin, ≥98% (TLC) | Sigma-Aldrich | Cat# B4261 |
| Taq DNA Polymerase | New England Biolabs | Cat# M0267X |
| 5-Ethynyl-2′-deoxyuridine,95% | Sigma-Aldrich | Cat#900584 |
| Tricaine methanesulfonate (MS-222) | Syndel | Cat# ANADA 200-226 |
| Recombinant Human Myostatin-Proform | BioVision | Cat# 4623P-10 |
| Recombinant Human FGF-acidic | PeproTech | Cat#100-17A |
| Critical commercial assays | ||
| NucleoSpin RNA Plus XS Kit | Clontech | Cat# 740990 |
| Maxima First Strand cDNA Synthesis Kit | ThermoFisher | Cat# K1672 |
| Luna qPCR master mix | New England Biolabs | Cat# M3003 |
| DIG RNA Labeling Mix | Sigma-Aldrich | Cat# 11277073910 |
| Deposited data | ||
| mstnb mutant Bulk RNA seq data | This manuscript | GEO accession# GSE183644 |
| Bulk RNA-seq in wildtype after SCI | (Mokalled et al., 2016)15 | GEO accession# GSE77025 |
| Experimental models: Organisms/strains | ||
| Zebrafish, mstnbbns5 | (Dogra et al., 2017)33 | ZFIN ID: ZDB-ALT-180503-6 |
| Zebrafish, Tg(nes:GFP) | (Lam et al., 2009)49 | ZFIN ID: ZDB-TGCONSTRCT-110309-7 |
| Zebrafish, Tg(dbx1b:GFP) | (Satou et al., 2012)51 | ZFIN ID: ZDB-TGCONSTRCT-110413-1 |
| Zebrafish, Tg(slc6a5:GFP) | (McLean et al., 2007)53 | ZFIN ID: ZDB-TGCONSTRCT-070514-1 |
| Zebrafish, Tg(gad1b:GFP) | (Satou et al., 2013)52 | ZFIN ID: ZDB-TGCONSTRCT-131127-6 |
| Oligonucleotides | ||
| mstnb_ISH_F: 5′-gactcaagcaggctccaaac-3′ | (Mokalled et al., 2016)15 | N/A |
| mstnb_ISH_R: 5′-gggctgttcgacagatgagt-3′ | (Mokalled et al., 2016)15 | N/A |
| mstnb_genotype_F: 5′-ggtccagtgggttatggaga-3′ | This manuscript | N/A |
| mstnb_genotype_R: 5′- cagcttgctgtgttgtctgaa-3′ | This manuscript | N/A |
| qPCR primers (see Table S1 for sequences) | This manuscript | N/A |
| Software and algorithms | ||
| ITCN | Center for Bio-image Informatics at UC Santa Barbara |
https://imagej.nih.gov/ij/plugins/itcn.html |
| AutoSwim software | Loligo Systems | cat# MI10000 |
| R v3.6.3 | (Burris et al., 2021)79 | https://cran.r-project.org |
| R studio v3.6 | (Burris et al., 2021)79 | https://www.rstudio.com/ |
| Swim behavior Analysis | (Burris et al., 2021)79 | https://github.com/MokalledLab/SwimBehavior |
| Other | ||
| 5L swim tunnel respirometer device | Loligo | Cat# SW100605L, 120/60Hz |
| Vannas scissors | World Precision Instruments | Cat# 14003-G |
| Vitrectomy Scissors, Vertical Opening, 60 deg, 20G | World Precision Instruments | Cat# WP504240 |