

Abstract
A new class of pharmacologically active mixed-ligand complexes (1a-2a) [MII(L)2 (bpy)], where L = 2-(4-morpholinobenzylideneamino)phenol), bpy = 2,2′-bipyridine, MII = Cu (1a), and Zn (2a), were assigned an octahedral geometry by analytical and spectral measurements. Gel electrophoresis showed that complex (1a) demonstrated the complete DNA cleavage mediated by H2O2. The overall DNA-binding constants observed from UV-vis, fluorometric, hydrodynamic, and electrochemical titrations were in the following sequence: (1a) > (2a) > (HL), which suggests that the complexes might intercalate DNA, a possibility that is further supported by the biothermodynamic characteristics. The binding constant results of BSA by electronic absorption and fluorometric titration demonstrate that complex (1a) exhibits the highest binding effectiveness among others, which means that all compounds could interact with BSA through a static approach, additionally supported by FRET measurements. Density FunctionalTheory (DFT) and molecular docking calculations were relied on to unveil the electronic structure, reactivity, and interacting capability of all substances with DNA, BSA, and SARS-CoV-2 main protease (Mpro). These observed binding energies fell within the following ranges: −7.7 to −8.6, −7.2 to −10.2, and −6.7 to −8.2 kcal/mol, respectively. The higher reactivity of the complexes compared to free ligand is supported by the Frontier MolecularOrbital (FMO) theory. The in vitro antibacterial, cytotoxic, and radical scavenging characteristics revealed that complex (1a) has the best biological efficacy compared to others. This is encouraged because all experimental findings are closely correlated with the theoretical measurements.
1. Introduction
Today, cancer has achieved the second highest death rate in the world, behind heart disease, making it one of the deadliest diseases due to the uncontrolled proliferation of cell growth and the capability to spread to essential organs. Current treatment protocols are not always effective, are hurting, and generate chronic disorder for the victims, thus generating the imperative demand for putative medications that are health-friendly and reduce adverse negative impacts [1]. Every year, about 13.2 million people worldwide die of cancer, and an estimated 21.4 million additional cases will occur by 2030, which is also expected to overtake those of communicable diseases in the next decade [2, 3]. Despite ongoing efforts to increase the availability of platinum-based drugs such as cisplatin, carboplatin, lobaplatin, oxaliplatin, heptaplatin, nedaplatin, and miriplatinhydrate for chemotherapeutic treatment in recent decades [4, 5], cancer mortality rates have not yet decreased significantly owing to these medications' limited efficacy, nonselectivity, resistance, and high-risk profiles. Numerous intrinsic limitations arise because of covalent interactions with DNA. These limitations include myelosuppression, thrombocytopenia, neutropenia, nephrotoxicity, ototoxicity, and peripheral neuropathy [6, 7]. This has prompted scientists to generate DNA-targeting anticancer medications that are not reliant on platinum. The majority of noncovalent interactions involve intercalation among base pairs or trapping medicine in the major or minor groove of the deoxyribonucleic acid double helix. These interactions could also be a factor in DNA strand breaks that cause single- or double-strand breaks, which interfere with enzyme function, obstructing fundamental cell functions including replication, transcription, repair, and ultimately resulting in cell death. Consequently, creating safe and powerful anticancer medications with unique modalities of action is extremely intriguing in the realm of bioinorganic chemistry [8]. Transition metal complexes with heterocyclic ligands have received the focus of special attention among chemists across the world during the past four decades because of their structural versatility, ease of formation, and stability under various oxidative and reductive conditions [9]. These have all been essential in the evolution of the coordination chemistry of these complexes with excellent biological activity in many biological systems, as well as their use for a range of pharmacological, analytical, agronomic, commercial, and clinical purposes [10, 11]. Particularly, copper, cobalt, manganese, nickel, and zinc complexes have played an important role in medical imaging, modelling, herbicides, anticancer, antibacterial, antifungal, and other potential biological activities [12, 13].
Recently, a number of mixed ligand complexes possessing O, S, and N-donor binding sites of heterocyclic moieties like morpholine, pyrimidine derivatives incorporated with 2,2′-bipyridine/1,10-phenanthroline coligands have been extensively studied owing to their unusual electromagnetic characteristics, an eccentric structure, and a range of chemical kinetics, which results in their promise for fighting cancer and bacterial strains [14–16]. These ligands may also have an impact on the planarity, hydrophobicity, and coordination structure of the complexes, which could eventually increase their affinity for binding DNA and improve the ability of metal-based medications to treat cancer [17–19]. Generally, the mixed ligand complexes can bind efficiently with biomolecules through hydrophobic, exterior electrostatic, and major/minor groove interactions and cleave the DNA under physiological conditions. It further reveals that the complexes' geometry, size, hydrophobicity, planarity, charge, and ability to form H-bonds with the ligand may influence the binding modes, position, affinity, and even the cleavage action slightly or dramatically [20–22]. Additionally, they are more adaptable to fit into the binding sites of different enzymes and receptors in biological systems and encourage the production of ROS, which ultimately prompts apoptosis or necrosis by inducing DNA damage and mitochondrial dysfunction. Numerous research reports put forward that N-functionalized morpholine derivative transition metal complexes show diverse pharmacological activities and are utilized to treat cancer, inflammatory diseases, pain, migraine, asthma, microbial and viral diseases, etc. [23, 24]. Also, the ternary copper(II) mixed ligand complexes that are strongly bound to DNA via non-covalent interactions, have high conformational selectivity, and efficiently oxidatively cleave DNA. Moreover, they have been revealed to have excellent anticancer efficacy compared to cisplatin [25, 26].
Furthermore, the electronic configuration and molecular characteristics of the ground and excited states of biologically active compounds can also be visualized using computational measurements [27]. To realize the binding mechanisms, evaluate the longevity of the guest-host molecules, and clarify the types of interactions that contribute to the stability of the compounds, docking properties are designed to simulate the binding between biomacromolecules and chemical substances. A variety of forces, including ion contacts, sigma-hole interactions, H-bonds, π-π stacking interactions, and numerous other noncovalent interactions, often support the stability of chemical substances within a protein's active site [28]. Since morpholine scaffold ligands and their heterocyclic derivatives with their mixed ligand transition metal(II) complexes are appealing origin of novel chemical moieties for the creation and discovery of new drugs, our research team has also been engaged in the design and synthesis of much more effective and selective anticancer analogues by chemically altering lead compounds from medicinal plant extractions. The binding affinity of these complexes (1a-2a) has further been examined in this work utilizing molecular docking studies employing DFT optimized geometry for all substances on DNA/BSA/SARS-CoV-2 proteins. Additionally, our findings encourage additional research targeted at confirming the expected activity and aiding in the fight against existing or upcoming viral pandemics.
2. Experimental Section
2.1. Materials and Techniques
From the Sigma-Aldrich Company, we acquired the necessary chemicals and other reagents. The ligand (HL) and its mixed ligand complexes (1a-2a) were measured by a variety of analytical and spectroscopic studies. The complete data sets were summarized in our earlier reports [6, 28].
2.2. Assessment of DNA-/BSA-Binding Features
2.2.1. Assessment of DNA Nuclease Efficacy
The characteristics were examined of all substances along with DNA containing H2O2 and Tris-HCl buffer solution (pH: 7.4) [6, 28]. The tank solution's gel layer was lifted out after the experiment was finished and put in front of a UV transilluminator. Additionally, each band lane was scrutinized with control (DNA + H2O2) [29, 30].
2.2.2. Analysis of DNA Interaction Characteristics
The DNA-binding experiment was conducted by an electronic absorption spectrophotometer by raising the DNA concentration from zero to 50 μM to the given concentration of all samples (50 μM) in Tris-HCl buffer solution (pH: 7.4) at 25°C [6, 28, 31, 32].
2.2.3. Assessment of Thermal Denaturation Characteristics
Thermal denaturation characteristics were executed by a UV-visible spectrophotometer in a temperature-controlled sample container in both the presence and absence of the substances. In a Tris-HCl buffer solution with a pH of 7.4, all substances were incubated with CT-DNA in a 1 : 1 ratio. Temperature increases of two degrees Celsius per minute were applied to test substances in the range of 25 to 100°C, and the changes in absorbance at 260 nm were carefully scrutinized [33–35].
2.2.4. Assessment of DNA Affinity by Hydrodynamic Technique
The titrations were performed for all compounds including EB (control) at 20, 40, 60, 80, and 100 μM concentrations. In the Ostwald viscometer, these substances were also separately treated with the calf thymus deoxyribonucleic acid solution (100 μM) [6, 28, 36].
2.2.5. Assessment of DNA-/BSA-Binding Characteristics by Fluorometric Approach
The experiment was performed in the 200 to 800 nm region. This is supporting evidence for the complexes' manner of deoxyribonucleic acid binding. When DNA (200 μM) was present or absent, we carefully monitored the intensity variations between 610 nm and 510 nm during the initial emission and excitation of EB [6, 28, 37]. Similarly, emission titrations for BSA interaction with different concentrations between 2.5 μM and 25 μM for all substances were conducted in a Tris-HCl buffer solution (pH: 7.4) between the regions of 300 nm and 400 nm [38].
2.2.6. Förster's Theory-Based FRET Computation
As per Förster's theory, the critical distance of donor-acceptor molecule system can be estimated using FRET to assess the binding affinity between BSA and substance systems [39–41].
2.2.7. Analysis of DNA-Binding Characteristics Using the CV Method
The CV titration for free substances was conducted at 10 μM at 25°C in the presence of Tris-HCl buffer solution (pH: 7.4). While CT-DNA increases (0–10 μM) in each sample solution, a shift in potential, including variations in the peak currents of anodic and cathodic sides, has been monitored [6, 28, 42].
2.2.8. Assessment of BSA-Binding Characteristics by Absorption Titration
In the presence of Tris-HCl buffer solution, the UV-vis absorption titrations were done with a 25 μM concentration of BSA at room temperature. While the sample concentrations (0–25 μM) increased in the same BSA concentration solution, the change in the absorption band at 278 nm was continuously noted [6, 28, 43].
2.3. DFT and Molecular Modelling Properties
All compounds were fully optimized with the help of the hybrid B3LYP functional as accomplished in the Gaussian 09 package [44]. To demonstrate the global and local reactivity of all substances, the FMO hypothesis [45] and electrostatic potentials within molecules [46] were studied. Using the B3LYP-optimized structures of each substance, docking computations were also carried out. The Autodock Vina software was used for input structure preparation and calculations [47], and the visualization was performed by Discovery Studio [48].
2.4. UV-Vis Absorption Titration for In Vitro Antioxidant Assay
All samples were evaluated for their scavenging ability with the help of UV-visible spectrophotometer at different concentrations of 40, 80, 120, 160, 200, and 240 μM [6, 28]. While performing the antioxidant properties for the DPPH, hydroxyl, superoxide, and nitric oxide radical scavenging, the absorbance at 517, 230, 590, and 546 nm, respectively, was closely observed. In addition, the observed IC50 values of all samples were compared with ascorbic acid [49–51].
2.5. Assessment of in Vitro Antimicrobial Properties
In-vitro antimicrobial properties were evaluated for all samples by the agar disc diffusion method towards different fungal and bacterial strains [6, 28, 52–54]. Additionally, the reported inhibition zone values were comparatively analyzed with the standard antifungal drugs ketoconazole and amphotericin B as well as the standard antibiotic medications streptomycin and amikacin.
2.6. MTT Cell Viability Assay for Anticancer Characteristics
All substances towards the A549, HepG2, MCF-7, and NHDF cell lines were evaluated by using the MTT approach [6, 28]. The collected data were utilized to compute the IC50 value and contrast it with the gold standard cisplatin anticancer medication [55].
3. Results and Discussions
It is observed that all compounds are highly pigmented and faintly hygroscopic and have high solubility in CH3OH, C2H5OH, CHCl3, and DMSO. The evaluated analytical results and structural characteristics are presented in the electronic supplementary information file (3a) (Figures S1–S14 and Tables S1–S13).
3.1. Synthetic Process and Properties
The evaluated analytical results, structural characteristics, as well as crystallographic data for ligand (HL) and its mixed ligand complexes (1a-2a) (Scheme 1) are presented in the electronic supplementary information file (3a) (Tables S1–S13 and Figures S1–S14).
Scheme 1.

The suggested geometry of complexes (1a-2a) [MII(L)2(bpy)].
3.2. DNA/BSA-Binding Properties
In general, it is recommended to restrict the growth of tumor cells by preventing the reproduction of DNA that has been damaged or broken due to binding or cleavage mechanisms. It deals with the static mode of binding between test compounds and BSA.
3.2.1. Analysis of DNA Cleavage Characteristics
Using the gel electrophoresis method, the DNA nuclease properties for all samples were assessed under the H2O2 environment. The examined DNA nuclease efficacy for all complexes (1a-2a) was contrasted with free ligand (HL) and CT-DNA alone. The raw data for electrophoretic gels and blots were also enclosed in the electronic supplementary file (Figure S15). In Figure 1, no substantial nuclease activity can be seen in the control (lane 1; DNA + H2O2) even after a lot of time has passed and the free ligand (HL) (lane: 2) was monitored as immobile in an H2O2 environment. Lane: 3 demonstrates that the mixed ligand complex (1a) demonstrates complete DNA cleavage. Similarly, lane: 4 reveals that complex (2a) partially cleaves DNA. In addition, the performance of the band reduction in the lanes was revealed in the agarose gel (Figure 1). Furthermore, ROS include O2•−, H2O2, OH•, ROOH, ROO•, HOCl, and 1O2 (singlet oxygen) and ozone (O3), which play essential roles in living systems. Consequently, it has commonly been acknowledged that ROS plays a dual physiological role in controlling a variety of illnesses as well as cellular homeostasis (self-regulating processes such as thermoregulation, blood glucose regulation, calcium/potassium homeostasis, and osmoregulation) [56]. Numerous oxidases, peroxidases, lipoxygenases, dehydrogenases, cytochrome P450, and other enzymes have been demonstrated to be able to produce ROS. Additionally, it is widely known that NADPH oxidase generates reactive oxygen species as a portion of its antibacterial effect on phagocytic cells. Nevertheless, these types of enzymes seem to be present in a variety of other cells as well and may have significant signalling pathway functions. When noncarcinogenic toxicity events occur, ROS has the ability to alter cell function as well as affect the genes of cancer at several levels. OH• can attack DNA, proteins, and lipids due to its high reactivity among ROS. The hydroxyl radical is a key participant in free radical-mediated hazardous reactions because of its great reactivity. The free radicals are also essential for the redox regulation of many cellular signalling pathways and proper cellular functions. Superoxide (O2•−) was believed to be a typical cellular metabolite. It was then realized that more dangerous radicals may potentially be produced via the Haber–Weiss process. The combination of O2•− and H2O2 may produce a powerfully reactive OH• radical [57]. Moreover, as per the Fenton/Haber–Weiss mechanism, it is suggested that it is capable of vigorous nucleolytic cleavage of chemical substances in an oxidizing agent (H2O2) environment [58]. According to this mechanism, the complexes acted as excellent vehicles for the creation of diffusible •OH free radicals from hydrogen peroxide. Additionally, •OH free radicals abstract the H-atom from the sugar fragment of the deoxyribonucleic acid base pair to generate sugar radicals. Concerning the location of the hydrogen atom, it rapidly induces the hydrolytic nuclease activity at the sugar-phosphate backbone [59]. The rapid migration of deoxyribonucleic acid can lead to the open circular form's transformation into a linear form. Meanwhile, EDTA facilitates the generation of highly reactive diffusible •OH and anions via the Fenton or Haber–Weiss processes and further prevents metal ions from binding with DNA via intercalation due to the generation of an EDTA-metal system. The diffusible hydroxyl free radicals also stimulate the abstraction of the H-atom from the sugar part of the deoxyribonucleic acid base pair to generate sugar radicals along with the formation of an adduct with nucleobases. Therefore, DNA cleavage occurs owing to the assault of a diffusible •OH on deoxyribonucleic acid base pairs in the metal complex environment. The complex serves as an effective catalyst to produce •OH from hydrogen peroxide according to the Fenton mechanism [60]. If metal complexes have strong hydrogen abstraction ability, they exhibit more DNA cleavage properties. Conversely, if metal complexes have weak hydrogen abstraction ability, they reveal less DNA cleavage properties (Figure S16).
Figure 1.

Ethidium bromide displacement assay: gel electrophoresis demonstrates the DNA cleavage property in the H2O2 environment for the following substances: Lane: 1 DNA alone + H2O2; lane: 2 ligand (HL) + DNA + H2O2; lane: 3 complex (1a) + DNA + H2O2; lane: 4 complex (2a) + DNA + H2O2. Raw data for electrophoretic gels and blots were also enclosed in the electronic supplementary information file.
3.2.2. Assessment of DNA-Binding Characteristics Using a UV-Visible Spectrophotometer
UV-visible absorption titration is the main imperative approach to observing the tendency of test substances to bind with deoxyribonucleic acid. The approach is commonly utilized to evaluate the potency and mode of binding of the test substances with deoxyribonucleic acid. The essential information regarding conformational change, the effectiveness of the DNA-substance binding, and the negatively charged phosphate on deoxyribonucleic acid are neutralized via exterior contact, and intercalation through interactions between π-π stacks is presented by DNA binding towards metal complexes. All complexes (1a-2a), including the free ligand (HL), were measured in the presence and absence of deoxyribonucleic acid by ultraviolet-visible spectrophotometric titrations under Tris-HCl buffer solution (pH: 7.4) at room temperature (Figure 2). The results are also included in Table 1. In this case, all samples were exposed to two prominent electronic absorption bands at 260 nm and 336–343 nm, consequent to the π-π∗ transition of the phenyl chromophore and MLCT, respectively. While the amount of DNA concentration rises in each test compound, the interaction of the chemical substance with DNA base pairs generates noticeable alterations in the intraligand charge transfer bands' strength and wavelength. The hypochromic shift of all compounds was observed in the range of 37.13–52.18% with 4–7 nm red shifts, which occurred due to a diminution in the π-π∗ transition energy and the half-packed electrons of bonding orbitals. In contrast, it would be possible for electrostatic interaction if the complex-DNA adduct exhibits hyperchromism with a hypsochromic shift [61, 62]. The Kb findings were measured for all samples by the Wolfe–Shimmer equations (2) and (3) by methods I and II, respectively, from the findings of the slope divided by the intercept in the linear regression plots of [DNA]/(ɛa − ɛf) vs. [DNA] and the intercept divided by intercept slope in the linear regression plot of (ɛb − ɛf)/(ɛa − ɛf) vs. 1/[DNA] M−1 (Figure S17), and the Kb results for each sample were in the subsequent sequence: (1a) > (2a) > (HL). Moreover, the observed overall ∆Gb° values in all cases were found in the range of –21.55 to –26.04 kJ·mol−1 (Table 1), which also indicates that the compounds spontaneously intercalate to DNA. However, complex (1a) exhibited excellent binding potency compared to others. It is concluded that the morpholine linked ligand's coplanarity and 2,2′-bipyridine aromatic system complexation with the metal center, which promotes the complex to infiltrate DNA base pairs smoothly, and large aromatic systems may also assist the complex to penetrate the phosphate backbone's core deeply, and those substances may permit the complex to freely penetrate deep into the deoxyribonucleic acid double helix. In addition, the observed isosbestic points are found at 256 and 276 nm for free ligand and complexes (1a-2a), respectively. It also suggests that DNA and complexes establish a dynamic equilibrium and further conclude that complexes (1a-2a) spontaneously intercalate into DNA. The Wolfe–Shimmer (1 and 2) [63], Benesi–Hildebrand (3 and 4) [64], and Sakthi–Krause equations (5 and 6) were supported to evaluate Kb results for all samples (Table 1). The Benesi–Hildebrand binding constant (Kb) values were measured using equations (3) and (4) by methods I and II, respectively, from the intercept divided by slope in the linear regression plot of [1/(Ax − A0)] vs. {1/[DNA]} M−1 and the intercept divided by slope in the linear regression plot of [(Amax − A0)/(Ax − A0)] vs. {1/[DNA]} M−1 (Figure S18). The Kb values were estimated using Sakthi–Krause equations (5) and (6) by methods I and II, respectively, with the intercept divided by slope in the linear regression plot of [(A/(A0 − A)] vs. {1/[DNA]} M−1 (Figure S19) and the antilogarithm value of the intercept in the linear regression plot of log {1/[DNA]} vs. log [(A/(A0 − A)]M−1 (Figure S20). In addition, the Van't Hoff equation (7) was supported to obtain the ∆Gb° values for DNA interaction, and equation (8) was supported to measure the % of chromicity for all substances (Table 1). The overall measured Kb findings were in the subsequent sequence: (1a) > (2a) > (HL). In these cases, the observed ∆Gb° values were reported in the range of −19.91 to −29.13, −21.55 to −26.04 and −22.50 to –25.22 kJ·mol−1, respectively (Table 1). In these cases, the complex (1a) had the highest DNA-binding efficacy among all binding results. The DNA cleavage, emission, hydrodynamic, and CV measurements all support the preceding observation.
Figure 2.

Increasing concentrations of CT-DNA were present while the ligand (HL) and its complexes (1a-2a) were measured for their absorption spectra in a Tris-HCl buffer solution at 25°C. Arrows depict the changes in absorbance that occur as CT-DNA concentration is increased, and another arrow with isosbestic points denotes that equilibrium between DNA and complexes has been achieved.
Table 1.
UV-visible spectral DNA-binding parameters for all substances.
| Compounds | λ max (nm) | Δλ nm (% H) | K b × 104 M−1 | ∆Gb° (kJ·mol−1) | ||||
|---|---|---|---|---|---|---|---|---|
| Free (bound) | WS-I | BH-I | SK-I | WS-I | BH-I | SK-I | ||
| (WS-II) | (BH-II) | (SK-II) | (WS-II) | (BH-II) | (SK-II) | |||
| (HL) | 336 (340) | 04 (37.13) | 1.5169 (1.5480) | 0.6000 (1.9515) | 0.8775 (1.7216) | −23.85 (−23.90) | −21.55 (−24.48) | −22.50 (−24.18) |
| (1a) | 336 (343) | 07 (52.18) | 1.9000 (2.1886) | 3.6777 (2.4500) | 1.7093 (2.6303) | −24.114 (−24.76) | −26.04 (−25.04) | −24.15 (−25.22) |
| (2a) | 337 (342) | 05 (43.15) | 1.8287 (1.7209) | 2.2115 (2.2605) | 1.4286 (2.0118) | −24.315 (−24.16) | −24.79 (−24.84) | −23.70 (−24.55) |
Hypochromism % H = (ɛb − ɛf)/ɛf × 100; ɛf and ɛb are denoted as extinction coefficient of substance alone and extinction coefficient of the completely interacted with deoxyribonucleic acid, WS is represented as Wolfe-shimmer, BH is denoted as Benesi–Hildebrand methods (BH-I and II), SK represented as Sakthi–Krause methods (SK-I and II), ΔGb° = –RT, In Kb, Kb = Intrinsic DNA-binding constant evaluated from the electronic absorption spectral titration, R is a universal gas constant = 1.987 cal·K−1·mol−1 (or) 8.314 J·K−1·mol−1, T = 298 K, Error limit ± 2.5% (P < 0.025).
| (1) |
| (2) |
| (3) |
where
| (4) |
| (5) |
| (6) |
| (7) |
| (8) |
where ɛa is represented as the apparent absorption coefficient value for the MLCT band at a specific concentration of deoxyribonucleic acid and evaluated from Abs/[complex]. ɛf and ɛb are absorption coefficient values for the chemical substance alone and fully interacted with deoxyribonucleic acid, respectively. ∆Amax = (Amax − A0); ∆A = (Ax − A0), where A0, Ax, and Amax are denoted as the absorbance of chemical substance alone, the middle form, and the completely interacted form with deoxyribonucleic acid, respectively.
3.2.3. Assessment of Thermal Denaturation Characteristics
DNA denaturation contributes to the root cause of several chronic diseases, hereditary disorders, and a reduction in the ability of DNA repair to work properly. The biothermodynamic properties were further supported to determine the ability of stabilization of the double-standard DNA, and it offers details on the structural alterations, the degree of the DNA-compound system, the external binding-mediated neutralization of phosphate charges on DNA, and the stacking interactions, all of which work together to raise the DNA's melting point [65]. Moreover, in this case, it is observed that complex-DNA adducts have a higher melting temperature compared to free DNA. Complex-bound deoxyribonucleic acid is more challenging to melt compared to deoxyribonucleic acid alone because it is involved in powerful intercalation binding to DNA. The Van't Hoff (9) and Gibbs Helmholtz equations (10) were supportive in evaluating the biothermodynamic parameters, which are enclosed in Table 2. The evaluated Tm values of the DNA-compound adduct in all cases were obtained in the following sequences: 80°C (1a) > 78°C (2a) > 74°C (HL) > 68°C (DNA alone) ± 2°C and the value of ΔTm°C: 12 (1a) > 10 (2a) > 6 (HL). If ΔTm > 10°C, the described biothermodynamic properties are also advantageous for the intercalation mode of the mechanism between the test compounds and deoxyribonucleic acid, except for the free ligand. Conversely, the result reveals the electrostatic or groove binding mode when ΔTm < 10°C [66, 67]. Additionally, the complex-DNA adduct's reported negative binding free energy was lower compared to the sum of the ligand-DNA binding energies, which attributes the complexes (1a-2a) spontaneously intercalating DNA. DNA thermal denaturation profile and its derivative melting curve for thermal denaturation at 260 nm in the absence and presence of test compounds are shown in Figures 3 and 4. The influencing factors between test compounds and DNA mostly depend on the type of interaction mode. Because of the driving forces, H-bonds, weak Van der Waals forces, and electrostatic modes of binding all occur while the enthalpy is favourable. Hydrophobic forces induce binding while entropy is favourable; on the other hand, the loss of structural degrees of freedom leads to undesirable entropic changes. As per Ross and colleagues, the findings for ΔH° and ΔS° can alternatively be derived in the following favourable sequence. If ΔH° > 0 and ΔS° > 0, this attributes intercalation due to hydrophobic forces of attraction. If ∆H° < 0 and ΔS° < 0, this involves weak Van der Waals forces of attraction and H-bonding interactions. On the other hand, if ΔH° < 0 (or), ΔH°≈0 and ∆S° > 0, this indicates the electrostatic mode of binding possible between DNA and compounds [28, 68]. The measured values for all samples were exposed to the favourable sequence ΔH° < 0 and ΔS° < 0, which is assumed to be due to weak van der Waals forces of attraction and H-bonding between DNA and chemical substances. However, they lose the ability to rotate and translate, interfere with counter ions and hydrophobic forces in compound-DNA adduct, and may result in exothermically active negative signals of ΔS° and ΔH°. Furthermore, it is widely acknowledged that the hydration and generation of the compound-deoxyribonucleic acid adduct system via the counter ion liberating mechanism are highly dependent on the hydrophobic forces of attraction. As a result, higher negative results of ΔH° and ΔS° for all substances that interacted with DNA were observed in the experiment [69]. According to the Ross and Subramanian mechanism for protein/DNA-complex interactions, it clearly reveals that the complexation of the metal center with the morpholine fused primary aromatic and 2,2′-bipyridine secondary aromatic planar systems stimulates the silky infiltration of the complex within deoxyribonucleic acid base pairs owing to π-π stacking interactions. Additionally, in the complex-DNA adduct, a number of noncovalent molecular interactions, including dipole-dipole interaction, weak van der Waals forces of attraction, formation of H-bonding, and electrostatic forces of attraction, may be present while the complex is positively charged and engages in stacking interaction as per Manning and Record's polyelectrolyte hypothesis [70].
Table 2.
UV-vis absorption spectra with biothermodynamic binding properties for all substances with CT-DNA.
| Compounds | T m °C (K) | ΔTm °C | Binding constant | Binding constant | ΔH° | ΔS° | ΔG° |
|---|---|---|---|---|---|---|---|
| K r at 298 K (M–1) | K m at Tm K (M–1) | (kcal mol–1) | (cal mol–1) | (kcal mol–1) | |||
| (HL) | 74 (347) | 6 | 1.5169 × 10⁴ | 1.4625 × 10³ | –9.8083 | –13.7851 | –5.0249 |
| (1a) | 80 (353) | 12 | 1.9000 × 10⁴ | 2.3722 × 10³ | –7.9071 | –6.9577 | –5.4511 |
| (2a) | 78 (351) | 10 | 1.8287 × 10⁴ | 2.1862 × 10³ | –8.3292 | –8.4501 | –5.3632 |
Figure 3.

DNA thermal denaturation profile at 260 nm in the absence and presence of compounds in 5 mM Tris-HCl/50 mM NaCl buffer pH = 7.2, [DNA]/[Complex] = 1 (R).
Figure 4.

Derivative melting curve for DNA thermal denaturation at 260 nm in the absence and presence of compounds in 5 mM Tris-HCl/50 mM NaCl buffer pH = 7.2, [DNA]/[Complex] = 1 (R).
CT-DNA melting temperature (Tm) = 68°C; ΔTm is denoted as melting temperature changes between compounds and free DNA; ln [K2/K1]=−ΔH°/R[1/T2 − 1/T1], and enthalpy change (ΔH°) = R. [TmTr/Tm − Tr] ln [Km/Kr], T1 = Tr ⟶ 298 K, T2 = Tm ⟶ DNA melting temperature of compounds, universal gas constant (R) = 1.987 cal·K−1·mol−1 (or) 8.314 J·K−1·mol−1; Gibb's free energy (ΔG°) = −R. Tm. lnKm; entropy change (ΔS°) = [∆H° − ∆G°/Tm];
| (9) |
Gibb's free energy is as follows:
| (10) |
3.2.4. Assessment of DNA-Binding Affinity Using Viscometric Techniques
Hydrodynamic findings can be utilized to assess the alteration of DNA length and afford details on the binding tendency between small molecules and biomolecules. As a result of their sensitivity to DNA contour length changes, which implies that the average distance between each monomer (cl = 0.338 nm/bp for B-form DNA), the DNA binding properties of all test compounds were further validated by this method. According to the Lerman concept, interactions between small molecules and deoxyribonucleic acid via covalent and noncovalent bindings are often possible. When a chemical substance interacts with the deoxyribonucleic acid double helix, the contour length of DNA increases via intercalation and leads to an increase in the absolute viscosity. Meanwhile, if DNA viscosity is not affected during interactions, which leads to the responsible for the major/minor groove binding due to H-bond/Van der Waals interactions, electrostatic, partial, or nonclassical interaction modes. Therefore, analyzing the binding modes provides additional support for the findings as well as a crucial aspect of the conventional intercalation concept. In this case, it was observed that the absolute viscosity increased consistently along with the concentration of each substance at the fixed DNA concentration. The DNA must extend to facilitate the binding of ligands, which causes a considerable rise in DNA viscosity while small molecules intercalate into the DNA helix [71]. According to equation (12), an increase in relative viscosity denotes an intercalation-induced lengthening of the deoxyribonucleic acid base pair. While adhering to the principle of excluding the nearest neighbors, intercalation entails inserting a planar molecule into a DNA base pair without rupturing the hydrogen bonds that hold the base pairs together. This causes a diminution in the DNA helical twist and an extension of the DNA. Moreover, a molecule can be presumed to bind to deoxyribonucleic acid by intercalation between base pairs if it causes lengthening and unwinding of the deoxyribonucleic acid base pairs [72]. In this case, the relative viscosity of DNA gradually increases, while the concentration of deoxyribonucleic acid increases. Moreover, the affinity interactions and their slope values were observed from the relative specific viscosity (η⁄η0)1/3 plotted straight line contrasting [Compound]/[DNA], and absolute specific viscosity of deoxyribonucleic acid in the absence or presence of samples was evaluated using equation (12) (Table 3). In the experiment, it was clearly noted that the slope values for all samples also increased due to the rising binding affinity. The evaluated slope findings were in the subsequent sequence: (EB) 1.215 > (1a) 0.915 > (2a) 0.630 > (HL) 0.490 (Figure S21 and Table 3). However, complex (1a) exhibited superior binding affinity among the others and was substantially smaller than EB. Due to the existence of the 2,2′-bipyridine and morpholine-fused aromatic planar systems, compounds can interact with deoxyribonucleic acid robustly via intercalation. The outcomes were excellent in accordance with the observed outcomes of absorption spectral properties.
| (11) |
where η and η0 are represented as specific viscosity of DNA in the presence complex and specific viscosity of DNA alone, and t0, tDNA, and tcomplex are represented as the average flow time of the Tris-HCl buffer solution, the average flow time of DNA alone solution, and the average flow time of DNA interacted with the samples, respectively. Error limit is ±2.5% (P < 0.025).
Table 3.
Relative specific viscosity versus [complex]/[DNA].
| Compounds | Binding ratio (R) = [complex]/[DNA] | ||||||
|---|---|---|---|---|---|---|---|
| 0.2 | 0.4 | 0.6 | 0.8 | 1.0 | Slope | R 2 | |
| Relative specific viscosity (η/η0)1/3 | |||||||
| EB (control) | 1.01 | 1.35 | 1.63 | 1.82 | 1.99 | 1.215 | 0.92002 |
| (HL) | 0.61 | 0.67 | 0.75 | 0.85 | 1.01 | 0.490 | 0.97018 |
| (1a) | 0.88 | 1.11 | 1.22 | 1.38 | 1.66 | 0.915 | 0.90375 |
| (2a) | 0.74 | 0.81 | 0.87 | 1.03 | 1.26 | 0.630 | 0.96043 |
3.2.5. Assessment of DNA-/BSA-Binding Characteristics Using Emission Titration
Emission titration is a more sensitive approach to examining the binding tendency between chemical substances and biomolecules. The emission measurements are extensively supported to scrutinize the interacting modes between compounds and deoxyribonucleic acid. In the presence of deoxyribonucleic acid (240 μM) in a Tris-HCl buffer solution (pH: 7.2) at room temperature, none of the test compounds emitted fluorescence. The titrations were also executed with the EB molecule, which is also a comparatively low fluorescence emission in Tris-HCl buffer solution (pH: 7.2) in the free state. Owing to the effective intercalation of EB with CT-DNA, the EB fluorophore displays extremely bright fluorescence at about 610 nm [73]. In the investigation, the addition of sample concentrations (0–240 μM) to the solution of DNA-EB results in a notable reduction in the emission intensity at 610 nm (Figure 5 and Table 4). As a result of intense intercalation, the complexes displace the EB in the DNA-EB adduct, causing the emission intensity to drop. The photoelectron shift from the DNA's guanine base to the excited states may be the cause of the frequency of quenching in the emission of chemicals by DNA. Therefore, EB can be utilized as a fluorescent probing agent in the competitive binding experiment.
Figure 5.

Fluorescence quenching curve of ethidium bromide bound DNA in the presence of ligand (HL) and complexes (1a-2a).
Table 4.
Determination of Kb and n values for all substances with DNA/BSA at pH of 7.4 using spectrofluorometer.
| Compounds | DNA-/BSA-binding constants | |||||||||
|---|---|---|---|---|---|---|---|---|---|---|
| SV methods for determining DNA-binding characteristics (SV methods for determining BSA-binding characteristics)∗ | LWB method KLB × 104 M−1 | Scatchard analysis | K app × 107 M−1 | |||||||
| Method I | Method II | |||||||||
| K q × 1012 M−1s−1 | K SV × 104 M−1 | K ass × 104 M−1 | n | ∆Gb° (kJM−1) | P | K SA × 104 M−1 | n | |||
| (HL) | 1.1636 (2.639) | 1.1636 (2.639) | 0.9606 (1.062) | 0.973 (0.926) | −22.720 (−23.0) | 0.0900 (0.464) | 0.6985 | 2.3194 | 1.096 | 0.5829 |
| (1a) | 5.2474 (8.691) | 5.2474 (8.691) | 5.0564 (8.734) | 1.168 (1.059) | −26.835 (−28.2) | 0.2000 (0.252) | 1.8846 | 3.3151 | 1.033 | 0.9894 |
| (2a) | 3.2694 (4.805) | 3.2694 (4.805) | 1.7368 (5.291) | 1.055 (1.041) | −24.187 (−26.9) | 0.1832 (0.348) | 1.5630 | 3.0190 | 0.971 | 0.6569 |
K SV is denoted as Stern–Volmer binding constant; Kass is represented as association binding constant; Kapp is represented as apparent binding constant, Kapp=KEB[EB]/[compound]=500/[compound], KEB = 107 M−1 at the concentration of 50 μM EB; Gibb's free energy change ΔGb°=–RT lnKass; Kq is represented as bimolecular quenching rate constant/Stern–Volmer dynamic quenching rate constant (Kq=KSV/τ0), average life time of the biomolecular quenching in the absence of a quencher (τ0) = 10−8 S; Gibb's free energy change ΔGb°=–RT lnKass (where R = 8.3144 KJ·mol−1, T = 298 K); KLB is represented as Lineweaver–Burk (LWB) binding constant; KSA is represented as Scatchard association binding constant; Kapp is denoted as apparent binding constant; n is the number of binding sites; P is a ratio of fluorescence quantum efficiency of DNA bound and free complex (P=ɸb/ɸf), which is obtained as intercept from plot F/F0 vs. 1/[DNA], Error limit is ± 2.5% (P < 0.025).
| (12) |
where Fcorr and Fobs are represented as the IFE-corrected fluorescence and observed (uncorrected) emission intensities, respectively. dex and dem are denoted as the cuvette path lengths in the excitation and emission directions, respectively. Aex and Aem are represented as the change in absorbance at the excitation and fluorescence wavelengths, respectively.
| (13) |
where [Q] is represented as the sample concentration, the emission intensities F0 and F of DNA/BSA in the absence and presence of the quencher (sample), respectively.
| (14) |
| (15) |
| (16) |
| (17) |
where γ = [(F0 − F)/F0], and CF is denoted as the concentration of sample alone.
Additionally, the intensity of bovine serum albumin was monitored at 350 nm (λex = 278 nm) during fluorescence titration. When increasing the sample concentrations, the BSA intensity diminishes dramatically owing to static quenching in the ground state. It is noted that the fluorophores of BSA are not clearly exposed to a shift in polarity [74–76]. The fluorescence spectra of bovine serum albumin with a variety of concentrations of all samples were estimated, and they are displayed in Figure S26. Additionally, the Stern–Volmer equations (12)-(13) were employed to analyze the data (Figure S27 and Table 4). Additionally, the observed kq values for DNA and BSA binding were found in the range of 1.1636–5.2474 × 10¹² and 2.6390–8.6910 × 10¹² mol−1·s−1, respectively. They are also much exceeded compared to the collision quenching constant value (2.0 × 10¹⁰ mol−1·s−1). Therefore, it is assumed that the static quenching process was brought on by adduct construction between the compounds and bovine serum albumin rather than a dynamic collision. However, fluorescence spectroscopy is generally plagued by the inner filter effect (IFE), which disturbs the spectral analysis in particular. The energizing ray is attenuated due to the highly concentrated solution sample. As a result, strong fluorescence is only seen on surfaces facing the excitation beam. The fluorescence intensity is reduced as a result of an inner filter effect generated by some chemicals' absorption of the excitation or emission wavelength in the UV province. The observed values of the absorption wavelength of ligand (HL) and mixed ligand complexes (1a-2a) in the range of 335–337 nm, the bovine serum albumin excitation wavelength of 278 nm, and emission wavelength of 350 nm were used to assess the effect of IFE in this approach. Equation (12) is employed to solve IFE in this instance as well (Table 4) [77, 78].
The fluorescence emission intensities of ethidium bromide interacted with deoxyribonucleic acid at 610 nm, and those of bovine serum albumin at 350 nm exhibited a distinctly reducing movement with increasing concentrations of the test compounds after resolving the inner filter effect (IFE). Additionally, no emission spectrum shifting was seen following the BSA-complex adduct, indicating that ground state BSA-compound systems formed owing to a static quenching mechanism. It is also observed that BSA might interact with complexes and that the polarity of BSA's fluorescence did not vary noticeably with complex titration. The linear regression correlation coefficient (R2) values for all substances further confirmed that there is no found inner filter effect due to these values are greater than 0.95. Moreover, the following Stern–Volmer equations (13)–(15) were employed to determine the KSV, Kq, and n values (Table 4). The KSV findings were measured from the slope to intercept ratio of the linear regression plot of F0/F vs. [Q] by the SV method I (Figure S22). Equation (14) is employed to evaluate the “n” and Kass values [42]. Similarly, Kapp (apparent binding constant) values for all samples were estimated using equation (15) (Table 4). The values of Kass and n were determined from the antilogarithm of the intercept and slope findings, respectively, in the linear regression plot of log (F0 − F)/F vs. log [Q] by SV method II with the help of equation (14) (Figure S22 and Table 4). ε findings for all substances were observed from the negative slope in the linear regression plot of emission intensity vs. [compound] with the help of the Beer–Lambert law equation (A = εcl) (Figure S25), and equation (15) is supported to evaluate Kapp value using KEB = 107 M−1 at 50 μM concentration and measured sample concentrations for all cases using the Beer–Lambert law equation. The Lineweaver–Burk (16) and Scatchard analysis (17) are utilized to expand the observations and validate the binding affinities [79, 80], and the observations are also compared with the Stern–Volmer method (Table 4). Equation (16) is used to determine the KLB from the finding of intercept divided by slope in the linear regression plot of 1/(F0 − F) vs. 1/[Q] (Figure S22 and Table 4). The linear regression plot of (γ/CF) vs. γ is employed to support equation (17), which was used to determine the values of KSA and n from the negative sign of the slope and the finding of intercept divided by the slope, respectively (Figure S23), and the overall measured DNA/BSA Kb findings in all cases were in the subsequent sequence: (1a) > (2a) > (HL). The “n” findings for deoxyribonucleic acid and bovine serum albumin binding acquired from the Stern–Volmer equation (14) were found in the range of 0.9733–1.1682 and 0.9260–1.0590 for all compounds, respectively. Moreover, the obtained n values for DNA binding by the Scatchard equation (17) were in the range of 0.9711–1.0966, and these values are nearly equal to one (Table 4). In these cases, complex (1a) has shown a better binding affinity among others. Consequently, it is proposed that the complexes contain both a 2,2′-bipyridine ring planar system and an aromatic ring system linked to morpholine. They can effectively interact with deoxyribonucleic acid via intercalation. Additionally, the values of the fluorescence quantum efficiency (P) ratio for the DNA-compound and BSA-compound adducts were 0.0900–0.2000 and 0.252–0.564, respectively. The findings were measured from the intercept in the linear regression plot of F/F0 vs. 1/[DNA] and 1/[BSA], respectively (Figures S24 and S28 and Table 4). The findings and those from the viscosity, electrochemical titration, and UV-vis spectral properties were in good accordance with the outcomes.
3.2.6. Förster's Theory-Based FRET Computation
FRET can be executed to distinguish the relative orientation and closeness of fluorophores [81]. The process happens when there is a large overlapping of the acceptor's (compound) absorption spectrum with the donor's (BSA) emission spectrum. Fluorescence is quenched owing to energy being transmitted from the excited state of bovine serum albumin to substances (HL)/(1a − 2a). As a result of the FRET analysis, their observed “r” findings were found in the range of 2.1851–2.7127 nm (Table 5 and Figure 6). It also shows that there is a high probability that energy will be transferred from bovine serum albumin to the compounds. The following conditions have a major impact on the FRET's effectiveness: (i) the distance (r) should be within the prescribed range from 2 to 8 nm for energy transfer, (ii) there is a large overlapping of the emission spectrum of biomolecules (donors) with the electronic absorption spectrum of acceptors (substances), and (iii) the bovine serum albumin and substance transition dipoles are oriented correctly. Bovine serum albumin transmits excitation energy to a compound during FRET without emitting a photon from the previous molecule system. It is a mechanistic pathway between several electronic excited states of molecules that depends on distance. Equation (18) can be employed to estimate the efficiency of energy transfer (E) in accordance with the FRET approach and the Förster radius (R0) for the donor-acceptor system, which is evaluated from equation (19) (Table 5). The relative orientation factor of the dipoles (K2) is associated with the geometry of the BSA and the complex of the dipoles, the value for random orientation (K2 = 2/3) like in a fluid solution. In short, the K2 values were found in the range from 0 to 4, and energy can be transferred from the BSA to the compound when electrons are transferred between the two molecules. For parallel transition dipoles that are aligned, K2 is equal to 4, which denotes the maximal energy transfer, and when the orientation of the dipoles is perpendicular to one another, K2 is equal to 0, which denotes very weak energy transfer. When the relative orientation of the dipoles is at random, K2 is attained to be equal to 2/3. n is denoted as the average refracted index of the medium, Φ is represented as the fluorescence quantum yield of the BSA, and equation (20) is helpful to measure the normalized spectral overlap integral (J) for the overlapping emission spectrum of the BSA with the electronic absorption spectrum of the compound (Table 5). The following variables for the complex-BSA interaction are determined using equations (18–23), n = 1.36, Φ = 0.15, E = 0.3462–0.5769, J = 0.5425–0.8215 × 10⁻¹⁴ cm3·L·mol–1, R0 = 2.2770–2.4400 nm, r = 2.1851–2.7127 nm, kET = 5.2957–13.6340 J/s, and B = 4642.53–5339.79 mol−1·cm−1 (Table 5). The observed findings of R0 and r between BSA, Trp213, and the interacted compound were substantially smaller than 8 nm, and their relationships are found in the following sequence: 0.5R0 (1.1384–1.2200) < r (2.1851–2.7127) < 1.5R0 (3.4155–3.6600). This implied that there was a sturdy possibility that the test compound and BSA exchanged nonradiative dipole-dipole energy, which agreed with a static quenching mechanism. This result proved that the binding adhered to Förster's energy transfer theory's conditions. Φ is denoted as the quantum yield, which is ascribed as the dimensionally invariant ratio of emission and absorption photons by a fluorophore, and it serves as a tool for estimating fluorescence emission's effectiveness in correlation to all other channels of relaxation. In addition, τ is denoted as the lifetime of fluorescence emission of the biomolecule and is described as the inverse of the entire degradation rate τ = 1/(kr + knr). The radiative lifetime of the fluorophore is represented as τ0 = 1/kr. The values of τ and Φ are associated with equation (21) (Table 5). Quenching occurs while a BSA's ground or excited states come into contact with a compound in the solution. There is also a diminishing in the fluorescence emission intensity. They are divided into two main categories of dynamic and static quenching. While an excited state BSA binds to the substance during a dynamic or collisional quenching mechanism, the BSA is radiationlessly deactivated to the ground state. Therefore, the concentration of the quenching compounds affects the dynamic quenching. The τ and Φ values for BSA diminished with raising the compound concentration. Conversely, static quenching minimises emission without changing the excited state τ or Φ, and quenching can be divided into two main categories based on the excited-state lifetime of the fluorophore. Additionally, the term kq [Q] is included in the denominator in equation (21), and the Φ value for the bovine serum albumin-compound adducts system is measured by equation (21). FRET requires an interaction between the emission and the absorption transition dipole moments of the bovine serum albumin and test compound, respectively, due to the nonradiative transfer of excitation energy from a fluorophore to a chromophore [82]. kET is denoted as the rate of energy transfer, which depends on not only the spectrum overlapping of the emission of the BSA and the absorbance of the compound but also the Φ value of BSA, K2, and r etc. The kET values for all substances were estimated by equation (22) [83]. Additionally, the brightness of BSA depends on the capability of a test compound to absorb light and the Φ value, which is calculated by the expression (23) (Table 5). Chemical compounds with high absorbance have higher values for ε and Φ, which also promotes effective emission.
Table 5.
FRET parameters for donor (BSA)—acceptor (compound) systems.
| Compounds | J × 10−14 (LM−1·cm3) | R 0 (nm) | E | r (nm) | k ET (J/s) | B (M−1·cm−1) |
|---|---|---|---|---|---|---|
| (HL) | 0.8215 | 2.4400 | 0.3462 | 2.7127 | 5.2957 | 5339.79 |
| (1a) | 0.7607 | 2.4090 | 0.5769 | 2.2877 | 13.6340 | 5187.78 |
| (2a) | 0.5425 | 2.2770 | 0.5615 | 2.1851 | 10.4206 | 4642.53 |
Figure 6.

The overlap of UV-vis spectra of ligand (HL) and mixed ligand complexes (1a-2a) (acceptor) at 336–337 nm with fluorescence emission spectrum of BSA (donor) at 350 nm.
FRET ⟶ Fluorescence resonance energy transfer,
| (18) |
When transmit efficiency is 50%, the observed critical distance is R0, which is denoted as the Förster radius characterizing the donor/acceptor pair and is evaluated from the equation (19).
| (19) |
| (20) |
where J is denoted as normalized spectral overlap integral between the emission spectrum of donor (BSA) and the absorption spectrum of acceptor (complex), R0 is critical distance at which the efficiency of resonance energy transfer (50%) , average refracted index of medium (n) = 1.36, fluorescence quantum yield of the donor (Φ) = 0.15, orientation factor related to geometry of the donor and acceptor of the dipoles (K2) = 2/3 for the complex-BSA interaction, E is represented as efficiency of energy transfer, E=(1 − F/F0), (f) and F0 are the fluorescence intensity of BSA in the presence and absence of complex, r is the donor-acceptor separation relative to their van der Waals radii L (nm), , (f) (λ) is represented as the corrected or the normalized emission intensity of the BSA in the wavelength range of λ − (λ + ∆λ), ε (λ) is denoted as the molar absorption coefficient of the compound at λ.
| (21) |
where the radiative, nonradiative decay and quenching rate constants are denoted as kr, knr, and kq, respectively, τ0 ⟶ radiative lifetime of the fluorophore (biomolecules) (τ0 = 10−8 s), and the concentration of complex (quenching species) is described as [Q].
| (22) |
K is detonated as a relative factor of the specific orbital interactions based on the orbital overlap between the bovine serum albumin and substances.
| (23) |
kET is denoted as rate of exchange resonance energy transfer, B is denoted as average brightness of the complex-BSA system, B = [(Φ1ε1 + Φ2ε2)/2], ε is molar absorption (or) extinction coefficient of the acceptor at λ, ε = 43,824 LM−1·cm−1 for donor (BSA) and ε values for acceptors = 27,373.20 (HL), 25,346.40 (1a), and 18,076.40 (2a). B value of free BSA = 6,573.60 M−1·cm−1.
3.2.7. Analysis of DNA-Binding Characteristics Using the CV Method
The CV technique is one of the most important tools for investigating the DNA-complex adduct's binding mechanism. The CV properties of all test samples in the presence and absence of DNA were executed at a scan rate (v) 0.1 Vs−1 with a potential range of +2 to −2 in a Tris-HCl (5 mM)/NaCl (50 mM) (pH = 7.2) solution. The M1+/M2+ redox couple is caused by complexes that reveal a single anodic and cathodic peak. The complex's reaction with the glassy carbon electrode surface was shown to be a one-step, one-electron, quasireversible redox process since the redox couple's (Ipa/Ipc) ratio values were close to unity, which is also supported by the change in peak potential separation (Ep > 0.0591 V) [84–86] (Figure S29 and Table 6).
Table 6.
Redox potential patterns for the interaction of DNA with ligand (HL) and its complexes (1a-2a).
| Compounds | ΔEP (V) | E° (or) E1/2 (V) | K [red]/K[oxi] | I pa/Ipc | D 0 × 10−5 cm2·s−1 | K b × 104 M−1 (methods) | S (bp) | ||
|---|---|---|---|---|---|---|---|---|---|
| Free (bound) | Free (bound) | Found (I) (Calcd) | Free (bound) | Free (bound) | I red (oxi) | II | III | ||
| (HL) | 0.7420 (0.8890) | 0.3490 (0.3680) | 0.7214 (2.0964) | 1.4295 (1.3424) | 2.8570 (2.5809) | 0.3809 (0.528) | 0.2443 | 0.4837 | 0.452 |
| (1a) | 0.4352 (0.2807) | 0.7054 (0.7398) | 0.8628 (3.76) | 1.2653 (0.2031) | 4.9799 (4.3266) | 2.1854 (2.533) | 7.0773 | 2.1567 | 0.123 |
| (2a) | 0.4819 (0.2965) | 0.5406 (0.5719) | 0.8268 (3.34) | 1.8999 (0.5000) | 3.9665 (3.6257) | 2.0348 (2.461) | 2.7693 | 1.8486 | 0.270 |
ΔEP is peak-to-peak separation = (EPa − EPc); E°(or) E1/2 is denoted as formal electrode potential = 1/2 (EPa + EPc); Es°=(Eb° − Ef°)Eb° and Ef° are represented as the formal electrode potential of the M1+/M2+ couple in the bound and free forms, respectively. Es° = +19 mV (HL), +34 mV (1a), and +31 mV (2a). Ipa is anodic peak current, Ipc is cathodic peak current. K1+ is binding constant of reduction process, K2+ is binding constant of oxidation process, S is represented as binding site size of base pairs (bp) with a molecule of complex, Scan rate is 100 mV·s−1, binding constant (Kb) values observed from the linear plots of log (1/[DNA]) vs. log (I/I0 − I) for oxidation and reduction, (I0 − IDNA)/IDNA = Cp/Cf versus [DNA] and Ip 2 versus (Ipo 2 −Ip 2 )/[DNA] by methods I, II, and III, respectively.
| (24) |
where I0 and I are represented as the peak currents of the compound in the absence and presence of DNA.
| (25) |
| (26) |
| (27) |
where Cf and Cb are denoted as the free substance concentration and DNA-interacted compound, respectively. (29) was obtained by comparing equations (27) and (28).
| (28) |
| (29) |
| (30) |
S is denoted as binding site size (bp), and Kb are estimated from (31) with the help of S = (intercept/4)1/2 and (Kb = 2S (slope/intercept), respectively. Nernst equations are as follows:
| (31) |
| (32) |
E 1/2 or Eb° and Ef° are the formal electrode potentials of the M1+/M2+ couple in their bound and free forms, respectively.
| (33) |
where Ipo and Ip are denoted as the peak currents of the complexes (1–3) in the absence and presence of DNA.
| (34) |
| (35) |
where Ipa is denoted as the anodic peak current in amperes, n is represented as the number of electrons participating in the redox (M1+/M2+) process (n = 1), charge transfer coefficient (or) activation coefficient (α)≈0.5 for quasireversible systems, which also calculated from Bard–Faulkner relation
| (35a) |
C0∗ ⟶ Bulk concentration of the compound, A is denoted as the cross-sectional area of the working electrode (glassy carbon) in cm2 (A∼0.07 cm2), D0 is denoted as diffusion coefficient (cm2 s−1) of the M1+/M2+ couple in the free and bound forms, respectively, and v is denoted as the potential scan rate at 0.1 Volt·s−1. While the substances often bind to deoxyribonucleic acid through intercalation, the peak potential shifts in a positive direction. When the compounds bind to deoxyribonucleic acid via minor or major grooves or electrostatic attractions, the peak potential shifts occur in a negative direction. In this case of ligand (HL) and its complexes (1a-2a), due to the consistent movement in the positive direction caused by the increment of deoxyribonucleic acid, the binding mode has been described as mainly intercalation in the compound-DNA adduct (Figure S29), and it is further ascribed to the presence of 2,2′-bipyridine and morpholine fused aromatic planar systems in mixed ligand complexes, which can create inclusion through intercalation owing to hydrophobic and π-π stacking interactions in the deoxyribonucleic acid base pairs. It is also verified by the evaluated outcomes of absorption titration, emission titration, viscometric, and biothermodynamic properties. Furthermore, the binding constants, binding site size (S), and ratio of binding constants (K1+/K2+) for M1+/M2+coupled systems further confirmed the binding affinity via intercalation. Additionally, the subsequent equations (24)–(35) are supported to determine the above parameters [87, 88]. Equation (24) is acquired from the modification of the Stern–Volmer equation (14) (Table 6). Kb values for all samples were estimated through the antilogarithm of the intercept in the linear regression plot of log (1/[DNA]) vs. log (I/I0 − I) by method I (Figure S30 and Table 6). Binding site size (bp) (S) and Kb are estimated from method II [89–91] (Figure S31 and Table 6). In addition, the base pair sites in a molecule of the compound are referred to as binding site size (S), which is also suggested that there should be one binding site for every two base pairs, and the evaluated S findings were found in the range from 0.1230 to 0.4520 bp (Table 6). In general, if S value is less than one, this denotes stronger binding through intercalation, and if S value is greater than one, this suggests the possibility of the mode of groove binding or electrostatic interactions [92–96]. Also, complex (1a) has a higher binding efficiency than others owing to robust DNA-binding affinity through intercalation with a low binding site size. It is therefore stated that a compound or medication exhibits high binding affinity when it occupies a single binding site. Meanwhile, the drug-DNA adducts exhibit low binding affinity when many site sizes are increased for the same [97]. As a result of the variable binding state [M1+/M2+] and the delayed mass transfer of complexes interacting with deoxyribonucleic acid fragments, the increment of deoxyribonucleic acid to the complex solution enables a change in the redox potential to a higher positive direction and a drop in both anodic and cathodic peak currents. Moreover, the Es° values of M1+/M2+ for all substances were observed to be positive values (Table 6). This suggests that the compounds' strong hydrophobicity makes their interactions with deoxyribonucleic acid through intercalation more favourable. On the other hand, if the value of Es° is negative, this indicates that the substance interacts more favourably with DNA through electrostatic interactions, and K1+ and K2+ are represented as binding constant findings for the binding states of the +1 and +2 chemical substances to deoxyribonucleic acid, respectively. With the aid of equation (25), the linear regression plot of log (1/[DNA]) versus log (I/I0 − I) (method I) is employed to determine the ratio of binding constant findings (K[red]/K[oxi]) for reduction and oxidation processes, which was also estimated using the Nernst equation (32) (Table 6). Generally, the DNA-compound adduct is assigned the groove binding or electrostatic binding interaction when the ratio of [K1+/K2+] is equal to one. When the ratio value is less or greater than one, it demonstrates that the mode of intercalation binding could occur in the DNA-compound system owing to hydrophobic forces of attraction [98, 99]. The following mechanism led to the latter finding in the compounds-deoxyribonucleic acid system (Table 6):
| (36) |
K b finding was measured by method III (Figure S32 and Table 6). In these cases, complex (1a) shows greater binding effectiveness among others owing to its robust binding affinity with deoxyribonucleic acid through intercalation. As a result, it is proposed that the complexes consist of an aromatic planar linked with a morpholine moiety as well as 2,2′-bipyridine planar systems that may strongly bind to DNA through intercalation, and it is also validated by the value of the diffusion coefficient (D0) of the compound alone and the DNA-bound test substance with the aid of the subsequent quasireversible Randles–Sevcik equation (34) (Table 6) [100, 101]. On adding DNA to test compounds, the anodic/cathodic peak currents of the M (I)/M (II) reduced due to a diminishing of D0. It is clearly suggested that the evaluated values of D0 of deoxyribonucleic acid-bound samples were fewer than the free test samples. The values of D0 for all samples in the absence and presence of DNA at scan rates of 0.01–0.3 V/s were measured from the linear regression plots of fIpa vs. v1/2 and bIpa vs. v1/2 using equation (35) [102–104] (Figure S33 and Table 6).
3.3. Evaluation of BSA Binding by UV-Visible Spectral Titration
The UV-visible spectral titration properties are imperatively supported to scrutinize the structural changes and the nature of quenched biomolecules by the chemical substance. The titration was executed for BSA in the presence and absence of substances in Tris-HCl solution (Figure 7 and Table 7). Two distinctive adsorption peaks can be noticed in the UV-visible spectra of free BSA: one at 210 nm, which is connected to the polypeptide backbone, and the other at 280 nm, which is responsible for Trp, Tyr, and Phe aromatic amino acid residues. BSA's interaction with the test substances is designated by alterations in the electronic absorption spectra. Quenching typically occurs in either a static or dynamic phase. The static quenching mechanism only involves the synthesis of a bovine serum albumin-compound in the ground state, when a dynamic quenching mechanism involves the temporary presence of the excited state due to diffusion, which brings the BSA and the compound into close proximity. In addition, the dynamic quenching mechanism has no outcome on the electronic absorption spectrum; it only affects the excited state [105]. Furthermore, both types have different temperature dependences; for example, in dynamic quenching, the quenching constants are meant to rise with temperature. Conversely, raised temperatures in static quenching favour decreased stability and lower quenching constants [106]. The BSA's absorption intensity was found to be between 278 and 280 nm. When the test sample concentration raises, the absorbance value also raises accompanied by the blue shift (hypsochromic) (2–5 nm), and it suggests that a more polar microenvironment is exposed to the protein's aromatic residues [107]. It also recommended that bovine serum albumin and the test compounds in the ground state interact statically. In this case, the evaluated hyperchromism was found in the range of 47.79 to 65.62%. The results also demonstrate that conformational alterations may happen owing to noncovalent interactions like H-bonds and electrostatic binding between substances and bovine serum albumin. The Benesi–Hildebrand (37) is supported to evaluate the Kb values (Table 7) [108]. The Kapp findings for all substances were estimated from the finding of the intercept divided slope in the linear regression plot of [(A∞ − A0)/(Ax − A0)] vs. {1/[compound]} M−1(Figure S34). The evaluated Kb findings for all test substances were in the subsequent order: (1a) > (2a) > (HL) with ∆Gb° values from –22.1246 to –28.0038 kJ·mol−1. Complex (1a) is also clearly shown to have the greatest spontaneous binding efficacy with BSA among others.
Figure 7.

Bovine serum albumin's UV-visible titration spectra at 25°C in a Tris-HCl buffer at a pH of 7.2 in the absence and presence of rising amounts of test substances. Arrow shows the changes in absorbance upon increasing the substance concentration.
Table 7.
UV-visible titration parameters for all substances bound to bovine serum albumin.
| Compounds | λ max (nm) | Δλ (nm) | Chromism (% H) | Binding constant Kapp × 104 M−1 by BH method | ∆Gb° (kJ·mol−1) | |
|---|---|---|---|---|---|---|
| Free | Bound | |||||
| (HL) | 278 | 276 | 02 | 47.79 | 0.7556 | −22.1246 |
| (1a) | 280 | 275 | 05 | 65.62 | 8.1059 | −28.0038 |
| (2a) | 280 | 276 | 04 | 55.04 | 4.4355 | −26.5010 |
Hyperchromism%=(A∞ − A0)/A∞ × 100; A0 is denoted as absorbance of BSA alone at 278 nm, A∞ is represented as absorbance of the fully bound form of BSA with complex or ligand, and Ax is absorbance of BSA in the addition of different concentration of complex or ligand, Gibb's free energy change ΔGb°=–RT lnKapp (where R = 8.3144 KJ·mol−1 and T = 298 K); Kapp is denoted as apparent binding constant evaluated from the UV-vis absorption spectral titration.
| (37) |
where ∆Amax = (A∞ − A0), ∆A = (Ax − A0), A0, Ax, and A∞ are denoted as the absorbance of free BSA, the absorbance of BSA in the increment concentrations of the compound, and the absorbance value of the fully bound form of bovine serum albumin with substance, respectively. Error limit ±2.5%.
3.4. DFT and Molecular Modelling Properties
The quantum chemical properties of all substances in the gas phase were examined using DFT calculations. When assessing the electronic structure, stability, and chemical reactivity of substances, quantum chemical characteristics such as HOMO, LUMO, and energy gap (ΔE) can be used. The ΔE findings of the substances and their biological activity may be connected. The DNA electron cloud largely occupies HOMO in the substance-DNA adduct system, when the LUMO electron cloud is primarily distributed across the intercalative ligands of the metal complex, such as the 2,2′ bipyridine moiety. The overlap of HOMO (DNA) and LUMO (complex) orbitals is enhanced by this type of electron cloud distribution, which results in the intercalation of the complex within DNA [109]. The optimized geometries for all compounds are enclosed in Figure 8. It also indicates the examined dipole moment (DM) next to each compound. Depending on the electronic structure of the central metal, complexes (1a-2a) are found in either the singlet (2a) or doublet ground states (1a). In line with the experimental results, all-metal complexes present a distorted octahedral geometry, where the central metal is bound to six coordination sites, including the two phenolic O and iminic N atoms of the ligand, along with the two N atoms of the bipyridine molecule. Dipole moment values suggest that all complexes (1a-2a) are more polar than that of the free ligand (HL). Regarding the complexes, the highest and lowest dipole moments, i.e., 12.27 and 10.06 debye, are assigned to complexes (1a) and (2a), respectively.
Figure 8.

The optimized geometries for the free ligand (HL) and its complexes (1a-2a).
Extensive research has demonstrated that chemical reactivity is mainly dictated by the interaction between the HOMO and LUMO. It is widely admitted that the kinetic stability of a given compound can be correlated with the energetic gap between its FMOs. A rule of thumb is that the larger the gap, the more kinetically stable the system. In the present case, HOMO-LUMO gaps of 3.986, 1.871, and 2.162 eV were predicted for (HL) and complexes (1a-2a), respectively. These values suggest the following order of kinetic stability: Cu(1a) < Zn(2a) < (HL), which further indicates that all synthesized complexes (1a-2a) have higher reactivity than the ligand and may give rise to better binding profiles with biomolecules.
However, although very handy and widely used to sort molecules in terms of global reactivity trends, the HOMO-LUMO gap does not provide any clue about the reactive regions of the system. This is where local reactivity descriptors come to the rescue. To decipher molecular regions or sites with the highest propensity to withdraw or accept the available density, one can first rely on the electron density distributions in FMOs. Figure 9 displays the FMOs of all test compounds. As far as the free ligand is concerned, the HOMO covers the whole molecule, while the LUMO does not cover the morpholine ring (except the nitrogen atom). The HOMO of the complex (1a) is concentrated on the transition metal and the phenolic rings of the ligand (HL), while the LUMO covers the metal and the 2,2′ bipyridine moiety. In the Zn-containing complex (2a), FMOs are less delocalized, with the HOMO expanding only over one L unit and the LUMO covering the 2,2′ bipyridine fragment. In particular, the central metal does not contribute to stabilizing these FMOs (Figure 10 and Table 8).
Figure 9.

FMO of the free ligand (HL) and its complexes (1a-2a).
Figure 10.
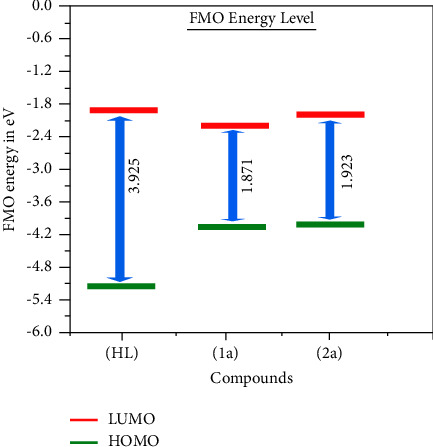
FMO energy level diagram by DFT computation for all compounds.
Table 8.
Quantum chemical parameters (eV) as well as FMO energy gap and dipole moment values of free ligand (HL) and metal complexes (1a-2a).
| Compounds | HOMO (eV) | LUMO (eV) | H-L gap (eV) | χ | η | σ | μ i | ω | ΔNmax | μ (debye) |
|---|---|---|---|---|---|---|---|---|---|---|
| (HL) | −5.177 | −1.192 | 3.985 | 3.155 | 1.963 | 0.510 | −3.155 | 2.535 | 1.607 | 0.86 |
| (1a) | −4.178 | −2.308 | 1.871 | 3.243 | 0.935 | 1.070 | −3.243 | 5.624 | 3.468 | 12.27 |
| (2a) | −4.163 | −2.240 | 1.923 | 3.202 | 0.962 | 1.040 | −3.202 | 5.329 | 3.328 | 10.06 |
Additional descriptors such as absolute electro negativity (χ), absolute hardness (η), absolute softness (σ), chemical potential μi, global electrophilicity (ω), and additional electronic charge (ΔNmax) are determined from the following equations (38)–(43) [38], and their related findings are summarized in Table 8. Absolute electronegativity (χ) indicates a substance is a Lewis acid or a base. While the χ finding is high, this is ascribed to the Lewis acid, and while the χ finding is low, this is ascribed to the Lewis base [110]. As demonstrated in Table 8, the observed χ findings for the complexes (1a-2a) were put forward that they act as Lewis acids compared to the free ligand. The η findings are supported to distinguish the hard and soft molecules. While the η finding is high, this is attributed to the hard nature of the molecule. On the other hand, while the η finding is low, this is attributed to the soft nature of the molecule. It is also pronounced that the soft nature of substances is more polarisable compared to hard ones [111]. The higher observed findings of η for the ligand demonstrate that it is a chemically hard substance compared to the complexes (1a-2a) (Table 8). Global electrophilicity (ω) is denoted as the capability of a substance to absorb electrons from the system. The substances with higher findings of ω indicate that they can form several interactions with biomolecules. However, the complexes (1a-2a) have a larger value of ω (5.329–5.624) than their related free ligand (2.535), which supports that the complexes involve strong binding with biomolecules due to numerous interaction modes [112]. It is also concluded that the observed findings of the quantum chemical parameters indicate the chemical reactivity of the complexes (1a-2a) (Table 8).
Electron volt (eV), ΔE (eV) ⟶ energy gap between HOMO and LUMO, HOMO ⟶ highest occupied molecular orbital which is directly related to ionization potential (IP = −EHOMO) without negative sign. LUMO ⟶ lowest unoccupied molecular oOrbital, which is directly related to electron affinity (EA = −ELUMO), and ΔE ⟶ the energy gap (ELUMO − EHOMO) (or) ΔE = (IP − EA),
| (38) |
| (39) |
| (40) |
| (41) |
| (42) |
where χ ⟶ absolute electronegativity, η ⟶ absolute (global) hardness, σ ⟶ absolute (global) softness, μi ⟶ chemical potential, ω ⟶ global electrophilicity index, and ΔNmax ⟶ additional electronic charge. μ ⟶ dipole moment (μ = Q × r) is the measure of net molecular polarity, which describes the charge separation in a molecule. It is the product of the charge Q, at the end of the molecular dipole, and the distance r, between the charges. These parameters are effective in predicting global reactivity trends based on Koopman's theorem.
From the visual analysis of FMOs, it comes out that the phenolic rings of (HL) and bipyridine units are the most reactive nonmetallic fragments of the complexes (1a-2a). As such, they are anticipated to participate most actively in a range of intermolecular interactions. Another well-established local reactivity descriptor is the molecular electrostatic potential (MEP). The MEP describes the interaction between the charge distribution of a molecule and a hypothetical positive charge [113]. One of its biggest merits is the capability to effectively recognize the most reactive sites in “hard-hard” interactions, as pioneered by Pearson through the hard-soft acid-base principle [114]. Figure 11 displays MEP maps of (HL) and complexes (1a-2a) calculated at the 0.002 isosurfaces. In this figure, the red and blue colors indicate regions that are expected to be engaged in nucleophilic and electrophilic attacks. Two nucleophilic sites appear on the MEP of the free ligand. The first region surrounds both the phenolic O and imine N atoms and mirrors the presence of the ESP global minimum of −46.6 kcal/mol. The second spot is found in the vicinity of the morpholinic O atom and is identified with a local minimum estimated to be roughly −29.5 kcal/mol. This points out that the first site is more highly reactive than the second and agrees with the fact that the phenolic site is the one that binds to the central metal during the formation of the metal complexes. Conversely, the MEP maps of complexes (1a-2a) present a negative electrostatic potential all over the phenolate units, whereas the 2,2′ bipyridine fragment carries a positive region enclosing all H atoms fixed opposite to the N atoms. This observation corroborates, at least partly, with the previous analysis of FMOs, highlighting that the phenolate and 2,2′ bipyridine fragments are the preferred binding sites for nucleophilic and electrophilic assaults, respectively. In sum, both the free ligand (HL) and complexes (1a-2a) appear as amphoteric species, able to act as Lewis acids and Lewis bases. Similar systems can be found throughout the literature [115].
Figure 11.

Molecular electrostatic potential (MEP) maps of the free ligand (HL) and associated complexes (1a-2a). Plots generated at the 0.002 isosurface value.
The 3D models of the BSA, CT-DNA, and 3CLPro host biomolecules are depicted in Figure S35. The guest molecules, i.e., the free ligand (HL) and complexes (1a-2a), were first docked within the active site of the BSA to assess their binding affinity and figure out the main interactions that ensure the stability of the resulting guest-host complex. Figure 12 shows the highest docking positions. Calculated binding energies between test compounds and BSA fell in the range from −7.2 to −10.2 kcal·mol−1 and suggested the spontaneous formation of the guest-host complex. The binding affinity values were found in the following sequence: −10.2 (1a) > −9.5 (2a) > −7.2 (HL). These binding energies point out that the complexes (1a-2a) demonstrate superior binding affinity to DNA contrasted to the ligand (HL). However, the stability of guest-host complexes, which constitutes the first criterion in the selection of lead compounds in drug discovery pipelines, does not only depend on their inherent reactivity but also on their size, bond length of the metal-ligand system, charge, electron density, polarity, metal ions' influence on the dipole moment, and intermolecular H-bonds, as this determines how easily they will be accommodated inside the active site. Moreover, several noncovalent interactions were found to maintain the guest molecules' interiors at the active site of the BSA (Figure S36). The most noteworthy ones are H-bonding interactions, π-π stacking, and hydrophobic interactions. For instance, the ligand (HL) establishes two conventional H-bonds with BSA, where it behaves as the proton acceptor. In the first interaction, a long of 2.73 Å, the phenolic O atom binds to Phe506, while the second contact involves the morpholinic O atom and the Asn504 amino acid residue. This finding is in line with the local reactivity of the free ligand (HL) as predicted by the MEP. Furthermore, the metal complex (1a) is also engaged in conventional H-bonds with Lys563, while complex (2a) did not form such interactions. The docking of our guest molecules inside 3CLPro was also favourable and showed binding energies in the range from −6.7 to −8.2 kcal·mol−1. The most stable guest-host complex was ascribed to complex (1a), while (HL) formed the least stable one. The binding affinity values between the test compounds and 3CLPro were found to be in the following sequence: −8.2 (1a) > −7.9 (2a) > (HL) − 6.7, which provides support for the enhanced reactivity of the metal complexes (1a-2a) than ligand (HL).
Figure 12.

Best docking poses of guest molecules inside the active site of the BSA protein.
Figures 13 and S37 display the best binding poses and the physical interactions that guest molecules establish inside 3CLPro's active site. It put forwards that apart from H-bonds in (HL), π-π stacking interactions contribute significantly to the stability of guest-host systems. In addition, all-metal complexes (1a-2a) seem to bind better than the cocrystalized ligand, which frequently performs as an optimistic control [116, 117]. This finding is quite encouraging and should incite further in vitro studies to validate the effect of inhibition of our guest molecules on SARS-CoV-2 main protease. Finally, docking calculations on the CT-DNA double helix suggested favourable binding energies for all test compounds were found between −7.7 and −8.6 kcal/mol. In addition, the acquired binding energies for all substances bound with CT-DNA were in the subsequent sequence: −8.6 (1a) > −8.2 (2a) > −7.7 (HL) kcal/mol. As shown in Figure 14, between the two brains of the helix, all substances are effectively sandwiched, where they seem to create both hydrogen bonds (HL) and complexes (1a-2a) and π-π stacking (HL) contacts with either of the guanine and cytosine subunits. Therefore, in all cases, these observed binding energies conclude that the metal complex (1a) demonstrates higher binding affinity towards DNA, BSA, and 3CLPro proteins, among others.
Figure 13.

Best docking pose of guest molecules inside the active site of 3CLPro.
Figure 14.

Best binding pose of our guest molecules in the CT-DNA double helix.
3.5. Assessment of Antioxidant Properties Using UV-Visible Spectral Titration
It is defined as the ability of any substance to put off or reduce the oxidation of the substrate (proteins/lipids/DNA/carbohydrates of living cells) or free radical formation. The biological systems are shielded from the potential adverse effects of excessive oxidation by the oxidizable substrate. As a result, the free radical's energy may be reduced, radical generation suppressed, or the chain propagation of lipid oxidation may be stopped in the initial stages. They also donate hydrogen or electrons to the free radicals, turning them into nontoxic or H2O molecules [118–120]. Of late, it has been found that antioxidant studies have attracted special attention among various biological studies due to their vital part in the execution of disorders associated with cancer. The observed percentage of inhibition efficiency for all substances in terms of IC50 findings for DPPH, OH, O2−•, and NO free radical assays was revealed in Figures S38a–S38d and Tables S14–S17.
3.5.1. Assessment of the DPPH Radical Scavenging Property
The colour of an aqueous or methanol solution changes from deep purple to pale yellow when DPPH, a stable chromogen free radical, combines with an antioxidant molecule, which means that DPPH quickly absorbs the hydrogen or electrons from the donor groups. In this case, for the baseline correction, a blank DPPH solution in the absence of a test compound was employed, and 517 nm (ε = 8320 M−1·cm−1) was attained to have a significant absorption maximum. It was found that when test compound concentrations (40–240 μM) increase, the DPPH radical inhibition increases as well. The DPPH radicals are reduced by an antioxidant compound (AH), in which the reduction of electronic absorbance for each compound was vigilantly noted at 517 nm [121]. The capacity to block radicals improves as the sample concentration increases. The assessed percentage of maximum inhibition for all substances was found at 240 μM in the subsequent order: (ascorbic acid) (85.65) > (1a) 68.64 > (2a) 59.55 > (HL) 52.45. The assessed IC50 findings of standard ascorbic acid and complex (1a) were analyzed at 80 μM and 160 μM, respectively (Figure S38a and Table S14). Moreover, the % of scavenging or maximum inhibition for all substances is estimated with the aid of equation (44) (Table S14).
| (43) |
3.5.2. Evaluation of Hydroxyl Radical Inhibition
Hydrogen peroxide receives electrons from antioxidant molecules and then neutralizes them into a water molecule. ●OH inhibition capability was determined from the % of inhibition for all test substances at 230 nm. The maximum % of inhibition for all samples at 240 μM was observed in the subsequent order: (1a) 61.10 > (2a) 56.14 > (HL) 50.68. The IC50 findings for standard ascorbic acid and complex (1a) were observed at 160 μM and 200 μM, respectively. Nevertheless, complex (1a) demonstrated the best antioxidant potency among others (Figure S38b and Table S15).
3.5.3. Superoxide Scavenging Assay
A vital enzyme catalyst in the body's defence against free radicals, superoxide dismutase (SOD) quickly and efficiently reduces toxicity and cellular damage by exchanging superoxide with water (or) harmless molecules. The % of inhibition for all substances was analyzed at 590 nm. The outcomes were obtained in the subsequent order: (ascorbic acid) 84.85 > (1a) 67.17 > (2a) 58.18 > (HL) 50.42. However, complex (1a) revealed the best antioxidant potency among others, and standard ascorbic acid's assessed IC50 values were found to be 120 μM and complex (1a)'s values to be 200 μM, respectively (Figure S38c and Table S16).
3.5.4. Assessment of Nitric Oxide Inhibition
The diffusible nitric oxide free radical is a crucial chemical mediator, which assists in overcoming diverse chronological human diseases. The NO free radical scavenging potential for all test samples was also carried out at 546 nm. It monitored the alterations in electronic absorption intensity of the nitric oxide radical inhibition outcome concerning the sample concentrations. When the test sample concentration rises, the nitric oxide free inhibition effectiveness also increases. The measured % of nitric oxide radical scavenging capability for all samples at 240 μM was obtained in the subsequent order (ascorbic acid) 72.73 > (1a) 65.47 > (2a) 58.43 > (HL) 51.62. However, complex (1a) showed superior antioxidant efficacy among others, and standard ascorbic acid's IC50 findings for ascorbic acid and complex (1a) were observed to be 160 M and 200 M, respectively (Figure S38d and Table S17).
3.6. Evaluation of Antimicrobial Properties
The current research has a curious focus on the in vitro antimicrobial properties of biological systems because these studies are crucial for developing effective antibacterial and antifungal medications. The obtained clear inhibition zone (mm) values towards various bacterial and fungal species for the test samples were revealed in Figure 15, and the evaluated findings were summarized in Table 9. The outcomes of the microbial activities revealed that the metal chelates demonstrated greater efficacy compared to ligand (HL) against the chosen bacterial and fungal pathogens owing to the improved lipophilicity of the substances under similar circumstances, and they accelerate the cell wall breaking down during the biosynthesis of the microorganisms' enzymes as well as damage the normal cell processes due to increasing the permeability of cells into lipid membranes [122]. The obtained results suggest that complexes (1a-2b) demonstrate significantly greater antimicrobial properties than the free ligand (HL) against the chosen microorganism, and they are contrasted with standard drugs like amikacin and streptomycin for bacteria, and ketokonazole and amphotericin B for fungal species. It can also be spelled out based on the chelation theory proposed by Overtone and Tweedy [123]. Chelation theory points out that the partial exchanging of the positive charge of the metal center with donor moieties, and overlap of the ligand orbitals will reduce the greater degree of the metal ion's polarity, which ultimately rises the delocalization of π and d electrons over the full chelated ring system. By raising the size of the metal ion due to the retarding of polarization, chelation may also enhance the complexes' lipophilic characteristics, which further stimulate the lipid membrane permeability and break down the bacteria' enzymes responsible for cell wall formation, therefore slowing down the regular cell processes. By preventing the production of cell walls/proteins/DNA, including by obstructing folate metabolism and the cytoplasmic membrane, antimicrobial drugs frequently either fully eliminate microbes or only prevent their cell growth. Additionally, the samples' mode of action may be employed in disrupting the cell's respiration process by forming an H-bond during the morpholine-fused iminic group coordinated with the active metal center of its components, inhibiting proliferation of the cell. It is also revealed that the enhanced antibacterial activity could be attributed to changes in pharmacological kinetics, conductivity, steric, electronic, solubility, and metal-ligand bond length. The difference in the antimicrobial efficacy of some of the compounds towards various microorganisms influences on the impermeability of the cells of the germs or the diversity of ribosomes of the microbes [124]. The % of the inhibition of all substances is estimated from (45) (Table 9).
Figure 15.

Agar disc diffusion technique histogram comparing the antibacterial effects of all substances.
Table 9.
Investigation of all substances' antimicrobial properties (measured as the diameter of the clear zone inhibition in mm) (inhibition %).
| Compounds | Antibacterial activity | Antifungal activity | ||||||||
|---|---|---|---|---|---|---|---|---|---|---|
| A | B | C | D | E | F | G | H | I | J | |
| Ligand (HL) | 09 (33) | 09 (33) | 11 (45) | 08 (25) | 14 (57) | 09 (33) | 09 (33) | 10 (40) | 10 (40) | 11 (45) |
| Complex (1a) | 13 (54) | 10 (40) | 12 (50) | 09 (33) | 11 (45) | 12 (50) | 13 (54) | 11 (45) | 12 (50) | 12 (50) |
| Complex (2a) | 12 (50) | 09 (33) | 09 (33) | 09 (33) | 11 (45) | 11 (45) | 14 (57) | 09 (33) | 13 (54) | 15 (60) |
| Amikacin | 22 (73) | 22 (73) | 24 (75) | 20 (70) | 20 (70) | 20 (70) | 20 (70) | — | — | — |
| Streptomycin | 24 (75) | 26 (77) | 24 (75) | 21 (71) | 25 (76) | 21 (71) | 21 (71) | — | — | — |
| Ketoconazole | — | — | — | — | — | — | — | 16 (63) | 18 (67) | 18 (67) |
| Amphotericin B | — | — | — | — | — | — | — | 15 (60) | 17 (65) | 17 (65) |
(A, B, C, D, and E are represented as gram negative bacteria species Escherichia coli, Salmonella enteric serovar typhi, Salmonella enteric serovar typhi, Pseudomonas aeruginosa, and Shigella flexneri, respectively. F & G are denoted as gram positive bacteria species Staphylococcus aureus and Bacillus cereus. H, I, and J are represented as fungal strains Aspergillus niger, Candida albicans, and Mucor indicus. Standard drugs for bacterial strains: Amikacin & Streptomycin Standard drugs for fungal strains: Ketoconazole and Amphotericin B. [Control (DMSO) = 6 mm].
| (44) |
where T and C are represented as the diameter of microbial growth of the sample plates and the control plate (6 mm), respectively. Error limits ±2.5–5.0% (P ≤ 0.05).
3.7. Evaluation of Anticancer Properties
Cellular viability or metabolic properties can be measured using the MTT assay, which is a powerful and credible method for anticancer properties. The anticancer efficacy of all test compounds was investigated by the MTT assay against A549, HepG2, MCF-7, and NHDF cell lines [125]. As per the colorimetric approach, the IC50 findings of all test substances were evaluated as the % of cell viability/growth inhibition [126]. Even though the complexes show superior activity than ligand (HL) against some cancer cell lines, the NHDF cell line is only mildly perturbed by cisplatin. Nevertheless, complex (1a) has the highest cytotoxic potential among others [127]. The acquired findings were in the subsequent sequence as follows: (cisplatin) > (1a) > (2a) > (HL) (Figure 16 and Table 10). The cytotoxic effectiveness is dependent upon the DNA-binding modalities, the structure-activity relationship, as well as drug concentrations and incubation period exposure [128]. In addition, it is suggested that these complexes consist of morpholine fused primary aromatic and secondary 2,2′-bipyridine planar systems connected with a metal center, which facilitate their simple insert within the base pairs of DNA. As per Tweedy's chelation theory, charge equilibration happens as a result of coordination between the ligands and metal ions, which minimises the polarity of the metal ions and causes the capability of the test complexes to pass via the cell membrane lipid layer. Thus, it put off the synthesis of cell wall/protein/nucleic acids. The measured % of the inhibition results of growth for these compounds is summarized in Table 10. Additionally, the results of DNA-binding tests using these complexes, including gel electrophoresis, UV-visible spectral titration, hydrodynamic, emission, and CV findings, were in good agreement with the findings of cytotoxicity [129]. The expressions (46) and (47) were supported to measure the % of growth inhibition and cell viability. The complex (1a) has been proven to have greater biological efficiency, among others, which also based on the Lewis acid character, solubility, conductivity, bond length of metal-ligand, charge, electron density, dipole moment, intermolecular hydrogen bonding, and proton transfer equilibrium, etc. These significant elements might also contribute to the increased biological activity. The Cu+ ion is unique among the transition metals owing to its size, d10 electronic configuration, softness, and flexible characteristics of the distorted coordination geometry. The effect of the Cu+ is a reduced form of the complexes' conformation, symmetry, and functionality that results in increased biological efficacy. Depending on the ligand donor selected, Cu+ can also be reduced as an intervening molecule. Despite both acting as d10 ions, Cu+ is softer and more flexible than Zn2+ ions. Hence, the copper complex may promote DNA damage while inhibiting its repair, producing a double-edged effect. According to numerous research findings, via cell apoptosis or enzyme inhibition, the great anticancer efficacy of copper complexes has been proven.
Figure 16.

The evaluation of the anticancer properties of ligand (HL) and its complexes (1a-2a) against cancer cell lines and normal cell lines in comparison to the standard medication cisplatin (CP). Error limits ±2.5–5.0% (P ≤ 0.05).
Table 10.
The evaluation of the anticancer properties of ligand (HL) and its complexes (1a-2a) against cancer cell lines and normal cell lines.
| Compounds | IC50 (μM) | |||
|---|---|---|---|---|
| A549 | HepG2 | MCF-7 | NHDF | |
| Cisplatin | 31.9 ± 1.6 | 22.9 ± 1.1 | 20.2 ± 1.0 | 26.9 ± 1.3 |
| (HL) | 126.4 ± 6.3 | 108.4 ± 5.4 | 105.2 ± 5.3 | 208.6 ± 10.4 |
| (1a) | 30.8 ± 1.5 | 33.1 ± 1.7 | 32.1 ± 1.6 | 73.6 ± 3.7 |
| (2a) | 34.3 ± 1.7 | 34.6 ± 1.7 | 35.6 ± 1.8 | 78.4 ± 3.9 |
Average IC50 values from at least three independent experiments for drug concentration μg/mL of 50% cell death following 72 hours exposure. A549, HepG2 MCF-7, and NHDF are represented as human lung cancer cell line, liver cancer cell line, breast cancer cell line, and normal human dermal fibroblasts cell line.
| (45) |
| (46) |
Error limits ±2.5–5.0% (P ≤ 0.05).
4. Conclusion
All compounds are treated with diverse analytical, spectral, and X-ray diffraction analyses. The examined results of the complexes (1a-2a) proposed an octahedral geometry. The gel electrophoresis results showed that complex (1a) revealed excellent metallo-nuclease efficacy in a H2O2 environment. The observed DNA-binding properties of all compounds by spectro-electro-hydrodynamic and fluorometric titrations disclose that complexes (1a-2a) could bind to deoxyribonucleic acid via intercalation. The observed BSA-binding constants of all samples recommend that the complexes could interact with BSA in static mode, which is further supported by FRET detection. Complex (1a) also possessed the best DNA-/BSA-binding affinities compared to others. The electronic configuration data of these substances were attained from DFT computations and their molecular docking studies on the interacting affinity of these substances with DNA/BSA/SARS-CoV-2. The findings demonstrated that the metal complexes bind spontaneously inside the active sites of these biomolecules. Additionally, the enhanced reactivity of complexes with respect to the free ligand is well accounted for in the context of the FMO theory. The theoretical measurements for all substances were reported to be in excellent accord with the experimental findings. The antimicrobial properties exposed that the metal complexes have highly significant inhibition potency than the ligand (HL). The scavenging properties put forward by complex (1a) stood out as having a greater potential to scavenge radicals than other substances. The observed in vitro anticancer characteristics' findings for all substances and cisplatin (CP) revealed that complex (1a) has revealed the best cytotoxic efficiency among others, and the faintly influenced normal cell was found to be less compared to cisplatin. In the future, complex (1a) might function as a brand-new class of anticancer agent.
Acknowledgments
The authors wish to acknowledge Rhodes University, Grahamstown, 6140, South Africa, for financial support granted through the postdoctoral research fellowships scheme 2022. RWMK acknowledges the NRF grant UID 141979 and the Rhodes LCMS and XRD facilities. K. Sakthikumar thanks Prof. Rui WM Krause and the head of the department of chemistry for providing lab facilities and also records sincere gratitude to the honourable Prime Minister of India, Sri Nareindra Modi Ji, for his outstanding support with social determination. B.K. Isamura is grateful to the Center for High-Performance Computing (Project CHEM0802) and Prof. Kevin Lobb for having provided computational resources.
Data Availability
The spectro-electro-hydrodynamic and fluorometric titrations and comparison with theoretical measurements for DNA/BSA/SARS-CoV-2 biomolecules, radical scavenging, and cytotoxic properties are included within the article, and the physicochemical characteristics of the ligand and complexes to support the findings of this study can be referred to at https://doi.org/10.1039/c8ra09218d and https://doi.org/10.1016/j.jinorgbio.2022.111953.
Conflicts of Interest
The authors declare that there are no conflicts of interest in this work.
Supplementary Materials
Tables (S1–S17) and Figures (S1–S38) were encapsulated in the electronic supplementary information file.
References
- 1.Utthra P. P., Raman N. Probing the potency of triazole tethered Schiff base complexes and the effect of substituents on their biological attributes. International Journal of Biological Macromolecules . 2018;116:194–207. doi: 10.1016/j.ijbiomac.2018.05.009. [DOI] [PubMed] [Google Scholar]
- 2.Kumar G., Devi S., Johari R., Kumar D. Synthesis, spectral characterization and antimicrobial evaluation of Schiff base Cr (III), Mn (III) and Fe (III) macrocyclic complexes. European Journal of Medicinal Chemistry . 2012;52:269–274. doi: 10.1016/j.ejmech.2012.03.025. [DOI] [PubMed] [Google Scholar]
- 3.Sung H., Ferlay J., Siegel R. L., et al. Global cancer statistics 2020: GLOBOCAN estimates of Incidence and mortality worldwide for 36 cancers in 185 Countries. CA: A Cancer Journal for Clinicians . 2021;71(3):209–249. doi: 10.3322/caac.21660. [DOI] [PubMed] [Google Scholar]
- 4.Abu-Surrah A., Kettunen M. Platinum group Antitumor chemistry: design and development of new anticancer drugs Complementary to cisplatin. Current Medicinal Chemistry . 2006;13(11):1337–1357. doi: 10.2174/092986706776872970. [DOI] [PubMed] [Google Scholar]
- 5.Gao A., Wu Y., Yu J., et al. Synthesis and anticancer activity of two highly water-soluble and ionic Pt(IV) complexes as prodrugs for Pt(II) anticancer drugs. RSC Medicinal Chemistry . 2022;13(5):594–598. doi: 10.1039/d2md00004k. [DOI] [PMC free article] [PubMed] [Google Scholar]
- 6.Sakthikumar K., Dhaveethu Raja J., Vijay Solomon R., Sankarganesh M. Density functional theory molecular modelling, DNA interactions, antioxidant, antimicrobial, anticancer and biothermodynamic studies of bioactive watersoluble mixed ligand complexes. Journal of Biomolecular Structure and Dynamics . 2018;37(10):2498–2514. doi: 10.1080/07391102.2018.1492970. [DOI] [PubMed] [Google Scholar]
- 7.Afsan Z., Roisnel T., Tabassum S., Arjmand F. Structure elucidation {spectroscopic, single crystal X-ray diffraction and computational DFT studies} of new tailored benzenesulfonamide derived Schiff base copper(II) intercalating complexes: Comprehensive biological profile {DNA binding, pBR322 DNA cleavage, Topo I inhibition and cytotoxic activity} Bioorganic Chemistry . 2020;94 doi: 10.1016/j.bioorg.2019.103427.103427 [DOI] [PubMed] [Google Scholar]
- 8.Kumar G. D., Siva B., Vadlamudi S., Bathula S. R., Dutta H., Suresh Babu K. Design, synthesis, and biological evaluation of pyrazole-linked aloe emodin derivatives as potential anticancer agents. RSC Medicinal Chemistry . 2021;12(5):791–796. doi: 10.1039/d0md00315h. [DOI] [PMC free article] [PubMed] [Google Scholar]
- 9.Devi J., Yadav M., Kumar D., Naik L. S., Jindal D. K. Some divalent metal(II) complexes of salicylaldehyde-derived Schiff bases: synthesis, spectroscopic characterization, antimicrobial and in vitro anticancer studies. Applied Organometallic Chemistry . 2018;33(2) doi: 10.1002/aoc.4693.e4693 [DOI] [Google Scholar]
- 10.Ebrahimipour S. Y., Sheikhshoaie I., Castro J., et al. Synthesis, spectral characterization, structural studies, molecular docking and antimicrobial evaluation of new dioxidouranium(VI) complexes incorporating tetradentate N2O2Schiff base ligands. RSC Advances . 2015;5(115):95104–95117. doi: 10.1039/c5ra17524k. [DOI] [Google Scholar]
- 11.Annaraj B., Mitu L., Neelakantan M. A. Synthesis and crystal structure of imidazole containing amide as a turn on fluorescent probe for nickel ion in aqueous media. An experimental and theoretical investigation. Journal of Molecular Structure . 2016;1104:1–6. doi: 10.1016/j.molstruc.2015.10.002. [DOI] [Google Scholar]
- 12.Bernardo K., Leppard S., Robert A., Commenges G., Dahan F., Meunier B. Synthesis and characterization of new chiral schiff base complexes with Diiminobinaphthyl or Diiminocyclohexyl moieties as potential enantioselective Epoxidation catalysts. Inorganic Chemistry . 1996;35(2):387–396. doi: 10.1021/ic950700i. [DOI] [PubMed] [Google Scholar]
- 13.Carella A., Roviello V., Iannitti R., et al. Evaluating the biological properties of synthetic 4-nitrophenyl functionalized benzofuran derivatives with telomeric DNA binding and antiproliferative activities. International Journal of Biological Macromolecules . 2019;121:77–88. doi: 10.1016/j.ijbiomac.2018.09.153. [DOI] [PubMed] [Google Scholar]
- 14.Benítez J., Becco L., Correia I., et al. Vanadium polypyridyl compounds as potential antiparasitic and antitumoral agents: new achievements. Journal of Inorganic Biochemistry . 2011;105(2):303–312. doi: 10.1016/j.jinorgbio.2010.11.001. [DOI] [PubMed] [Google Scholar]
- 15.Sasmal P. K., Patra A. K., Nethaji M., Chakravarty A. R. DNA cleavage by new Oxovanadium(IV) complexes of N-salicylidene α-amino acids and phenanthroline bases in the Photodynamic Therapy Window. Inorganic Chemistry . 2007;46(26):11112–11121. doi: 10.1021/ic7011793. [DOI] [PubMed] [Google Scholar]
- 16.Creaven B. S., Czeglédi E., Devereux M., et al. Biological activity and coordination modes of copper(II) complexes of Schiff base-derived coumarin ligands. Dalton Transactions . 2010;39(45):10854–10865. doi: 10.1039/c0dt00068j. [DOI] [PubMed] [Google Scholar]
- 17.Gaur R., Choubey D. K., Usman M., Ward B. D., Roy J. K., Mishra L. Synthesis, structures, nuclease activity, cytotoxicity, DFT and molecular docking studies of two nitrato bridged homodinuclear (Cu-Cu, Zn-Zn) complexes containing 2, 2′-bipyridine and a chalcone derivative. Journal of Photochemistry and Photobiology B: Biology . 2017;173:650–660. doi: 10.1016/j.jphotobiol.2017.07.005. [DOI] [PubMed] [Google Scholar]
- 18.Manimohan M., Paulpandiyan R., Pugalmani S., Sithique M. A. Biologically active Co (II), Cu (II), Zn (II) centered water soluble novel isoniazid grafted O-carboxymethyl chitosan Schiff base ligand metal complexes: synthesis, spectral characterisation and DNA nuclease activity. International Journal of Biological Macromolecules . 2020;163:801–816. doi: 10.1016/j.ijbiomac.2020.06.278. [DOI] [PubMed] [Google Scholar]
- 19.Zare N., Zabardasti A., Mohammadi A., Azarbani F. Synthesis of spherical Fe2O3 nanoparticles from the thermal decomposition of iron (III) nano-structure complex: DFT studies and evaluation of the biological activity. Bioorganic Chemistry . 2018;80:334–346. doi: 10.1016/j.bioorg.2018.07.005. [DOI] [PubMed] [Google Scholar]
- 20.Erkkila K. E., Odom D. T., Barton J. K. Recognition and reaction of Metallointercalators with DNA. Chemical Reviews . 1999;99(9):2777–2796. doi: 10.1021/cr9804341. [DOI] [PubMed] [Google Scholar]
- 21.Xiong Y., Ji L. N. Synthesis, DNA-binding and DNA-mediated luminescence quenching of Ru(II) polypyridine complexes. Coordination Chemistry Reviews . 1999;185-186(186):711–733. doi: 10.1016/s0010-8545(99)00019-3. [DOI] [Google Scholar]
- 22.Ji L. N., Zou X. H., Liu J. G. Shape- and enantioselective interaction of Ru(II)/Co(III) polypyridyl complexes with DNA. Coordination Chemistry Reviews . 2001;216-217(217):513–536. doi: 10.1016/s0010-8545(01)00338-1. [DOI] [Google Scholar]
- 23.Dhar S., Nethaji M., Chakravarty A. R. Synthesis, crystal structure and photo-induced DNA cleavage activity of ternary copper(II) complexes of NSO-donor Schiff bases and NN-donor heterocyclic ligands. Inorganica Chimica Acta . 2005;358(7):2437–2444. doi: 10.1016/j.ica.2005.02.006. [DOI] [Google Scholar]
- 24.Thanusu J., Kanagarajan V., Gopalakrishnan M. Synthesis, spectral characterization, and in vitro antibacterial and antifungal activities of novel 1, 3-thiazine-2-amines comprising morpholine nucleus. Journal of Enzyme Inhibition and Medicinal Chemistry . 2010;25(6):756–764. doi: 10.3109/14756360903389898. [DOI] [PubMed] [Google Scholar]
- 25.Chew S. T., Lo K. M., Lee S. K., et al. Copper complexes with phosphonium containing hydrazone ligand: Topoisomerase inhibition and cytotoxicity study. European Journal of Medicinal Chemistry . 2014;76:397–407. doi: 10.1016/j.ejmech.2014.02.049. [DOI] [PubMed] [Google Scholar]
- 26.Maheswari P. U., Palaniandavar M. DNA binding and cleavage activity of [Ru(NH3)4(diimine)]Cl2 complexes. Inorganica Chimica Acta . 2004;357(4):901–912. doi: 10.1016/j.ica.2003.07.010. [DOI] [Google Scholar]
- 27.Halder S., Aggrawal R., Jana S., Saha S. K. Binding interactions of cationic gemini surfactants with gold nanoparticles-conjugated bovine serum albumin: a FRET/NSET, spectroscopic, and docking study. Journal of Photochemistry and Photobiology B: Biology . 2021;225 doi: 10.1016/j.jphotobiol.2021.112351.112351 [DOI] [PubMed] [Google Scholar]
- 28.Sakthikumar K., Solomon R. V., Raja J. D. Spectro-electrochemical assessments of DNA/BSA interactions, cytotoxicity, radical scavenging and pharmacological implications of biosensitive and biologically active morpholine-based metal(II) complexes: a combined experimental and computational investigation. RSC Advances . 2019;9(25):14220–14241. doi: 10.1039/c8ra09218d. [DOI] [PMC free article] [PubMed] [Google Scholar]
- 29.Song Y. M., Wu Q., Yang P. J., Luan N. N., Wang L. F., Liu Y. M. DNA Binding and cleavage activity of Ni(II) complex with all-trans retinoic acid. Journal of Inorganic Biochemistry . 2006;100(10):1685–1691. doi: 10.1016/j.jinorgbio.2006.06.001. [DOI] [PubMed] [Google Scholar]
- 30.Sakthikumar K., Krause R. W. M., Isamura B. K., Raja J. D., Athimoolam S. Spectro-electrochemical, fluorometric and biothermodynamic evaluation of pharmacologically active morpholine scaffold single crystal ligand and its metal(II) complexes: a comparative study on in-vitro and in-silico screening towards DNA/BSA/SARS-CoV-19. Journal of Inorganic Biochemistry . 2022;236(1–23) doi: 10.1016/j.jinorgbio.2022.111953.111953 [DOI] [PubMed] [Google Scholar]
- 31.Mizyed S. Synthesis of new Azacrown ether schiff-bases and their complexes with C₆₀. Jordan Journal of Chemistry . 2013;8(2):71–78. doi: 10.12816/0001518. [DOI] [Google Scholar]
- 32.Sakthikumar K., Raja J. D., Sankarganesh M., Rajesh J. Antimicrobial, antioxidant and DNA interaction studies of water-soluble complexes of schiff base Bearing morpholine moiety. Indian Journal of Pharmaceutical Sciences . 2018;80(4):723–738. doi: 10.4172/pharmaceutical-sciences.1000413. [DOI] [Google Scholar]
- 33.Uma Maheswari P., Palaniandavar M. DNA binding and cleavage properties of certain Tetrammine ruthenium(II) complexes of modified 1, 10-Phenanthrolines – effect of hydrogen-bonding on DNA-binding affinity. Journal of Inorganic Biochemistry . 2004;98(2):219–230. doi: 10.1016/j.jinorgbio.2003.09.003. [DOI] [PubMed] [Google Scholar]
- 34.Raja A., Rajendiran V., Uma Maheswari P., et al. Copper(II) complexes of tridentate Pyridylmethylethylene diamines: role of ligand steric Hindrance on DNA binding and cleavage. Journal of Inorganic Biochemistry . 2005;99(8):1717–1732. doi: 10.1016/j.jinorgbio.2005.05.014. [DOI] [PubMed] [Google Scholar]
- 35.Nagaraj K., Murugan K. S., Thangamuniyandi P., Sakthinathan S. Nucleic acid binding study of surfactant copper(II) complex containing dipyrido[3, 2-a:2′-3′-c]phenazine ligand as an intercalator: in vitro antitumor activity of complex in human liver carcinoma (HepG2) cancer cells. RSC Advances . 2014;4(99):56084–56094. doi: 10.1039/c4ra08049a. [DOI] [Google Scholar]
- 36.Shahabadi N., Kashanian S., Darabi F. DNA binding and DNA cleavage studies of a water soluble cobalt(II) complex containing dinitrogen Schiff base ligand: the effect of metal on the mode of binding. European Journal of Medicinal Chemistry . 2010;45(9):4239–4245. doi: 10.1016/j.ejmech.2010.06.020. [DOI] [PubMed] [Google Scholar]
- 37.Ramana M. M. V., Betkar R., Nimkar A., Ranade P., Mundhe B., Pardeshi S. Synthesis of a novel 4H-pyran analog as minor groove binder to DNA using ethidium bromide as fluorescence probe. Spectrochimica Acta Part A: Molecular and Biomolecular Spectroscopy . 2016;152:165–171. doi: 10.1016/j.saa.2015.07.037. [DOI] [PubMed] [Google Scholar]
- 38.Feizi-Dehnayebi M., Dehghanian E., Mansouri-Torshizi H. Probing the biomolecular (DNA/BSA) interaction by new Pd(II) complex via in-depth experimental and computational perspectives: synthesis, characterization, cytotoxicity, and DFT approach. Journal of the Iranian Chemical Society . 2022;19(7):3155–3175. doi: 10.1007/s13738-022-02519-6. [DOI] [Google Scholar]
- 39.Meti M. D., Nandibewoor S. T., Joshi S. D., More U. A., Chimatadar S. A. Multi-spectroscopic investigation of the binding interaction of fosfomycin with bovine serum albumin. Journal of Pharmaceutical Analysis . 2015;5(4):249–255. doi: 10.1016/j.jpha.2015.01.004. [DOI] [PMC free article] [PubMed] [Google Scholar]
- 40.Hu Y. J., Ou-Yang Y., Zhang Y., Liu Y. Affinity and specificity of Ciprofloxacin-bovine serum albumin interactions: spectroscopic approach. The Protein Journal . 2010;29(4):234–241. doi: 10.1007/s10930-010-9244-6. [DOI] [PubMed] [Google Scholar]
- 41.Na N., Zhao D. Q., Li H., Jiang N., Wen J. Y., Liu H. Y. DNA binding, Photonuclease activity and human serum albumin interaction of a water-soluble Freebase Carboxyl Corrole. Molecules . 2015;21(1):p. 54. doi: 10.3390/molecules21010054. [DOI] [PMC free article] [PubMed] [Google Scholar]
- 42.Arif R., Nayab P. S., Ansari I. A., et al. Synthesis, molecular docking and DNA binding studies of phthalimide-based copper(II) complex: in vitro antibacterial, hemolytic and antioxidant assessment. Journal of Molecular Structure . 2018;1160:142–153. doi: 10.1016/j.molstruc.2018.02.008. [DOI] [Google Scholar]
- 43.Pyle A. M., Rehmann J. P., Meshoyrer R., Kumar C. V., Turro N. J., Barton J. K. Mixed-ligand complexes of ruthenium(II): factors governing binding to DNA. Journal of the American Chemical Society . 1989;111(8):3051–3058. doi: 10.1021/ja00190a046. [DOI] [Google Scholar]
- 44.Farooq S., Siebert J. P. Gaussian Projection, SIGGRAPH ’09: Posters on - SIGGRAPH ’09 . New Orleans: Enlighten: Publications; 2009. [Google Scholar]
- 45.Seeman J. I., Fukui K. Frontier molecular orbital theory, and the Woodward-Hoffmann rules. Part I. The Person. Chemical Record . 2022;22(4) doi: 10.1002/tcr.202100297.e202100297 [DOI] [PubMed] [Google Scholar]
- 46.Kabuyaya Isamura B., Patouossa I., Muya J. T., Lobb K. A. Unveiling the reactivity of truxillic and truxinic acids (TXAs): deprotonation, anion…H–O, cation…O and cation…ππ interactions in TXA0…Y+ and TXA0…Z− complexes (Y = Li, Na, K; Z = F, Cl, Br) Structural Chemistry . 2022:1–16. doi: 10.1007/s11224-022-01965-5. [DOI] [Google Scholar]
- 47.Sandeep G., Nagasree K. P., Hanisha M., Kumar M. M. K., Audocker L. E. AUDocker LE: a GUI for virtual screening with AUTODOCK Vina. BMC Research Notes . 2011;4(1):p. 445. doi: 10.1186/1756-0500-4-445. [DOI] [PMC free article] [PubMed] [Google Scholar]
- 48.Alfaro M., Alfaro I., Angel C. Identification of potential inhibitors of SARS-CoV-2 papain-like protease from tropane alkaloids from Schizanthus porrigens: a molecular docking study. Chemical Physics Letters . 2020;761 doi: 10.1016/j.cplett.2020.138068.138068 [DOI] [PMC free article] [PubMed] [Google Scholar]
- 49.Miguel M. G., Nunes S., Dandlen S. A., Cavaco A. M., Antunes M. D. Phenols, flavonoids and antioxidant activity of aqueous and methanolic extracts of propolis (Apis mellifera L.) from Algarve, South Portugal. Food Science and Technology . 2014;34(1):16–23. doi: 10.1590/s0101-20612014000100002. [DOI] [Google Scholar]
- 50.Boora F., Chirisa E., Mukanganyama S. Evaluation of nitrite radical scavenging properties of selected Zimbabwean plant extracts and their Phytoconstituents. Journal of Food Processing . 2014;2014:7. doi: 10.1155/2014/918018.918018 [DOI] [Google Scholar]
- 51.Sakthikumar K., Sankarganesh M., Raja J. D., Mitu L. Water soluble mixed ligand complexes spectral, antioxidant, antimicrobial and DNA interaction studies. Revista de Chimie . 2018;69(11):3169–3177. doi: 10.37358/rc.18.11.6705. [DOI] [Google Scholar]
- 52.Balouiri M., Sadiki M., Ibnsouda S. K. Methods for in vitro evaluating antimicrobial activity: a review. Journal of Pharmaceutical Analysis . 2016;6(2):71–79. doi: 10.1016/j.jpha.2015.11.005. [DOI] [PMC free article] [PubMed] [Google Scholar]
- 53.Ali I., Wani W. A., Saleem K., Hsieh M. F. Anticancer metallodrugs of glutamic acid sulphonamides: in silico, DNA binding, hemolysis and anticancer studies. RSC Advances . 2014;4(56):29629–29641. doi: 10.1039/c4ra02570a. [DOI] [Google Scholar]
- 54.Sweeney E. E., McDaniel R. E., Maximov P. Y., Fan P., Jordan V. C. Models and mechanisms of acquired antihormone resistance in breast cancer: significant clinical progress despite limitations. Hormone Molecular Biology and Clinical Investigation . 2012;9(2):143–163. doi: 10.1515/hmbci-2011-0004. [DOI] [PMC free article] [PubMed] [Google Scholar]
- 55.Ulukaya E., Colakogullari M., Wood E. J. Interference by anti-cancer chemotherapeutic agents in the MTT-tumor Chemosensitivity assay. Chemotherapy . 2004;50(1):43–50. doi: 10.1159/000077285. [DOI] [PubMed] [Google Scholar]
- 56.Sun Y., Ma R., Wang S., et al. New cofactors and inhibitors for a DNA-cleaving DNAzyme: superoxide anion and hydrogen peroxide mediated an oxidative cleavage process. Scientific Reports . 2017;7(1):p. 378. doi: 10.1038/s41598-017-00329-y. [DOI] [PMC free article] [PubMed] [Google Scholar]
- 57.Kehrer J. P. The Haber–Weiss reaction and mechanisms of toxicity. Toxicology . 2000;149(1):43–50. doi: 10.1016/s0300-483x(00)00231-6. [DOI] [PubMed] [Google Scholar]
- 58.Detmer C. A., Pamatong F. V., Bocarsly J. R. Nonrandom double strand cleavage of DNA by a Monofunctional metal complex: mechanistic studies. Inorganic Chemistry . 1996;35(21):6292–6298. doi: 10.1021/ic960519p. [DOI] [Google Scholar]
- 59.Sudhamani C. N., Bhojya Naik H. S., Gowda K. R. S., Giridhar M., Girija D., Kumar P. N. P. Novel iron phenanthroline-based photosensitizers for antimicrobial PDT: synthesis, DNA binding and photo-induced DNA cleavage activity. Medicinal Chemistry Research . 2017;26(6):1160–1169. doi: 10.1007/s00044-017-1831-z. [DOI] [Google Scholar]
- 60.Wang W., Lee G. J., Jang K. J., Cho T. S., Kim S. K. Real-time detection of Fe{middle dot}EDTA/H2O2-induced DNA cleavage by linear dichroism. Nucleic Acids Research . 2008;36(14):p. e85. doi: 10.1093/nar/gkn370. [DOI] [PMC free article] [PubMed] [Google Scholar]
- 61.Khan N. U. H., Pandya N., Maity N. C., et al. Influence of chirality of V(V) Schiff base complexes on DNA, BSA binding and cleavage activity. European Journal of Medicinal Chemistry . 2011;46(10):5074–5085. doi: 10.1016/j.ejmech.2011.08.020. [DOI] [PubMed] [Google Scholar]
- 62.Gubendran A., Kumar G. G. V., Kesavan M. P., Rajagopal G., Athappan P., Rajesh J. New anthracene based Schiff base ligands appended Cu(II) complexes: theoretical study, DNA binding and cleavage activities. Applied Organometallic Chemistry . 2017;32(3) doi: 10.1002/aoc.4128.e4128 [DOI] [Google Scholar]
- 63.Patra A. K., Nethaji M., Chakravarty A. R. Synthesis, crystal structure, DNA binding and photo-induced DNA cleavage activity of (S-methyl-l-cysteine)copper(II) complexes of heterocyclic bases. Journal of Inorganic Biochemistry . 2007;101(2):233–244. doi: 10.1016/j.jinorgbio.2006.09.018. [DOI] [PubMed] [Google Scholar]
- 64.Benesi H. A., Hildebrand J. H. A spectrophotometric investigation of the interaction of Iodine with aromatic Hydrocarbons. Journal of the American Chemical Society . 1949;71(8):2703–2707. doi: 10.1021/ja01176a030. [DOI] [Google Scholar]
- 65.Reddy P. R., Shilpa A., Raju N., Raghavaiah P. Synthesis, structure, DNA binding and cleavage properties of ternary amino acid Schiff base-phen/bipy Cu(II) complexes. Journal of Inorganic Biochemistry . 2011;105(12):1603–1612. doi: 10.1016/j.jinorgbio.2011.08.022. [DOI] [PubMed] [Google Scholar]
- 66.Cory M., McKee D. D., Kagan J., Henry D. W., Miller J. A. Design, synthesis, and DNA binding properties of bifunctional intercalators. Comparison of polymethylene and diphenyl ether chains connecting phenanthridine. Journal of the American Chemical Society . 1985;107(8):2528–2536. doi: 10.1021/ja00294a054. [DOI] [Google Scholar]
- 67.Selvakumar B., Rajendiran V., Uma Maheswari P., Stoeckli-Evans H., Palaniandavar M. Structures, spectra, and DNA-binding properties of mixed ligand copper(II) complexes of iminodiacetic acid: the novel role of diimine co-ligands on DNA conformation and hydrolytic and oxidative double strand DNA cleavage. Journal of Inorganic Biochemistry . 2006;100(3):316–330. doi: 10.1016/j.jinorgbio.2005.11.018. [DOI] [PubMed] [Google Scholar]
- 68.Gellert M., Smith C. E., Neville D., Felsenfeld G. Actinomycin binding to DNA: mechanism and specificity. Journal of Molecular Biology . 1965;11(3):445–457. doi: 10.1016/s0022-2836(65)80001-8. [DOI] [PubMed] [Google Scholar]
- 69.Shahabadi N., Fatahi N., Mahdavi M., Nejad Z. K., Pourfoulad M. Multispectroscopic studies of the interaction of calf thymus DNA with the anti-viral drug, valacyclovir. Spectrochimica Acta Part A: Molecular and Biomolecular Spectroscopy . 2011;83(1):420–424. doi: 10.1016/j.saa.2011.08.056. [DOI] [PubMed] [Google Scholar]
- 70.Chaires J. B. Energetics of drug–DNA interactions. Biopolymers . 1997;44(3):201–215. doi: 10.1002/(sici)1097-0282(1997)44:3<201::aid-bip2>3.0.co;2-z. [DOI] [PubMed] [Google Scholar]
- 71.Parveen S., Arjmand F. De novo design, synthesis and spectroscopic characterization of chiral benzimidazole-derived amino acid Zn(II) complexes: development of tryptophan-derived specific hydrolytic DNA artificial nuclease agent. Spectrochimica Acta Part A: Molecular and Biomolecular Spectroscopy . 2012;85(1):53–60. doi: 10.1016/j.saa.2011.09.006. [DOI] [PubMed] [Google Scholar]
- 72.Barkhudaryan V. G., Ananyan G. V. Development of viscometric methods for studying the interaction of porphyrins with DNA. Journal of Biomolecular Structure and Dynamics . 2019;38(12):3489–3495. doi: 10.1080/07391102.2019.1660217. [DOI] [PubMed] [Google Scholar]
- 73.Lian W. J., Wang X. T., Xie C. Z., et al. Mixed-ligand copper(II) Schiff base complexes: the role of the co-ligand in DNA binding, DNA cleavage, protein binding and cytotoxicity. Dalton Transactions . 2016;45(22):9073–9087. doi: 10.1039/c6dt00461j. [DOI] [PubMed] [Google Scholar]
- 74.Deepa S., Mishra A. K. Fluorescence spectroscopic study of serum albumin–bromadiolone interaction: fluorimetric determination of bromadiolone. Journal of Pharmaceutical and Biomedical Analysis . 2005;38(3):556–563. doi: 10.1016/j.jpba.2005.01.023. [DOI] [PubMed] [Google Scholar]
- 75.Sevilla P., Rivas J. M., García-Blanco F., García-Ramos J. V., Sánchez-Cortés S. Identification of the antitumoral drug emodin binding sites in bovine serum albumin by spectroscopic methods. Biochimica et Biophysica Acta (BBA) - Proteins & Proteomics . 2007;1774(11):1359–1369. doi: 10.1016/j.bbapap.2007.07.022. [DOI] [PubMed] [Google Scholar]
- 76.Hamishehkar H., Hosseini S., Naseri A., Safarnejad A., Rasoulzadeh F. Interactions of cephalexin with bovine serum albumin: displacement reaction and molecular docking. BioImpacts . 2016;6(3):125–133. doi: 10.15171/bi.2016.19. [DOI] [PMC free article] [PubMed] [Google Scholar]
- 77.Kumar Panigrahi S., Kumar Mishra A. Inner filter effect in fluorescence spectroscopy: as a problem and as a solution. Journal of Photochemistry and Photobiology C: Photochemistry Reviews . 2019;41 doi: 10.1016/j.jphotochemrev.2019.100318.100318 [DOI] [Google Scholar]
- 78.Dhara K., Ratha J., Manassero M., Wang X. Y., Gao S., Banerjee P. Synthesis, crystal structure, magnetic property and oxidative DNA cleavage activity of an octanuclear copper(II) complex showing water–perchlorate helical network. Journal of Inorganic Biochemistry . 2007;101(1):95–103. doi: 10.1016/j.jinorgbio.2006.08.010. [DOI] [PubMed] [Google Scholar]
- 79.Ray A., Koley Seth B., Pal U., Basu S. Nickel(II)-Schiff base complex recognizing domain II of bovine and human serum albumin: spectroscopic and docking studies. Spectrochimica Acta Part A: Molecular and Biomolecular Spectroscopy . 2012;92:164–174. doi: 10.1016/j.saa.2012.02.060. [DOI] [PubMed] [Google Scholar]
- 80.Feng Q., Li N. Q., Jiang Y. Y. Electrochemical studies of porphyrin interacting with DNA and determination of DNA. Analytica Chimica Acta . 1997;344(1-2):97–104. doi: 10.1016/s0003-2670(97)00008-1. [DOI] [Google Scholar]
- 81.Roy M., Biswal D., Sarkar O., et al. Synthesis, characterization, DFT calculations, protein binding and molecular docking studies of mononuclear dioxomolybdenum(VI) complexes with ONS donor ligand. Journal of Molecular Structure . 2021;1234 doi: 10.1016/j.molstruc.2021.130192.130192 [DOI] [Google Scholar]
- 82.Jain A., Blum C., Subramaniam V. Fluorescence lifetime spectroscopy and imaging of visible fluorescent proteins. Advances in Biomedical Engineering . 2009;0:147–176. doi: 10.1016/b978-0-444-53075-2.00004-6. [DOI] [Google Scholar]
- 83.Bhuin S., Halder S., Saha S. K., Chakravarty M. Binding interactions and FRET between bovine serum albumin and various phenothiazine-/anthracene-based dyes: a structure–property relationship. RSC Advances . 2021;11(3):1679–1693. doi: 10.1039/d0ra09580j. [DOI] [PMC free article] [PubMed] [Google Scholar]
- 84.Raman N., Sobha S. Exploring the DNA binding mode of transition metal based biologically active compounds. Spectrochimica Acta Part A: Molecular and Biomolecular Spectroscopy . 2012;85(1):223–234. doi: 10.1016/j.saa.2011.09.065. [DOI] [PubMed] [Google Scholar]
- 85.Carter M. T., Rodriguez M., Bard A. J. Voltammetric studies of the interaction of metal chelates with DNA. 2. Tris-chelated complexes of cobalt(III) and iron(II) with 1, 10-phenanthroline and 2, 2’-bipyridine. Journal of the American Chemical Society . 1989;111(24):8901–8911. doi: 10.1021/ja00206a020. [DOI] [Google Scholar]
- 86.Motati D. R., Uredi D., Watkins E. B. A general method for the metal-free, regioselective, remote C–H halogenation of 8-substituted quinolines. Chemical Science . 2018;9(7):1782–1788. doi: 10.1039/c7sc04107a. [DOI] [PMC free article] [PubMed] [Google Scholar]
- 87.Arshad N., Yunus U., Razzque S., et al. Electrochemical and spectroscopic investigations of isoniazide and its analogs with ds.DNA at physiological pH: evaluation of biological activities. European Journal of Medicinal Chemistry . 2012;47:452–461. doi: 10.1016/j.ejmech.2011.11.014. [DOI] [PubMed] [Google Scholar]
- 88.Hussain R. A., Badshah A., Akbar K. Comparative DNA binding and antioxidant studies of acetyl and benzoyl substituted ferrocene incorporated selenoureas. Russian Journal of Electrochemistry . 2015;51(3):198–208. doi: 10.1134/s1023193515030088. [DOI] [Google Scholar]
- 89.Poorniammal R., Balachandar D., Gunasekaran S. Evaluation of antioxidant property of some fungal pigments by DNA protection assay. Annals of Phytomedicine: International Journal . 2018;7(1):106–111. doi: 10.21276/ap.2018.7.1.13. [DOI] [Google Scholar]
- 90.Sethupathi M., Thulasinathan B., Sengottuvelan N., et al. Macrocyclic ‘tet a’-derived cobalt(III) complex with a N, N′-Disubstituted Hexadentate ligand: crystal structure, Photonuclease activity, and as a Photosensitizer. ACS Omega . 2021;7(1):669–682. doi: 10.1021/acsomega.1c05306. [DOI] [PMC free article] [PubMed] [Google Scholar]
- 91.Aslanoglu M. Electrochemical and spectroscopic studies of the interaction of Proflavine with DNA. Analytical Sciences . 2006;22(3):439–443. doi: 10.2116/analsci.22.439. [DOI] [PubMed] [Google Scholar]
- 92.Xu Z., Bai G., Dong C. Studies on interaction of an intramolecular charge transfer fluorescence probe: 4′-Dimethylamino-2, 5-dihydroxychalcone with DNA. Bioorganic & Medicinal Chemistry . 2005;13(20):5694–5699. doi: 10.1016/j.bmc.2005.06.023. [DOI] [PubMed] [Google Scholar]
- 93.Arshad N., Mir M. I., Perveen F., et al. Investigations on anticancer potentials by DNA binding and cytotoxicity studies for newly synthesized and characterized Imidazolidine and Thiazolidine-based Isatin derivatives. Molecules . 2022;27(2):p. 354. doi: 10.3390/molecules27020354. [DOI] [PMC free article] [PubMed] [Google Scholar]
- 94.Daskalakis M., Nguyen T. T., Nguyen C., et al. Demethylation of a hypermethylated P15/INK4B gene in patients with myelodysplastic syndrome by 5-Aza-2′-deoxycytidine (decitabine) treatment. Blood . 2002;100(8):2957–2964. doi: 10.1182/blood.v100.8.2957. [DOI] [PubMed] [Google Scholar]
- 95.Kelly J. J., Baird E. E., Dervan P. B. Binding site size limit of the 2:1 pyrrole-imidazole polyamide-DNA motif. Proceedings of the National Academy of Sciences . 1996;93(14):6981–6985. doi: 10.1073/pnas.93.14.6981. [DOI] [PMC free article] [PubMed] [Google Scholar]
- 96.Wang K. Y., Gerena L., Swaminathan S., Bolton P. H. Determination of the number and location of the manganese binding sites of DNA quadruplexes in solution by EPR and NMR. Nucleic Acids Research . 1995;23(5):844–848. doi: 10.1093/nar/23.5.844. [DOI] [PMC free article] [PubMed] [Google Scholar]
- 97.Berezhkovskiy L. M. On the calculation of the concentration dependence of drug binding to Plasma proteins with Multiple binding sites of different affinities: determination of the possible variation of the Unbound drug Fraction and calculation of the number of binding sites of the protein. Journal of Pharmaceutical Sciences . 2007;96(2):249–257. doi: 10.1002/jps.20777. [DOI] [PubMed] [Google Scholar]
- 98.Pravin N., Raman N. Investigation of in vitro anticancer and DNA strap interactions in live cells using carboplatin type Cu(II) and Zn(II) metalloinsertors. European Journal of Medicinal Chemistry . 2014;85:675–687. doi: 10.1016/j.ejmech.2014.08.036. [DOI] [PubMed] [Google Scholar]
- 99.Maruyama K., Mishima Y., Minagawa K., Motonaka J. Electrochemical and DNA-binding properties of dipyridophenazine complexes of osmium(II) Journal of Electroanalytical Chemistry . 2001;510(1-2):96–102. doi: 10.1016/s0022-0728(01)00549-6. [DOI] [Google Scholar]
- 100.Iqbal M., Ali S., Tahir M. N. Octahedral copper(II) carboxylate complex: synthesis, structural description, DNA-binding and anti-bacterial studies. Journal of Coordination Chemistry . 2018;71(7):991–1002. doi: 10.1080/00958972.2018.1456655. [DOI] [Google Scholar]
- 101.Somasundaram I., Palaniandavar M. Factors influencing the stability of ATP in ternary complexes: spectroscopic investigation of the interaction of certain biomimetic copper(II) complexe with ATP and AMP. Journal of Inorganic Biochemistry . 1994;53(2):95–107. doi: 10.1016/0162-0134(94)85024-0. [DOI] [Google Scholar]
- 102.Shakeel M., Butt T. M., Zubair M., et al. Electrochemical investigations of DNA-Intercalation potency of bisnitrophenoxy compounds with different alkyl chain lengths. Heliyon . 2020;6 doi: 10.1016/j.heliyon.2020.e04124.e04124 [DOI] [PMC free article] [PubMed] [Google Scholar]
- 103.Janjua N. K., Akhter Z., Jabeen F., Iftikhar B. Cyclic Voltammetric investigation of interactions between Bisnitroaromatic compounds and ds.DNA. Journal of the Korean Chemical Society . 2014;58(2):153–159. doi: 10.5012/jkcs.2014.58.2.153. [DOI] [Google Scholar]
- 104.Wang S., Peng T., Yang C. F. Electrochemical determination of interaction parameters for DNA and mitoxantrone in an irreversible redox process. Biophysical Chemistry . 2003;104(1):239–248. doi: 10.1016/s0301-4622(02)00371-x. [DOI] [PubMed] [Google Scholar]
- 105.Kathiresan S., Mugesh S., Murugan M., Ahamed F., Annaraj J. Mixed-ligand copper(II)-phenolate complexes: structure and studies on DNA/protein binding profiles, DNA cleavage, molecular docking and cytotoxicity. RSC Advances . 2016;6(3):1810–1825. doi: 10.1039/c5ra20607c. [DOI] [Google Scholar]
- 106.Alanazi A. M., Abdelhameed A. S. A spectroscopic approach to investigate the molecular interactions between the newly Approved irreversible ErbB blocker ‘Afatinib’ and bovine serum albumin. PLoS One . 2016;11(1) doi: 10.1371/journal.pone.0146297.e0146297 [DOI] [PMC free article] [PubMed] [Google Scholar]
- 107.Yu S., Perálvarez-Marín A., Minelli C., Faraudo J., Roig A., Laromaine A. Albumin-coated SPIONs: an experimental and theoretical evaluation of protein conformation, binding affinity and competition with serum proteins. Nanoscale . 2016;8(30):14393–14405. doi: 10.1039/c6nr01732k. [DOI] [PubMed] [Google Scholar]
- 108.Idowu M., Lamprecht E., Nyokong T. Interaction of water-soluble thiol capped CdTe quantum dots and bovine serum albumin. Journal of Photochemistry and Photobiology A: Chemistry . 2008;198(1):7–12. doi: 10.1016/j.jphotochem.2008.02.008. [DOI] [Google Scholar]
- 109.Theetharappan M., Subha L., Balakrishnan C., Neelakantan M. A. Binding interactions of mixed ligand copper(II) amino acid Schiff base complexes with biological targets: spectroscopic evaluation and molecular docking. Applied Organometallic Chemistry . 2017;31(10):p. e3713. doi: 10.1002/aoc.3713. [DOI] [Google Scholar]
- 110.Parr R. G., Pearson R. G. Absolute hardness: companion parameter to absolute electronegativity. Journal of the American Chemical Society . 1983;105(26):7512–7516. doi: 10.1021/ja00364a005. [DOI] [Google Scholar]
- 111.Pearson R. G. Absolute electronegativity and hardness: applications to organic chemistry. Journal of Organic Chemistry . 1989;54(6):1423–1430. doi: 10.1021/jo00267a034. [DOI] [Google Scholar]
- 112.Kavitha R., Nirmala S., Nithyabalaji R., Sribalan R. Biological evaluation, molecular docking and DFT studies of charge transfer complexes of quinaldic acid with heterocyclic carboxylic acid. Journal of Molecular Structure . 2020;1204 doi: 10.1016/j.molstruc.2019.127508.127508 [DOI] [Google Scholar]
- 113.Politzer P., Murray J. S. Quantitative Analyses of molecular surface electrostatic potentials in relation to hydrogen bonding and Co-Crystallization. Crystal Growth & Design . 2015;15(8):3767–3774. doi: 10.1021/acs.cgd.5b00419. [DOI] [Google Scholar]
- 114.Kasende O. E., Matondo A., Muzomwe M., Muya J. T., Scheiner S. Interaction between temozolomide and water: preferred binding sites. Computational and Theoretical Chemistry . 2014;1034:26–31. doi: 10.1016/j.comptc.2014.02.005. [DOI] [Google Scholar]
- 115.Isamura B. K., Lobb K. A., Muya J. T. Regioselectivity, chemical bonding and physical nature of the interaction between imidazole and XAHs (X=H, F, Cl, Br, CH3, and A=S, Se, Te) Molecular Physics . 2022;120(7):p. e2026511. doi: 10.1080/00268976.2022.2026511. [DOI] [Google Scholar]
- 116.Cherrak S. A., Merzouk H., Mokhtari-Soulimane N. Potential bioactive glycosylated flavonoids as SARS-CoV-2 main protease inhibitors: a molecular docking and simulation studies. PLoS One . 2020;15(10) doi: 10.1371/journal.pone.0240653.e0240653 [DOI] [PMC free article] [PubMed] [Google Scholar]
- 117.Mengist H. M., Dilnessa T., Jin T. Structural Basis of potential inhibitors targeting SARS-CoV-2 main protease. Frontiers of Chemistry . 2021;9(1–19) doi: 10.3389/fchem.2021.622898.622898 [DOI] [PMC free article] [PubMed] [Google Scholar]
- 118.Javanmardi J. Antioxidant activity and total phenolic content of Iranian Ocimum accessions. Food Chemistry . 2003;83(4):547–550. doi: 10.1016/s0308-8146(03)00151-1. [DOI] [Google Scholar]
- 119.Dhaveethu Raja J., Sakthikumar K. Synthesis of water soluble transition metal(II) complexes from Morpholine condensed tridentate schiff base: structural elucidation, antimicrobial, antioxidant and DNA interaction studies. Journal of Chemical and Pharmaceutical Research . 2015;7:23–34. [Google Scholar]
- 120.Dhaveethu Raja J., Sukkur Saleem S., Sakthikumar K., Sankarganesh M., Vadivel M. Synthesis of transition metal(II) complexes from piperonal condensed Schiff base: structural elucidation, antimicrobial, antioxidant, DNA-binding and oxidative cleavage studies. Journal of Chemical and Pharmaceutical Research . 2015;7:67–76. [Google Scholar]
- 121.Liu F., Meadows K. A., McMillin D. R. DNA-binding studies of Cu(bcp)2+ and Cu(dmp)2+: DNA elongation without intercalation of Cu(bcp)2+ Journal of the American Chemical Society . 1993;115(15):6699–6704. doi: 10.1021/ja00068a029. [DOI] [Google Scholar]
- 122.Al Zoubi W., Al-Hamdani A. A. S., Kaseem M. Synthesis and antioxidant activities of Schiff bases and their complexes: a review. Applied Organometallic Chemistry . 2016;30(10):810–817. doi: 10.1002/aoc.3506. [DOI] [Google Scholar]
- 123.Thimmaiah K. N., Lloyd W. D., Chandrappa G. T. Stereochemistry and fungitoxicity of complexes of p-anisaldehydethiosemicarbazone with Mn(II), Fe(II), Co(II) and Ni(II) Inorganica Chimica Acta . 1985;106(2):81–83. doi: 10.1016/s0020-1693(00)82252-5. [DOI] [Google Scholar]
- 124.Paulpandiyan R., Arunadevi A., Raman N. Role of Knoevenagel condensate pyrazolone derivative Schiff base ligated transition metal complexes in biological assay and cytotoxic efficacy. Applied Organometallic Chemistry . 2017;31:1–11. doi: 10.1002/aoc.3792. [DOI] [Google Scholar]
- 125.Li S., Ma Z., Liu X., Tian J., Yan S. Synthesis, crystal structures, DNA/bovine serum albumin binding, DNA cleavage and cytotoxicity of five mononuclear zinc(II) complexes. Applied Organometallic Chemistry . 2017;31(11) doi: 10.1002/aoc.3802. [DOI] [Google Scholar]
- 126.Petrović Z. D., Đorović J., Simijonović D., Trifunović S., Petrović V. P. In vitro study of iron coordination properties, anti-inflammatory potential, and cytotoxic effects of N-salicylidene and N-vanillidene anil Schiff bases. Chemical Papers . 2018;72(9):2171–2180. doi: 10.1007/s11696-018-0419-5. [DOI] [Google Scholar]
- 127.Kumaravel G., Ponnukalai P. U., Mahendiran D., Raman N. Exploring the DNA interactions, FGF growth receptor interaction and biological screening of metal(II) complexes of NNN donor ligand derived from 2-(aminomethyl)benzimidazole. International Journal of Biological Macromolecules . 2019;126:1303–1317. doi: 10.1016/j.ijbiomac.2018.09.116. [DOI] [PubMed] [Google Scholar]
- 128.Lozynskyi A., Zimenkovsky B., Radko L., et al. Synthesis and cytotoxicity of new thiazolo[4, 5-b]pyridine-2(3H)-one derivatives based on α, β-unsaturated ketones and α-ketoacids. Chemical Papers . 2017;72(3):669–681. doi: 10.1007/s11696-017-0318-1. [DOI] [Google Scholar]
- 129.Zhou X., Zhang C., Zhang G., Liao Y. Intercalation of the daphnetin–Cu(II) complex with calf thymus DNA. RSC Advances . 2016;6(7):5408–5418. doi: 10.1039/c5ra22274e. [DOI] [Google Scholar]
Associated Data
This section collects any data citations, data availability statements, or supplementary materials included in this article.
Supplementary Materials
Tables (S1–S17) and Figures (S1–S38) were encapsulated in the electronic supplementary information file.
Data Availability Statement
The spectro-electro-hydrodynamic and fluorometric titrations and comparison with theoretical measurements for DNA/BSA/SARS-CoV-2 biomolecules, radical scavenging, and cytotoxic properties are included within the article, and the physicochemical characteristics of the ligand and complexes to support the findings of this study can be referred to at https://doi.org/10.1039/c8ra09218d and https://doi.org/10.1016/j.jinorgbio.2022.111953.