


Abstract
Oral squamous cell carcinoma (OSCC) accounts for about 90% of oral cancers. Expression of the long noncoding RNA (lncRNA) maternally expressed 3 (MEG3) has previously been reported to be downregulated in OSCC, and its overexpression can inhibit proliferation, migration, and invasion and promote apoptosis of OSCC cells. However, the mechanism underlying MEG3 downregulation in OSCC has not been well characterized. Here we report that low expression of MEG3 is caused by H3K27me3 modification of the MEG3 gene locus, and this is associated with the poor prognosis of OSCC. Overexpression of MEG3 inhibited the proliferation and invasion of OSCC cells. We observed that MEG3 was modified by m6A and bound to YTHDC1. Enhancer‐controlled genes positively regulated by MEG3 were functionally enriched for the ‘negative regulation of Wnt signaling pathway’ term, as determined using metascape. GATA3 was predicted to be a transcription factor for these genes, and was demonstrated to bind to MEG3. Knockdown of GATA3 countered the effects on proliferation, invasion, and increased transcription of HIC1 and PRICKLE1 induced by MEG3 overexpression. In conclusion, our data suggest that MEG3 is downregulated in OSCC due to trimethylation of H3K27 at the MEG3 gene locus. The inhibitory effect of MEG3 on proliferation and invasion of OSCC cells was dependent on the binding of GATA3.
Keywords: GATA3, H3K27me3, m6A, MEG3, noncoding RNA, oral squamous cell carcinoma
We report that the lncRNA maternally expressed 3 (MEG3) was downregulated in oral squamous cell carcinoma (OSCC), and this was mediated by H3K27me3 modification of the MEG3 gene locus. Overexpression of MEG3 inhibited the proliferation and invasion of OSCC cells. Furthermore, the anticancer function of MEG3 in OSCC is dependent on the interaction with GATA3.

Abbreviations
- ANOVA
analysis of variance
- ATCC
American Type Culture Collection
- BRD4
bromodomain containing 4
- CCK8
cell counting kit 8
- ChIP
chromatin immunoprecipitation
- EZH2
enhancer of zeste homolog 2
- GATA3
GATA binding protein 3
- GEO
Gene Expression Omnibus
- H3K27me3
trimethylation of Lys‐27 in histone 3
- HIC1
HIC ZBTB transcriptional repressor 1
- lncRNA
long noncoding RNA
- m6A
N6‐methyladenosine
- MEG3
long noncoding RNA maternally expressed 3
- NOK
normal oral keratinocyte line
- OD
optical density
- oe‐Control
empty plasmid
- oe‐MEG3
MEG3 overexpression plasmid
- OS
overall survival
- OSCC
oral squamous cell carcinoma
- PFS
progression‐free survival
- PRICKLE1
prickle planar cell polarity protein 1
- qRT‐PCR
quantitative real time‐polymerase chain reaction
- RIP
RNA immunoprecipitation
- si‐GATA3
siRNA targeting GATA3
- si‐NC
siRNA negative control
- SRAMP
sequence‐based RNA adenosine methylation site predictor
- TCGA
The Cancer Genome Atlas
- TRF2
telomeric repeat binding factor 2
- YTHDC1
YTH domain containing 1
Oral cancer is the sixth most common malignancy worldwide, with about 354 864 new cases and 177 384 deaths annually [1, 2]. As the most common pathological type of oral cancer, oral squamous cell carcinoma (OSCC) accounts for about 90% of oral cancers [3]. The preferred position of OSCC is the tongue and mouth floor. Early symptoms of OSCC are atypical, and most patients are diagnosed at an advanced stage of the disease [4]. Patients with advanced OSCC are prone to lymph node metastasis and recurrence [5]. It is worth noting that when patients present with metastasis outside the anterior lymph nodes, they often develop metastasis to other distant organs [5]. Patients with advanced OSCC have a poor prognosis, with a 5‐year survival of only about 30% [6, 7]. The identification of biomarkers for the diagnosis and treatment of OSCC has great clinical importance.
LncRNA maternally expressed 3 (MEG3) is ~ 1600 nucleotides in length [8]. MEG3 expression is downregulated in a variety of tumors such as gastric cancer, nasopharyngeal carcinoma, colorectal cancer, breast cancer, and prostate cancer [9, 10, 11, 12, 13]. In previous studies, MEG3 expression was reported to be downregulated in OSCC tissues [14, 15, 16]. Overexpression of MEG3 could inhibit proliferation, migration, invasion, and promote apoptosis of OSCC cells [14, 15, 16]. However, the mechanism underlying MEG3 downregulation in OSCC has not been well characterized. Hypermethylation of the gene locus is an essential mechanism for suppressing gene expression [17]. Several studies reveal that the low expression of MEG3 in adenoma, meningioma, and neuroblastoma is directly related to the trimethylation of Lys‐27 in histone 3 (H3K27me3) of the MEG3 gene promoter [18, 19, 20]. However, it is unknown whether the downregulation of MEG3 expression in OSCC is related to H3K27me3 modification of the MEG3 gene locus.
Recently, the mechanism of MEG3 inhibiting tumor progression has attracted extensive attention. For example, MEG3 inhibits hepatocarcinogenesis by inhibiting the activity of telomerase and telomeric repeat binding factor 2 (TRF2) [21]. Chen et al. reported that MEG3 inhibits multiple myeloma progression through upregulating p53 [22]. MEG3 inhibits migration and promotes apoptosis of OSCC cells by regulating the JAK/STAT signaling pathway through adsorption of miR‐548d‐3p [14]. Another study has shown that MEG3 inhibits proliferation and migration of OSCC cells by targeting miR‐21 [15]. In addition, MEG3 could inhibit proliferation and metastasis of OSCC cells by suppressing the Wnt/β‐catenin signaling pathway [23]. LncRNAs regulate gene expression at multiple levels, including epigenetic, transcriptional, and posttranscriptional levels. MEG3 is a chromatin‐interacting lncRNA, and its mechanism of regulation of gene expression remains elusive [24]. The detailed mechanism by which MEG3 inhibits OSCC progression is a subject deserving in‐depth study.
N6‐methyladenosine (m6A) is a prevalent epigenetic modification of RNA [25]. m6A modification is dynamically regulated by methyltransferases (writers), demethylases (erasers), and methyl recognition protein (readers) [26]. m6A modification of lncRNAs influences cancer progression by regulating biological functions associated with cancer [25]. However, whether MEG3 is modified by m6A in OSCC cells, and whether m6A modification of MEG3 is associated with MEG3‐mediated regulation of the target gene, remains to be elucidated.
The purpose of this study was to elucidate whether the downregulation of MEG3 in OSCC cells is associated with H3K27me3 at MEG3 gene locus, and to uncover the transcription factors involved in the cancer‐suppressive function of MEG3.
Materials and methods
Datasets
Gene expression profiles of 324 OSCC tissues and 32 normal control tissues were downloaded from The Cancer Genome Atlas (TCGA, https://tcga‐data.nci.nih.gov/tcga/) using the r package ‘TCGAbiolinks.’ H3K27me3 ChIP‐seq data of Cal27 and SCC4 cells, as well as H3K27ac ChIP‐seq data of Cal27 cells were downloaded from GSE149670 dataset of the Gene Expression Omnibus (GEO, http://www.ncbi.nlm.nih.gov/geo/).
Prediction of m6A site of MEG3
Sequence‐based RNA adenosine methylation site predictor (SRAMP, http://www.cuilab.cn/sramp) is a database based on a random forest machine‐learning framework, which is able to predict potential m6A sites and calculate the confidence for each m6A site [27]. In this study, potential m6A sites for MEG3 were predicted by the SRAMP database.
Identification of H3K27me3 peak, H3K27ac peak and enhancer‐controlled gene
H3K27me3 and H3K27ac peaks were visualized using the integrative genomics viewer (https://igv.org). Enhancers were identified using the homer ‘findPeaks’ package based on H3K27ac ChIP‐seq data of Cal27 cells from GSE149670. The enhancer‐controlled gene was defined as the gene that is nearest to the enhancer region, and was identified by the homer ‘annotatePeaks’ package.
Gene expression correlation analysis
Pearson's correlation was analyzed for gene expression correlation using r package ‘stats’ based on the data downloaded from TCGA database. P < 0.05 and ¦cor¦ ≥ 0.3 were set as the threshold value to screen for genes significantly correlated with MEG3 expression.
Biological function analysis
metascape (https://metascape.org/) is an online platform for gene function annotation [28]. Biological function of genes was enriched using metascape in this study.
Transcription factor prediction
The cistrome data Browser is a website for cis‐regulatory information, such as transcription factor binding sites, histone posttranslational modifications, and chromatin endonuclease action sites, of human and mouse [29]. In this study, transcription factors were predicted by the Toolkit for cistrome data Browser (http://dbtoolkit.cistrome.org/).
Patients
Seventy‐two patients with OSCC who underwent surgical resection at the Fourth Affiliated Hospital of Hebei Medical University from January 2005 to December 2010 were enrolled in this study. All patients were pathologically confirmed with OSCC. OSCC and adjacent normal tissues (> 2 cm from the tumor margin) were collected. None of these patients were receiving chemotherapy, radiotherapy, or other cancer‐related treatment prior to surgery. Written informed consent was obtained from all enrolled patients. The study methodologies conformed to the standards set by the Declaration of Helsinki. This study was approved by the Ethics Committee of the Fourth Affiliated Hospital of Hebei Medical University (Approval No. 2022KY391).
Prognostic analysis
Gene expression and clinical data of the 72 OSCC patients collected in this study was used for prognostic analysis. Patients were divided into MEG3‐high and MEG3‐low expression groups according to the median of MEG3 expression. Overall survival (OS) and progression‐free survival (PFS) were analyzed by Kaplan–Meier plots and log‐rank tests with the r package ‘survival.’ P < 0.05 was considered a significant difference.
Cell culture and treatment
Four OSCC cell lines, SCC4, SCC9, SCC25, and Cal27, and one human normal oral keratinocyte line (NOK), primary gingival keratinocytes, were obtained from the American Type Culture Collection (ATCC, Rockville, MD, USA). Cells were cultured in Dulbecco's modified Eagle medium (DMEM) medium (Gibco, Gaithersburg, MD, USA) containing 10% FBS (Gibco) and 1% penicillin–streptomycin (Gibco) at 37 °C with 5% CO2. To investigate whether MEG3 downregulation in OSCC cells is associated with H3K27me3 modification of the MEG3 gene locus, Cal27 and SCC4 cells were treated with 5 μm enhancer of zeste homolog 2 (EZH2) inhibitor GSK126 (Beyotime, Shanghai, China) at 37 °C for 36 h.
Cell transfection
MEG3 overexpression plasmid (oe‐MEG3), empty plasmid (oe‐Control), siRNA targeting GATA3 (si‐GATA3), and siRNA negative control (si‐NC) were purchased from GenePharma (Shanghai, China). Cal27 and SCC4 cells were seeded into 6‐well plates and cultured to 70% confluence followed by cell transfection. Lipofectamine 3000 (Invitrogen, La Jolla, CA, USA) was used for cell transfection according to the manufacturer's instructions. Cells were harvested 48 h after transfection for subsequent analysis.
Quantitative real‐time polymerase chain reaction (qRT‐PCR)
Total RNA of OSCC cells or tissues was extracted using TRIzol (Invitrogen). RNA was reverse transcribed to cDNA using the PrimeScript RT reagent Kit (TaKaRa, Kyoto, Japan). qRT‐PCR amplification was performed using the SYBR Green qPCR Master Mix Kit (TaKaRa) according to the manufacturer's instructions. GAPDH was employed as the internal reference. Relative gene expression was calculated according to the 2−ΔΔCt method. The sequences of primers were as follows: MEG3, forward, 5'‐CTTTTCTGGGGGAATGGGG‐3′; reverse, 5'‐AGAGGGGTGGGAAGGGACT‐3′. HIC1, forward, 5'‐GTCGTGCGACAAGAGCTACAA‐3′; reverse, 5'‐CGTTGCTGTGCGAACTTGC‐3′. PRICKLE1, forward, 5'‐TTTGCTTGCTTACCAGAGGAAA‐3′; reverse, 5'‐ACTGGCAATACCGTACCTCAT‐3′. GATA3, forward, 5'‐GCCCCTCATTAAGCCCAAG‐3′; reverse, 5'‐TTGTGGTGGTCTGACAGTTCG‐3′. GAPDH, forward, 5'‐GGAGCGAGATCCCTCCAAAAT‐3′; reverse, 5'‐GGCTGTTGTCATACTTCTCATGG‐3′.
Chromatin immunoprecipitation (ChIP)‐qPCR
Cal27 and SCC4 cells in the GSK126 treatment group and control group were cross‐linked with 1% formaldehyde for 10 min and then lysed with cell lysis solution for 20 min. The cross‐linked chromatin was sonicated with Covaris E220 (Woburn, MA, USA). Immunoprecipitation with anti‐H3K27me3 (#ab6002, Abcam, Cambridge, MA, USA) and anti‐IgG (#ab133470, Abcam) was performed overnight at 4 °C. The DNA was purified using a Gel Extraction Kit (Omega Bio‐Tek, Norcross, GA, USA). Finally, qRT‐PCR was performed using the purified products. The sequences of primers were as follows: Region 1, forward, 5'‐CAAGTCCCCGCAGATGAAGT‐3′; reverse, 5'‐CAGGACACAGGGCACCTTAG‐3′. Region 2, forward, 5'‐GTCAAACGCATACCCTCCCA‐3′; reverse, 5'‐GGGTCAGACACCCCAATGAG‐3′.
RNA immunoprecipitation (RIP)‐qPCR
Cal27 and SCC4 cells were lysed with RIPA lysis buffer (Solarbio, Beijing, China). Binding of YTHDC1 or GATA3 to MEG3 was detected using anti‐YTHDC1 (#ab264375, Abcam), anti‐GATA3 (#ab199428, Abcam), and anti‐IgG (#ab133470, Abcam) and the Magna RIP Kit (Millipore, Billerica, MA, USA) according to the manufacturer's protocol. The m6A modification of MEG3 was detected using anti‐m6A (#ab208577, Abcam), anti‐IgG (#ab133470, Abcam), and Magna MeRIP™ m6A Kit (Millipore) according to the manufacturer's instructions. Relative enrichment of RNA was measured by qRT‐PCR. The sequences of primers were as follows: MEG3, forward, 5'‐CTTTTCTGGGGGAATGGGG‐3′; reverse, 5'‐AGAGGGGTGGGAAGGGACT‐3′.
Cell counting kit 8 (CCK8) assay
Cell proliferation was assessed using the CCK8 kit (Solarbio). Cal27 and SCC4 cells were seeded into 96‐well plates at 5 × 10³ cells per well, and then incubated at 37 °C with 5% CO2. CCK8 solution (10 μL) was added to each well at each timepoint (0, 24, 48, and 72 h) and incubated at 37 °C in the dark for 2 h. The optical density (OD) at 450 nm was measured using a microplate reader (Thermo, Waltham, MA, USA).
Transwell assay
Cal27 and SCC4 cells were resuspended in serum‐free DMEM medium and adjusted to a concentration of 1.0 × 10⁵ cells·mL−1. Transwell chambers were precoated with Matrigel (BD Biosciences, San Jose, CA, USA). Two hundred microliters of cell suspension (with serum‐free DMEM) was added into the apical chamber, and 600 μL of DMEM with 10% fetal bovine serum (FBS) was added into the basolateral chamber. After 48 h of incubation, cells on the upper surface of the chambers were discarded, while cells on the lower surface were fixed with 5% paraformaldehyde for 20 min and stained with 0.1% crystal violet for 20 min.
Statistical analysis
Statistical analysis was performed using r software 3.6 (https://www.r‐project.org/). Data are shown as mean ± SD. One‐way analysis of variance (ANOVA) followed by Tukey's test and Student's t‐test were conducted for comparison of multiple and two groups, respectively. P < 0.05 indicated the significant difference.
Results
Low expression of MEG3 was associated with poor prognosis in OSCC patients
To investigate how MEG3 affects OSCC progression, we analyzed the expression of MEG3 in 324 OSCC tissues and 32 normal control tissues based on the TCGA database. The expression of MEG3 was significantly downregulated in OSCC tissues relative to the normal control tissues, with a 0.4‐fold downregulation (P < 0.05; Fig. 1A). However, there was no significant difference in MEG3 expression among G1, G2, and G3 grades of OSCC (Fig. 1B). Furthermore, the expression of MEG3 in 72 pairs of OSCC and adjacent normal tissues collected in this study was detected by qRT‐PCR. Compared with the normal control tissues, MEG3 expression was significantly downregulated in OSCC tissues (0.6‐fold downregulation, P < 0.0001; Fig. 1C).
Fig. 1.

Low expression of MEG3 was associated with poor prognosis in OSCC patients. (A) Analysis of MEG3 expression in 324 OSCC tissues and 32 normal control tissues based on TCGA data. Student's t‐test was applied for statistical analysis. Data are shown as median ± SD. *P < 0.05. (B) Analysis of the differences in MEG3 expression among G1, G2, and G3 tumor grades based on TCGA data. ANOVA followed by Tukey's test was performed for statistical analysis. Ns, nonsignificant. Solid line, median. Dotted line, quartile. (C) qRT‐PCR was performed to analyze MEG3 expression in 72 pairs of OSCC and adjacent normal tissues collected in this study. Student's t‐test was applied for statistical analysis. Data are shown as median ± SD. ****P < 0.0001. (D,E) overall survival (D) and progression‐free survival (E) of MEG3‐high (n = 36) and MEG3‐low (n = 36) groups based on the 72 patients enrolled in this study. The log‐rank Kaplan–Meier survival test was applied to compare the survival distribution of MEG3‐high and MEG3‐low groups.
To further assess the impacts of MEG3 on the prognosis of OSCC patients, 72 OSCC patients enrolled in this study were divided into MEG3‐high (n = 36) and MEG3‐low expression (n = 36) groups based on the median of MEG3 expression. It was found that patients in the MEG3‐low group had a worse OS than those in the MEG3‐high group (Fig. 1D). In addition, low expression of MEG3 corresponded to a poor PFS of OSCC patients (Fig. 1E). Hence, we concluded that MEG3 was downregulated in OSCC tissues, and low expression of MEG3 was related to poor prognosis in OSCC patients.
H3K27me3 modification of MEG3 gene locus resulted in the downregulation of MEG3 in OSCC cells
To further investigate the expression pattern of MEG3 in OSCC, we examined the expression of MEG3 in OSCC cells using qRT‐PCR. The results revealed that MEG3 expression was dramatically downregulated in OSCC cells (SCC4, SCC9, SCC25, and Cal27) relative to NOK cells (Fig. 2A). In the present study we explored the underlying reasons for the low expression of MEG3 in OSCC cells. EZH2‐catalyzed H3K27me3 is a key factor in the repression of gene transcription [30, 31]. We speculated that the low expression of MEG3 in OSCC cells was associated with H3K27me3 modification of the MEG3 gene locus. To confirm this speculation, the H3K27me3 signal of MEG3 gene locus in two OSCC cells (SCC4 and Cal27 cells) was analyzed according to GSE149670. The results showed that the H3K27me3 signal of the MEG3 gene locus was remarkably enriched in SCC4 and Cal27 cells (Fig. 2B). We segmented the H3K27me3 signal enrichment region into regions 1 and 2 (Fig. 2B). Subsequently, H3K27me3 modification of regions 1 and 2 was verified using ChIP‐qPCR (Fig. 2C,D). GSK126 is an EZH2 inhibitor that reduces cellular H3K27me3 levels [32]. Cal27 and SCC4 cells were treated with 5 μm GSK126. The results of ChIP‐qPCR suggested that GSK126 treatment significantly downregulated the H3K27me3 modification of regions 1 and 2 in Cal27 and SCC4 cells (Fig. 2C,D). Then, MEG3 expression in the GSK126 group and the control group were detected by qRT‐PCR. It was found that the expression level of MEG3 was significantly higher in the GSK126 group than the control group (Fig. 2E). Taken together, these results suggested that MEG3 was downregulated in OSCC cells, and that this downregulation was associated with H3K27me3 modification on the MEG3 gene locus.
Fig. 2.

H3K27me3 modification of the MEG3 gene locus resulted in the downregulation of MEG3 in OSCC cells. (A) qRT‐PCR was used to measure the relative expression of MEG3 in SCC4, SCC9, SCC25, Cal27, and NOK cells. ANOVA followed by Tukey's test was performed for statistical analysis. *P < 0.05, **P < 0.01, vs. NOK cells. (B) Enrichment analysis of H3K27me3 signal of MEG3 gene locus in Cal27 and SCC4 cells based on the GSE149670 dataset. The H3K27me3‐enriched region was divided into region 1 and 2. (C,D) ChIP‐qPCR was used to detect the H3K27me3 modification of region 1 (C) and 2 (D) in Cal27 and SCC4 cells with or without GSK126 treatment. ANOVA followed by Tukey's test was applied for statistical analysis. **P < 0.01. (E) qRT‐PCR was used to measure the relative expression of MEG3 in Cal27 and SCC4 cells with or without GSK126 treatment. Student's t‐test was applied for statistical analysis. **P < 0.01. Experiments were performed in three biologically‐independent replicates. Data shown as mean ± SD.
Overexpression of MEG3 inhibited the proliferation and invasion of OSCC cells
To determine the function of MEG3 in OSCC progression, MEG3 was overexpressed in Cal27 and SCC4 cells. MEG3 expression was significantly upregulated in Cal27 and SCC4 cells by transfection with oe‐MEG3 plasmid, indicating that MEG3 overexpression cell lines were successfully obtained (Fig. 3A). Overexpression of MEG3 significantly inhibited the proliferation of Cal27 and SCC4 cells (Fig. 3B,C). In addition, the Transwell assay showed that the invasion of both Cal27 and SCC4 cells was significantly attenuated after overexpression of MEG3 (Fig. 3D). These results demonstrated the inhibitory effect of MEG3 on the proliferation and invasion of OSCC cells.
Fig. 3.

Overexpression of MEG3 inhibited the proliferation and invasion of OSCC cells. (A) qRT‐PCR was performed to detect the efficiency of MEG3 overexpression in Cal27 and SCC4 cells. ANOVA followed by Tukey's test was performed for statistical analysis. **P < 0.01. Ns, nonsignificant. (B,C) CCK8 assay was used to detect the proliferation of Cal27 (B) and SCC4 (C) cells in oe‐control and oe‐MEG3 groups. Student's t‐test was applied for statistical analysis. **P < 0.01. (D) Transwell assay was performed to detect the invasion of Cal27 and SCC4 cells in oe‐control and oe‐MEG3 groups. Student's t‐test was applied for statistical analysis. **P < 0.01. Experiments were performed in three biologically‐independent replicates. Data shown as mean ± SD. Scale bars = 200 μm.
MEG3 was modified by m6A and bound to YTHDC1
To investigate the mechanism of MEG3 inhibiting OSCC progression, the binding proteins of MEG3 were predicted by starbase (https://starbase.sysu.edu.cn/). YTHDC1 was predicted as a potential binding protein of MEG3 (Table 1). Then, the binding of YTHDC1 to MEG3 was confirmed by RIP‐qPCR (Fig. 4A). Given that YTHDC1 is an m6A reader [33], SRAMP (http://www.cuilab.cn/sramp/) was used to predict the m6A sites of MEG3. The predicted results of SRAMP indicated the presence of abundant m6A sites in MEG3, suggesting that MEG3 may be modified by m6A (Fig. 4B). RIP‐qPCR results showed a significantly higher enrichment of MEG3 in the anti‐m6A group compared to the IgG group, confirming the presence of m6A modification of MEG3 (Fig. 4C). Taken together, these results suggested that MEG3 was modified by m6A and bound to YTHDC1.
Table 1.
The potential binding proteins of MEG3.
| Proteins | Official full name | Gene ID |
|---|---|---|
| YTHDC1 | YTH domain containing 1 | ENSG00000083896 |
| XRN2 | 5′–3′ exoribonuclease 2 | ENSG00000088930 |
| UPF1 | UPF1 RNA helicase and ATPase | ENSG00000005007 |
| U2AF2 | U2 small nuclear RNA auxiliary factor 2 | ENSG00000063244 |
| U2AF1 | U2 small nuclear RNA auxiliary factor 1 | ENSG00000160201 |
| TRA2A | Transformer 2 alpha homolog | ENSG00000164548 |
| TNRC6A | Trinucleotide repeat containing adaptor 6A | ENSG00000090905 |
| TARDBP | TAR DNA binding protein | ENSG00000120948 |
| TAF15 | TATA‐box binding protein associated factor 15 | ENSG00000270647 |
| SRSF3 | Serine and arginine rich splicing factor 3 | ENSG00000112081 |
| SRSF1 | Serine and arginine rich splicing factor 1 | ENSG00000136450 |
| SND1 | Staphylococcal nuclease and tudor domain containing 1 | ENSG00000197157 |
| SMNDC1 | Survival motor neuron domain containing 1 | ENSG00000119953 |
| SAFB2 | Scaffold attachment factor B2 | ENSG00000130254 |
| RBM6 | RNA binding motif protein 6 | ENSG00000004534 |
| RBM5 | RNA binding motif protein 5 | ENSG00000003756 |
| RBM10 | RNA binding motif protein 10 | ENSG00000182872 |
| QKI | QKI, KH domain containing RNA binding | ENSG00000112531 |
| PTBP1 | Polypyrimidine tract binding protein 1 | ENSG00000011304 |
| PRPF8 | pre‐mRNA processing factor 8 | ENSG00000174231 |
| NOP58 | NOP58 ribonucleoprotein | ENSG00000055044 |
| NOP56 | NOP56 ribonucleoprotein | ENSG00000101361 |
| MSI1 | Musashi RNA binding protein 1 | ENSG00000135097 |
| MBNL2 | Muscleblind like splicing regulator 2 | ENSG00000139793 |
| LSM11 | LSM11, U7 small nuclear RNA associated | ENSG00000155858 |
| KHSRP | KH‐type splicing regulatory protein | ENSG00000088247 |
| KHDRBS1 | KH RNA binding domain containing, signal transduction associated 1 | ENSG00000121774 |
| ILF3 | Interleukin enhancer binding factor 3 | ENSG00000129351 |
| IGF2BP2 | Insulin like growth factor 2 mRNA binding protein 2 | ENSG00000073792 |
| HNRNPUL1 | Heterogeneous nuclear ribonucleoprotein U like 1 | ENSG00000105323 |
| HNRNPU | Heterogeneous nuclear ribonucleoprotein U | ENSG00000153187 |
| HNRNPK | Heterogeneous nuclear ribonucleoprotein K | ENSG00000165119 |
| HNRNPC | Heterogeneous nuclear ribonucleoprotein C | ENSG00000092199 |
| HNRNPA2B1 | Heterogeneous nuclear ribonucleoprotein A2/B1 | ENSG00000122566 |
| HNRNPA1 | Heterogeneous nuclear ribonucleoprotein A1 | ENSG00000135486 |
| FUS | FUS RNA binding protein | ENSG00000089280 |
| FMR1 | Fragile X messenger ribonucleoprotein 1 | ENSG00000102081 |
| FBL | Fibrillarin | ENSG00000105202 |
| EWSR1 | EWS RNA binding protein 1 | ENSG00000182944 |
| ELAVL1 | ELAV like RNA binding protein 1 | ENSG00000066044 |
| EIF4G2 | Eukaryotic translation initiation factor 4 gamma 2 | ENSG00000110321 |
| EIF4A3 | Eukaryotic translation initiation factor 4A3 | ENSG00000141543 |
| DKC1 | Dyskerin pseudouridine synthase 1 | ENSG00000130826 |
| DGCR8 | DGCR8 microprocessor complex subunit | ENSG00000128191 |
| CSTF2T | Cleavage stimulation factor subunit 2 tau variant | ENSG00000177613 |
| CPSF6 | Cleavage and polyadenylation specific factor 6 | ENSG00000111605 |
| ADAR | Adenosine deaminase RNA specific | ENSG00000160710 |
Fig. 4.

MEG3 was modified by m6A and bound to YTHDC1. (A) RIP‐qPCR was used to detect the binding between YTHDC1 and MEG3 in Cal27 and SCC4 cells. Student's t‐test was applied for statistical analysis. **P < 0.01. (B) Potential m6A modification sites of MEG3 were predicted using SRAMP (http://www.cuilab.cn/sramp). (C) RIP‐qPCR was used to detect MEG3 enriched levels of Cal27 and SCC4 cells in anti‐m6A and IgG groups. Student's t‐test was applied for statistical analysis. **P < 0.01. Experiments were performed in three biologically‐independent replicates. Data shown as mean ± SD.
Screening and functional analysis of enhancer‐controlled genes positively regulated by MEG3
YTHDC1 interacts with m6A‐modified RNA and bromodomain containing 4 (BRD4) to induce the recruitment of transcription factors at the target gene promoter, thereby activating the transcription of target gene [33, 34, 35]. BRD4 recognizes H3K27ac, an epistatic marker for activated enhancers, which is required for gene transcriptional activation [36]. Therefore, we hypothesized that MEG3 triggers the transcription of target genes through regulating their enhancers. Based on data from TCGA, we screened genes significantly associated with MEG3 expression in OSCC tissues, resulting in 2098 positively and 2 negatively genes associated with MEG3 expression (Fig. 5A). Based on the GSE149670 dataset, 17 650 gene loci rich in H3K27ac signal were found in Cal27 cells, and these genes were identified as enhancer‐controlled genes. Then, a total of 576 intersecting genes were filtered out by screening the intersections of genes positively correlated with MEG3 expression (n = 2098) and enhancer‐controlled genes (n = 17 650; Fig. 5B). These 576 genes were defined as enhancer‐controlled genes positively regulated by MEG3.
Fig. 5.
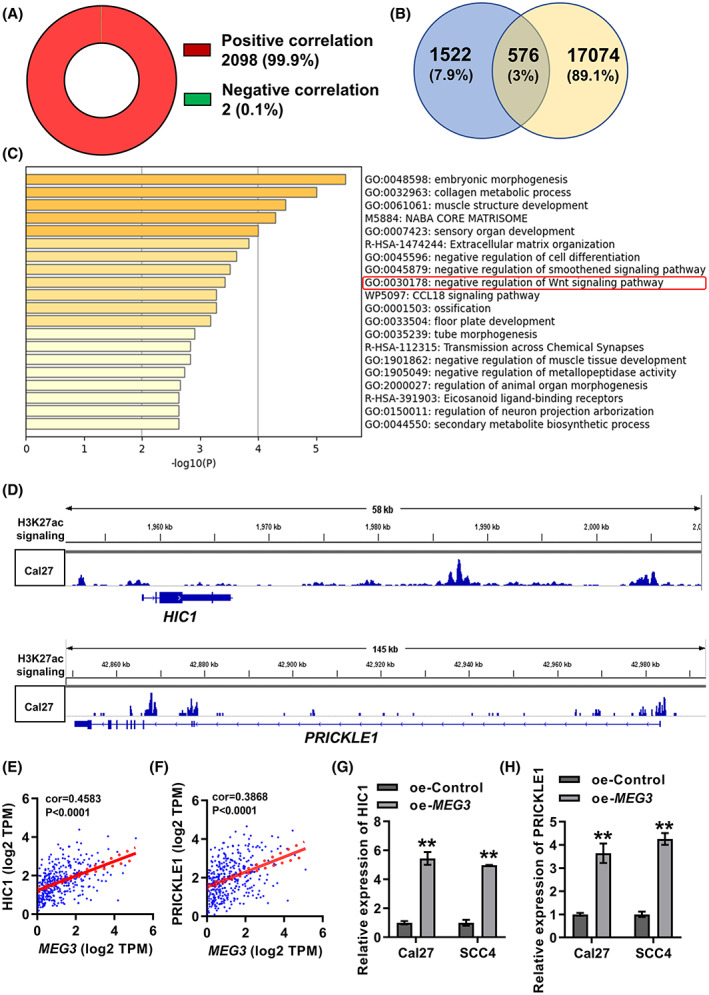
Screening and functional analysis of enhancer‐controlled genes positively regulated by MEG3. (A) Genes significantly correlated with MEG3 expression in OSCC tissues were screened based on TCGA data. (B) Intersections of genes positively correlated with MEG3 expression (blue, based on TCGA data) and enhancer‐controlled genes (yellow, based on GSE149670). (C) metascape (https://metascape.org/) analysis of the 576 intersecting genes. (D) H3K27ac signal at HIC1 and PRICKLE1 gene locus in Cal27 cells based on the GSE149670 dataset. (E,F) Pearson's correlation among MEG3, HIC1 (E) and PRICKLE1 (F) transcription in OSCC tissues was assessed based on TCGA data. (G,H) qRT‐PCR was performed to detect the relative transcriptional levels of HIC1 (G) and PRICKLE1 (H) in MEG3 overexpressed and control cells. Student's t‐test was applied for statistical analysis. **P < 0.01. Experiments were performed in three biologically‐independent replicates. Data shown as mean ± SD.
Functional analysis of the 576 intersecting genes by the metascape platform revealed that these genes were significantly enriched in ‘negative regulation of Wnt signaling pathway’ (Fig. 5C). A total of 20 genes were enriched in ‘negative regulation of Wnt signaling pathway,’ and two of them, HIC1 and PRICKLE1, were randomly selected for validation. Figure 5D details the modification of HIC1 and PRICKLE1 gene loci by H3K27ac. Based on TCGA data, MEG3 showed a significant positive correlation with the transcription of HIC1 and PRICKLE1 (Fig. 5E,F). Furthermore, the transcriptional levels of HIC1 and PRICKLE1 in Cal27 and SCC4 cells overexpressing MEG3 were detected by qRT‐PCR. The results showed that the overexpression of MEG3 significantly promoted the transcription of HIC1 and PRICKLE1 (Fig. 5G,H). Overall, we screened 576 enhancer‐controlled genes positively regulated by MEG3, and found that these genes were associated with ‘negative regulation of Wnt signaling pathway’.
The anticancer function of MEG3 in OSCC was dependent on the interaction with GATA3
In order to develop more detailed understanding of the mechanisms by which MEG3 inhibits OSCC progression, we wished to identify transcription factors involved in regulating of enhancer‐controlled genes positively regulated by MEG3. Transcription factors of the 576 intersecting genes were predicted using the Toolkit for cistrome data Browser (http://dbtoolkit.cistrome.org/). The top 20 transcription factors, with GATA3 ranked first, are shown in Fig. 6A. The RIP‐qPCR results showed that MEG3 was significantly more stronger enriched in anti‐GATA3 group than in the IgG group, which demonstrated the binding between MEG3 and GATA3 (Fig. 6B). Cal27 and SCC4 cells with GATA3 knockdown were successfully established by transfecting si‐GATA3 (Fig. 6C). Overexpression of MEG3 significantly promoted the transcription of HIC1 and PRICKLE1, which was restored by knocking down GATA3 (Fig. 6D,E). The CCK8 assay revealed that overexpression of MEG3 inhibited the proliferation of Cal27 and SCC4 cells, while knockdown of GATA3 partially counteracted this inhibitory effect (Fig. 6F,G). The invasion of Cal27 and SCC4 cells was inhibited after overexpression of MEG3, and this inhibition was reversed by GATA3 knockdown (Fig. 6H). All of these results indicated that the anticancer function of MEG3 in OSCC was dependent on the interaction with GATA3.
Fig. 6.
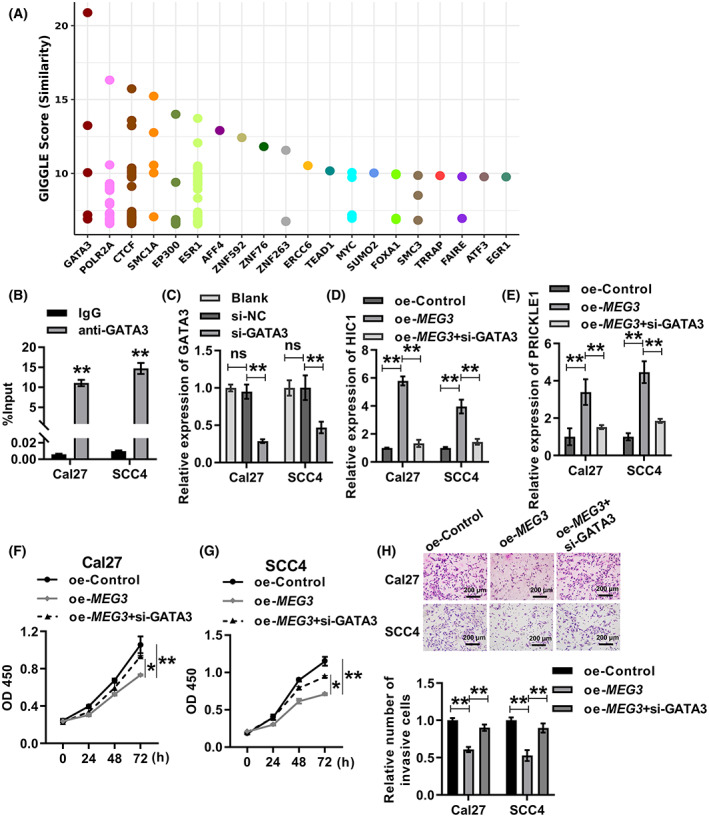
The anticancer function of MEG3 in OSCC was dependent on the interaction with GATA3. (A) Transcription factors of the 576 intersecting genes were predicted using the toolkit for the cistrome data browser (http://dbtoolkit.cistrome.org/). (B) RIP‐qPCR was used to measure the binding between GATA3 and MEG3 in Cal27 and SCC4 cells. Student's t‐test was applied for statistical analysis. **P < 0.01. (C) Knockdown efficiency of GATA3 in Cal27 and SCC4 cells was assessed by qRT‐PCR. ANOVA followed by Tukey's test was performed for statistical analysis. **P < 0.01. Ns, nonsignificant. (D,E) qRT‐PCR was used to assess the relative transcription levels of HIC1 (D) and PRICKLE1 (E) in Cal27 and SCC4 cells after overexpression of MEG3 alone or overexpression of MEG3 with concomitant knockdown of GATA3. ANOVA followed by Tukey's test was performed for statistical analysis. **P < 0.01. (F,G) CCK8 assay was performed to detect the proliferation of Cal27 (F) and SCC4 (G) cells after overexpression of MEG3 alone or overexpression of MEG3 with concomitant knockdown of GATA3. ANOVA followed by Tukey's test was performed for statistical analysis. *P < 0.05, **P < 0.01. (H) Transwell assay was performed to detect invasion of Cal27 and SCC4 cells after overexpression of MEG3 alone or overexpression of MEG3 with concomitant knockdown of GATA3. ANOVA followed by Tukey's test was performed for statistical analysis. **P < 0.01. Experiments were performed in three biologically‐independent replicates. Data shown as mean ± SD. Scale bars = 200 μm.
Discussion
Oral squamous cell carcinoma is a common malignant tumor of the head and neck [1, 2, 5]. Mechanisms underlying the development of OSCC are unclear. Aberrant expression of lncRNAs plays important roles in regulating tumor progression [37, 38]. This study confirmed the anticancer function of MEG3 in OSCC progression. We found that downregulation of MEG3 in OSCC cells was associated with H3K27me3 modification of the MEG3 gene locus. We also provided evidence that MEG3 was bound to YTHDC1 and modified by m6A in OSCC cells. In addition, the anticancer function of MEG3 was relying on binding to the transcription factor GATA3.
MEG3 is usually acts as a tumor‐suppressive lncRNA, which is downregulated in tumor tissues and cells [9, 10, 11, 12, 13]. Several studies have shown that MEG3 expression is inhibited in OSCC tissues [14, 15, 16]. Consistent with this, we found that MEG3 expression was downregulated in OSCC tissues by analyzing TCGA data and the 72 pairs samples collected in this study. However, the prognostic value of MEG3 in OSCC patients has not been clarified. In the present study we found that, although the differences in MEG3 expression among G1, G2, and G3 grades were not significant, patients with low MEG3 expression had a worse outcome.
The underlying mechanism for the downregulation of MEG3 in OSCC cells is unclear. As we know, EZH2 could be recruited to target genes, and subsequently catalyzes the 27th lysine trimethylation of nucleosome histone H3, which is one of the central mechanisms of gene expression repression [39]. In this study it was confirmed that there was abundant H3K27me3 signal of the MEG3 gene locus in OSCC cells. GSK126 is a highly selective S‐adenosyl‐methionine‐competitive EZH2 inhibitor that reduces cellular H3K27me3 levels [32]. We found that GSK126 treatment indeed significantly inhibited H3K27me3 modification of the MEG3 gene locus and promoted MEG3 expression in OSCC cells, suggesting that the downregulation of MEG3 expression in OSCC cells was mediated by H3K27me3 modification of the MEG3 gene locus.
Several reports have demonstrated that MEG3 inhibits proliferation, migration, invasion, and promotes apoptosis of OSCC cells [14, 15, 16]. In the present work, it was authenticated that overexpression of MEG3 resulted in the suppression of proliferation and invasion of OSCC cells, which is consistent with previous studies [14, 15, 16]. Regarding the regulatory mechanism of MEG3, previous studies have found that MEG3 inhibits the malignant phenotype of OSCC cells by targeting miR‐548d‐3p and miR‐21 [14, 15]. Additionally, MEG3 promotes p53 expression and directly binds to p53, thereby activating the p53 signaling pathway and suppressing the malignant phenotype of tumor cells [16, 40, 41]. However, the detailed mechanism by which MEG3 inhibits OSCC remains poorly understood. This study demonstrated the binding between MEG3 and YTH domain containing 1 (YTHDC1). YTHDC1 is a nuclear m6A reader [33]. m6A is the most abundant posttranscriptional base modification found in eukaryotic RNA [42]. m6A‐modified lncRNAs can be recognized and bound by YTHDC1, which in turn affects cellular biological processes [43, 44]. However, we did not find any studies of m6A‐modified MEG3 in OSCC cells. In this study, we found that MEG3 was modified by m6A in OSCC cells. These results inspired us to explore the anticancer mechanism of MEG3 from the perspective of YTHDC1 regulation.
YTHDC1 interacts with m6A‐modified RNAs and BRD4, to promote the recruitment of transcription factors and the activation of enhancers [33, 34, 35]. According to TCGA data, genes significantly correlated with MEG3 expression in OSCC tissues were identified. In addition, 17 650 enhancer‐controlled genes in Cal27 cells were filtered. Through intersection analysis, 576 enhancer‐controlled genes positively regulated by MEG3 were screened. Functional analysis of the 576 genes suggested that these genes were significantly enriched in ‘negative regulation of Wnt signaling pathway.’ As a prior study showed, MEG3 exerts tumor‐suppressive effects in OSCC by inhibiting of the Wnt/β‐catenin signaling pathway, which is consistent with our results [23]. Furthermore, HIC1 and PRICKLE1, which were enriched in ‘negative regulation of Wnt signaling pathway,’ were selected for validation. HIC ZBTB transcriptional repressor 1 (HIC1) usually plays a suppressive role in tumor progression [45]. Prickle planar cell polarity protein 1 (PRICKLE1) is a negative regulator of the Wnt/beta‐catenin signaling pathway [46]. We found that HIC1 and PRICKLE1 gene loci were modified by H3K27ac, suggesting that these two genes were enhancer‐controlled genes. Transcription of these two genes were positively correlated with MEG3 expression in OSCC tissues. HIC1 and PRICKLE1 transcription were significantly enhanced after overexpression of MEG3 in OSCC cells.
To further elucidate the tumor‐suppressive mechanism of MEG3, we predicted transcription factors of the intersecting genes, and confirmed the binding between MEG3 and transcription factor GATA3 in OSCC cells. GATA binding protein 3 (GATA3) is a highly conserved transcription factor that plays a pro‐ or anticancer role in cancer progression [47, 48]. For example, GATA3 acts as a downstream gene of BRCA1 to inhibit epithelial mesenchymal transition in breast cancer cells [48]. GATA3 expression promotes proliferation and migration in high‐grade serous ovarian cancer, and is associated with a poor prognosis of high‐grade serous ovarian cancer [49]. However, the function and mechanism of GATA3 in the development of OSCC remain largely unknown. We found that knockdown of GATA3 restored the elevated transcription of HIC1 and PRICKLE1 induced by MEG3 overexpression. Functional experiments showed that the proliferation and invasion of OSCC cells were reduced after overexpression of MEG3, while this reduction was attenuated by GATA3 knockdown.
Conclusion
In summary, this study confirmed that MEG3 was downregulated in OSCC cells, which was mediated by H3K27me3 modification of the MEG3 gene locus. Furthermore, the anticancer function of MEG3 in OSCC cells was dependent on the interaction with GATA3. These findings have the potential to provide a basis for the discovery of novel therapeutic targets for OSCC.
Conflict of interest
The authors declare no conflict of interest.
Author contributions
YQ, LJ, YH and FL conceived this study. YH and FL performed data analysis. YH, FL, NL, XY, LZ and SZ participated in the experiments of this study. YH and FL contributed to the writing of this article. The article was approved by all the authors.
Acknowledgments
This study was supported by the Medical Science Research Project of Hebei Provincial Healthcare Commission (20200102).
Yan Hu and Feifei Lv contributed equally to the work.
Contributor Information
Linyu Jin, Email: jinlinyu80868195@163.com.
Yongle Qiu, Email: qqqyl@hebmu.edu.cn.
Data accessibility
The presented data can be obtained under reasonable request by contacting Yongle Qiu.
References
- 1. Sung H, Ferlay J, Siegel RL, Laversanne M, Soerjomataram I, Jemal A, et al. Global cancer statistics 2020: GLOBOCAN estimates of incidence and mortality worldwide for 36 cancers in 185 countries. CA Cancer J Clin. 2021;71:209–49. [DOI] [PubMed] [Google Scholar]
- 2. Zheng W, Zhou Q, Yuan C. Nanoparticles for Oral cancer diagnosis and therapy. Bioinorg Chem Appl. 2021;2021:9977131. [DOI] [PMC free article] [PubMed] [Google Scholar] [Retracted]
- 3. Khurshid Z, Zafar MS, Khan RS, Najeeb S, Slowey PD, Rehman IU. Role of salivary biomarkers in Oral cancer detection. Adv Clin Chem. 2018;86:23–70. [DOI] [PubMed] [Google Scholar]
- 4. Lindemann A, Takahashi H, Patel AA, Osman AA, Myers JN. Targeting the DNA damage response in OSCC with TP53 mutations. J Dent Res. 2018;97:635–44. [DOI] [PMC free article] [PubMed] [Google Scholar]
- 5. Irani S. Distant metastasis from oral cancer: a review and molecular biologic aspects. J Int Soc Prev Community Dent. 2016;6:265–71. [DOI] [PMC free article] [PubMed] [Google Scholar]
- 6. Arellano‐Garcia ME, Li R, Liu X, Xie Y, Yan X, Loo JA, et al. Identification of tetranectin as a potential biomarker for metastatic oral cancer. Int J Mol Sci. 2010;11:3106–21. [DOI] [PMC free article] [PubMed] [Google Scholar]
- 7. Ferrari E, Pezzi ME, Cassi D, Pertinhez TA, Spisni A, Meleti M. Salivary cytokines as biomarkers for Oral squamous cell carcinoma: a systematic review. Int J Mol Sci. 2021;22:6795. [DOI] [PMC free article] [PubMed] [Google Scholar]
- 8. Miyoshi N, Wagatsuma H, Wakana S, Shiroishi T, Nomura M, Aisaka K, et al. Identification of an imprinted gene, Meg3/Gtl2 and its human homologue MEG3, first mapped on mouse distal chromosome 12 and human chromosome 14q. Genes Cells. 2000;5:211–20. [DOI] [PubMed] [Google Scholar]
- 9. Huang ZF, Tang YL, Shen ZL, Yang KY, Gao K. UXT, a novel DNMT3b‐binding protein, promotes breast cancer progression via negatively modulating lncRNA MEG3/p53 axis. Mol Ther Oncolytics. 2022;24:497–506. [DOI] [PMC free article] [PubMed] [Google Scholar]
- 10. Wei GH, Wang X. lncRNA MEG3 inhibit proliferation and metastasis of gastric cancer via p53 signaling pathway. Eur Rev Med Pharmacol Sci. 2017;21:3850–6. [PubMed] [Google Scholar]
- 11. Ning J, Zhang L, Guo H, Zhou S, Sun X, Bao W. LncRNA MEG3 inhibits the development of nasopharyngeal carcinoma by sponging miR‐543 targeting KLF4. Transl Cancer Res. 2020;9:958–71. [DOI] [PMC free article] [PubMed] [Google Scholar]
- 12. Wu X, Li J, Ren Y, Zuo Z, Ni S, Cai J. MEG3 can affect the proliferation and migration of colorectal cancer cells through regulating miR‐376/PRKD1 axis. Am J Transl Res. 2019;11:5740–51. [PMC free article] [PubMed] [Google Scholar]
- 13. Wu M, Huang Y, Chen T, Wang W, Yang S, Ye Z, et al. LncRNA MEG3 inhibits the progression of prostate cancer by modulating miR‐9‐5p/QKI‐5 axis. J Cell Mol Med. 2019;23:29–38. [DOI] [PMC free article] [PubMed] [Google Scholar]
- 14. Tan J, Xiang L, Xu G. LncRNA MEG3 suppresses migration and promotes apoptosis by sponging miR‐548d‐3p to modulate JAK‐STAT pathway in oral squamous cell carcinoma. IUBMB Life. 2019;71:882–90. [DOI] [PubMed] [Google Scholar]
- 15. Zhang LL, Hu D, Zou LH. Low expression of lncRNA MEG3 promotes the progression of oral squamous cell carcinoma by targeting miR‐21. Eur Rev Med Pharmacol Sci. 2018;22:8315–23. [DOI] [PubMed] [Google Scholar]
- 16. Wang W, Li H, Qiu Y, Li K, Lu Y, Deng Q, et al. Maternally expressed 3 inhibits the biological activity of oral squamous cell carcinoma SCC25 and CAL27 cell lines. Oncol Lett. 2021;22:784. [DOI] [PMC free article] [PubMed] [Google Scholar]
- 17. Ghafouri‐Fard S, Taheri M. Maternally expressed gene 3 (MEG3): a tumor suppressor long non coding RNA. Biomed Pharmacother. 2019;118:109129. [DOI] [PubMed] [Google Scholar]
- 18. Zhang X, Gejman R, Mahta A, Zhong Y, Rice KA, Zhou Y, et al. Maternally expressed gene 3, an imprinted noncoding RNA gene, is associated with meningioma pathogenesis and progression. Cancer Res. 2010;70:2350–8. [DOI] [PMC free article] [PubMed] [Google Scholar]
- 19. Zhao J, Dahle D, Zhou Y, Zhang X, Klibanski A. Hypermethylation of the promoter region is associated with the loss of MEG3 gene expression in human pituitary tumors. J Clin Endocrinol Metab. 2005;90:2179–86. [DOI] [PubMed] [Google Scholar]
- 20. Astuti D, Latif F, Wagner K, Gentle D, Cooper WN, Catchpoole D, et al. Epigenetic alteration at the DLK1‐GTL2 imprinted domain in human neoplasia: analysis of neuroblastoma, phaeochromocytoma and Wilms' tumour. Br J Cancer. 2005;92:1574–80. [DOI] [PMC free article] [PubMed] [Google Scholar]
- 21. Jiang X, Wang L, Xie S, Chen Y, Song S, Lu Y, et al. Long noncoding RNA MEG3 blocks telomerase activity in human liver cancer stem cells epigenetically. Stem Cell Res Ther. 2020;11:518. [DOI] [PMC free article] [PubMed] [Google Scholar]
- 22. Yu W, Shi Q, Wu C, Shen X, Chen L, Xu J. Promoter hypermethylation in fl uences the suppressive role of long non‐coding RNA MEG3 in the development of multiple myeloma. Exp Ther Med. 2020;20:637–45. [DOI] [PMC free article] [PubMed] [Google Scholar]
- 23. Liu Z, Wu C, Xie N, Wang P. Long non‐coding RNA MEG3 inhibits the proliferation and metastasis of oral squamous cell carcinoma by regulating the WNT/beta‐catenin signaling pathway. Oncol Lett. 2017;14:4053–8. [DOI] [PMC free article] [PubMed] [Google Scholar]
- 24. Mondal T, Subhash S, Vaid R, Enroth S, Uday S, Reinius B, et al. MEG3 long noncoding RNA regulates the TGF‐beta pathway genes through formation of RNA‐DNA triplex structures. Nat Commun. 2015;6:7743. [DOI] [PMC free article] [PubMed] [Google Scholar]
- 25. Ma S, Chen C, Ji X, Liu J, Zhou Q, Wang G, et al. The interplay between m6A RNA methylation and noncoding RNA in cancer. J Hematol Oncol. 2019;12:121. [DOI] [PMC free article] [PubMed] [Google Scholar]
- 26. Pan Y, Ma P, Liu Y, Li W, Shu Y. Multiple functions of m(6)a RNA methylation in cancer. J Hematol Oncol. 2018;11:48. [DOI] [PMC free article] [PubMed] [Google Scholar]
- 27. Zhou Y, Zeng P, Li YH, Zhang Z, Cui Q. SRAMP: prediction of mammalian N6‐methyladenosine (m6A) sites based on sequence‐derived features. Nucleic Acids Res. 2016;44:e91. [DOI] [PMC free article] [PubMed] [Google Scholar]
- 28. Zhou Y, Zhou B, Pache L, Chang M, Khodabakhshi AH, Tanaseichuk O, et al. Metascape provides a biologist‐oriented resource for the analysis of systems‐level datasets. Nat Commun. 2019;10:1523. [DOI] [PMC free article] [PubMed] [Google Scholar]
- 29. Zheng R, Wan C, Mei S, Qin Q, Wu Q, Sun H, et al. Cistrome data browser: expanded datasets and new tools for gene regulatory analysis. Nucleic Acids Res. 2019;47:D729–35. [DOI] [PMC free article] [PubMed] [Google Scholar]
- 30. Duan R, Du W, Guo W. EZH2: a novel target for cancer treatment. J Hematol Oncol. 2020;13:104. [DOI] [PMC free article] [PubMed] [Google Scholar]
- 31. Zhou L, Mudianto T, Ma X, Riley R, Uppaluri R. Targeting EZH2 enhances antigen presentation, antitumor immunity, and circumvents anti‐PD‐1 resistance in head and neck cancer. Clin Cancer Res. 2020;26:290–300. [DOI] [PMC free article] [PubMed] [Google Scholar]
- 32. McCabe MT, Ott HM, Ganji G, Korenchuk S, Thompson C, Van Aller GS, et al. EZH2 inhibition as a therapeutic strategy for lymphoma with EZH2‐activating mutations. Nature. 2012;492:108–12. [DOI] [PubMed] [Google Scholar]
- 33. Widagdo J, Anggono V, Wong JJ. The multifaceted effects of YTHDC1‐mediated nuclear m(6)a recognition. Trends Genet. 2022;38:325–32. [DOI] [PubMed] [Google Scholar]
- 34. Lee JH, Wang R, Xiong F, Krakowiak J, Liao Z, Nguyen PT, et al. Enhancer RNA m6A methylation facilitates transcriptional condensate formation and gene activation. Mol Cell. 2021;81:3368–85 e9. [DOI] [PMC free article] [PubMed] [Google Scholar]
- 35. Sabari BR, Dall'Agnese A, Boija A, Klein IA, Coffey EL, Shrinivas K, et al. Coactivator condensation at super‐enhancers links phase separation and gene control. Science. 2018;361:eaar3958. [DOI] [PMC free article] [PubMed] [Google Scholar]
- 36. Wang Q, Ozer HG, Wang B, Zhang M, Urabe G, Huang Y, et al. A hierarchical and collaborative BRD4/CEBPD partnership governs vascular smooth muscle cell inflammation. Mol Ther Methods Clin Dev. 2021;21:54–66. [DOI] [PMC free article] [PubMed] [Google Scholar]
- 37. Meng X, Lou QY, Yang WY, Wang YR, Chen R, Wang L, et al. The role of non‐coding RNAs in drug resistance of oral squamous cell carcinoma and therapeutic potential. Cancer Commun (Lond). 2021;41:981–1006. [DOI] [PMC free article] [PubMed] [Google Scholar]
- 38. Tang J, Fang X, Chen J, Zhang H, Tang Z. Long non‐coding RNA (lncRNA) in Oral squamous cell carcinoma: biological function and clinical application. Cancers (Basel). 2021;13:5944. [DOI] [PMC free article] [PubMed] [Google Scholar]
- 39. van Mierlo G, Veenstra GJC, Vermeulen M, Marks H. The complexity of PRC2 subcomplexes. Trends Cell Biol. 2019;29:660–71. [DOI] [PubMed] [Google Scholar]
- 40. Roth RI, Levin J. Amplification of chromogenic staining of proteases within electrophoretic gels. J Biochem Biophys Methods. 1989;19:129–41. [DOI] [PubMed] [Google Scholar]
- 41. Uroda T, Anastasakou E, Rossi A, Teulon JM, Pellequer JL, Annibale P, et al. Conserved pseudoknots in lncRNA MEG3 are essential for stimulation of the p53 pathway. Mol Cell. 2019;75:982–95 e9. [DOI] [PMC free article] [PubMed] [Google Scholar]
- 42. Liu ZX, Li LM, Sun HL, Liu SM. Link between m6A modification and cancers. Front Bioeng Biotechnol. 2018;6:89. [DOI] [PMC free article] [PubMed] [Google Scholar]
- 43. Jones AN, Tikhaia E, Mourao A, Sattler M. Structural effects of m6A modification of the Xist a‐repeat AUCG tetraloop and its recognition by YTHDC1. Nucleic Acids Res. 2022;50:2350–62. [DOI] [PMC free article] [PubMed] [Google Scholar]
- 44. Patil DP, Chen CK, Pickering BF, Chow A, Jackson C, Guttman M, et al. M(6)a RNA methylation promotes XIST‐mediated transcriptional repression. Nature. 2016;537:369–73. [DOI] [PMC free article] [PubMed] [Google Scholar]
- 45. Sun X, Qu Q, Lao Y, Zhang M, Yin X, Zhu H, et al. Tumor suppressor HIC1 is synergistically compromised by cancer‐associated fibroblasts and tumor cells through the IL‐6/pSTAT3 axis in breast cancer. BMC Cancer. 2019;19:1180. [DOI] [PMC free article] [PubMed] [Google Scholar]
- 46. Katoh M. WNT/PCP signaling pathway and human cancer. Oncol Rep. 2005;14:1583–8. [PubMed] [Google Scholar]
- 47. Lin MC, Lin JJ, Hsu CL, Juan HF, Lou PJ, Huang MC. GATA3 interacts with and stabilizes HIF‐1alpha to enhance cancer cell invasiveness. Oncogene. 2017;36:4243–52. [DOI] [PMC free article] [PubMed] [Google Scholar]
- 48. Bai F, Zhang LH, Liu X, Wang C, Zheng C, Sun J, et al. GATA3 functions downstream of BRCA1 to suppress EMT in breast cancer. Theranostics. 2021;11:8218–33. [DOI] [PMC free article] [PubMed] [Google Scholar]
- 49. El‐Arabey AA, Abdalla M. GATA3 as a regulator for naughty cancer‐associated fibroblasts in the microenvironment of high‐grade serous ovarian cancer. Hum Cell. 2021;34:1934–6. [DOI] [PubMed] [Google Scholar]
Associated Data
This section collects any data citations, data availability statements, or supplementary materials included in this article.
Data Availability Statement
The presented data can be obtained under reasonable request by contacting Yongle Qiu.