

Summary
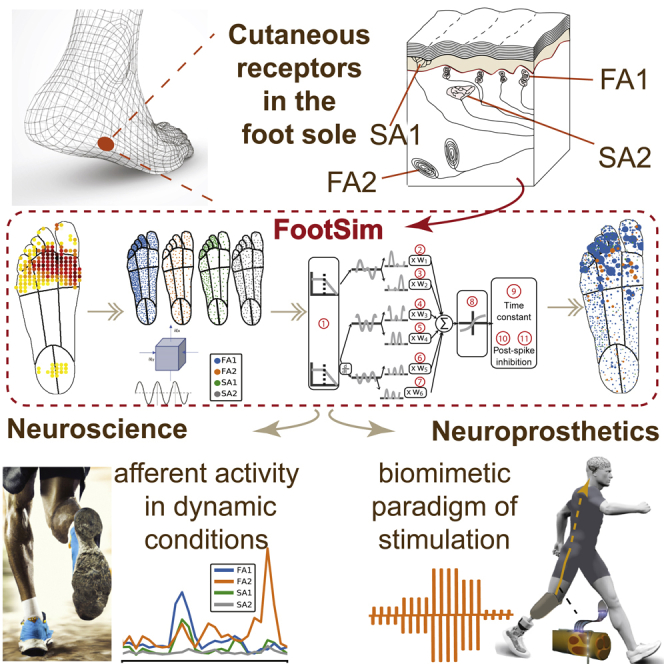
While walking and maintaining balance, humans rely on cutaneous feedback from the foot sole. Electrophysiological recordings reveal how this tactile feedback is represented in neural afferent populations, but obtaining them is difficult and limited to stationary conditions. We developed the FootSim model, a realistic replication of mechanoreceptor activation in the lower limb. The model simulates neural spiking responses to arbitrary mechanical stimuli from the combined population of all four types of mechanoreceptors innervating the foot sole. It considers specific mechanics of the foot sole skin tissue, and model internal parameters are fitted using human microneurography recording dataset. FootSim can be exploited for neuroscientific insights, to understand the overall afferent activation in dynamic conditions, and for overcoming the limitation of currently available recording techniques. Furthermore, neuroengineers can use the model as a robust in silico tool for neuroprosthetic applications and for designing biomimetic stimulation patterns starting from the simulated afferent neural responses.
Subject areas: Biocomputational method, sensory neuroscience, Systems neuroscience
Graphical abstract
Highlights
-
•
FootSim simulates a realistic neural activation of foot sole afferents
-
•
This in silico tool is suggested for neuroprosthetic and neuroscientific use
-
•
FootSim is suitable to design biomimetic neurostimulation paradigms for legs
-
•
The model can be used to reveal afferent activation in dynamic condition like walking
Biocomputational method; Sensory neuroscience; Systems neuroscience
Introduction
Complex sensorimotor integration of foot sole cutaneous feedback is crucial for gait and posture control.2,3 If somatosensory feedback is disrupted, postural stability is impaired, as demonstrated by an increase in sway and reduced gait stability in conditions of reduced feedback, such as under local anesthesia4 or cooling.5 Neuropathic conditions such as amputation or severe diabetic neuropathy also result in compromised sensory feedback and motor control.6 Conversely, gait can be stabilized and sway reduced by the use of balance-enhancing insoles with ridged surrounds if some sensitivity remains7,8,9 or with neural implants where nerves have been damaged or severed.10 Tactile sensibility on the foot sole relies on four classes of myelinated cutaneous afferents that provide information about touch and pressure.11,12 These sensory units carry information to circuits in the spinal cord and further toward the somatosensory cortex. Afferents are classified by the speed with which they adapt to constant stimulation, fast (FA) or slow (SA), and the size of their receptive fields (RFs), type 1 (small, with receptors close to the skin surface) and type 2 (large, with receptors embedded deeper in the skin).
Our understanding of how these afferents respond under natural conditions, such as standing and walking, is limited due to technical challenges related to in vivo electrophysiological recordings from afferent fibers. Microneurography, a technique for recording electrophysiological responses from single fibers in human nerves, is difficult to implement, time-consuming, and very unstable (and therefore not practicable in dynamic conditions such as walking and running). Experiments also require participants to remain motionless, so as not to dislocate the recording electrode from the single fiber of interest. Furthermore, the majority of such studies have focused on the glabrous skin of the hand, and it is unclear how well these findings would apply to the different mechanical environment of the foot sole. Even though the palmar skin of the hand and the foot sole are innervated by the same classes of receptors, neural coding likely differs between them for a number of reasons. First, the usage of hands and feet differ greatly; while the hand experiences many small and delicate stimuli, such as during precision grips, the foot is usually exposed to a large spatial extent. Such usage differences will affect the nature of the signal being sent to the brain. Innervation densities also vary several-fold and are much lower on the foot than on the hand.13 The foot also displays an apparent medial-lateral increase in the density of afferents, with the FA1 units being the most prevalent,12 which is not evident on the hand.14 Finally, the hardness of the skin differs from the hand and varies considerably by region of the foot sole,15 which affects the propagation of mechanical stimuli and therefore the neural responses.
To address the need for a detailed understanding of foot afferent responses during standing and walking, which are impossible to access via existing recording techniques, we constructed a realistic in silico model of their behavior. The model is based on experimentally recorded spiking responses from cutaneous afferents on the foot sole to arbitrary indentations of the skin. It is inspired by a previously constructed model replicating tactile responses from the hand for three classes of cutaneous afferents16 but adapted to fit the mechanical environment and afferent response properties of the foot. We divided the foot sole into separate regions based on the mechanical properties of the skin and the estimated densities of different afferent classes. In a first step, the model determines the stresses within the displaced skin arising from contact with an object and how these displacements propagate across it. In a second step, it generates the spiking responses of individual afferents, which are modeled by a set of 11 parameters each that are fit based on single-fiber recordings obtained from the human tibial nerve.1 We validate the obtained results by comparing modeled estimates for firing rates, thresholds, and RF sizes with the ones recorded experimentally and afferent responses to ramp-and-hold stimuli reported in the literature. Finally, we estimate the population response originating from the foot sole during walking and demonstrate that the model can be used for understanding the activation of sensory units during dynamic conditions, overcoming a considerable limitation of available recording techniques.
Results
FootSim model overview and fitting
We developed a model of an entire population of cutaneous afferents in the foot sole that is able to simulate their neural responses to different types of mechanical stimuli. Taking into account mechanical15,17 and innervation properties,12 we divided the foot sole into separate regions (Figure 1, box 1 from the left) and included respective densities of different classes of mechanoreceptor afferents (Figure 1, box 2). To achieve a higher modularity which would enable easy and fast simulation of different realistic situations, we divided the foot sole into 13 regions which are differentially populated. The depth at which afferents terminate within the skin is set for each mechanoreceptor type and is constant across the foot sole. Tactile stimulation of the foot sole is modeled using a group of circular pins that indent the skin orthogonal to its surface. That is similar to monofilament testing which is used to determine afferent firing thresholds and map the RFs. Mechanical stimuli that a user can apply on the place of interest on the foot sole can be defined in any shape. The indentation of every pin is set independently such that arbitrary spatiotemporal patterns of indentation can be simulated (Figure 1, box 3) and given as input to the FootSim model.
Figure 1.

Overview of the FootSim model mimicking the mechanotransduction process
We divided the foot sole into 13 regions with different mechanical properties and tactile innervation: toes 1–5, lateral/middle/medial metatarsal/arch, and lateral/medial heel (box 1, from the left). We incorporated different densities of specific afferent types (fast-adapting and slowly adapting type 1 and 2 – FA1, FA2, SA1, SA2) across regions of the foot sole based on empirically established innervation densities1 (box 2). Stimuli are represented as spatiotemporal indentation profiles on the foot sole (box 3), creating an input to the mechanical model (box 4), where it is converted into quasi-static and dynamic stresses within the plantar skin at the locations of individual receptors.16 Quasi-static stress is associated with local vertical stress while dynamic component represents the pressure component propagated through the skin. Both stress components are passed through firing models (box 5) that simulate single afferent behavior. 11 parameters (1: low pass, 2:7: w1-w6, 8: saturation, 9: time constant, 10,11: post-spike inhibition parameters – slow and fast component, respectively) are fitted to replicate characteristics of individual afferent classes. As output, the FootSim model creates time-varying firing patterns for the desired afferent population (box 6). See also Figure S2.
The FootSim model consists of two parts that jointly capture the complexity of mechanotransduction. The first part corresponds to a mechanical model that computes the deformation of the skin by the applied tactile stimulus (Figure 1, box 4): the calculated quasi-static stress reflects the perpendicular indentation of the skin, while the dynamic stress component simulates the stimulus propagation across the sole of the foot at higher frequencies. The second part consists of firing models that generate spiking output for individual fibers of different afferent classes based on the time-varying mechanical inputs (Figure 1, box 5). Each firing model contains 11 unique parameters. A low-pass filter (parameter 1) reflects the fact that afferents become unresponsive to stimulation above a certain frequency of stimulation, dependent on the afferent class. To provide an acceleration signal, we differentiated the dynamic skin response. Three mechanical signals (quasi-static, dynamic, and dynamic derivative) are then split into positive and negative signal contributions and rectified, resulting in six time-varying signals that are multiplied by six weight parameters (parameters 2–7) and summed. Because afferents’ neural responses can saturate as a reaction to large skin deflections,18 the resulting signal trace is passed through a saturating nonlinear function (parameter 8). The resulting time-varying trace represents the input to the component that simulates the generation of the action potential. Its membrane potential decays to its resting value according to a time constant (parameter 9), and a post-spike inhibitory kernel is added to model the refractory period. Post-spike inhibition consists of a fast component (parameter 10), which decays after 4 ms, and a slow component, which peaks after 8 ms and decays completely after 36 ms (parameter 11), inspired by a previous model.19 As its final output, the model simulates neural responses of all afferent types innervating the foot sole (Figure 1, box 6), giving the user information about the type, position, and firing pattern of each activated afferent.
Mechanical properties of the glabrous skin of the foot differ compared to the hand and also vary considerably across regions of the foot sole. These differences influence the propagation of the stimuli through the skin and consequently the mechanotransduction properties of the hand and foot. The FootSim model incorporates a physically plausible mechanism of dynamic stress propagation,20 which is similarly used in a previously published model for the hand. Yet there are important changes we implemented, to properly fit the specific properties of the foot sole. Poisson’s ratio, a measure that describes the expansion of material in directions perpendicular to the direction of compression, is set as constant for all foot sites, based on previous measurements.21 Skin hardness represents how resistant the skin is to material deformation due to the constant compression load. It influences the stiffness, skin resistance to elastic elongation, characterized by Young’s modulus of the skin, a mechanical property that defines the relationship between stress (σ) and strain (ε) in the skin. We used experimentally obtained hardness measurements in arbitrary units recorded by a handheld durometer (Rx-1600-OO, with a 2 mm diameter, column-shaped indenter). For every single position of the recorded afferent, a hardness measurement was obtained. We averaged all values from the same foot region (regions defined as in Figure 1) and included them in the FootSim model (Figure 2A, upper part). Based on a transformation appropriate for the type of durometer,22 we defined realistic values of Young’s modulus (Figure 2A, lower part). Skin hardness values affect both quasi-static and dynamic stress components, thereby influencing both the local vertical stress based on a quasi-static elastic model of the skin and the mechanical stimulus propagation on the surface of the foot sole. Figure 2B shows an example for how these two stress components propagate through the skin when stimuli are applied on regions with different hardness values. The foot representation on the right shows how the dynamic stress component is propagating spatially through the skin when stimuli are applied to the region with the highest hardness value (heel) and with the lowest one (medial arch). In the Figure S1, we show the differences in the firing rates spatially presented, and in form of peristimulus time histogram (PSTH), which are resulting from the use of different hardness values. It is a straightforward demonstration of the differences induced in the neural responses due to the variability of the hardness values, rather than maintaining them constant.16 We can observe big changes in PSTH of afferent responses, reflecting the influence of the hardness values used.
Figure 2.

Mechanical model of FootSim simulates skin changes caused by the applied stimuli and its propagation through the sole of the foot
(A) Typical hardness of the skin in different regions of the foot sole (arbitrary units) as experimentally measured and incorporated into the model (upper part). Young’s modulus, describing the stiffness of the skin, is defined as a function of skin hardness (down part).
(B) We calculated the deflection produced by the applied stimuli. Quasi-static (solid line) and dynamic (dashed line) stress components as a result of sinusoidal stimulation with a circular probe (radius: 3 mm) at 10 Hz and amplitude of 0.25 mm. Different shades of turquoise indicate skin hardness values in different foot regions. Units on the vertical axis are arbitrary. Foot representation on the right indicates the values of dynamic component of stress showing how stress is propagating over the skin depending on the region where stimuli is applied. We used the same stimuli values reported above but using circular probe of 15 mm.
See also Figure S1.
For fitting the parameter values of individual afferent models, we used the neural activity obtained in a previously published microneurography experiment,1 which we only briefly describe here for the sake of clarity. In short, afferent responses were recorded using 200 μm tungsten microelectrodes at the level of the popliteal fossa (Figure 3B, left). During the experiments, sinusoidal mechanical stimuli of varying amplitudes and frequencies were applied to the skin of the foot sole using a 6 mm diameter probe (Figure 3A, left). In total, 52 tactile afferents terminating in different locations on the foot sole (Figure 3A, middle) were stimulated using frequency/amplitude combinations that were changing depending on the afferent type (Figure 3A, right). The obtained dataset used for tuning of parameters contained neural responses from 52 single afferents stimulated by sinusoidal mechanical stimuli. The number of stimuli ranged between 2 and 109 different frequency-amplitude pairs, depending on the type of afferent and limited by the time a stable afferent isolation could be maintained (Figure 3B, right). Using a differential evolution algorithm, we optimized values for the set of 11 parameters that resulted in the most accurate reproduction of firing rates for each afferent recorded experimentally (see STAR Methods). We achieved high accuracy of the fitting procedure for several models of each afferent type. Different models partially reflect the natural response variability of different afferents, which is observed in the empirical data. We did not observe strong trends in clustering the parameter values across the different afferent types (Figure S2). As they do not occupy the same parameter space, we ran a more extensive analysis of the parameter robustness as explained in a later section.
Figure 3.

Microneurography recordings in human tibial nerve1 are used for fitting the model
(A) Applied mechanical stimuli: using a 6 mm diameter probe (left side of the panel, taken and adapted from15) sinusoidal stimuli were with varying frequency and amplitude to excite afferents in different regions of the foot sole. Approximate positions of excited afferents are given on the foot sole representation (middle of the panel), color-coded (blue – FA1, orange – FA2, green – SA1, gray – SA2). 19 FAI, 9 FAII, 14 SAI and 10 SAII afferents were stimulated. Ranges of amplitude and frequency values of sinusoidal mechanical stimuli vary depending on the afferent type (representation on right).
(B) Illustration of the microneurography technique, recording from the tibial nerve at the level of the popliteal fossa. Two electrodes are inserted through the skin, one serves as a reference electrode, and the other is inserted into the nerve to record single afferents. Firing thresholds and firing rates [spikes/s] of single afferents were recorded. Here we present the average firing rate of responses that were stimulated with a specific frequency-amplitude combination.
The FootSim model matches experimental firing rates
We compared experimental and simulated firing rate responses to vibrotactile stimuli of different frequencies and amplitudes (skin indentation levels), covering a substantial range of the stimuli that the foot might be expected to encounter during natural behavior.
We found a close match between the experimental firing rates and the ones simulated by the model (Figure 4A), both across different afferent classes as well as for individual afferents. We show the rate-intensity functions of two examples of fitted models for each afferent type (Figure 4B). The model reproduced canonical response properties of different afferent classes. We observed an overall higher responsivity of FA afferents compared to SA afferents for vibrotactile stimuli. In addition, the frequencies eliciting the highest rates are higher for FA afferents than for either SA class.23
Figure 4.

FootSim accurately simulates afferent firing rates
(A) Scatterplots showing experimental versus modeled firing rates. Individual panels show comparisons for different afferent classes. Each dot corresponds to a tested frequency-amplitude pair, colored by frequency. Data from all afferents within a class is overlaid. Boxplots are showing the accuracy of the fitted models in predicting the firing rate of the afferents (FA1: median 0.94, min 0.87, max 0.98); FA2: median 0.96, min: 0.92, max: 0.98; SA1: median 0.85, min: 0.71, max: 0.98; SA2: median 0.91, min: 0.88, max: 0.99).
(B) Examples of two fitted models for each afferent class showing experimental and modeled rate-intensity functions. Solid semi-transparent lines denote experimental data, while dashed lines show the model results. Color scheme as in panel A.
Response thresholds
As the frequency sensitivity profile of afferents is one of their main features and helps distinguish between different afferent types, we investigated afferents’ absolute firing thresholds. These were defined as the minimum stimulation amplitude necessary to apply at each frequency to elicit afferent firing rates of at least 1 Hz. We compared the frequency profile simulated by FootSim with the empirical behavior of afferents. Within the boundaries of the range of frequencies evaluated, the model behavior closely matched experimentally derived counterparts (Figure 5).
Figure 5.

FootSim demonstrates realistic absolute firing threshold values
Top row: Empirically measured absolute firing thresholds for afferents from all four classes over a range of different frequencies, obtained using a circular probe with 3 mm diameter. Each line with different color shade represents a different recorded afferent. Bottom row: Modeled absolute firing thresholds of the afferents using identical stimulation parameters as in experimental setup. Absolute threshold is defined as the minimal applied stimulation indentation level with specific frequency that results with the afferent firing rate of 1 Hz. Each line represents a different model fit. Experimentally recorded afferent and its modeled replication in FootSim are presented with the same color on the top and bottom panel.
We observe that FA afferents decrease their threshold at higher frequencies. Specifically, the FA2 afferent type displays very high responsiveness on frequencies higher than 90 Hz. On the other hand, SA1 afferents have high thresholds across all frequencies. Modeled SA2 afferents show slightly lower thresholds than the empirically recorded ones, especially on the higher frequencies. This result matches the behavior of SA2 shown in Figure 4A, where we observe a higher firing rate on high frequencies compared to the experimentally measured ones. SA2 afferents were stimulated up to 100 Hz (Figure 3A) during the microneurography recording. Therefore, lack of the neural response data on higher frequencies limits the parameter-fitting procedure and the accuracy of simulated responses.
Model validation and robustness
We evaluated the performance of the model on a number of standard physiological metrics that are commonly used in the literature to characterize the response behavior of tactile afferents.
Receptive fields
Tactile afferents differ in the size of their RFs.11 This effect is most prominent across class, with type 1 fibers characterized by small RFs, while type 2 fibers possess much larger RFs that might also vary considerably between afferents of the same class. RFs predicted by the model emerge “naturally” out of the interaction between skin mechanics and the fitted response behavior of the different afferent models. We tested whether modeled RFs were comparable to experimentally recorded ones. We simulated the responses of all individual models to suprathreshold stimuli at fixed distances to determine the maximal distance at which a tactile stimulus would still elicit a response from the afferent (see STAR Methods for details). As our model of the skin is isotropic, modeled RFs will always be circular, while empirically measured RFs are often elliptical, likely caused by the structure of the skin and possibly properties of the receptors themselves. Nevertheless, when comparing RF sizes (expressed as the radius of a circular field of a given area), we found relatively good agreement between the modeled and empirical fields (Figure 6A). SA1 and FA1 RFs were small and matched well though the measured fields showed higher size variability than the modeled ones. FA2 fields were large but highly variable in size and could cover a considerable portion of the foot sole. Modeled SA2 RFs, on the other hand, were smaller than those of real afferents. We ran a Kruskal-Wallis test to check whether the modeled and experimental values are statistically different. A significant difference was found only for SA2 afferents. Experimentally, SA2s are pretty insensitive to indentation, so they have high monofilament thresholds. For that reason, very large monofilaments are used to map the RFs, which are required to induce skin stretch to evoke SA2 firing. Therefore, it is likely that the simple skin model we implemented, which reproduces stresses to normal indentation only, is not sufficient to capture the response profile of SA2 afferents accurately enough.
Figure 6.

FootSim can produce realistic receptive field sizes and afferent responses to ramp-and-hold stimuli, replicating the natural behavior of specific afferent types
(A) Receptive field sizes measured experimentally (stars) and simulated with FootSim (circles) for different afferent classes. Kruskal-Wallis test didn’t show statistical difference (p > 0.05) of modeled and experimentally measured receptive field sizes, except for SA2 (0.01 < p < 0.05).
(B) Responses of different classes to the ramp-and-hold stimuli. Average population responses of the four different afferent classes (colored lines) to a ramp-and-hold stimulus (indentation trace shown as black line). The model reproduces canonical response properties of the four afferent classes, as have been widely reported in the literature.24
Responses to ramp-and-hold stimuli
Different afferent classes are characterized by their stereotypical and canonical response profiles to ramp-and-hold stimuli: SA afferents respond during stimulus onset but importantly also during sustained, constant indentation with a continued and graded dynamic response with SA2s having more uniform interspike intervals than SA1s. FA afferents only respond to dynamic phases during stimulus onset and offset.24 In order to test whether the model reproduced these stereotypical responses reported in the literature, we simulated simple indentation traces with 2 mm depth and computed the firing responses of all afferent models in every region of the foot sole (Figure 6B). Stimulation was given in a 1 s window. In agreement with empirical expectations, SA1 afferents responded during the ramp onset and, less vigorously, during the plateau phase. In addition, SA2 afferents responded weakly but consistently throughout the stimulus presentation. In contrast, both FA1 and FA2 afferents responded only during the onset and offset. We also tested the model with a slightly changed shape of ramp-and-hold stimuli, making the ramp phase steeper, reaching the plateau amplitude value in the short time period. In this scenario, FA afferents increased their firing rate, showing that the modeled afferent representatives are able to code the velocity. Thus, the model reproduces afferent behavior during ramp-and-hold stimuli as expected based on previous findings.
Robustness of model parameters
The firing model employed by FootSim is composed of eleven parameters (Figure 1) that form a nonlinear dependence between the stress profile given as an input and the neural response as an output of the simulation. We ran several simulation experiments in order to explore the parameter space that is occupied by different neuron classes, validate the robustness of the fitted parameter values, and demonstrate the importance of both the absolute values and the relationships between parameters.
First, we sampled new models by “mixing and matching” different models of the same afferent type. We selected each parameter value of the new model by sampling it with replacement from the set of originally fitted values for that afferent type (Figure S2A). This change highly reduced the accuracy in predicting the firing rates compared to the fitted models. As fitted parameters are not clustered based on the afferent type (Figure S1), this result was expected and additionally emphasizes that specific parameters are not independent of each other.
To address whether the relationship between values is a key feature of accurate and realistic behavior of afferent models, we substantially changed the absolute values of the model parameters, while keeping their relationship constant—increasing or decreasing all values five times (Figures S3B and S3C, respectively). These changes mostly surpassed the behavior of mix-and-match models; however, accuracy was highly decreased.
Finally, we examined whether slight changes of each parameter in the model would result in unexpected responses or whether the models are robust enough with respect to moderately small parameter jittering. We changed the value of each parameter by randomly jittering them between 5% and 30% of their value (Figure 7). The accuracy of the predicted firing rates was slightly decreased, as expected, but overall these models performed reasonably well. Estimated RF sizes remained very similar to the originally fitted models, and responses on ramp-and-hold stimuli were very similar to the ones presented in Figure 6. In summary, results show that slight jittering of parameters does not change significantly the neural responses.
Figure 7.

FootSim is robust to modifications of parameters values but also to changes of relationships between parameters
We changed parameter (11 parameters from the Figure 1) values by increasing or decreasing randomly by between 5% and 30% of their nominal value. Scatterplots on the left show experimental versus modeled firing rates. Individual panels show comparisons for different afferent classes. Each dot corresponds to a tested frequency-amplitude pair, colored by frequency. Boxplots are showing the accuracy of the models in predicting the firing rate of the afferents. Plots on the right show the size of receptive fields for each afferent type. See also Figure S3.
Based on the investigated variations of model parameters, we can conclude that both absolute values and the relationships between different values are important for realistic and accurate prediction of neural responses. In addition, slight changes in these features will not cause a significant change in behavior, demonstrating the robustness of the fitted models.
Simulating neural responses during walking
Tactile responses during dynamic behavior are technically challenging to record as the microneurography technique requires the subject to be still. One of the benefits of the FootSim computational model is that it can be used to simulate neural responses to natural spatiotemporal pressure distributions during dynamic activities, such as walking, and thereby yield novel insights into neural population responses in behaviorally relevant scenarios. As a proof-of-concept for this application, we used pressure data from a healthy participant during walking, collected with a pressure-sensitive shoe insole (see STAR Methods for details). We averaged the spatiotemporal pressure profiles from multiple steps to create an average step profile and used this as an input to the model.
We present example frames of the input and the FootSim response in three different phases of the step—heel strike, mid-step, and toe push-off—in Figure 8A. The simulated neural responses are color-coded depending on the afferent fiber type, and the size of the marker is correlated with the simulated firing rate. As the heel region has the highest skin hardness, propagation of stimuli is strong at the heel, and it provokes the response of even some afferents in the metatarsal area or toes. In line with previous research,25,26 we noted that pressure increases rapidly during initial contact when the heel strikes the ground, then decreases and plateaus while the foot is flat on the ground, and finally increases again, mostly around the metatarsal area, during push-off, before decaying as the foot lifts off (Figure 8B, black line). FootSim simulation responses for each afferent class were averaged across all afferents of that class that occur in the foot sole, with a time bin of 25 ms, and they are color-coded for different afferent types (Figure 8B). Across the four afferent populations, the largest responses were observed during heel strike, with smaller responses during push-off, while the mid-stance elicited the smallest responses. This result mirrors similar findings on the hand, where the population response is the strongest during transient events and small during sustained forces.27 Averaged firing rate curves (Figure 8B) show differences in the response profiles for the different afferent types during the walking cycle, implying potentially varied and specific roles during different moments of the gait cycle. Differences in the overall activity levels of the different afferent types partly reflect differences in local innervation densities but might also be a consequence of the extrapolation from the relatively small probe used in data acquisition to the much larger contact areas simulated here. Future validation with experimental data is needed to validate such differences in responsiveness.
Figure 8.

FootSim can reveal dynamics of activation during the walking cycle
(A) The spatial indentation profile and the population response. Each afferent’s marker is scaled by its firing rates during heel strike (pink box), mid-step (light blue box), and toe push-off (light green box).
(B) Total pressure during an average step as a function of time (black line). Shaded areas denote the three time periods depicted in panel B. We simulated average population responses divided by afferent class. Average firing rates for each class were divided by the number of fibers of the corresponding type that exist in the foot sole. Since FA1 and SA2 afferent have lower responses compared to the other afferents, we zoomed the view for better understanding of changes in activation of specific afferent type during walking cycle.
See also Figure S4.
Tactile feedback during walking is likely also employed in determining which part of the foot is in contact with the ground at any given moment. Indeed, afferent populations innervating different regions on the foot sole responded with different intensities and temporal profiles to the step (see responses for the heel, lateral arch, middle metatarsal, and great toe in Figure S4), signaling local time-varying pressure at different skin sites. Finally, neural responses also varied across different types of steps. The FootSim model responded consistently to similar pressure profiles (Figures S4A, S4B, and S4C), while producing markedly different responses to different spatiotemporal pressure patterns, as present for example during jogging (Figure S4D).
Specifically, responses from different regions of the foot during walking and jogging were notably different. Afferents from the heel responded more during walking than in jogging, reflecting the differences in the pressure profile of the two activities, and specifically the decreased use of heel strikes during jogging. Conversely, afferents on the metatarsal location showed higher levels of activity in the jogging scenario as this region is involved much more than while walking. Unlike when the person is walking, there is no second peak in SA1 activity, since SA1 are activated mostly during the slow change from the lateral to the metatarsal area of the foot.
Discussion
We assembled an in silico model of the foot sole, which reconstructs the neural responses of individual tactile afferents innervating the foot sole in humans. It uses a mechanical part of the model to convert indentations into stress patterns, followed by firing models that reproduce the response properties of individual afferents. The model is fitted on a dataset of tactile afferents exposed to a wide range of vibrotactile stimuli at different frequencies and amplitudes, recorded in humans using microneurography. We showed that the model can reproduce the response properties of these neurons accurately, as determined by firing rates, firing thresholds, and RF sizes. Characteristic response behaviors of different afferent types to ramp-and-hold stimuli are commonly taken as their specific feature. We confirmed that FootSim can replicate these features even though the models were not fit this type of stimuli, proving that the model can generalize to novel stimuli. Finally, we showed how the model can be used to reconstruct approximate population activity during natural dynamic conditions, such as walking, which is difficult to measure experimentally (e.g. through microneurography). The model has direct possible neuroscientific and neuroprosthetic applicability.
FootSim emulates and reveals the role of specific tactile afferents for balance and gait
For bipeds, such as humans, the soles of the feet are the only interface with the ground. Forces acting at this interface are sensed through the foot sole skin, and this feedback is then used to aid in the control of body orientation and to manipulate the body center of mass (COM).28,29 Consequently, a reduction of plantar cutaneous information results in an increase in postural sway30,31 and compensatory stepping reactions to postural perturbations.32 The importance of cutaneous feedback from the foot sole is also highlighted in patients with peripheral neuropathy, which causes a loss or degradation of tactile feedback, leading to concomitant decreased balance, distorted gait, and even falls. Conversely, increasing cutaneous feedback from the foot sole border has been shown to increase gait stability in older adults.8
Mechanoreceptors in the skin of the foot sole contribute to the representation of the COM with respect to the base of support28 and are able to initiate postural reflexes that result in increased standing stability.33 The toes, the heel, and the lateral border of the sole represent the physical limits of the base of support. Receptor densities in the toes are higher than in the rest of the foot sole, suggesting the significance of feedback from the toes in maintaining balance.12 FootSim simulation of activation during the walking cycle reveals an important increase of afferent activation in the heel and toes (Figures 8 and S4). The density of mechanoreceptors on the lateral side of the foot is also larger than that on the medial, and again this might afford fast and reliable feedback to react to balance loss. Specifically, if the COM moves beyond the base of support in the lateral direction, there is a need for a stepping reaction to prevent a fall,34 while the medial movement of the COM can be compensated with the other leg and is, therefore, less critical. In addition, the medial region of the foot sole is arched upwards, and it is therefore less often in contact with the ground compared to the lateral part, which provides an additional possible explanation for the low density of afferents in this region and their lower activity during walking (Figures 8 and S4). Furthermore, activation of specific skin regions on the sole of the foot through electrical stimulation has been shown to modulate the muscles of the lower limb to facilitate gait.35 This very direct evidence and direct measures of afferent coupling36 support the notion that feedback from specific mechanoreceptive subpopulations plays a significant role in spinal reflexes to control the magnitude of muscle activation for successful ambulation.
Apart from the location where an afferent terminates, its class also influences responsiveness to different types of stimuli, and FootSim can help us understand the dynamics of afferent activation (Figures 6, 8, and S4). Fast-adapting afferents are especially important in assisting balance control during human locomotion. They are likely responsive to the unevenness of the ground and unexpected slips and will serve as a feedback mechanism for balance maintenance and/or recovery. They are considered motion and velocity detectors, which explains their increased activity during transient events, such as foot-off and foot contact. Because FA2 afferents are the most sensitive to perpendicular light touch and have the biggest RFs which can cover up to the entire foot sole,12 it is expected that activity of these afferents is present during the whole gait cycle and especially high during the initial gait stance (Figure 8). Merkel cells and Ruffini endings, corresponding to slow-adapting tactile afferent units type 1 and 2, respectively, participate in postural regulation, which generally involves movements and forces at frequencies below 5 Hz.32 SA1 afferents are mostly associated with the maintained contact of the foot on support, and they show high activity during the end of mid-stance when the metatarsal part of the foot is mostly on the ground and terminal gait stance when the subject is leaning on his toes. FA1 afferents and their connected Meissner corpuscles are associated with information related to foot contact,11 and their density is the highest in the toes,12 which explains their increased firing during the terminal, toe-off phase of the gait. FA1 afferents are also strongly coupled to motor neurons in the lower36 and upper5 limbs highlighting their reflexive role in standing balance. As shear was not experimentally tested or modeled, FA1 show lower activation as they respond a great deal to tangential forces along the skin. Low activity of SA2 is expected as they are stretch receptors and have a high threshold to orthogonal load and are characteristically the least-sensitive type.
Importance of specific FootSim features
Differences in skin hardness across the foot sole produce nonlinear changes in skin stiffness, and, consequently, stress calculation and propagation are highly nonlinear. Even though this variability does not correlate highly with single afferent firing rates,15 it influences the number of recruited fibers due to the differential spread of the mechanical stimuli through the skin of the foot sole. If stimuli with equal indentation amplitude are applied to a region of the skin with increased hardness, stress values will be higher and the dynamic component will propagate further on the skin of the foot sole, activating more afferents than when stimuli are applied to the region with low hardness values (Figures 2B, 8A, and S1). This effect is of importance for understanding the dynamics of afferent activation and translation of observed results for defining the biomimetic stimulating patterns for neuroprosthetic application. In addition, the ability to implement modular values of skin hardness in FootSim is necessary when adapting the model for different groups of patients. For example, patients with diabetic neuropathy, as one of the conditions, develop increased skin hardness.37 In addition, afferent units from the foot sole lose their ability to transmit tactile information. In the FootSim model, the number of afferents can easily be modified. Therefore, we believe that the FootSim model design is suitable to be adapted for different groups of patients. The robustness of model parameters is very important as it is validating the strength of the designed model and its fitted values. Slight changes of parameter values in FootSim afferent models will not significantly change the neural response, therefore indicating that FootSim can be used as a unique, robust tool for simulating the neural responses of foot sole afferents.
The number of constructed afferents is restricted by the relatively small amount of experimentally recorded data. Hence, the FootSim model has a limited number of afferent replications and limited diversity of afferent responses. This variability, which is one of the natural features and important for a realistic representation of foot sole afferent responses, could be accomplished by changing the fitted model parameter values on a small scale. Newly created models will not completely replicate the recorded afferent but could conceivably portray information from different regions of the foot.
FootSim model application in neuroprosthetics
Lower-limb amputees are dealing with the loss of natural information about the interaction with the ground, and currently available prostheses are not able to restore missing sensations.38 This leads to reduced mobility, asymmetrical walking, lower embodiment, higher risk of falls, and numerous consequent health issues.39 Electrical nerve stimulation shows promising results in restoring sensory feedback and improving amputees’ condition.39,40,41 Multiple research groups are working on finding the best way to stimulate the nerve10 and have achieved distinct and spatially selective sensations that significantly improved motor tasks as well as the way the subject is perceiving the prostheses.40,42 Most often, artificial encoding of linear stimulation has been tested, which has resulted in a range of perceived sensations: from undesirable paresthesia, tingling, or prickling to more pleasant like touch and pressure, with limited reported perceived naturalness.10 Because naturalness is among the features of the highest importance for prosthesis acceptance,43 generating close-to-natural information for the nervous system44 represents a critical clinical need. While hybrid modeling45 can help tackle the design of an optimal device to implant,46 we envisage the use of the FootSim model for defining the “biomimetic language”: stimulation patterns to mimic the natural signals from the periphery. Indeed, the model has been designed to be effortlessly included in closed loop neuroprosthetics (Figure 9).
Figure 9.

FootSim possible contribution to biomimetic stimulation patterns for tactile feedback restoration in future neuroprosthetics
In a possible scenario, the user will be fitted with a leg prosthesis collecting real-time spatiotemporal pressure data via a sensorized insole (bottom left). This data will be provided as an input to the FootSim model. The model would convert the artificial pressure profiles into realistic neural response patterns (top, blue shaded box). FootSim output could be potentially used for generating biomimetic stimulation policies (bottom right). Neurostimulator would generate these paradigms, and this type of stimulation could be used to transmit to the subject the information recorded with the insole in a future possible scenario.
Such a system is comprised of a sensorized insole that is able to record the pressure under the artificial foot sole, sending a reconstructed pressure profile as an input to the FootSim model, which simulates the neural responses of the fiber population. For an engineer, constructing the neuromodulation system, FootSim can be considered as a “plug & play” tool, able to reconstruct the afferent activity and not requiring any specific expertise for use. As an output, the model is producing the quasi-continuous dynamics of afferent activation during any activity (e.g., walking or running) of the subject, which can be used as a trigger for biomimetic stimulation policies. To do so, the function of transformation from the computed units’ activities to the neurostimulator commands has to be assumed. We hypothesize a plausible option for such a transformation (Figure 9): the frequency of stimulation is defined directly from the summation of spike trains of all activated afferents, while the charge profile is coded in the number of recruited fibers.47 A direct translation of FootSim to biomimetic policy creation needs to be investigated further in light of the limitations of available neurostimulating technologies.48 Finally, developed stimulating paradigms could be transmitted to the neurostimulator through an appropriate transfer function. Potentially, such a biomimetic code encoded to nerves, through the neural implant, would be transmitted to the spinal cord and somatosensory cortex, enabling the transfer of the information about contact with the ground. In this manner, we could potentially restore to a disabled subject close-to-natural sensation coming from the artificial foot. Yet, this use of FootSim needs to be investigated and validated in eventual future experiments.
Limitations of the study
The importance of spike timing is well known in tactile coding.49,50 However, due to limitations in how precisely spike trains could be aligned with the precise stimulation profile, the fitting of the FootSim model relied on average firing rates, limiting the accuracy of predicting precise timings of generated action potentials. Still, when precise alignment of spike trains with skin oscillations is not required (and it is not clear whether precise spike timing at such fine temporal resolutions is behaviorally relevant on the foot), the model should reproduce time-varying firing rates on the order of around 100 ms with relatively high accuracy.
Second, we are simulating the stress propagation as quasi-continuous, without incorporating lateral sliding and shear forces. This is, together with the lack of experimentally recorded neural activity, one of the biggest reasons for the limited accuracy of SA2 responses. Yet, this simplification is not expected to significantly impact model accuracy, since a high correlation between tangential and normal forces is typically observed during sliding.51 Still, future models should incorporate more complex skin mechanics. In a related issue, we are approximating the skin as a two-dimensional surface, since 3D modeling of the involved tissues would drastically increase the complexity of the model, as well as limit the possibility of FootSim use in real time. Lastly, and importantly, our experimental dataset is obtained by applying passive vibrotactile sinusoidal stimuli through a single relatively small probe over the RF of individual mechanoreceptor endings. For the simulation of neural responses during walking, we are predicting afferent responses in a dynamically loaded condition, where large parts of the foot are in contact with the ground and forces are high. Therefore, the model may be limited in its ability to accurately predict firing under high loads and with large contact areas, as well as when tangential forces are applied. Future experimental work should test and validate these predictions, within the limits of current technical capabilities, to improve future iterations of the model.
STAR★Methods
Key resources table
| REAGENT or RESOURCE | SOURCE | IDENTIFIER |
|---|---|---|
| Deposited data | ||
| Insole data for recreating step simulation | This paper |
https://github.com/LClel/FootSim_insole_demonstration and Zenodo (https://doi.org/10.5281/zenodo.7457045) |
| Software and algorithms | ||
| FootSim model code | This paper |
https://github.com/ActiveTouchLab/footsim-python and Zenodo (https://doi.org/10.5281/zenodo.7456827) |
| Code for recreating step simulation | This paper |
https://github.com/LClel/FootSim_insole_demonstration and Zenodo (https://doi.org/10.5281/zenodo.7457045) |
Resource availability
Lead contact
Further information and requests should be directed to the lead contact: Stanisa Raspopovic (stanisa.raspopovic@hest.ethz.ch).
Materials availability
This study did not generate any new materials.
Experimental model and subject details
This study used a previously published dataset1 that contained microneurography recordings (see below for a summary of experimental procedures) from 21 healthy subjects (12 males, 9 females; mean age 24, range 20–27 years). All participants gave written informed consent to participate in the experiment. The protocol was approved by the University of Guelph Research Ethics Board.
Method details
Microneurography
Neural responses of single cutaneous afferents were obtained through recordings in the tibial nerve while vibrations of different frequencies and amplitude were delivered through the probe centered on the hotspot of the respective afferent. The dataset includes 59 recording sessions across 21 healthy subjects for a total of 52 identified single afferents recorded in a prone, unloaded position.1 Two-second bursts of sinusoidal stimuli were applied at varied frequency (3–250 Hz) and amplitude (0.001–2 mm) combinations. Vibration was applied using a 6 mm diameter probe driven by a mini vibration exciter (mini-shaker type 4810, Power Amplifier Type 2718; Bruel & Kjaer, Naerum, Denmark). Receptive field size, monofilament firing threshold and hotspot location were measured using Semmes-Weinstein monofilaments (Touch Test; North Coast Medical, Gilroy, CA). Receptive fields were mapped by applying a force 4–5 times greater than the afferent firing threshold (defined as the minimum monofilament force that reliably elicited an afferent firing response).
Fitting procedure
Firing models were fitted to replicate the spiking responses of a single recorded afferent on the applied mechanical stimuli. Each firing model was governed by a set of 11 parameters, whose role is explained in the results section, similarly as in TouchSim.16 We searched for the best combination of these parameter values by using metaheuristic search algorithm52 that would result with the realistic simulation of afferent neural responses. We excluded from the dataset all afferents that were stimulated experimentally with less than 3 different frequencies (9 of them were discarded). Our goal was to find a realistic replication of every afferent recorded during the microneurography experiment. That would ensure the enough variety of simulated afferent neural responses that is observed in different experiments. We applied a differential evolution algorithm,53 implemented in Python, for finding the sets of 11 parameter values that represent single afferents. The procedure follows several steps: within the FootSim environment, we place an afferent within the corresponding region where it was recorded during the experiment, ensuring that the mechanical parameters of this patch of skin matched those commonly observed for this region. Then we start the searching process by initializing the population of 11 parameters randomly. We generate the set of sinusoidal stimuli with all frequency-amplitude combination pairs applied experimentally and excite the afferent model. The cost function is defined as a sum of: i) errors between the simulated and recorded firing rate for each stimulus and ii) error in the simulated and recorded threshold value. The differential evolution algorithm was then used to tune the parameters of the afferent models while minimizing this cost function. Initial parameters (starting values of the 11-parameter set) were changed based on the best set of values obtained in the previous optimization run and the procedure was repeated until the cost function did not decrease further over several consecutive runs. An individual optimization run was stopped when it approached the maximum number of iterations (500) or when the difference between the two populations of 11 parameters was less than 1%. For every recorded afferent, a separate model was fit. Models that failed a minimum performance threshold (set as a correlation between predicted and recorded firing rates less than 0.7) were excluded from the final model set. In total, we fit 5 SA1, 6 SA2, 15 FA1 and 5 FA2 individual afferent models that are the best-modeled replication of realistic afferents recorded during experimental procedure.
Fitting accuracy and model validation
In order to investigate the behavior of the fitted afferents, a Python toolbox was developed to perform validation of the model. We chose key metrics to investigate such as firing rate responses, absolute thresholds, response to ramp-and-hold stimuli and receptive field areas. In all tests, afferents generated with FootSim were placed on the foot sole following previously published afferent densities for each of the foot sole regions that have different mechanical properties and tactile innervation.12 A detailed description of the validation assessment will follow.
Firing rate responses
To analyze the responses of the fitted models to a given set of stimuli, we subjected the afferent models to an equivalent experiment to the one that generated our in vivo dataset.1 An initial challenge to reproducing such experiments was that not all afferents in the in vivo dataset received the whole range of stimuli. In turn, an individualized stimulus set was required for each fitted model.
The modeled firing rates were compared with the experimentally recorded ones for the same frequency and amplitude of stimulation received by the empirical counterpart. Sinusoidal waves of stimulation were modeled in FootSim indentation of a circular probe with 3 mm radius, which was indented and vibrated for 2 s. Firing rates were computed for each frequency-amplitude pair and compared with the empirical ones.
Afferent firing thresholds
Afferent firing thresholds (AFTs) were also compared with their empirical counterparts, a set of stimuli emulating the empirically given ones was applied to each of the fitted afferent models. In an effort to closely reproduce response thresholds, the minimum amplitude necessary to elicit a firing rate response of 1 Hz was classed as the model’s afferent firing threshold as displayed in Figure 5.
Receptive fields
Receptive field sizes were calculated analogous to the procedure established in.16 In short, we found the largest distance from the contact point of a simulated small probe (1-mm radius) at which an afferent model still responded to a short vibratory stimulus with an amplitude of several times the absolute threshold. This procedure was intended to mimic experimental determination of receptive fields. Empirically, afferent receptive fields were measured with monofilaments that applied a force 4–5 times greater than the absolute threshold.
Ramp-and-hold responses
Each afferent class exhibits well-known stereotypical responses to ramp-and-hold indentations. Aiming to interrogate these responses in our model we subjected each of the fitted models to a ramp-and-hold stimulus of 1 mm amplitude and 1 s of duration. The onset and offset of the stimulation lasted 0.2 s, responses are described in Figure 6.
Simulation of neural responses during walking
TekScan™ F-Scan™ (TekScan Inc., South Boston, MA, USA) Sport Insoles were worn by a single healthy participant (female, 19 years, shoe size UK 5) during a period of four 6 m walking bouts at a self-selected speed. The insoles were cut to the size of the participant’s foot, inserted into the shoe, and calibrated to the participant’s mass. The insoles consist of equally spaced pressure sensors with an area of 0.26 cm2, spaced 0.51 cm apart on a grid. During the trial, a total of 446 pressure sensors were active, sampling the pressure signal at 100 Hz. We extracted 16 steps (average length: 817 ms, SD: 7.76) from straight line walking. The jogging step is representative of the other steps in that trial (average length = 56.16 ms, standard deviations = 14.97 ms). All steps are normalized to 100 time points. Pressure data for the left foot from all steps taken was averaged to create the spatiotemporal pressure profile of an average step. Recorded pressure is mapped into the FootSim by taking into consideration Poisson’s ratio of the skin, Young’s modulus of the skin and the radius of the flat-ended cylindrical indenter (radius equaling that of the pressure sensors). Instances of the participant turning were removed so that only full steps in a forward direction were processed. Each sensor input was represented by a separate simulated probe in the model, whose indentation trace was calculated from the measured average pressure profile, by considering the stiffness of each skin region as set in the model.
Quantification and statistical analysis
All statistical analyses were performed using Python, and specific statistical tests used for each experiment are described in the figure legends. Differences were considered significant if p < 0.05.
Acknowledgments
We acknowledge support from the European Research Council (ERC) under the European Union’s Horizon 2020 research and innovation program FeelAgain (grant agreement no. 759998), SNSF grant MOVEIT (no. 205321_197271), the Wellcome Trust (209998/Z/17/Z), the MRC Discovery Medicine North (DiMeN) Doctoral Training Partnership (MR/N013840/1), and the Natural Sciences and Engineering Research Council (NSERC) of Canada (Discovery Grant ID 312007, and PDF).
Author contributions
H.S. and S.R. designed research; N.S. and L.B. provided the microneurography data; L.C. collected and preprocessed the insole data; N.K., R.K.S., H.S., and S.R. performed research; N.K., R.K.S., and L.C. analyzed the data and made figures; N.K., R.K.S., H.S., and S.R. wrote the paper, and all authors contributed to its editing.
Declaration of interest
S.R. holds shares of “Sensars Neuroprosthetics”, a start-up company dealing with potential commercialization of neurocontrolled artificial limbs. The other authors do not have anything to disclose.
Published: January 20, 2023
Footnotes
Supplemental information can be found online at https://doi.org/10.1016/j.isci.2022.105874.
Contributor Information
Stanisa Raspopovic, Email: stanisa.raspopovic@hest.ethz.ch.
Hannes Saal, Email: h.saal@sheffield.ac.uk.
Supplemental information
Data and code availability
-
•
No new data for model fitting and validation was generated for this study. It has been published previously1 (see STAR Methods, microneurography section). Insole data for recreating step simulation have been deposited at Zenodo and are publicly available as of the date of publication. DOI is listed in the key resources table.
-
•
The full model code has been deposited on GitHub at https://github.com/ActiveTouchLab/footsim-python and is publicly available. The current version described in this paper has been archived on Zenodo. Code for recreating the step simulation is available at https://github.com/LClel/FootSim_insole_demonstration and has been archived on Zenodo. DOIs are listed in the key resources table.
-
•
Any additional information required to run or validate the model reported in this paper is available from the lead contact upon request.
References
- 1.Strzalkowski N.D.J., Ali R.A., Bent L.R. The firing characteristics of foot sole cutaneous mechanoreceptor afferents in response to vibration stimuli. J. Neurophysiol. 2017;118:1931–1942. doi: 10.1152/jn.00647.2016. [DOI] [PMC free article] [PubMed] [Google Scholar]
- 2.Takakusaki K. Neurophysiology of gait: from the spinal cord to the frontal lobe. Mov. Disord. 2013;28:1483–1491. doi: 10.1002/mds.25669. [DOI] [PubMed] [Google Scholar]
- 3.Pearcey G.E.P., Zehr E.P. We are upright-walking cats: human limbs as sensory antennae during locomotion. Physiology. 2019;34:354–364. doi: 10.1152/physiol.00008.2019. [DOI] [PubMed] [Google Scholar]
- 4.McDonnell M., Warden-Flood A. Effect of partial foot anaesthesia on normal gait. Aust. J. Physiother. 2000;46:115–120. doi: 10.1016/S0004-9514(14)60319-6. [DOI] [PubMed] [Google Scholar]
- 5.Bent L.R., Lowrey C.R. Single low-threshold afferents innervating the skin of the human foot modulate ongoing muscle activity in the upper limbs. J. Neurophysiol. 2013;109:1614–1625. doi: 10.1152/jn.00608.2012. [DOI] [PubMed] [Google Scholar]
- 6.Raspopovic S. Neurorobotics for neurorehabilitation. Science. 2021;373:634–635. doi: 10.1126/science.abj5259. [DOI] [PubMed] [Google Scholar]
- 7.Priplata A.A., Patritti B.L., Niemi J.B., Hughes R., Gravelle D.C., Lipsitz L.A., Veves A., Stein J., Bonato P., Collins J.J. Noise-enhanced balance control in patients with diabetes and patients with stroke. Ann. Neurol. 2006;59:4–12. doi: 10.1002/ana.20670. [DOI] [PubMed] [Google Scholar]
- 8.Perry S.D., Radtke A., McIlroy W.E., Fernie G.R., Maki B.E. Efficacy and effectiveness of a balance-enhancing insole. J. Gerontol. A Biol. Sci. Med. Sci. 2008;63:595–602. doi: 10.1093/gerona/63.6.595. [DOI] [PubMed] [Google Scholar]
- 9.Christovão T.C.L., Neto H.P., Grecco L.A.C., Ferreira L.A.B., Franco de Moura R.C., Eliege de Souza M., Franco de Oliveira L.V., Oliveira C.S. Effect of different insoles on postural balance: a systematic review. J. Phys. Ther. Sci. 2013;25:1353–1356. doi: 10.1589/jpts.25.1353. [DOI] [PMC free article] [PubMed] [Google Scholar]
- 10.Raspopovic S., Valle G., Petrini F.M. Sensory feedback for limb prostheses in amputees. Nat. Mater. 2021;20:925–939. doi: 10.1038/s41563-021-00966-9. [DOI] [PubMed] [Google Scholar]
- 11.Kennedy P.M., Inglis J.T. Distribution and behaviour of glabrous cutaneous receptors in the human foot sole. J. Physiol. 2002;538:995–1002. doi: 10.1113/jphysiol.2001.013087. [DOI] [PMC free article] [PubMed] [Google Scholar]
- 12.Strzalkowski N.D.J., Peters R.M., Inglis J.T., Bent L.R. Cutaneous afferent innervation of the human foot sole: what can we learn from single-unit recordings? J. Neurophysiol. 2018;120:1233–1246. doi: 10.1152/jn.00848.2017. [DOI] [PMC free article] [PubMed] [Google Scholar]
- 13.Corniani G., Saal H.P. Tactile innervation densities across the whole body. J. Neurophysiol. 2020;124:1229–1240. doi: 10.1152/jn.00313.2020. [DOI] [PubMed] [Google Scholar]
- 14.Johansson R.S., Vallbo A.B. Tactile sensibility in the human hand: relative and absolute densities of four types of mechanoreceptive units in glabrous skin. J. Physiol. 1979;286:283–300. doi: 10.1113/jphysiol.1979.sp012619. [DOI] [PMC free article] [PubMed] [Google Scholar]
- 15.Strzalkowski N.D.J., Triano J.J., Lam C.K., Templeton C.A., Bent L.R. Thresholds of skin sensitivity are partially influenced by mechanical properties of the skin on the foot sole. Physiol. Rep. 2015;3:e12425. doi: 10.14814/phy2.12425. [DOI] [PMC free article] [PubMed] [Google Scholar]
- 16.Saal H.P., Delhaye B.P., Rayhaun B.C., Bensmaia S.J. Simulating tactile signals from the whole hand with millisecond precision. Proc. Natl. Acad. Sci. USA. 2017;114:E5693–E5702. doi: 10.1073/pnas.1704856114. [DOI] [PMC free article] [PubMed] [Google Scholar]
- 17.Strzalkowski N.D.J., Mildren R.L., Bent L.R. Thresholds of cutaneous afferents related to perceptual threshold across the human foot sole. J. Neurophysiol. 2015;114:2144–2151. doi: 10.1152/jn.00524.2015. [DOI] [PMC free article] [PubMed] [Google Scholar]
- 18.Wheat H.E., Salo L.M., Goodwin A.W. Cutaneous afferents from the monkeys fingers: responses to tangential and normal forces. J. Neurophysiol. 2010;103:950–961. doi: 10.1152/jn.00502.2009. [DOI] [PubMed] [Google Scholar]
- 19.Dong Y., Mihalas S., Kim S.S., Yoshioka T., Bensmaia S., Niebur E. A simple model of mechanotransduction in primate glabrous skin. J. Neurophysiol. 2013;109:1350–1359. doi: 10.1152/jn.00395.2012. [DOI] [PMC free article] [PubMed] [Google Scholar]
- 20.Manfredi L.R., Baker A.T., Elias D.O., Dammann J.F., Zielinski M.C., Polashock V.S., Bensmaia S.J. The effect of surface wave propagation on neural responses to vibration in primate glabrous skin. PLoS One. 2012;7:e31203. doi: 10.1371/journal.pone.0031203. [DOI] [PMC free article] [PubMed] [Google Scholar]
- 21.Nakamura S., Crowninshield R.D., Cooper R.R. An analysis of soft tissue loading in the foot--a preliminary report. Bull. Prosthet. Res. 1981;10–35:27–34. [PubMed] [Google Scholar]
- 22.Mitchell M.R., Link R.E., Mix A.W., Giacomin A.J. Standardized polymer durometry. J. Test. Eval. 2011;39:103205. doi: 10.1520/JTE103205. [DOI] [Google Scholar]
- 23.Muniak M.A., Ray S., Hsiao S.S., Dammann J.F., Bensmaia S.J. The neural coding of stimulus intensity: linking the population response of mechanoreceptive afferents with psychophysical behavior. J. Neurosci. 2007;27:11687–11699. doi: 10.1523/JNEUROSCI.1486-07.2007. [DOI] [PMC free article] [PubMed] [Google Scholar]
- 24.Kaas J.H. The Human Nervous System. Elsevier; 2004. Somatosensory system; pp. 1059–1092. [DOI] [Google Scholar]
- 25.Bonnefoy A., Armand S. 2015. Normal Gait. Orthopedic Management of Children with Cerebral Palsy: A comprehensive approach; p. 567. [Google Scholar]
- 26.Wiik A.V., Aqil A., Brevadt M., Jones G., Cobb J. Abnormal ground reaction forces lead to a general decline in gait speed in knee osteoarthritis patients. World J. Orthop. 2017;8:322–328. doi: 10.5312/wjo.v8.i4.322. [DOI] [PMC free article] [PubMed] [Google Scholar]
- 27.Callier T., Suresh A.K., Bensmaia S.J. Neural coding of contact events in somatosensory cortex. Cereb. Cortex. 2019;29:4613–4627. doi: 10.1093/cercor/bhy337. [DOI] [PMC free article] [PubMed] [Google Scholar]
- 28.Kavounoudias A., Roll R., Roll J.-P. The plantar sole is a ‘dynamometric map’ for human balance control. Neuroreport. 1998;9:3247–3252. doi: 10.1097/00001756-199810050-00021. [DOI] [PubMed] [Google Scholar]
- 29.Meyer P.F., Oddsson L.I.E., De Luca C.J. The role of plantar cutaneous sensation in unperturbed stance. Exp. Brain Res. 2004;156:505–512. doi: 10.1007/s00221-003-1804-y. [DOI] [PubMed] [Google Scholar]
- 30.Orma E.J. The effects of cooling the feet and closing the eyes on standing equilibrium. Different patterns of standing equilibrium in young adult men and women. Acta Physiol. Scand. 1957;38:288–297. doi: 10.1111/j.1748-1716.1957.tb01392.x. [DOI] [PubMed] [Google Scholar]
- 31.Wang Y., Watanabe K., Chen L. Effect of plantar cutaneous inputs on center of pressure during quiet stance in older adults. J. Exerc. Sci. Fit. 2016;14:24–28. doi: 10.1016/j.jesf.2016.02.001. [DOI] [PMC free article] [PubMed] [Google Scholar]
- 32.Perry S.D., McIlroy W.E., Maki B.E. The role of plantar cutaneous mechanoreceptors in the control of compensatory stepping reactions evoked by unpredictable, multi-directional perturbation. Brain Res. 2000;877:401–406. doi: 10.1016/S0006-8993(00)02712-8. [DOI] [PubMed] [Google Scholar]
- 33.Do M.C., Bussel B., Breniere Y. Influence of plantar cutaneous afferents on early compensatory reactions to forward fall. Exp. Brain Res. 1990;79:319–324. doi: 10.1007/BF00608241. [DOI] [PubMed] [Google Scholar]
- 34.Maki B.E., McIlroy W.E. Postural control in the older adult. Clin. Geriatr. Med. 1996;12:635–658. doi: 10.1016/S0749-0690(18)30193-9. [DOI] [PubMed] [Google Scholar]
- 35.Zehr E.P., Nakajima T., Barss T., Klarner T., Miklosovic S., Mezzarane R.A., Nurse M., Komiyama T. Cutaneous stimulation of discrete regions of the sole during locomotion produces “sensory steering” of the foot. BMC Sports Sci. Med. Rehabil. 2014;6:33. doi: 10.1186/2052-1847-6-33. [DOI] [PMC free article] [PubMed] [Google Scholar]
- 36.Fallon J.B., Bent L.R., McNulty P.A., Macefield V.G. Evidence for strong synaptic coupling between single tactile afferents from the sole of the foot and motoneurons supplying leg muscles. J. Neurophysiol. 2005;94:3795–3804. doi: 10.1152/jn.00359.2005. [DOI] [PubMed] [Google Scholar]
- 37.Piaggesi A., Romanelli M., Schipani E., Campi F., Magliaro A., Baccetti F., Navalesi R. Hardness of plantar skin in diabetic neuropathic feet. J. Diabetes Complications. 1999;13:129–134. doi: 10.1016/S1056-8727(98)00022-1. [DOI] [PubMed] [Google Scholar]
- 38.Raspopovic S. Advancing limb neural prostheses. Science. 2020;370:290–291. doi: 10.1126/science.abb1073. [DOI] [PubMed] [Google Scholar]
- 39.Petrini F.M., Bumbasirevic M., Valle G., Ilic V., Mijović P., Čvančara P., Barberi F., Katic N., Bortolotti D., Andreu D., et al. Sensory feedback restoration in leg amputees improves walking speed, metabolic cost and phantom pain. Nat. Med. 2019;25:1356–1363. doi: 10.1038/s41591-019-0567-3. [DOI] [PubMed] [Google Scholar]
- 40.Petrini F.M., Valle G., Bumbasirevic M., Barberi F., Bortolotti D., Cvancara P., Hiairrassary A., Mijovic P., Sverrisson A.Ö., Pedrocchi A., et al. Enhancing functional abilities and cognitive integration of the lower limb prosthesis. Sci. Transl. Med. 2019;11:eaav8939. doi: 10.1126/scitranslmed.aav8939. [DOI] [PubMed] [Google Scholar]
- 41.Valle G., Saliji A., Fogle E., Cimolato A., Petrini F.M., Raspopovic S. Mechanisms of neuro-robotic prosthesis operation in leg amputees. Sci. Adv. 2021;7:eabd8354. doi: 10.1126/sciadv.abd8354. [DOI] [PMC free article] [PubMed] [Google Scholar]
- 42.Preatoni G., Valle G., Petrini F.M., Raspopovic S. Lightening the perceived prosthesis weight with neural embodiment promoted by sensory feedback. Curr. Biol. 2021;31:1065–1071.e4. doi: 10.1016/j.cub.2020.11.069. [DOI] [PubMed] [Google Scholar]
- 43.Graczyk E.L., Schiefer M.A., Saal H.P., Delhaye B.P., Bensmaia S.J., Tyler D.J. The neural basis of perceived intensity in natural and artificial touch. Sci. Transl. Med. 2016;8:362ra142. doi: 10.1126/scitranslmed.aaf5187. [DOI] [PMC free article] [PubMed] [Google Scholar]
- 44.Saal H.P., Bensmaia S.J. Biomimetic approaches to bionic touch through a peripheral nerve interface. Neuropsychologia. 2015;79:344–353. doi: 10.1016/j.neuropsychologia.2015.06.010. [DOI] [PubMed] [Google Scholar]
- 45.Katic N., Valle G., Raspopovic S. In: Handbook of Neuroengineering. Thakor N.V., editor. Springer Singapore; 2022. Modeling of the peripheral nerve to investigate advanced neural stimulation (sensory neural prosthesis) pp. 1–30. [DOI] [Google Scholar]
- 46.Zelechowski M., Valle G., Raspopovic S. A computational model to design neural interfaces for lower-limb sensory neuroprostheses. J. Neuroeng. Rehabil. 2020;17:24. doi: 10.1186/s12984-020-00657-7. [DOI] [PMC free article] [PubMed] [Google Scholar]
- 47.Valle G., Mazzoni A., Iberite F., D’Anna E., Strauss I., Granata G., Controzzi M., Clemente F., Rognini G., Cipriani C., et al. Biomimetic intraneural sensory feedback enhances sensation naturalness, tactile sensitivity, and manual dexterity in a bidirectional prosthesis. Neuron. 2018;100:37–45.e7. doi: 10.1016/j.neuron.2018.08.033. [DOI] [PubMed] [Google Scholar]
- 48.Valle G., Aiello G., Ciotti F., Cvancara P., Martinovic T., Kravic T., Navarro X., Stieglitz T., Bumbasirevic M., Raspopovic S. Multifaceted understanding of human nerve implants to design optimized electrodes for bioelectronics. Biomaterials. 2022;291:121874. doi: 10.1016/j.biomaterials.2022.121874. [DOI] [PubMed] [Google Scholar]
- 49.Johansson R.S., Birznieks I. First spikes in ensembles of human tactile afferents code complex spatial fingertip events. Nat. Neurosci. 2004;7:170–177. doi: 10.1038/nn1177. [DOI] [PubMed] [Google Scholar]
- 50.Mackevicius E.L., Best M.D., Saal H.P., Bensmaia S.J. Millisecond precision spike timing shapes tactile perception. J. Neurosci. 2012;32:15309–15317. doi: 10.1523/JNEUROSCI.2161-12.2012. [DOI] [PMC free article] [PubMed] [Google Scholar]
- 51.Yoshioka T., Bensmaïa S.J., Craig J.C., Hsiao S.S. Texture perception through direct and indirect touch: an analysis of perceptual space for tactile textures in two modes of exploration. Somatosens. Mot. Res. 2007;24:53–70. doi: 10.1080/08990220701318163. [DOI] [PMC free article] [PubMed] [Google Scholar]
- 52.Abdel-Basset M., Abdel-Fatah L., Sangaiah A.K. Computational Intelligence for Multimedia Big Data on the Cloud with Engineering Applications. Elsevier; 2018. Metaheuristic algorithms: a comprehensive review; pp. 185–231. [DOI] [Google Scholar]
- 53.Storn R., Price K. Differential evolution – a simple and efficient heuristic for global optimization over continuous spaces. J. Glob. Optim. 1997;11:341–359. doi: 10.1023/A:1008202821328. [DOI] [Google Scholar]
Associated Data
This section collects any data citations, data availability statements, or supplementary materials included in this article.
Supplementary Materials
Data Availability Statement
-
•
No new data for model fitting and validation was generated for this study. It has been published previously1 (see STAR Methods, microneurography section). Insole data for recreating step simulation have been deposited at Zenodo and are publicly available as of the date of publication. DOI is listed in the key resources table.
-
•
The full model code has been deposited on GitHub at https://github.com/ActiveTouchLab/footsim-python and is publicly available. The current version described in this paper has been archived on Zenodo. Code for recreating the step simulation is available at https://github.com/LClel/FootSim_insole_demonstration and has been archived on Zenodo. DOIs are listed in the key resources table.
-
•
Any additional information required to run or validate the model reported in this paper is available from the lead contact upon request.