Abstract
Protein-nucleic acid interactions play a crucial role in many biological processes. This work investigates the changes of pKa values and protonation states of ionizable groups (including nucleic acid bases) that may occur at protein-nucleic acid binding. Taking advantage of the recently developed pKa calculation tool DelphiPka, we utilize the large protein-nucleic acid interaction database (NPIDB database) to model pKa shifts caused by binding. It has been found that the protein’s interfacial basic residues experience favorable electrostatic interactions while the protein acidic residues undergo proton uptake to reduce the energy cost upon the binding. This is in contrast with observations made for protein-protein complexes. In terms of DNA/RNA, both base groups and phosphate groups of nucleotides are found to participate in binding. Some DNA/RNA bases undergo pKa shifts at complex formation, with the binding process tending to suppress charged states of nucleic acid bases. In addition, a weak correlation is found between the pH-optimum of protein-DNA/RNA binding free energy and the pH-optimum of protein folding free energy. Overall, the pH-dependence of protein-nucleic acid binding is not predicted to be as significant as that of protein-protein association.
Keywords: pKa changes, proton transfer, protein-nucleic acid interactions, electrostatic interactions, optimum pH
Introduction:
Protein-nucleic acid interactions are common in various biological reactions and play a crucial role in cell life (1–3). These interactions are mediated by various forces and effects, such as electrostatic interactions, hydrogen bonding, hydrophobic effect, and base stacking (2, 4, 5). Particularly, electrostatic interaction plays a crucial role in protein-nucleic acid binding, since nucleic acids are predominantly negatively charged, while the binding protein interface is typically positively charged – this results in charge complementarity(6–10). It has been demonstrated, in the case of protein-DNA interactions, that the protein recognizes a specific DNA sequence via formation of hydrogen bonds with specific bases (primarily in the major groove) and that the subsequent binding results in sequence-dependent deformations of the DNA helix (11, 12). Furthermore, it was shown that the narrow minor groove of DNA strongly enhances the negative electrostatic potential of the DNA phosphate groups and thus facilitates the binding of positively charged arginine residues (11, 13). Similarly, stacking, electrostatics, and hydrogen bonding play important roles in ssRNA recognition, providing affinity and sequence-specificity during the binding process (14).
In the past, existing structures of protein-nucleic acid complexes were utilized to predict protein binding hot spots and elucidate the mechanism of the binding (2, 4, 10, 14, 15). However, no attempts were made to evaluate the pKa change induced by the binding, even though it is well recognized that any binding results in a change of electrostatic environment (16, 17). Thus, the pKa values of the titratable groups may shift upon the complex formation and these pKa shifts can be used as an indicator of the electrostatic energy contribution to the binding (17–19).
Most properties of biological macromolecules are pH dependent, and are tuned towards a particular cellular or sub-cellular pH (20). Stability and binding are among the basic biophysical characteristics of these macromolecules. It was previously indicated that the stability of monomeric proteins is adapted to cellular and sub-cellular characteristic pH (4, 21, 22). Similarly, our past investigations have demonstrated that the pH-optimum of binding and the pH-optimum of folding are correlated (18, 23, 24). At the same time, the pH dependence of protein-nucleic acid binding has not attracted much attention.
Our work took advantage of a recent development: a Poisson-Boltzmann based pKa calculation approach, the DelPhiPKa (25, 26). The DelPhiPKa is capable of performing rapid pKa calculations of protein ionizable residues, and of nucleotides of RNA and DNA. Complex structures from a large protein-nucleic acid interaction database (NPIDB database) (27, 28) were used for the modeling. Our work aims at revealing plausible proton transfers and pKa shifts induced by protein-nucleic acid interactions. Furthermore, we investigate whether or not the pH-optimum protein-nucleic acid binding is correlated with the stability of the corresponding binding protein.
Materials and Methods:
Protein-nucleic acid structures used in the study:
Protein-nucleic complex structures were downloaded from the NPIDB database (27, 28). The NPIDB is a large protein-nucleic acid interaction database, which contains 5,547 structures of protein-nucleic acid complexes in the PDB format. The database also includes classification of complexes based on the protein domains using Pfam(29) and SCOP(30) families.
Structural analysis of these 5,547 complex structures showed that there are many entries with very similar structures. This is due to either a particular protein-nucleic acid complex being reported at different experimental conditions, structural resolution, or the existence of highly homologous binding domains. These identical or highly similar structures would result in common protonation state changes in our analysis, and would cause overrepresentation of such protein-nucleic acid interaction types. To eliminate structural bias, we took advantage of the existing Pfam and SCOP classification in the NPIDB database. One representative structure from each Pfam/SCOP family was elected based on the best resolution. We then created two datasets resulting in 112 protein-DNA complex structures and 56 protein-RNA complex structures using SCOP classification, along with 99 protein-DNA complex structures and 105 protein-RNA complex structures using Pfam classification. In this investigation, they are referred as “NPIDB Pfam dataset” and “SCOP dataset”.
pKa calculations:
The calculations of pKa values were performed with DelPhiPKa (25, 26), which is a Poisson-Boltzmann based approach to calculating the pKa values of protein ionizable residues and nucleotides of RNA and DNA. The profix program, a software module within the JACKAL package (http://wiki.c2b2.columbia.edu/honiglab_public/index.php/Software:Jackal_General_Description) was used to generate missing atoms/residues of the original structures. The ligands and ions were removed from the structures. For each protein-nucleic acid complex, one pKa’s calculation was performed for the entire complex structure and then another two calculations were run for the protein and nucleic acid component respectively. This provides pKa values of the titratable groups in bound and unbound states. The pH range in the calculations was set from 0 to 14 with an interval of 1.
Proton uptake and pH dependence of folding and binding energies:
We calculated the pH dependence of the stability of the complexes and their monomers using the following equation (17, 24, 31):
| (1) |
where Qf(pH) and Qu(pH) are the total net charge of folded and unfolded states. R is the universal gas constant, taken as 8.314J/(mol*K) and T is the temperature (in K). Similarly, in the case of pH dependence of binding energy, Qf(pH) and Qu(pH) represent the net charge of the complex and the sum of the net charges of the unbound protein and nucleic acid components. Typically, the difference of these net charges is referred as “proton uptake or release”(31).
The net charge of the folded state for complexes and their components in the pH range were calculated with the DelPhiPKa (25, 26). In this work, the unfolded state was modeled as a chain of non-interacting residues (24, 31). Thus, the net charge of the unfolded state was calculated with the Henderson-Hasselbalch equation:
| (2) |
, where the summation is over all titratable groups in the system and y(i) is +1 for basic groups and −1 for acidic groups.
Determination of the interfacial residues and classification of nucleotides in DNA/RNA:
A residue is defined to be interfacial residue if its solvent accessible surface area (SASA) changes upon complex formation. The SASA of all residues in the complexes and components was calculated using the VMD plugin (32). The probe radius was taken as 1.4 Å. For statistical analysis of pKa shifts in DNA and RNA, we classified nucleotides into three different types: phosphate group binding type, base group binding type and O-type (18). These classifications were based on the different binding modes as described below. These different interaction types were identified by calculating the SASA change of phosphate and base groups upon the complex formation. In our work, we are focused on the effects on the protonation state changes for the N1 and N3 atom in the bases of adenine and cytosine (33). Instead of the entire base group, we only carry out SASA calculations on N1, N3, and two bound carbon atoms. For the phosphate group, the SASA calculations were restricted to the P, OP1, and OP2 atoms. Thus, the relative SASA change for each group of atoms of interest was calculated as:
| (3) |
Finally, the classification of the binding mode was done using the following rules:
| (4) |
Results and Discussion:
In the results section, we will first report general frequency patterns of ionizable residues in datasets, as well as statistical analysis of pKa shifts induced by the binding. Furthermore, different pKa shift origins are classified for all ionizable groups based on different chemical-physical properties and binding modes. The pKa shifts among different binding modes are then analyzed. Finally, we investigate the pH dependence of the net charge of binding, complexes, and their components – and reveal how the optimum pH values are correlated (pH-optimum is the pH at which the binding or folding free energy is most favorable, see refs (22, 23) for details). Below we describe the results in sequential order.
The frequency patterns of ionizable residues in the datasets:
It is expected that proteins binding to negatively charged DNA or RNA should be positively charged, so that the electrostatic interactions are able to guide the protein toward its binding partner. To investigate this expectation, we carried out statistical analysis of amino acid composition of the proteins in both Pfam and SCOP datasets (Figure 1). We considered only Arg and Lys residues to be carrying positive charge, as His is typically neutral. The acidic groups were Glu and Asp. It can be seen (Figure 1) that the frequency of Arg and Lys residues are almost the same as the acidic residues in both datasets. Thus, the total net charge of these binding proteins is close to zero in the neutral pH range, which is somewhat unexpected.
Figure 1:
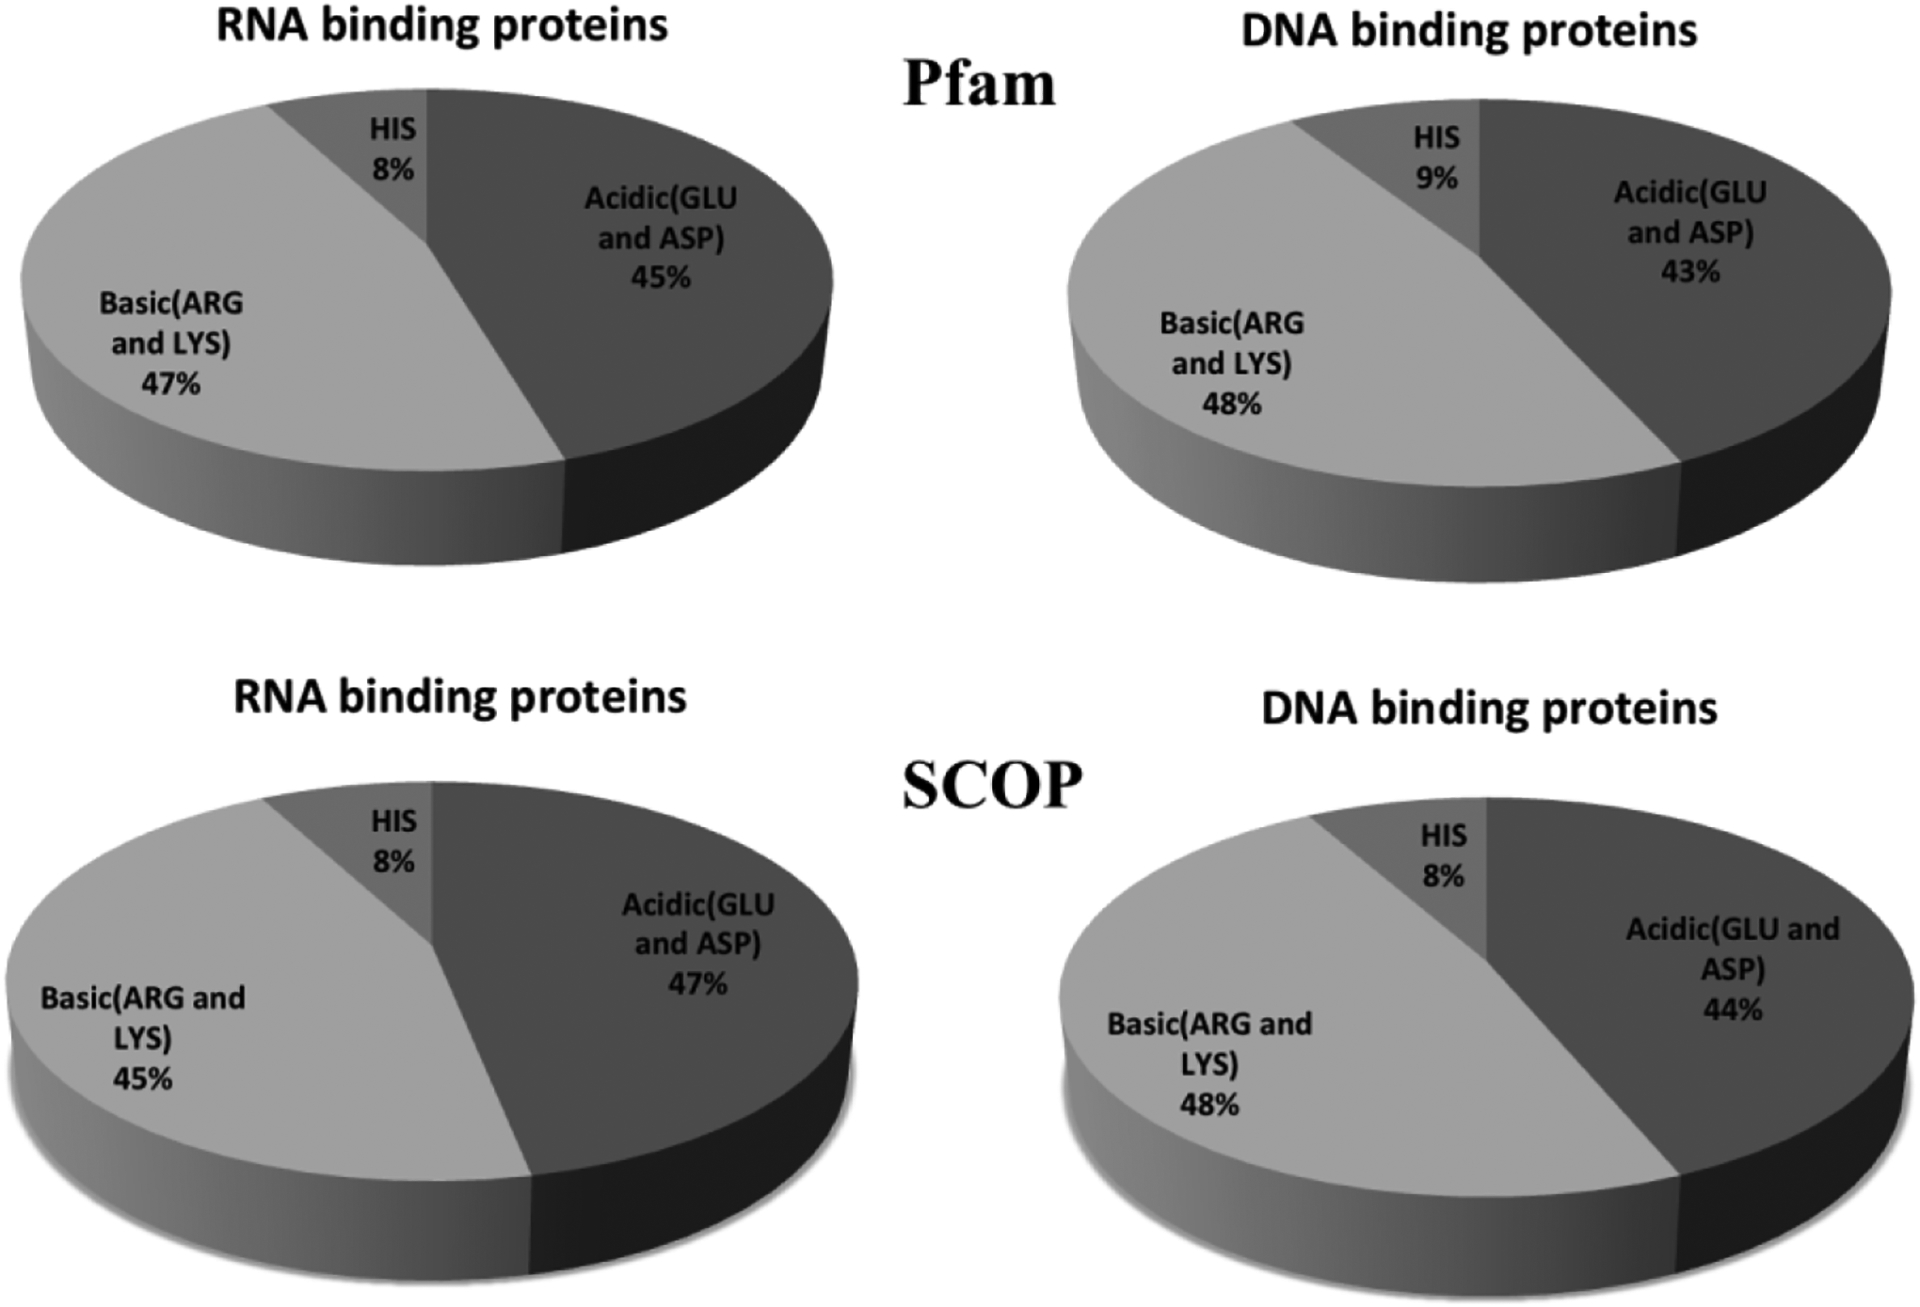
Frequency patterns of ionizable residues in both Pfam and SCOP datasets.
We now expand the analysis to the interfacial ionizable residues. The frequency patterns of different residue types were shown in Figure 2. In contrast to overall amino acid composition (Figure 1), the interfacial regions are enriched with basic residues, resulting in highly positive charged interfacial patches. This confirms our expectations, since both RNA and DNA are highly negatively charged in neutral pH. The important role of electrostatics in protein nucleic acid binding is indicated by our observations that the overall net charge is almost zero, but interfaces are positively charged. It provides guidance for correct orientations of binding partners. It should be mentioned that interfaces of DNA binding proteins are typically more positively charged when compared with RNA binding protein (Figure 2).
Figure 2:
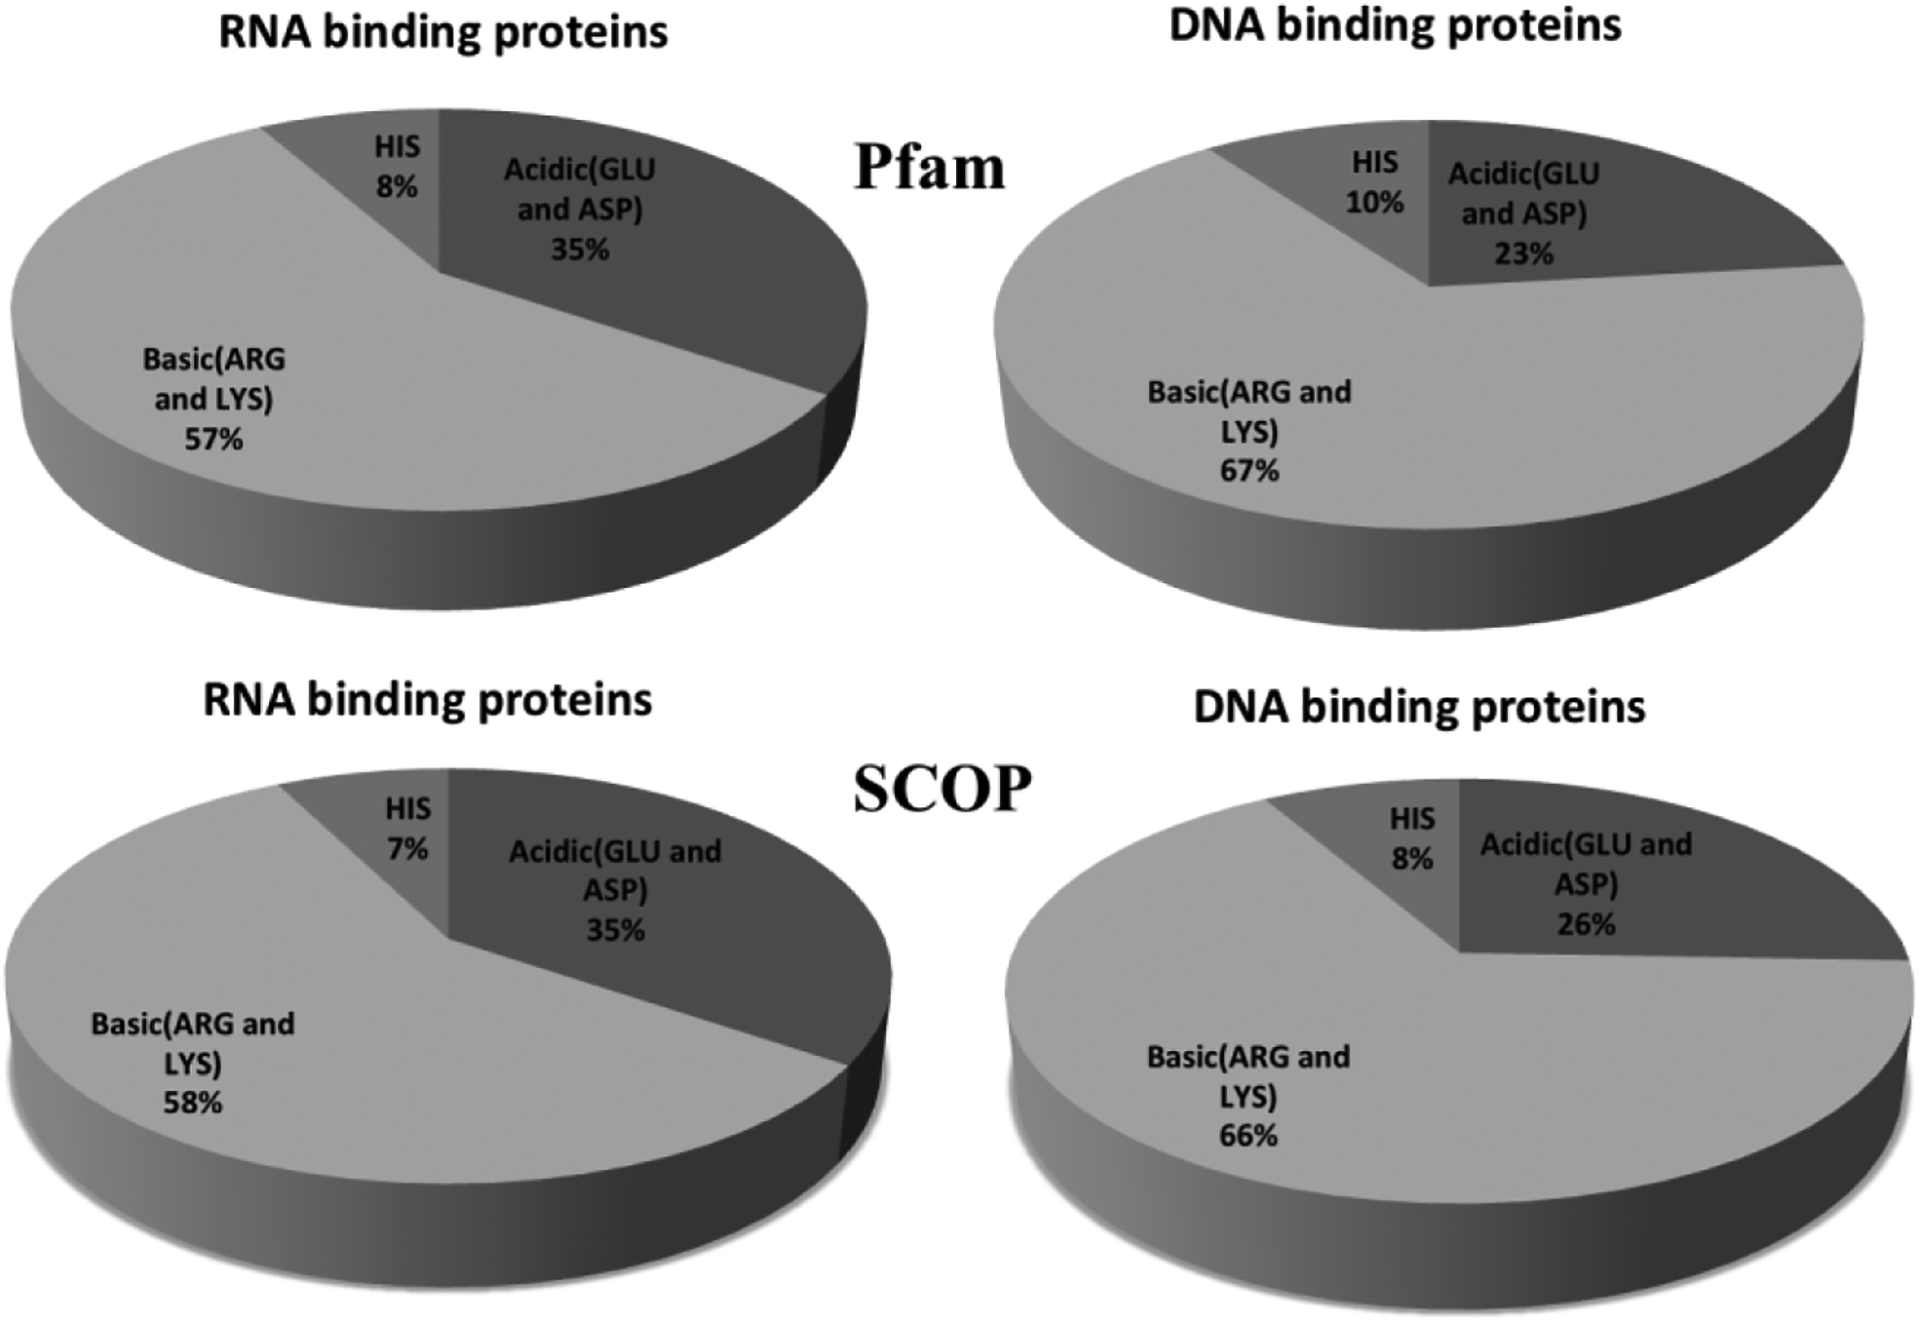
Frequency patterns of ionizable interfacial residues in both Pfam and SCOP datasets.
Statistics of pKa shifts induced by the binding:
Protein-protein binding frequently involves pKa shifts of ionizable groups as previously demonstrated both computationally (17, 18, 31, 34) and experimentally (31, 35–39). Here we address the same question for protein-DNA and protein-RNA binding, including the pKa changes of DNA/RNA bases, using computational methods. The calculations were done for all interfacial residues and bases separately for the complex and monomers alone. The pKa shifts were calculated with the following equation:
| (5) |
,where Z stands for the ionizable group in the protein or DNA/RNA.
The pKa shifts of all interfacial residues were calculated in both Pfam and SCOP datasets and the results are shown in Figures 3 and 4. The corresponding pKa shifts are reported for all protein acidic interfacial residues, protein basic interfacial residues, and nucleic acid ionizable groups (bases) separately. The results are grouped by complex type: protein-RNA complex, protein-double stranded DNA (protein-dsDNA) complex, and protein-single stranded (protein-ssDNA) complex. This is done to facilitate the analysis of the effect of different binding modes. It can be seen (Figures 3,4) that complex formation is predicted to cause positive pKa shifts for both acidic and basic protein titratable residues. This is in sharp contrast with the statistical observation made for protein-protein complexes(18). An opposite shift is predicted for nucleic acid bases – they are predicted to lower their pKa values upon complex formation. These tendencies are similar for all types of complexes (such as protein-RNA, protein-dsDNA, and protein-ssDNA complexes) and remain similar across both datasets (Pfam and SCOP). These pKa shifts originate from the different intrinsic properties of these groups, different binding modes, and different structural features (which will be discussed later).
Figure 3:
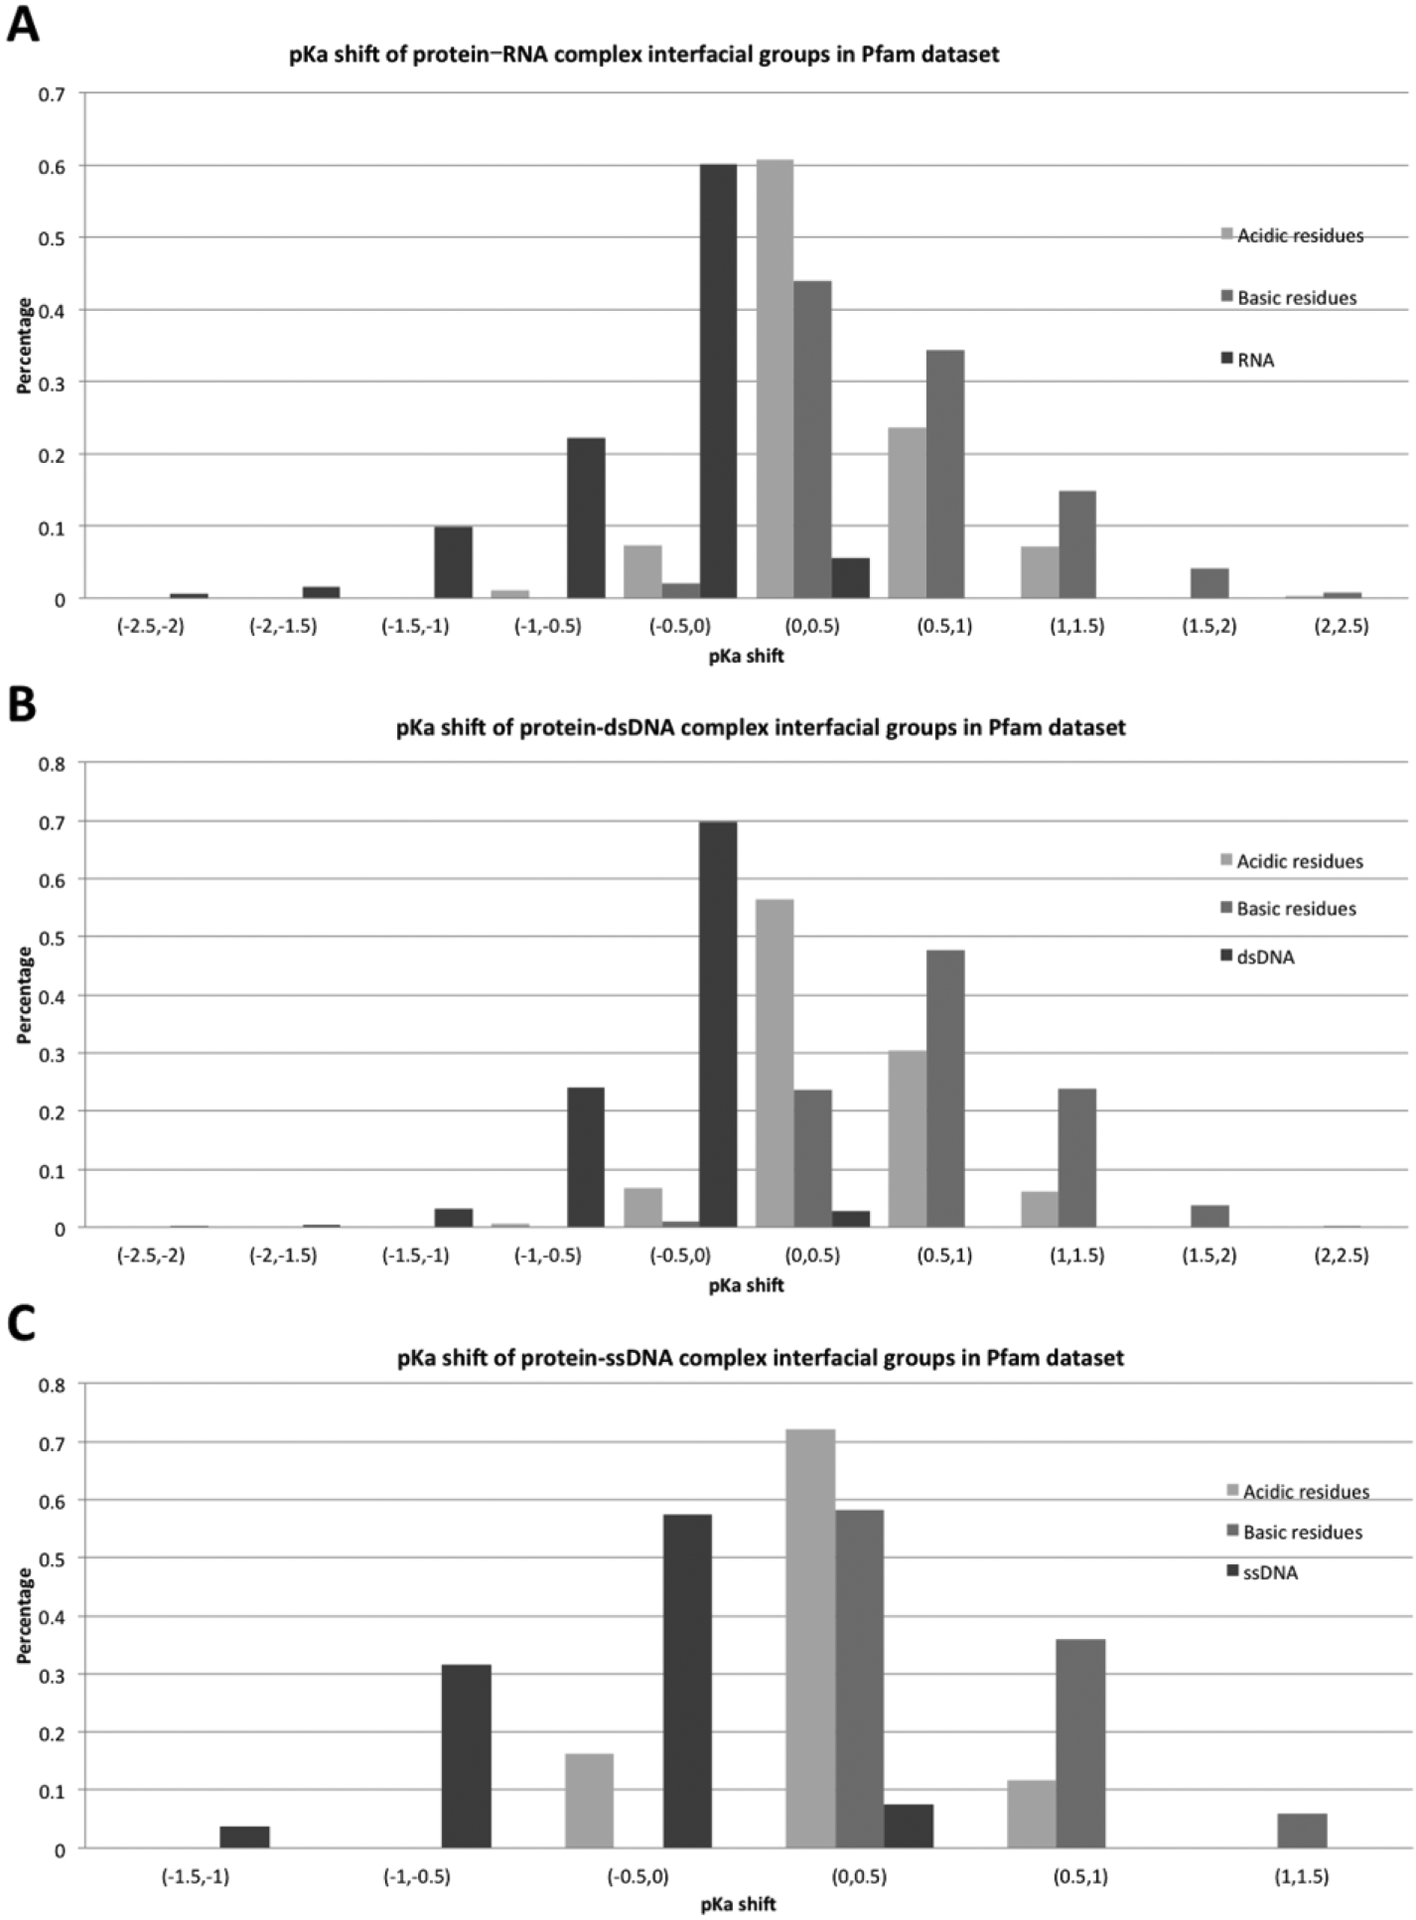
Distribution of pKa shifts for different types of ionizable groups and different types of complexes in Pfam dataset.
Figure 4:
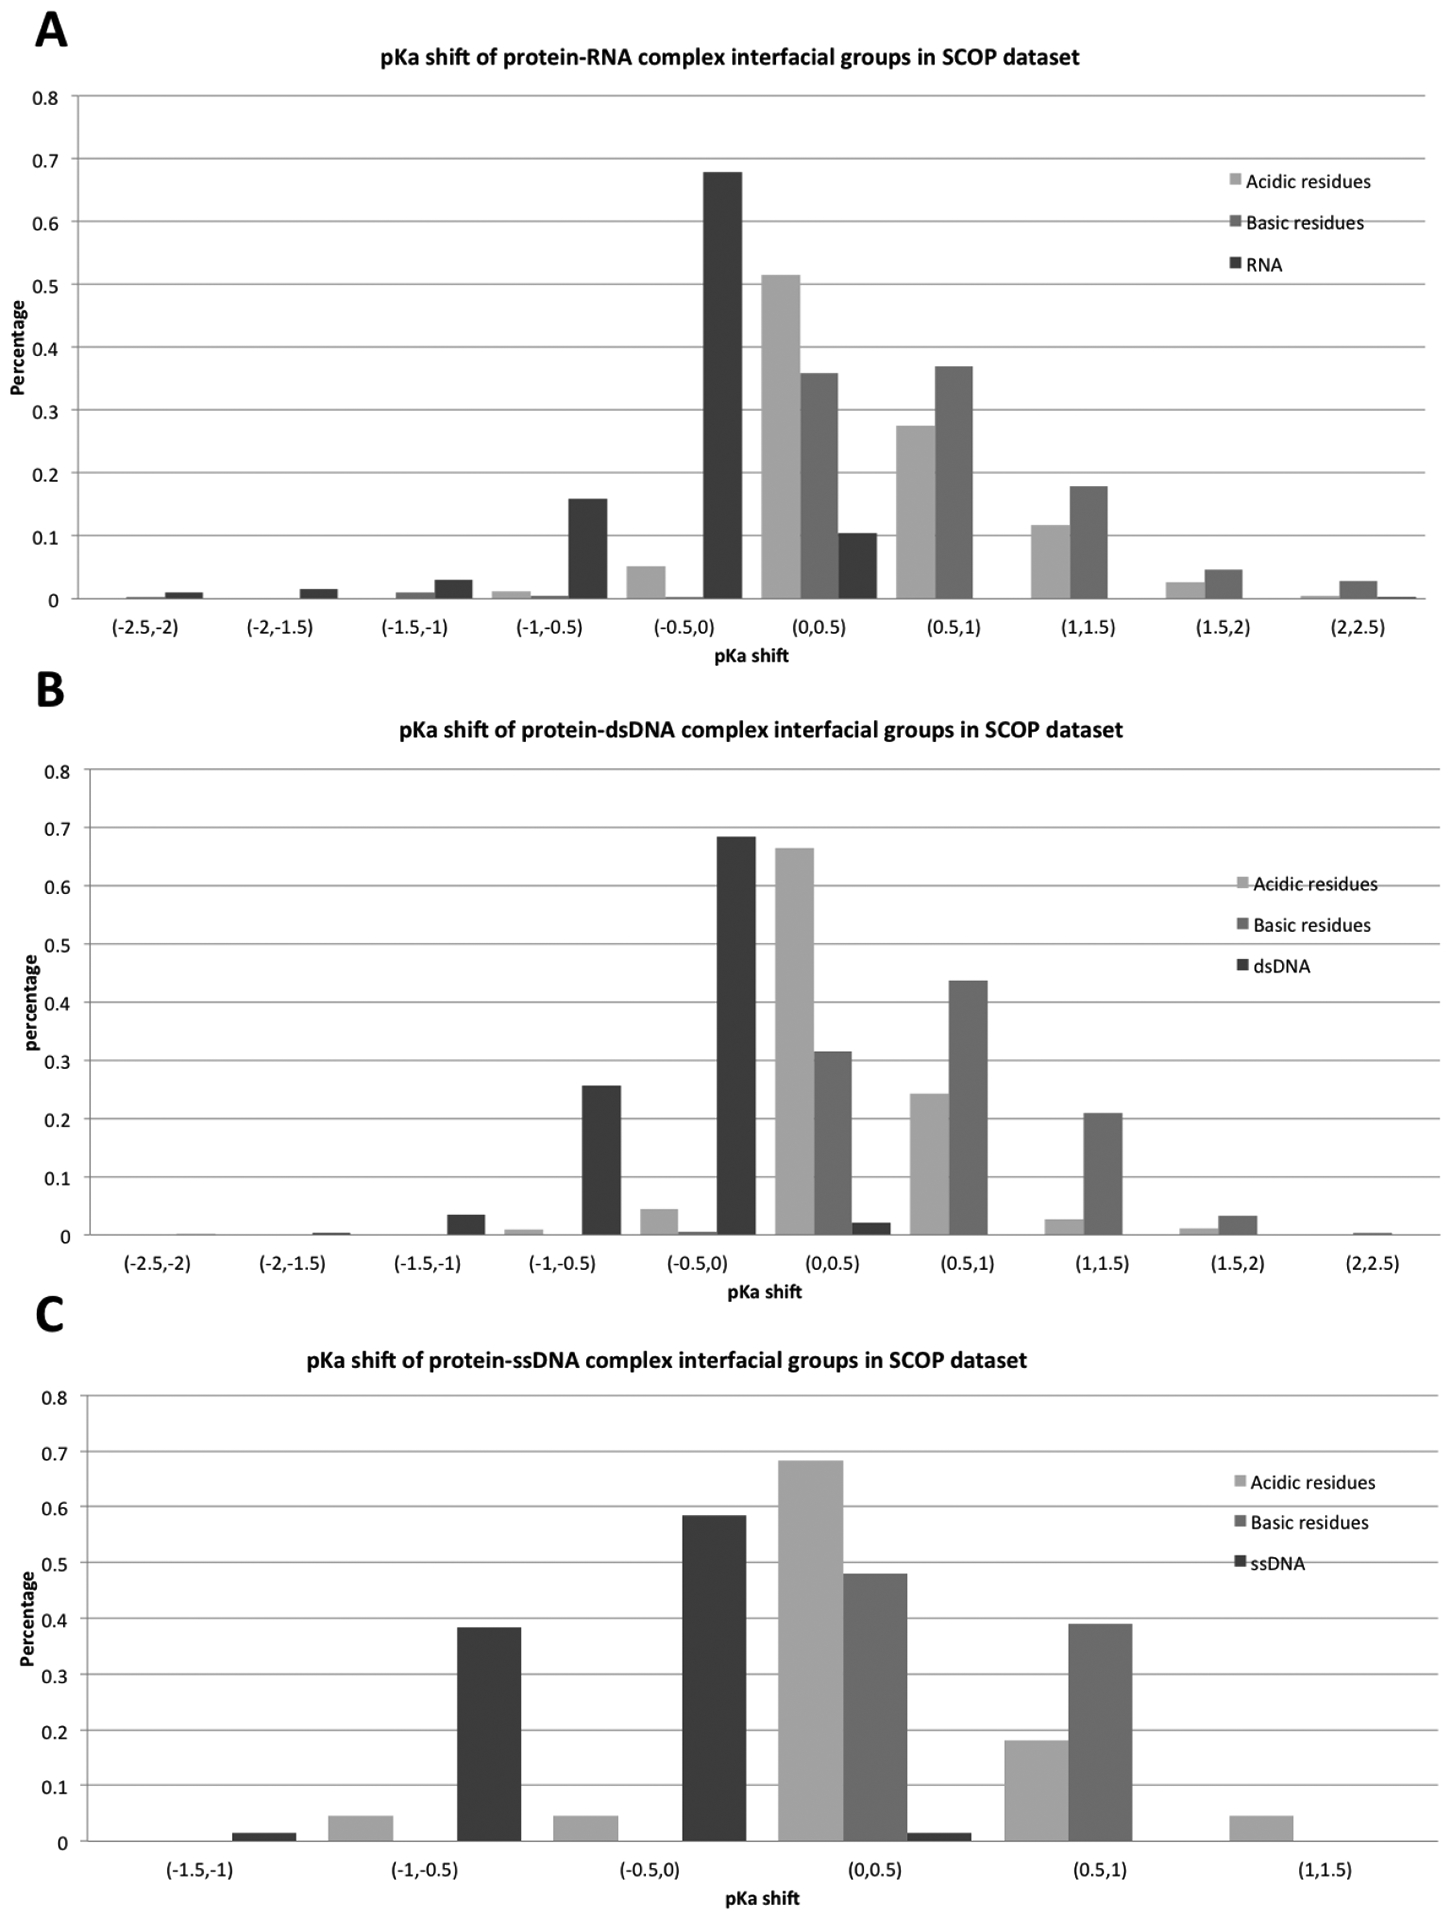
Distribution of pKa shifts for different types of ionizable groups and different types of complexes in SCOP dataset.
Further analysis of the pKa shift distribution indicates that the overall pKa shifts of protein basic residues are slightly larger when compared with the pKa shifts of acidic residues. This may indicate that protein basic groups are frequently involved in direct interactions with negatively charged phosphate groups of DNA/RNA. Nucleic bases of RNA and ssDNA are predicted to undergo larger pKa shifts than those of dsDNA. Perhaps this is due to the double helix structure of dsDNA, where the base groups make hydrogen bonds with their partners, and are buried before binding. Due to this, the base groups of RNA and ssDNA are involved in more direct interactions with the corresponding binding protein.
Analysis of the pKa shift origins:
In this section, we will outline common reasons for predicted pKa shifts and categorize them into several distinctive classes. Since protein titratable groups and DNA/RNA bases have different physical-chemical properties, the origins of their pKa shifts will be discussed separately.
Protein pKa shifts:
pKa shifts are caused by various factors, the most prominent being interactions with other charges and de-solvation penalty (upon complex formation). Based on the comparison of these energy components, we will consider two common scenarios: (a) complex formation is not affected by much solvation energy change (small de-solvation penalty) but provides strong favorable interactions supporting the charged state of the protein titratable group (termed C-type); and (b) complex formation does not greatly affect the solvation energy (small de-solvation penalty) while resulting in strong unfavorable interactions suppressing the charged state of the protein titratable group (termed N-type). A representative example for the first case, C-type residue, is shown in Figure 5A – depicting a fragment of the binding interface of Archaeosine tRNA-Guanine Transglycosylase complexed with lambda-form tRNA(PDB: 1j2b) (40). Upon the complex formation, Lys430 of chain A forms a new salt-bridge with the RNA Gua927’s phosphate group. In the unbound state, the pKa of Lys430 was calculated to be 10.22, a slight deviation from the standard pKa value. In the complex formation, the de-solvation energy slightly increases by 0.04kcal/mol, since the degree of the burial of the residue does not undergo a large change. However, the interaction energy is changed by −1.52kcal/mol – a contribution from the salt-bridge formed by Lys430 and phosphate group of RNA Gua927. As a result of favorable electrostatic interactions between the protein interfacial basic residue and phosphate group in RNA, the pKa of Lys430 shifts from 10.22 to 12.47 at the complex formation. This type of pKa shift was found in many cases, thus explaining the positive pKa shifts predicted for protein interfacial basic residues. The second common scenario is shown in Figure 5B for the structure of PVUII Endonuclease complexed with cognate DNA (PDB: 3pvi) (41). In unbound protein, the Glu68 residue of chain A is exposed to the water and the side chain is stabilized by the interaction with the nearby Lys70. Upon the complex formation, Glu68 side chain points to the phosphate group of DNA Cyt9. As shown in the corresponding Figure, the oxygen-oxygen distance between the Glu68 side chain and DNA Cyt9 phosphate group is only 3.5 Å. This results in strong unfavorable interactions opposing the charged state of Glu68. The existing interactions of the Glu68 and Lys70 are additionally weakened in the complex as Lys 70 forms new interactions with a phosphate group. According to the energy calculation of DelphiPka, the interaction energy is increased by 0.64 kcal/mol and the de-solvation energy is only slightly increased, since the degree of the burial of the residue does not change much. As result, the Glu68 pKa value is shifted from 3.93 to 5.11. Therefore, we refer to these kinds of residues (which are under unfavorable interactions in the complex) as N-type protein residues. As shown in the previous statistical analysis of pKa shifts, the majority of the protein acidic residues are affected by different degrees of positive pKa shifts. Most of these cases can be classified as N-type residues due to the unfavorable electrostatic interactions between the acidic residue and the phosphate group of the DNA/RNA nucleotides.
Figure 5:
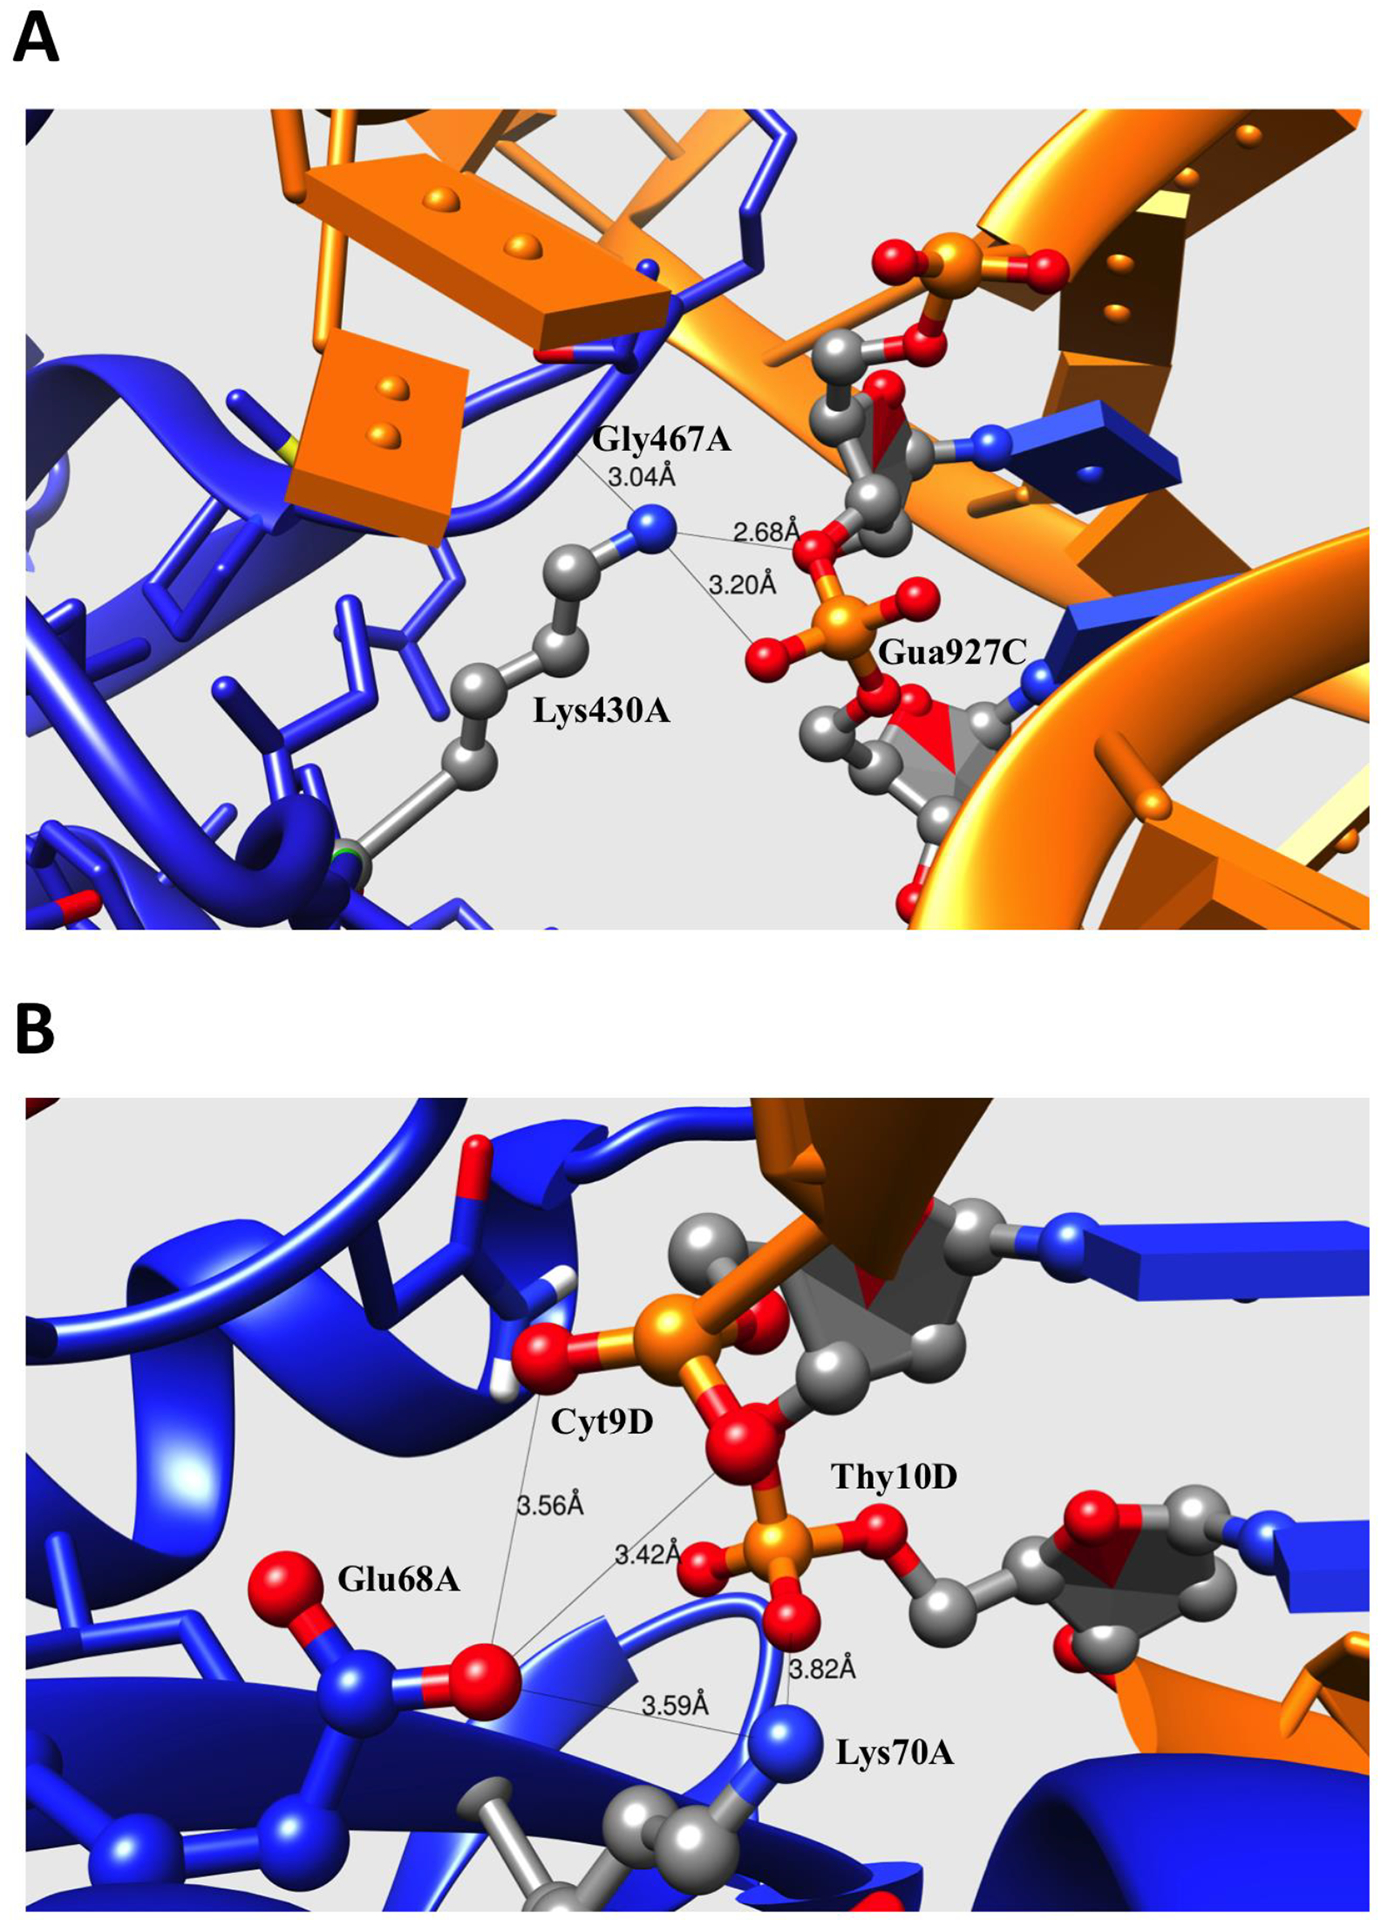
(A) Fragment of binding interface of Archaeosine tRNA-Guanine Transglycosylase complexed with lambda-form tRNA (PDB: 1j2b). (B) Fragment of binding interface of PVUII Endonuclease complexed with cognate DNA (PDB: 3pvi). The side chains of the residues directly contributing to the electrostatic interactions or H-bonding are shown with balls and sticks. The protein and DNA/RNA are marked as blue and orange for comparison. The distance between the atom pairs are shown in Å.
DNA/RNA:
In this investigation, the pKa values of Cys and Ade bases are predicted for bound and unbound states. These bases are typically neutral at physiological pH (pH about 7), but can be protonated and positively charged in some cases (25). As shown from the above statistical analysis, the majority of DNA/RNA bases are predicted to undergo negative pKa shifts due to the binding. Therefore, the base groups are less likely to be protonated at physiological pH values. We will group the common pKa shift scenarios into several categories: (a) bases experiencing large de-solvation penalty and forming H-bonding or electrostatic interactions (termed B-type), (b) bases experiencing electrostatic interactions and negligible de-solvation penalty (termed L-type), and (c) bases experiencing small de-solvation penalty (O-type). Typically, the B-type residue is a base group in which the nucleotide is buried into the binding interface and directly participates in hydrogen bonding or electrostatic interactions upon the complex formation. One representative example is shown in Figure 6A: a CCA-adding enzyme complexed with tRNA (PDB: 3ovb) (42). The atom N3 of the base group of the RNA Cyt33 is predicted to have standard pKa of 4.35 in unbound RNA. In chain C of the complex, the atom N3 of Cyt33 makes a hydrogen bond with the backbone atom of His93 of chain A of the complex. Since the N3 atom plays the role of a proton acceptor, such an interaction increases the energy cost of protonation. Cys 33 is also buried at the binding interface, and thus the charged form of Cys 33 pays the de-solvation penalty. Combining these two effects, the RNA Cys 33 pKa shifts from 4.56 to 1.14. Another example is shown in the Figure 6B: TilS complexed with tRNA (PDB: 3a2k)(43). The base group of RNA Ade36 is buried into the binding interface and surrounded by a pocket of three Arg residues. Although the base group is not directly forming interactions with nearby residues, it is still affected by electrostatic interactions of the three positively charged Arg residues. This results in a shifting equilibrium towards the de-protonated form. The degree of burial for Ade36 is increased upon complex formation, resulting in a de-solvation penalty. Finally, the pKa value of Ade36 is predicted to decrease from 4.90 to 2.75.
Figure 6:
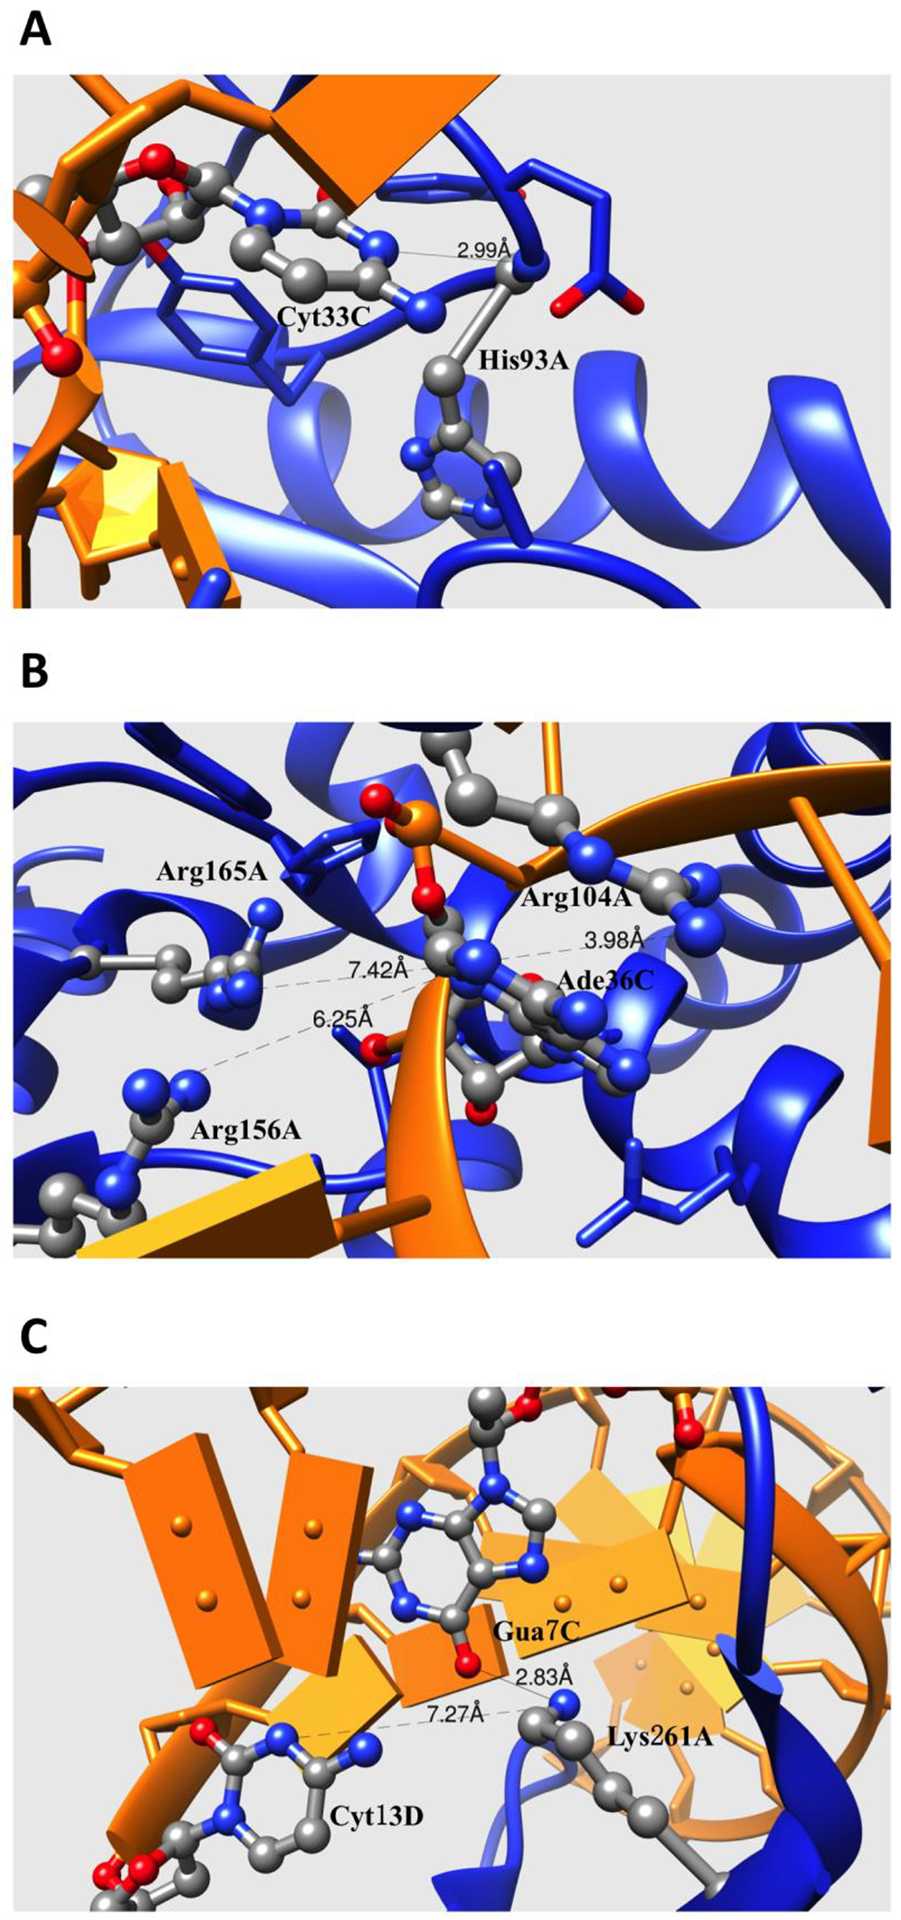
(A) Fragment of binding interface of CCA-adding Enzyme complexed with tRNA (PDB: 3ovb). (B) Fragment of binding interface of TilS complexed with tRNA (PDB: 3a2k). (C) Fragment of binding interface of restriction endonuclease MspI on its palindromic DNA recognition site (PDB: 1sa3). The side chains of the residues directly contributing to the electrostatic interactions or H-bonding are shown with balls and sticks. The protein and DNA/RNA are marked as blue and orange. The distances between atom pairs are shown in Å.
Another common type of pKa shift, listed above as L-type, is shown in Figure 6C. This shift occurs in case of restriction endonuclease MspI on its palindromic DNA recognition site (PDB: 1sa3)(44). The Cyt13 of chain D resides in a double strand structure, and its base group makes a hydrogen bond with its base pair. The base group of Cyt13 is pre-buried in unbound DNA and its degree of burial is almost unchanged in the complex. Therefore, Cys13 does not pay a de-solvation penalty upon complex formation. However, a nearby positively charged Lys261 protein residue does interact with the base of Cyt13. This unfavorable interaction energy is calculated to be about 0.5 kcal/mol, and along with other smaller contributions, results in pKa shift of −0.83.
Finally, the common cases referred to above as “O-type” are represented by many other residues that are not involved in strong interactions with charged residues upon complex formation. Their pKa shifts are relatively small (|ΔpKa| < 0.5) and are mostly due to a de-solvation penalty upon complex formation.
pKa shifts and binding mode:
In this section we investigate the effect of different binding modes on previously discussed pKa shifts. Here, we classify the binding modes into three categories: (a) phosphate group binding mode (protein interacts mostly with phosphate groups), (b) base group binding mode (protein interacts mostly with base groups), and (c) others (O-type mode: categorization is outlined in Method section).
Figures 7 and 8 show the distributions of pKa shifts in different binding modes for both Pfam and SCOP datasets. The most significant pKa shifts are predicted for the base group binding mode. In base group binding modes, the base groups directly participate in the interactions across the interface and bases are buried at the binding interface, thus paying a large de-solvation penalty. According to the above categorization strategy, these bases are grouped as B-type nucleotides. Both the de-solvation penalty and interaction energy oppose the charged form of the bases and thus result in significant pKa shifts, lowering the pKa of the bases. Phosphate group binding modes result in L-type bases, as the base groups are not at the interface and do not experience burial change upon complex formation (but are affected by long-range electrostatic interactions). In the phosphate group binding mode, the bases are predicted to have relatively less significant pKa shifts. The rest of these cases are mostly of O-type, and are predicted to have the smallest pKa shifts as they are not involved in strong interactions and do not experience a de-solvation penalty upon binding.
Figure 7:
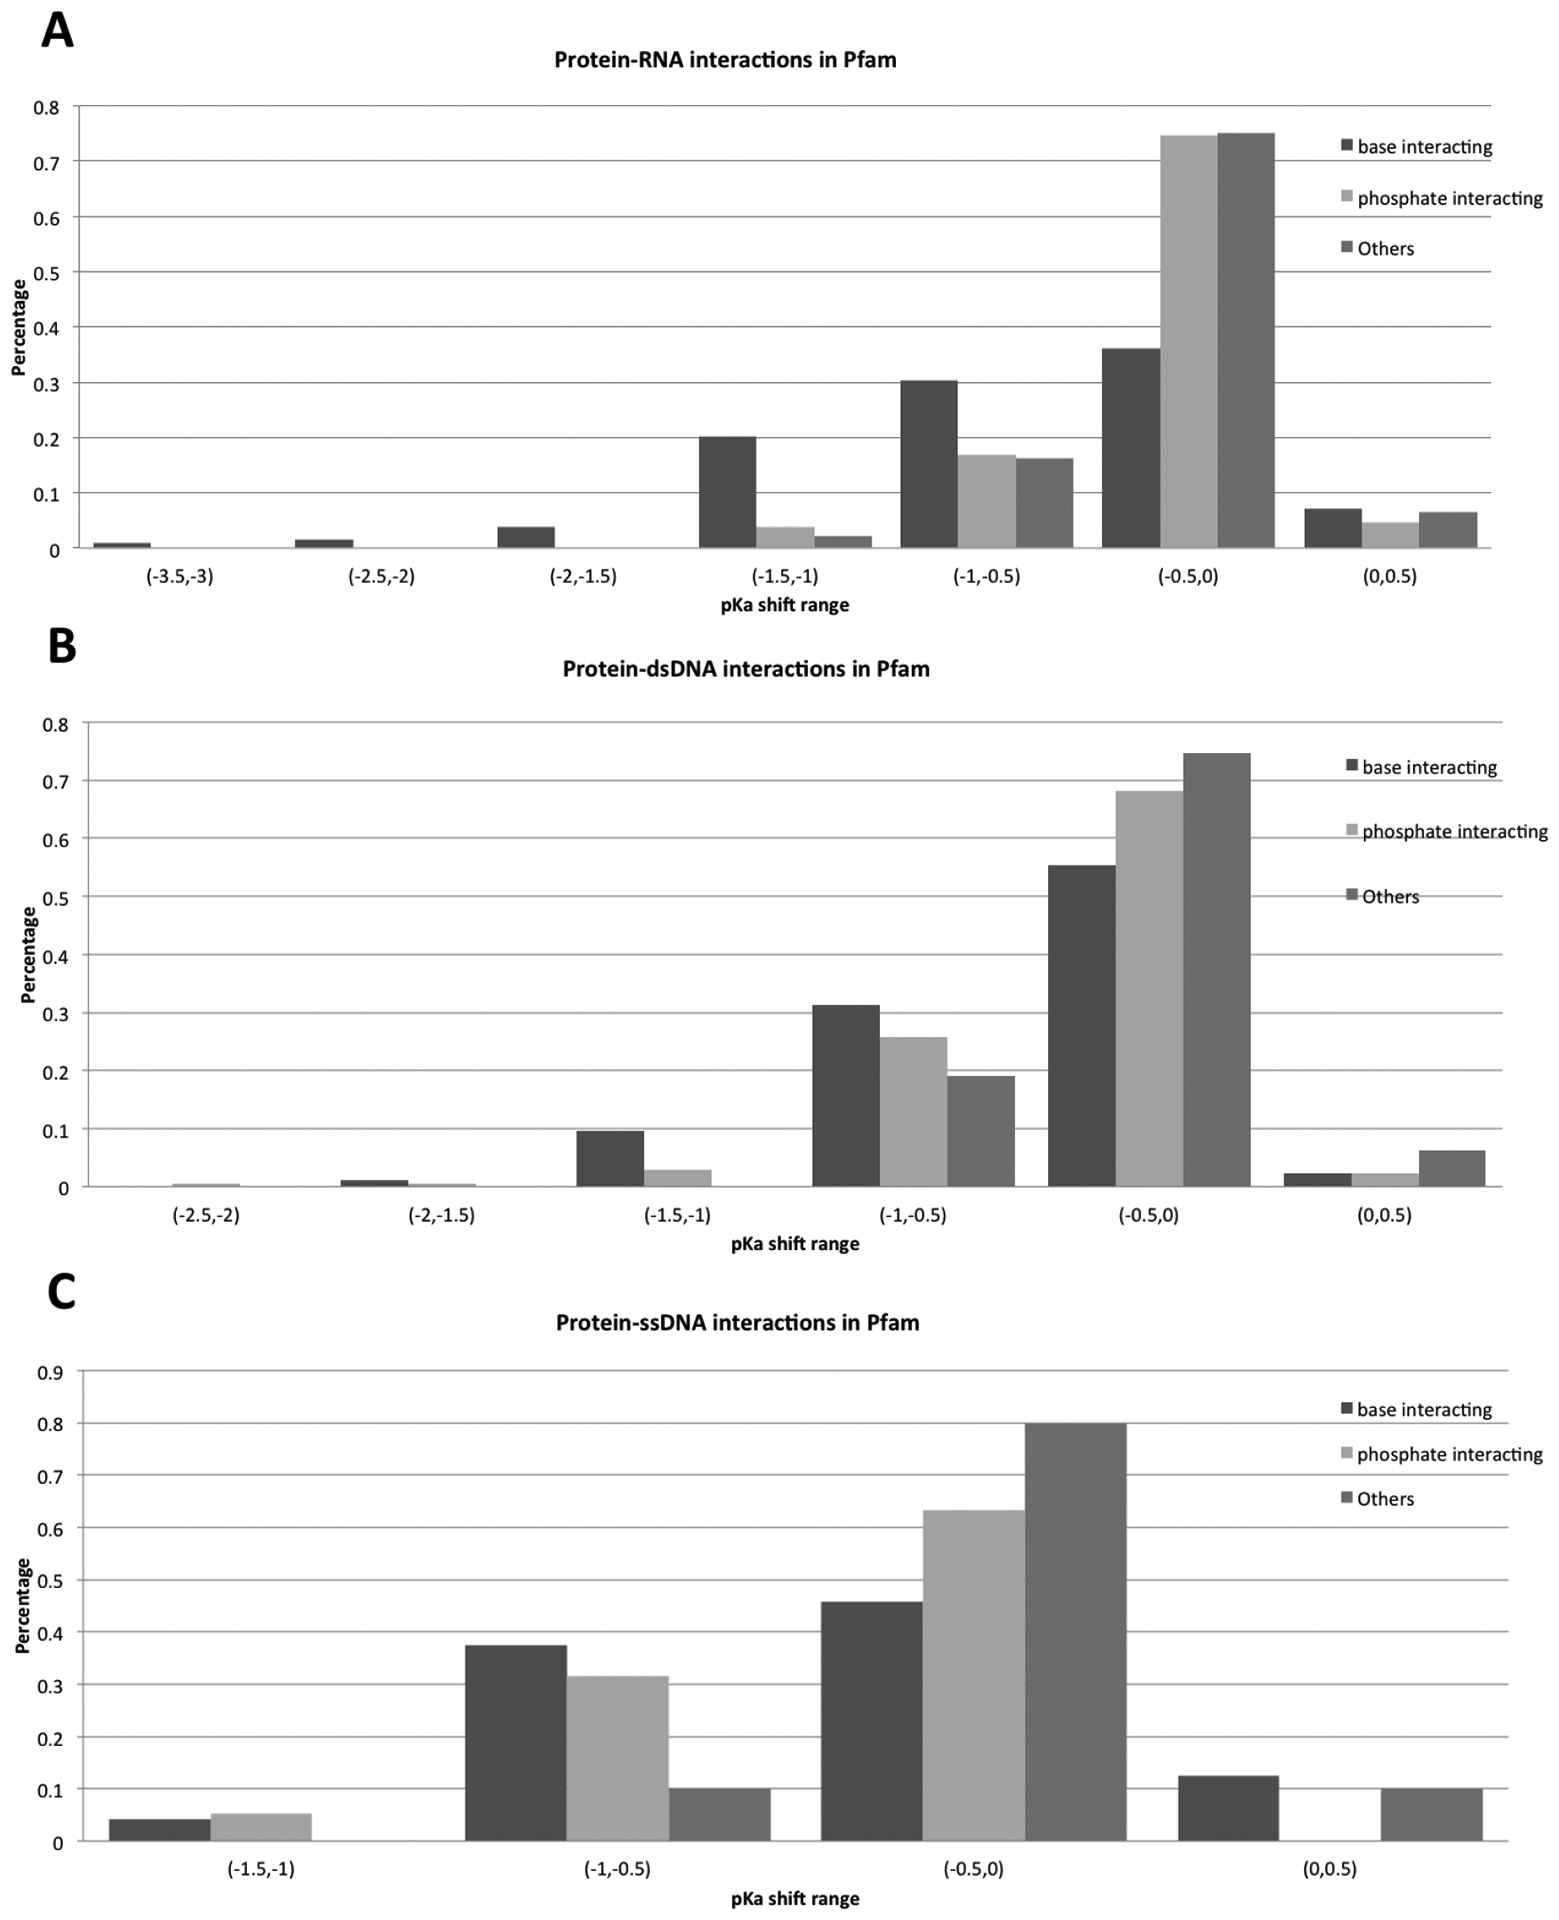
Distributions of pKa shifts across the different binding modes in the Pfam dataset.
Figure 8:
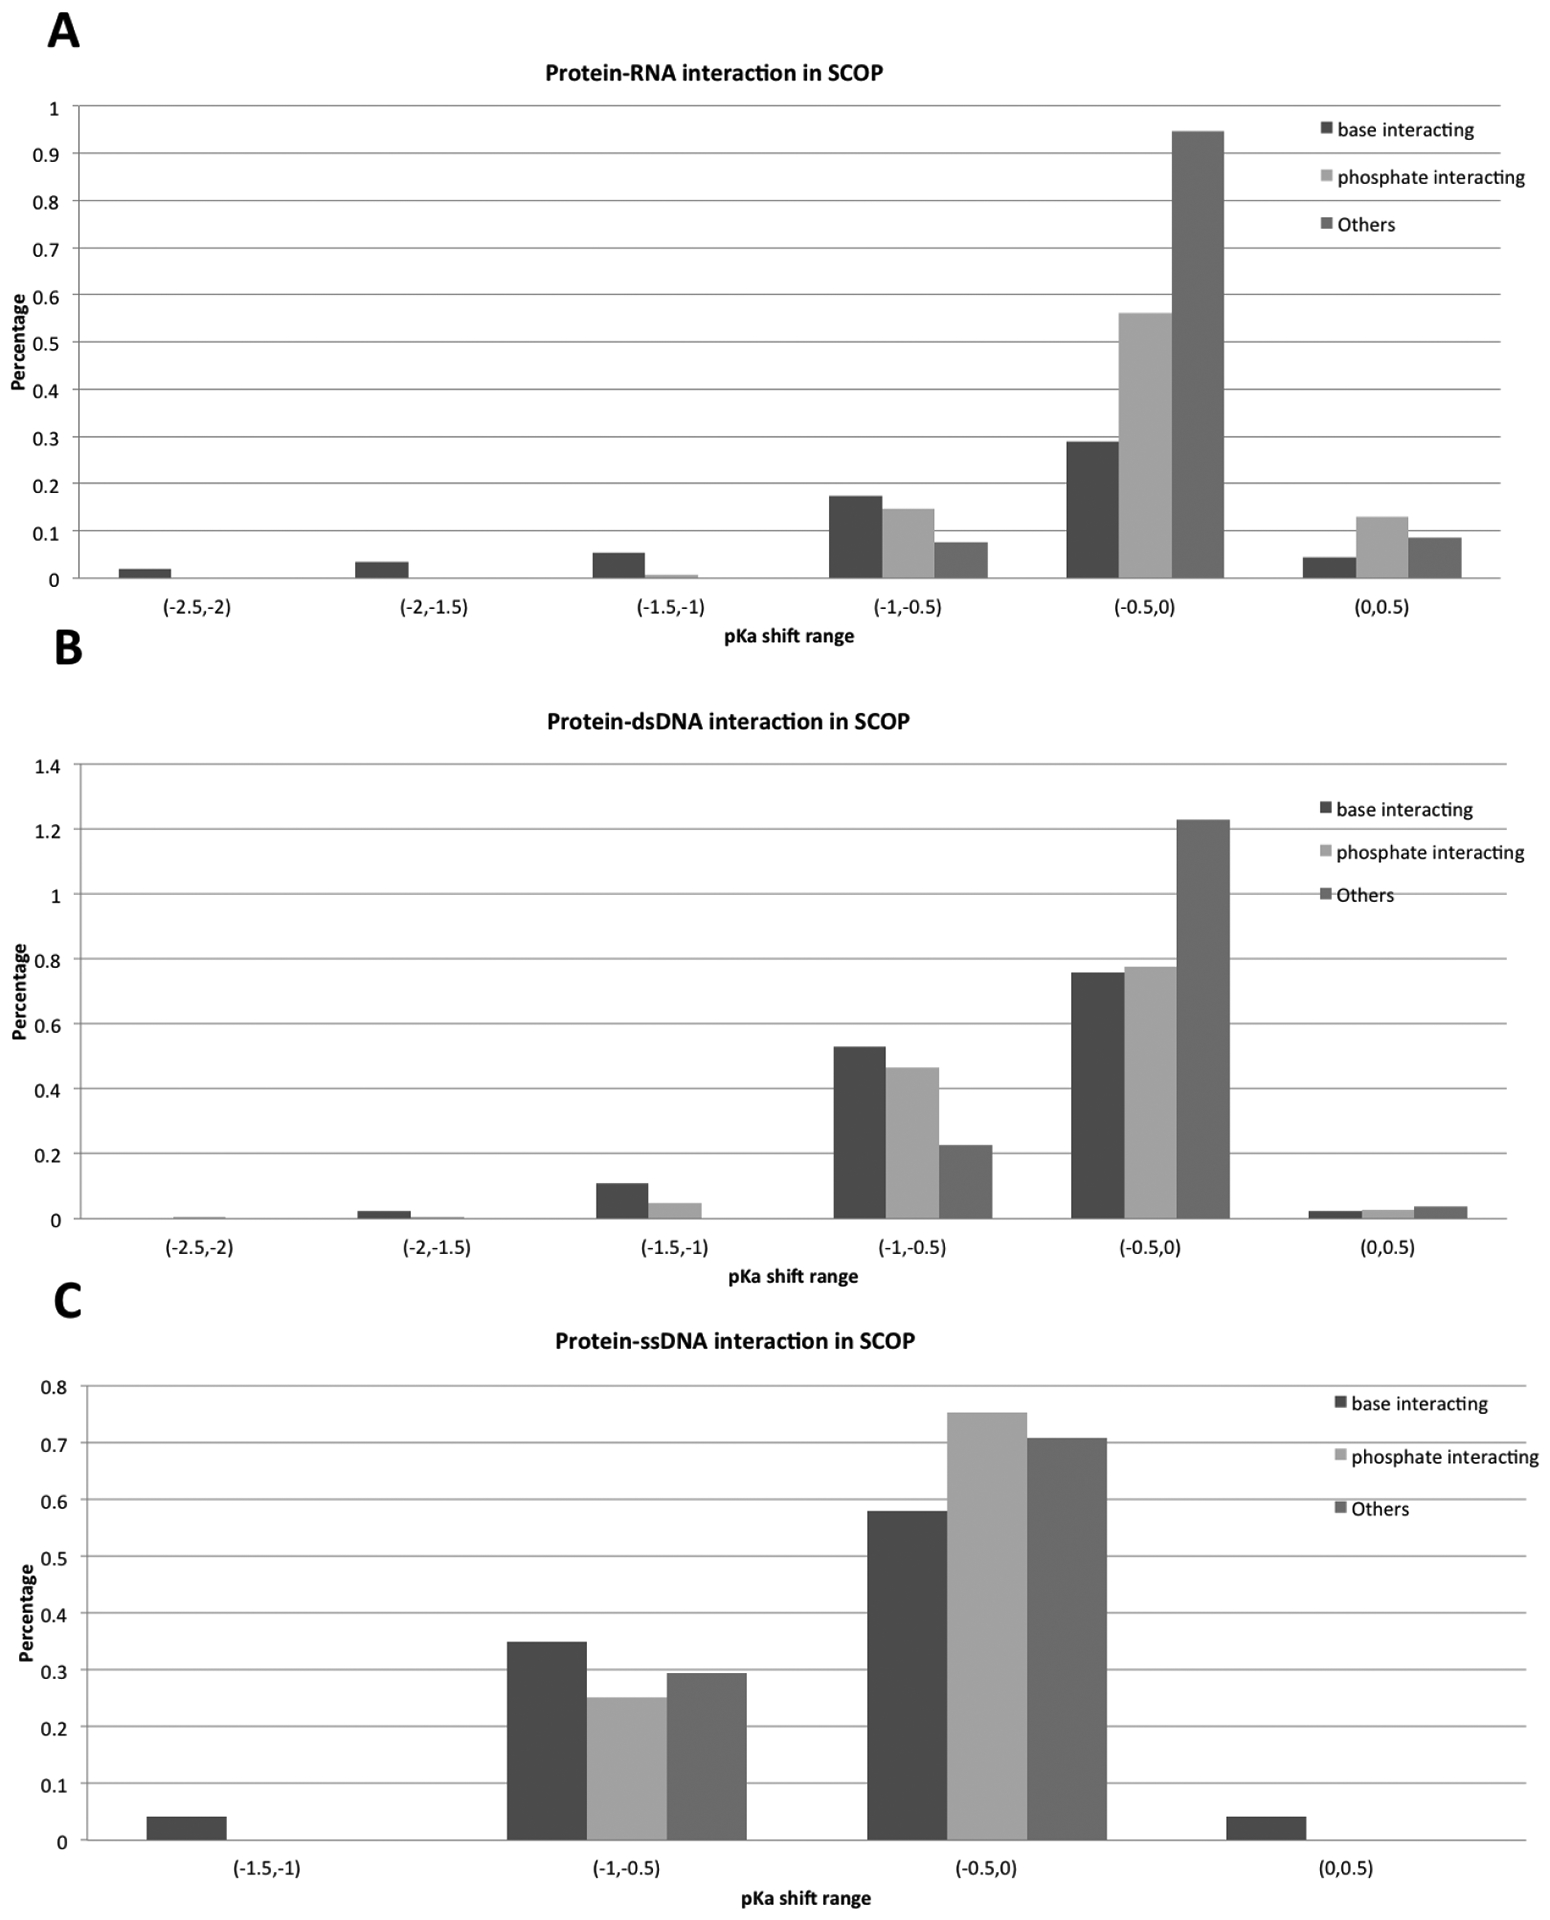
Distributions of pKa shifts across the different binding modes in the SCOP dataset.
pH-optimum of binding:
Previous studies investigated protein stability and interactions as a function of pH, and referred to the pH-optimum as the pH of maximal stability and interactions (22–24). This optimum pH can be obtained by finding the pH value at which the net charge difference of the folded and unfolded states, or bound and unbound states, is zero. We illustrate this with a particular example from our dataset. The pH dependence of the net charge difference and the pH dependence of the binding free energy for a bacteriophage lambda cII protein in complex with dsDNA (PDB: 1zs4) (45) is shown in Figure 9. Three distinctively different pH regions can be clearly identified. The first region is in the acidic pH range, where both the net charge difference (ΔQ < 0) and the free energy decrease (the free energy of binding becomes more favorable) with an increase in pH. Proton release occurs in this pH range upon complex formation or protein folding which involves mostly acidic groups. The third region is in the basic pH range, where ΔQ > 0 and the free energy increases with the pH (the binding free energy becoming less favorable). Proton uptake involving predominantly basic groups occurs in this pH range. The second region is in the intermediate pH range, where ΔQ is close to 0 and remains almost unchanged with the increase in pH. The titration of acidic or basic groups with non-standard pKa values occurs in this pH range. Since most of the proteins perform their function in this intermediate pH range, it is the most interesting pH region for the study. The optimum pH can be determined by finding the pH corresponding to the minimum free energy. This is usually located at the border of first and third pH regions. As shown in Figure 9, the ΔQ in the second region is frequently very small, practically close to zero. Thus, the results from this pH region are very sensitive to the imperfections of computational protocol and applied methodology. To reduce the error in finding the optimum pH, we introduce a threshold value Qt and assume that ΔQ = 0 if. if abs(ΔQ) < Qt We explored different values for Qt (from 0.1, 0.2, 0.3 to 0.4) and the best results (in terms of obtaining the best correlation coefficient, explained below) were obtained with the 0.1 value. In cases of very flat intermediate pH regions, the pH-optimum was taken to be the center of the intermediate pH range. In Figure 9(B) and (D), the intermediate pH regions for binding and protein stability both range from pH 4 to 9. Thus, the optimum pH for the binding and stability of the protein component is taken to be 6.5. Several other approaches were explored as outlined below.
Figure 9:
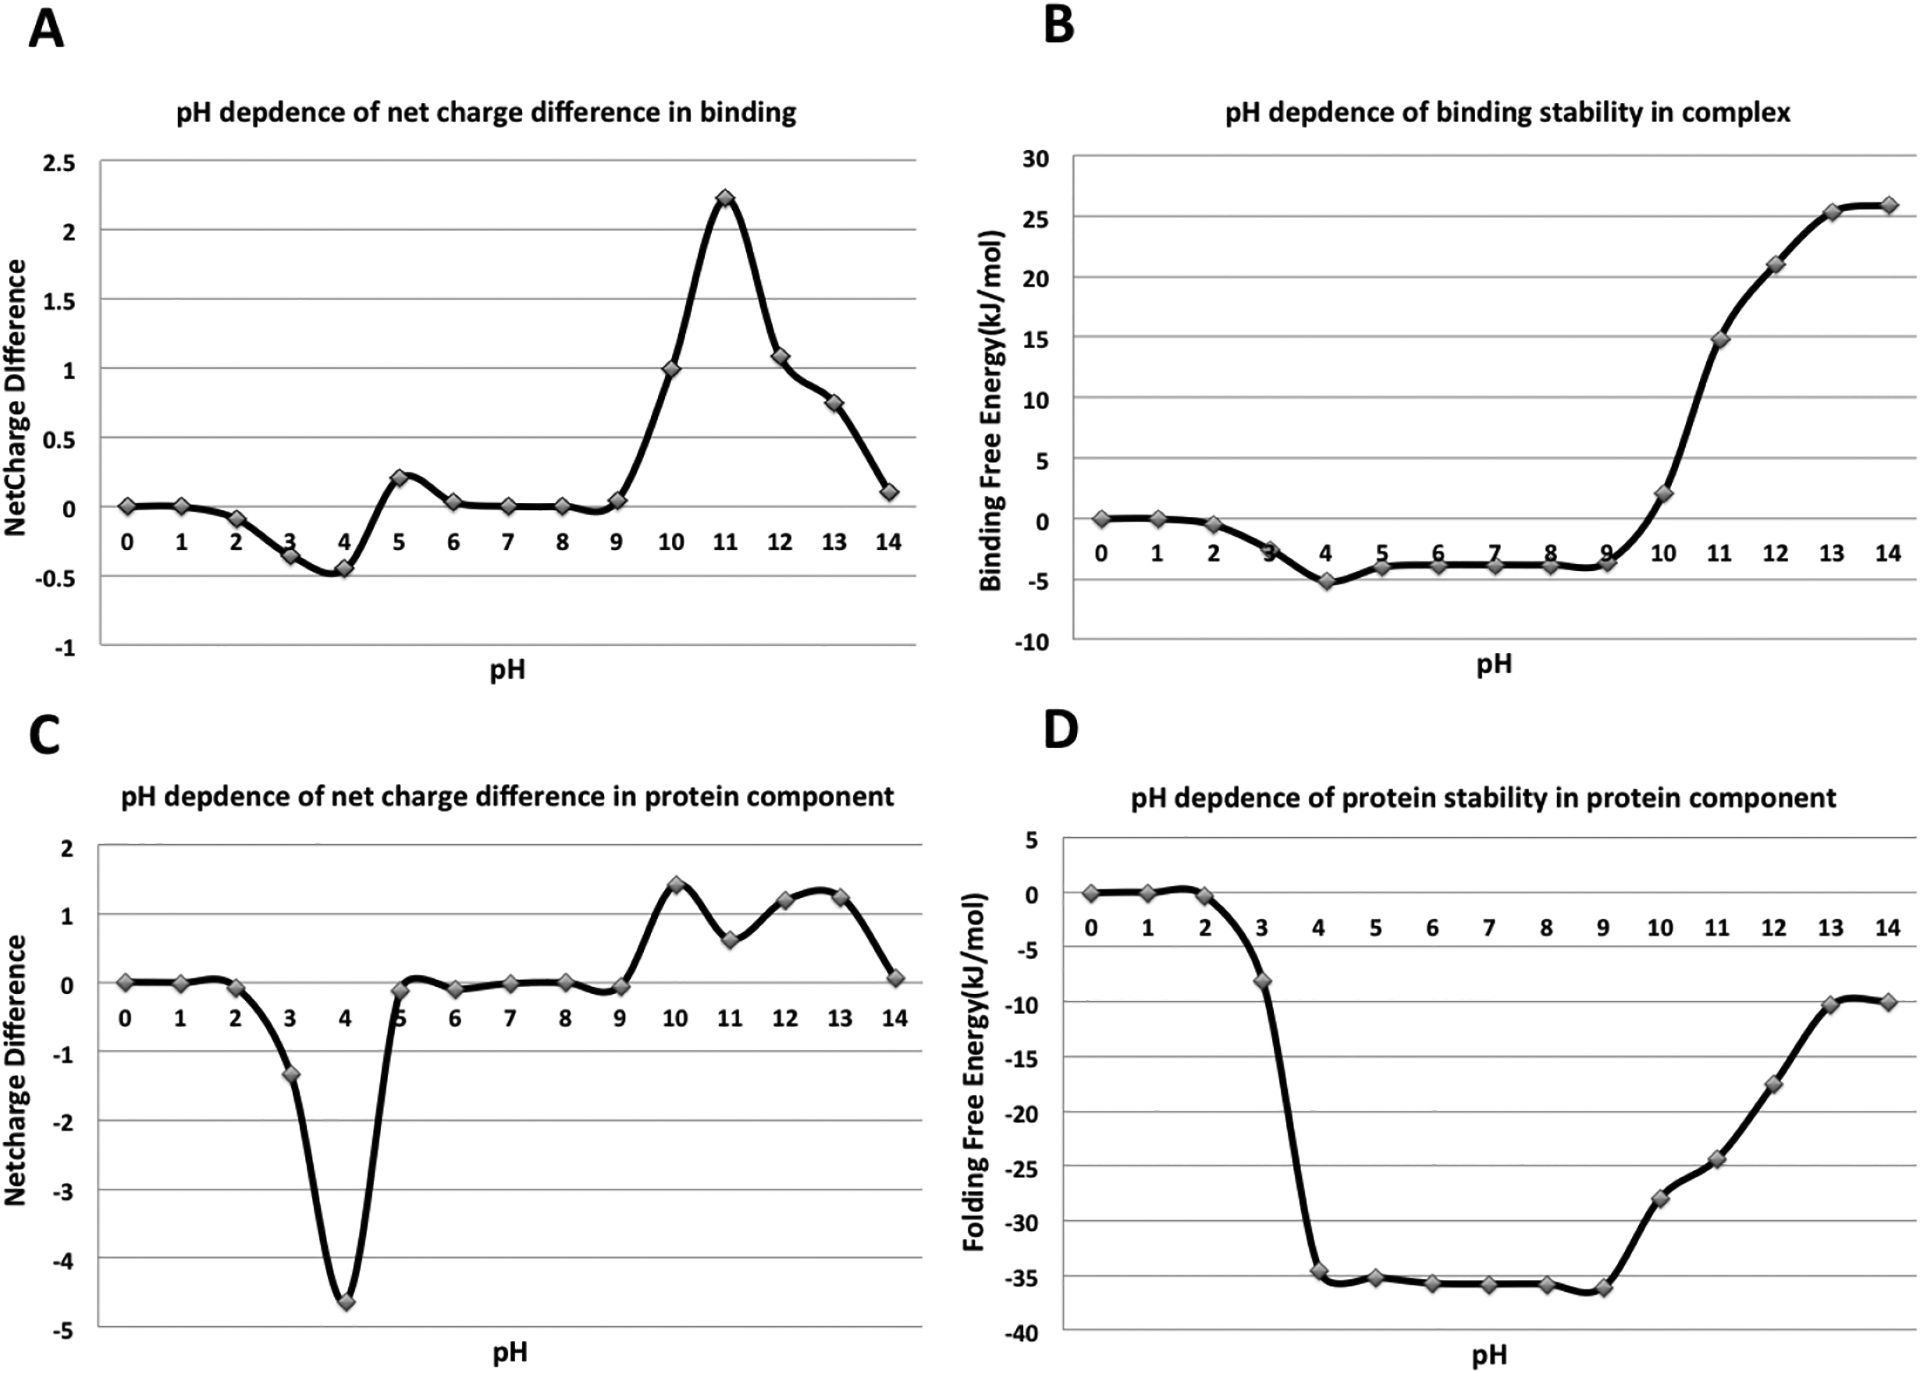
pH dependence of the net charge difference and free energy for a bacteriophage lambda cII protein in complex with dsDNA (PDB: 1zs4). (A) and (B) show pH dependence of net charge difference (proton uptake/release) and the corresponding pH dependence of the binding free energy. (C) and (D) show pH dependence of net charge difference and folding free energy of the protein component.
Correlation of pH-optimum of binding and protein stability:
Protein-DNA/RNA interaction is a pH-dependent process, with the binding affinity reaching a maximum at the pH-optimum. In vivo, the monomers and their complex coexist in the same subcellular environment and thus should be adapted to the corresponding subcellular pH (20). Indeed, it was demonstrated that the optimum pH of binding and folding are correlated (18, 23). In this work, we investigate the possibility that the pH-optimum of protein-DNA/RNA binding is correlated with the pH-optimum of the folding of the corresponding binding protein. We do not address the same question for RNA/DNA stability, since our approach considers only basic titration of RNA/DNA titratable groups and therefore the titration is monotonic with pH.
The optimum pH was determined by using the above-discussed strategy for both SCOP and Pfam datasets, and Qt was taken as 0.1 in the calculations. A fraction of cases did not show clear pH dependence and thus no optimal pH value could be determined. Thus, we excluded these cases from the correlation analysis and the rest of the cases (62 out of 105 cases and 33 out of 56 cases for protein-RNA complexes in Pfam and SCOP datasets respectively, as well as 68 out of 99 cases and 91 out of 112 cases for protein-DNA complexes in Pfam and SCOP datasets respectively) were subjected to two different protocols to assess pH-optimum: (a) pH-optimum is taken to be the middle of the “flat”, almost pH independent region and (b) the pH-optimum of binding is taken within the “flat” pH region, with selected pH being the closest to folding of the corresponding binding protein. The results are summarized in Table 1 and the corresponding plots are provided in the supplementary material. One can see a weak correlation between the pH-optimum of binding and the pH-optimum folding of the corresponding binding protein.
Table 1.
Pearson product-moment correlation coefficient between pH-optimum of binding and folding of the corresponding binding protein. Results are shown for both SCOP and Pfam classifications and the two scenarios outlined above. For each complexes type, Pearson product-moment correlation coefficient is calculated for all complexes and also for complexes in which outliers are excluded (standard deviation > 2 pH units).
| Scenario (a) | Scenario (b) | ||||
|---|---|---|---|---|---|
| Complexes Type | Correlation coefficient for all complexes | Correlation coefficient for STDEV<2 | Complexes Type | Correlation coefficient for all complexes | Correlation coefficient for STDEV<2 |
| Protein-RNA in SCOP | 0.71 | 0.66 | Protein-RNA in SCOP | 0.78 | 0.83 |
| Protein-DNA in SCOP | 0.3 | 0.58 | Protein-DNA in SCOP | 0.42 | 0.83 |
| Protein-RNA in Pfam | 0.48 | 0.56 | Protein-RNA in Pfam | 0.5 | 0.77 |
| Protein-DNA in Pfam | 0.24 | 0.27 | Protein-DNA in Pfam | 0.41 | 0.74 |
Conclusion:
In this work, we investigated the electrostatic properties, pKa shifts, proton uptake/release, and pH-optimum of a large number of protein-DNA/RNA complexes with available 3D structures. The analysis of the pKa shifts induced by the complex formations indicated a completely different trend in comparison with previous studies on protein-protein complexes (17, 18, 46). Protein titratable residues were found to undergo positive pKa shift, thus increasing the pKa values of both basic and acidic groups. Such an opposite trend (opposite to the trend observed for protein-protein complexes) is due to the difference between the electrostatic properties of the corresponding partners. In the case of protein-protein complexes, the interfaces are frequently made up of patches of opposite polarity and thus the given protein may provide a favorable electrostatic environment for both basic and acidic groups (18, 46). In contrast, most of the binding modes in our dataset consist of cases in which the protein binds to phosphate groups of DNA/RNA. Since phosphate groups are negatively charged, the electrostatic environment for protein titratable groups make the charged state of acidic groups less favorable while promoting the charged state of basic groups. This is the main reason for the observed tendency of protein-DNA/RNA binding to induce positive pKa shifts of protein titratable groups. In contrast, the binding causes pKa values of nucleic acid bases to lower. Most of this effect is due to unfavorable electrostatic interactions with the positively charged interface of the corresponding binding protein.
Very little proton uptake/release was predicted to accompany the binding. For many cases in the dataset, the proton uptake/release was almost zero for the pH range of 5 to 8. This is also quite different from observations made of protein-protein complexes (16, 17, 23). Protein-DNA/RNA binding seems to be less pH dependent than protein-protein binding. This likely reflects the fact that protein-protein interactions occur in more diverse environments than protein-DNA/RNA binding.
A weak correlation was found between the pH-optimum of binding affinity and the folding free energy of unbound protein. The correlation is not as significant as correlations found for protein-protein binding (16–18, 23). This may be due to the fact that only basic groups of DNA/RNA were treated as titratable residues in our protocol. We anticipate that the inclusion of other groups (phosphate groups, for example) could result in a more significant correlation.
Overall, our study indicates that electrostatics play a significant role in protein-DNA and protein-RNA binding and frequently this binding is accompanied by pKa shifts, resulting in little proton uptake/release and weak pH dependence.
Supplementary Material
References
- 1.Varani G, Nagai K. RNA recognition by RNP proteins during RNA processing. Annu Rev Biophys Biomol Struct. 1998;27:407–45. [DOI] [PubMed] [Google Scholar]
- 2.Lejeune D, Delsaux N, Charloteaux B, Thomas A, Brasseur R. Protein-nucleic acid recognition: statistical analysis of atomic interactions and influence of DNA structure. Proteins. 2005;61(2):258–71. [DOI] [PubMed] [Google Scholar]
- 3.B ML, G E, L DJ, C GM. Quantifying DNA-protein interactions by double-stranded DNA arrays. Nat Biotechnol. 1999;17:573–7. [DOI] [PubMed] [Google Scholar]
- 4.Luscombe NM. Amino acid-base interactions: a three-dimensional analysis of protein-DNA interactions at an atomic level. Nucleic acids research. 2001;29(13):2860–74. [DOI] [PMC free article] [PubMed] [Google Scholar]
- 5.Rumora AE, Ferris LA, Wheeler TR, Kelm RJ Jr. Electrostatic and Hydrophobic Interactions Mediate Single-Stranded DNA Recognition and Acta2 Repression by Purine-Rich Element-Binding Protein B. Biochemistry. 2016;55(19):2794–805. [DOI] [PMC free article] [PubMed] [Google Scholar]
- 6.N K, W SJ, J J. Structural Features of Protein-Nucleic Acid Recognition Sites. Biochemistry. 1999;38:1999–2017. [DOI] [PubMed] [Google Scholar]
- 7.T Y, R PD, M CP. Thermodynamics of Cro Protein-DNA Interactions. Proc Natl Acad Sci U S A. 1992;89(17):8180–4. [DOI] [PMC free article] [PubMed] [Google Scholar]
- 8.Bowater RP, Cobb AM, Pivonkova H, Havran L, Fojta M. Biophysical and electrochemical studies of protein–nucleic acid interactions. Monatshefte für Chemie - Chemical Monthly. 2015;146(5):723–39. [Google Scholar]
- 9.Iwakiri J, Tateishi H, Chakraborty A, Patil P, Kenmochi N. Dissecting the protein-RNA interface: the role of protein surface shapes and RNA secondary structures in protein-RNA recognition. Nucleic Acids Res. 2012;40(8):3299–306. [DOI] [PMC free article] [PubMed] [Google Scholar]
- 10.Jones S, van Heyningen P, Berman HM, Thornton JM. Protein-DNA interactions: A structural analysis. J Mol Biol. 1999;287(5):877–96. [DOI] [PubMed] [Google Scholar]
- 11.Rohs R, West SM, Sosinsky A, Liu P, Mann RS, Honig B. The role of DNA shape in protein-DNA recognition. Nature. 2009;461(7268):1248–53. [DOI] [PMC free article] [PubMed] [Google Scholar]
- 12.Rohs R, Jin X, West SM, Joshi R, Honig B, Mann RS. Origins of specificity in protein-DNA recognition. Annu Rev Biochem. 2010;79:233–69. [DOI] [PMC free article] [PubMed] [Google Scholar]
- 13.West SM, Rohs R, Mann RS, Honig B. Electrostatic interactions between arginines and the minor groove in the nucleosome. J Biomol Struct Dyn. 2010;27(6):861–6. [DOI] [PMC free article] [PubMed] [Google Scholar]
- 14.Auweter SD, Oberstrass FC, Allain FH. Sequence-specific binding of single-stranded RNA: is there a code for recognition? Nucleic acids research. 2006;34(17):4943–59. [DOI] [PMC free article] [PubMed] [Google Scholar]
- 15.Jones S Protein-RNA interactions: a structural analysis. Nucleic acids research. 2001;29(4):943–54. [DOI] [PMC free article] [PubMed] [Google Scholar]
- 16.Zhang Z, Witham S, Alexov E. On the role of electrostatics in protein-protein interactions. Physical biology. 2011;8(3):035001. [DOI] [PMC free article] [PubMed] [Google Scholar]
- 17.Onufriev AV, Alexov E. Protonation and pK changes in protein-ligand binding. Q Rev Biophys. 2013;46(2):181–209. [DOI] [PMC free article] [PubMed] [Google Scholar]
- 18.Kundrotas PJ, Alexov E. Electrostatic properties of protein-protein complexes. Biophys J. 2006;91(5):1724–36. [DOI] [PMC free article] [PubMed] [Google Scholar]
- 19.Petukh M, Stefl S, Alexov E. The role of protonation states in ligand-receptor recognition and binding. Current pharmaceutical design. 2013;19(23):4182–90. [DOI] [PMC free article] [PubMed] [Google Scholar]
- 20.Garcia-Moreno B Adaptations of proteins to cellular and subcellular pH. Journal of biology. 2009;8(11):98. [DOI] [PMC free article] [PubMed] [Google Scholar]
- 21.Chan P, Lovric J, Warwicker J. Subcellular pH and predicted pH-dependent features of proteins. Proteomics. 2006;6(12):3494–501. [DOI] [PubMed] [Google Scholar]
- 22.Talley K, Alexov E. On the pH-optimum of activity and stability of proteins. Proteins. 2010;78(12):2699–706. [DOI] [PMC free article] [PubMed] [Google Scholar]
- 23.Mitra RC, Zhang Z, Alexov E. In silico modeling of pH-optimum of protein-protein binding. Proteins. 2011;79(3):925–36. [DOI] [PMC free article] [PubMed] [Google Scholar]
- 24.Alexov E Numerical calculations of the pH of maximal protein stability. European Journal of Biochemistry. 2003;271(1):173–85. [DOI] [PubMed] [Google Scholar]
- 25.Wang L, Li L, Alexov E. pKa predictions for proteins, RNAs, and DNAs with the Gaussian dielectric function using DelPhi pKa. Proteins. 2015;83(12):2186–97. [DOI] [PMC free article] [PubMed] [Google Scholar]
- 26.Wang L, Zhang M, Alexov E. DelPhiPKa web server: predicting pKa of proteins, RNAs and DNAs. Bioinformatics. 2016;32(4):614–5. [DOI] [PMC free article] [PubMed] [Google Scholar]
- 27.Kirsanov DD, Zanegina ON, Aksianov EA, Spirin SA, Karyagina AS, Alexeevski AV. NPIDB: Nucleic acid-Protein Interaction DataBase. Nucleic acids research. 2013;41(Database issue):D517–23. [DOI] [PMC free article] [PubMed] [Google Scholar]
- 28.Zanegina O, Kirsanov D, Baulin E, Karyagina A, Alexeevski A, Spirin S. An updated version of NPIDB includes new classifications of DNA-protein complexes and their families. Nucleic acids research. 2016;44(D1):D144–53. [DOI] [PMC free article] [PubMed] [Google Scholar]
- 29.Finn RD, Bateman A, Clements J, Coggill P, Eberhardt RY, Eddy SR, Heger A, Hetherington K, Holm L, Mistry J, Sonnhammer EL, Tate J, Punta M. Pfam: the protein families database. Nucleic acids research. 2014;42(Database issue):D222–30. [DOI] [PMC free article] [PubMed] [Google Scholar]
- 30.Andreeva A, Howorth D, Brenner SE, Hubbard TJ, Chothia C, Murzin AG. SCOP database in 2004: refinements integrate structure and sequence family data. Nucleic acids research. 2004;32(Database issue):D226–9. [DOI] [PMC free article] [PubMed] [Google Scholar]
- 31.Alexov E Calculating proton uptake/release and binding free energy taking into account ionization and conformation changes induced by protein-inhibitor association: application to plasmepsin, cathepsin D and endothiapepsin-pepstatin complexes. Proteins. 2004;56(3):572–84. [DOI] [PubMed] [Google Scholar]
- 32.Humphrey W, Dalke A, Schulten K. VMD: Visual molecular dynamics. Journal of Molecular Graphics. 1996;14(1):33–8. [DOI] [PubMed] [Google Scholar]
- 33.Tang CL, Alexov E, Pyle AM, Honig B. Calculation of pKas in RNA: on the structural origins and functional roles of protonated nucleotides. J Mol Biol. 2007;366(5):1475–96. [DOI] [PubMed] [Google Scholar]
- 34.Nielsen JE, Gunner MR, Garcia-Moreno BE. The pKa Cooperative: a collaborative effort to advance structure-based calculations of pKa values and electrostatic effects in proteins. Proteins. 2011;79(12):3249–59. [DOI] [PMC free article] [PubMed] [Google Scholar]
- 35.Perez-Canadillas JM, Campos-Olivas R, Lacadena J, Martinez del Pozo A, Gavilanes JG, Santoro J, Rico M, Bruix M. Characterization of pKa values and titration shifts in the cytotoxic ribonuclease alpha-sarcin by NMR. Relationship between electrostatic interactions, structure, and catalytic function. Biochemistry. 1998;37(45):15865–76. [DOI] [PubMed] [Google Scholar]
- 36.Sharp KA. Electrostatic interactions in hirudin-thrombin binding. Biophysical Chemistry. 1996;61(1):37–49. [DOI] [PubMed] [Google Scholar]
- 37.Richter HT, Brown LS, Needleman R, Lanyi JK. A linkage of the pKa’s of asp-85 and glu-204 forms part of the reprotonation switch of bacteriorhodopsin. Biochemistry. 1996;35(13):4054–62. [DOI] [PubMed] [Google Scholar]
- 38.Schubert M, Poon DK, Wicki J, Tarling CA, Kwan EM, Nielsen JE, Withers SG, McIntosh LP. Probing electrostatic interactions along the reaction pathway of a glycoside hydrolase: histidine characterization by NMR spectroscopy. Biochemistry. 2007;46(25):7383–95. [DOI] [PubMed] [Google Scholar]
- 39.Grey MJ, Tang Y, Alexov E, McKnight CJ, Raleigh DP, Palmer AG 3rd. Characterizing a partially folded intermediate of the villin headpiece domain under non-denaturing conditions: contribution of His41 to the pH-dependent stability of the N-terminal subdomain. J Mol Biol. 2006;355(5):1078–94. [DOI] [PubMed] [Google Scholar]
- 40.Ishitani R, Nureki O, Nameki N, Okada N, Nishimura S, Yokoyama S. Alternative Tertiary Structure of tRNA for Recognition by a Posttranscriptional Modification Enzyme. Cell. 2003;113(3):383–94. [DOI] [PubMed] [Google Scholar]
- 41.Horton JR, Nastri HG, Riggs PD, Cheng X. Asp34 of PvuII endonuclease is directly involved in DNA minor groove recognition and indirectly involved in catalysis. J Mol Biol. 1998;284(5):1491–504. [DOI] [PubMed] [Google Scholar]
- 42.Pan B, Xiong Y, Steitz TA. How the CCA-adding enzyme selects adenine over cytosine at position 76 of tRNA. Science. 2010;330(6006):937–40. [DOI] [PMC free article] [PubMed] [Google Scholar]
- 43.Nakanishi K, Bonnefond L, Kimura S, Suzuki T, Ishitani R, Nureki O. Structural basis for translational fidelity ensured by transfer RNA lysidine synthetase. Nature. 2009;461(7267):1144–8. [DOI] [PubMed] [Google Scholar]
- 44.Xu QS, Kucera RB, Roberts RJ, Guo HC. An asymmetric complex of restriction endonuclease MspI on its palindromic DNA recognition site. Structure. 2004;12(9):1741–7. [DOI] [PubMed] [Google Scholar]
- 45.Jain D, Kim Y, Maxwell KL, Beasley S, Zhang R, Gussin GN, Edwards AM, Darst SA. Crystal structure of bacteriophage lambda cII and its DNA complex. Molecular cell. 2005;19(2):259–69. [DOI] [PubMed] [Google Scholar]
- 46.Aguilar B, Anandakrishnan R, Ruscio JZ, Onufriev AV. Statistics and physical origins of pK and ionization state changes upon protein-ligand binding. Biophys J. 2010;98(5):872–80. [DOI] [PMC free article] [PubMed] [Google Scholar]
Associated Data
This section collects any data citations, data availability statements, or supplementary materials included in this article.


