

Abstract
Following a request from the European Commission, the EFSA Panel on Nutrition, Novel Foods and Food Allergens (NDA) was asked to deliver a scientific opinion on the tolerable upper intake level (UL) for selenium. Systematic reviews of the literature were conducted to identify evidence regarding excess selenium intake and clinical effects and potential biomarkers of effect, risk of chronic diseases and impaired neuropsychological development in humans. Alopecia, as an early observable feature and a well‐established adverse effect of excess selenium exposure, is selected as the critical endpoint on which to base a UL for selenium. A lowest‐observed‐adverse‐effect‐level (LOAEL) of 330 μg/day is identified from a large randomised controlled trial in humans (the Selenium and Vitamin E Cancer Prevention Trial (SELECT)), to which an uncertainty factor of 1.3 is applied. A UL of 255 μg/day is established for adult men and women (including pregnant and lactating women). ULs for children are derived from the UL for adults using allometric scaling (body weight0.75). Based on available intake data, adult consumers are unlikely to exceed the UL, except for regular users of food supplements containing high daily doses of selenium or regular consumers of Brazil nuts. No risk has been reported with the current levels of selenium intake in European countries from food (excluding food supplements) in toddlers and children, and selenium intake arising from the natural content of foods does not raise reasons for concern. Selenium‐containing supplements in toddlers and children should be used with caution, based on individual needs.
Keywords: tolerable upper intake level, UL, selenium, dietary reference value
1. Introduction
1.1. Background as provided by the European Commission
On 19 October 2000, the Scientific Committee on Food (SCF) expressed an opinion on the Tolerable Upper Intake Level (UL) for selenium. The SCF derived a UL of 300 μg Se/day for adults that covered selenium intake from all sources of food, including supplements. The SCF extrapolated the UL from adults to children on a body weight basis as follows: 1–3 years of age – 60 μg Se/day; 4–6 years of age – 90 μg Se/day; 7–10 years of age – 130 μg Se/day; 11–14 years of age – 200 μg Se/day; 15–17 years of age – 250 μg Se/day.
On 18 December 2019, the Authority adopted an opinion on the “Safety of selenium‐enriched biomass of Yarrowia lipolytica as a novel food pursuant to Regulation (EU) 2015/2283”. In its opinion, the Authority noted that newly emerging data, including the results of large population‐based randomised controlled trials made available in recent years, warranted a reassessment of the UL for selenium as established in 2000.
Consequently, the European Commission would like to ask the Authority to re‐evaluate the safety in use of selenium, and to provide revised tolerable upper intake levels that are unlikely to pose a risk of adverse effects from intake of this nutrient, for all population groups.
1.2. Terms of Reference as provided by the European Commission
In accordance with Article 29(1)(a) of Regulation (EC) No 178/2002, the European Commission asks the European Food Safety Authority to:
-
–
re‐evaluate the safety in use of selenium;
-
–
if necessary, provide revised tolerable upper intake levels for selenium for all relevant categories of the population that are unlikely to pose a risk of adverse health effects.
1.3. Interpretation of the Terms of Reference
The UL is defined as ‘the maximum level of total chronic daily intake of a nutrient (from all sources) which is not expected to pose a risk of adverse health effects to humans’ (EFSA NDA Panel, 2022).
‘Tolerable intake’ in this context connotes what is physiologically tolerable and can be established based on an assessment of risk, i.e. the probability of an adverse effect occurring at a specified level of exposure. The UL is not a recommended level of intake. As the intake increases above the UL, the risk of adverse effects increases.
ULs should be protective for all members of the general population, including the most sensitive individuals, throughout their lifetime. The derivation of ULs accounts for the expected variability in sensitivity among individuals. In principle, individuals under medical care are not excluded from the application of the UL unless: (a) there is an expected interaction between the medical condition and the occurrence of possible adverse effects of a nutrient, or (b) they are under medical treatment with the nutrient under assessment.
On the other hand, the UL may exclude sub‐populations with extreme and distinct vulnerabilities to adverse effects of the nutrient due to specific genetic predisposition or other factors. The exclusion of such sub‐populations must be considered on a nutrient‐by‐nutrient basis and is an area of scientific and expert judgement and of risk management (EFSA NDA Panel, 2022).
1.4. Context of the assessment
The Scientific Committee on Food (SCF) in 2000 set a UL of 300 μg/day in adults, including pregnant and lactating women, based on evidence from observational studies on long term selenium exposure carried out in selenium‐rich areas in China (Yang et al., 1989a; Yang and Zhou, 1994) and in the US (Longnecker et al., 1991), where selenium poisonings are endemic due to high selenium concentrations in soil (SCF, 2000a). For children, the SCF extrapolated the UL from adults on a body weight basis, using reference weights (SCF, 1993). No UL was established for infants. ULs set by SCF (2000a) are summarised in Table 1. These values cover selenium intakes from all food sources, including food supplements.
Table 1.
Overview of existing tolerable upper intake levels (ULs) for selenium, in μg/day
| Population group | SCF (2000a) | IOM (2000) | EVM (2003) (a) | WHO/FAO (2004) | NHMRC (2006) |
|---|---|---|---|---|---|
| Infants | |||||
| 0–6 mo | nd | 45 | nd | nd | 45 |
| 7–12 mo | nd | 60 (b) | nd | nd | 60 (b) |
| Children and adolescents | |||||
| 1–3 y | 60 (c) | 90 (b) | nd | nd | 90 (b) |
| 4–6 y | 90 (c) | nd | nd | ||
| 4–8 y | 150 (b) | nd | nd | 150 (b) | |
| 7–10 y | 130 (c) | nd | nd | ||
| 9–13 y | 280 (b) | nd | nd | 280 (b) | |
| 11–14 y | 200 (c) | nd | nd | ||
| 14–18 y | 400 (b) | nd | nd | 400 (b) | |
| 15–17 y | 250 (c) | nd | nd | ||
| Adults | |||||
| ≥ 18 y | 300 (d) | 450 | 400 | ||
| ≥ 19 y | 400 (d) | 400 (d) | |||
mo: months; nd: not defined; EVM: UK Expert Group on Vitamins and Minerals (UK); IOM: Institute of Medicine (US); NHMRC: National Health and Medical Research Council of Australia and New Zealand; SCF: Scientific Committee on Food; WHO/FAO: World Health Organization/Food and Agriculture Organization of the United Nations; y: years.
Safe upper level (SUL).
Extrapolated from the UL for infants aged 0–6 months (7 μg/kg body weight/day) on a body weight basis.
Extrapolated from the UL for adults on a body weight basis.
Including pregnant and lactating women.
In 2014, the NDA Panel published an opinion on Dietary Reference Values (DRVs) for selenium (EFSA NDA Panel, 2014). As per the terms of reference for this task, a review of the UL for selenium was out of the scope of the assessment. The NDA Panel focused on providing advice on the requirement for the micronutrient. The levelling off of plasma selenoprotein P concentration with increasing selenium intakes was considered indicative of an adequate supply of selenium to all tissues and to reflect saturation of the functional selenium body pool, ensuring that selenium requirement is met. This criterion was used for establishing DRVs for selenium in adults. Evidence from human studies on the relationship between selenium intake and plasma selenoprotein P concentration was reviewed. Given the uncertainties in available data on this relationship, they were considered insufficient to derive an Average Requirement (AR). Instead, the Panel established an Adequate Intake (AI) for adults of 70 μg/day. No specific indicators of selenium requirements were available for infants, children or adolescents. For infants aged 7–11 months, an AI of 15 μg/day was derived by extrapolating upwards from the estimated selenium intake from breast milk of younger exclusively breast‐fed infants (i.e. 12 μg/day), taking into account differences in reference body weights. For children and adolescents, the AIs for selenium were extrapolated from the AI for adults by isometric scaling (i.e. proportionately to body weight) and application of a growth factor. AIs range from 15 μg/day for children aged one to 3 years to 70 μg/day for adolescents aged 15–17 years. Considering that adaptive changes in the metabolism of selenium occur during pregnancy, the AI set for adult women applies to pregnancy. For lactating women, an additional selenium intake of 15 μg/day was estimated to cover the amount of selenium secreted in breast milk, and an AI of 85 μg/day was set.
EFSA evaluated the safety and bioavailability of various forms of selenium as a source of selenium for use in food supplements or addition to foods. The safety and bioavailability of selenium‐enriched yeast (Se‐yeast) as a source of selenium were established under the proposed conditions of use, for addition to foods for particular nutritional uses and foods, including food supplements (EFSA AFC Panel, 2008). The safety and bioavailability of l‐selenomethionine (SeMet) (EFSA ANS Panel, 2009b) and selenious acid (EFSA ANS Panel, 2009d) were established for use in food supplements, under the proposed conditions of use. In contrast, data provided in the application dossiers were inadequate to establish the safety and bioavailability of selenium‐humic acid/fulvic acid chelate (EFSA ANS Panel, 2009a) and Se‐methyl‐l‐selenocysteine (EFSA ANS Panel, 2009c), under the proposed conditions of use.
EFSA's Panel on Additives and Products or Substances used in Animal Feed (FEEDAP Panel) has assessed the safety of several selenium compounds in the context of their use as additives in animal feed and have considered them to be safe for consumers provided that the total maximum authorised content of selenium in complete feed is respected (EFSA FEEDAP Panel, 2013a,b, 2015, 2016a,b,c, 2018a,b, 2019a,b, 2021).
1.5. Previous assessments by other bodies
As for the SCF assessment, clinical selenosis (see Section 3.5.2) was the critical effect used by other authoritative bodies in charge of establishing ULs for adults (IOM, 2000; EVM, 2003; WHO/FAO, 2004; NHMRC, 2006; FSCJ, 2012) considering the findings reported by Yang et al. (1989a), Yang and Zhou (1994) and Longnecker et al. (1991). Regarding lactating mothers, most risk assessments refer to the study by Brätter and Negretti de Brätter (1996). The studies by Shearer and Hadjimarkos (1975) and Brätter et al. (1991), which collected data on selenium concentration in human milk in women in the US and Canada, and in Germany respectively, were used as reference to establish the ULs for infants.
An overview of ULs for selenium established by other risk assessment bodies is provided in Table 1 below (see Appendix B of the protocol (Annex A) for further details).
2. Data and methodologies
For this scientific assessment, a protocol (Annex A) has been developed in line with EFSA's existing methodology (EFSA, 2020).
2.1. Problem formulation
In accordance with the draft NDA Panel guidance on establishing and applying ULs for vitamins and essential minerals (EFSA NDA Panel, 2022), the assessment questions underlying the UL evaluation are formulated as follows:
What is the maximum level of total chronic daily intake of selenium (from all sources) which is not expected to pose a risk of adverse health effects to humans? (Hazard identification and hazard characterisation)
What is the daily intake of selenium from all dietary sources in EU populations? (Intake assessment)
What is the risk of adverse effects related to the intake of selenium in EU populations, including attendant uncertainties? (Risk characterisation)
The hazard identification and hazard characterisation relate to the identification of adverse health effects of a given nutrient and the qualitative and quantitative evaluation of the adverse health effects associated with the nutrient, including dose–response assessment and derivation of an UL, if possible.
Adverse (health) effects are defined as ‘a change in the morphology, physiology, growth, development, reproduction or life span of an organism, system or (sub)population that results in an impairment of functional capacity to compensate for additional stress or an increase in susceptibility to other influences (FAO/WHO, 2009; EFSA Scientific Committee, 2017a). The observable effects of high nutrient intake within the causal pathway of an adverse health effect can range from biochemical changes without functional significance (e.g. certain changes in enzyme activity) to irreversible clinical outcomes. Notably, some changes that occur before clinical manifestations could be used as surrogate or predictive markers of subsequent adverse health effects, i.e. biomarkers of effect’ (EFSA NDA Panel, 2022).
Available risk assessments on dietary selenium intakes from authoritative bodies (IOM, 2000; EVM, 2003; WHO/FAO, 2004; NHMRC, 2006; FSCJ, 2012) and expert reviews (Fairweather‐Tait et al., 2011; Rayman, 2012; Vinceti et al., 2014; Jablonska and Vinceti, 2015; Vinceti et al., 2016b; Vinceti et al., 2017b; Brigelius‐Flohe and Arner, 2018; Dinh et al., 2018; Vinceti et al., 2018b; Rayman, 2020; Naderi et al., 2021) were used to identify adverse health effects that have been associated with excess selenium intakes in humans. As a result, the following effects were prioritised for the risk assessment: selenosis (including biomarkers of effect of excess selenium intake), hypertension, Alzheimer's dementia, amyotrophic lateral sclerosis (ALS), impaired neuropsychological development in children, thyroid diseases, prostate cancer, skin cancer, type 2 diabetes mellitus (T2DM) and overall mortality. The rationale for the prioritisation is detailed in the protocol (Annex A).
As a result of the problem formulation, the overarching risk assessment questions were further specified into assessment sub‐questions (sQs) and the methods to address each sQ was selected, as outlined in Table 2.
Table 2.
Assessment sub‐questions
| Sub‐question | Method | |
|---|---|---|
| sQ1 |
a. What are the clinical effects associated with selenosis (a) in humans? b. What are biomarkers of effect (b) of excess selenium intake in humans? What is their biological relevance? |
Systematic review |
| sQ2 |
a. Is there a causal positive relationship between selenium intake and risk of diseases in humans, with a focus on hypertension, Alzheimer's dementia, amyotrophic lateral sclerosis (ALS), thyroid diseases, prostate cancer, skin cancer, type 2 diabetes mellitus, and overall mortality? b. Is there a causal positive relationship between selenium intake and risk of impaired neuropsychological development in children? c. Is there a positive relationship between selenium intake and excess overall mortality risk in humans? |
Systematic review |
| sQ3 | What is the quantitative relationship between selenium intake and plasma selenium concentrations in humans? | Narrative review and dose–response modelling (if applicable) |
| sQ4 | What is the dose–response relationship between selenium intake and clinical effects of selenosis (a) and/or biomarkers of effect of excess selenium intake in humans? | Systematic review and dose–response modelling (if applicable) |
| sQ5 | What is the dose–response relationship between selenium intake and risk of disease in humans? | Systematic review and dose–response modelling (if applicable) |
| sQ6 | What is the absorption, distribution, metabolism and excretion (ADME) of selenium and specific selenium species from different sources in humans? | Narrative review |
| sQ7 | What are the potential mode(s) of action for the relationships found between selenium intake and adverse health effects? | Narrative review |
| sQ8 |
a. What are the levels of selenium in foods, beverages and food supplements in the EU? b. What is the distribution of daily selenium intake from all dietary sources in EU populations and subgroups thereof? |
Collection of data based on existing EFSA intake estimates and complementary searches in relevant databases and inquiries to competent Authorities of European Countries |
sQ: subquestion.
In the clinical setting, the term selenosis refers to a specific clinical condition resulting from excess selenium exposure, as diagnosed based on accepted signs and symptoms (integumental features in particular). This condition is observed especially in populations living in seleniferous areas. This term can also be more generally used to refer to selenium toxicity and associated features. In the context of the formulation of sQ1 and sQ4, the term selenosis is to be understood in a wide sense.
Biomarker of effect: ‘a measurable biochemical, physiological, behavioural or other alteration within an organism that, depending upon the magnitude, can be recognised as associated with an established or possible health impairment or disease’ (WHO/IPCS, 1993; EFSA Scientific Committee, 2017a). Its biological relevance depends on its relation to the mode of action and the linkage with the adverse effect or the relevant adverse outcome pathway (EFSA Scientific Committee, 2017a).
2.2. Hazard identification and characterisation (sQ1 to sQ7)
2.2.1. Data
A brief description of the processes applied for evidence retrieval, study selection and data extraction is provided below (see the protocol (Annex A) for further details).
2.2.1.1. Priority adverse health effects (sQ1 and sQ2)
To address sQ1 and sQ2, relevant human studies on the selected adverse health effects were identified through systematic searches of the literature in PubMed, Embase and the Cochrane library for articles published in English. The search strategy was created by EFSA's information specialist and is further detailed in the protocol (Annex A). Grey literature was not searched. No limit was applied regarding the inception date. The searches were performed on the 7 May 2021 regarding sQ1 and 3 May 2021 regarding sQ2. An update of the literature search focusing on T2DM was performed on the 7 February 2022.
Retrieved articles were screened in duplicate in Distiller SR® at title and abstract and full‐text levels for inclusion/exclusion according to the criteria defined in the protocol. Conflicts were solved by a third reviewer, if necessary. Relevant systematic reviews were hand‐searched for additional pertinent studies. Reviews, expert opinions, editorials, letters to the editors, abstracts, posters and theses were excluded.
Eligible designs: For selenosis and related potential biomarkers of effects (sQ1), all experimental and observational study designs in humans (including case reports) were considered relevant. For other health effects (sQ2), eligible study designs were limited to prospective designs, i.e. human controlled trials (HCTs; randomised or non‐randomised), prospective cohort studies (PCs) and nested case–control studies (NCCs).
Eligible study populations: Studies were eligible if they involved individuals of any age, either healthy individuals or diseased individuals if the disease was considered not to be related to the exposure–outcome relationship. Decision on the inclusion/exclusion of studies conducted in diseased individuals were taken by the experts of the EFSA working group on ULs and the rationale for the decisions is available in Annex E.
Eligible exposure measurements: studies were eligible if they measured selenium intake by dietary assessment methods or used accepted biomarkers of selenium intake, i.e. whole blood/plasma/serum/red blood cell (RBC) selenium, urinary selenium, toenail/hair selenium, whole blood/plasma/serum selenoprotein P concentrations and whole blood/plasma/serum/RBC glutathione peroxidase activity (see Section 3.3).
In relation to sQ1, 6,004 unique references were identified after removing duplicates (flow chart in Appendix B). The title and abstract screening left 207 relevant articles that underwent a full‐text review. Of those, 130 were excluded. A total of 77 publications reporting on 45 HCTs and 32 observational studies were included.
In relation to sQ2, 7,873 unique references were identified after removing duplicates (flow chart in Appendix B). The title and abstract screening left 363 relevant articles that underwent a full‐text review. Of those, 224 were excluded and additional 31 were excluded during the data extraction step (see below). A total of 108 publications reporting on 33 HCTs and 75 observational studies were included.
For the purpose of data plotting and analysis, data were extracted into Microsoft Excel® by one EFSA staff member and double checked by another. Evidence tables were prepared in Microsoft Word® and are provided in Appendix D.
2.2.1.2. Dose–response between selenium intake and plasma/serum concentration (sQ3)
Many studies investigating the relationship between selenium exposure and health effects use serum/plasma selenium as a biomarker of dietary selenium intake. A predictive equation for estimating selenium intake from serum/plasma selenium concentrations was needed to integrate these data in the risk assessment. In particular, the equation was instrumental for performing the dose–response meta‐analysis on selenium exposure and incidence of T2DM (see Section 2.2.2.2).
Studies used to characterise the quantitative relationship between selenium intake and plasma or serum selenium concentrations were identified through the searches described in Section 2.2.2.1 (sQ1 and sQ2) (see Annex A). The reviews by Haldimann et al. (1996), Jenny‐Burri et al. (2010) and Noisel et al. (2014) were used to retrieve additional relevant studies. Additionally, a separate search in PubMed was tailored for similar reviews published after 2011, the date up to when the literature had been searched by Noisel et al. (2014). No additional reviews were retrieved. However, the Panel notes that publications reviewing equations by which selenium intake can be assessed from plasma or serum concentrations may not be classified consistently as reviews in literature databases. In total, 43 studies were identified through the searches performed to address sQ1 and sQ2 and an additional 11 were found by searching the reference list of the reviews mentioned above, yielding a total of 54 studies.
HCTs, PCs, NCCs, case–control studies (CCs) and cross‐sectional studies (CSs) were included when they reported cross‐sectionally on the dietary selenium intake from all sources (i.e. food plus food supplements), using 24‐h recalls and dietary records, and on plasma or serum selenium concentrations. There was no restriction regarding study location (to explore ethnicity as an influencing factor for plasma selenium as a biomarker of selenium intake). Owing to the fact that inorganic selenium forms have a different effect on plasma selenium concentrations than organic forms of selenium (see also Section 3.2), inorganic forms are to be considered separately from organic forms. As, however, only two studies reported on inorganic forms (i.e. selenate Levander et al., 1983; selenite Martin et al., 1989), the study arms in which inorganic selenium was consumed in these studies were excluded from further analyses and only studies that administered organic selenium or in which selenium originated from mixed diets were included (Annex B).
2.2.1.3. Other background information (sQ6 and SQ7)
For questions addressed through narrative reviews (sQ6 and sQ7), searches were conducted in PubMed to retrieve articles reporting on the absorption, distribution, metabolism and excretion (ADME) of selenium, on the potential mechanisms by which selenium may exert an adverse health effect, and on the potential confounders or effect modifiers to be considered in the risk of bias (RoB) assessment of individual studies.
In addition, an expert review was contracted out through a procurement procedure with the aim to identify the most recent evidence on ADME, potential pathways to adverse health effects and potential biomarkers of effect. 1
2.2.2. Methodologies
The methodology for this assessment follows the approach for deriving ULs for nutrients laid down by the SCF (2000b), the principles established by the EFSA NDA Panel (2022), EFSA's guidance on the application of the systematic review methodology in food and feed safety assessments (EFSA, 2010), its principles and processes for dealing with data and evidence in scientific assessments (EFSA, 2015), the guidance on statistical significance and biological relevance (EFSA Scientific Committee, 2011), the guidance on the assessment of the biological relevance of data in scientific assessments (EFSA Scientific Committee, 2017a), the guidance on the use of the weight of evidence approach in scientific assessments (EFSA Scientific Committee, 2017c) and the draft guidance on appraising and integrating evidence from epidemiological studies for use in EFSA's scientific assessments (EFSA Scientific Committee, 2020).
2.2.2.1. Evidence appraisal (sQ2)
A RoB appraisal, i.e. evaluation of the internal validity of studies, was applied to eligible studies which addressed sQ2.
The appraisal was performed using the Office of Health Assessment and Translation (OHAT) RoB tool developed by the US National Toxicology Program (NTP) (OHAT‐NTP, 2015). The RoB criteria and rating instructions provided therein were tailored to the specific research questions, for the questions addressing: (1) consideration of potential confounders, (2) confidence in the exposure characterisation, and (3) confidence in the outcome assessment (Appendix C).
The appraisal was performed in duplicate by the experts of the EFSA Working Group (WG) on ULs and EFSA staff in Distiller SR®. Discrepancies in the assessment in relation to the RoB judgement of each domain were discussed among the assessors. In case of disagreement, the WG was consulted.
The OHAT RoB tool proposes five response options for each RoB question: definitely low RoB (++), probably low RoB (+), not reported (NR), probably high RoB (−), definitely high RoB (−−). For the appraisal of intervention studies, the scale was aggregated to three options (high RoB, NR, low RoB) as it was considered sufficiently discriminatory for this design in the context of the present assessment.
Studies were categorised according to their overall RoB based on a three‐tier system (i.e. at low (tier 1), moderate (tier 2) or high (tier 3) RoB), according to the strategy proposed by OHAT (OHAT‐NTP, 2019) (Appendix C).
2.2.2.2. Evidence synthesis (sQ2, sQ3 and sQ5)
The methods applied for the evidence synthesis to address sQ2, sQ3 and sQ5 are outlined below. Detailed information is provided in Annex B.
Descriptive forest plots of studies investigating selenium exposure and health effects.
Results from eligible studies were plotted using descriptive forest plots, when three or more studies reported on the same outcome. For intervention studies with several selenium doses, the mean difference between the highest dose group and control group was selected for the plot, unless specified otherwise. For observational studies reporting both continuous and categorical analyses, the latter was selected for the plot.
Dose–response relationship between selenium intake and plasma/serum concentration
A dose–response meta‐analysis was conducted by EFSA to characterise the relationship between mean selenium intake and mean plasma/serum selenium concentration. Parametric dose–response models were estimated based on summarised data. Both linear and non‐linear (piecewise linear splines) dose–response relationships were investigated. Random‐effects models were fitted on mean values from both observational and experimental designs via restricted maximum likelihood. The between‐study heterogeneity was investigated with Cochran's Q test and the I2 statistic. Different knots for the piecewise linear function were explored and potential modifying factors were characterised; sensitivity analyses were run to address the uncertainty in the choice of spline knots, the influence of individual studies, aspects of study design and the reliability of studies' features.
Dose–response relationship between selenium exposure and incidence of T2DM
A dose–response meta‐analysis was conducted by EFSA to characterise the relationship between plasma/serum selenium concentrations and incidence of T2DM based on observational studies. The analysis included studies using plasma/serum selenium concentrations as exposure variable as well as studies which estimated selenium intake based on dietary assessment methods. In the latter case, the piecewise regression equation described above was used to convert mean selenium intakes into estimates of plasma/serum selenium concentrations for inclusion in the dose–response analysis.
Parametric dose–response models were estimated based on summarised data. Both linear and non‐linear (restricted cubic splines) dose–response relationships were investigated. Random‐effects models were fitted on risk ratios (RR) from most adjusted multivariable models via restricted maximum likelihood using a one‐stage approach (Crippa et al., 2019) and a two‐stage approach (Orsini et al., 2012) to estimate pooled effects of individual studies across exposure categories. The reference dose chosen corresponded to the lowest mean plasma concentration observed or estimated in the sample. The between‐study heterogeneity was investigated with Cochran's Q test and the I2 statistic; sensitivity analyses were run to address the uncertainty in the choice of spline knots, in the type of exposure assessment and in the influence of individual studies. Publication bias was assessed using Egger's test and funnel plot on study‐specific RRs.
2.2.2.3. Evidence integration (sQ1 and sQ2)
Hazard identification
Regarding sQ1, a causal relationship between ‘high’ selenium intake and clinical selenosis is well‐established and the assessment focussed on the characterisation of the dose–response. As proposed in the guidance for establishing and applying ULs for vitamins and essential minerals (EFSA NDA Panel, 2022), some changes that occur before clinical manifestations of excess selenium intake could be used as surrogate or predictive markers of subsequent adverse health effects, i.e. biomarkers of effect. Thus, data that could inform the identification of potential biomarkers of effect were also gathered and explored.
Regarding sQ2, the hazard identification step consisted of assessing the evidence for a causal positive relationship between selenium intake and the health effects identified. For each health effect, HCTs and prospective observational studies (PCs/NCCs) are organised in separate lines of evidence (LoE), which are classified in hierarchical order:
Standalone main LoE: Studies on disease endpoints (e.g. incidence of hypertension, incidence of T2DM). These studies could, on their own, answer the sQ directly.
Standalone surrogate LoE: Studies on endpoints which are surrogate measures of the disease risk (e.g. blood pressure for hypertension, fasting blood glucose for T2DM). These studies also could, on their own, answer the sQ, on the assumption that a sustained increase in the surrogate measure over time (e.g. blood pressure) would eventually lead to an increased risk of disease (e.g. hypertension). However, the Panel is aware of the uncertainty inherent in this assumption, and this was considered in the uncertainty analysis (UA) for each sQ (see for example Section 3.5.10).
Complementary LoE: Studies on endpoints which are relevant to the disease but less directly than those included in standalone LoE (e.g. risk factors, upstream indicators, other biologically related endpoints). These studies, on their own, cannot answer the sQ but can be used as supporting evidence to the standalone LoEs.
Conclusions on each health effect are reached by study design (HCTs separately from PCs/NCCs), through considering the uncertainties in the body of evidence (BoE) and in the methods.
A stepwise approach is applied as illustrated in Figure 1 and described below:
Figure 1.
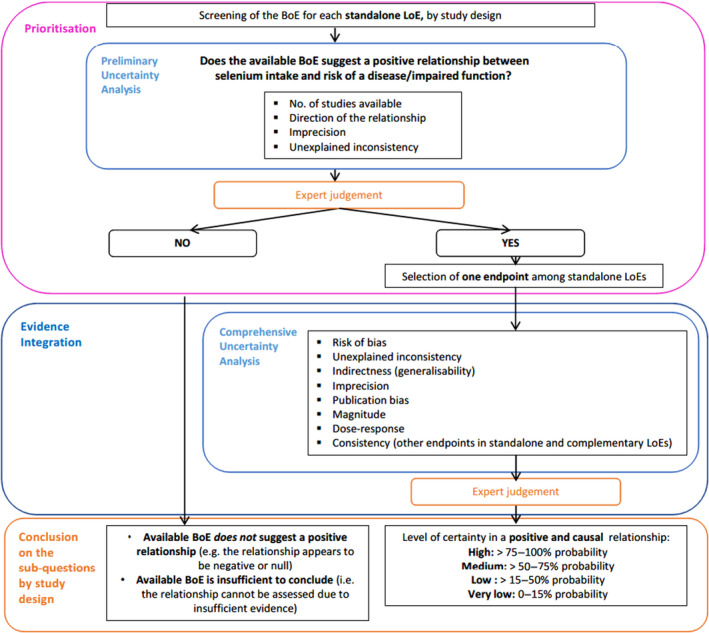
Stepwise approach for evidence integration and uncertainty analysis applied to sQ2, by study design
- BoE: body of evidence; LoE: line of evidence.
Prioritisation
A prioritisation step is applied to identify health effects for which the available BoE suggests a positive relationship between dietary intake of selenium and risk of disease/impaired function based on a preliminary UA and expert judgement. The Panel considers that health effects for which the available BoE (i) does not suggest a positive relationship (i.e. the relationship appears to be negative or null) or (ii) is insufficient to conclude on a relationship, cannot be used to inform the setting of a UL for selenium. Data gaps and research needs are identified, where appropriate.
When the available BoE indicates a positive association between selenium intake and the risk of a disease/impaired function, a comprehensive UA is performed to inform the formulation of the hazard identification conclusions, i.e. judgement on the level of certainty for a causal relationship. For health effects with more than one standalone LoE, the comprehensive uncertainty analysis is undertaken for the endpoint with the highest level of evidence for a positive relationship with the exposure.
Evidence integration and conclusions on the prioritised SQs, by study design
The OHAT‐NTP framework for the formulation of hazard identification conclusions is used and adapted (OHAT‐NTP, 2019). According to the OHAT‐NTP approach, available studies on a particular outcome are initially grouped by study design (i.e. trials vs prospective cohort studies) and the BoE on a particular sQ is given an initial level of certainty based on study design. In the OHAT's framework, the ‘initial confidence rating’ is expressed through four qualitative descriptors, i.e. ‘high’, ‘moderate’, ‘low’, ‘very low’. It is assigned by considering four features of the design i.e. exposure is experimentally controlled, exposure occurs prior to the endpoint, endpoint is assessed at individual level and an appropriate comparison group is included in the study. As a result, OHAT assigns a ‘high’ confidence rating (likely to comply with all four the above‐mentioned criteria) to HCTs, while PC studies (where the exposure is unlikely to be controlled) start with a ‘low’ to ‘moderate’ confidence rating, 2 depending on whether the exposure precedes the outcome or not (OHAT‐NTP, 2019). The Panel agrees with the rationale behind this initial rating but notes that qualitative descriptors bear some ambiguity. The EFSA Scientific Committee recommends the use of probability as the preferred measure for expressing uncertainty (EFSA Scientific Committee, 2018). Therefore, OHAT's ‘initial confidence ratings’ have been translated into ‘initial levels of certainty’ expressed as approximate probabilities. Similarly, the final level of certainty for a positive and causal relationship between the exposure and risk of disease is expressed in terms of probabilities, rather than using qualitative descriptors (Figure 2).
Figure 2.
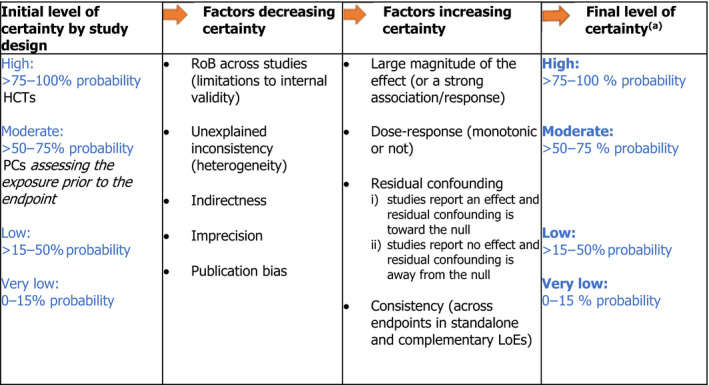
Approach applied to assign the final level of certainty in a causal relationship
-
Adapted from OHAT‐NTP (2019).LoE: line of evidence; PC: prospective cohort study; HCT: human controlled trial; RoB: risk of bias.(a): As an example, a ‘high level of certainty’ means that, based on the available evidence, experts are 75%–100% certain that selenium is positively and causally associated with the disease of interest.
A schematic representation of the approach for assessing the final level of certainty in the hazard identification conclusions by study design is provided in Figure 2. This initial rating is downgraded on the basis of factors that decrease certainty in the results (RoB, unexplained inconsistency, indirectness or lack of applicability, imprecision, and publication bias) and upgraded for factors that increase certainty in the results (large magnitude of effect, dose–response, consistency across study designs/populations/animal models or species, and consideration of residual confounding or other factors that increase the certainty in the causal nature of the relationship).
Reaching overall conclusions on the prioritised SQs
Adapted from the OHAT‐NTP approach, the overall conclusion regarding the relationship is formulated as follows:
hazard identification conclusions are primarily based on the BoE providing the highest level of certainty on the relationship;
consistent results across study designs could result in higher level of certainty on the causality of a positive relationship;
mechanistic or mode‐of‐action data are considered as other relevant supporting types of evidence; they could provide strong support or opposition for biological plausibility and could thus result in higher or lower certainty on the causality of the positive relationship.
It is noted that the formulation of hazard identification conclusions necessarily requires expert judgement. The value of this type of approach is that it involves using a reproducible and transparent framework for expressing uncertainty in the evidence and in the methods.
Hazard characterisation
At this step, evidence is integrated to select the critical effect(s) and identify a reference point (RP) for establishing the UL. As proposed in the guidance for establishing and applying ULs for vitamins and essential minerals (EFSA NDA Panel, 2022), when available data are not suitable for dose–response modelling, a no‐observed‐adverse‐effect level (NOAEL) or a lowest‐observed‐adverse‐effect level (LOAEL) can be identified and used as the RP. In view of the available BoE, this approach is applied. To derive the UL, an uncertainty factor (UF) is applied to the RP to account for the uncertainties associated with extrapolating from the observed data to the general population. ULs should be protective for all members of the general population, including sensitive individuals, throughout their lifetime. The rationale for the selection of the RP and UF are documented in Section 3.6 of the Opinion.
2.3. Dietary intake assessment (sQ8)
The assessment follows the approach outlined in the protocol for the intake assessments performed in the context of the revision of Tolerable Upper Intake Levels for selected nutrients (EFSA, 2022). It is briefly summarised below.
2.3.1. Data
Selenium intakes from foods, excluding food supplements, have previously been estimated for all population groups in the context of the Scientific Opinion on DRVs (EFSA NDA Panel, 2014). Food intake data from the EFSA Comprehensive European Food Consumption Database (hereinafter referred as Comprehensive Database) 2 and data on selenium content in foods from the EFSA food composition database (FCDB) 3 (Roe et al., 2013) were used. Given that the EFSA FCDB has not been updated since then and the number of national surveys that were newly integrated in the Comprehensive Database is limited, the intake estimates published in 2014 are still considered adequate for the purpose of the present assessment and were not updated, except for the addition of data for infants aged < 1 year (Section 2.3.2).
Regarding the use of selenium food supplements, data in the Comprehensive Database suffer from important limitations, in particular due to partial reporting in the database of the nutrient(s) contained in food supplements. In view of the uncertainties associated with these data, the Panel relied on information available at national level (see below).
To complement EFSA intake assessment from 2014, selenium intake estimates from natural sources, from addition to foods and from food supplements based on nationally‐representative food consumption surveys and Total Diet Studies (TDS) published after 2014 were collected. Data on selenium intakes from fortified foods and/or food supplements published before 2014 were also considered as the contribution of those sources was not addressed in EFSA's previous assessment. Data were collected between September and November 2021 by contacting 64 competent authorities in 37 European countries through EFSA Focal Points 3 An additional search in sources of bibliographic information (Google Scholar, PubMed) was performed to collect reports of national surveys included in the Comprehensive database which had not been obtained through the competent authorities.
The Mintel Global New Products Database (GNPD) 5 was used as a data source to identify the type of selenium containing food supplements and fortified foods available on the EU market. The search was limited to the past 5 years, from January 2016 to December 2021.
2.3.2. Methodology
EFSA intake estimates were calculated by matching the food intake data from the Comprehensive Database and the data on selenium content in foods from the EFSA FCDB as available in 2014 (EFSA NDA Panel, 2014) (Section 3.4.2). Data on intake estimates for infants (≥ 4 to < 12 months), which were not in the remit of the DRV Opinion from 2014, have been added to the present assessment. The methodology applied to estimate intakes in this population group is the same as for the other age groups.
Selenium intake data from recent national food consumption surveys and TDSs, including specific estimates of selenium intake from food supplements and/or fortified foods, were extracted.
Information on food products fortified with selenium and selenium‐containing supplements available on the EU market, and their selenium content as reported on the label, were extracted from the GNPD database. These data were used qualitatively to describe the types of fortified foods and food supplements available and to gain insight into their potential contribution to total selenium intake.
2.4. Public consultation
In line with EFSA's policy on openness and transparency, and for EFSA to receive comments from the scientific community and stakeholders, the draft Scientific Opinion was released for public consultation from 14 September 2022 to 19 October 2022. 6 The outcome of the public consultation is described in a technical report published as Annex F to this Scientific Opinion.
3. Assessment
3.1. Chemistry of selenium
Selenium (CAS number 7782‐49‐2) resembles sulfur in its organic and inorganic forms (EFSA NDA Panel, 2014). Selenium is found in organic compounds, such as SeMet, selenocysteine (SeCys), dimethlyselenide (DMSe), dimethyldiselenide and Se‐methyl‐selenocysteine (MeSeCys), and inorganic forms, such as selenite (), selenide (Se2−), selenate () and elemental selenium (Mehdi et al., 2013; Naderi et al., 2021). The main inorganic selenium compounds, selenite and selenate, are water soluble, while elemental selenium is not (ATSDR, 2013). Selenium in a component of a number of selenoproteins which are mediating the biological effects of selenium and include glutathione peroxidases, thioredoxin reductases, iodothyronine deiodinases and selenoprotein P (EFSA NDA Panel, 2014).
3.2. Absorption, distribution, metabolism and excretion
The most abundant forms of selenium in the diet are organic, SeMet and SeCys in particular. Selenite and selenate (inorganic selenium compounds) normally represent a minor proportion of the overall dietary intake (EFSA NDA Panel, 2014; see Section 3.4.1). Brassica and Allium species are sources of the non‐proteinogenic selenium‐containing amino acids Se‐methyl‐selenocysteine (MeSeCys) and γ‐glutamyl‐Se‐methyl‐selenocysteine (γ‐Glu‐MeSeCys) (see also Section 3.4.1).
SeMet is a methionine analogue that may non‐specifically replace methionine in proteins. It can only be synthesised by plants but can be incorporated into proteins by plants and animals into the non‐specific protein pool. They are often referred to as selenium‐containing proteins, in contrast to selenoproteins (Combs, 2015).
SeCys, which is the only form of selenium used for selenoprotein synthesis (see Section 3.1), is co‐translationally synthesised from selenide and serine and can be integrated into peptides through in‐frame UGA codons in selenoprotein mRNA (Labunskyy et al., 2014). Plants generally do not have UGA‐encoded selenoproteins (White, 2018). With exception of some algae (Jiang et al., 2020), selenoproteins can only be synthesised in animals and some microorganisms (Beilstein and Whanger, 1986; Combs, 2015).
Human studies confirm that all forms of selenium are readily absorbed (Jäger et al., 2016a,b).
As evidenced by animal studies, selenium‐containing amino acids require the digestion of the respective proteins and are then absorbed through active transport (Combs, 2015). SeMet is absorbed with the involvement of intestinal methionine transporters, while the absorption of SeCys is less well studied (Burk and Hill, 2015), but might be absorbed in a similar way as cysteine (Ha et al., 2019). Selenite is absorbed via passive diffusion (Burk and Hill, 2015) and, when ingested in physiological amounts, is reduced in the intestinal mucosa cells to selenide. It is, therefore, not expected to occur as such in circulation (Burk and Hill, 2015). Selenate, on the contrary, is absorbed via a carrier‐mediated mechanism and can appear unchanged in blood (Combs, 2015; Ha et al., 2019) (Figure 3). The absorption of selenium can be influenced by other dietary components and is in the range of 50%–90% in humans (Burk and Hill, 2015).
Figure 3.
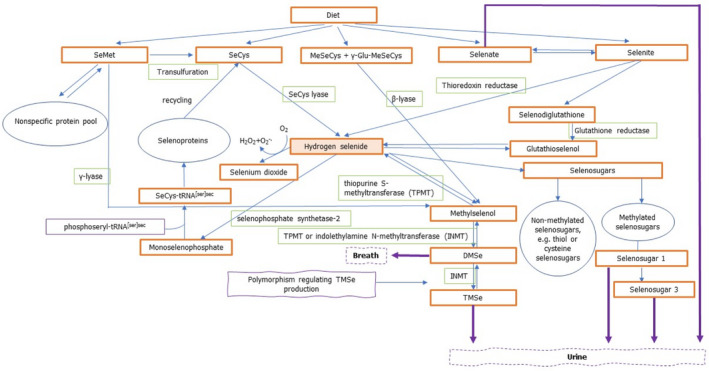
Schematic representation of selenium metabolism
-
Based on Burk and Hill (2015), Combs (2015), Saito (2021), Jäger et al. (2016a,b), Thiry et al. (2012), and Rayman et al. (2008a).DMSe: dimethylselenide; γ‐Glu‐MeSeCys: γ‐glutamyl‐Se‐methyl‐selenocysteine; INMT: indolethylamine N‐methyltransferase; MeSeCys: Se‐methyl‐selenocysteine; SeMet: selenomethionine; SeCys: selenocysteine; TMSe: trimethylselenonium ion; tRNA: transfer ribonucleic acid; TPMT: thiopurine S‐methlytransferase.
Following absorption, the different selenium compounds are mostly transported to the liver (Ha et al., 2019). The liver is the principal site of selenium metabolism. The metabolites are then widely distributed to other organs and tissues such as pancreas, nervous system, skin and hair, bone, both skeletal and cardiac muscle, lungs and kidneys (ATSDR, 2013). These organs are variably affected by deficient and excessive intakes of selenium giving rise to site‐specific pathological and biochemical features (Alexander, 2022).
Evidence on the fate of selenium in the liver and subsequent transport to cells stems mainly from animal and in vitro studies. In the liver, all selenium compounds, except SeMet, MeSeCys and γ‐Glu‐MeSeCys, are metabolised to the common intermediate, hydrogen selenide (Figure 3).
SeMet can be metabolised via the transsulfuration pathway to SeCys or be randomly incorporated into the non‐specific protein pool (Burk and Hill, 2015). SeMet can also be metabolised to methylselenol by γ‐lyase in mouse liver (Suzuki et al., 2007; Thiry et al., 2012). However, it is uncertain if this conversion occurs in humans. Selenium deposited in the non‐specific protein pool can be released by the degradation of proteins and be used in the formation of selenoproteins as SeCys (Waschulewski and Sunde, 1988a,b).
MeSeCys and γ‐Glu‐MeSeCys are converted to methylselenol by β‐lyase which can be either metabolised to hydrogen selenide or further methylated for excretion (Suzuki et al., 2007; Thiry et al., 2012).
SeCys, either consumed as such or produced from SeMet, is transformed to hydrogen selenide and alanine by SeCys lyase (Burk and Hill, 2015). It is subsequently phosphorylated by selenophosphate synthase 2 to monoselenophosphate (H2SePO3) (Saito, 2021), which is used for conversion of phosphoseryl tRNA[ser]sec to SeCys tRNA[ser]sec that provides SeCys for insertion into selenoproteins during translation (Burk and Hill, 2015). SeCys is highly reactive and has not been found in free form in tissues, as SeCys lyase which catalyses the reaction from SeCys to hydrogen selenide keeps its level low (Burk and Hill, 2015; Plateau et al., 2017; Hoffman et al., 2019). In humans, there is no physiological pathway that allows SeMet to be synthesised from SeCys (Katarzyna et al., 2020).
Selenate is reduced first to selenite and then to hydrogen selenide through a series of redox reactions coupled to reduced glutathione or with the involvement of thioredoxin reductases (Burk and Hill, 2015).
Hydrogen selenide can be incorporated into selenoproteins, used in the formation of selenosugars or methylated for excretion as shown in a study on the human metabolic profile of urinary selenium (Lajin et al., 2016a).
From the liver, selenium is transported to tissues as SeCys mainly in selenoprotein P, the major selenium transport protein, but also in other selenoproteins (Burk and Hill, 2015). The distribution is differential, as some tissues, such as the brain and the testes, require more selenium than others for their function, as shown in animal studies (Ha et al., 2019). In in vitro studies it has been observed that in order to use selenium that had been transported by selenoprotein P, selenoprotein P is incorporated into cells where it is degraded in the lysosome and the liberated SeCys can be used in selenoprotein synthesis (Saito, 2021).
In plasma, selenium is also present as SeMet, which non‐specifically substitutes for methionine in plasma proteins, and as small molecules such as selenosugars (Burk and Hill, 2015).
Under physiological intakes, the assumption is that selenoproteins make up the majority of tissue selenium, but recent data in turkey liver suggest that the selenosugar 1 (β‐methylseleno‐N‐acetyl‐galactosamine; SeGalNac) comprises more selenium than all the selenoproteins combined (Katarzyna et al., 2020).
It has been shown that in turkey liver selenosugars can react with low‐molecular weight thiols and with cysteine‐containing peptides and proteins. Analysis of high‐molecular weight selenium species found that selenium was present as SeGalNac (selenosugar 1) linked to thiols on general body proteins. With high selenium supplementation, increased selenosugar formation occurred, further increasing these ‘selenosugar‐decorated proteins’, but also increasing selenosugar linked to low‐molecular weight thiols and the excretion of SeGalNac (selenosugar 1) in urine (Katarzyna et al., 2020).
Selenium elimination primarily occurs by urinary excretion (Sunde, 2012). The main human urinary selenium metabolites are the selenosugars 1 and 3, trimethylselenonium ion (TMSe) and, depending on the selenium compound consumed, selenate and selenium‐methylselenoneine, the latter originating most likely from methylation of selenoneine in fish (Hadrup and Ravn‐Haren, 2021). A considerable part of excreted selenium is in the form of yet unidentified metabolites. The amount of identified and unidentified selenium metabolites in urine is dependent on the selenium compound ingested, on the dose and on the individual genetic background (Kuehnelt et al., 2007; Jäger et al., 2016a,b).
TMSe is produced following methylation of hydrogen selenide first to methylselenol (driven by thiopurine S‐methyltransferase (TPMT)), then to DMSe (driven by either TPMT or indolethylamine N‐methyltransferase (INMT)) and finally to TMSe (driven by INMT). A genetic polymorphism in the human INMT gene results in the fact that some individuals are not able to excrete TMSe in substantial amounts (TMSe non‐eliminators) (Lajin and Francesconi, 2016). It has been suggested that conversion of hydrogen selenide to methylselenol and to DMSe takes place in the liver, while the urinary metabolite TMSe is produced from DMSe in the lungs (Fukumoto et al., 2020). This would explain why following ingestion of large amounts of selenium, when the ability of the lung to convert DMSe into TMSe is exceeded, DMSe is exhaled in breath. There is indication that TMSe eliminators excrete TMSe in addition to other selenium metabolites and eliminate more selenium than TMSe non‐eliminators (Kuehnelt et al., 2015; Lajin et al., 2016a). The Panel notes that the reduced capacity of TMSe non‐eliminators to excrete excess selenium in urine might make them more susceptible to selenium toxicity compared with TMSe eliminators. However, current evidence is inadequate to confirm this hypothesis.
In TMSe non‐eliminators, selenosugars 1 and 3 are the predominant selenium metabolites in urine, while TMSe seems to be more prominent in TMSe eliminators (Lajin et al., 2016b). Selenosugar 2 is present usually only in trace amounts and is only detected when selenium intakes are high. For example, selenosugar 2 has been reported to be present in urine in individuals who had been supplemented with 8,000 μg/day SeMet for 7 days and thereafter 4,000 μg/day with urine collections up to day 30 of supplementation (Kuehnelt et al., 2007; Lajin et al., 2016b). With increasing selenium intakes, selenosugar 1 becomes more prominent while the selenosugar 3 rise is less pronounced. The ratio of selenosugar 3 to total urinary selenium metabolites tends to reach a plateau at around 5%, while that of selenosugar 1 to total urinary selenium metabolites continues to rise and stabilises at around 70% (Lajin et al., 2016a).
Selenium ingested as selenate given at a single dose of 50 μg was mostly excreted unmetabolised in humans (Jäger et al., 2016a). Small amounts of ingested selenite are also excreted as selenate, indicating that a fraction of selenite is oxidised to selenate following intake (Jäger et al., 2016b).
Figure 3 provides a schematic overview of selenium metabolism in humans.
3.3. Biomarkers of intake
3.3.1. Characteristics of selenium biomarkers
Several biological markers have been proposed as potential markers of selenium exposure. High correlations (r = 0.63–0.96) between selenium dietary intake, as estimated from duplicate food portions, and single measurements from whole blood, 2‐h‐urine, serum/plasma, hair and (toe)nail samples have been reported (Yang et al., 1989a; Longnecker et al., 1996). The characteristics of selenium biomarkers are described in Appendix A, together with their strengths and limitations regarding their use as biomarkers of selenium dietary intake.
Dietary selenium intake is the major determinant of whole blood/serum/plasma selenium concentrations in non‐occupationally exposed individuals. Serum/plasma selenium concentrations and, to a lesser extent, whole blood selenium concentrations, are the most commonly used biomarkers of selenium intake in epidemiological studies and reflect short/medium term exposure. 7
Some equations have been published to estimate selenium intake from whole blood/serum/plasma selenium concentrations. These equations have been developed using data collected in specific populations. Some approximate conversion factors have also been proposed based on observational evidence (Haldimann et al., 1996).
Other markers that have been used include urinary selenium (short term exposure), nail and hair selenium concentrations (medium/long term exposure 8 ).
Glutathione peroxidases are selenoproteins which are part of the human antioxidant network. Measures of glutathione peroxidase activity in plasma (glutathione peroxidase 3) and other blood compartments (glutathione peroxidase 1 activity in platelets and RBCs; whole blood glutathione peroxidase activity) have been commonly used as biomarkers of selenium status (EFSA NDA Panel, 2014). Selenoprotein P has a central role in selenium storage and transport and has also been used as a biomarker of selenium status (EFSA NDA Panel, 2014). The utility of these markers as biomarkers of intake is limited to the lower range of selenium intake as they reach a plateau as selenium intake increases (glutathione peroxidases were found to reach maximum activity at an intake of 40–60 μg/day (Yang et al., 1987; Duffield et al., 1999; Xia et al., 2005; Xia et al., 2010), while plasma selenoprotein P was found to reach such a plateau with selenium intakes of 60–70 μg/day (Duffield et al., 1999; Persson‐Moschos et al., 2000; Xia et al., 2010); in addition, these proteins are upregulated by oxidative stress, and therefore their levels and activity may increase as a response to free radicals even in the absence of any change in selenium supply.
3.3.2. Dose–response relationship between selenium intake and plasma/serum selenium concentration
A dose–response meta‐analysis was conducted by EFSA to characterise the relationship between mean selenium intake and mean selenium plasma concentrations. The method and results are summarised below. More details are given in the technical report in Annex B.
Data points from studies in which the standard error (SE) of the mean values was not available or could not be calculated were excluded from the analysis. For each study only results from one analysis among alternative ones were chosen (e.g. overall vs. sex‐specific estimates). After sensitivity and subgroup analyses were conducted, 63 pairs of mean values and related standard errors (plasma concentrations and intakes) from 39 studies were included in the final set for the dose–response analysis. The data points corresponding to the intervention phase of trials (25 data points) were excluded as, in a sensitivity analysis, the slope obtained using datapoints from only this subgroup was much different from the slope obtained from analysis of datapoints originating from observational settings (i.e. observational studies, baseline characteristics of participants in intervention studies), possibly due to the manipulation of the diet for relatively short periods. Therefore, intake estimates corresponded to intakes from mixed diets containing different selenium compounds.
The shape of the relationship was explored by applying linear splines; these were considered a convenient way of capturing the non‐linearities in the relationship while keeping the conversion process simple. Different numbers and types of knots were tested, including one at 70 μg/day which is the AI for selenium established by the NDA Panel in 2014 (EFSA NDA Panel, 2014). This knot was finally chosen as it corresponded to the best fitting model. Accordingly, the model estimated two different slopes depending on whether the intake values were below or above the cut‐off of 70 μg/day and related constant terms.
The estimated coefficients were 1.25 (95% confidence interval (CI) 0.88, 1.61) below 70 μg/day and 0.43 (95% CI: 0.29, 0.58) above 70 μg/day, with a constant term for the first spline of 23.10 (95% CI: 1.92, 44.28) and a constant term for the second spline of 79.90 (95% CI 58.72, 101.08) – not shown (Figure 4); at 70 μg/day of mean selenium intake the predicted mean plasma concentrations were 99 (95% CI: 93, 105) μg/L in the linear meta‐regression model (not shown) and 111 (95% CI 102, 119) μg/L in the non‐linear model (see Figure 4).
Figure 4.
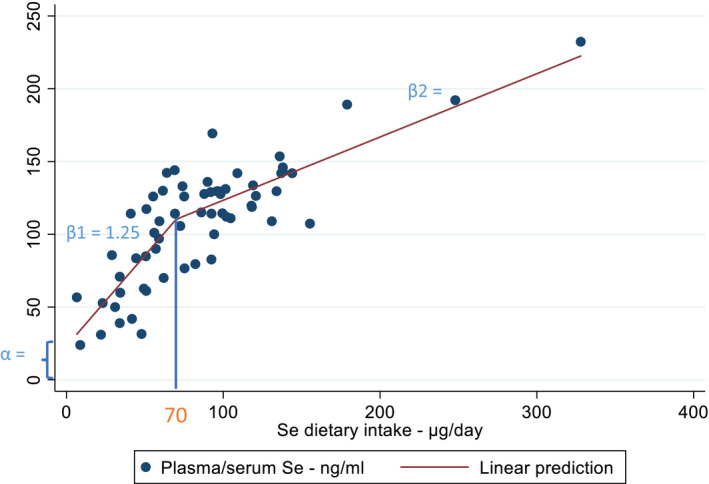
Dose–response meta‐analysis on the relationship between mean selenium intakes and mean selenium plasma concentrations. At 70 μg/day one knot was identified from the best fitting linear splines model and coefficients estimated below and above such a cut‐off (β1 = 1.25, β2 = 0.43, α = 23.10)
- Se: selenium.
The outcome of the stratified and sensitivity analyses conducted on this model are presented in Annex B.
3.4. Intake assessment
3.4.1. Sources of dietary selenium
Dietary selenium from plant and animal sources occurs mainly as organic compounds, primarily SeMet and SeCys (Rayman et al., 2008a; Cubadda et al., 2010; Fairweather‐Tait et al., 2011; Rayman, 2012; Mehdi et al., 2013). Almost 90% of selenium in (non‐selenium‐enriched) plants is present as SeMet (Burk and Hill, 2015). In food of animal origin, SeMet is also present as a major species alongside SeCys specifically incorporated into selenoproteins (Bierla et al., 2008a,b; Lipiec et al., 2010). In fish, SeMet or selenoneine are the major selenium forms depending on the fish species (Yamashita and Yamashita, 2010; Sele et al., 2018).
The richest food source of selenium are Brazil nuts (Bertholletia excelsa). Mean concentrations between 5 and 72 μg/g dry weight (up to 400 μg/nut) have been reported in samples collected in Brazil and the Amazon Basin, indicating large variability depending on their region of production (Pacheco and Scussel, 2007; Cardoso et al., 2017). There may be high seed‐to‐seed variation in selenium content within commercially available batches (Lima et al., 2019).
Other rich foods of selenium include offals (e.g. mean content in kidney (pig, lamb, beef: 1–3 μg/g)) and fish and crustaceans (e.g. mean content in tuna: 1–3 μg/g; shrimps, crabs, prawns: 1–2 μg/g) (Anses, 2020; Public Health England, 2021; Finnish Institute for Health and Welfare, 2022).
In EFSA's intake assessment of selenium in European populations, the main food groups contributing to selenium intake were found to be milk and dairy products, meat and meat products, grains and grain‐based products and fish and fish products (EFSA NDA Panel, 2014) (see also Section 3.4.2).
There is a large variability in the selenium concentration of foods, which depends, to a large extent, on where crops and fodder are grown (Johnson et al., 2010; Mehdi et al., 2013). The amount of selenium available in soil is a major determinant of the amount of selenium in the plant foods. Seleniferous soils are present in parts of the United States, Canada, South America, India, China and Russia, while New Zealand, some parts of China, Nordic European countries and parts of Eastern Europe are characterised by selenium content in soils which are lower than the average content worldwide (Combs, 2001; Oldfield, 2002). Other factors affect the uptake of selenium into plants, such as soil pH, rainfall or microbial activity (Mora et al., 2015).
Selenium in water is mainly present as inorganic compounds, predominantly as selenate (WHO, 2011; LeBlanc et al., 2018). As per Directive (EU) 2020/2184 9 the parametric value for the selenium content of drinking water is 20 μg/L in the EU, which can be increased to 30 μg/L in regions where geological conditions could lead to high levels of selenium in groundwater.
Selenium‐enriched foods
Food items with an artificially increased content of selenium can be produced by means of selenium‐enriched fertilisers or growth medium. They are hereinafter referred to as selenium‐enriched foods (sometimes called selenised or biofortified foods in the literature). Examples include selenised wheat, garlic, onion, broccoli, potatoes and selenised yeast (Demirci et al., 1999; Heard et al., 2004; Fisinin et al., 2008; Fairweather‐Tait et al., 2011).
Soil enrichment is usually performed with inorganic selenium salts (selenate, rarely selenite, e.g. as sodium salt). In most plants, inorganic selenium is taken up and biotransformed into SeMet. For example in cereal grains grown in areas with selenium‐rich soil, the major selenium compound is protein‐bound SeMet. Inorganic selenium and water soluble low molecular weight seleno‐compounds, including selenosugars, are also present and are non‐protein bound (Aureli et al., 2012). In plants of the Brassica genus (e.g. broccoli) and the Allium genus (e.g. onion and garlic) enrichment with inorganic selenium results in the biosynthesis of notable amounts of the non‐protein selenoamino acids MeSeCys and γ‐Glu‐MeSeCys (Rayman et al., 2008a).
Se‐yeast is the most widespread selenium‐enriched source and contains predominantly SeMet, with a large variety of other organic species present as minor compounds (Fairweather‐Tait et al., 2011; Bierla et al., 2012; Bierla et al., 2018).
Fortified foods
The selenium content of foods can be increased by its addition to foods during processing (hereinafter referred to as fortified foods). In the EU, sodium selenate, sodium hydrogen selenite, sodium selenite, and Se‐yeast are authorised for addition to foods 10 and foods for specific groups. 11
The Mintel GNPD database 12 was used to identify foods and beverages to which selenium has been voluntarily or mandatorily added in the EU market in the last 5 years (from January 2016 to December 2021). A total of 1,847 packaged food products available in 22 EU Member States (MSs) and Norway were identified as containing added selenium in the ingredient list. The majority of the products belong to the Mintel categories ‘baby foods’ 13 (41%) and ‘nutritional drinks & others’ (34%). Most products were found in Germany, Italy, France and Spain. Data on selenium content per serving based on labelled information were available for 19% of the products. Among those, this information was available for 2% of ‘baby foods’ only (n = 18): range 1.5–11 μg selenium per serving (median = 5.7 μg selenium); and 29% of ‘nutritional drinks & others’ (n = 179): range 6.4–165 μg selenium per serving (median = 18 μg selenium), with the highest contents per serving reported in some weight management products such as meal replacement shakes.
Food supplements
In the EU, authorised forms of selenium for use in food supplements are sodium selenate, sodium hydrogen selenite, sodium selenite, Se‐yeast, L‐SeMet and selenious acid. 14
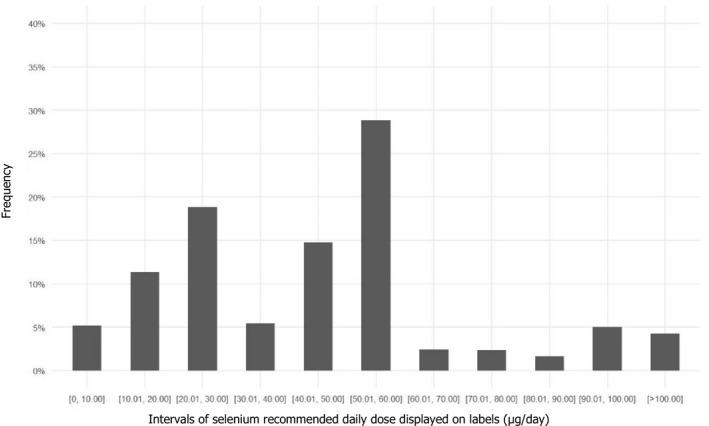
The Mintel GNPD database was used to identify selenium containing food supplements present in the EU market in the last 5 years (from January 2016 to December 2021). The Mintel category ‘vitamins and dietary supplements’, including supplements formulated for special nutrition needs such as ‘maternal & infants nutrition’ and ‘performance nutrition’, was searched. It yielded a total of 1,238 products available in 24 EU MSs and Norway. Most of the products were found in Germany, France and the Netherlands. The labelled recommended daily dose ranged from 2.5 up to 220 μg of selenium, with an average of 49 μg per daily dose (median 50 μg per daily dose) (Figure 5). A proportion of 15% of the food supplements contain ≥ 70 μg per daily dose, which is the AI for selenium in adults, and 4% contain > 100 μg per daily dose. Among selenium containing products, only 2.6% were single‐nutrient supplements.
Figure 5.
Distribution of selenium‐containing supplements available in EU Member States and Norway according to the recommended daily dose displayed on labels
- Source: Mintel GNPD database. Search for selenium‐containing supplements available in the EU market in the last 5 years (from January 2016 to December 2021). A total of 1,238 products available in 24 EU Member States and Norway were identified.
3.4.2. EFSA's intake assessment
Selenium intakes from food sources (excluding food supplements) in European populations were calculated in the context of the Scientific Opinion of DRVs for selenium, based on the data from the EFSA Comprehensive Database and the EFSA FCDB (EFSA NDA Panel, 2014). Food consumption surveys of Finland, France, Germany, Ireland, Italy, Latvia, the Netherlands and Sweden were used for the assessment. The period of data collections covered by the surveys ranged between 2000 and 2012. Further information on the characteristics and methods used for the data collection in the respective surveys are provided in Annex C.
Food composition data from Finland, Germany, Italy, the Netherlands and the UK were used to calculate selenium intake in these countries. For nutrient intake estimates of Ireland and Latvia, food composition data from the UK and Germany, respectively, were used, because no specific composition data from these countries were available. The proportion of borrowed selenium values in the five composition databases varied as follows: Germany 100%, Italy 91%, the UK 68%, Finland 58% and the Netherlands 50%.
The intake assessment of 2014 did not distinguish between selenium ‘naturally present’ or ‘added’ to foods by manufacturers. As data on the consumption of foods fortified with selenium available in the Comprehensive Database 15 and on the concentration of selenium in fortified foods available in EFSA FCDB database are scarce, EFSA's intake estimates can be considered to reflect selenium intake from natural sources.
The estimated distributions of intake are presented below by age group, sex and country of origin (Figures 6 and 7). A summary overview, providing the ranges of means and 95th percentiles (P95) across EU surveys is given in Table 3.
Figure 6.
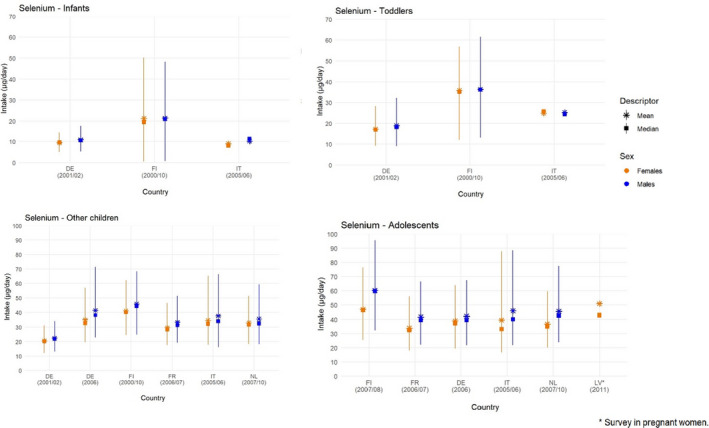
Mean, median, 5th and 95th percentiles of selenium intakes in infants (< 1 year old), toddlers (≥ 1 year to < 3 years old), other children (≥ 3 years to < 10 years old) and adolescents (≥ 10 years to < 18 years old), by sex and country
-
Lines represent the range between the 5th and 95th percentiles. Estimated intakes from 5th and 95th percentiles are not presented when sample size is below 60 participants.DE: Germany; FI: Finland; FR: France; IT: Italy; LV: Latvia; NL: Netherlands.Source: (EFSA NDA Panel, 2014), except for infants.
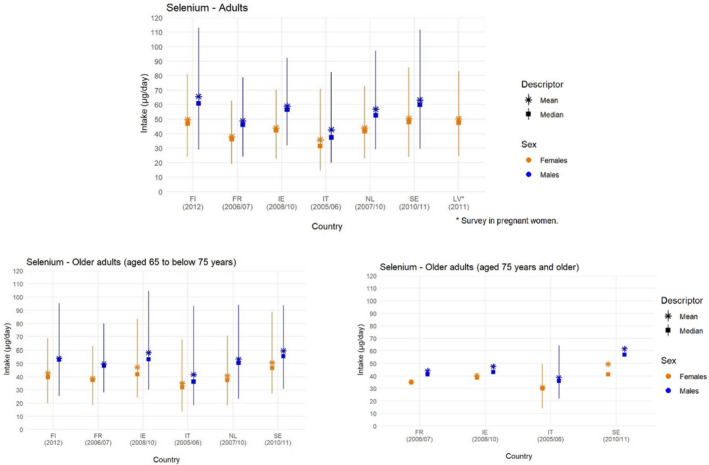
Figure 7.
Mean, median, 5th and 95th percentiles of selenium intakes in adults (≥ 18 years to < 65 years old) and older adults (≥ 65 years), by sex and country
-
Lines represent the range between the 5th and 95th percentiles. Estimated intakes from 5th and 95th percentiles are not presented when sample size is below 60 participants.FI: Finland; FR: France; IE: Ireland; IT: Italy; LV: Latvia; NL: Netherlands; SE: Sweden.Source: (EFSA NDA Panel, 2014).
Table 3.
Minimum and maximum mean values and 95th percentiles of selenium daily intake from food sources (supplement use excluded) across European dietary surveys by population group and sex
| Population group, age range (mo, y) (n of surveys) | Selenium (μg/day) | |||||||
|---|---|---|---|---|---|---|---|---|
| Males | Females | |||||||
| Mean | P95 | Mean | P95 | |||||
| Min. | Max. | Min. | Max. | Min. | Max. | Min. | Max. | |
| Infants, ≥ 4 to < 12 mo (3) | 10.2 | 21.4 | 17.7 | 48.3 | 9.0 | 21.2 | 14.5 | 50.2 |
| Toddlers, ≥ 1 to < 3 y (3) | 18.9 | 36.3 | 32.2 | 61.6 | 17.2 | 35.8 | 28.3 | 56.9 |
| Other children, ≥ 3 to < 10 y (6) | 22.5 | 45.9 | 33.9 | 71.5 | 20.6 | 41.1 | 31.3 | 65.2 |
| Adolescents, ≥ 10 to < 18 y (5) | 41.6 | 60.3 | 66.5 | 95.5 | 33.9 | 46.9 | 55.9 | 87.8 |
| Adults, ≥ 18 to < 65 y (6) | 42.7 | 65.6 | 78.8 | 113.0 | 35.8 | 50.5 | 62.7 | 85.4 |
| Older adults, ≥ 65 to < 75 y (6) | 41.6 | 59.6 | 80 | 104.4 | 35.0 | 50.7 | 62.8 | 88.6 |
| Older adults, ≥ 75 y (4) | 38.8 | 61.7 | 64.6 (a) | 64.6 (a) | 31.0 | 49.5 | 49.6 (a) | 49.6 (a) |
| Pregnant women (1) | 50.3 | 50.9 | 82.9 (a) | 82.9 (a) | ||||
mo: months, n: number, P, percentile; y: years.
95th percentiles calculated only for 1 survey.
Source: (EFSA NDA Panel, 2014), except for infants.
Across population groups, the main food groups contributing to selenium intake were milk and dairy products, meat and meat products, grains and grain‐based products and fish and fish products, with minor differences between sexes (EFSA NDA Panel, 2014) (Annex C).
When available, EFSA selenium intake estimates were compared with values from the same national surveys published in the literature (EFSA NDA Panel, 2014). EFSA average selenium intake estimates were similar to the published results from the Dutch national food consumption survey (van Rossum et al., 2011) (± 5% difference), while EFSA values were up to 25% higher than the published results from the Swedish Riksmaten survey (Amcoff et al., 2012) and up to 20% lower than the published values from the INCA 2 survey in France (AFSSA, 2009), the FINDIET 2012 survey (Helldan et al., 2013) and NWSSP study in adolescents (Hoppu et al., 2010) in Finland. As previously discussed (EFSA NDA Panel, 2014), several factors may contribute to these differences, including discrepancies in mapping food consumption data according to food classifications and in nutrient content estimates available from the food composition tables, as well as different intake modelling methods. The lower estimates for Finland may be due to borrowed values lower than the selenium contents of Finnish foods that were used in the intake assessments at the national level owing to the national selenium enrichment programme implemented in Finland. As the intake calculations rely heavily on estimates of both food composition and food consumption, it is not possible to conclude which of these intake estimates would be closer to the actual selenium intake.
3.4.3. Complementary information from national reports
3.4.3.1. Intake data of selenium from foods and fortified foods
Nationally representative consumption surveys and TDSs published after the surveys included in EFSA's intake assessment were collected. Survey characteristics, mean and P95 intake estimates are presented in Annex D. Key information is summarised below.
Intake estimates from national consumption surveys
Reports from national consumption surveys providing estimates of selenium intake from foods and fortified foods (excluding food supplements) are available for 10 countries: Denmark, Estonia, Finland, France, Greece, Lithuania, Norway, Spain, Sweden, the Netherlands (Pedersen et al., 2015; Hansen et al., 2016; AECOSAN, 2017; Anses, 2017; Hansen et al., 2017; Lemming et al., 2018; Valsta et al., 2018; Mitsopoulou et al., 2020; van Rossum et al., 2020; Bulotaitė et al., 2021; Kukk et al., 2021; Mitsopoulou et al., 2021). At the P95, the estimated intakes are up to 80.9 μg/day in male infants (aged ≥ 3 to < 12 months; 3 countries), up to 108.6 μg/day in female toddlers (1 to < 3 years; 5 countries), up to 153.3 μg/day in male other children (3 to < 10 years; 5 countries), up to 183.7 μg/day in female adolescents (10 to < 18 years; 6 countries) and up to 227.7 μg/day in male adults (≥ 18 years; 6 countries). The highest P95 values in all age groups are reported in the Third Individual and National Survey on Food Consumption in France (INCA 3). However, the report of the INCA3 survey (Anses, 2017) stressed large uncertainties related to the food composition tables used for the selenium intake assessment.
Intake estimates from total diet studies
TDS data from Ireland and the Czech Republic were collected (FSA, 2016; Státní zdravotní ústav, 2021). Unpublished data from the Italian TDS were also obtained (F. Cubadda, personal communication, November 2021). At the P95, selenium intakes from food consumption only in males (i.e. without food supplements and fortified foods) are up to 64 μg/day in toddlers (1 to < 3 years; one country), up to 116 μg/day in other children (3 to < 10 years; two countries), up to 144 μg/day in adolescents (10 to < 18 years; one country) and up to 142 μg/day in adults (≥ 18 years; two countries). Consistent with other results, intakes are slightly lower in females than in males. For all age groups, the highest P95 values are found in the Italian TDS.
Contribution of fortified and enriched foods
The majority of the survey reports did not distinguish between selenium intake from natural sources and intake resulting from selenium addition to foods (fortified foods). One report on two national surveys in Estonia, involving children and adults, respectively, estimated selenium intake from fortified foods only (Kukk et al., 2021). Only 1.5% of the total eating occasions included information on fortification. Boys aged 1–9 years was the only population group for which a contribution of fortified foods (0.1 μg selenium per day) could be detected. Challenges related to data gaps in food composition databases particularly for foods fortified with selenium were noted. In the report from the DNFCS 2007–2010 (van Rossum et al., 2011), the estimated contribution of foods fortified with selenium to total intake of selenium was negligible (< 1%).
Regarding selenium‐enriched foods (Section 3.4.1), the addition of sodium selenate to the main fertilisers became mandatory in 1984 in Finland, as a way to enrich the selenium content of local food products, because of the low selenium content of Finnish soils. Following this public health measure, the mean selenium intake in the Finnish population increased from 38 μg/day before enrichment policy to 80 μg/day in 2001 (Rayman et al., 2008a). In other EU MSs, some selenium‐enriched foods may be present on the market (e.g. selenised potatoes). However, data on the contribution of these foods to selenium intake are lacking.
3.4.3.2. Intake data of selenium from food supplements
Information on selenium intake from food supplements are available for six countries: Norway (Totland et al., 2012; Hansen et al., 2016; Hansen et al., 2017; Astrup et al., 2020; Paulsen et al., 2020), Sweden (Lemming et al., 2018), Finland (Valsta et al., 2018), the Netherlands (van Rossum et al., 2020), Estonia (Kukk et al., 2021) and Poland (Stos et al., 2021). Study characteristics and intake estimates are presented in Annex D.
Intake of selenium from foods supplements in the whole population
Six national dietary surveys from Estonia, the Netherlands and Norway provide information on the contribution of selenium‐containing food supplements to total selenium intake in the whole study population, in different age groups (Table 4). The contribution is estimated to be ≤ 8% for toddlers, children and adolescents in the three countries. Among adults, the contribution ranges between 2% and 4% (adult women in Estonia) and 19% (adult women aged 51–79 years in the Netherlands).
Table 4.
Percent contribution of food supplements to total selenium intake in whole survey population
| Country | Dietary method (N of days) | Sex |
Contribution of supplements to total mean selenium intake % (age) |
||||
|---|---|---|---|---|---|---|---|
| Toddlers | Other children | Adolescents | Adults | Elderly | |||
| Survey name (N subjects) | |||||||
| Reference | |||||||
|
Estonia National Dietary Survey in Children and Adults 2013–2015 1 (n = 4,646) (Kukk et al., 2021) |
24‐h recalls (2‐d); food records (2‐d) 2 |
m |
2–5 (1–9 y) |
1–1.5 (10–17 y) |
2–4 (18–64 y) |
2–3 (65–74 y) |
|
| f |
3–4 (1–9 y) |
2–5 (10–17 y) |
5–9 (18–64 y) |
3–7 (65–74 y) |
|||
|
Netherlands DNFCS 2012–2016 (n = 4,313) (van Rossum et al., 2020) |
24‐h recalls (2‐d) |
m |
4 (1–3 y) |
9 (4–8 y) |
7.5 (9–13 y) 7 (14–18 y) |
7 (19–30 y) 5 (31–50 y) 11 (51‐70y) |
14 (71–79 y) |
| f |
4 (1–3 y) |
7 (4–8 y) |
6 (9–13 y) 5 (14–18 y) |
9 (19–30 y) 10 (31–50 y) 18.5 (51–70 y) |
19 (71–79 y) |
||
|
Norway Spedkost 32,019 (n = 1,957) (Paulsen et al., 2020) |
FFQ |
m + f |
6.5 (1 y) |
||||
|
Norway Småbarnskost 32,019 (n = 1,413) (Astrup et al., 2020) |
FFQ |
m + f |
5.6 (2 y) |
||||
|
Norway Ungkost 3 (n = 1,722) |
Dietary records (web) (3 or 4‐d) |
m |
3 (4 y) |
0 (9 y) |
3 (13 y) |
||
| f |
3 (4 y) |
0 (9 y) |
3 (13 y) |
||||
|
Norway Norkost 32,010–2011 (n = 1,787) (Totland et al., 2012) |
24‐h recalls (2‐d) + FPQ |
m |
6.8 (18–70 y) |
||||
|
f |
10.7 (18–70 y) 11.8 3 (18–45 y) |
||||||
d: days; DNFCS: Dutch National Food Consumption Survey; f: females; FFQ: Food Frequency Questionnaire; FPQ: Food Propensity Questionnaire; m: males; N: number; y: years.
Contribution expressed as a range based on two scenarios: (a) lower value: only accounting for supplements for which the brand was reported (hence, food labelling checked) and, (b) upper value: accounting for all food supplements; when the supplement brand was not reported, the nutrient concentration was estimated based on the label database created in the first exposure scenario.
For children up to 10 years of age.
Women at childbearing age.
Intake of selenium from food supplements among users
In the latest national Finnish survey (FINDIET 2017), the percentage of selenium supplements users was 15% among adult males and 22% among adult females of the total survey population (based on 2 × 24‐h recalls). Among selenium supplement users, the contribution of supplements to selenium intake was 30% and 34% for males and females, respectively (Valsta et al., 2018) (Table 5).
Table 5.
Percent selenium supplement users in EU surveys and selenium intake from food supplements among users
| Country | Dietary method (N of days) | Sex | Age range | % Se supplement users in total survey sample | Se intake from supplements, mean ± SD (μg/day) | Contribution of supplements to total selenium intake, mean (%) |
|---|---|---|---|---|---|---|
| Survey name (N of food supplement users) | ||||||
|
Sweden Riksmaten 2016–2017 (N = 350) (Lemming et al., 2018) |
Dietary records (web) (3‐d) |
m + f | 11–13 y | 4 | 17 | 29 |
| 12–16 y | 5 | 14 | 23 | |||
| 17–21 y | 9 | 24 | 18 | |||
|
Finland FINDIET 2017 (N = 310) (Valsta et al., 2018) |
24‐h recalls (2‐d) | m | 18–74 y | 15 | 38 | 30 |
| f | 22 | 37 | 34 | |||
|
Poland NIPH‐NIH 2019–2020 (N = 178) (Stos et al., 2021) |
FPQ | m | 18–96 y | 2 | 45.4 ± 26.8 | NA |
| f | 4 | 33.3 ± 15.5 | NA |
d: days; f: females; FPQ: food propensity questionnaire; m: males; N: number; NA: not available; Se: selenium; y: years.
Among food supplement users of the Riksmaten Adolescents 2016–2017 survey in Sweden (individuals aged 11 to 21 years; n = 350), the contribution of selenium supplements to total mean selenium intake ranged from 18% to 29% across age groups (based on 3 days of web‐based dietary record) (Lemming et al., 2018) (Table 5).
Among adult male and female food supplement users of the national survey in Poland (n = 178), around 30% reported to have consumed selenium‐containing supplements during the preceding year (based on a food propensity questionnaire) (Stos et al., 2021). Mean (± standard deviation (SD)) selenium intake from food supplements only was 38.5 ± 21.5 μg/day (median: 30 μg/day) for men and women combined.
3.4.4. Overall conclusions on intake data
The Panel notes the uncertainties associated with selenium intake estimates due to the large variability in the selenium content of foods, which mainly depends on the geochemistry and selenium content of the soil. The origin of the foods can have a substantial impact on the selenium content of some commodities. This may result in inaccuracies in food composition tables if the analytical data that they include do not adequately capture the variability in the selenium content of foods or in the case of borrowed values. Regarding EFSA intake estimates, the Panel notes the large amounts of borrowed values and that there are uncertainties on how accurately the information contained in the nutrient composition database reflects the variability in selenium concentrations in foods. Therefore, the results should be considered indicative and be interpreted with caution (EFSA NDA Panel, 2014). TDSs can address some limitations of the intake assessment based on food consumption tables as they use representative sampling methods and chemical analysis of foods ‘as consumed’.
The Panel notes that, at P95, estimated intake of selenium from food consumption only (i.e. without food supplements and fortified foods) are up to 48.3 μg/day in infants (4 to < 12 months), up to 61.6 μg/day in toddlers (1 to < 3 years), up to 71.5 μg/day in other children (3 to < 10 years), up to 95.5 μg/day in adolescents (10 to < 18 years) and up to 113.0 μg/day in adults (≥ 18 years), across surveys included in EFSA's intake assessment (EFSA NDA Panel, 2014). Intakes are slightly lower in females, mainly due to smaller quantities of food consumed per day. National reports of more recent data indicate that selenium intakes of high (P95) and average consumers in some EU MSs may exceed EFSA estimates, but comparisons are difficult owing to the different methodologies and food composition tables used.
The Panel notes that fortified foods were found to contribute little to total selenium intake in the two countries for which information is available. The Panel notes the inherent uncertainties related to self‐reported intakes of fortified foods in food consumption surveys, as well as uncertainties in the composition data, which can hamper the accurate evaluation of the actual contribution of these foods. The Panel notes that the contribution of fortified foods to total selenium intake could be significant among regular users of these foods but data are too limited for a reliable intake assessment of this group.
In Finland, selenium‐enriched foods contribute to total selenium intake to a significant extent. This situation is unique in the EU, being the result of a national policy to increase selenium content of local foods and the selenium status of the population through the use of selenium‐supplemented fertilisers. Data on the contribution of selenium‐enriched foods to selenium intake in other countries are lacking.
Data on the contribution of food supplements to total selenium intakes are available for a limited number of European countries. The Panel notes that food supplements were found to contribute up to 19% of total selenium intake in the Netherlands. In Finland, a significant proportion of the adult population was found to use selenium‐containing supplements (15% of males and 22% of females), with supplements representing about a third of total selenium intake in the user group. In a cohort of supplements users in Sweden, selenium supplements accounted for about 20%–30% of total selenium intake among users. The Panel also notes that data from the Mintel database indicate that half of the products on the EU market provide ≥ 50 μg selenium per daily dose and 15% provide daily doses ≥ 70 μg (maximum 220 μg per daily dose). The Panel notes that in regular consumers of selenium supplements, the contribution of supplementation to total selenium intake can be substantial.
The Panel also notes that Brazil nuts can have a particularly high selenium content compared to other food sources and may contribute remarkably high amounts of selenium (e.g. a serving of 5 or 6 Brazil nuts could contribute approximately between 100 and 2,000 μg selenium, considering the range of concentration reported in the literature (range of means: 5–72 μg/g dry weight)).
3.5. Hazard identification
3.5.1. Mechanisms of toxicity
In the opinion of 2000, the SCF concluded that ‘the molecular mechanisms of selenium toxicity remain unclear’ (SCF, 2000a). The mechanisms reviewed included redox cycling of auto‐oxidisable selenium metabolites, glutathione depletion, protein synthesis inhibition, depletion of S‐adenosyl‐methionine (cofactor for selenide methylation), general replacement of sulfur and reactions with critical sulfhydryl groups of proteins and cofactors. However, it was noted that no unifying hypothesis is possible given that several mechanisms may operate and vary among different selenium compounds.
The most often invoked mode of action of excess selenium involves oxidative stress generation and the consequent perturbations of cellular and mitochondrial function. In summary, hydrogen selenide is the central selenium metabolite for selenoprotein synthesis. As the body burden of the element increases, once selenoprotein biosynthesis is saturated, oxidation of excess hydrogen selenide and free selenols (e.g. monomethylselenol) is suggested to lead to the production of superoxide and other reactive oxygen species (ROS) and cellular and subcellular damage, including that of lipids and deoxyribonucleic acid (DNA) (Rayman et al., 2008a) (Figure 3). Generation of superoxide in the presence of thiols such as glutathione would result in redox cycling, cell‐cycle arrest and cell death due to apoptosis, necrosis, necroptosis or ferroptosis (Wallenberg et al., 2014; Misra et al., 2015). Another suggested mode of action is inhibition of methylation, the major detoxification pathway for selenium, allowing the accumulation of hepatotoxic hydrogen selenide and other selenides. For instance, overexposure to SeCys has been shown to cause hepatic toxicity in mice by depressing selenium methylation through the inactivation of methionine adenosyltransferase, the enzyme responsible for S‐adenosyl methionine synthesis (Rayman et al., 2008a).
Recently, high selenium exposure (as selenite) has been shown to lead to endothelial dysfunction through activation of endoplasmic reticulum stress and increased ROS production in vitro (Zachariah et al., 2021). The SCF (2000a) further observed that growth reduction in experimental animals may be caused by selective selenium accumulation and toxicity to growth hormone producing cells in the anterior pituitary gland. It is now appreciated that selenium is necessary for the function of insulin‐like growth factor 1 but, as yet, any impact of excess selenium intake on insulin‐like growth factor 1 activity, including that on growth, cellular integrity and hair growth has not been reported (Hosnedlova et al., 2017).
Finally, the replacement of sulfur with selenium in proteins, with disruption of structural and functional components, has also been proposed to contribute to selenium toxic effects (Unrine et al., 2007; Lv et al., 2021). This could be the underlying mechanism for the structural damage and loss of hair and nails which are typical of selenosis, through alterations in keratin structure (Webb and Kerns, 2009; Fairweather‐Tait et al., 2011; Yu et al., 2018).
The Panel notes that that several modes of action may operate in parallel, and the respective importance might depend on the dose and the chemical form of selenium ingested.
3.5.2. Clinical effects of selenosis and related potential biomarkers of effects
As indicated before, the term ‘selenosis’ in the formulation of sQ1 broadly refers to selenium toxicity and associated features (Section 2.1). Accordingly, the term selenosis is to be understood in a wide sense in this opinion. In the few cases where the term is employed in accordance with its clinical definition in the articles cited, this is specified in the text.
This section follows the approach for hazard identification that is outlined for sQ1 (Section 2.2.2.3). Accordingly, Section 3.5.2.1 describes the clinical effects, i.e. signs and symptoms, associated with selenosis. Based on the systematic reviews conducted to address sQ1, Section 3.5.2.2 reports data on clinically diagnosed cases of selenosis in humans, as well as data on individual signs and symptoms that are typical of excess selenium intake. Further, using a biologically based model, Section 3.5.2.3 explores potentially relevant endpoints among the homeostatic and adaptive responses to excess selenium intake and increasing body burden. Relevant endpoints may be early biochemical changes or biological markers for which a mechanistic pathway can be discerned, and which can be characterised and validated as predictive of adverse effects (‘biomarkers of effects’) (EFSA NDA Panel, 2022).
3.5.2.1. Clinical effects of selenosis
In animals, selenium poisoning has been described in livestock, particularly cattle and horses, living in seleniferous areas. Chronic selenosis, often termed Alkali disease, is mainly characterised by hoof and hair changes and has been suggested to be a result of chronic ingestion of selenium compounds not soluble in water. Blind staggers disease was initially proposed to be a result of feeding on plants containing water soluble selenium compounds. Its symptoms are impaired vision and unsteady gait up to blindness and paralysis. As the symptoms could not be reproduced in experimental settings, its relationship with selenium has been questioned (O'Toole and Raisbeck, 1995; O'Toole et al., 1996).
Signs and symptoms of acute selenium poisoning in humans (sometimes referred to as ‘acute selenosis’) include hypotension and tachycardia, nausea, vomiting, diarrhoea, abdominal pain, pulmonary oedema and neurologic abnormalities such as tremor, muscle spasms, restlessness, confusion, delirium and coma (Nuttall, 2006; Fairweather‐Tait et al., 2011).
The most common signs of chronic selenium poisoning in humans (sometimes referred to as ‘chronic selenosis’) are brittle thickened nails with white spots and longitudinal streaks as well as brittle hair and hair loss/alopecia. Other signs include discoloration and excessive decay of teeth, garlic odour on the breath, skin lesions and neurological abnormalities, such as fatigue, weakness, peripheral paraesthesia, hyperreflexia, pain in the extremities, unsteady gait, paralysis and decreased cognitive function (Nuttall, 2006; Rayman et al., 2008a; Fairweather‐Tait et al., 2011; ATSDR, 2013).
3.5.2.2. Evidence from human studies relating selenium intake to clinical effects of selenosis
Studies considered in the assessment by the SCF (2000a)
The current UL has been derived from the cross‐sectional study by Yang et al. (1989a) conducted in the Enshi County in China. A total of 349 individuals aged 1–71 years living in three distinct areas with ‘low’, ‘medium’ and ‘high’ selenium content in the soil were included. Among adults, the average daily selenium‐intake estimated in the respective areas (mean ± SE) was 70.5 ± 4.8 μg, 194.7 ± 22.9 μg and 1,438.2 ± 76.3 μg for males, and 62.0 ± 3.6 μg, 198.1 ± 23.81 μg and 1,238.5 ± 64.6 μg for females (average body weight: male 55 kg, female 53 kg).
A total of 60 cases of selenosis (aged 13–70 years) were identified upon physical examination. Morphological changes in fingernails, stratified by severity and persistence, were used as the main criterion for clinical diagnosis of selenosis. Hair loss or changes in hair structure were also considered when present in combination with changes in fingernails. No clinical signs of selenosis were observed among individuals with whole blood selenium concentration < 1,000 μg/L, corresponding to intakes of around 850 μg/day selenium (calculated by the authors based on a regression equation presented in Yang et al., 1989b). In a follow‐up study, among five cases with long‐persisting clinical symptoms of selenosis (all adults aged > 30 years), blood selenium concentrations ranged between 1,054 and 1,854 μg/L; 1,054 μg corresponding to around 910 μg/day selenium intake (calculated). Symptoms disappeared after a change in diet resulting in lower selenium intakes (Yang and Zhou, 1994).
In the same study, a prolonged prothrombin time (defined as > 14 s) was observed in 45% of individuals with whole blood selenium concentrations > 1,000 μg/L, compared to 2.7% of individuals with whole blood selenium concentrations below this value (analysed among a subset of 84 individuals). Although liver function was not thoroughly investigated, alterations associated with liver fibrosis (assessed by supersonic shear imaging of the liver tissue) were not found in a subgroup of 20 male adults native of the high selenium area, 70% of whom had suffered from heavy hair and nail loss.
Among a subset of 127 individuals, a reduction of the ratio between plasma selenium to RBC selenium was observed at whole blood selenium concentrations > 100 μg/L and was more pronounced at concentrations > 900 μg/L (around 750 μg/day selenium intake). The latter was taken by the authors as indicative of an increased body burden (i.e. that it may reflect the nonspecific integration of selenium in proteins, e.g. haemoglobin, after the requirement for the synthesis of selenoproteins has been met). In a subgroup of adult males, a higher white blood cell (WBC) count was observed in those living in the ‘high selenium’ area (mean ± SE 10,004 ± 403 count/mm3) compared with those in the ‘low selenium’ area (8,216 ± 469 count/mm3). The authors also noted that blood concentrations of glutathione were lower in subjects with whole blood selenium concentration > 1,000 μg/L than those with concentrations < 1,000 μg/L.
Finally, in school children 7–14 years of age, the prevalence of mottled enamel teeth was 0%, 49% and 95% in groups with ‘low’ (mean 130 μg/L), ‘medium’ (370 μg/L) and ‘high’ (1,570 μg/L) whole blood selenium concentrations, respectively.
Based on Yang et al. (1989a), the daily selenium intake of 850 μg has been taken by the SCF (2000a) as a NOAEL in relation to signs and symptoms of selenosis, to which an UF of 3 was applied to derive the UL of 300 μg/day for adults. The data on mottled teeth did not allow a NOAEL to be derived and the UL from children was extrapolated from adults on a body weight basis.
Additional studies, by Longnecker et al. (1991), Clark et al. (1996) and Brätter and Negretti de Brätter (1996), were considered by the SCF to support the UL of 300 μg/day for adults.
In the study by Longnecker et al. (1991) conducted in seleniferous areas of western South Dakota and eastern Wyoming, 142 adult subjects were recruited from households selected at random and from ranches where unusually high selenium intakes were suspected. About half of the subjects had selenium intakes > 200 μg/day (range 68–724 μg/day), assessed using the duplicate food portion technique. Median serum selenium was of 184 μg/L (range 123–363 μg/L). A physician performed a physical examination of the 78 subjects enrolled in the first year of the study, including 29 ranchers suspected of having high selenium intakes because of previous or current selenosis in livestock. The examination covered a standardised list of signs and symptoms including muscle weakness, asymmetrical reflexes, hyperreflexia, abnormal sensory examination, dermatitis, and nail loss or markings. In all 142 subjects, a self‐administered questionnaire inquired about the frequency of symptoms such as weakness, paraesthesia, dyspepsia, loss of hair or nails, and dermatitis, and nail photographs were taken. No symptoms of selenosis were observed in this population, even at the highest estimated selenium intake of around 720 μg/day. There was a positive correlation between selenium intake and alanine aminotransferase (ALT) activity, but this was within the reference and not considered to be of biological relevance.
In the Nutritional Prevention of Cancer (NPC) trial, in which 200 μg/day Se‐yeast was given to patients with skin cancer (total dietary selenium intake 300 μg/day), Clark et al. (1996) reported that ‘no dermatologic signs of selenium toxicity’ were observed regarding the safety endpoints monitored in the study. 16
In the cross‐sectional study by Brätter and Negretti de Brätter (1996) in lactating women in three areas of Venezuela with average (range) dietary selenium intakes of 205 (90–350) μg/day, 274 (170–500) μg/day and 552 (250–980) μg/day (calculated based on selenium breast‐milk concentrations), no changes in fingernails or hair loss were reported (method for outcome assessment not reported).
Additional data identified
To establish whether newly available data would require a revision of this NOAEL, the Panel investigated whether signs and symptoms of selenosis have been reported in the literature below a daily selenium intake of 850 μg (i.e. whole blood selenium < 1,000 μg/L). Given that an intake of 850 μg/day is the current NOAEL, studies reporting signs and symptoms of selenosis at selenium intakes above these values are not described hereunder. In addition, studies which reported such signs and symptoms at plasma/serum selenium concentrations above 850 μg/L were also excluded, under the conservative assumption that a daily intake of 850 μg is equivalent to a plasma or serum selenium concentration of 850 μg/L (the prediction equation described in Section 3.3.2 is not applicable at these levels). As a result, eight publications on case reports or case series of chronic selenium poisoning were not further assessed (No authors listed, 1984; Sutter et al., 2008; Dosary et al., 2009; MacFarquhar et al., 2010; Aldosary et al., 2012; Morris and Crane, 2013; Razmi et al., 2017; D'Oria et al., 2018). In addition, the study by García‐Esquinas et al. (2021) was not considered because it only reported on ‘weakness’, without other signs and symptoms of selenium toxicity (Annex E).
When studies characterised selenium intake by measuring plasma/serum selenium concentration, an estimate of the corresponding selenium intake is provided, applying the prediction equation described in Section 3.3.2.
Intervention studies
Five RCTs in adults provided data on signs and symptoms of selenium toxicity collected as part of the monitoring of adverse events (Appendix D.1.1).
In the Selenium and Vitamin E Cancer Prevention Trial (SELECT) in the US (Lippman et al., 2009), 8,752 healthy men, ≥ 50 years of age, received 200 μg/day selenium from SeMet and 8,696 were given placebo for a median duration of 5.5 years. Mean baseline serum selenium concentrations were around 135 and 138 μg/L in the selenium and the placebo group, respectively (this corresponds to an estimated selenium intake of around 130 μg/day which is higher than what is typically observed in European populations) and reached 252 and 140 μg/L, respectively, after 4 years of follow‐up. The primary endpoint of the study was the incidence of prostate cancer, while prespecified secondary endpoints included lung, colorectal, and other cancers as well as deaths, and cardiovascular events. Adverse events were reported by the participants every 6 months during a study site visit (or a substitute phone call). Staff specifically queried about the following events: alopecia, dermatitis, fatigue, halitosis, nail changes and nausea. The National Cancer Institute Common Toxicity Criteria (version 2) were used for the grading of alopecia, nail changes, fatigue and nausea, 17 while halitosis and dermatitis were graded according to the study protocol. 18 The side effects reported in the paper were the worst grade that study participants experienced over the course of the trial.
The risk of developing alopecia was significantly increased in the selenium group (RR 1.28; 99% CI 1.01, 1.62). There was a slight increase in risk of developing nail changes when compared with placebo (selenium group: RR 1.04; 99% CI 0.94, 1.16). The risks of developing dermatitis, halitosis, fatigue grades 1–2 and nausea grades 1–2 were also higher in the selenium group, i.e. dermatitis grades 1–2 (RR 1.17; 99% CI 1.00, 1.35), dermatitis grades 3–4 (RR 1.74; 99% CI 0.56, 5.44), halitosis (RR 1.17; 99% CI 0.99, 1.38), fatigue grades 1–2 (RR 1.09; 99% CI 0.95, 1.26) and nausea grades 1–2 (RR 1.19; 99% CI 0.94, 1.52). Loss to follow‐up, defined as last contact data > 24 months before analysis, was < 5%. The Panel notes that this study shows an increased risk of developing alopecia at selenium intakes of around 330 μg/day compared with selenium intakes of 130 μg/day. Increased risks for other features associated with selenium toxicity were also observed.
Algotar et al. (2013b) reported the evaluation of adverse effects in the Negative Biopsy Trial (NBT) in the US, in which adult men, selected as being at increased risk of prostate cancer, were randomly assigned to receiving a placebo or doses of 200 μg/day selenium or 400 μg/day selenium as Se‐yeast (sample size around 230 individuals per group at baseline). Mean baseline plasma selenium concentrations were 126 μg/L (this corresponds to an estimated selenium intake of around 110 μg/day). Collection of adverse event data was performed at each study visit (every 6 months). The median duration of follow‐up was about 3 years in all groups. The occurrence of ‘brittle nail and hair’ was 11.2%, 10.3% and 8.6% in the respective groups. The authors clustered the outcomes ‘garlic breath’ and ‘liver/kidney function test abnormality’ and reported an occurrence of 6.0%, 5.6% and 4.7%, respectively, for this composite outcome. The study dropout was around 45%.
In the Danish PREvention of Cancer by Intervention with Selenium (DK PRECISE) study, healthy participants were randomised to receive 100, 200 and 300 μg/day selenium as Se‐yeast intended for 5 years (sample size around 120 individuals per group). Median plasma baseline concentration was 85 ng/g (equivalent to around 87 μg/L corresponding to an estimated selenium intake of around 50 μg/day). The authors reported that 25 individuals stopped the study early mainly because of ‘hair loss, skin reactions, and grooved nails’ and that ‘these were equally associated with selenium and placebo and were independent of selenium dose’ (Winther et al., 2015). The study flow chart documents 3, 2, 1 and 2 ‘adverse events’ and 3, 0, 2 and 2 ‘adverse effects’ in the groups receiving the placebo, 100, 200 or 300 μg/day selenium, respectively, during the first 6 months of intervention; and 2, 11, 10 and 4 ‘adverse events’ and 3, 5, 6 and 4 ‘adverse effects’ from 6 months after the initiation of the trial until its conclusion. However, no definition of ‘adverse events’/’adverse effects' and no description of the method used for their monitoring are provided in the article. The % drop‐out during the trial was 28%, 27%, 27% and 24% in the respective groups.
For the Selenium and Celecoxib (Sel/Cel) trial in the US, in which participants with a history of colorectal adenoma received 200 μg/day selenium as Se‐yeast or a placebo for a median duration of 3 years, Thompson et al. (2016) reported a hazard ratio (HR) of 0.86 (95% CI 0.53, 1.39) for developing ‘brittle hair and/or nails’ in the selenium group (30 events/908 participants) compared with the placebo group (35 events/912 participants). The method to monitor these events is not described in the article. Median baseline plasma selenium concentrations were around 135 μg/L (corresponding to an estimated selenium intake of around 126 μg/day).
Finally, the intervention study by Fairris et al. (1989) involved psoriasis patients in the US, who consumed 600 μg/day selenium as Se‐yeast supplement (n = 22), a combination of 600 μg/day selenium as Se‐yeast and 600 IU of vitamin E (n = 23) or a placebo (n = 24) for 12 weeks. The patients were followed up at weeks 2, 4, 8 and 12 of supplementation and again 12 weeks after supplementation stopped. On each occasion, the following symptoms were sought by direct questioning: ‘garlic breath’, ‘nausea’, ‘vomiting’, ‘loss of nails’ and ‘alopecia’. The authors report that no signs and symptoms of selenium toxicity occurred in the study, but results are not shown in the publication.
The Panel notes that one RCT shows an increased risk of alopecia and other features of selenium toxicity at a total dietary selenium intake of around 330 μg/day compared with an intake of around 130 μg/day. This finding was not corroborated in three other RCTs. However, they had a much smaller sample size and no or partial reporting on how the reported signs and symptoms were defined and monitored.
Cross‐sectional studies
In addition to the cross‐sectional study by Yang et al. (1989a), three cross‐sectional studies investigated signs and symptoms of selenium toxicity in populations living in seleniferous areas, in Brazil, India and the US. In addition, one cross‐sectional study investigated signs and symptoms of selenium toxicity in schoolchildren enrolled in a public health programme in which Brazil nuts, which naturally have a high selenium content, were distributed to pre‐school children.
Lemire et al. (2012) reported on a cross‐sectional study in 407 individuals (aged 15–87 years) living in the Brazilian Amazonas who had a large variation in selenium intake, as reflected in plasma selenium concentrations that were between 50 and 950 μg/L (median 135 μg/L). Individuals were classified according to their plasma selenium levels, i.e. < 328 μg/L (n = 360), ≥ 328 to < 520 μg/L (n = 15) and ≥ 520 μg/L (n = 11). A trained nurse performed an examination of the clinical dermal signs of selenium toxicity (hair, body hair, fingernails, toenails and skin) and garlic odour breath. Individual signs on fingernails and toenails specific for selenosis (e.g. longitudinal or transversal streaks, darkening, discoloration, symmetric thickening and stratifying) were detected in up to 8 individuals (2.2%) of those with plasma selenium levels < 328 μg/L and in up to 2 individuals (7.7%) of those with levels ≥ 328 μg/L. In the groups with levels ≥ 328 μg/L, the effect was limited to darkening of toenails and to longitudinal streaks on fingernails, while other symptoms did not occur in this groups. Dry and brittle hair, sparse head hair and body hair occurred respectively in 2 (0.6%), 21 (6%) and 163 (45%) individuals with the lowest plasma selenium levels, and in 0, 1 (4%) and 13 (50%) individuals in the groups with higher selenium levels. The Panel notes that the higher intake groups were small and may have not allowed the detection of individuals with specific symptoms.
In the study by Chawla et al. (2020), 680 adult residents living in a seleniferous area in Punjab, India, were examined for signs of selenosis, including: ‘pallor’, ‘hair abnormalities’, ‘nail abnormalities’, ‘garlic odour’, ‘oedema’ and ‘dermatitis’. For 238 individuals, serum selenium concentrations were available. Nail and hair abnormalities occurred in more than half of the population under investigation and at median serum concentrations of around 250 μg/L compared with around 155 μg/L in those without abnormalities, but there was a wide overlap in serum selenium concentration between individuals with and without abnormalities. There was an increased risk of hair and nail abnormalities as well as garlic odour, but not pallor and dermatitis, at serum selenium concentrations above the study population median of 171 μg/L (odds ratio (OR)) adjusted for age, sex and socio‐economic status: nail abnormalities OR 2.1 (95% CI 1.2, 3.5); hair abnormalities OR 1.6 (0.9, 2.7); garlic odour OR 3.45 (0.59, 20.34); pallor OR 0.57 (0.13, 2.50); dermatitis OR 0.81 (0.21, 3.19).
A cross‐sectional study in children living in the Brazilian Amazonas (Martens et al., 2015) included 41 children from a public preschool (age range around 2–6.5 years) who had received as part of a public health programme 15 to 30 g of Brazil nuts 3 days per week and a control group of 88 children who had not received Brazil nut–enriched meals. Children who had received Brazil nuts consumed on average 155 μg/day selenium, an intake that is above the UL of 60 and 90 μg/day for 1‐ to 3‐ and 4‐to 6‐year‐old children, and those who had not consumed the nuts around 44 μg/day, based on the analysis of duplicate food portions. The paper reports that, upon clinical examination of the children by a doctor, ‘no signs of selenosis were observed in either group’.
Case reports
A case of selenosis in a 55‐year‐old woman has been reported by Senthilkumaran et al. (2012). The woman had consumed 10–15 paradise nuts per day for 20 days and her serum selenium concentration was 512 μg/L. She presented with headaches, dizziness, vomiting, abdominal pain, massive alopecia and greyish discoloration of the fingernails. Two months after the end of the exposure her hair restarted to grow.
Conclusions
The Panel notes that signs and symptoms of selenium toxicity have been observed at average intakes below those that have been reported by Yang et al. (1989a) to be associated with selenosis and which have been used by the SCF (2000a) to establish the NOAEL. However, the number of studies available is limited and there seems to be a wide variability in the susceptibility of individuals to selenium toxicity. Nail and hair changes were visible at a median serum concentration of 250 μg/L in one cross‐sectional study among residents living in a seleniferous area in India (Chawla et al., 2020). Another cross‐sectional study among individuals living in the Brazilian Amazonas reports on signs of selenium toxicity at plasma selenium levels < 328 μg/L in 2.2% of individuals; such signs were not consistently present in groups with higher plasma levels, but these included less than 15 participants (Lemire et al., 2012). A case report describes overt selenosis at serum selenium concentration of 512 μg/L (Senthilkumaran et al., 2012). Finally, there is evidence from a large RCT (SELECT; Lippman et al., 2009) in around 8,700 men (age ≥ 50 years) that average selenium intakes of 330 μg/day for a median of 5.5 years (around 130 μg/day from background diet plus 200 μg/day from supplements) increase the risk of developing features of selenium toxicity, such as alopecia and dermatitis. This finding was not corroborated in three other smaller RCTs at similar or higher levels of selenium intake (Algotar et al., 2013b; Winther et al., 2015; Thompson et al., 2016); however, the latter provide limited information on the method used to identify adverse events and may have lacked sufficient power to detect such effects (sample size in intervention arms between 22 and 900 participants).
The Panel considers that available studies provide evidence that signs and symptoms of selenium toxicity occur at selenium exposures below the previously identified NOAEL of 850 μg/day; thus, the NOAEL needs to be revisited.
None of the studies published after Yang et al. (1989a) and investigating selenium toxicity at selenium exposures below 850 μg/day allow the derivation of a NOAEL.
There are indications from the SELECT (Lippman et al., 2009), a large RCT, that the risk of developing features of selenium toxicity is increased when individuals with baseline selenium intake around 130 μg/day are supplemented with 200 μg/day.
The Panel considers that, from available evidence from intervention and observational studies, a LOAEL of 330 μg/day can be identified from the SELECT.
3.5.2.3. Identification of biomarkers of effect
In line with the protocol and the Guidance on ULs (EFSA NDA Panel, 2022), a biologically based model for establishing ULs was investigated. Markers that could be indicative of when selenium homeostasis is becoming overwhelmed and key tissues and organs are becoming functionally and structurally affected, as the systemic load of the nutrient increases, were explored. Fundamental to this are the recognition of the components of homeostasis and adaptation, and of early evidence of adaptation failing. In that context, excretion of selenium metabolites, markers of liver dysfunction or damage, and haematological parameters have been examined as potential markers of excess selenium intake through the systematic review of the evidence. The selection of these markers have been identified a priori in the protocol, based on expert knowledge (Annex A).
Excretion of selenium metabolites
The excretion of DMSe in breath and TMSe in urine has been proposed to reflect processes that aim at minimising selenium accumulation in the body outside the regulated pool (Burk and Hill, 2015). Notably, as described in Section 3.2, TMSe excretion is influenced by a polymorphism in the INMT gene, which characterises individuals as eliminators or non‐eliminators of TMSe, and eliminators may excrete TMSe in urine at usual dietary selenium intakes (Lajin and Francesconi, 2016).
TMSe excretion in urine
A total of nine eligible studies, i.e. seven intervention studies (Sun et al., 1987; Robinson et al., 1997; Janghorbani et al., 1999; Kuehnelt et al., 2005; Kuehnelt et al., 2007; Jäger et al., 2016a,b) and two cross‐sectional studies (Yang et al., 1989b; Kuehnelt et al., 2015) have been identified.
Yang et al. (1989b) reported a positive linear relationship between TMSe excretion and 24‐h total urinary selenium excretion (log–log scale) in 37 males living in a seleniferous area in China (TMSe‐eliminator status not determined). Janghorbani et al. (1999) observed a non‐linear relationship between TMSe as a fraction of total urine selenium and urinary selenium excretion with increasing selenium supplementation, in 10 adult males (TMSe‐eliminator status not determined) living in a seleniferous area in China with daily selenium intakes of 197 to 1,230 μg who were moved to a low selenium area and reduced their selenium dietary intake to 43 μg/day.
In the intervention studies in which selenium was administered at doses of 50 μg selenate (Jäger et al., 2016a), 200 μg selenite or 100 μg Se‐yeast (Jäger et al., 2016b), TMSe non‐eliminators did not excrete TMSe in detectable amounts, while TMSe‐eliminators all excreted TMSe regardless of supplementation. In the cross‐sectional study by Kuehnelt et al. (2015), Andean women (mean ± SD whole blood selenium 180 ± 20 μg/L) characterised as TMSe non‐eliminators (TMSe excretion < 4% of total urinary selenium), excreted on average 0.35% of total urinary selenium as TMSe, versus 11% in eliminators. In a Bangladeshi women population (mean whole blood selenium 114 μg/L (SD not reported)), TMSe non‐eliminators excreted on average 0.4%–1% of total urinary selenium as TMSe, while eliminators excreted 13%–24% (Kuehnelt et al., 2015).
In three intervention studies in which TMSe‐eliminator status was not characterised, the following results were obtained. In the first trial, at doses of 1,000 μg selenium provided as selenite, L‐SeMet, or DL‐SeMet, no TMSe in urine was detected (Kuehnelt et al., 2005). In the second, urinary excretion of TMSe as a fraction of total urinary selenium metabolites was below 0.5% for supplementation doses of 197, 3,395 and 5,592 μg selenium as selenite (Sun et al., 1987). In the third, only one out of five cancer patients excreted TMSe in significant amounts after supplementation (8,000 μg/day selenium as SeMet for 7 days plus 4,000 μg/day for 21 days) (Kuehnelt et al., 2007). A notable observation from two studies (Robinson et al., 1997; Kuehnelt et al., 2007) was that metabolites other than TMSe became more prominent in urine with increasing selenium intakes.
The Panel notes that the available data do not allow a threshold to be determined below or above which TMSe concentrations in urine could be used as an indicator of selenium overload either in TMSe‐eliminators or in non‐eliminators.
DMSe exhalation in breath
Five eligible studies, i.e. three intervention studies (Serwin et al., 2003; Reid et al., 2004; Kremer et al., 2005) and two cross‐sectional studies (Lemire et al., 2012; Chawla et al., 2020), investigated DMSe exhalation in breath. As described in Section 3.2 DMSe exhalation in breath, leading to a garlic odour in breath, may occur when the capacity of the lungs to convert DMSe into TMSe is exceeded. It is affected by the same polymorphism in the INMT gene that also affects TMSe production.
In the RCT by Reid et al. (2004), men with biopsy‐proven prostate cancer were randomised to consume either 1,600 μg/day (n = 8) or 3,200 μg/day (n = 16) Se‐yeast (amount of selenium in Se‐yeast not reported) for an average of about 12 months. Supplementation was stopped when plasma selenium had reached 1,000 μg/L. Selenium toxicity symptoms were monitored throughout the study and plasma selenium levels at the time when symptoms were reported were documented. Garlic breath was observed in six individuals in the 3,200‐μg group and none in the 1,600‐μg group. It appeared on average at a plasma selenium level of around 155 μg/L (SD 222; read from graph).
Kremer et al. (2005) analysed breath samples of a healthy male volunteer using cryotrapping–cryofocussing–gas chromatography–inductively coupled plasma–time of flight mass spectrometry. Following the ingestion of 300 μg 77Se given as selenite, isotopically labelled selenium in DMSe appeared in breath 15 min after ingestion with the highest concentration reached after 90 min (1.4 ng/L). After 20 days, labelled selenium was still excreted in breath.
In an RCT (Serwin et al., 2003), 22 patients with active plaque psoriasis received either 200 μg/day selenium as SeMet or placebo for 4 weeks. Every 2 weeks patients were asked to report symptoms of selenium toxicity, including garlic breath. None of the patients reported the development of garlic odour in breath.
Lemire et al. (2012) reported on a cross‐sectional study in 407 individuals living in the Brazilian Amazonas with a large variation in selenium intake. Individuals were classified by plasma selenium levels, i.e. < 328 μg/L (n = 360), ≥ 328 to < 520 μg/L (n = 15) and ≥ 520 μg/L (n = 11). Garlic breath occurred in around 16% of individuals in the group with plasma selenium concentrations < 328 μg/L, in 20% of individuals in the group with plasma selenium concentrations ≥ 328 to < 520 μg/L and in 10% of individuals in the group with the highest plasma concentrations.
In the cross‐sectional study by Chawla et al. (2020), described above, garlic odour occurred in eight of 238 individuals. Those individuals had median serum selenium concentrations of 404 μg/L (IQR 212–600 μg/L), while individuals with no detectable garlic odour had concentrations of 165 μg/L (111–392 μg/L). In two individuals, garlic odour was noticeable at serum selenium concentrations below the median of 171 μg/L.
The Panel notes that DMSe production is affected by the same polymorphism that also affects TMSe excretion. Contrary to TMSe, DMSe is not exhaled in breath to a significant extent if a certain threshold of selenium intake is not exceeded, at least not to an extent that a change in breath odour is noticeable. This threshold is likely to have a large interindividual variability, in particular owing to the polymorphism that influences DMSe production. In addition, in most of the studies, garlic odour was self‐reported and not assessed in a standardised manner.
Other selenium metabolites
The metabolome of selenium includes selenosugars (Figure 3, Section 3.2), which are one of the forms in which of selenium is excreted in urine. There is indication from animal experiments that hexose conjugation of selenium may occur as an early parallel feature of homeostasis rather than as a pathway recruited for selenium excretion when methylation becomes less effective (Katarzyna et al., 2020).
The Panel, however, notes that selenosugars have not been explored yet in humans as candidate markers of actual or potential excess selenium intake.
Markers of liver function
The liver is one of the target organs for selenium toxicity. In hepatocyte models, early features involve increased accumulation of selenides with oxidative damage (Section 3.5.1). Markers of liver dysfunction and damage have been observed in livestock and animal models. In rodents, liver cirrhosis is a common effect of chronic selenium excess exposure. Although less commonly observed in domestic animals (horses, cattle and swine), focal necrosis of the liver can be observed in advanced cases of chronic selenosis in these animals (ATSDR, 2013; Alexander, 2022).
In its previous assessment, the SCF (2000a) noted hepatic effects in humans manifested by an increased prothrombin time, attributed to impaired synthesis of coagulation factors in the liver, which was observed at dietary intakes at and above 850 μg/day selenium in the cross‐sectional study in seleniferous areas of China reported by Yang et al. (1989a). The SCF (2000a) further noted that in a study by Longnecker et al. (1991) in areas of high selenium intake in the US, the concentration of the liver enzyme ALT in serum, although within the reference range, showed a correlation with selenium intake, but this was not considered to be clinically significant; no effect on prothrombin time was seen in that study. The SCF (2000a) noted that the US population studied covered a lower range of selenium intake than the Chinese study and, considering mean body weights, it is also likely that the intake per kg body weight was greater in the Chinese study, in comparison with the US study. No other evidence of adverse effects of selenium intake on liver was reported in the SCF assessment (SCF, 2000a).
For the present assessment, data were collected to systematically investigate human evidence of an effect of ‘high’ selenium dietary intake on liver function.
A total of 11 pertinent human studies were retrieved, i.e. two intervention studies (Välimäki et al., 1991; Reid et al., 2004) and nine cross‐sectional studies (Yang et al., 1989a; Longnecker et al., 1991; Ruhl and Everhart, 2003; Petrovski et al., 2012; Yang et al., 2016; Loomba et al., 2020; Wu et al., 2020; Isobe et al., 2021; Wang et al., 2021).
In an intervention study in which high doses of Se‐yeast (i.e. 1,600 μg/day selenium (n = 8) and 3,200 μg/day selenium (n = 16)) were administered to patients with a diagnosis of prostate cancer without other active treatment for 1 year, markers of liver function remained within the normal range, i.e. alkaline phosphatase (ALP) (43.5–111.2 U/L), ALT (11.9–27.3 U/L), aspartate aminotransferase (AST) (13.3–29.1 U/L), albumin (3.8–4.7 g/dL) and total bilirubin (< 1.2 mg/dL); however, ALP and bilirubin levels were increased at 6 and 12 months of intervention in the 3,200 μg/day group (i.e. ALP 84 vs 65 U/L and bilirubin 0.59 vs 0.38 mg/dl at 12 months intervention) (Reid et al., 2004). In the other intervention study, in a group of 8 healthy individuals who received 200 μg/day selenium as Se‐yeast, no changes were observed in the same markers of liver function, as well as in prothrombin time; an increase in bilirubin was observed in controls (from 9.1 ± 1.2 to 12.2 ± 1.4 μmol/L) but this was within the normal range (Välimäki et al., 1991).
In some cross‐sectional studies, positive correlations between markers of selenium exposure and ALT activity were observed. These studies had sample sizes between 93 and 8,550 individuals. Longnecker et al. (1991) observed an increase in ALT activity at dietary selenium intake 68–724 μg/day (β 19.7; 95% CI 8.65, 29.9; p < 0.05). Yang et al. (2016) investigated exposure levels of plasma selenium < 182 μg/L (quantile; Q1) vs > 247 μg/L (Q4) and observed elevated ALT (Q1 median (interquartile range; IQR): 14 (10–20) U/L vs Q4: 17 (12–23) U/L; p < 0.001). Wang et al. (2021) reported a 9.25 (95% CI 2.23, 16.76) percent higher ALT activity in quintile 5 (143–298 μg/L serum selenium) than in quintile 1 (58–115 μg/L). Isobe et al. (2021) reported a positive correlation between selenium exposure and log ALT activity (r 0.122 p < 0.001) in a population with mean ± SD serum selenium concentrations of 159 ± 28 μg/L, Ruhl and Everhart (2003) observed a slight increase in risk of having elevated ALT activity across deciles of serum selenium concentrations (overall range 39–425 μg/L) (OR 1.05; 95% CI 0.99, 1.12). A positive association between serum selenium concentrations and ALT activity was reported. For each 100 U/L higher ALT activity serum selenium concentrations were 0.007 μmol/L (95% CI 0.039, 0.195 μmol/L) higher (Petrovski et al., 2012). No correlation between selenium exposure and ALT activity was observed by Loomba et al. (2020) at serum selenium concentrations of 112–401 μg/L (r 0.043; 95% CI −0.085, 0.169). Loomba et al. (2020) did not observe correlations between hair and nail selenium concentrations and ALT. Most of the studies did not report sufficient details to establish whether the extent of increase in ALT activity was of biological relevance. In the study by Longnecker et al. (1991) in ranchers living in seleniferous areas of the US and corresponding controls it is reported that even though ALT was increased in those with higher selenium exposure, ALT levels were not outside the reference range. This observation is consistent with the results of the intervention studies.
Correlations between other markers of liver function and selenium exposure were less consistent. Yang et al. (1989a) observed a prolonged prothrombin time (defined as > 14 s) in 84 individuals in whom this was measured, in 45% of the population with whole blood selenium concentration > 1,000 μg/L, compared to only 2.7% individuals with the same observation with lower whole blood selenium concentrations. Longnecker et al. (1991) reported no relationship between dietary selenium intake and prothrombin time (βx 1,000 1.18; 95% CI −165, 173), and gamma‐glutamyl transferase (GGT) activity (β 2.36; 95% CI −27.5, 31.5) and an inverse association with ALP activity (β −28.3; 95% CI −59.0, 2.4). Loomba et al. (2020) reported no correlation between serum selenium and ALP activity (r 0.07; 95% CI −0.06, 0.19), as well as AST activity (r 0.09; 95% CI −0.04, 0.22) and albumin concentrations (r 0.04; 95% CI −0.09, 0.16). In other studies, a positive correlation was observed between selenium exposure and AST activity (Yang et al., 2016; Isobe et al., 2021). Isobe et al. (2021) found a relationship between selenoprotein P concentrations and log AST (r 0.14, p < 0.001) and Yang et al. (2016) between plasma selenium quartiles (Q1 < 181.6 μg/L, Q4 > 247.4 μg/L) and AST (median (IQR): Q1 20 (16–24), Q2 21(17–25), Q3 21 (18–26), Q4 (22 (19–27) U/L, p for trend < 0.001). A positive association was also found for selenium exposure and GGT (Yang et al., 2016; Isobe et al., 2021). Isobe et al. (2021) reported a correlation between selenoprotein P and log GGT of 0.2, p < 0.001. Yang et al. (2016) found a significant p for trend between serum selenium quartiles and GGT (median (IQR): Q1 19 (13–31), Q2 20 (14–32), Q3 21 (14–34), Q4 (22 (15–40) U/L, p for trend < 0.001). Petrovski et al. (2012) found no association between serum selenium in individuals without chronic liver disease and some markers of liver function (selenium concentrations per 100 Unit difference in the marker of liver function (GGT 0.004; 95% CI −0.019, 0.026 μmol/L; ALP −0.008; 95% CI −0.028, 0.013 μmol/L and albumin 0.059; 95% CI −0.042, 0.159 μmol/L). A negative association was observed for AST (−0.0121; 95% CI ‐0.235, −0.007 μmol/L) and the AST/ALT ratio (−0.095; 95% CI −0.123, −0.069 μmol/L). Finally, Wu et al. (2020) reported a positive linear relationship between quintiles of dietary selenium intake (Q1 ≤ 21.3 μg/1,000 kcal,Q5 ≥ 31 μg/1,000 kcal) and non‐alcoholic fatty liver disease (NAFLD), diagnosed based on imaging or histological evidence of hepatic steatosis, in the absence of specific aetiologies and no heavy alcohol consumption (prevalence of NAFLD Q1 31.6%, Q2 35.3%, Q3 37.2%, Q4 37.6%, Q5 42.3%, p < 0.001). Markers of liver function were not measured in this study.
The Panel notes that animal models indicate that the liver is one of the target organs for selenium toxicity and that data in humans provide indications that excess selenium intake may affect liver function. However, the Panel considers that available data in humans are limited and insufficient to inform the identification of a reference point that could be used to establish an UL for selenium.
Haematological parameters
Six eligible studies that reported on the relationship between selenium exposure and haematological parameters were retrieved, i.e. two intervention studies (Fairris et al., 1989; Hawkes et al., 2001) and four cross‐sectional studies (Yang et al., 1989a; Longnecker et al., 1991; Larvie et al., 2019; Loomba et al., 2020).
In the cross‐sectional study by Yang et al. (1989a), an increase in WBC counts was observed in individuals with increasing selenium consumption up to around 1,400 μg/day through their habitual diet (low selenium group, 25 men (mean selenium intakes around 60–70 μg/day): mean ± SE WBC counts 8,216 ± 469/mm3, medium selenium group, 23 men (mean selenium intakes around 200 μg/day): 9,104 ± 695/mm3, high selenium group, 28 men (mean selenium intakes around 1,200–1,400 μg/day): 10,004 ± 403/mm3).
A decrease in WBC counts by 5% was observed in a group of 5 men who consumed a diet containing about 300 μg/day selenium (baseline vs end mean ± SD 6,100 ± 1,300 vs 5,800 ± 1,400/mm3) for 99 days compared to 6 men who consumed a diet containing about 15 μg/day selenium and in whom WBC counts increased by 10% (4,100 ± 750 vs 4,500 ± 760/mm3) (Hawkes et al., 2001) while in another intervention study involving 69 psoriasis patients, 600 μg/day selenium supplementation for 12 weeks did not affect WBC counts (results not shown in the publication) (Fairris et al., 1989).
In two other studies in a seleniferous area of India (median (IQR) serum selenium concentration 171 (111–400) μg/L among 238 individuals) (Loomba et al., 2020) and in the US (median (range) serum selenium concentration 2.33 (1.56–4.60) μmol/L among 142 individuals) (Longnecker et al., 1991), no relationship was found between selenium intake and WBC counts. The correlation coefficients (95% CI) between serum selenium concentrations and WBC counts in the study by Loomba et al. (2020) was 0.08 (−0.04, 0.21). Longnecker et al. (1991) reported a regression coefficient (95% CI) of −10.2 (−42.5, 22.0) between dietary selenium intake (range 68–724 μg/day) and WBC counts.
No relevant findings were reported for other haematological parameters (haemoglobin concentrations, haematocrit, RBC and platelet counts) in these studies.
Conclusion
Overall, the Panel considers that there is no valid marker that is predictive of a risk of selenium excess and potential toxicity, or biomarker of effect, which can be used to establish an UL for selenium.
3.5.3. Hypertension
This section and the followings follow the approach for hazard identification that is outlined for sQ2 (Section 2.2.2.3).
For the risk of hypertension, incidence of hypertension is included in the standalone main LoE and changes in systolic blood pressure (SBP) and/or diastolic blood pressure (DBP) are included in the standalone surrogate LoE.
3.5.3.1. Intervention studies
No eligible intervention studies were retrieved which assessed the effect of selenium supplementation on the incidence of hypertension.
LoE2. Standalone surrogate: Changes in systolic blood pressure and/or diastolic blood pressure
Preliminary UA
One eligible RCT was retrieved, which involved healthy adult males and females in Spain (Navas‐Carretero et al., 2011) and aimed at investigating in normo‐ and overweight adults the effect of integrating selenium‐enriched chicken in the diet on body composition, lipid profile, glucose metabolism and antioxidant status. The intervention group received a controlled diet with selenium‐enriched chicken (22 μg/day selenium supplementation; n = 11) and the control group received non‐enriched chicken (n = 13) for 10 weeks. No effect of the intervention was found on blood pressure levels (Appendix D.2.1).
The Panel notes the limited BoE from intervention studies. No comprehensive UA is performed.
3.5.3.2. Observational studies
LoE1. Standalone main: Incidence of hypertension and LoE2. Standalone surrogate: Changes in systolic blood pressure and/or diastolic blood pressure
The relationship between dietary selenium intake and risk of hypertension was investigated in three prospective cohort studies (Flemish Study on Environment, Genes and Health Outcomes (FLEMENGHO) Nawrot et al., 2007; The Selenium and Cognitive Decline study Su et al., 2016; Bangladesh Vitamin E and Selenium Trial (BEST) Bulka et al., 2019). Bulka et al. (2019) and Su et al. (2016) defined hypertension cases as SBP ≥ 140, DBP ≥ 90 mmHg, and/or use of antihypertensive medication, and/or self‐reported physician‐diagnosed hypertension, while Nawrot et al. (2007) defined ‘high blood pressure’ cases as SBP ≥ 130 or DBP ≥ 85 mmHg or use of antihypertensive medication. Three additional prospective cohort studies (Programming Research in Obesity, Growth Environment and Social Stress (PROGRESS) Kupsco et al., 2019; Prospective Urban and Rural Epidemiology (PURE) Swart et al., 2019; RHEA, Howe et al., 2021) reported on the relationship of dietary selenium intake with blood pressure levels.
Preliminary UA
Two studies investigated the association between exposure to various metals, including selenium, in pregnant women and blood pressure in their child (PROGRESS (544 mother–child pairs in Mexico; children aged 4–6 years at follow up), RHEA (176 mother–child pairs in Greece; children aged 11 years at follow up)). Exposure was assessed as selenium concentrations in maternal whole blood in PROGRESS and maternal urine in RHEA.
The four other prospective cohort studies involved adult males and females. The size of the cohorts ranged between 255 participants (BEST) and 719 participants (FLEMENGHO), and the length of follow‐up ranged between 2.5 years (Selenium and Cognitive Decline study) and 10 years (PURE). Cohorts were located in Belgium, China, Bangladesh and South Africa. Exposure was assessed in whole blood (BEST, PROGRESS), serum (PURE) or nail (Selenium and Cognitive Decline study).
The evidence table is in Appendix D.2.2. Key study characteristics, together with the risk estimates and related CIs, are plotted in Figures 8 and 9 for incidence of hypertension and change in blood pressure, respectively.
Figure 8.

Observational studies investigating the effect of selenium on the incidence of hypertension
-
*Denotes hypertension definition different from other studies.BD: Bangladesh; BE: Belgium; BEST Bangladesh Vitamin E and Selenium Trial; B‐Se: blood selenium; CI: confidence interval; CN: China; FLEMENGHO: Flemish Study on Environment Genes and Health Outcomes; FM: females and males; N‐Se: nail selenium; NR: not reported; P/S‐Se: plasma/serum selenium, Q: quantile; SD: standard deviation; y: years.
Figure 9.
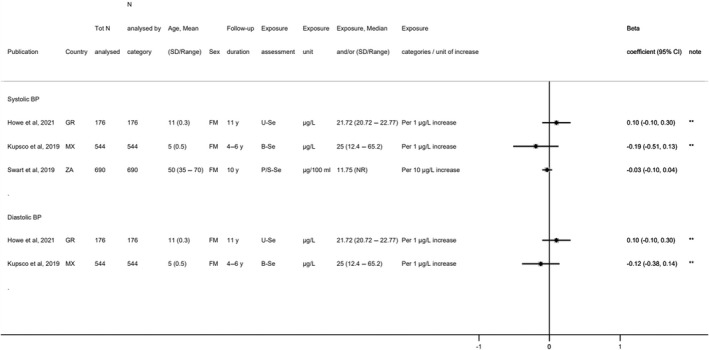
Observational studies investigating the effect of selenium on continuous measures of blood pressure
-
*Denotes estimated annual changes in blood pressure; **denotes mother–child pair studies where exposure was analysed in the mothers and outcome in their child; the age of children is shown.BD: Bangladesh; BP: blood pressure; B‐Se: blood selenium; CI: confidence interval; FM: females and males; GR: Greece; MX: Mexico; SD: standard deviation; U‐Se: urinary selenium; ZA: South Africa; y: years.
The Panel notes that available observational studies are small and heterogeneous in terms of population characteristics (age, country) and biomarkers of selenium exposure.
Inconsistent results were found in the two mother–child pair studies investigating prenatal exposure to various metals, including selenium, and blood pressure in the child (Kupsco et al., 2019; Howe et al., 2021) (Figure 8).
Among the prospective cohorts of adults, one study reported a positive association between nail selenium concentrations and incidence of hypertension in an elderly Chinese population (Su et al., 2016). This is not supported by the other available studies (Nawrot et al., 2007; Bulka et al., 2019; Swart et al., 2019) (Figures 8 and 9).
The Panel considers that the available BoE from observational studies does not suggest a positive relationship between dietary intake of selenium and risk of hypertension over the range of exposure investigated in these studies. No comprehensive UA is performed.
3.5.3.3. Overall conclusions on hypertension
The Panel considers that the available BoE does not suggest a positive relationship between dietary intake of selenium and risk of hypertension.
3.5.4. Alzheimer's dementia
Incidence of Alzheimer's dementia is included in the standalone main LoE.
3.5.4.1. Intervention studies
LoE1. Standalone main: Incidence of Alzheimer's dementia
Preliminary UA
When developing the protocol for this assessment (Annex A), the Panel noted one prospective cohort study in Italy, in which higher amounts of selenate, but not of other selenium species or of overall selenium, in cerebrospinal fluid in 56 subjects with mild cognitive impairment were associated with an increased risk of developing Alzheimer's dementia (Vinceti et al., 2017a).
One eligible study was identified as the result of the literature search, which reported on an observational follow‐up of an intervention study.
The Prevention of Alzheimer's Disease by Vitamin E and Selenium (PREADViSE) trial, ancillary to the SELECT (Kryscio et al., 2017) began as a double‐blind RCT recruiting 7,540 non‐demented individuals in the US and transitioned into an observational cohort study upon cessation of the intervention (4,271 participants of the original sample agreed to remain in the study). The study included groups which received selenium supplementation (200 μg/day) or a placebo for a median duration of 5.5 years and aimed at determining the effect of the intervention on dementia. A HR for dementia incidence of 0.83 (95% CI 0.61, 1.13) was estimated for the selenium arm compared to placebo (see evidence table in Appendix D.3.1).
The Panel considers that the available BoE from RCTs does not suggest a positive relationship between dietary intake of selenium and risk of Alzheimer's dementia at the intake level investigated. No comprehensive UA is performed.
3.5.4.2. Observational studies
No eligible observational study was retrieved. The study by Vinceti et al. (2017a) described above was not included in the current risk assessment, because selenium in cerebrospinal fluid was not among the eligible biomarkers of exposure.
3.5.4.3. Overall conclusions on Alzheimer's dementia
The Panel considers that the available BoE does not suggest a positive relationship between dietary selenium intake and risk of Alzheimer's dementia.
3.5.5. Amyotrophic lateral sclerosis
The incidence of ALS is included in the standalone main LoE.
3.5.5.1. Intervention studies
No eligible intervention study was retrieved.
3.5.5.2. Observational studies
LoE1. Standalone main: Incidence of amyotrophic lateral sclerosis
Preliminary UA
Two prospective cohort studies investigated the association between selenium exposure and the risk of ALS. The evidence table is in Appendix D.4.1.
One prospective cohort study (Rivalta cohort in Italy) investigated the risk for ALS associated with high exposure to selenium through contaminated water. ‘Exposed’ individuals consumed water with a selenium content of 8–10 μg/L while the ‘unexposed’ cohort consumed water with selenium content < 1 μg/L. Over a total follow‐up of 29 years, the incidence rate ratio (IRR) was 2.8 (95% CI 1.3, 6) for the exposed vs unexposed cohorts, with higher IRR observed in women (5.1; 95% CI 1.8, 14.3) than men (1.7; 95% CI 0.5, 5.4) (Vinceti et al., 2019).
One NCC within the European Prospective Investigation into Cancer and Nutrition (EPIC) cohort (France, Germany, Greece, Italy, the Netherlands, Spain, UK) investigated the association between blood selenium concentration and ALS mortality over a median follow up of 8.1 years. An OR of 1.21 (95% CI 0.65, 2.25) was estimated, comparing the highest (> 123 ng/g) vs lowest (≤ 104 ng/g) tertiles of selenium in RBCs (Peters et al., 2021).
The Panel notes the limited BoE from observational studies. The Panel considers that the available BoE is insufficient to conclude on a positive relationship between dietary intake of selenium and risk of ALS. No comprehensive UA is performed.
3.5.5.3. Overall conclusions on amyotrophic lateral sclerosis
The Panel considers that the available BoE is insufficient to conclude on a positive relationship between dietary intake of selenium and risk of ALS.
3.5.6. Functional neuropsychological development in children
For the impairment of functional neuropsychological development in children, measures of functional neuropsychological development are included in the standalone main LoE.
3.5.6.1. Intervention studies
No eligible intervention study was retrieved.
3.5.6.2. Observational studies
LoE1. Standalone main: measures of neuropsychological development
A total of 11 eligible prospective observational studies reported in 13 publications were retrieved. All studies investigated the association between prenatal selenium exposure and functional neurodevelopmental outcomes in children (Skröder et al., 2015; Kippler et al., 2016; Polanska et al., 2017; Skröder et al., 2017; Tatsuta et al., 2017; Varsi et al., 2017; Amorós et al., 2018a,b; Močenić et al., 2019; Calamandrei et al., 2020; Castriotta et al., 2020; Doherty et al., 2020; Li et al., 2020a). Two studies also assessed selenium biomarkers of exposure in children after birth (Skröder et al., 2017; Doherty et al., 2020).
Preliminary UA
The study size varied from 114 to 1,408 mother–child pairs. Cohorts were located in Europe (Croatia, Spain, Greece, Italy, Norway, Poland, Slovenia), Asia (Bangladesh, China, Japan) and in the US. Maternal selenium exposure was assessed during pregnancy (mostly at 1st or 3rd trimester) or at delivery, and children's functional neurodevelopment was assessed at different ages ranging from 6 months to 10 years. Maternal selenium exposure during pregnancy was assessed through selenium concentrations in RBCs, serum/plasma, urine and toenails, and at delivery through maternal whole blood or cord blood content. The neurodevelopment tests used included different editions (I–III) of the Bayley Scales of Infant Development (BSID), the McCarthy Scales of Children's Abilities (MSCA), the Kyoto Scale of Psychological Development (KSPD), the Ages and Stages Questionnaire (ASQ), the Wechsler Preschool and Primary Scale of Intelligence (WPPSI) and Wechsler Intelligence Scale for Children (WISC), the Social Responsiveness Scale 2nd edition (SRS‐2), and the Behaviour Assessment System for Children 2nd edition (BASC‐2), according to the developmental stage of the children involved in the studies. The evidence table is in Appendix D.5.1. Data on these outcomes are not plotted due to lack of comparability across studies.
In the birth cohort of the Spanish Childhood and Environment Project, an inverted U‐shaped relationship was found between maternal selenium status measured through plasma selenium during the 1st trimester of pregnancy and some domains of child neuropsychological development assessed at both 1 year of age (children's mental and psychomotor development scales of BSDI version II) and 5 years of age (verbal and global memory scales of the MSCA test) (Amorós et al., 2018a).
In the Northern Adriatic Cohort II in Italy (Castriotta et al., 2020), an inverted U‐shaped relationship was observed between cord blood selenium concentrations and the cognitive development of children at 40 months of age, assessed by the BSID version III. In a dichotomous analysis, children who had low and high selenium concentrations in cord blood at birth had higher odds of falling in the first quintile of cognitive composite compared with those who had medium concentrations.
In a mother–child cohort in China (Li et al., 2020a), an inverted U‐shaped relationship between maternal urinary selenium excretion during the last month of gestation and mental and psychomotor development (BSDI version I) at 2 years was reported in girls, but not in boys.
The other studies reported no or positive associations between measures of selenium exposure and measures of neurodevelopment in children (Skröder et al., 2015; Kippler et al., 2016; Polanska et al., 2016; Skröder et al., 2017; Tatsuta et al., 2017; Varsi et al., 2017; Močenić et al., 2019; Calamandrei et al., 2020; Castriotta et al., 2020; Doherty et al., 2020; Li et al., 2020a). The Panel notes that, in most studies, non‐linearity was either not explored (Polanska et al., 2017; Tatsuta et al., 2017; Varsi et al., 2017; Močenić et al., 2019; Calamandrei et al., 2020; Castriotta et al., 2020; Doherty et al., 2020) or not observed (Skröder et al., 2015; Kippler et al., 2016).
The Panel notes that available observational studies are heterogeneous in terms of population characteristics (child age at assessment, country), selenium exposure assessments and methods used to assess children's neurodevelopment, which hampers comparisons between studies. Findings are inconsistent across studies and domains of cognitive and motor functions. However, some data suggest that there might be a relationship between ‘higher’ maternal selenium status and decreased functional neuropsychological development in the offspring. The Panel notes that these data are limited and subject to uncertainties related to the observational nature of these findings and further research is necessary.
The Panel considers that the available BoE from observational studies is insufficient to conclude on a relationship between ‘high’ dietary intake of selenium and impaired functional neuropsychological development in children. No comprehensive UA is performed.
3.5.6.3. Overall conclusions on functional neuropsychological development in children
The Panel considers that the available BoE is insufficient to conclude on a relationship between high dietary intake of selenium and impaired functional neuropsychological development in children.
3.5.7. Thyroid diseases
Incidence of thyroid diseases such as hypo‐ or hyperthyroidism or thyroid cancer, are included in the standalone main LoE. Measures of thyroid hormones are included in the standalone surrogate LoE.
3.5.7.1. Intervention studies
No eligible intervention studies were retrieved which assessed the effect of selenium supplementation on the incidence of thyroid disease.
LoE2. Standalone surrogate: changes in thyroid hormones
Nine eligible intervention studies were identified that investigated the relationship between dietary selenium intake and thyroid function as measured by changes in thyroid hormone concentrations. The supplemental doses ranged from 10 to 400 μg/day. Eight studies lasted less than 1 year (13 to 48 weeks) (Olivieri et al., 1995; Duffield and Thomson, 1999; Hawkes and Keim, 2003; Thomson et al., 2005; Hawkes et al., 2008; Rayman et al., 2008b; Thomson et al., 2009; Carvalho et al., 2015) and one study lasted 5 years (Winther et al., 2015).
Preliminary UA
The study size ranged from 12 to 501 participants. The studies included adult males and females, except for two studies that included only males (Hawkes and Keim, 2003; Hawkes et al., 2008). Most studies selected apparently healthy individuals and one study selected subjects treated for dyslipidaemia and hypertension (Carvalho et al., 2015). The studies were conducted in Brazil, Denmark, Italy, the UK, the US and New Zealand. Mean/median plasma selenium concentrations at baseline were between 62 and 118 μg/L across trials. The outcomes assessed included plasma levels of the thyroid hormones triiodothyronine (T3), thyroxine (T4) and thyroid‐stimulating hormone (TSH), as well as free triiodothyronine (FT3), free thyroxine (FT4) and T3:T4 ratio.
The evidence table is in Appendix D.6.1 Key study characteristics, together with the effect estimates and related CIs, are plotted in Figure 10.
Figure 10.
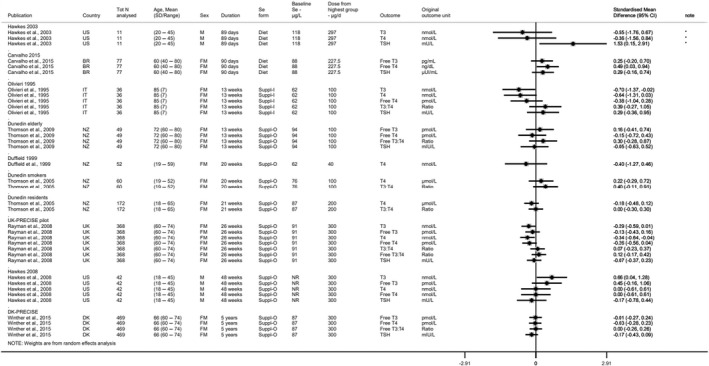
Intervention studies investigating the effects of selenium supplementation vs placebo on thyroid hormone concentrations (standardised mean differences), sorted by study duration
-
*Denotes depletion study.BR: Brazil; CI: confidence interval; DK: Denmark; FM: females and males; IT: Italy; N: number; NR: not reported; NZ: New Zealand; PRECISE: PREvention of Cancer by Intervention with Selenium SD: standard deviation; Suppl‐I: inorganic selenium supplement; Suppl‐O: organic selenium supplement; T3: triiodothyronine; T4: thyroxine; TSH: thyroid‐stimulating hormone, UK: United Kingdom.
Among studies lasting less than 1 year, the direction of the changes in T4, FT4, T3, FT3, TSH, and T3:T4 ratio is inconsistent (dose: 40 to 300 μg/day; duration: 13 to 48 weeks) (Figure 10). In the largest and longest trial using 100, 200 or 300 μg/day for 5 years, Winther et al. (2015) reported a decrease of −0.035 mIU/L (p = 0.611) in TSH and −0.21 pmol/L (p = 0.12) in FT4 per 100 μg/day increase using a binary analysis (i.e. active treatment vs placebo as a binary covariate in the regression model); using a dose‐analysis (i.e. dose as a continuous covariate in the regression model), a decrease in TSH of −0.066 mIU/L (p = 0.010) and in FT4 of −0.11 pmol/L (p = 0.015) was estimated. The Panel considers that the variations in thyroid hormones observed in this study are not biologically relevant.
The Panel considers that the available BoE from RCTs does not suggest a positive relationship between selenium intake and thyroid diseases at the intake levels investigated. No comprehensive UA is performed.
3.5.7.2. Observational studies
LoE1. Standalone main: incidence of thyroid diseases
Preliminary UA
One eligible prospective observational study was identified, which investigated the relationship between dietary selenium intake assessed with FFQ and thyroid cancer incidence in a cohort of 566,398 men and women of the National Institutes of Health‐American Association of Retired Persons (NIH‐AARP) Diet and Health Study in the US (O'Grady et al., 2014). After 10 years of follow‐up, a HR of 1.35 (95% CI 0.99, 1.84) was estimated when comparing the 5th to the 1st quintile of selenium intake (see evidence table in Appendix D.6.2).
The Panel notes the limited BoE from observational studies. No comprehensive UA is performed.
3.5.7.3. Overall conclusions on thyroid diseases
The Panel considers that the available BoE does not suggest a positive relationship between selenium intake and thyroid diseases.
3.5.8. Prostate cancer
Incidence of prostate cancer is included in the standalone main LoE.
3.5.8.1. Intervention studies
LoE1. Standalone main: incidence of prostate cancer
Four intervention studies investigated the effect of selenium supplementation vs placebo on incidence of prostate cancer (NBT, Algotar et al., 2013b; Nutritional Prevention of Cancer (NPC) trial, Duffield‐Lillico et al., 2003a; SELECT, Lippman et al., 2009; Southwest Oncology Group (SWOG) trial, Marshall et al., 2011). The supplemental intake of selenium ranged from 200 to 400 μg/day and the mean study intervention period ranged from 3 to 12 years. For the SELECT, results for an additional observational follow‐up period of 3 years after cessation of the intervention were also reported (Klein et al., 2011).
Preliminary UA
The study size ranged between 255 (Marshall et al., 2011) and 17,448 participants (SELECT, Lippman et al., 2009); one trial was in healthy men (SELECT), two trials included men at ‘high’ risk of prostate cancer (NBT, SWOG), and one trial involved men with confirmed history of non‐melanoma skin cancer (NPC). Incidence of prostate cancer was the primary outcome in the SELECT, the NBT and the SWOG trial, while in the NPC trial it was added as a secondary endpoint during the course of intervention. Two studies were conducted in the US (SWOG, NPC), one in the US and New Zealand (NBT) and one study in the US, New Zealand and Puerto Rico (SELECT). Mean/median plasma selenium concentration at baseline ranged between 115 μg/L (NPC) and 138 μg/L (SWOG).
The evidence table is in Appendix D.7.1. Key study characteristics, together with the effect estimates and related CIs, are plotted in Figure 11.
Figure 11.
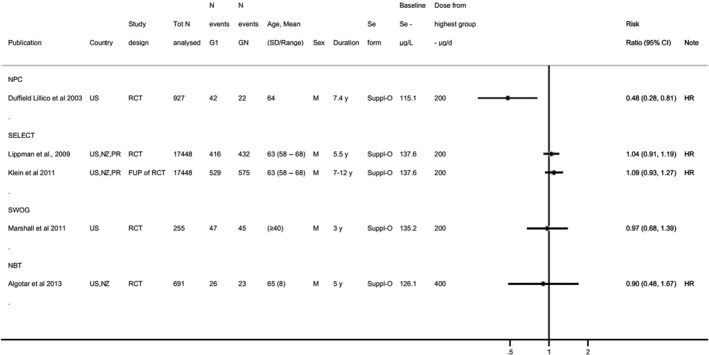
Intervention studies investigating the effects of selenium supplementation vs placebo on incidence of prostate cancer, sorted by supplemental dose
-
CI: confidence interval; duration: duration of the intervention and follow‐up phase for studies with an observational period (i.e. Klein et al., 2011); FUP: follow‐up; GN: highest dose group from each study; HR: hazard ratio; M: males; NBT: Negative Biopsy Trial; NPC: Nutritional Prevention of Cancer; NZ: New Zealand; PR: Porto Rico; RCT: randomised controlled trial; SD: standard deviation; SELECT: Selenium and Vitamin E Cancer Prevention Trial; Suppl‐O: organic selenium supplement; SWOG: Southwest Oncology Group; US: United States; y: years.
The NBT, NPC and SWOG trials found no indication of an increased risk of prostate cancer in the groups which received selenium supplementation (dose: 200 to 400 μg/day; mean duration: 3 to 7.4 years) (Figure 10). In the largest trial, i.e. the SELECT, a HR of 1.04 (99% CI 0.87, 1.24) was estimated when comparing the selenium group (200 μg/day) to the control group after a median of 5.5 years of supplementation. After 3 years of follow‐up upon cessation of the intervention, the HR was 1.09 (99% CI 0.93, 1.27) (Klein et al., 2011) (Figure 10 and evidence table in Appendix D.7.1). Making use of data collected through the SELECT and applying a case‐cohort study design, authors observed a non‐statistically significant increase in the risk of high‐grade prostate cancer among men in the highest quintiles of baseline toenail selenium compared to the lowest quintile (Q4 ≥ 0.9– < 1.0 μg selenium/g toenail, HR: 1.52 (95% CI 0.71, 3.25); Q5 ≥ 1.0 μg selenium/g toenail, HR: 1.74 (95% CI 0.81, 3.72)) (Kristal et al., 2014).
The Panel considers that the available BoE from RCTs does not suggest a positive relationship between dietary intake of selenium and risk of prostate cancer at the doses investigated in these studies. No comprehensive UA is performed.
3.5.8.2. Observational studies
LoE1. Standalone main: incidence of prostate cancer
Fifteen eligible prospective observational studies investigated the relationship between selenium exposure and incidence of prostate cancer (EPIC, Allen et al., 2008; Seattle firms, Coates et al., 1988; Mobile Clinic Health Examination Survey (MCHES), Knekt et al., 1990; Alpha‐Tocopherol, Beta‐Carotene Cancer Prevention (ATBC), Hartman et al., 1998; Health Professional Follow‐Up Study (HPFS), Yoshizawa et al., 1998; CLUE II, Helzlsouer et al., 2000; Honolulu Heart Program (HHP), Nomura et al., 2000; Carotene and Retinol Efficacy Trial (CARET), Goodman et al., 2001; Physician's Health Study (PHS), Li et al., 2004; Prostate, Lung, Colorectal, and Ovarian Cancer Screening Trial (PLCOCS), Peters et al., 2007; Prostate Cancer Prevention Trial (PCPT), Kristal et al., 2010; Uppsala Longitudinal Study of Adult Men (ULSAM), Grundmark et al., 2011; Netherlands Cohort Study, Geybels et al., 2013; The Multiethnic Cohort (MEC), Park et al., 2015; Diet, Cancer and Health cohort, Outzen et al., 2021).
Preliminary UA
The cohort size ranged between 37 (Seattle firms) and 75,216 (MEC) participants. The length of follow‐up ranged from 2.5 to 26.5 years. Cohorts were located in Europe (Germany, Denmark, Spain, Finland, Greece, Italy, the Netherlands, Sweden, the UK) and in the US and Canada.
Plasma or serum selenium concentrations were used as measure of selenium exposure in seven studies (MCHES, HHP, CARET, PHS, PLCOCS, EPIC, ULSAM), one study used plasma selenoprotein P concentration (Diet, Cancer and Health cohort), four studies used toenail selenium (HPFS, CLUE II, Netherlands Cohort Study and the Diet, Cancer and Health cohort). Total dietary intake was assessed through a diet history questionnaire or a semi‐quantitative FFQ (SFFQ) in two studies (ATBC, MEC) and supplemental intake of selenium was estimated through a questionnaire in one other (PCPT).
The evidence table is in Appendix D.7.2. Key study characteristics, together with the risk estimates and related CIs, are plotted in Figures 12 and 13.
Figure 12.
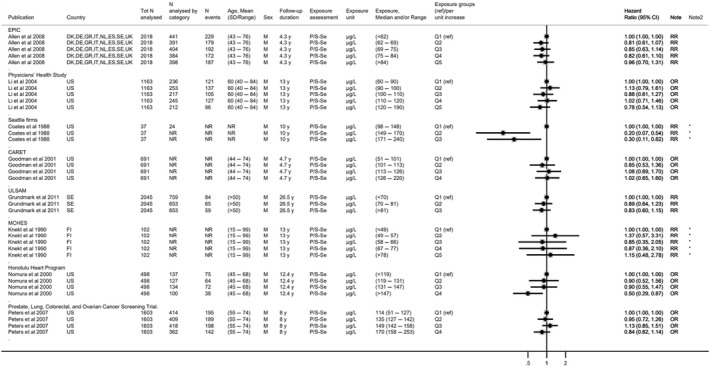
- *Denotes imputed standard error.CI: confidence interval; CA: Canada; CARET: Carotene and Retinol Efficacy Trial; DE: Germany; DK: Denmark; EPIC: European Prospective Investigation into Cancer and Nutrition; ES: Spain; FI: Finland; GR: Greece; IT: Italy; M: males; MCHES: Mobile Clinic Health Examination Survey; N: number; NL: The Netherlands; N: number NR: not reported; OR: odds ratio; P/S‐Se: plasma/serum Se; Q: quantile; RR: risk ratio; SD: standard deviation; SE: Sweden; UK: United Kingdom; ULSAM: Uppsala Longitudinal Study of Adult Men; US: United States; y: years.
Figure 13.
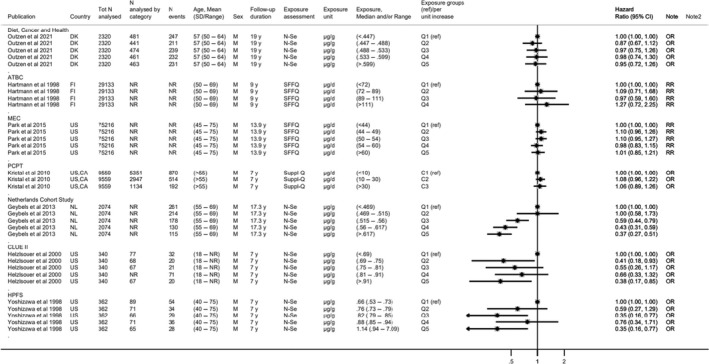
- ATBC: Alpha‐Tocopherol, Beta‐Carotene Cancer Prevention; C: category; CA: Canada; CI: confidence interval; d: day; DK: Denmark; FI: Finland; HPFS: Health Professionals Follow‐Up Study; M: males; MEC: Multiethnic Cohort; N: number; NL: Netherlands; N‐Se: nail selenium; NR: not reported; OR: odds ratio; P/S‐Se: plasma/serum selenium; PCPT: Prostate Cancer Prevention Trial; Q: quantile; RR: risk ratio; SFFQ: semiquantitative food frequency questionnaire; Suppl‐Q: supplement use questionnaire; US: United States, y: years.Note: For Kristal et al., 2010 stratified results plotted for incidence of prostate cancer for Gleason scores 2–7 (stratified results for Gleason scores 8–10 available in evidence table in Appendix D.7.2).
Overall, prospective observational studies investigating the association between plasma/serum selenium concentration (Figures 12) or other measures of selenium exposure (Figure 13) do not support a positive association with the risk of prostate cancer.
The Panel considers that the available BoE from observational studies does not suggest a positive relationship between dietary selenium intake and risk of prostate cancer over the range of exposure investigated in these studies. No comprehensive UA is performed.
3.5.8.3. Overall conclusions on prostate cancer
The Panel considers that the available BoE does not suggest a positive relationship between dietary selenium intake and risk of prostate cancer.
3.5.9. Skin cancer
For the risk of skin cancer, incidence of any type of skin cancer (i.e. melanoma skin cancer, squamous cell carcinoma (SCC) and basal cell carcinoma (BCC) skin cancer) is included in the standalone main LoE.
3.5.9.1. Intervention studies
LoE1. Standalone main: incidence of skin cancer
Three RCTs, reported in five publications, investigated the effect of selenium supplementation vs placebo on incidence of skin cancer (NPC, Reid et al., 2008; NPC, Duffield‐Lillico et al., 2002; NPC, Duffield‐Lillico et al., 2003b; Sel/Cel, Thompson et al., 2016; NBT, Algotar et al., 2013b). The NPC and NBT trials measured the incidence of melanoma skin cancer, SCC and BCC skin cancer. The Sel/Cel trial reports on incidence of SCC only. Three publications are available from the NPC trial: two report the effect of 200 μg/day vs placebo based on the data collected in the main trial conducted in several study sites (Duffield‐Lillico et al., 2002, 2003b); one reports the results of an adjunct trial conducted in one of the study sites, in which an additional group of participants was randomised to receive a supplemental dose of 400 μg/day or a placebo (Reid et al., 2008). Across trials, the supplemental doses of selenium ranged from 200 to 400 μg/day and the mean study intervention period ranged from 2.75 to 7.9 years.
Preliminary UA
The study size ranged from 423 (NPC adjunct trial) to 1,820 participants (Sel/Cel). The studies included adult males and females (Sel/Cel and NPC) or males only (NBT). One trial was conducted in patients with a history of non‐melanoma skin cancer (NPC), one in subjects with a history of colorectal adenomas (Sel/Cel) and one in men at high risk for prostate cancer (NBT). In the NPC trial, incidence of non‐melanoma skin cancers (i.e. BCC and SCC) was the primary outcome and incidence of melanoma skin cancer was a secondary outcome, while in the NBT and Sel/Cel trials they were assessed as part of the evaluation of adverse events/toxicity outcomes. The studies were conducted mainly in US, and New Zealand. Mean/median plasma selenium concentration at baseline were between 114 and 127 μg/L across trials.
The evidence table is in Appendix D.8.1. Key study characteristics, together with the effect estimates and related CIs, are plotted in Figure 14.
Figure 14.
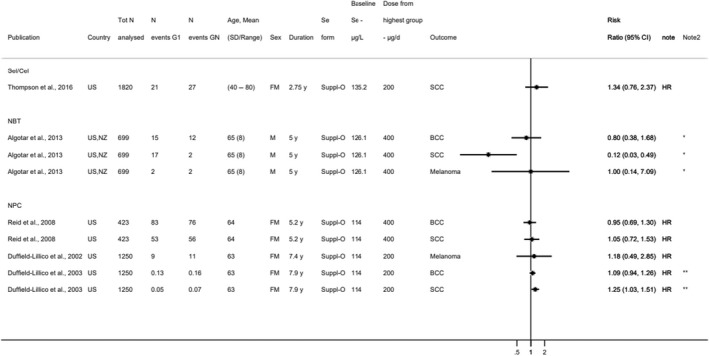
- *Denotes estimated risk ratios and standard errors; **denotes incidence rates instead of N events.BCC: basal cell carcinoma; CI: confidence interval; FM: females and males; GN: highest dose group from each study; HR: hazard ratio; N: number; NBT: Negative Biopsy Trial; NPC: Nutritional Prevention of Cancer; NZ: New Zealand; SCC: squamous cell carcinoma; SD: standard deviation; Sel/Cel: Selenium and Celecoxib; Suppl‐O: organic Se supplement; US: United States: y: years.Note: Participants in the NPC trial were at high risk of non‐melanoma skin cancer at baseline having been diagnosed with 1 or more SCC or 2 or more BCC within the year prior to randomization.
In the NPC trial, an increased incidence of SCC (HR 1.25; 95% CI 1.03, 1.51) was found in the group of subjects who received 200 μg/day selenium for 7.9 years compared to the control group (Duffield‐Lillico et al., 2003b). In a subgroup analysis according to baseline plasma selenium concentrations, an increased incidence of SCC was found in the second tertile (105.6–122.0 ng/mL; HR 1.49; 95% CI 1.05, 2.12) and third tertile (≥ 122.4 ng/mL; HR 1.59; 95% CI 1.11, 2.30) (Duffield‐Lillico et al., 2003b). In the adjunct study of the NPC trial, the HR for SCC was 1.05 (95% CI 0.72, 1.53) comparing the group of participants who received 400 μg/day selenium for 5.2 years to the control group (Reid et al., 2008). In the Sel/Cell trial, the HR for SCC was 1.34 (95% CI 0.76, 2.37) when comparing the intervention group (200 μg/day selenium for 2.75 years) to the control group (Thompson et al., 2016). In the NBT trial, 17 cases of SCC were identified in the control group compared to 10 and 2 cases in the groups which received 200 or 400 μg/day selenium for 5 years, respectively (Algotar et al., 2013b). The Panel notes that an increased incidence of SCC was observed in the NPC trial among participants with plasma selenium ≥ 105.6 ng/mL who received a supplemental intake of 200 μg/day selenium. However, the Panel notes the available data on an effect of selenium supplementation on the risk of SCC are limited. In addition, the Panel notes the paucity of data on the risk of BCC or melanoma in the selenium supplementation trials described above.
The Panel considers that the available BoE is insufficient to conclude on a positive relationship between selenium exposure and risk of skin cancer at the doses investigated in these studies. No comprehensive UA is performed.
3.5.9.2. Observational studies
LoE1. Standalone main: incidence of skin cancer
Six prospective observational cohorts, reported in seven publications, investigated the relationship between selenium exposure and incidence of skin cancer (Nurses' Health Study (NHS) and HPFS, Matthews et al., 2019; Skin Cancer Prevention (SCP) study, Karagas et al., 1997; VITamins And Lifestyle (VITAL) cohort, Asgari et al., 2009; Nambour Skin Cancer (NSC) study, van der Pols et al., 2009; Heinen et al., 2007; MCHES, Knekt et al., 1990; Knekt et al., 1991). The incidence of SCC and BCC were investigated in five cohorts (NHS and HPFS, SCP study, NSC study and MCHES) and four cohorts (NHS and HPFS, NSC study and MCHES), respectively. The incidence of melanoma was investigated in three cohorts (NHS and HPFS, VITAL) and one NCC (within the MCHES cohort).
Preliminary UA
The size of the cohorts ranged between 392 participants (SCP study) and 69,671 participants (VITAL), while the NCC included 10 cases of melanoma and 18 matched controls (MCHES; Knekt et al., 1991). The length of follow‐up ranged from 5 years in the SCP study and VITAL cohort, to 28 years in the NHS cohort. Cohorts were located in Finland, US and Australia. All cohorts involved adult males and females; the MCHES cohort also included adolescents from 15 years of age.
The SCP study was an RCT designed to investigate the effect of β‐carotene supplementation in preventing non‐melanoma skin cancer in people who had a history of BCC or SCC; Karagas et al. (1997) reported the association between baseline plasma selenium and incidence of a new SCC among all trial participants. The NSC study was an RCT which investigated the effect of β‐carotene supplementation or use of sunscreen in preventing non‐melanoma skin cancer; the association between baseline plasma selenium and incidence of SCC and BCC among the participants involved in the control group was investigated (van der Pols et al., 2009). In the NSC study, the associations between estimates of dietary selenium intake and incidence of BCC and SCC were also investigated among a subset of participants who completed an SFFQ at the end of the trial and were further followed‐up for 8 years after the end of the intervention phase (Heinen et al., 2007). In the other cohorts, selenium exposure was assessed as toenail selenium in the NHS and HPFS cohorts, as 10‐year average selenium supplement intake in the VITAL cohort, and as serum selenium in MCHES.
The evidence table is in Appendix D.8.2. Key study characteristics, together with the risk estimates and related CIs, are plotted in Figure 15.
Figure 15.
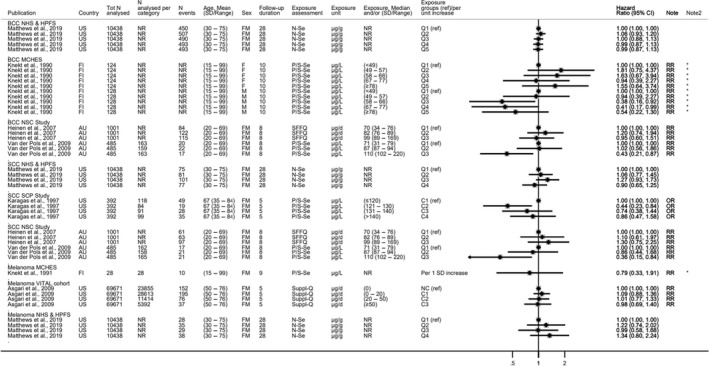
- *Denotes imputed standard error.AU: Australia; BCC: basal cell carcinoma; C: category; CI: confidence interval; d: day; FI: Finland; FM: females and males; HPFS: Health Professionals Follow‐Up Study; MCHES: Mobile Clinic Health Examination Survey; N: number; NCC: nested case–control study; NHS: Nurses' Health Study; NR: not reported; NSC: Nambour Skin Cancer; N‐Se: nail selenium; OR: odds ratio; P/S‐Se: plasma/serum selenium; Q: quantile; RR: risk ratio; SD: standard deviation; SCC: squamous cell carcinoma; SCP: Skin Cancer Prevention; SFFQ: semiquantitative food frequency questionnaire; Suppl‐Q: supplement use questionnaire; UK: United Kingdom: VITAL: VITamins And Lifestyle.Notes: Knekt et al. (1991) and Karagas et al. (1997) are NCCs; Karagas et al. (1997) enrolled participants with at least one BCC or SCC cancer previously removed.
The Panel notes the heterogeneity of the exposure‐endpoint relationships investigated across studies. Overall, available prospective observational studies do not support an increased risk of skin cancer (SCC, BCC or melanoma) associated with increased selenium exposure, as assessed by plasma or nail selenium concentrations or as estimated by dietary questionnaires.
The Panel considers that the available BoE from observational studies does not suggest a positive relationship between selenium intake and risk of skin cancer over the range of exposure investigated in these studies. No comprehensive UA is performed.
3.5.9.3. Overall conclusions on skin cancer
The Panel considers that the available BoE is insufficient to conclude on a positive relationship between dietary selenium exposure and risk of skin cancer.
3.5.10. Type 2 diabetes mellitus
Incidence of T2DM is included in the standalone main LoE for the risk of T2DM.
Measures of glucose homeostasis have been grouped in LoEs which follow the natural history of T2DM, i.e. from those that are expected to be impaired first to those expected to be impaired later in time:
Measures of insulin sensitivity obtained either in steady‐state conditions (during an euglycaemic hyperinsulinaemic clamp) or in non‐steady state conditions (e.g. during an intravenous glucose tolerance test (IVGTT) with frequent sampling/minimal model assessment).
Indices of insulin sensitivity/resistance and indices of insulin secretion/beta cell function, either derived from the fasting state (e.g. homeostasis model assessment for insulin resistance (HOMA‐IR), homeostasis model assessment of β‐cell function (HOMA‐β) or from an oral glucose tolerance test (OGTT)) (e.g. Matsuda index of insulin sensitivity).
Measures of glucose tolerance, either derived from the fasting state (fasting blood glucose (FBG) and fasting insulin (FI)) or from an OGTT, including glucose and insulin at 120 min and areas under the curve (AUCs) for glucose and insulin.
Measures of blood glucose control, including fructosamine, glycated albumin and glycated haemoglobin (HbA1c).
LoE (c) is considered standalone surrogate because cut‐off values for fasting glucose and for glucose at 120 min during an OGTT are used for the diagnosis of diabetes. Within this LoE, measures of fasting insulin and insulin at 120 min during an OGTT will be considered as complementary. In contrast, LoEs (a), (b) and (d) are considered complementary because, on their own, they cannot answer the sQ about the risk of T2DM.
3.5.10.1. Intervention studies
LoE1. Standalone main: incidence of type 2 diabetes mellitus
Five RCTs, which investigated effects of selenium supplementation vs placebo, reported data on incident cases of T2DM (NPC, Stranges et al., 2007; SELECT, Lippman et al., 2009; NBT, Algotar et al., 2013a; Eastern Cooperative Oncology Group (ECOG), Karp et al., 2013; Sel/Cel, Thompson et al., 2016). The supplemental intake of selenium ranged from 200 (five study arms) to 400 μg (one study arm) per day and the mean study intervention period ranged from 2.8 to 7.7 years. For the SELECT, results after an additional observational follow‐up period of 3 years after cessation of the intervention were also reported (Klein et al., 2011). The SELECT was a 4‐arm trial with groups receiving either selenium supplementation alone, vitamin E alone, the combination of the two, or a placebo; only the results for the arms receiving selenium or placebo are considered below.
In addition, in a publication describing the effect of selenium supplementation on changes in HbA1c in the context of the 5‐year PRECISE pilot trial (DK PRECISE) authors reported the overall number of study participants receiving medication for T2DM 2 years after the initiation of the intervention. The trial included three arms of selenium supplementation (100, 200 or 300 μg/day) vs placebo (Stranges et al., 2019). As the number of incident T2DM cases by study group was not provided in the publication, authors were contacted to obtain the data. In their answer, authors also provided data for the UK PRECISE trial, a pilot RCT which used 100, 200 or 300 μg/day vs placebo for 6 months (Rayman et al., 2012).
Preliminary UA
The study size ranged between 192 participants (NBT) and 17,448 participants (SELECT). Three trials involved healthy individuals (SELECT; DK PRECISE; UK PRECISE), one trial recruited men at ‘high’ risk of prostate cancer (NBT), one trial involved men with confirmed history of non‐melanoma skin cancer (NPC), one trial included subjects with resected non‐small‐cell lung cancer (ECOG), and one trial selected subjects with a history of colorectal adenomas (Sel/Cel). Three studies were conducted in the US (NPC, ECOG, Sel/Cel), one in the US and New Zealand (NBT), one study in the US, New Zealand and Puerto Rico (SELECT), with mean/median plasma selenium concentration at baseline between 114 and 137 μg/L. The DK PRECISE and UK trials were conducted in Denmark and UK respectively, with mean plasma selenium concentration at baseline of 88 μg/L in both trials.
Cases of T2DM were recorded from the start of the intervention among the secondary outcomes of the study in two trials (NPC, NBT). In three trials, cases of T2DM were monitored among safety endpoints, either from the start of the intervention (Sel/Cel; DK PRECISE; UK PRECISE) or added during the course of intervention (SELECT, ECOG). Three studies reported estimates of RRs (NPC, SELECT, Sel/Cel), while two studies only reported the number of T2DM cases in each study arm (NBT, ECOG). For DK PRECISE and UK PRECISE, the number of incident T2DM cases in each study arm was obtained from the authors through personal communication.
The evidence table is in Appendix D.9.1. Key study characteristics, together with the effect estimates and related CIs, are plotted in Figure 16. A random‐effect meta‐analysis of the eligible RCTs was conducted. For each study, the effect estimate corresponded to the RR in the group receiving 200 μg/day selenium compared to the control group. For the NBT trial, in which a dose of 400 μg/day selenium was also tested, the RR was the same in both treatment groups.
Figure 16.

- *Denotes estimated risk ratios and standard errors.CA: Canada; CI: confidence interval; d: day; FM: females and males; G: group; HR: hazard ratio; N: number; PR: Puerto Rico; SD: standard deviation; Suppl‐O: organic selenium supplement; US: United States; y: years.Note: In Karp et al. (2013): the ratio of participants assigned to G1 and G2 was 1:2: i.e. 521 individuals in the control group and 1:040 individuals in treatment group.
In view of the specific characteristics of the DK PRECISE (mean plasma selenium concentration at baseline of 88 μg/L) and UK PRECISE (6 months follow up), the Panel considered that these trials could not be combined with the other trials and therefore, these data were not included in the meta‐analysis (number of T2DM cases available in Appendix D.9.1).
A higher number of T2DM cases in the selenium supplementation groups than in the control groups was found in the five studies included in the meta‐analysis. The pooled effect (RR) is 1.11 (95% CI 1.00, 1.24), with low statistical heterogeneity identified across studies (I2 = 2.2%, p = 0.394). The Panel notes that the SELECT is the major determinant of the pooled effect estimate (85% weight in the estimation of the overall effect).
The Panel notes that in the NPC trial, in a stratified analysis by tertile of baseline plasma selenium concentrations, the HRs were 1.13 (95% CI 0.58, 2.18) in the first tertile (≤ 105.2 ng/mL), 1.36 (95% CI 0.60, 3.09) in the second tertile (95% CI 105.3, 121.6 ng/mL) and 2.70 (95% CI 1.30, 5.61) in the third tertile (> 121.6 ng/mL). HRs were 1.04 (95% CI 0.60, 1.80) and 2.50 (95% CI 1.32, 4.77) for the subgroups with baseline plasma selenium concentrations below or above the median value of 113.4 ng/mL (Stranges et al., 2007). No indication of a modification of the association by age (≤ 65 years vs > 65 years), sex (men vs women), smoking status (never, former, current), or body mass index (BMI) (≤ 23.71, 23.72–26.76, > 26.76 kg/m2) was found.
In the Sel/Cel trial, a HR of 2.21 (95% CI 1.04, 4.67) was found in the group aged ≥ 63 years vs 0.59 (95% CI 0.25, 1.35) in the group aged < 63 years.
In the SELECT, after an additional observational follow‐up period of 3 years after cessation of the intervention, the HR was 1.04 (99% CI 0.93, 1.17) (Klein et al., 2011).
Overall, the Panel considers that the available BoE suggests a positive relationship between the intake of selenium and incidence of T2DM.
LoE2. Standalone surrogate: measures of glucose tolerance
Ten eligible RCTs reported on the effect of selenium supplementation on measures of glucose tolerance. FBG concentrations were measured in nine trials, among which seven also reported measures of FI concentration (Navas‐Carretero et al., 2011; Jamilian et al., 2015; Karamali et al., 2015; Hosseinzadeh et al., 2016; Mesdaghinia et al., 2017; Raygan et al., 2018; Tamtaji et al., 2019), while two studies did not (Hawkes et al., 2008; Richie et al., 2014). The supplemental intake of selenium ranged from 30 to 300 μg/day and the mean/median study intervention period ranged from 8 to 48 weeks. One study reported the results of an OGTT conducted in a subset of the initial study sample of the Sel/Cel trial mentioned above, in which participants received 200 μg/day selenium for 2.9 years (Jacobs et al., 2019).
Preliminary UA
The size of the studies reporting on FBG (with or without FI) ranged between 24 and 70 participants; three trials were in healthy adults (Hawkes et al., 2008; Navas‐Carretero et al., 2011; Richie et al., 2014), one trial involved pregnant women (Mesdaghinia et al., 2017), two trials in women with polycystic ovary syndrome (Jamilian et al., 2015; Hosseinzadeh et al., 2016), one trial among patients with cervical intraepithelial neoplasia grade 1 (Karamali et al., 2015), one trial in patients with congestive heart failure (Raygan et al., 2018), and one trial in patients with Alzheimer's dementia (Tamtaji et al., 2019). The study which conducted an OGTT involved 175 individuals with a history of colorectal adenomas (Sel/Cel, Jacobs et al., 2019). Six studies were conducted in Iran, one in Spain, and three in the US. Median/mean plasma selenium concentrations at baseline were reported for two studies based in the US and were approx. 140 μg/L (Richie et al., 2014; Jacobs et al., 2019). Mean whole blood selenium concentration was 144 μg/L in the study conducted in Spain (Navas‐Carretero et al., 2011). An average selenium intake of approx. 32 μg/day at baseline was estimated in one study in Iran, using six 24‐h recalls (Hosseinzadeh et al., 2016).
Measures of glucose tolerance were investigated as the primary outcome in three trials (Jamilian et al., 2015; Hosseinzadeh et al., 2016; Raygan et al., 2018) and as secondary outcome in five trials (Richie et al., 2014; Karamali et al., 2015; Mesdaghinia et al., 2017; Jacobs et al., 2019; Tamtaji et al., 2019). Two trials measured FBG among other blood parameters (including markers of antioxidant or inflammatory status, blood lipids) (Hawkes et al., 2008; Navas‐Carretero et al., 2011).
The evidence table is in Appendix D.9.2. Key study characteristics, together with the effect estimates and related CIs for fasting blood glucose and fasting insulin are plotted in Figures 17 and 18, respectively. A random‐effect meta‐analysis of the eligible RCTs was conducted. For each study, the effect estimate corresponds to the differences between the group receiving the highest daily selenium dose compared to the control group.
Figure 17.
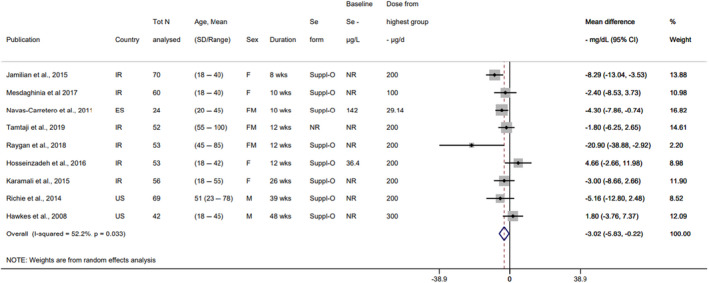
- CI: confidence interval; d: day; ES: Spain; FM: females and males; IR: Iran; N: number; NR: not reported; SD: standard deviation; Se: selenium; Suppl‐O: organic selenium supplement; US: United States; wks: weeks.Notes: Baseline selenium intake estimated with six 24‐h recalls in Hosseinzadeh et al. (2016) (in μg/day). Baseline selenium measured in whole blood in Navas‐Carretero et al. (2011) (in μg/L).
Figure 18.
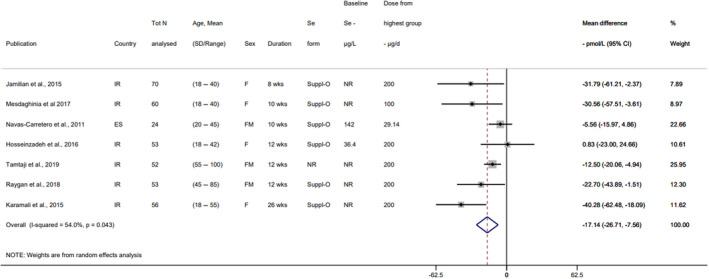
- CI: confidence interval; d: day; ES: Spain; FM: females and males; IR: Iran; N: number; NR: not reported; SD: standard deviation; Se: selenium; Suppl‐O: organic selenium supplement; wks: weeks.Notes: Baseline selenium intake estimated with six 24‐h recalls in Hosseinzadeh et al. (2016) (in μg/day). Baseline selenium measured in whole blood in Navas‐Carretero et al. (2011) (in μg/L).
Lower FBG concentrations were found in the intervention groups compared to control group in seven out of nine trials (Figure 17). In those trials which also measured FI, the pattern of change was consistent, with lower FI concentrations found in six out of seven trials (Figure 18).
However, the Panel notes that three of these articles are currently under investigation after concerns were raised to the Editors‐in‐Chief of the Scientific Journals about their integrity (Karamali et al., 2015; Mesdaghinia et al., 2017; Raygan et al., 2018), according to information available on the respective Journal websites. Forest plots excluding studies from this research group are presented in Figure 19.
Figure 19.
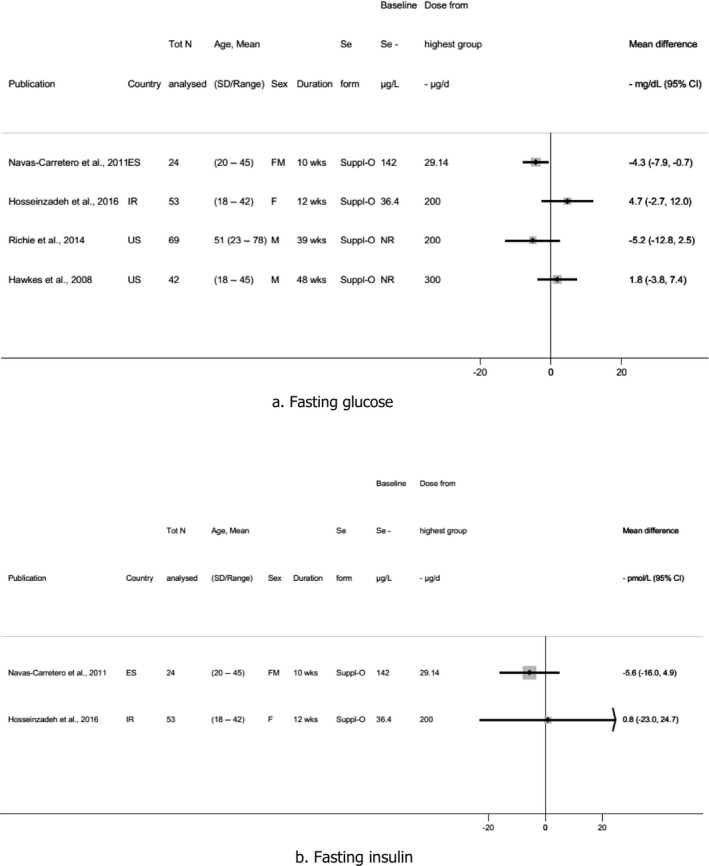
- CI: confidence interval; d: day; ES: Spain; FM: females and males; IR: Iran; N: number; NR: not reported; SD: standard deviation; Se: selenium; Suppl‐O: organic selenium supplement; US: United States; wks: weeks.Notes: Baseline selenium intake estimated with six 24‐h recalls in Hosseinzadeh et al. (2016) (in μg/day). Baseline selenium measured in whole blood in Navas‐Carretero et al. (2011) (in μg/L).
Jacobs et al. (2019) conducted a 3‐h modified OGTT among a subsample of participants from the Sel/Cel study (200 μg/day vs placebo for 2.9 years). A convenience sample was selected among the participants who remained in the trial near the end of follow up. A total of 96 in the control group and 79 in the selenium group accepted to perform the test. At 120 min after oral administration of 75 g glucose, there was no difference in blood glucose concentration between the two groups (mean ± SD: 132.2 ± 49.8 mg/dL in the control group vs 129.4 ± 41.4 in the selenium group, p = 0.70) (Appendix D.9.2).
The Panel considers that the available BoE does not suggest an adverse effect of high selenium intake on measures of glucose tolerance.
Comprehensive UA.
The Panel selected incidence of T2DM as the key endpoint for the comprehensive UA.
Risk of bias appraisal. Four RCTs were at low RoB (tier 1) and one RCT was at moderate RoB (tier 2) (Table 6).
Table 6.
Outcome of the risk of bias appraisal of the RCTs on incidence of T2DM
| Reference | Study name | Exposure | Outcome | Randomization | Allocation concealment | Blinding | Attrition/exclusion from analysis | Other threats | Tier |
|---|---|---|---|---|---|---|---|---|---|
| Stranges et al. (2007) | NPC | + | + | + | + | + | + | + | 1 |
| Lippman et al. (2009) | SELECT | + | + | + | NR | + | + | + | 1 |
| Algotar et al. (2013b) | NBT | + | + | + | − | + | − | − | 2 |
| Karp et al. (2013) | ECOG | + | + | + | + | + | NR | − | 1 |
| Thompson et al. (2016) | Sel/Cel | + | + | + | + | NR | + | + | 1 |
+: low RoB; −: high RoB; NR: not reported.
The reasons for judging certain items as high RoB are outlined in the following.
With respect to allocation concealment for the NBT study described by Algotar et al. (2013a), it is reported that randomisation codes were held by unblinded personnel. As it was unclear what the exact tasks of these individuals were, a high RoB rating was attributed to this item. Study drop‐out percentages were 34.1%, 41.9% and 40.8% for the placebo group, the 200 μg/day selenium group and the 400 μg/day selenium group, respectively. This high drop‐out rate was considered to have introduced a high RoB. The judgement related to the item on other threats to internal validity was based on the fact that no risk estimates were provided in the publications. In addition, it was unclear why self‐reports of T2DM were not confirmed with the available data on plasma glucose concentrations. For the ECOG trial described by Karp et al. (2013), the assessment of T2DM only started 7 years after the start of the study and 2 years before the end of the study. This is the reason why the question on other threats to internal validity was rated as high RoB.
In a sensitivity analysis excluding the NBT and ECOG trials, considering the RoB appraisal and the fact that these studies only reported number of T2DM cases by group rather than risk estimates, the pooled effect estimate (RR) for the effect of selenium supplementation vs placebo on incidence of T2DM was 1.18 (95% CI 0.95, 1.48; I2 = 38.2%, p = 0.198).
Publication bias. Funnel plots and Egger's regression results provide weak support (p = 0.137; intercept 0.97, 95% CI 0.56, 2.51) for a publication bias, i.e. there is weak support that results of some studies with no effect of selenium supplementation on T2DM or an effect in the opposite direction may have not been published (Figure 20).
Figure 20.
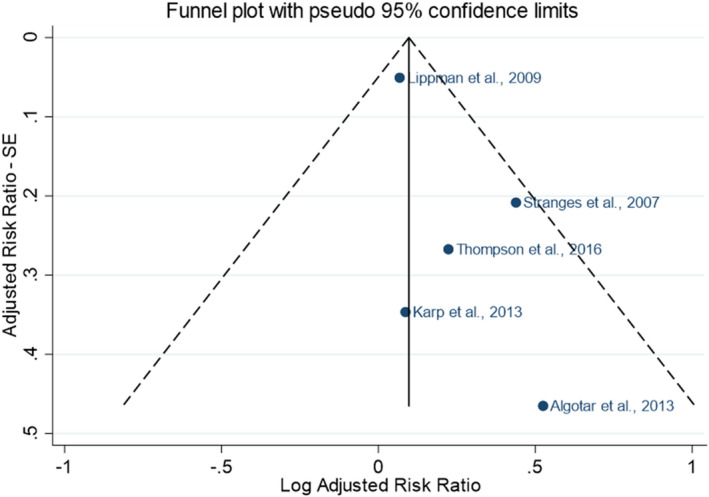
Funnel plot of the RCTs on incidence of T2DM
The Panel notes the low number of studies and thus the low power of the test and related risk for false‐negatives. Therefore, the Panel considers the results of the tests as inconclusive.
The Panel notes that the reporting of adverse effects in supplementation studies is often incomplete, particularly for those which are not pre‐planned in the study protocol.
Dose–response relationship. Eligible studies were similar regarding the baseline selenium status of the participants (mean/median plasma concentration between 114 and 137 μg/L) and all used a supplementation dose of 200 μg/day (corresponding to a total selenium intake between 270 and 340 μg/day). Only the NBT trial used two doses of selenium, i.e. 200 and 400 μg/day. The number of T2DM cases identified during the intervention was 7 in the control group, 12 in the group receiving 200 μg/day and 12 in the group receiving 400 μg/day.
The Panel considers that the data from RCTs are not suitable to characterise a dose–response relationship between selenium intake and incidence of T2DM.
LoE3. Complementary: Indices of insulin sensitivity/resistance and indices of insulin secretion/β‐cell function
Among the RCTs which reported on measures of glucose tolerance, seven studies also assessed changes in the HOMA2‐IR (Navas‐Carretero et al., 2011; Jamilian et al., 2015; Karamali et al., 2015; Hosseinzadeh et al., 2016; Mesdaghinia et al., 2017; Raygan et al., 2018; Tamtaji et al., 2019), among which four also HOMA2‐β. A statistically significant decrease in HOMA2‐IR was found in six trials (30–200 μg/day selenium for 8–26 weeks, Navas‐Carretero et al., 2011; Jamilian et al., 2015; Karamali et al., 2015; Mesdaghinia et al., 2017; Raygan et al., 2018; Tamtaji et al., 2019), with a consistent decrease in HOMA2‐β in the three trials reporting this parameter (Jamilian et al., 2015; Karamali et al., 2015; Mesdaghinia et al., 2017). In contrast, a statistically significant increase in HOMA2‐IR was found in one trial (200 μg/day for 12 weeks; Hosseinzadeh et al., 2016) (Appendix D.9.2).
However, the Panel notes that three of these articles are currently under investigation after concerns were raised to the Editors‐in Chief of the Scientific Journals about their integrity (Karamali et al., 2015; Mesdaghinia et al., 2017; Raygan et al., 2018), according to information available on the respective Journal websites. Forest plots excluding studies from this research group are presented in Figure 19.
LoE4. Complementary: Measures of blood glucose control
The DK PRECISE reported HbA1c measurements at baseline and after 6 months and 2 years of selenium supplementation with 100 μg/day (n = 124, group 1), 200 μg/day (n = 122, group 2), or 300 μg/day (n = 119, group 3) vs placebo (n = 126). After 2 years, HbA1c had decreased in all groups, with no difference between active treatment and placebo (mean (95% CI) in control group: −1.8 (−3.1, −0.6); group 1: −2.7 (−4.0,‐1.4); group 2: −1.7 (−3.0, −0.3); group 3: −2.8 (−4.1, −1.5)) (Stranges et al., 2019). Six participants were using diabetes medications at baseline, six at 6 months, and 14 at 2 years. The exclusion from analysis of participants once they had received diabetes medications did not alter the results on HbA1c.
Consistency across LoEs. The increased risk of T2DM observed following selenium supplementation is not supported by the results of studies reporting on measures of glucose tolerance (LoE2, standalone surrogate), indices of insulin sensitivity/resistance (LoE3, complementary) or measures of blood glucose control (LoE4, complementary).
Outcome of the comprehensive analysis of the uncertainties
Conclusions from intervention studies. The level of certainty in a positive and causal relationship between the intake of selenium and risk of T2DM is moderate (rationale in Table 7).
Table 7.
Comprehensive analysis of the uncertainties in the BoE from intervention studies
| What is the level of certainty that the intake of selenium is positively and causally associated with the risk of T2DM? | ||
|---|---|---|
| BoE |
LoE1. Standalone main. Endpoint: incidence of T2DM 5 RCTs, 22,227 participants (92% males). Pooled mean effect estimate, RR (95% CI) = 1.11 (1.00, 1.24) (Figure 16). |
Initial certainty: High (> 75%–100% probability) |
| Domain | Rationale | Evaluation |
| RoB |
4 studies in tier 1 (low RoB), 1 study in tier 2 (moderate RoB) (Table 6).
Key questions:
Mostly low RoB for blinding; mixed low/high RoB or not reported for attrition/exclusion from analysis; mixed low/high RoB for other threats to internal validity |
Not serious |
| Unexplained inconsistency |
Point estimates are in the same direction. Low statistical heterogeneity (I2 = 2.2% for the meta‐estimate). RR estimates substantially higher in smaller studies; yet, 95% CI largely overlap. |
Not serious |
| Indirectness |
No concern regarding the directness of the endpoint (incidence of the disease). Regarding the study populations: all trials were conducted in populations with average baseline plasma selenium higher than those typically observed in European populations; mean age was ≥ 63 years in the 5 trials; men are overrepresented as compared to women in the overall body of evidence; three trials were designed for the secondary prevention of cancer, i.e. recruited people with a history of non‐melanoma skin cancer, non‐small‐cell lung cancer and colorectal adenomas, respectively, while the largest trial involved men from the general population. Overall, no source of concern was identified given the relevance of the study populations for the target population |
Not serious |
| Imprecision | Low, based on the 95% CI of the meta‐estimate | Not serious |
| Publication bias |
Weak support for publication bias based on funnel plot and Egger test. Given the low number of studies and thus the low power of the test and related risk for false‐negatives, the results of the tests are considered inconclusive. Funding sources were public (n = 4), or not reported (n = 1). |
Undetected |
| Upgrading factors |
Dose–response: cannot be characterised based on the available BoE Consistency across LoEs: the increased risk of T2DM observed following selenium supplementation is not supported by the results of the surrogate and complementary LoEs Magnitude: effect size is insufficient to consider upgrading |
None identified |
| Final certainty | Started ‘high’. No serious concern identified regarding RoB, unexplained inconsistency, imprecision, indirectness and no publication bias detected. However, the level of certainty was downgraded one level considering the limitations related to the design and conduct of the studies (T2DM not the primary outcome) and the inconsistent results from the surrogate and complementary LoEs. |
Moderate (> 50%–75% probability) |
BoE: body of evidence; CI: confidence interval; LoE: line of evidence; RoB: risk of bias; RR: risk ratio; T2DM: type 2 diabetes mellitus.
3.5.10.2. Observational studies
LoE1. Standalone main: incidence of type 2 diabetes mellitus
Ten cohorts investigated the relationship between selenium exposure and incidence of T2DM. Seven were PCs (Hortega study, Galan‐Chilet et al. 2017; ULSAM, Gao et al., 2014; NHS and HPFS, Park et al., 2012; HORmones and Diet in the ETioliogy of Breast Cancer (ORDET), Stranges et al., 2010; Moli‐Sani, Vinceti et al., 2021; China Stroke Primary Prevention Trial (CSPPT), Zhang et al., 2019), three were NCCs (Dongfeng‐Tongji cohort (DFJT), Yuan et al., 2018; Jinchang cohort, Cheng et al., 2022; ORDET, Cabral et al., 2021) and one was a case‐cohort study (EPIC‐Potsdam, Cabral et al., 2021). Two analyses of the ORDET cohort were available, using a FFQ (Stranges et al., 2010) and toenail selenium concentration (Vinceti et al., 2015b) to characterise selenium exposure, respectively. The CSPPT study used a population involved in an RCT designed to investigate the effect of enalapril and/or folic acid treatment in preventing stroke (Zhang et al., 2019).
Preliminary UA
The size of the PCs ranged between 1,234 participants (Hortega) and 21,335 participants (Moli‐Sani), while the NCCs and case‐cohort studies included between 621 participants (ORDET) and 2,741 participants (EPIC‐Potsdam). The length of follow‐up ranged from 4.5 years in the CSPPT study to 26 years in the NHS cohort. Five cohorts were located in Europe (Spain, Sweden, Italy, Germany), one in the US and three in China. All cohorts involved adult males and females.
Selenium exposure was assessed as plasma/serum selenium concentrations in the Hortega, ULSAM, DFJT, EPIC‐Postdam and CSPPT studies, as dietary selenium intake estimates based on FFQs in the Moni‐Sani study and one of analyses of the ORDET study and as toenail selenium concentrations in the NHS and HPFS cohorts and the other analysis of the ORDET study.
The evidence table is in Appendix D.9.3. Key study characteristics, together with the risk estimates and related CIs, are plotted in Figures 21 and 22.
Figure 21.
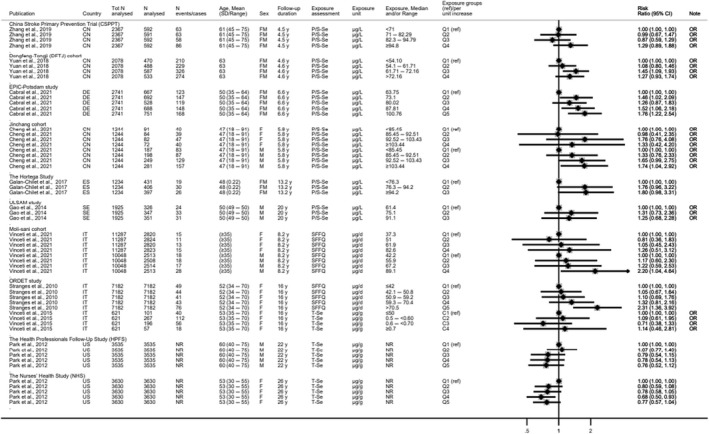
- C: category: CI: confidence interval; CN: China; d: day; DE: Germany; EPIC: European Prospective Investigation into Cancer and Nutrition; ES: Spain; IT: Italy; N: number; NR: not reported; FM: females and males; SD: standard deviation; SE: Sweden; OR: Odds Ratio; ORDET: HORmones and Diet in the ETioliogy of Breast Cancer; P/S‐Se: plasma/serum selenium; Q: quantile; ref: reference; SFFQ: semiquantitative food frequency questionnaire; T‐Se: toenail selenium; ULSAM: Uppsala Longitudinal Study of Adult Men; US: United States; y: years.Note: For Stranges et al., 2010: N analysed refers to total number of participants.
Figure 22.
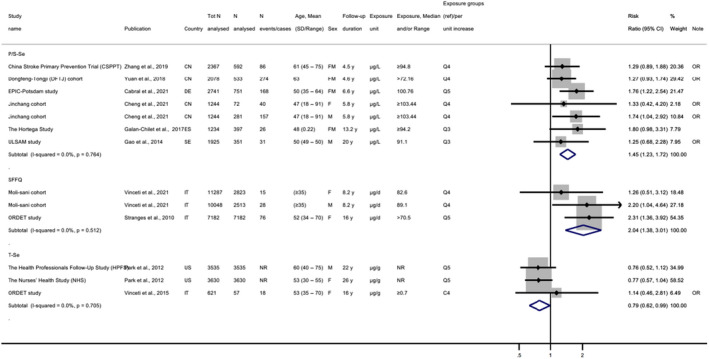
- C: category; CI: confidence interval; CN: China; d: day; DE: Germany; EPIC: European Prospective Investigation into Cancer and Nutrition; ES: Spain; FM: females and males; IT: Italy; N: number; NR: not reported; ORDET: HORmones and Diet in the ETioliogy of Breast Cancer; P/S‐Se: plasma/serum selenium; SD: standard deviation; SE: Sweden; SFFQ: food frequency questionnaire; T‐Se: toenail selenium; OR: Odds Ratio; ULSAM: Uppsala Longitudinal Study of Adult Men; US: United States: y: years.Note: For Stranges et al., 2010: N analysed refers to total number of participants.
Eight observational studies found a positive association between selenium exposure and risk of T2DM, while two did not (Park et al., 2012; Vinceti et al., 2015b). These two studies used toenail selenium concentrations as a marker of exposure.
Overall, the Panel considers that the available BoE suggests a positive relationship between the intake of selenium and incidence of T2DM.
LoE2. Standalone surrogate: measures of glucose tolerance
One PC conducted in 76 healthy Japanese adults (Oo et al., 2018) reported a positive association between baseline serum selenoprotein P concentration and FBG after 4 years of follow‐up (β = 0.237, p = 0.033), independently from age and baseline insulinogenic index, 19 BMI and HBA1c levels. Baseline serum selenium concentration and glutathione peroxidase 3 activities were not associated with FBG at follow‐up.
The Panel notes the limited BoE from observational studies on measures of glucose tolerance (Appendix D.9.4).
Comprehensive UA
The Panel selected incidence of T2DM as the key endpoint for the comprehensive UA.
Risk of bias appraisal. All eligible observational studies were at low RoB (tier 1) (Table 8).
Table 8.
Outcome of the risk of bias appraisal of the observational studies on incidence of T2DM
| Reference | Study name | Exposure | Outcome | Confounding | Attrition/exclusion from analysis | Comparison Groups | Tier |
|---|---|---|---|---|---|---|---|
| Cabral et al. ( 2021 ) | EPIC Potsdam | + | + | ++ | ++ | ++ | 1 |
| Galan‐Chilet et al. ( 2017 ) | HORTEGA | + | + | + | ++ | ++ | 1 |
| Gao et al. ( 2014 ) | ULSAM | + | ++ | ++ | + | ++ | 1 |
| Park et al. ( 2012 ) | NHS/HPFS | + | + | ++ | ++ | ++ | 1 |
| Stranges et al. ( 2010 ) | ORDET (FFQ) | + | + | ++ | + | ++ | 1 |
| Vinceti et al. ( 2015b ) | ORDET (Toenail) | + | + | ++ | + | ++ | 1 |
| Yuan et al. ( 2018 ) | DFJT | + | + | ++ | ++ | ++ | 1 |
| Zhang et al. ( 2019 ) | CSPPT | + | + | ++ | ++ | ++ | 1 |
| Vinceti et al. ( 2021 ) | Moli‐Sani | + | + | ++ | ++ | ++ | 1 |
| Cheng et al. ( 2022 ) | Jinchang | + | + | ++ | ++ | ++ | 1 |
++: Definitely low RoB; +: probably low RoB.
Dose–response relationship. A dose–response meta‐analysis modelling the relationship between selenium exposure and risk of T2DM was performed using restricted cubic splines. The method and results are summarised below. The technical statistical report and all related references are in Annex B.
The NHS, the HPFS and one of the analyses of the ORDET study could not be included in the analysis as they used toenail selenium concentrations as markers of exposure. Upon request for additional data from the study authors of EPIC‐Potsdam and ORDET, risk estimates by quintiles of exposure and not standardised for energy intake, respectively, were included in the dose–response meta‐analysis. For three estimates of two studies (Stranges et al., 2010; Vinceti et al., 2018a and for males and females in Vinceti et al., 2021), in which selenium intake had been assessed with FFQs, exposure was converted to estimated mean plasma concentrations using the equation from the dose–response reported in Section 3.3.2.
Thirty non‐referent most adjusted RRs from 10 study‐specific analyses (5 PCs and 3 NCCs) were included (I2 = 0%; p = 0.771) in the dose–response analysis. The predicted pooled RR of T2DM was 1.10 (95% CI 1.07, 1.14) for an increase in selenium plasma concentrations of 10 μg/L in the linear model (p for linear trend < 0.0001) and 1.53 (95% CI 1.13, 2.06) at 100 μg/L in the non‐linear model (restricted cubic splines with three knots at fixed percentiles, 10%, 50%, and 90%, of the distribution; p for non‐linearity = 0.157).
A subgroup analysis on the three ‘intake’ estimates from the ORDET and the Moli‐sani studies provided strong evidence of departure from linearity (p = 0.009; RR at 92 μg/L inflection point: 1.17 (95% CI 1.09, 1.26)); the subgroup of studies that reported on plasma selenium concentrations showed no support for non‐linearity (p = 0.831). The inclusion of the two studies for which the conversion was necessary (Stranges et al., 2010; Vinceti et al., 2018a) was found to have little impact on the relative risk (RR) estimate but improved its precision (Annex B).
A sensitivity analysis excluding females' study‐specific trends confirmed no evidence of departure from linearity (p = 0.568), while in a sensitivity analysis excluding Cheng et al. (2022) (Jinchang cohort; in which it had been observed that the risk of developing T2DM differed between men and women) and with a choice of four knots (Harrell: 5%, 35%, 65%, 95%) the data supported a departure from linearity (p = 0.039; RR at 94 μg/L inflection point: 1.12 (95% CI 1.06, 1.18)) (Annex B).
Overall, the dose–response meta‐analysis could not consistently identify departures from non‐linearity between plasma selenium concentrations and risk of T2DM over the range of plasma selenium concentrations investigated.
The Panel considers that a linear positive dose–response between plasma selenium concentration and incidence of T2DM over a range of plasma selenium concentrations which largely corresponds to selenium intake levels achieved through the natural selenium content of food, is not biologically plausible. A major limitation of the analysis relates to the lack of data points in the higher range of plasma selenium concentrations (> 120 μg/L). The Panel notes that the baseline mean/median plasma concentrations in the trials described in Section 3.5.10.1 were between 114 and 137 μg/L, which is at or above the plasma selenium concentrations found in observational studies included in this assessment.
There are uncertainties associated with this dose–response relationship:
The observed association could also be due to confounding factors. For example, other dietary factors in foods that contain selenium could contribute to the risk of T2DM. Key potential confounders (i.e. age, sex, BMI) were adjusted for in all eligible cohorts. Nevertheless, unmeasured confounding cannot be excluded.
Factors other than dietary selenium intake affect plasma selenium concentrations (Section 3.3 and Appendix A). It cannot be excluded that metabolic disturbances (e.g. an increase in oxidative stress), occurring before T2DM is diagnosed, could affect plasma selenium concentrations. In the ORDET cohort where the association with incidence of T2DM was investigated using both plasma and toenail Se concentrations, a positive association was found with plasma selenium concentrations, while no association was found with toenail selenium concentrations. Similarly, no association was found between toenail selenium concentrations and incidence of T2DM in the NHS and HPFS cohorts.
Publication bias. Publication bias in the subset of studies included in the dose–response modelling was investigated through a funnel plot (Figure 23) and Egger's regression. No support for a ‘small‐study effect’ (larger effects in PCs where RRs are more imprecise) was found (p = 0.444; intercept 0.88, 95% CI −1.76, 3.53).
Figure 23.
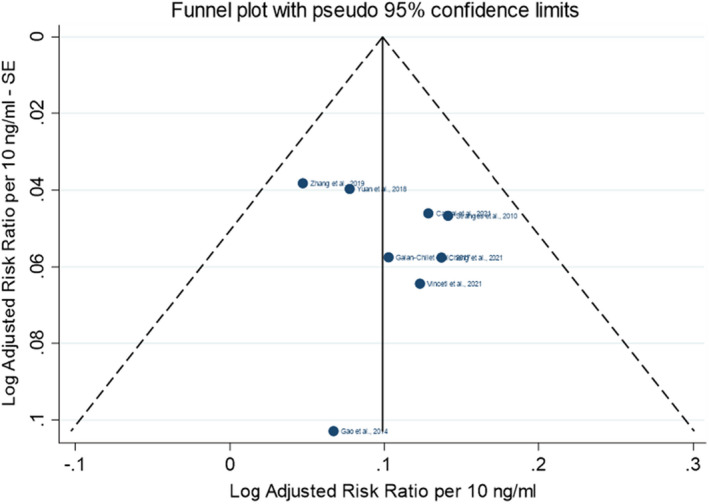
Funnel plot of the observational studies on incidence of T2DM included in the dose–response analysis
LoE4. Complementary: Measures of blood glucose control
In a cohort of 2,774 adult men and women in Germany (Monitoring of Trends and Determinants in Cardiovascular Diseases (MONICA)/Cooperative Health Research in the Region of Augsburg (KORA) cohort), no association was found between the intake of selenium from food supplements (assessed through interviews at baseline) and HbA1c levels after 10 years of follow‐up (Schwab et al., 2015). In a population of 548 mother–child pairs in Mexico (PROGRESS cohort), no association was found between blood selenium concentrations during the 2nd trimester of pregnancy and HbA1c levels measured in children at 4–6 years of age (Kupsco et al., 2019).
The Panel notes the limited BoE from observational studies on these endpoints.
Consistency across LoEs. The Panel considers that this cannot be assessed given the limited BoE available on LoE2 and LoE4.
Outcome of the comprehensive analysis of the uncertainties
Conclusions from observational studies. The level of certainty in a positive and causal relationship between the intake of selenium and risk of T2DM is low (rationale in Table 9).
Table 9.
Comprehensive analysis of the uncertainties in the BoE from observational studies
| What is the level of certainty that the intake of selenium is positively and causally associated with the risk of T2DM? | ||
| BoE |
LoE1. Standalone main. Endpoint: incidence of T2DM 10 observational studies, 47,271 participants (42.6% males). Pooled mean effect estimate, RR (95% CI) = 1.45 (1.23, 1.72) for six studies which used plasma/serum Se (7 study‐specific analyses: CSPPT, DFTJ, EPIC‐Postdam, Jinchang males, Jinchang females, Hortega, ULSAM); pooled mean effect estimate, RR (95% CI) = 2.04 (1.38, 3.01) for two studies which used a FFQ (3 study‐specific analyses: ORDET, Moli‐Sani males, Moli‐Sani females); pooled mean effect estimate, RR (95% CI) = 0.79 (0.62, 0.99) for two studies which used toenail selenium (3 study‐specific analyses: HPFS, NHS, ORDET). |
Initial certainty: Moderate (> 50%–75% probability) |
| Domain | Rationale | Evaluation |
| RoB |
10 studies in tier 1 (low RoB) (Table 8)
Key questions:
No concern identified in relation to attrition/exclusion from analysis and comparison groups. |
Serious |
| Unexplained inconsistency | 8 PCs which used serum/plasma selenium or an FFQ to measure selenium intake found positive relationships with the incidence of T2DM, while 2 PCs which used toenail selenium, a marker of medium/long term selenium exposure, did not. Factors other than dietary selenium intake can affect plasma selenium concentrations. | Serious |
| Indirectness |
|
Not serious |
| Imprecision | Low based on the 95% CI of the meta‐estimates by category of exposure. | Not serious |
| Publication bias |
|
Undetected |
| Upgrading factors |
Dose–response. The dose–response meta‐analysis could not consistently identify departures from non‐linearity between plasma/serum selenium and risk of T2DM; the significant linear positive relationship, over a range of plasma selenium concentrations which corresponds to ‘normal’ selenium intake from the diet, was not considered biologically plausible. Consistency across LoEs: cannot be assessed Magnitude: insufficient to upgrade |
None identified |
| Final certainty | Started moderate, downgraded one level for risk of bias due to unmeasured confounding factors and unexplained inconsistency |
Low (> 15%–50% probability) |
BMI: body mass index; BoE: body of evidence; CI: confidence interval; CSPPT: China Stroke Primary Prevention Trial; DFTJ: Dongfeng‐Tongji cohort; EPIC: European Prospective Investigation into Cancer and Nutrition FFQ: food frequency questionnaire; HPFS: Health Professionals Follow‐Up Study; LoE: line of evidence; NHS: Nurses' Health Study; ORDET: HORmones and Diet in the ETioliogy of Breast Cancer; PC: prospective cohort study; RoB: risk of bias; RR: risk ratio; T2DM: type 2 diabetes mellitus.
3.5.10.3. Mode of action
Several possible mechanisms by which selenium could be involved in the development of T2DM have been proposed in the literature.
As discussed in Section 3.5.1, endoplasmic reticulum stress and increased ROS production have been suggested to play a role in the development of T2DM (Zachariah et al., 2021). It has also been suggested that selenium may on the one hand stimulate biosynthesis and secretion of insulin in pancreatic beta‐cells and on the other may lead to a reduced insulin sensitivity in target cells. It has been put forward that both purported mechanisms could be mediated through the upregulation of selenoproteins involved in the antioxidant network, in particular, glutathione peroxidases and thioredoxin reductases. An upregulation of the antioxidant defence system may lead to a reduction in hydrogen peroxide (H2O2) concentrations in the target cells. As H2O2 is essential for insulin signalling in target cells, its reduction may lead to an impairment of the insulin signalling cascade. The effect on an increased insulin secretion has been proposed to be also due to a modulation of H2O2 concentrations in the β‐cells where H2O2 is essential for insulin biosynthesis (Steinbrenner, 2013; Steinbrenner et al., 2022). Mice with a global overexpression of glutathione peroxidase 1, which were fed a selenium‐adequate diet from 8 to 24 weeks of age, developed hyperglycaemia, hyperinsulinaemia, mild insulin resistance and obesity. The insulin‐induced activation of the insulin receptor was attenuated (McClung et al., 2004). An overexpression of β‐cell specific glutathione peroxidase 1, reversed hyperglycaemia in db/db mice, increased β‐cell volume and insulin granulation (Harmon et al., 2009). Glutathione peroxidase 1 knock‐out mice were protected from high‐fat‐diet‐induced insulin resistance and showed improved insulin signalling in muscle cells, but not hepatocytes (Loh et al., 2009). In another study, glutathione peroxidase 1 knock‐out mice had lower fasting plasma insulin concentrations, glucose‐stimulated insulin secretion and lower β‐cell mass as compared with the wild type (Wang et al., 2011). An involvement of selenoprotein P, the transport protein in blood, in the upregulation of the expression of glutathione peroxidase has been also suggested. It has been observed that the treatment of mice with purified human selenoprotein P induced glucose intolerance and insulin resistance, while selenoprotein P knock‐out was associated with improved glucose tolerance and insulin resistance. Also, in vitro studies seem to suggest an involvement of selenoprotein P in a potential adverse effect on the insulin signalling cascade (Misu et al., 2010).
The Panel notes that even though there is evidence that oxidative stress and the concomitant upregulation of the antioxidant networks may play a role in the pathogenesis of T2DM, convincing evidence lacks that this antioxidant network is upregulated as a sole response to excess selenium intakes, in particular considering that selenoprotein concentrations in humans reach a plateau beyond a certain selenium intake. Taking this into account, it has been speculated that additional selenium species beyond selenoproteins, i.e. low molecular weight selenometabolites might have specific actions on signalling and metabolic pathways (Steinbrenner et al., 2022).
The Panel considers that potential mechanisms by which excess intake of selenium may increase the risk of T2DM are not firmly established.
3.5.10.4. Overall conclusions on type 2 diabetes mellitus
There is evidence from RCTs for a positive and causal relationship between the intake of selenium and risk of T2DM (moderate level of certainty). The available BoE from observational studies and information regarding the mode of action cannot be used to modify the level of certainty in this conclusion.
3.5.11. All‐cause mortality
All‐cause mortality rate is included in the standalone main LoE.
3.5.11.1. Intervention studies
LoE1. Standalone main: All‐cause mortality rate
The effect of selenium supplementation vs placebo on all‐cause mortality was investigated in five intervention studies (NBT, Clark et al., 1996; NPC, Clark et al., 1996; SWOG, Marshall et al., 2011; DK‐PRECISE, Rayman et al., 2018; SELECT, Lippman et al., 2009). The supplemental doses of selenium ranged from 200 to 400 μg/day and the mean study intervention period ranged from 3 up to 12 years. The SELECT (Klein et al., 2011) and DK‐PRECISE (Rayman et al., 2018) also reported results for an additional observational follow‐up period of 3 and 10 years after cessation of the intervention, respectively.
The study size ranged between 437 and 17,448 participants; one trial included healthy men and women with relatively low selenium status (DK‐PRECISE), one trial included healthy men (SWOG), two trials included men at risk of prostate cancer (NBT, SELECT), and one trial involved men and women with confirmed history of non‐melanoma skin cancer (NPC). Number of deaths by study arm was recorded as part of the evaluation of adverse events/toxicity in the five trials. Mean plasma selenium concentration at baseline were between 87 (DK‐PRECISE) and 138 μg/L (SWOG) across trials.
An overview of eligible studies is provided in the evidence table presented in Appendix D.10.1. Key study characteristics, together with the effect estimates and related CIs, are plotted in Figure 24.
Figure 24.

- *Denotes estimated risk ratio and standard error.CI: confidence interval; d: day; duration: duration of the intervention and follow‐up phase for studies with an observational period (i.e. Klein et al., 2011; Rayman et al., 2018); DK: Denmark; FM: females and males; FUP: follow‐up; GN: highest dose group from each study; HR: hazard ratio; NBT: Negative Biopsy Trial; NZ: New Zealand; PR: Puerto Rico; PRECISE: PREvention of Cancer by Intervention with Selenium; RCT: randomised controlled trial; SD: standard deviation; Se: selenium; SELECT: Selenium and Vitamin E Cancer Prevention Trial; Suppl‐O: organic selenium supplements; SWOG: Southwest Oncology Group; US: United States; y: years.
There is no indication for an increased mortality risk in the groups which received selenium supplementation in the NPC trial, the NBT, the SWOG trial and the SELECT (dose: 200 to 400 μg/day; duration: 3 to 12 years) (Figure 24). In the DK‐PRECISE, the HR comparing 300 μg/day selenium to placebo was 1.62 (95% CI 0.66, 3.96) after 5 years of treatment and 1.59 (95% CI 1.02, 2.46) after an additional 10 year of observational follow‐up (Figure 22). Mortality rates in the groups receiving 100 and 200 μg/day selenium were similar to the control group (Rayman et al., 2018) (see evidence table in Appendix D.10.1). The Panel notes the excess mortality with selenium supplementation of 300 μg/day for 5 years in the DK‐PRECISE.
Overall, the Panel considers that the available BoE from RCTs does not suggest a positive relationship between selenium supplementation and all‐cause mortality.
3.5.11.2. Observational studies
LoE1. Standalone main: All‐cause mortality rate
Sixteen prospective observational cohorts investigated the relationship between selenium exposure and all‐cause mortality (Virtamo et al., 1985; Kilander et al., 2001; Wei et al., 2004; Akbaraly et al., 2005; Ray et al., 2006; González et al., 2007; Lauretani et al., 2008; Eaton et al., 2010; Bates et al., 2011; Alehagen et al., 2016; Henríquez‐Sánchez et al., 2016; Sun et al., 2016; Vinceti et al., 2016a; Giovannini et al., 2018; Schomburg et al., 2019; Li et al., 2020b).
The size of the cohorts ranged between 215 participants (Asturias cohort) and 73,854 participants (SWHS). The length of follow‐up ranged from 4 (Prevención con Dieta Mediterránea (PREDIMED) and Asturias cohorts) to 27 years (Reggio Emilia cohort). Cohorts were located in Europe (Spain, Finland, France, Italy, Sweden, UK), China, and the US. Most cohorts involved adult males and females, while one cohort involved females only, two cohorts involved males only.
Twelve studies assessed exposure as plasma or serum selenium (Virtamo et al., 1985; Kilander et al., 2001; Wei et al., 2004; Akbaraly et al., 2005; Ray et al., 2006; González et al., 2007; Lauretani et al., 2008; Eaton et al., 2010; Bates et al., 2011; Alehagen et al., 2016; Giovannini et al., 2018; Li et al., 2020b), one study assessed plasma selenoprotein P concentration (Schomburg et al., 2019), two studies assessed dietary intake of selenium through a SFFQ (Henríquez‐Sánchez et al., 2016; Sun et al., 2016), and one study investigated selenium exposure through drinking water (Vinceti et al., 2016a). The evidence table is in Appendix D.10.2. Key study characteristics, together with the risk estimates and related CIs, are plotted in Figures 25 and 26.
Figure 25.
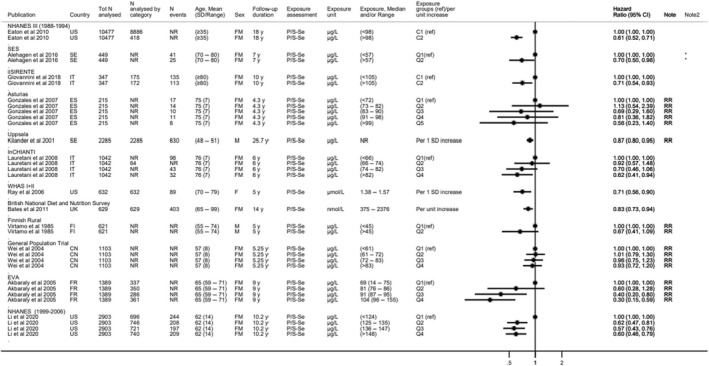
Observational studies on plasma/serum selenium and all‐cause mortality
-
*Denotes Q1 vs Q2‐Q3‐Q4.C: category; CI: confidence interval; CN: China; ES: Spain; EVA: Étude du Vieillissement Artériel; FI: Finland; FM: females and males; FR: France; ilSIRENTE: Invecchiamento e Longevità nel Sirente; InCHIANTI: Invecchiare in Chianti; IT: Italy; N: number; NHANES: National Health and Nutrition Examination Survey; NR: not reported; P/S‐Se: plasma/serum selenium; Q: quantile; ref: reference; RR: risk ratio; SD: standard deviation; SE: Sweden; Se: selenium; SES: cohort in the south‐east of Sweden; UK: United Kingdom; US: United States; WHAS: Women's Health and Aging Studies; y: years.
Figure 26.
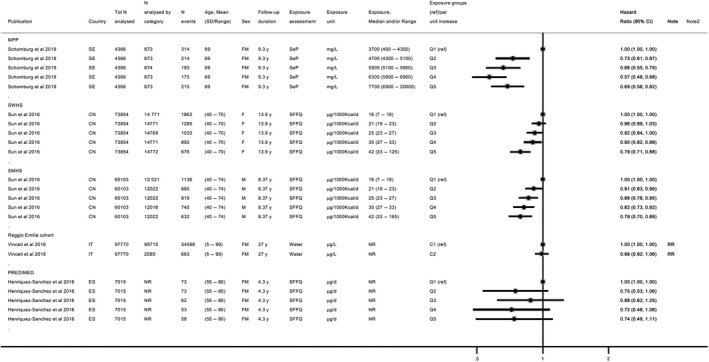
- C: category; CI: confidence interval; CN: China; d: day; ES: Spain; FM: females and males; IT: Italy; MPP: Malmö Preventive Project; N: number; NR: not reported; PREDIMED: Prevención con Dieta Mediterránea; Q: quantile; ref: reference; RR: risk ratio; SD: standard deviation; SE: Sweden; SeP: selenoprotein P; SFFQ: semiquantitative food frequency questionnaire; SWHS: Shanghai Women's Health; SMHS: Shanghai Men's Health study; y: years.
Overall, prospective observational studies investigating the association between plasma/serum selenium concentration (Figure 25) or other measures of selenium exposure (Figure 26) do not support a positive association with all‐cause mortality.
The Panel considers that the available BoE from observational studies does not suggest a positive relationship between dietary selenium intake and all‐cause mortality over the range of exposure investigated in these studies.
3.5.11.3. Overall conclusions on all‐cause mortality
The Panel considers that the available BoE does not suggest a positive relationship between dietary selenium intake and all‐cause mortality.
3.6. Hazard characterisation
3.6.1. Selection of a critical effect and reference point
The Panel considers that the progression of the effects of excess selenium on keratinised epithelia or integuments (hair, skin, nails) as seen in selenosis is a consequence of altered protein metabolism. Alopecia is an early observable feature and a well‐established adverse effect of excess selenium exposure (Sections 3.5.2.1 and 3.5.2.2). Thus, based on considerations of causality and biological relevance, the Panel selects alopecia as the critical endpoint on which to base a UL for selenium (Section 3.6.2).
There are indications from one RCT, the SELECT (Lippman et al., 2009), that at average selenium intakes of 330 μg/day (around 130 μg/day from the background diet plus 200 μg/day from supplements), the risk of developing alopecia is increased as compared to un‐supplemented individuals with similar background selenium intakes. This was accompanied by an increased risk of other features of selenium toxicity, such as dermatitis (Section 3.5.2.2). The Panel notes uncertainties related to the self‐reporting of adverse events in that study; signs and symptoms of selenosis were, however, recorded among the pre‐planned adverse events monitored in the study using standardised criteria. Strengths of this study also lie in its controlled setting regarding selenium intake (fixed supplemental dose, high level of compliance among participants), its large sample size and its long duration. The Panel uses the LOAEL of 330 μg/day identified from the SELECT as a RP for the derivation of an UL for selenium.
3.6.2. Derivation of a tolerable upper intake level
3.6.2.1. Adults
The Panel notes that men aged ≥ 50 years, recruited from the general population in the US, were involved in the SELECT. There is no indication from the literature that younger men may be more susceptible to selenium toxicity. The Panel considers that the results from the SELECT can be generalised to the European male adult population and that the LOAEL of 330 μg/day derived from that study is applicable to this population group.
The Panel considers that the large number (~8,700 individuals per arm) and characteristics of the participants involved in the SELECT adequately account for inter‐individual variability among adult men. No UF is required to account for this source of uncertainty.
The following uncertainties needs to be accounted for:
The use of a LOAEL as the RP for the derivation of the UL. Data are lacking to characterise the steepness of the dose–response curve. However, when compared to controls, an excess of less than 1% of the selenium supplemented participants exhibited alopecia in the SELECT, possibly indicating that the NOAEL might not be far from the LOAEL.
The lack of data in women. However, the Panel notes that there is no indication from the literature that women may be more susceptible than men to selenium toxicity.
Taking this into account and considering that alopecia is an early sign of selenium toxicity, is of mild nature and likely to be reversible, the Panel considers that an UF of 1.3 is sufficient to cover for the uncertainties. After rounding to the closest 5 μg, it results in an UL of 255 μg/day for adult men and women, which is judged by the Panel to be protective for adverse effects of excess selenium intake based on available data. The choice of an UF of 1.3 is based on expert judgement and is a pragmatic choice which allows to extrapolate the value for adults to infants and children (Sections 3.6.2.3 and 3.6.2.4). The application of a higher UF would result in ULs for younger age groups very close to background intakes of selenium observed in European countries (Sections 3.4.2 and 3.4.3). The Panel notes that no adverse effects related to selenium excess intake have been reported with the current background intake of selenium (intake from food, excluding food supplements) in European countries.
The Panel further notes that the UL value is lower than the mean selenium intake levels which have been associated with an increased number of T2DM cases in intervention studies (Section 3.5.10).
The UL covers selenium intake from all dietary sources based on available evidence, including the forms currently authorised for addition to food10 and use in food supplements 20 (i.e. sodium selenate, sodium hydrogen selenite, sodium selenite, L‐selenomethionine and selenium‐enriched yeast).
3.6.2.2. Pregnant and lactating women
There is no indication for a specific risk or increased susceptibility to adverse effects of excessive selenium intake during pregnancy or lactation from populations living in seleniferous areas.
In line with what was previously proposed by the SCF (2000a), the Panel considers that the UL for women also applies during pregnancy and lactation.
3.6.2.3. Children and adolescents
There are no data to support a derivation of a UL for children. On the other hand, there is no indication from the literature that children may be more susceptible than adults to selenium toxicity. The Panel considers that it is appropriate to extrapolate the UL from adults to children based on allometric scaling (body weight0.75) as it is the preferred method to adjust for metabolic differences between age groups, using reference body weights (EFSA NDA Panel, 2022).
ULs are established for the age categories proposed by the Panel in its guidance on establishing ULs (EFSA NDA Panel, 2022). Values are rounded to the closest 5 μg (Table 10).
Table 10.
UL for children and adolescents aged 1 year to 17 years
| Age range | Reference bw males and females (kg) (a) | UL males and females (μg/day) |
|---|---|---|
| 1–3 years | 11.9 | 70 |
| 4–6 years | 19.0 | 95 |
| 7–10 years | 28.7 | 130 |
| 11–14 years | 44.6 | 180 |
| 15–17 years | 60.3 | 230 |
bw: body weight; UL: Tolerable Upper Intake Level.
3.6.2.4. Infants
There are no data to support a derivation of an UL for infants. On the other hand, there is no indication from the literature that infants may be more susceptible than adults to selenium toxicity. The Panel considers that it is appropriate to extrapolate the UL from adults to infants aged ≥ 4 months based on allometric scaling (body weight0.75) as it is the preferred method to adjust for metabolic differences between age groups, using reference body weights (EFSA NDA Panel, 2022).
ULs established for infants aged 4–6 months and 7–11 months, respectively. Values are rounded to the closest 5 μg.
The Panel notes that breast milk concentration reflects maternal selenium intake and that there are large variations in breast milk selenium concentrations between countries or regions within a country (EFSA NDA Panel, 2014). In European countries, selenium concentrations in mature breast milk of 50 μg/L or above have been measured (Miklavcic et al., 2013; Krachler et al., 2000) corresponding to 40 μg per day or more based on an average consumption of 800 mL/day breast milk, which indicates that the UL established for infants aged 4 to 6 months can be considered sufficiently protective (Table 11).
Table 11.
UL for infants aged 4 to 11 months
| Age range | Reference bw males and females (kg) (a) | UL males and females (μg/day) |
|---|---|---|
| 4–6 months | 7.2 | 45 |
| 7–11 months | 8.6 | 55 |
bw: body weight; UL: Tolerable Upper Intake Level.
The averages of the median weights‐for‐age for boys and girls at 5 and 9 months, respectively, were used as reference weights (WHO Multicentre Growth Reference Study Group, 2006).
3.7. Risk characterisation
The ULs apply to the general European population and relate to selenium intake from all dietary sources.
Among adults, mean and high consumers (P95) selenium intake estimates, excluding supplements, are below the UL of 255 μg/day, across countries and age groups (Sections 3.4.2 and 3.4.3). The Panel considers that it is unlikely that adult consumers exceed the UL for selenium, except for regular users of food supplements containing high daily doses of selenium or regular consumers of Brazil nuts (Section 3.4.1).
Based on EFSA intake estimates, mean and high consumers' (P95) selenium intakes, excluding supplements, are below the ULs for infants and children, including adolescents, across all surveys (Section 3.4.2). Considering national reports published after EFSA's intake assessment (Section 3.4.3, Annex D), the Panel notes that high consumers (P95) intakes estimated for some groups of the Spanish and French surveys exceed the ULs. The Panel notes that no risk has been reported with the current levels of selenium intake in EU countries from food (excluding food supplements) in toddlers and children. The Panel, however, considers that selenium‐containing supplements in toddlers and children should be used with caution based on individual needs, upon consultation with a healthcare provider.
With respect to infants, the Panel also notes that exclusively formula‐fed infants being fed a formula with the currently highest permitted concentration of selenium as per Delegated Regulation (EU) 2016/127 21 (i.e. 8.6 μg/100 kcal), will consume on average 43 μg/day selenium, using mean formula intakes in the first half year of life of 500 kcal/day as a basis. High consumers can reach formula intakes of around 1,000 mL (EFSA Scientific Committee, 2017b) (or 700 kcal/day using as a basis the maximum energy content of a formula as permitted by Delegated Regulation (EU) 2016/127). The Panel notes that in these high consumers, the selenium intake would be 60 μg/day. Therefore, infants from 4–6 months and infants from 7–11 months for whom formula with the highest permitted concentration of selenium is predominant in the diet may exceed the UL of 45 μg/day and 55 μg/day, respectively, when such a formula is consumed on a regular basis.
Conclusions
The following ULs are established:
| Age group | UL males and females (μg/day) |
|---|---|
| 4–6 months | 45 |
| 7–11 months | 55 |
| 1–3 years | 70 |
| 4–6 years | 95 |
| 7–10 years | 130 |
| 11–14 years | 180 |
| 15–17 years | 230 |
| Adults | 255 |
| Pregnant women | 255 |
| Lactating women | 255 |
UL, Tolerable Upper Intake Level.
Recommendations for research
Biomarkers of exposure and effect that can be used for the risk assessment of selenium are limited. The identification and validation of biomarkers would allow a more refined hazard characterisation (i.e. dose–response assessment and characterisation of critical levels). Further investigation of homeostatic and adaptive responses to excess selenium intakes and of the mechanistic pathways involved in adverse effects of selenium is recommended, also with the aim of validating biomarkers (EFSA NDA Panel, 2022).
Further investigation of the relationship between excess selenium intake and the risk of diseases such as T2DM is needed to ascertain further the causality of reported associations (e.g. strengthening the understanding of underlying mode of actions).
Further investigation of age and sex susceptibility to selenium toxicity is needed. Genetic traits that may influence individual susceptibility (e.g. TMSe eliminators vs non eliminators) also requires further investigation.
Additional research is needed regarding potential differences in the toxicity profile of the various dietary forms of selenium (e.g. organic vs inorganic Se).
Data on the consumption of selenium‐containing fortified and enriched foods, and food supplements in EU populations are scarce. For the intake assessment of selenium and risk characterisation, there is a need to generate more data on selenium intake from food supplements and fortified/enriched foods among users of those products. Improved food composition databases, which include analytical results representative of the food supply of the survey population (using appropriate sampling methods), are also needed to enhance estimations of selenium intake.
Abbreviations
- ADME
absorption, distribution, metabolism and excretion
- AI
adequate intake
- ALP
alkaline phosphatase
- ALS
amyotrophic lateral sclerosis
- ALT
alanine aminotransferase
- AR
average requirement
- ASQ
Ages and Stages Questionnaire
- AST
aspartate aminotransferase
- ATBC
Alpha‐Tocopherol, Beta‐Carotene Cancer Prevention
- AU
Australia
- AUC
area under the curve
- BASC‐2
Behaviour Assessment System for Children 2nd edition
- BCC
basal cell carcinoma
- BD
Bangladesh
- BE
Belgium
- BEST
Bangladesh Vitamin E and Selenium Trial
- BMI
body mass index
- BoE
body of evidence
- BP
blood pressure
- BR
Brazil
- B‐Se
blood selenium
- BSID
Bayley Scales of Infant Development
- bw
body weight
- C
category
- CA
Canada
- CARET
Carotene and Retinol Efficacy Trial
- CC
case–control study
- CI
confidence interval
- CN
China
- CS
cross‐sectional study
- CSPPT
China Stroke Primary Prevention Trial
- DBP
diastolic blood pressure
- DE
Germany
- DFJT
Dongfeng‐Tongji cohort
- DK
Denmark
- DMSe
dimethlyselenide
- DNFCS
Dutch National Food Consumption Survey
- DRV
Dietary Reference Values
- ECOG
Eastern Cooperative Oncology Group
- EPIC
European Prospective Investigation into Cancer and Nutrition
- ES
Spain
- EVA
Étude du Vieillissement Artériel
- EVM
Expert Group on Vitamins and Minerals (UK)
- F
females
- FBG
fasting blood glucose
- FCDB
food composition database
- FEEDAP Panel
EFSA's Panel on Additives and Products or Substances used in Animal Feed
- FFQ
food frequency questionnaire
- FI
fasting insulin
- FI
Finland
- FINDIET
Finnish National Dietary Survey in Adults and Elderly
- FLEMENGHO
Flemish Study on Environment Genes and Health Outcomes
- FM
females and males
- FR
France
- FT3
free triiodothyronine
- FT4
free thyroxine
- FUP
follow‐up
- G
group
- GGT
gamma‐glutamyl transferase
- GN
highest dose group from each study
- GNPD
Global New Products Database (Mintel)
- GR
Greece
- HbA1c
glycated haemoglobin
- HCT
human controlled trial
- HOMA‐IR
homeostasis model assessment for insulin resistance
- HOMA‐β
homeostasis model assessment of β‐cell function
- HPFS
Health Professionals Follow‐Up Study
- HR
hazard ratio
- IE
Ireland
- ilSIRENTE
Invecchiamento e Longevità nel Sirente
- InCHIANTI
Invecchiare in Chianti
- INMT
indolethylamine N‐methyltransferase
- IOM
Institute of Medicine (US)
- IQR
interquartile range
- IR
Iran
- IRR
incidence rate ratio
- IT
Italy
- IVGTT
intravenous glucose tolerance test
- KORA
Cooperative Health Research in the Region of Augsburg
- KSPD
Kyoto Scale of Psychological Development
- LOAEL
lowest observed adverse effect level
- LoE
lines of evidence
- LV
Latvia
- M
males
- MCHES
Mobile Clinic Health Examination Survey
- MEC
Multiethnic Cohort
- MeSeCys
Se‐methyl‐selenocysteine
- MONICA
Monitoring of Trends and Determinants in Cardiovascular Diseases
- MPP
Malmö Preventive Project
- MS
Member State
- MSCA
McCarthy Scales of Children's Abilities
- MX
Mexico
- N
number
- NAFLD
non‐alcoholic fatty liver disease
- NBT
Negative Biopsy Trial
- NCC
nested case–control study
- nd
not defined
- NDA Panel
EFSA Panel on Nutrition, Novel Foods and Food Allergens
- NHANES
National Health and Nutrition Examination Survey
- NHMRC
National Health and Medical Research Council of Australia and New Zealand
- NHS
Nurses' Health Study
- NIH‐AARP
National Institutes of Health‐American Association of Retired Persons
- NL
The Netherlands
- NOAEL
No Observed Adverse Effect Level
- NPC
Nutritional Prevention of Cancer
- NR
not reported
- NSC
Nambour Skin Cancer
- N‐Se
nail selenium
- NTP
National Toxicology Program
- NZ
New Zealand
- OHAT
Office of Health Assessment and Translation
- OR
odd ratio
- ORDET
HORmones and Diet in the ETioliogy of Breast Cancer
- P/S‐Se
plasma/serum selenium
- P95
95th percentile
- PC
prospective cohort study
- PCPT
Prostate Cancer Prevention Trial
- PHS
Physicians' Health Study
- PLCOCS
Prostate, Lung, Colorectal, and Ovarian Cancer Screening Trial
- PR
Porto Rico
- PREADViSE
Alzheimer's Disease by Vitamin E and Selenium
- PRECISE
PREvention of Cancer by Intervention with Selenium
- PREDIMED
Prevención con Dieta Mediterránea
- PROGRESS
Programming Research in Obesity, Growth Environment and Social Stress
- PURE
Prospective Urban and Rural Epidemiology
- Q
quantile
- RBC
red blood cell
- RCT
randomised controlled trial
- ref
reference
- RoB
risk of bias
- ROS
reactive oxygen species
- RP
reference point
- RR
risk ratio
- SBP
systolic blood pressure
- SCC
squamous cell carcinoma
- SCF
Scientific Committee on Food
- SCP
Skin Cancer Prevention
- SD
standard deviation
- Se
selenium
- SE
standard error
- SE
Sweden
- SeCys
selenocysteine
- Sel/Cel
Selenium and Celecoxib
- SELECT
Selenium and Vitamin E Cancer Prevention Trial
- SeMet
l‐selenomethionine
- Se‐yeast
selenium‐enriched yeast
- SFFQ
semi‐quantitative food frequency questionnaire
- SMHS
Shanghai Men's Health study
- sQ
sub‐question
- SRS‐2
Social Responsiveness Scale 2nd edition
- Suppl‐I
inorganic selenium supplement
- Suppl‐O
organic selenium supplement
- SWHS
Shanghai Women's Health
- SWOG
Southwest Oncology Group
- T2DM
type 2 diabetes mellitus
- T3
triiodothyronine
- T4
thyroxine
- TDS
Total Diet Study
- TMSe
trimethylselenonium ion
- TPMT
thiopurine S‐methyltransferase
- T‐Se
toenail selenium
- TSH
thyroid‐stimulating hormone
- U/L
units per litre
- UA
uncertainty analysis
- UF
uncertainty factor
- UL
Tolerable Upper Intake Level
- ULSAM
Uppsala Longitudinal Study of Adult Men
- U‐Se
urinary selenium
- VITAL
VITamins And Lifestyle
- WBC
white blood cell
- WG
Working Group
- WHAS
Women's Health and Aging Studies
- WHO/FAO
World Health Organization/Food and Agriculture Organization of the United Nations
- WISC
Wechsler Intelligence Scale for Children
- WPPSI
Wechsler Preschool and Primary Scale of Intelligence
- γ‐Glu‐MeSeCys
γ‐glutamyl‐Se‐methyl‐selenocysteine
- ZA
South Africa
Appendix A – Characteristics of selenium biomarkers as measures of selenium intake
| Biomarker | Description | Influencing factors | Characteristics | Sensitivity as biomarker of selenium intake(b) |
|---|---|---|---|---|
| Serum/plasma (a) Se concentrations | Non‐cellular Se; organic (mainly selenoproteins (selenoprotein P, glutathione peroxidase 3, thioredoxin reductases)); albumin‐bound SeMet; selenosugars (Ward‐Deitrich et al., 2021) and inorganic selenium (Vinceti et al., 2015a; Filippini et al., 2018) |
‐ Sex, age (Sheehan and Halls, 1999; Muntau et al., 2002) ‐ Smoking status (Swanson et al., 1990; Alfthan and Neve, 1996; Kocyigit et al., 2001; Arnund et al., 2006; Filippini et al., 2018) ‐ Inflammation, disease (Miller et al., 1983; Nichol et al., 1998; Combs et al., 2012) ‐ Chemical nature of dietary Se ‐ GPX1 679 genotype (Combs et al., 2012) |
‐ Varies across geographical locations (Fordyce, 2013; Stoffaneller and Morse, 2015; Ibrahim et al., 2019) ‐ Responds to Se supplementation over wide range of supplemental intake (15–700 μg/d); dose‐dependent (Ashton et al., 2009) ‐ Higher response to organic Se, especially in non‐deficient populations (Thomson et al., 1982; Burk et al., 2006; Combs, 2015) ‐ Suitable for speciation analysis |
‐ Can detect changes in intake over short/medium‐term ‐ Can distinguish ‘high’ from ‘low’ consumers ‐ Low responsiveness to inorganic Se intake in Se‐replete populations (Neve, 1995) ‐ Population‐specific equations to predict dietary Se intake (Longnecker et al., 1996; Burk et al., 2006; Combs, 2015) |
| RBC Se concentrations | Mainly glutathione peroxidase 1 and Hb‐bound Se |
‐ Age (Lloyd et al., 1983) ‐ Chemical nature of dietary Se (Neve, 1995) ‐ Unaffected by inflammatory responses (Stefanowicz et al., 2013) |
‐ Responds to Se supplementation, more slowly than serum/plasma (Neve, 1995; Ashton et al., 2009) |
‐ Can detect changes in intake over medium/long‐term ‐ Can distinguish ‘high’ from ‘low’ consumers |
| Whole blood Se concentrations | Cellular and non‐cellular circulating Se |
‐ Age (Lloyd et al., 1983) ‐ Smoking status (Lloyd et al., 1983) ‐ Disease (Muecke et al., 2009; Muecke et al., 2018) ‐ Chemical nature of dietary Se |
‐ Varies across geographical locations (Fordyce, 2013) ‐ Responds to Se supplementation over wide range of supplemental intake (15–200(c) μg/d); dose‐dependent (Neve, 1995; Ashton et al., 2009) ‐ Suitable for speciation analysis |
‐ Can detect changes in intake over medium/long‐term ‐ Can distinguish ‘high’ from ‘low’ consumers ‐ Population‐specific to predict dietary Se intake (Yang et al., 1989b) |
| Urine Se concentrations | Primary route of Se elimination, mainly as selenosugars 1 and 3, trimethylselenonium ion (TMSe) and selenate and Se‐methylselenoneine |
‐ Sex ‐ Chemical nature of dietary Se (Burk et al., 2006) ‐ Se status ‐ Kidney function (Oster and Prellwitz, 1990) ‐ Physical activity (Rodriguez Rodriguez et al., 1995) ‐ GPX1 679 genotype (Combs et al., 2012) ‐ TMSe eliminators vs non‐eliminators (Kuehnelt et al., 2015; Lajin et al., 2016a) |
‐ Varies across geographical locations (Fordyce, 2013) ‐ Responds to Se supplementation over wide range of supplemental intake (100–700 μg/d); dose‐dependent (Yang et al., 1989b; Burk et al., 2006; Combs et al., 2012) ‐ Correlates with plasma Se over a wide range (Yang et al., 1989b; Sanz Alaejos and Diaz Romero, 1993) ‐ Suitable for speciation analysis |
‐ Can detect changes in intake over short term ‐ Can distinguish ‘high’ from ‘low consumers’ ‐ Population‐specific to predict dietary Se intake (Yang et al., 1989b; Sanz Alaejos and Diaz Romero, 1993; Longnecker et al., 1996; Combs, 2015) |
|
(Toe)nail/hair Se concentrations |
Deposition of Se |
‐ Age (Hunter et al., 1990) ‐ Smoking (Swanson et al., 1990; van den Brandt et al., 1993; Virtanen et al., 1996; Xun et al., 2011) ‐ Chemical nature of dietary Se (i.e. toenail Se content might not reflect inorganic Se exposure (Filippini et al., 2017)) ‐ Growth rate (Slotnick and Nriagu, 2006) ‐ External exposure (e.g. Se‐containing shampoos) |
‐ Varies across geographical locations (Morris et al., 1983; Hunter et al., 1990; Fordyce, 2013) ‐ Responds slowly to Se supplementation (weeks to months) (Gallagher et al., 1984; Longnecker et al., 1993) ‐ Correlation with Se intake (Hunter et al., 1990; Swanson et al., 1990) and blood/plasma Se (Yang et al., 1989a; Satia et al., 2006) over a wide range shown in some studies. Other studies found no or low association with Se intake (Hunter et al., 1990; Al‐Saleh and Billedo, 2006; Satia et al., 2006; Vinceti et al., 2012) or blood selenium (Satia et al., 2006; Vinceti et al., 2012; Chawla et al., 2020). |
‐ Can detect changes in intake over medium/long‐term ‐ Can distinguish ‘high’ from ‘low’ consumers ‐ Requires standardised procedures for sample collections and treatments as prone to contamination (Slotnick and Nriagu, 2006) ‐ Population‐specific to predict dietary Se intake based on toenail content (Longnecker et al., 1996) |
| Plasma selenoprotein P concentrations | 20%–70% of total plasma Se; mostly secreted in the liver (Saito, 2021) |
‐ Inflammation; oxidative stress (Saito, 2020; Vinceti et al., 2022); insulin levels and glucose metabolism (Speckmann et al., 2008; Mao and Teng, 2013; Schomburg, 2022) ‐ Se status ‐ Selenoprotein P polymorphisms (Meplan et al., 2007) |
‐ Responds rapidly to Se supplementation in populations with ‘low Se’ intake/status (Duffield et al., 1999; Hurst et al., 2010) ‐ Correlates with plasma/serum Se up to 80–90 μg/L (Hurst et al., 2013) |
‐ Responsive in population with Se status in the lowest range ‐ Plateau (i.e. maximum expression) in the higher range of Se intake (> ca. 60–70 μg/day) |
| Plasma, RBC, platelet and whole blood glutathione peroxidase activity |
‐ Glutathione peroxidase 3 in plasma (represents 10%–25% of plasma/whole blood Se) ‐ Glutathione peroxidase 1 in RBC ‐ Glutathione peroxidase 1 and glutathione peroxidase 4 in platelets |
‐ Sex, age ‐ Se status ‐ Race ‐ Physical activity (Tessier et al., 1995; Pograjc et al., 2012) ‐ Deficiencies in other nutrients ‐ Chemical nature of dietary Se (Thomson et al., 1982; Xia et al., 2005) ‐ Diseases, polymorphisms (Hurst et al., 2013) |
‐ Plasma glutathione peroxidase is a useful marker of Se intake/status in populations with low Se intake; it responds rapidly to supplementation. Correlates with plasma/serum Se up to 80 μg/L serum Se (Rea et al., 1979; Muller et al., 2020) ‐ RBC GPx glutathione peroxidase responds slowly to depletion and supplementation; plateau at plasma Se levels > 100 μg/L (Neve, 1995; zzn et al., 2000; Burk et al., 2006; Hurst et al., 2010; Combs et al., 2012) ‐ Platelet glutathione peroxidase responds rapidly to Se dietary changes; plateau at plasma Se levels > 100 μg/L (Alfthan et al., 1991; Neve, 1995; Burk et al., 2006; Hurst et al., 2010) |
‐ Responsive in population with Se status in the lowest range ‐ Plateau in the higher range of Se intakes (> ca. 40–60 μg/day) |
AAS: Atomic absorption spectrometer; d: day; ELISA: enzyme‐linked immunosorbent assay; GF: graphite‐furnace; Hb: haemoglobin; HG: Hydride‐generation; ICP‐MS: Inductively coupled plasma mass spectrometry; RBC: red blood cell; Se: selenium.
(a) Serum and plasma selenium concentrations are considered equivalent.
(b) Short term: hours/days; Medium term: weeks; Long term: months.
(c) Highest dose tested in available supplementation trials reporting on blood Se concentration.
Appendix B – Flow charts for the selection of human studies
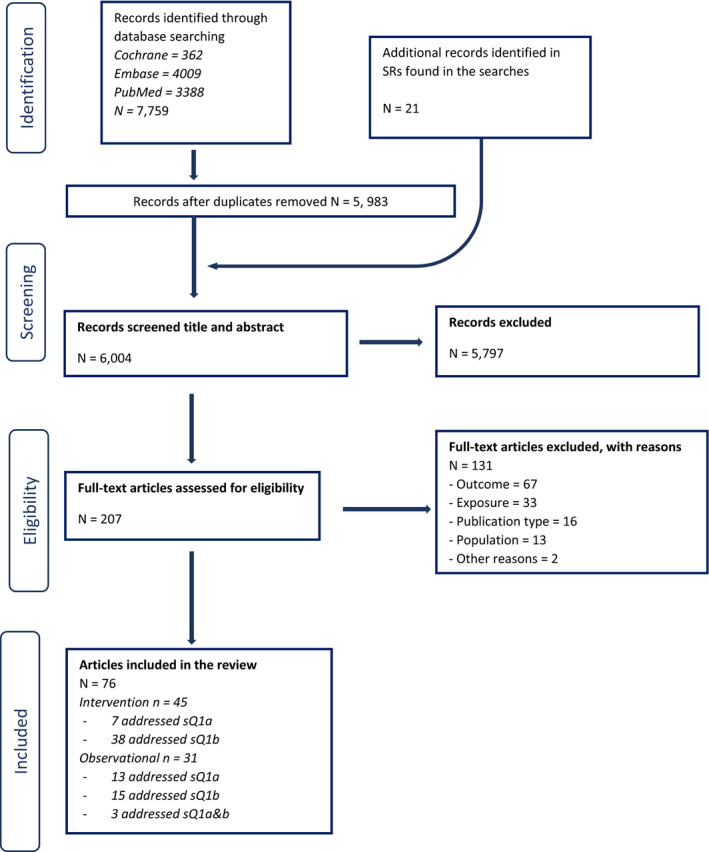
- Note: 26 articles identified from the search for sQ1 were included in the dose–response plasma‐intake modelling.
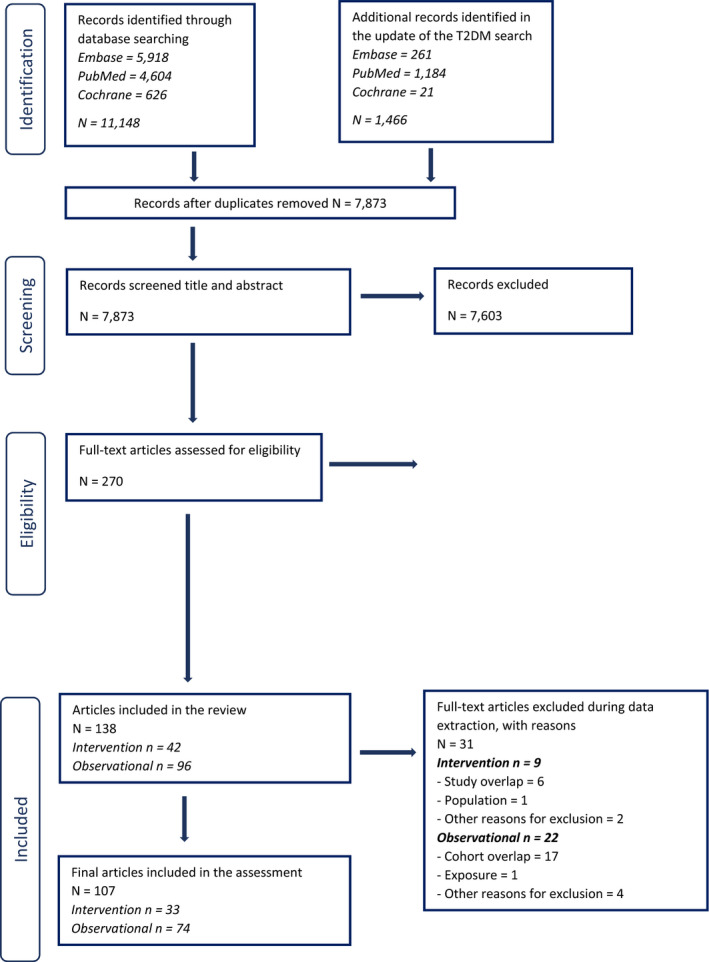
- Note: 17 studies identified through the search addressing sQ2 were included in the dose–response analysis for plasma‐intake.
Appendix C – RoB appraisal
C.1. Criteria used to appraise RoB in eligible studies
C.1.1. Human controlled trials
| Question | Rating | Explanation for expert judgement |
|---|---|---|
|
1. Was administered dose or exposure level adequately randomised? Key question |
+ | There is direct or indirect evidence that subjects were allocated to any study group (or intervention sequence for cross‐over studies) including controls using a method with a random component (including authors state that allocation was random, without description of the method used). Acceptable methods of randomisation include: referring to a random number table, using a computer random number generator, coin tossing, shuffling cards or envelopes, throwing dice, or drawing of lots. Restricted randomisation (e.g., blocked randomisation) to ensure particular allocation ratios will be considered low risk of bias. Similarly, stratified randomisation and minimisation approaches that attempt to minimise imbalance between groups on important prognostic factors (e.g., body weight) will be considered acceptable |
|
There is indirect evidence that subjects were allocated to study groups (or intervention sequence for cross‐over studies) using a method with a random component (i.e., authors state that allocation was random, without description of the method used) OR it is deemed that allocation without a clearly random component during the study would not appreciably bias results (e.g. cross‐over studies with no or unlikely carry‐over effects) | ||
| NR | There is insufficient information provided about how subjects (or clusters) were allocated to study groups | |
| − |
There is indirect evidence that subjects were allocated to study groups using a method with a non‐random component NOTE: Non‐random allocation methods may be systematic but have the potential to allow participants or researchers to anticipate the allocation to study groups. Such “quasi‐random” methods include alternation, assignment based on date of birth, case record number, or date of presentation to study. NR: There is insufficient information provided about how subjects were allocated to study groups (or intervention sequence for cross‐over studies) |
|
| There is direct evidence that subjects were allocated to study groups (or intervention sequence for cross‐over studies) using a non‐random method including judgement of the clinician, preference of the participant, the results of a laboratory test or a series of tests, or availability of the intervention. | ||
| 2. Was allocation to study groups adequately concealed? | + | There is direct evidence that at the time of recruitment the research personnel and subjects did not know what study group subjects were allocated to, and it is unlikely that they could have broken the blinding of allocation until after assignment was complete and irrevocable. Acceptable methods used to ensure allocation concealment include central allocation (including telephone, web‐based and pharmacy‐controlled randomisation); sequentially numbered drug containers of identical appearance; sequentially numbered, opaque, sealed envelopes; or equivalent methods |
|
There is indirect evidence that the research personnel and subjects did not know what study group subjects were allocated to and it is unlikely that they could have broken the blinding of allocation until after recruitment was complete and irrevocable OR It is deemed that lack of adequate allocation concealment would not appreciably bias results (e.g. cross‐over studies where all subjects receive all the study treatments) | ||
| NR | There is insufficient information provided about allocation to study groups. | |
| − |
There is indirect evidence that at the time of recruitment it was possible for the research personnel and subjects to know what study group subjects were allocated to (or treatment sequence for cross‐over studies), or it is likely that they could have broken the blinding of allocation before recruitment was complete and irrevocable NOTE: Inadequate methods include using an open random allocation schedule (e.g., a list of random numbers); assignment envelopes used without appropriate safeguards (e.g., if envelopes were unsealed or nonopaque or not sequentially numbered); alternation or rotation; date of birth; case record number; or any other explicitly unconcealed procedure. |
|
| There is direct evidence that at the time of recruitment it was possible for the research personnel and subjects to know what study group subjects were allocated to, or it is likely that they could have broken the blinding of allocation before recruitment was complete and irrevocable | ||
| 3. Were the research personnel and human subjects blinded to the study group during the study? | + | There is direct evidence that the subjects and research personnel were adequately blinded to study group, AND it is unlikely that they could have broken the blinding during the study. Methods used to ensure blinding include central allocation; sequentially numbered drug containers of identical appearance; sequentially numbered, opaque, sealed envelopes; or equivalent methods |
|
There is indirect evidence that the research personnel and subjects were adequately blinded to study group, AND it is unlikely that they could have broken the blinding during the study OR it is deemed that lack of adequate blinding during the study would not appreciably bias results (this would depend on the outcome). | ||
| NR | There is insufficient information provided about blinding to study group during the study | |
| − |
There is indirect evidence that it was possible for research personnel or subjects to infer the study group NOTE: Inadequate methods include using an open random allocation schedule (e.g., a list of random numbers), assignment envelopes used without appropriate safeguards, alternation or rotation; date of birth; case record number; or any other explicitly unconcealed procedure |
|
| There is direct evidence for lack of adequate blinding of the study group including no blinding or incomplete blinding of research personnel and subjects. For some treatments, such as behavioural interventions, allocation to study groups cannot be concealed | ||
| 4. Were outcome data complete without attrition or exclusion from analysis? | + |
There is direct evidence that there was no loss of subjects during the study and outcome data were complete, OR loss of subjects (i.e., incomplete outcome data) was adequately addressed(a) and reasons were documented when human subjects were removed from a study or analyses. Review authors should be confident that the participants included in the analysis are exactly those who were randomised into the trial. Acceptable handling of subject attrition includes: very little missing outcome data (e.g. < 10% in each group); reasons for missing subjects unlikely to be related to outcome; missing outcome data balanced in numbers across study groups, with similar reasons for missing data across groups, OR analyses (such as intention‐to‐treat analysis) in which missing data have been imputed using appropriate methods (insuring that the characteristics of subjects lost to follow up or with unavailable records are described in identical way and are not significantly different from those of the study participants). NOTE: Participants randomised but subsequently found not to be eligible need not always be considered as having missing outcome data. |
|
There is indirect evidence that loss of subjects (i.e., incomplete outcome data) was adequately addressed and reasons were documented when human subjects were removed from a study, OR it is deemed that the proportion lost to follow‐up would not appreciably bias results (e.g. < 20% in each group). This would include reports of no statistical differences in characteristics of subjects lost to follow up or with unavailable records from those of the study participants. Generally, the higher the ratio of participants with missing data to participants with events, the greater potential there is for bias. For studies with a long duration of follow‐up, some withdrawals for such reasons are inevitable. | ||
| NR | There is insufficient information provided about numbers of subjects lost to follow‐up | |
| − | There is indirect evidence that loss of subjects (i.e., incomplete outcome data) was unacceptably large (e.g. > 20% in each group) and not adequately addressed. | |
| There is direct evidence that loss of subjects (i.e., incomplete outcome data) was unacceptably large and not adequately addressed. Unacceptable handling of subject attrition includes: reason for missing outcome data likely to be related to true outcome, with either imbalance in numbers or reasons for missing data across study groups; or potentially inappropriate application of imputation. | ||
|
5. Can we be confident in the exposure characterisation? Key question |
+ | There is direct evidence that the exposure was adequately assessed, i.e. the sugar content of the intervention (and control) foods and/or beverages was measured during the study by e.g. food analysis AND there is direct evidence that the exposure was consistently administered (i.e., with the same method and time‐frame) across treatment groups (e.g., administration of study foods or diets was supervised; compliance was assessed) |
|
There is indirect evidence that the exposure was adequately assessed, i.e. the sugar content of the intervention (and control) foods and/or beverages was not measured but rather e.g. calculated from food composition tables, provided by the food manufacturer, calculated form the ingredients list; AND there is indirect evidence that exposure was consistently administered (i.e., with the same method and time‐frame) across treatment groups (e.g. administration of study foods or diets was not supervised but study products were provided by the investigators and compliance was assessed using food records, return of unconsumed foods, or a similar method). | ||
| NR | There is insufficient information provided about the validity of the exposure assessment method | |
| − | There is indirect evidence that the exposure was assessed using poorly validated methods (e.g. study products or diets were not provided by the investigators and compliance was not checked) | |
|
There is direct evidence that the exposure was assessed using poorly validated methods OR There is direct evidence of poor compliance with the intervention | ||
|
6. Can we be confident in the outcome assessment? Key question |
+ |
There is direct evidence that the outcome was assessed using well‐established methods (e.g., the “gold standard”). Such methods will depend on the outcome, but may include: objectively measured with diagnostic methods, measured by trained interviewers, obtained from registries AND subjects had been followed for the same length of time in all study groups, AND there is direct evidence that the outcome assessors (including study subjects, if outcomes were self‐reported) were adequately blinded to the study group, and it is unlikely that they could have broken the blinding prior to reporting outcomes. |
|
There is indirect evidence that the outcome was assessed using acceptable methods (i.e., deemed valid and reliable but not the gold standard). Such methods will depend on the outcome, but may include: proxy reporting of outcomes, mining data collected for other purposes AND subjects had been followed for the same length of time on average in all study groups (or if not, this has been accounted for using appropriate statistical approaches), OR it is deemed that the outcome assessment methods used would not appreciably bias results (e.g. when there is no information about the method but standard measurements are most likely, e.g. blood lipids, body weight in a research setting), AND there is indirect evidence that the outcome assessors (including study subjects, if outcomes were self‐reported) were adequately blinded to the study group, and it is unlikely that they could have broken the blinding prior to reporting outcomes, OR it is deemed that lack of adequate blinding of outcome assessors would not appreciably bias results, which is more likely to apply to objective outcome measures. | ||
| NR | There is insufficient information provided about blinding of outcome assessors OR there is no information about the outcome assessment method | |
| − |
There is indirect evidence that the outcome assessment method is an insensitive instrument (e.g., a questionnaire used to assess outcomes with no information on validation), OR the length of follow up differed by study group, OR there is indirect evidence that it was possible for outcome assessors (including study subjects if outcomes were self‐reported) to infer the study group prior to reporting outcomes AND it is deemed that the outcome assessment methods used could appreciably bias results |
|
|
There is direct evidence that the outcome assessment method is an insensitive instrument, OR the length of follow up differed by study group, OR there is direct evidence for lack of adequate blinding of outcome assessors (including study subjects if outcomes were self‐reported), including no blinding or incomplete blinding AND it is deemed that the outcome assessment method could have biased the results | ||
| 7. Were there no other potential threats to internal validity (e.g. statistical methods were appropriate and researchers adhered to the study protocol)? | + |
There is direct evidence that variables, other than the exposure and outcome, did not differ between groups during the course of the intervention in a way that could bias results/For cross‐over trials: there is direct evidence of no carry‐over effects, AND there is no evidence of differences in baseline characteristics between groups. |
|
There is indirect evidence that variables, other than the exposure and outcome, did not differ between groups during the course of the intervention in a way that could bias results/For cross‐over trials: there is indirect evidence of no carry‐over effects (e.g. presence of a sufficient washout period) AND there is no evidence of differences in baseline characteristics between groups, OR there is evidence that reported variables differed between groups at baseline/For cross‐over trials: no washout period AND it is deemed that these differences (or absence of washout for cross‐over trials) would not appreciably bias results (no concern or adequately addressed by analysis) | ||
| NR | There is no information about baseline characteristics by group (for parallel studies) | |
| − |
There is no information on variables, other than the exposure and outcome, which could bias the results would have differed between groups during the course of the intervention/ For cross‐over trials: no washout period AND there is indirect evidence that variables, other than the exposure and outcome, may have differed between groups during the course of the intervention in a way that could bias results/ For cross‐over trials: indirect evidence of carry‐over effects |
|
|
There is evidence that variables, other than the exposure and outcome, differed between groups during the intervention/For cross‐over trials: direct evidence of carry‐over effects AND It is deemed that these differences appreciably biased results (there is concern e.g. not adequately addressed by analysis) OR there is evidence that reported variables differed between groups at baseline AND it is deemed that these differences appreciably biased results (e.g. not adequately addressed by analysis) |
+: Low RoB; NR: not reported; −: high RoB.
(a) This will depend on the context in which the assessment is performed. For safety assessments the interest lies in particular in the population group who followed the protocol and consumed the intervention accordingly (PP population), while for efficacy assessments the intention‐to‐treat population is of greater importance, This item needs to be judged on a case‐by‐case basis as also other types of information supplied in the publication could be used in the assessment (e.g. considerations on the type of missingness of the data or sensitivity analyses presented in the publication).
C.1.2. Prospective observational studies
| Question | Rating | Explanation for expert judgement |
|---|---|---|
|
1. Did the study design or analysis account for important confounding? Key question |
++ |
There is direct evidence that appropriate adjustments or explicit considerations were made for primary covariates and confounders in the final analyses through the use of statistical models to reduce research‐specific bias including standardisation, matching, adjustment in multivariate model, stratification, propensity scoring, or other methods that were appropriately justified. Acceptable consideration of appropriate adjustment factors includes cases when the factor is not included in the final adjustment model because the author conducted analyses that indicated it did not need to be included, AND there is direct evidence that primary covariates and confounders were assessed using valid and reliable measurements, AND there is direct evidence that other exposures anticipated to bias results were not present or were appropriately measured and adjusted for.
Note: This applies to:
|
| + |
There is indirect evidence that appropriate adjustments were made, OR it is deemed that not considering or only considering a partial list of covariates or confounders in the final analyses would not appreciably bias results. AND there is evidence (direct or indirect) that primary covariates and confounders were assessed using valid and reliable measurements, OR it is deemed that the measures used would not appreciably bias results (i.e., the authors justified the validity of the measures from previously published research), AND there is evidence (direct or indirect) that other co‐exposures anticipated to bias results were not present or were appropriately adjusted for, OR it is deemed that co‐exposures present would not appreciably bias results. Note: This applies to studies which characterised exposure though dietary questionnaire (e.g. FFQ) and accounted for age, sex, BMI as potential confounders, but did not control for total energy intake |
|
| NR |
There is insufficient information provided about the distribution of known confounders, OR there is indirect evidence that primary covariates and confounders were assessed using measurements of unknown validity, OR there is insufficient information provided about the measurement techniques used to assess primary covariates and confounders, OR there is insufficient information provided about co‐exposures in occupational studies or studies of contaminated sites where high exposures to other chemical exposures would have been reasonably anticipated |
|
| − |
There is indirect evidence that the distribution of potential confounders differed between the groups and was not appropriately adjusted for in the final analyses OR there is indirect evidence that primary covariates and confounders were assessed using measurements of unknown validity, OR there is indirect evidence that there was an unbalanced provision of additional co‐exposures across the primary study groups, which were not appropriately adjusted for |
|
| − − |
There is direct evidence that the distribution of primary covariates and known confounders differed between the groups, confounding was demonstrated, and was not appropriately adjusted for in the final analyses, OR there is direct evidence that primary covariates and confounders were assessed using non valid measurements, OR there is direct evidence that there was an unbalanced provision of additional co‐exposures across the primary study groups, which were not appropriately adjusted for. |
|
| 2. Were outcome data complete without attrition or exclusion from analysis? | ++ |
There is direct evidence that loss of subjects (i.e., incomplete outcome data) was adequately addressed and reasons were documented when subjects were removed from a study. Acceptable handling of subject attrition includes:
OR missing data have been imputed using appropriate methods and characteristics of subjects lost to follow up or with unavailable records are described in identical way and are not significantly different from those of the study participants. |
| + |
There is indirect evidence that loss of subjects (i.e., incomplete outcome data) was adequately addressed and reasons were documented when subjects were removed from a study, OR it is deemed that the proportion lost to follow‐up would not appreciably bias results (i.e. losses are not expected to be related to both exposure and outcome, considering N of subjects included over N of subjects eligible for the analysis). This would include reports of no statistical differences in characteristics of subjects lost to follow up or with unavailable records from those of the study participants. Generally, the higher the ratio of participants with missing data to participants with events, the greater potential there is for bias. For studies with a long duration of follow‐up, some withdrawals for such reasons are inevitable. |
|
| NR | There is insufficient information provided about numbers of subjects lost to follow‐up | |
| − | There is indirect evidence that loss of subjects (i.e., incomplete outcome data) was unacceptably large (greater than 20% in each group, Genaidy et al., 2007) and not adequately addressed | |
| − − |
There is direct evidence that loss of subjects (i.e., incomplete outcome data) was unacceptably large and not adequately addressed. Unacceptable handling of subject attrition includes:
|
|
| 3. Did selection of study participants result in appropriate comparison groups? | ++ |
Cohort studies: There is direct evidence that subjects (both exposed and non‐exposed) were similar (e.g., recruited from the same eligible population, recruited with the same method of ascertainment using the same inclusion and exclusion criteria, and were of similar age and health status), recruited within the same time frame Case–control studies: There is direct evidence that cases and controls were similar (e.g., recruited from the same eligible population including being of similar age, gender, ethnicity, and eligibility criteria other than outcome of interest as appropriate), recruited within the same time frame, and controls are described as having no history of the outcome. Note: A study will be considered low risk of bias if baseline characteristics of groups differed but these differences were considered as potential confounding or stratification variables |
| + |
Cohort studies: There is indirect evidence that subjects (both exposed and non‐exposed) were similar (e.g., recruited from the same eligible population, recruited with the same method of ascertainment using the same inclusion and exclusion criteria, and were of similar age and health status), recruited within the same time frame OR differences between groups would not appreciably bias results. Case–control studies: There is indirect evidence that cases and controls were similar (e.g., recruited from the same eligible population, recruited with the same method of ascertainment using the same inclusion and exclusion criteria, and were of similar age), recruited within the same time frame, and controls are described as having no history of the outcome, OR differences between cases and controls would not appreciably bias results |
|
| NR |
Cohort studies: there is insufficient information provided about the comparison group Case–control studies: there is insufficient information provided about the appropriateness of controls |
|
| − |
Cohort studies: There is indirect evidence that subjects (both exposed and non‐exposed) were not similar, recruited within very different time frames Case–control studies: There is direct evidence that controls were drawn from a very dissimilar population than cases or recruited within very different time frames, Note: A study will be considered low risk of bias if baseline characteristics of groups differed but these differences were considered as potential confounding or stratification variables |
|
| − − |
Cohort studies: There is direct evidence that subjects (both exposed and non‐exposed) were not similar, recruited within very different time frames Case–control studies: There is direct evidence that controls were drawn from a very dissimilar population than cases or recruited within very different time frames. Note: A study will be considered low risk of bias if baseline characteristics of groups differed but these differences were considered as potential confounding or stratification variables |
|
|
4. Can we be confident in the exposure characterisation? Key question |
++ |
There is direct evidence that exposure was consistently assessed (i.e., under the same method and time‐frame) using well‐established methods that directly measure exposure (e.g., measurement of the chemical in air or measurement of the chemical in blood, plasma, urine, etc.), OR exposure was assessed using less‐established methods that directly measure exposure and are validated against well‐established methods. Note: This applies to studies which characterised Se exposure through repeated measurements of plasma/serum selenium. Graphite furnace atomic absorption spectrometric method and inductively coupled plasma tandem mass spectrometry are considered reliable methods |
| + |
There is indirect evidence that the exposure was consistently assessed using well‐established methods that directly measure exposure, OR exposure was assessed using indirect measures (e.g., questionnaire or occupational exposure assessment by a certified industrial hygienist) that have been validated or empirically shown to be consistent with methods that directly measure exposure (i.e., inter‐methods validation: one method vs. another).
Note: This applies to studies which characterised exposure through:
|
|
| NR |
There is insufficient information provided about the exposure assessment, including validity and reliability, but no evidence for concern about the method used Note: This applies to studies which characterised exposure through toenails concentration but do not describe measures applied to avoid contamination of the samples |
|
| − |
There is indirect evidence that the exposure was assessed using poorly validated methods that directly measure exposure, OR there is direct evidence that the exposure was assessed using indirect measures that have not been validated or empirically shown to be consistent with methods that directly measure exposure (e.g., a job‐exposure matrix or self‐report without validation) |
|
| − − |
There is direct evidence that the exposure was assessed using methods with poor validity, OR evidence of exposure misclassification (e.g., differential recall of self‐reported exposure). |
|
|
5. Can we be confident in the outcome assessment? Key question |
++ |
There is direct evidence that the outcome was assessed using well‐established methods AND subjects had been followed for the same length of time in all study groups. Acceptable assessment methods will depend on the outcome, but examples of such methods may include: objectively measured with diagnostic methods, measured by trained interviewers, obtained from registries (Shamliyan et al. 2010), AND there is direct evidence that the outcome assessors (including study subjects, if outcomes were self‐reported) were adequately blinded to the study group, and it is unlikely that they could have broken the blinding prior to reporting outcomes. Note: This applies to studies in which incident cases of T2DM were identified based on systematic clinical screening of the participants (i.e. measures of fasting glucose, glucose at 2 h during OGTT, glycated haemoglobin for diagnostic purposes). Diagnostic based on single fasting glucose measurement is considered acceptable. |
| + |
There is indirect evidence that the outcome was assessed using acceptable methods (i.e., deemed valid and reliable but not the gold standard) AND subjects had been followed for the same length of time in all study groups [Acceptable, but not ideal assessment methods will depend on the outcome, but examples of such methods may include proxy reporting of outcomes and mining of data collected for other purposes] OR it is deemed that the outcome assessment methods used would not appreciably bias results, AND there is indirect evidence that the outcome assessors (including study subjects, if outcomes were self‐reported) were adequately blinded to the study group, and it is unlikely that they could have broken the blinding prior to reporting outcomes, OR it is deemed that lack of adequate blinding of outcome assessors would not appreciably bias results, which is more likely to apply to objective outcome measures
Note: This applies to studies in which diagnosis of T2DM was based on self‐reporting (e.g. self‐report of a diabetes diagnosis or use of diabetes medication)
Differential underreporting of T2DM in ‘high’ selenium exposure groups is considered unlikely. Non‐differentiable underreporting across exposure groups is not expected to bias rate ratios. |
|
| NR | There is insufficient information provided about blinding of outcome assessors | |
| − |
There is indirect evidence that the outcome assessment method is an insensitive instrument (e.g., a questionnaire used to assess outcomes with no information on validation), OR the length of follow up differed by study group, OR there is indirect evidence that it was possible for outcome assessors (including study subjects if outcomes were self‐reported) to infer the study group prior to reporting outcomes |
|
| − − |
There is direct evidence that the outcome assessment method is an insensitive instrument, OR the length of follow up differed by study group, OR there is direct evidence for lack of adequate blinding of outcome assessors (including study subjects if outcomes were self‐reported), including no blinding or incomplete blinding. |
++: Definitely low RoB; +: probably low RoB; NR: not reported; −: probably high RoB; − −: definitely high RoB.
Appendix D – Evidence tables
D.1. Clinical effects associated with selenosis
D.1.1. Intervention studies on clinical effects of selenosis
|
Reference Study Country |
Design N randomised/completed Duration(a) Recruitment criteria |
Subject characteristics at baseline(b) | Intervention(b) | Outcomes assessed | Results |
|---|---|---|---|---|---|
|
Lippman et al. (2009) SELECT USA, Canada, and Puerto Rico |
RCT G1, placebo: 8,856/8,696 G2, 200 μg Se/d: 8,910/8,752 Duration (median (min‐max)): 5.46 (4.17–7.33) yr Aged ≥ 50 yr (African American men) or ≥ 55 yr (all other men); serum prostate‐specific antigen level ≤ 4 ng/mL; DRE not suspicious for prostate cancer |
Sex: M Age (yr, median (IQR)) G1: 62.6 (58.1–67.8) G2: 62.6 (58.2–68.0) BMI (kg/m 2 ): NR Ethnicity (Caucasian, %) G1: 79 G2: 79 Serum Se (μg/L, median (IQR)) G1: 137.6 (124.7–151.8) G2: 135.0 (123.4–145.9) Se intake: NR |
L‐selenomethionine (200 μg Se/d) vs placebo Adherence, pill counts (%) G1: 85% at yr 1; 69% at yr 5 G2: 84% at yr 1; 69% at yr 5 Serum Se at 4 yr follow up, μg/L (median (IQR)) G1: 140.1 (124.3–150.8) G2: 251.6 (218.7–275.0) |
Adverse events self‐reported every 6 months during study site visit (or phone call): alopecia, dermatitis, halitosis, nail changes, fatigue, nausea. NCI Common Toxicity Criteria used for alopecia, nail changes, fatigue, and nausea. Halitosis and dermatitis defined in study protocol. |
RR for adverse events (99% CI) Alopecia: 1.28 (1.01, 1.62) Dermatitis grade 1–2: 1.17 (1.00, 1.35) Dermatitis grade 3–4: 1.74 (0.56, 5.44) Halitosis: 1.17 (0.99, 1.38) Nail changes: 1.04 (0.94, 1.16) Fatigue grade 1–2: 1.09 (0.95, 1.26) Fatigue grade 3–4: 0.87 (0.40, 1.88) Nausea grade 1–2: 1.19 (0.94, 1.52) Nausea grade 3: 0.99 (0.30, 3.34) Grade 1 = mild, 2 = moderate, 3 = severe, 4 = life‐threatening. |
|
Algotar et al. (2013b) NBT USA and New Zealand |
RCT G1, placebo: 232/0 G2, 200 μg Se/d: 234/0 G2, 400 μg Se/d: 233/0 Duration (median): 35 mo High risk of prostate cancer, as evidenced by PSA > 4 ng/mL and/or suspicious digital rectal examination and/or PSA velocity (rate of PSA change over time) > 0.75 ng/mL per year; undergone a prostate biopsy negative for cancer within 12 mo of enrolment. |
Sex: M Age (yr) G1: 65.5 ± 7.4 G2: 65.2 ± 8.0 G3: 65.5 ± 7.7 BMI (kg/m 2 ): NR Ethnicity (Caucasian, %) G1: 84.2 G2: 83.7 G3: 82.6 Plasma Se (μg/L) G1: 124.5 ± 24.7 G2: 126.6 ± 26.9 G3: 127.2 ± 24.8 Se intake: NR |
Selenised yeast (200 μg Se/d or 400 μg Se/d or) vs placebo Adherence, pill counts (%) G1: 92.1 G2: 93.2 G3: 91.2 |
Adverse events self‐reported to study staff every 6 months during study visit: Brittle nail and hair, garlic breath, liver/kidney abnormality (criteria NR) |
N (%) adverse events Brittle nail and hair: G1: 26 (11.2) G2: 24 (10.3) G3: 20 (8.6) p = 0.63 Garlic breath, liver/kidney abnormality: G1: 14 (6.0) G2: 13 (5.6) G3: 11 (4.7) p = 0.82 |
|
Winther et al. (2015) DK PRECISE Denmark |
RCT G1, placebo: 126/90 G2, 100 μg Se/d: 124/91 G3, 200 μg Se/d: 122/90 G4, 300 μg Se/d: 119/90 Duration (max): 5 yr Aged 60–74 yr; taking > 80% pills in the run‐in phase; SWOG performance status score ≤ 1; no active liver or kidney disease; no previous diagnosis of cancer (excluding NMSC); no diagnosed HIV infection; not receiving immunosuppressive therapy; not receiving ≥ 50 mg/day of Se supplements in the previous 6 mo |
Sex (% F): 48.1% Age (yr): 66.1 ± 4.1 BMI (kg/m 2 ): NR Ethnicity: Caucasian Plasma Se (ng/g, median (IQR)) G1: 85 (20) G2: 86 (18) G3: 88 (22) G4: 84 (19) Se intake: NR |
Se‐enriched yeast (100 μg Se/d or 200 μg Se/d 300 μg Se/d) vs placebo Adherence: NR Serum selenium at 5 yr follow up, μg/L (median (IQR)) G1: 85 (16) G2: 157 (33) G3: 217 (46) G4: 271 (106) |
‘Adverse effects’ monitored during the intervention. Method and criteria NR. |
25 participants withdrew due to ‘adverse effects’, which included hair loss, skin reactions, grooved nails N of adverse effects, first 6 months/from 7th month until end of study G1: 3/3 G2: 0/5 G3: 2/6 G4: 2/4 35 participants withdrew due to ‘non‐fatal adverse events’ (not described) |
|
Thompson et al. (2016) Sel/Cel USA |
RCT G1, placebo: 914/912 G2, 200 μg Se/d: 910/908 Duration (median (max)): 2.75 (0–7.0) yr Aged 40–80 yr; had undergone removal of ≥ 1 colorectal adenomas ≥ 3 mm within 6 mo prior to random assignment; 200 participants had one or more advanced adenomas (i.e., adenomas ≥ 10 mm, villous histology, or high‐grade dysplasia). |
Sex (% F) G1: 34.0 G2: 36.7 Age (yr) G1: 62.6 ± 8.9 G2: 63.2 ± 9.0 BMI (kg/m 2 ) G1: 29.2 ± 5.1 G2: 29.1 ± 5.1 Ethnicity (white, %) G1: 93.3 G2: 94.4 Plasma Se (μg/L), median (Q1, Q3) G1: 135.2 (120.8, 153.3) G2: 135.5 (121.5, 151.8) Se intake: NR |
Selenised yeast (200 μg Se/d) vs placebo Adherence: NR |
Adverse events included brittle hair and/or nails. Method and criteria NR. |
N of events/participants (event rate/1,000 PY) Brittle hair and/or nails G1: 35/912 (13.8) G2: 30/908 (12.2) HR (95% CI) = 0.86 (0.53, 1.39); p = 0.53 |
|
Fairris et al. (1989) USA |
RCT G1, placebo: 22/20 G2, 600 μg/d Se: 23/21 G3, 600 μg/d Se + 600 IU vitamin E/d: 24/24 Duration: 12 wk (+12 wk follow up after treatment cessation) Aged 18–70 yr; patients with moderate or severe chronic stable plaque psoriasis |
Sex (% F): 51 Age (mean (min‐max), yr) G1: 43 (27–59) G2: 39 (23–66) G3: 44 (20–68) BMI (kg/m 2 ): NR Ethnicity: NR Plasma Se (μmol/L) 1.19 ± 0.17 Se intake: NR |
Se‐enriched yeast (600 μg Se/d or 600 μg Se/d + 600 IU vitamin E/d) vs placebo Adherence: NR |
Adverse events self‐reported at 2, 4, 8, 12 and 24 wk: garlic breath, nausea, vomiting, loss of nails and alopecia. Method and criteria NR. | ‘None of the patients developed symptoms or signs that could be related to selenium toxicity’ (Data not shown). |
BMI: body mass index; CI: confidence interval; d: day; DK: Denmark; DRE: digital rectal examination; F: females; Gx: group x; HR: hazard ratio; IU: International Unit; IQR: interquartile range; M: males; mo: month; NBT: Negative Biopsy Trial; NCI: National Cancer Institute; NMSC: non‐melanoma skin cancer; NR: Not Reported; PSA: prostate specific antigen; PRECISE: PREvention of Cancer by Intervention with Selenium; PY: person years; Qx: quartile x; RCT: randomised controlled trial; RR: risk ratio; Se: selenium; Sel/Cel: The Selenium and Celecoxib Trial; SELECT: Selenium and Vitamin E Cancer Prevention Trial; SWOG: Southwest Oncology Group; USA: United States of America; wk: week; yr: year.
(a) Duration = duration of the treatment phase, unless specified otherwise.
(b) Mean ± SD, unless specified otherwise.
D.1.2. Observational studies on clinical effects of selenosis
|
Cohort name Country Reference |
Original Cohort (N total) Exclusion criteria Study population (n, sex and age at baseline(a)) |
Ascertainment of outcome |
Exposure groups(a) n |
Results |
|---|---|---|---|---|
|
China Yang et al. (1989a) Cross‐sectional |
N = 349 Population sampled: individuals living is a seleniferous area in Enshi County, China Exclusion criteria: NR n = 237 Sex: M and F Age (yr): 1–71+ |
Morphological changes in fingernails used as the main criteria for the presence of selenosis in the ‘high Se’ area. Selenosis was categorised in: (++) persistent or ongoing fingernail disease over yr; (+) fingernail thickening and stratifying + ≥ 1 of the following signs: history of severe hair or nail loss; deformed or brittle fingernails; distinct transverse or longitudinal ridges of the nails; white area at the base of the nail; persistent fall of brow hair and itchiness of shaded skin OR the presence of ≥ 4 of the latter signs. |
Whole blood Se |
N cases with signs, per category: (++) 6 (+) 54 Whole blood Se of 5 individuals with long‐persisting, distinct clinical signs, ranged from 1.054 to 1.854 mg/L. Minimal whole blood Se of 1.054 mg/L taken as the marginal level for Se toxicity; equivalent to 910 μg/d based on equation from Yang et al. (1989b) |
|
China Yang et al. (1989a) Cross‐sectional Sub‐study on children dental health |
N = NR Population sampled: children from “high”, “medium” and “low” Se sites in Enshi County, China Exclusion criteria: NR n = 402 Sex: NR Age (yr): 7–14 |
Mottled enamel teeth and dental caries; methods NR |
Whole blood Se (mg/L) Low: 0.13 ± 0.02; n = 163 Medium: 0.37 ± 0.32; n = 108 High: 1.57 ± 0.44; n = 131 |
N cases (%) with mottled enamel teeth/dental caries, per Se site: Low: 0 (0%)/39 (23.9%) Medium: 53 (49.1%)/9 (8.3%) High: 125 (95.4%)/3 (2.3%) |
|
CARUSO Project Brazil Lemire et al. (2012) Cross‐sectional |
N = 448 Population sampled: Population living in the Lower Tapajós River region of the Brazilian Amazon, with a local traditional diet that includes important Se sources. Exclusion criteria: Pregnant and breastfeeding women, reported stroke, taking psychotropic medication, missing data for blood or plasma biomarkers. n = 407 Sex (% F): 50 Age (yr): 39.9 ± 14.3 |
A nurse without the information of Se exposure of the individuals, performed clinical examinations an examination of the clinical dermal (hair, body hair, fingernails, toenails and skin), garlic odour breath and dermal signs of Se toxicity. Alopecia and early hair damage (hair shininess and split hairs) were evaluated on a gradient (absent, mild, more than mild, and important). Nails abnormalities, the number of fingernail and toenail whitlows and the presence specific nails damage were examined and noted. General skin irritations were noted and specific skin‐related signs of selenosis on different parts of the body were also carefully examined. |
Whole blood Se (μg/L; median, max): 228.4, 1,500.2 Plasma Se (μg/L; median, max): 134.8, 913.2 Normal Whole blood < 560 μg/L Plasma < 328 μg/L N = 360 High Whole blood ≥ 560 < 1,000 μg/L Plasma ≥ 328 < 520 μg/L N = 15 Very high Whole blood ≥ 1,000 μg/L Plasma ≥ 520 μg/L N = 11 |
N cases with signs, per Se group Hair dry and brittle, easily broken at scalp Normal 2 High 0 Very high 0 Sparse head hair Normal 21 High 1 Very high 0 Sparse body hair Normal 163 High 9 Very high 4 Abnormal fingernails Normal 149 High 7 Very high 5 Fingernails with whitlow Normal 52 High 1 Very high 2 Longitudinal/transversal fingernail streaks Normal 4/3 High 0/0 Very high 1/0 Symmetric fingernail thickening and stratifying Normal 8 High 0 Very high 0 Deformed and brittle fingernail Normal 8 High 0 Very high 0 Garlic breath Normal 56 High 3 Very high 1 |
|
India Chawla et al. (2020) Cross‐sectional |
N = 680 Population sampled: Residents of 7 villages pertaining to a seleniferous area in Punjab, India. Exclusion criteria: NR n = 680 Sex (% F): 61 Age (yr, median (IQR)): 43 (32–52) |
Method to identify clinical signs of selenosis NR |
Serum Se (μg/L, median (IQR)) 171.30 (111.7, 400.5) N = 238 Hair Se (μg/g, median (IQR)) 1.25 (0.75, 2.42) N = 521 Nail Se Se (μg/g, median (IQR)) 5.69 (4.37, 8.42) N = 513 |
N cases with sign present/sign not present; OR (95% CI) of clinical signs according to Se exposure biomarkers above the median compared to below the median (ref.) , adjusted for age, sex, socio‐economic status Hair loss Serum Se: 22/97 vs 33/86; 0.61 (0.33, 1.15) Hair Se: 57/203 vs 39/222; 1.69 (1.07, 2.66) Nail Se: 46/211 vs 49/207; 0.92 (0.59, 1.44) Hair abnormalities Serum Se: 72/47 vs 58/61; 1.56 (0.92, 2.65) Hair Se: 57/203 vs 39/222; 2.71 (1.86, 3.96) Nail Se: 46/211 vs 49/207; 1.35 (0.94, 1.95) Nail abnormalities Serum Se: 77/42 vs 55/64; 2.06 (1.21, 3.50) Hair Se: 139/121 vs 78/183; 2.72 (1.88, 3.93) Nail Se: 122/13 vs 89/167; 1.71 (1.19, 2.44) Garlic odour breath Serum Se: 6/113 vs 2/117; 3.45 (0.59, 20.34) Hair Se: 12/249 vs 14/246; 0.88 (0.39, 1.96) Nail Se: 3.48 (1.37, 8.85) Selenosis* 7/102 vs 1/109 Serum Se 7.56 (0.87, 65.39) Nail Se 3.48 (0.68, 17.92) *Considered as a collection of all clinical signs linked to overexposure to selenium. |
|
USA Longnecker et al. (1991) Cross‐sectional |
N = 142 Population sampled: Year 1: households selected at random from telephone books for western South Dakota and eastern Wyoming’ (n = 49) and ranches with suspected unusually high because of selenosis in livestock (n = 29) Year 2: additional group of subjects suspected of having high Se intakes (because of selenosis in livestock) + ≥ 1 adult in household with serum Se >2. 10 mol/L (n = 64) Exclusion criteria: NR n = 142 Sex (% F): 53 Age: NR |
Self‐administered questionnaire to collect data on symptoms of Se toxicity; collected once every season in yr 1; in summer and winter fin yr 2. Photographs of subjects' thumbnails taken with a camera equipped with a macro lens and a ring light; taken once, in summer of yr 1 and yr 2; a board‐certified dermatologist, unaware of the subjects' laboratory results, evaluated the photographs Standardised physical examinations performed by a physician, focusing on dermatologic and neurologic examinations (e.g. signs of interest included muscle weakness, asymmetrical reflexes, hyperreflexia, abnormal sensory examination, dermatitis, and nail loss or markings); performed in summer of yr 1 |
Whole blood Se (μmol/kg) 4.04 ± 1.39 (2.30–8.54) n = 141 sampled once every season in yr 1; in summer and winter in yr 2 Toenail Se (μmol/kg) 19.7 ± 7.3 (10.6–48.4) n = 142 collected once every season in yr 1; in summer and winter in yr 2 Diet Se (μmol/d) 3.04 ± 1.81 (0.86–9.20) n = 76 based on 2‐d duplicate portions method, once every season in yr 1; in summer and winter in yr 2 |
OR (95% CI) of having symptoms more frequently than the median for an increase of 1 SD* in Se biomarker, adjusted for sex, age and smoking Muscle twitches Muscle twitches Whole blood: 1.17 (0.84,1.64) Nail: 1.10 (0.80,1.51) Diet: 1.28 (0.87,1.88) Paraesthesia Whole blood: 0.64 (0.45,0.93) Nail: 0.73 (0.36,0.80) Diet: 0.52 (0.50,1.05) Lethargy Whole blood: 1.41 (1.01,1.96) Nail: 1.41 (1.02,1.95) Diet: 1.43 (0.98,2.09) Nail breakage/ nail loss Whole blood: 0.72 (0.50, 1.02)/1.22 (0.56, 2.66) Nail: 0.79 (0.56, 1.10)/1.13 (0.52, 2.42) Diet: 0.84 (0.57, 1.23)/0.78 (0.09, 6.59) Dark nail lines/white nail lines Whole blood: 0.77 (0.39, 1.53)/1.09 (0.74, 1.60) Nail: 0.75 (0.39, 1.44)/1.01 (0.67, 1.49) Diet: 0.85 (0.42, 1.72)/1.20 (0.80, 1.78) Hair loss Whole blood 1.13 (0.77, 1.67) Nail 1.04 (0.70, 1.54) Diet 0.96 (0.61, 1.53) Yellowed skin Whole blood 0.38 (0.06, 2.46) Nail 0.50 (0.09, 2.91) Diet 0.86 (0.08, 8.81) Garlic breath Whole blood 1.14 (0.76, 1.73) Nail 1.03 (0.68, 1.56) Diet 1.03 (0.65, 1.63) Dizziness Whole blood 1.20 (0.88, 1.64) Nail 1.29 (0.94, 1.76) Diet 1.17 (0.82, 1.66) OR (95% CI) of having abnormal findings on photographic examination of thumbnails for an increase of 1 SD* in Se toenail, adjusted for sex, age and smoking Leukonychia: 0.95 (0.53, 1.72) Transverse ridging: 0.55 (0.25, 1.25) Longitudinal ridging: 0.57 (0.19, 1.65) Onycholysis: 1.16 (0.48, 2.79) * 1 SD = 1.27 μmol/kg for whole blood; 6.36 μmol/kg for toenail; 1.27 μmol/d for diet N cases with signs, upon physical examination Nail loss, alopecia, liver enlargement, muscle fasciculation: 0 Yellowed sclera: 2; abnormal proprioception: 2; abnormal muscle strength to extend the fingers: 3 (whole‐blood Se <3.18 μmol/kg) Easy epilation: 1 (whole‐blood Se = 3.88 μmol/kg) |
|
Brazil Martens et al. (2015) Cross‐sectional |
N = NR Population sampled: Macapá city: children enrolled in public preschool receiving 15‐30 g Brazil nuts 3 d/wk (n = 41); Belém city: control children from public preschool, not receiving Brazil nuts as part of their diet (n = 88); All children spent 5 d/wk at school and had breakfast, lunch and dinner at school. Exclusion: child not enrolled in school in last 7 mo or attendance < 75%. n = 129 Sex (% F): Macapá: 46.3 Belém: 52.3 Age (yr): Macapá: 4.7 ± 0.9 (3.1–6.3) Belém: 4.5 ± 1.2 (2.1–6.6) |
Clinical symptoms of selenosis clinically evaluated by a doctor; symptoms included changes to and loss of nails and hair, skin lesions, unusual garlic odour breath, nervous system defects, and gastrointestinal disorders (nausea, vomiting). |
Mean Se intake (μg/d, median (range)) Macapá (n = 41): 155.3 (98.7–195.3) Belém (n = 88): 44.4 (33.9–53.2) Based on 7‐d duplicate portions method Plasma Se (μg/L) Macapá (n = 41): 107.29 ± 27.15 (73.0–172.0) Belém (n = 41): 83.56 ± 23.32 (47.0–142.0) Hair Se (μg/g) Macapá (n = 41): 0.89 ± 0.24 (0.44–1.35) Belém (n = 41): 0.31 ± 0.10 (0.12–0.50) Toe‐ and fingernail Se (μg/g) Macapá (n = 41): 3.43 ± 1.81 (0.89–8.43) Belém (n = 41): 1.29 ± 0.52 (0.31–2.16) |
No clinical symptoms of selenosis observed in any child. |
|
India Senthilkumaran et al. (2012) Case report |
1 woman, healthy, 55 yr old; Consumed “paradise nuts” (Lecythis ollaria) with the intention of preventing cancer |
Recovered at the emergency department of Sri Gokulam Hospital, Tamil Nadu |
Plasma Se, μg/L: 512 Consumed 10–15 ‘paradise nuts’ per day for 20 days |
Patient reported headaches, dizziness, vomiting, and abdominal pain for 5 d before hospital admission; Presented severe alopecia; Greyish discolouration of nails developed on 4th hospital day. At follow‐up after 2 mo, hair started to regrow. |
CI: confidence interval; d: day; F: females; mo: month; M: males; N: number of participants; NA: not applicable; NR: not reported; OR: odds ratio; SD: standard deviation; Se: selenium; USA: United States of America; wk: week; yr: year.
(a) Mean ± SD (range), unless specified otherwise.
D.2. Blood Pressure and hypertension
D.2.1. Intervention studies on continuous measures of blood pressure
|
Reference Study Country |
Design N randomised/completed Duration(a) Recruitment criteria |
Subject characteristics at baseline(b) | Intervention(b) | Outcomes assessed | Results(b) | |
|---|---|---|---|---|---|---|
|
Navas‐Carretero et al. (2011) Spain |
RCT G1, non‐enriched chicken breast: 16/13 G2, Se‐enriched chicken breast: 16/11 Duration: 10 wk Aged 20–45 yr; BMI 18.5–30 kg/m2; not taking any medication or following any dietary treatment; had maintained their weight (±3 kg) for the last 3 mo; no diabetes, thyroid impairments, or other endocrine disturbances; not suffering gastric and peptic ulcer problems; no hypertension, constipation, or diarrhoea. |
Sex: M and F Age (yr): 20–45 BMI (kg/m 2 ) G1: 24.2 ± 2.1 G2: 24.1 ± 2.7 Ethnicity: NR Blood Se (μg/dL) G1: 14.2 ± 1.4 G2: 14.6 ± 1.7 Blood pressure (mmHg) Se intake: NR |
Non‐enriched chicken breast vs 22 μg/d Se supplementation as Se‐enriched chicken breast Isocaloric diet with 30% of energy as proteins Blood Se, end of trial (μg/dL): G1: 0.7 ± 0.9 G2: 0.2 ± 1.4 |
SBP and DBP (method not described; not a pre‐planned outcome) |
Baseline SBP (mmHg) G1: 110.0 ± 7.4 G2: 110.0 ± 12.0 DBP (mmHg) G1: 68.8 ± 6.8 G2: 69.1 ± 8.6 |
Changes from baseline SBP (mmHg) G1: −8.5 ± 10.3 G2: −1.8 ± 8.7 G1 vs G2 NS DBP (mmHg) G1: −1.1 ± 8.9 G2: −3.2 ± 7.5 G1 vs G2 NS |
d: day; DBP: diastolic blood pressure; F: females; Gx: group x; M: males; mo: month; NR: not reported; SBP: systolic blood pressure; SD: standard deviation; Se: selenium; RCT: randomised controlled trial; wk: week; yr: year.
(a) Duration = duration of the treatment phase, unless specified otherwise.
(b) Mean ± SD, unless specified otherwise.
D.2.2. Observational studies on continuous measures of blood pressure and incidence of hypertension
| Cohort name | Original Cohort (N total) | Ascertainment of outcome | Exposure groups(a) | Incident cases | Model covariates | Results |
|---|---|---|---|---|---|---|
| Country | Exclusion criteria | n/person‐years | ||||
| Reference | Study population (n, sex and age at baseline(a)) | |||||
| Follow‐up | ||||||
| Funding | ||||||
|
BEST Bangladesh Bulka et al. (2019) 6 yr Prospective Cohort Public |
N = 255 Population sampled: general population in an arsenic‐endemic area, randomly selected from placebo arm of BEST trial; adults having manifested arsenical skin lesions. Exclusion: pregnant women, unwillingness to discontinue vitamin use, prior history of cancer, too ill to participate, unwilling to give blood and urine samples; hypertensive at baseline. n = 178 Sex (% F): 54.9 Ethnicity: NR Age (yr): 24–64 |
SBP and DBP (2 seated measurements using an automated sphygmomanometer) measured in visits at 2, 4‐ and 6‐yr follow‐up. HTN defined as SBP ≥ 140 mmHg, DBP ≥ 90 mmHg, antihypertensive medication use, or self‐reported physician diagnosed HTN. |
Blood Se (μg/L, median (IQR)): 121 (110.0–135.0) Cut‐offs for quartiles NR |
Incident HTN cases: 46 N per quartile NR |
Model 1 (M1): age and sex Model 2 (M2): M1 + baseline blood lead, manganese, and selenium Model 3 (M3): M2 + site, smoking status, educational duration, creatinine‐corrected urinary arsenic concentration Model 4 (M4): M3 + time‐varying BMI, time‐varying diabetes status |
HR (95% CI) for incidence of HTN Q1(ref): 1 Q2: 1.31 (0.52, 3.29) Q3: 1.68 (0.70, 4.02) Q4: 1.33 (0.53, 3.36) p trend 0.432 Model 2 Q1(ref): 1 Q2: 1.17 (0.46, 3.01) Q3: 1.35 (0.55, 3.23) Q4: 1.11 (0.42, 2.91) p trend 0.593 Model 3 Q1(ref): 1 Q2: 0.94 (0.35, 2.54) Q3: 1.10 (0.41, 3.00) Q4: 0.90 (0.30, 2.68) p trend 0.882 Model 4 Q1(ref): 1 Q2: 0.72 (0.25, 2.08) Q3: 0.91 (0.32, 2.55) Q4: 0.73 (0.23, 2.30) p trend 0.641 |
|
FLEMENGHO Belgium Nawrot et al. (2007) 8.4 yr prospective cohort Public |
N = 1,107 Population sampled: general population Exclusion: participants who died, became severely ill or moved; creatinine excretion was outside published limits; missing values; high BP or hypertension at baseline. n = 385 sex (% F): 51.8 Ethnicity: NR Age (yr) = 48.8 (> 20) |
Blood pressure measured (5 seated measurements) by trained nurses, twice at baseline (1–3 wk apart) and once at follow‐up visit. High BP was defined as HTN (≥ 140/≥ 90 mmHg), high‐normal BP (130–139/85–89 mmHg), or self‐reported start of antihypertensive drug. | Blood Se (μg/L): 97.0 ± 19.0 | Incident cases of high BP: 139; 36 cases per 1,000 person‐years | Age, BMI, smoking, the 24 h urinary excretion of sodium and potassium + for F: menopausal status and the use of contraceptive pills at baseline. |
HR (95% CI) for incidence of high BP, by 20 μg/L blood Se at baseline F: 1.08 (0.90, 1.27) p = 0.41 M: 0.63 (0.48, 0.83) p = 0.0013 |
|
The Selenium and Cognitive Decline study China Su et al. (2016) 7 yr prospective cohort Public |
N = 2000 Population sampled: general population > 65 yr Exclusion: severe hearing loss (cognitive assessment not possible). n = 635 sex (% F): 53.7 age (yr): 71.9 ± 5.6 |
Blood pressure measures and self‐reported HTN history collected at baseline, 2.5 and 7 yr follow‐up. HTN was defined as ≥ 140/≥ 90 mmHg. |
Nail Se (μg/g): 0.413 ± 0.183 n, per quintile: Q1 ≤ 0.233: 402 Q2 0.234–0.362: 405 Q3 0.363–0.442: 395 Q4 0.443–0.552: 397 Q5 > 0.552: 401 |
Incident HTN cases n, per quintile: Q1: 192 Q2: 132 Q3: 120 Q4: 105 Q5: 86 |
Age, gender, BMI, education, smoking, alcohol consumption, physical activity. |
HR (95% CI) for incidence of HTN Q1(ref): 1 Q2: 1.41 (1.03, 1.94) p = 0.0331 Q3: 1.93 (1.40, 2.67) p < 0.0001 Q4: 2.35 (1.69, 3.26) p < 0.0001 Q5: 1.94 (1.36, 22.77) p = 0.0002 |
|
PURE South Africa Swart et al. (2019) 10 yr prospective cohort Private |
N = 987 Population sampled: general population Exclusion: missing baseline or follow‐up cardiovascular data or baseline Se data. n = 690 sex (% F): 64.6 Ethnicity: black South Africans Age (yr): 50.7 ± 10.2 (35–70) |
Blood pressure (seated measurements; twice, 5‐min apart) measured with a validated device at baseline and follow‐up. |
Plasma Se (μg/100 mL) Group with “normal Se status” at baseline (n = 845): 12.7 ± 3.41 Group with “deficient Se status” at baseline (n = 142): 6.12 ± 1.67 |
NA | Age, sex, BMI, physical activity index, tobacco use, Ɣ‐glutamyl transferase, glucose, C‐reactive protein, LDL |
SBP level, β coefficients (95% CI), per 10 μg/L Se increase All: −0.03 (−0.10, 0.04) p = 0.418 Group with “normal Se status”: −0.03 (−0.11, 0.05) p = 0.439 Group with “deficient Se status”: 0.01 (−0.20, 0.22) p = 0.929 DBP NR |
|
PROGRESS Mexico Kupsco et al. (2019) 6 yr prospective cohort Public |
N = 948 Population sampled: mother–child pairs Exclusion: Women exposed to environmental tobacco smoke (at home) or smoking during pregnancy; missing values n = 548 sex (% F): 49.6 Ethnicity: NR Maternal age (yr) = 28 ± 5.6 |
Children blood pressure measures at 4–6 yr of age (4.8 ± 0.55 yr) during a clinical examination (seated measurements; twice, 3 min apart) | Maternal blood Se (2nd trimester) (μg/dL): 25 ± 4.5 | NA |
Single‐metal model (SMM): Maternal age, pre‐pregnancy BMI, education, socioeconomic status, parity (primiparous or multiparous), and environmental tobacco smoke (present or absent in home) Multi‐metal model (SMM): as above + As, Cd, Co, Cr, Cs, Cu, Mn, Pb, Sb, and Zn |
BP levels, β‐coefficients (95% CI), per 1 μg/L Se increase SBP SMM: −0.19 (−0.51, 0.13) p = 0.25; MMM: −0.07 (−0.52, 0.39) p = 0.77 DBP SMM: β = −0.12 (−0.39, 0.14) p = 0.36; MMM: −0.14 (−0.51, 0.23) p = 0.46 |
|
RHEA Greece Howe et al. (2021) 11 yr prospective cohort Public |
N = 1,363 Population sampled: mother–child pairs from Heraklion, Greece; aged ≥ 16 yr Exclusion: outliers for metal measurements (mean ± 4 SD), missing values n = 176 Sex (% F) = 44.3 Ethnicity: Caucasian Maternal age (yr) = 30.3 ± 4 |
Children blood pressure measured at 4, 6 and 11 yr of age during clinical examination (seated measurements; 3 times, 1‐min apart) |
Maternal urinary Se in early pregnancy (specific‐gravity adjusted) (μg/L, geometric mean (95% CI)): 21.72 (20.72, 22.77) |
Incident cases of elevated BP: 56 |
Maternal age, maternal education, maternal pre‐pregnancy BMI, maternal smoking during pregnancy, child's sex, child's exact age, and child's height at each time point, maternal urinary Co, Se, Mo, As, Cd, Sb, Pb |
Per‐year change in BP levels from 4 to 11 yr of age, main effect estimate* for Se (95% CI) SBP β = 0.1 (−0.1, 0.3) DBP β = 0.1 (−0.1, 0.3) *Bayesian Varying Coefficient Kernel Machine Regression |
BEST: The Bangladesh Vitamin E and Selenium Trial; BP: blood pressure; FLEMENGHO: The Flemish Study on Environment, Genes and Health Outcomes; HTN: Hypertension; PROGRESS: Programming Research in Obesity, Growth, Environment and Social Stressors; NR: not reported; PURE: Prospective Urban Rural Epidemiology; yr: year.
(a) Mean ± SD (range), unless specified otherwise.
D.3. Alzheimer's dementia
D.3.1. Intervention study on Alzheimer's dementia
|
Cohort name Country Reference Follow‐up Funding |
Original Cohort (N total) Exclusion criteria Study population (n, sex and age at baseline(a)) |
Ascertainment of outcome |
Exposure groups(a) n |
Incident cases | Model covariates | Results |
|---|---|---|---|---|---|---|
|
PREADVISE USA, Canada and Puerto Rico Kryscio et al. (2017) Approx. 5 yr RCT + 7 yr observational follow‐up Public |
N = 7,540 Population sampled: Subsample of participants from SELECT Exclusion: dementia, active neurologic and/or neuropsychiatric conditions affecting cognition; history of serious head injury and substance abuse; no follow‐up visit n = 3,786 Sex: Males Ethnicity: 8.4% Black, 2.5% Hispanic, 89.1% White Age: > 60 yr |
Incidence of dementia; Memory Impairment Screening (MIS) test at follow‐up visit; cases identified based on MIS test and i) followed by diagnostic by local clinician, or ii) AD8 Dementia Screening Interview ≥ 1 plus a self‐reported dementia diagnosis, use of a memory enhancing prescription drug, or cognitive score ≥ 1.5 SDs below expected performance |
n, per group G1, placebo*: 1,830 G2, 200 μg Se/d*: 1,881 *5.4 ± 1.2 yr of intervention |
Incident cases of dementia, n G1: 85 G2: 78 |
Baseline age, black race, APOE ε4 carrier status (present or absent), college education, baseline MIS score, and the presence/absence of the following self‐reported co‐morbidities at PREADVISE baseline: coronary artery bypass graft (CABG), congestive heart failure (CHF), diabetes, hypertension, stroke, sleep apnoea, and memory change or problem |
HR (95% CI) for incidence of dementia G1: ref. G2: 0.92 (0.63, 1.34) Modified intent‐to‐treat analysis G1: ref. G2: 0.83 (0.61, 1.13) Weighted for treatment compliance G1: ref. G2: 0.80 (0.59, 1.09) |
PREADVISE: Prevention of Alzheimer's Disease with Vitamin E and Selenium; RCT: randomised controlled trial; SELECT: Selenium and Vitamin E Cancer Prevention Trial; yr: year.
(a) Mean ± SD (range), unless specified otherwise.
D.4. Amyotrophic lateral sclerosis
D.4.1. Observational studies on amyotrophic lateral sclerosis
|
Cohort name Country Reference Follow‐up Funding |
Original Cohort (N total) Exclusion criteria Study population (n, sex and age at baseline) |
Ascertainment of outcome |
Exposure groups(a) n/person‐years |
Incident cases | Model covariates | Results |
|---|---|---|---|---|---|---|
|
EPIC France, Germany, Greece, Italy, The Netherlands, Spain, UK Peters et al. (2021) 8.1 yr (median) Nested case–control Public |
N = 487 Population sampled: general population Exclusion: missing data on exposure or confounding variables n = 426 Cases: 107 Controls: 319 (matched for age, sex and study centre) Sex: 65.5% females Ethnicity: NR Age (yr, median (range)): 60 (35–70) |
Fatal cases of ALS, identified from death certificates; ALS cases defined as those subjects for whom “motor neuron disease” (G12.2 according to ICD, v. 10) was reported as an immediate, antecedent, or underlying cause of death |
Erythrocyte Se (ng/g, geo. mean SD) Controls: 117.7 ± 1.31 Cases: 115 ± 1.25 n, per tertile T1 ≤ 104: 141 T2 > 104 ≤ 123: 140 T3 > 123: 145 |
Incident cases, n per tertile T1: 32 T2: 38 T3: 37 |
Cigarette smoking, BMI, physical activity, alcohol consumption, and education. |
ALS mortality, OR (95% CI) T1: 1.00 [Ref] T2: 1.31 (0.74, 2.31) T3: 1.21 (0.65, 2.25) p trend , linear = 0.374 p trend , spline = 0.850 Exclusion of deaths within first 3 yrs did not substantially change the results |
|
Rivalta + Reggio Emilia Italy Vinceti et al. (2019) 29 yr Prospective cohort Public |
N = 97,780 Population sampled: subjects continuously residing in Rivalta from 1974 to 1985, exposed to high‐Se‐contaminated tap water (n = 2,065) and unexposed municipal population as controls (n = 95,715) n = 97,780 Sex (% F): Exposed: 51 Unexposed: 53 Ethnicity: NR Age (yr): 5–95+ |
Fatal and non‐fatal cases of ALS ascertained from death records (since 1986), registries of the neurological department (since 1986), hospital discharge data (since 1993), records of riluzole prescription (since 2001); data from the local ALS registry (since 2009) |
Se in tap water (inorganic Se), μg/L Exposed: 8–10 Unexposed: < 1 person‐years, per group: G1, exposed cohort: 50,100 G2, unexposed cohort: 2,233,963 |
Incident cases, n G1: 7 G2: 112 By period, 1986–1994/1995–2015 G1: 4/3 G2: 21/91 By sex, M/F G1: 3/4 G2: 73/39 Incident cases, n per 100,000 person‐years G1: 14 G2: 5 |
Age, gender and calendar year, education and occupation |
Incidence rate ratio (IRR) for ALS (95% CI) in exposed group (G1) compared to unexposed group (G2) Overall 2.8 (1.3, 6) By period 1986–1994: 8.2 (2.7, 24.7) 1995–2015: 1.5 (0.5, 4.7) By sex F: 5.1 (1.8, 14.3) M: 1.7 (0.5, 5.4) |
ALS: Amyotrophic Lateral Sclerosis; EPIC: European Prospective Investigation into Cancer and Nutrition; ICD: International Classification of Diseases; NR: not reported; PREADVISE: Prevention of Alzheimer's Disease with Vitamin E and Selenium; RCT: randomised controlled trail; SELECT: Selenium and Vitamin E Cancer Prevention Trial; yr: year.
(a) Mean ± SD (range), unless specified otherwise.
D.5. Functional neuropsychological development in children
D.5.1. Observational studies on functional neuropsychological development in children
|
Cohort name Country Reference Follow‐up Funding |
Original Cohort (N total) Exclusion criteria Study population (n, sex and age at baseline)(a) |
Ascertainment of outcome |
Exposure groups(a) n/person‐years |
Model covariates | Results |
|---|---|---|---|---|---|
|
INMA Project (2003–2005) Spain Amorós et al. (2018a) Approx. 1.7 yr Cohort Public |
N = 787 Population Sampled: Pregnant women aged ≥ 16 yr, 10–13 weeks of gestation, singleton pregnancy, intention of undergoing follow‐up and delivery at the corresponding centre of reference, and no impediment for communication. Excluded: missing exposure or outcome variables. n = 651 mother–child pairs Sex (% F): 47 Ethnicity: NR Mothers' age (yr): 30.1 ± 4.4 |
Neuropsychological development assessed around 12 mo of age (12.3 ± 0.7 mo) using the BSID‐II, mental scale and psychomotor scale. Testing carried out at the children's reference hospital in the presence of their mothers, by four trained psychologists. |
Maternal serum Se at 1st trimester of pregnancy (μg/L) 79.74 ± 7.92 |
BSID mental score: child's sex, maternal BMI, parity, area of residence (urban, metropolitan, semi‐urban and rural), maternal age and intake of seafood per 100 g/d. BSID psychomotor score: social class, paternal age, attendance to nursery, season of birth. |
Maternal Se concentrations and BSID‐II scores; β‐coefficient (95% CI) Mental: −0.13 (−0.29, 0.03); p = 0.122 Psychomotor: −0.08 (−0.24, 0.07); p = 0.283 Non‐linearity (splines analysis): inverted U‐shape for the associations between maternal serum Se and mental score (break point at 86.4 μg/L Se (95% CI 79.3, 93.5)) and psychomotor score (break point at 86.2 μg/L Se (95% CI 69.3, 103.0)) |
|
INMA Project (2003–2012) Spain Amorós et al. (2018b) Approx. 5.7 yr Cohort Public |
N = 787 Population Sampled: Pregnant women aged ≥16 yr, 10–13 wk of gestation, singleton pregnancy, intention of undergoing follow‐up and delivery at the corresponding centre of reference, and no impediment for communication. Excluded: missing exposure or outcome variables. n = 409 mother–child pairs Sex (% F): 48.6 Ethnicity: NR Mothers' age (yr): 30.1 ± 4.4 yr |
Neuropsychological development assessed at 5 yr of age (5.8 ± 0.16 yr) by using a standardised version of the MSCA adapted to the Spanish population |
Maternal serum Se at 1st trimester of pregnancy (μg/L) 79.9 ± 8.1 |
Base model (BM): sex, age at evaluation, psychologist, maternal age, maternal educational level or maternal intelligence Verbal: BM + maternal country of birth, parity, type of zone, maternal working status and BMI before pregnancy. Perceptual‐performance: BM + type of zone, smoking during pregnancy, parity, breastfeeding, maternal smoking at evaluation and maternal working status Quantitative: BM + parental educational level, type of zone, parity General cognitive: BM + parity, type of zone, paternal working status at evaluation, and seafood intake during pregnancy. Working memory: BM + maternal country of birth, paternal educational level, parity, maternal smoking at evaluation. Global memory: BM + parity, type of zone, maternal country of birth, and seafood intake during pregnancy. Fine motor: BM + breastfeeding, parity, type of zone and maternal smoking at evaluation. Global motor: BM + breastfeeding. Executive function: BM + maternal country of birth, maternal age, parental educational level, parity, type of zone, maternal smoking at evaluation |
Maternal Se concentrations and MSCA scores; β‐coefficients (95% CI) Verbal: −0.052 (−0.164, 0.061); p = 0.366 Perceptual‐performance: −0.046 (−0.128, 0.036); p = 0.268 Quantitative: 0.015 (−0.050, 0.080); p = 0.653 General cognitive: −0.085 (−0.283, 0.112); p = 0.395 Working memory: −0.006 (−0.054, 0.042); p = 0.793 Global memory: −0.041 (−0.110, 0.027); p = 0.234 Fine motor: −0.022 (−0.064, 0.021); p = 0.317 Global motor: −0.048 (−0.115, 0.019); p = 0.160 Executive function: −0.057 (−0.175, 0.060); p = 0.338 Non‐linearity (splines analysis): inverted U‐shape for the associations maternal serum Se and the verbal score (break point at 83.7 μg/L Se (95% CI 77.2, 90.1)) and global memory score (break point at 85.6 μg/L Se (95% CI 77.4, 93.9)) |
|
China Li et al. (2020a) Approx. 2 yr Prospective Cohort Public |
N = 545 mother–child pairs Population Sampled: Pregnant women recruited from the Wuhan Women and Children Medical Care Center Excluded: Participants with missing values. n = 544 mother–child pairs Sex (% F): 44 Ethnicity: Asian Mothers' age (yr): 28.97 ± 3.43 |
Neurocognitive development assessed by BSID at 2 yr of age; translated to Chinese and locally standardised. |
Maternal urinary Se (Geometric mean ± SD, (P5th, P95th), μg/L) 11.47 ± 2.34 (2.59, 43.03) Based on one spot urine sample collected before delivery (36–42 wk) |
Single‐metal model (SMM): child's sex, maternal education, paternal education, weight gain during pregnancy, annual household income and parity. Multi‐metal model (MMM): as above + maternal urinary zinc, copper, manganese, strontium, nickel, cobalt, rubidium, chromium and vanadium. |
Maternal Se concentrations and BSID scores; β‐coefficients* (95% CI), by IQR change in lnSe Mental: SMM 2.02 (−0.18, 4.22); MMM 2.28 (−1.23, 5.80) Psychomotor: SMM −0.10 (−1.81, 1.62); MMM −1.09 (−3.83, 1.65) Non‐linearity (Bayesian kernel machine regression): inverted U‐shaped between log(maternal urinary Se) and mental and psychomotor scores in girls, but not boys. |
|
RHEA study Greece Kippler et al. (2016) 4 yr Public |
N = 628 mother–child pairs Population Sampled: early stage pregnant women (before 15 wk), residency within the study area, aged ≥16 yr and good understanding of the Greek language. Excluded: Participants with missing data. n = 575 mother–child pairs Sex (% F): 50 Ethnicity: NR Mothers' age (yr): 30 ± 5.1 |
Neuropsychological development assessed by two trained psychologists, with MSCA at 4 yr (4.2 ± 0.23 yr). Executive and cognitive functions of posterior cortex derived from reorganisation of the MSCA subtests in accordance with their association with specific neurocognitive function areas. |
Maternal urinary Se (Mean ± SD, median (5‐95th percentile), μg/L) 23 ± 8.6; 22 (12–39) Samples collected at median 13 wk of gestation (IQR: 4 wk) |
Single‐element model (SEM): adjusted for examiner, child sex, age at testing, and maternal age, parity, marital status, education and tobacco smoking. Multi‐element model (MEM): as above + urinary iodine, cadmium, lead. |
Maternal urinary Se and MSCA scores; β‐coefficients (95% CI), per every doubling of maternal urinary Se General cognitive: SEM 1.9 (−0.57, 4.3); MEM 2.2 (−0.38, 4.8) Verbal: SEM 2.2 (−0.31, 4.7); MEM 2.4 (−0.14, 5.0) Quantitative: SEM −0.072 (−2.7, 2.6); MEM −0.27 (−3.0, 2.5) Memory: SEM 1.9 (−0.66, 4.4); MEM 1.9 (0.72, 4.5) Perceptive‐performance: SEM 1.5 (−0.78, 3.9); MEM 2.0 (−0.66, 4.7) Motor: SEM 0.54 (−1.6, 2.7); MEM 0.87 (−1.7, 3.5) Executive functions: SEM 1.5 (−0.98, 4.0); MEM 1.4 (−1.3, 4.0) Cognitive functions: SEM 1.9 (0.50, 4.2); MEM 2.5 (−0.055, 5.1) No indication of non‐linearity (scatterplots). |
|
The Tohoku Study of Child Development Japan Tatsuta et al. (2017) 18 mo |
N = 879 Population Sampled: mother–child pairs (term infants) Excluded: mothers: in vitro fertilisation, preeclampsia or gestational diabetes mellitus (DM), use of antidiabetic agents, thyroid dysfunction, mental or psychological disease, hepatitis, immune deficiency, malignant tumours, diseases affecting foetus growth; infants: congenital anomalies or severe disease, non‐singleton, preterm birth (< 36 wk), BW < 2,500 g. n = 566 Sex (% F): 49 Ethnicity: Asian Mothers' age (yr): NR |
Neurocognitive development assessed by BSID‐II and KSPD at 18 mo of age (range, 17–20 mo). A Japanese version of the BSID‐II was prepared by the researchers. |
Cord‐plasma Se (ng/g) Boys: 66.3 ± 10.2 Girls: 67.0 ± 9.6 |
Pearson correlations were used to determine the association of maternal blood and cord‐blood Se with KPSD/BSID‐II scores. |
Cord‐plasma Se and KPSD/BSID‐II scores, r‐coefficients KPSD Developmental quotient: 0.015, p = 0.729 Cognitive‐adaptive: 0.004, p = 0.918 Language‐social: 0.018, p = 0.675 Postural‐motor: 0.020, p = 0.643 BSID‐II Mental: 0.56, p = 0.181 Psychomotor: 0.007, p = 0.876 |
|
Norway Varsi et al. (2017) From 18 wk pregnancy to 6 mo postpartum; infants from birth to 6 mo old |
N = 140 Population Sampled: mother (pregnant at 18 wk)‐child pairs Excluded: Women with pregnancy related or chronic disease, except those with hypothyroidism under control. Missing outcome. n = 112 Sex (% F): 47 Ethnicity: Caucasian Mothers' age (yr): 31.5 ± 4.3 |
Neurodevelopment assessed by Ages and Stages Questionnaire (ASQ), completed by parents at 6 mo. |
Maternal serum Se at 18 wks pregnancy (μmol/L, median (P2.5, P97.5)) 0.96 (0.71, 1.35) Maternal serum Se at 28 and 36 wk pregnancy; infant serum Se at 6 mo |
Birthweight, BW at 6 mo, gender, mo of exclusive breastfeeding, maternal age, education, and parity |
Maternal serum Se at 18 wks and ASQ scores, β‐coefficients (95% CI NR) Total: 11, p = 0.007 Problem solving: 3, p = 0.006 Fine motor scores: 3, p = 0.04 Communication: 1, p = 0.22 Personal‐social functioning: 2, p = 0.11 Gross motor score: 1, p = 0.56 No associations observed between ASQ scores and maternal serum Se at other timepoints or infant serum Se Non‐linearity not explored. |
|
PHIME Croatia Močenić et al. (2019) Approx. 18 mo Public |
N = 205 mother–child pairs Population Sampled: pregnant women that were permanent residents in the study area for at least 2 years Excluded: Participants with missing values. n = 154 mother–child pairs Sex (% F): 46 Ethnicity: NR Mothers' age (yr): 30.1 (20–43) |
Neurodevelopment assessed with the BSID‐III at the age of 18 mo. |
Maternal blood Se at delivery (ng/g, mean ± SD (min‐max)) 92.6 ± 22.4 (40.9–182.4) Cord‐blood Se at delivery (ng/g, mean ± SD, (min‐max)) 98.7 ± 21.8 (59.6–162.7) |
Pearson correlations were used to determine the association of maternal blood and cord‐blood Se with BSID‐III scores. |
Maternal blood Se correlation with BSID‐III scores; r‐coefficients Cognitive: 0.176 (p = 0.029) Language: 0.138 (p = 0.089) Motor: 0.128 (p = 0.113) Cord‐blood Se correlation with BSID‐III scores; r‐coefficients Cognitive: 0.001 (p = 0.993) Language: 0.100 (p = 0.218) Motor: 0.032 (p = 0.692) Non‐linearity not explored. |
|
REPRO_PL Poland Polanska et al. (2017) Approx. 3 yr Public |
N = 539 mother–child pairs Population Sampled: women up to 12 wk of single pregnancy, no assisted conception, no pregnancy complications and no chronic diseases. Excluded: Participants with missing values. n for analysis 1‐y old children = 239 n for analysis 2‐y old children = 168 Sex (% F): 53 Ethnicity: NR Mothers' age (yr): 28.9 ± 4.4 |
Neuropsychological development assessed with BSID‐III in children at 1 year (12.6 ± 1.4 mo) and 2 years of age (24.8 ± 2.5 mo). |
Maternal plasma Se in the 1st trimester (μg/L, mean ± SD (min‐max)) 48.3 ± 10.6 (16.1–91.4) Cord‐blood Se at delivery (μg/L, mean ± SD (min‐max)) 31.1 ± 8.2 (13.8–56.3) |
Examiner, maternal age, maternal education, child gender and maternal smoking status during pregnancy based on the cotinine level. |
Maternal plasma Se (1st trimester) and BSID‐III scores, β‐coefficients (95% CI) 1‐y‐old children Cognitive: 0.11 (−0.03, 0.25) p = 0.13 Language: 0.18 (0.02, 0.34) p = 0.03 Motor: 0.25 (0.08, 0.42) p = 0.005 2‐y‐old children Cognitive: 0.22 (−0.02, 0.47) p = 0.07 Language: 0.07 (−0.15, 0.29) p = 0.52 Motor: 0.15 (−0.07, 0.38) p = 0.18 Cord‐blood Se and BSID‐III scores, β‐coefficients (95% CI) 1‐y‐old children Cognitive: 0.005 (−0.16, 0.17) p = 0.95 Language: 0.10 (−0.08, 0.29) p = 0.28 Motor: 0.17 (−0.03, 0.37) p = 0.10 2‐y‐old children Cognitive: −0.06 (−0.32, 0.19) p = 0.62 Language: 0.09 (−0.14, 0.32) p = 0.44 Motor: 0.07 (−0.16, 0.31) p = 0.55 Non‐linearity not explored. |
|
MINIMat Bangladesh Skröder et al. (2015) Approx. 2 yr Public |
N = 4,436 pregnant women; 3,267 had singleton live births Population Sampled: women in early pregnancy, at gestational wk 8 on average; gestational age ≤ 14 wk by ultrasound examination; no severe illness. n = 750 mother–child pairs Sex (% F): 47.5 Ethnicity: NR Mothers' age (yr): 27 (14–44) |
Neuropsychological development assessed at 18 mo of age 17–19.2) with BSID‐II and tests for children's comprehensive and expressive language development using a Bangladeshi version of MacArthur's Communicative Development Inventory |
Maternal erythrocyte Se (Ery‐Se) at gestational wk 30 (μg/g Hb): Low Ery‐Se: 0.39 ± 0.056 High Ery‐Se: 0.53 ± 0.068 |
Model 1 (M1): age at testing and gender. Model 2 (M2): M1 + gestational age, maternal age, maternal BMI, socio economic status (SES), home observation for measurement of the environment (HOME), weight for height (WHZ) and birth weight. Model 3 (M3): M2 + Ery‐Zn, Ery‐Mn and urinary iodine. Model 4 (M4): M2 + urinary arsenic, urinary cadmium and Ery‐Pb. |
Maternal Ery‐Se and BSID‐II, comprehensive and expressive language scores, β‐coefficients (95% CI), by 0.5 μg/g Hb increase in Ery‐Se Mental: M1 3.2 (−1.7, 8.0); M2 3.3 (−1.7, 8.3); M3 3.8 (−2.2, 9.9); M4 4.0 (−1.4, 9.4) Psychomotor: M1 9.2 (3.9, 15); M2 8.8 (3.3, 14); M3 10 (3.7, 17); M4 10 (4.6, 16) Comprehension: M1 7.2 (3.3, 11); M2 3.7 (0.40, 7.1); M3 3.1 (−0.65, 6.9); M4 3.5 (−0.079, 7.0) Expression: M1 2.4 (−0.066, 4.9); M2 0.75 (−1.6, 3.1); M3 0.087 (−2.7, 2.9); M4 1.3 (−1.3, 3.9) No indication of non‐linearity for mental, psychomotor and expression scores (scatterplots). For comprehension, estimates given between the knots at 0.32 and 0.60 μg/g Hb. |
|
MINIMat Bangladesh Skröder et al. (2017) Approx. 10 yr Public |
N = 1,530 children Population Sampled: mother–child pairs, women in early pregnancy, at gestational wk 8 on average gestational age ≤ 14 wk by ultrasound examination; no severe illness. Excluded: Participants with missing values. Analysis maternal Ery‐Se, n = 1,260 Analysis children U‐Se: <34 μg/L, n = 1,214; ≥34 μg/L, n = 20 Sex (% F): 47.6 Ethnicity: NR Mothers' age (yr): NR |
Children's cognition assessed at 5 yr (5.4 ± 0.13) and 10 yr (9.5 ± 0.095) using the WPPSI and the WISC |
Maternal Se erythrocyte (Ery‐Se) at gestational wk 14 (μg/g Hb): 0.45 ± 0.11 Children urinary Se (U‐Se) at 5 yr (μg/L): 14 ± 6.6 |
Model 1 (M1): gender, parity and family socio economic status (SES) at enrolment, birthweight, Hb at gestational week 14, age at testing, height‐for‐age z‐score (HAZ), modified Home Observation for Measurement of the Environment score (HOME), testers, school type, mothers' cognitive function, and paternal education (all assessed at 5‐yr follow‐up) Model 2 (M2): M1 + erythrocyte zinc and manganese at gestational wk 14 (prenatal analyses). No M2 for U‐Se as Zn and Mn not measured Model 3 (M3): M1 + erythrocyte cadmium, lead, and arsenic at gestational wk 14 (prenatal analyses) or urinary arsenic, cadmium, and lead at 5 yr |
Maternal Ery‐Se and WPPSI/WISC scores; β‐coefficients (95% CI), by 0.1 μg/g Hb increase in Ery‐Se At 5 yr Full developmental: M1 0.94 (0.027, 1.9); M2 0.97 (−0.16, 2.1); M3 0.99 (0.0051, 2.0) Verbal: M1 0.47 (−0.0072, 0.95); M2 0.41 (−0.18, 1.0); M3 0.46 (−0.054, 0.98) Performance: M1 0.27 (−0.078, 0.62); M2 0.32 (−0.11, 0.76); M3 0.25 (−0.13, 0.63) At 10 yr Full developmental: M1 2.2 (1.0, 3.3); M2 2.6 (1.2, 3.9); M3 2.2 (1.0, 3.4) Verbal: M1 0.50 (0.12, 0.89); M2 0.50 (0.051, 0.95); M3 0.51 (0.10, 0.92) Perceptual reasoning: M1 0.53 (0.079, 0.98); M2 0.75 (0.22, 1.3); M3 0.56 (0.081, 1.0) Working memory: M1 0.38 (0.14, 0.62); M2 0.39 (0.11, 0.67); M3 0.37 (0.12, 0.62) Processing speed: M1 0.75 (0.29, 1.2); M2 0.94 (0.40, 1.5); M3 0.78 (0.30, 1.3) Children urinary Se at 5 yr and WISC scores at 10 yr, β‐coefficients (95% CI), by 10 μg/L increase in U‐Se U‐Se < 34 μg/L Full developmental: M1 2.5 (−0.033, 5.0); M3 2.5 (−0.12, 5.1) Verbal: M1 0.49 (−0.35, 1.3); M3 0.52 (−0.34, 1.4) Perceptual reasoning: M1 1.2 (0.18, 2.2); M3 1.2 (0.18, 2.2) Working memory: M1 0.34 (−0.18, 0.86); M3 0.25 (−0.28, 0.78) Processing speed: M1 0.52 (−0.50, 1.5); M3 0.53 (−0.50, 1.6) U‐Se ≥ 34 μg/L Full developmental: M1 1.1 (−12, 14); M3 1.0 (−12, 14) Verbal: M1–1.5 (−5.8, 2.8); M3–1.4 (−5.8, 3.0) Perceptual reasoning: M1 3.1 (−20, 8.1); M3 3.2 (−2.0, 8.3) Working memory: M1–0.13 (−2.8, 2.5); M3–0.28 (−3.0, 2.4) Processing speed: M1–0.37 (−5.5, 4.8); M3–0.44 (−5.7, 4.8) |
|
HEALS project Croatia, Slovenia, Poland Calamandrei et al. (2020) 18 mo for PHIME and 24 mo for REPRO_PL Public |
N = 984 Population Sampled: Mothers and their infants from the PHIME and REPRO_PL cohorts. Excluded PHIME: preterm births, babies with congenital malformations or severe perinatal problems or severe health problems that presented in the following mo and potentially compromised their neurological development. REPRO_PL: Poor‐quality BSID tests or missing data. PHIME Croatia, n = 141 PHIME Slovenia, n = 212 REPRO_PL, n = 311 Sex (% F): 51.6 Ethnicity: NR Mothers' age (yr): 29.6 ± 4.5 |
Neuropsychological development assessed by BSID‐III at 18 mo in PHIME cohort and at 24 mo in REPRO_PL cohort |
Cord‐blood Se at delivery (μg/L, mean ± SD (min‐max)) PHIME Croatia 42.5 ± 9.0 (24.0–71.0) n = 141 PHIME Slovenia 40.3 ± 8.0 (15.0–61.0) REPRO_PL 31.1 ± 8.2 (13.8–56.3) |
Sex, age at examination (mo), maternal pre‐pregnancy BMI, maternal education level (primary vs secondary vs university degree), and mode of delivery (caesarean vs natural) |
Cord‐blood Se and BSID‐III scores, β‐coefficients (95% CI) PHIME CRO Cognitive: 0.045 (−0.201, 0.292) p = 0.717 Language: 0.178 (−0.144, 0.499) p= 0.278 Motor: 0.005 (−0.265, 0.276) p = 0.969 PHIME SLO Cognitive: 0.118 (−0.155, 0.391) p = 0.394 Language: 0.172 (−0.174, 0.518) p = 0.329 Motor: 0.050 (−0.224, 0.324) p= 0.719 REPRO_PL Cognitive: −0.024 (−0.320, 0.273) p= 0.876 Language: 0.071 (−0.186, 0.327) p = 0.587 Motor: −0.029 (−0.325, 0.266) p= 0.846 Non‐linearity not explored. |
|
NHBCS USA Doherty et al. (2020) 3 yr Public |
N = 2000 mother–child pairs Population Sampled: mothers aged 18–45 yr, carrying a singleton pregnancy, literate in English, having a private water system as the primary source of water at their residence n children = 371 for SRS‐2 and 318 for BASC‐2 Sex (% F): 51 Ethnicity: Majority white, non‐Hispanic Mothers' age (yr, median (IQR)): 31 (29,34) |
Neurobehavior at 3 years of age assessed by mothers using the Social Responsiveness Scale, 2nd edition (SRS‐2) and the Behaviour Assessment System for Children, 2nd edition (BASC‐2) |
Maternal prenatal toenail Se (at 25–30 gestational wk) (μg/g, median (IQR)) 0.97 (0.87, 1.07) Infant toenail Se at 2–8 wk after birth (μg/g, median (IQR)) 1.21 (0.90, 1.81) |
Maternal age (quadratic), maternal BMI (quadratic), highest level of parental education (high school or less, any college, any graduate), sex, parity (0, ≥1), smoking status (no second‐ or first‐hand, ever second‐hand only, ever first‐hand), age at last breastfeeding (< 365 d, ≥ 365 d), maternal marital status (married, other), birth year, Healthy Eating Index (linear), Parenting Relationship Questionnaire (first three principal components), and age at assessment (linear). Toenail As, Cu, Mn, Pb, and Zn fixed at their medians |
Maternal toenail Se and SRS‐2/BASC‐2 scores; effect estimate* (95% CI) SRS‐2 Total: −0.04 (−0.15, 0.07) BSC‐2 Behavioural Symptoms: 0.03 (−0.08, 0.14) Externalising Problems: 0.07 (−0.04, 0.17) Internalising Problems: −0.02 (−0.14, 0.10) Adaptive Skills: 0.02 (−0.09, 0.14) Infant toenail Se and SRS‐2/BASC‐2 scores; effect estimate* (95% CI) SRS‐2 Total: 0.00 (−0.05, 0.05) BSC‐2 Behavioural Symptoms: 0.03 (−0.02, 0.08) Externalising Problems: 0.04 (−0.01, 0.09) Internalising Problems: 0.06 (0.01, 0.12) Adaptive Skills: 0.01 (−0.04, 0.07) *Difference in the mean predicted outcome (standardised) between Se fixed at 75% versus 25% Associations appeared linear (after log2 transformation) |
|
PHIME Italy Castriotta et al. (2020) 40 mo Public |
N = 900 mother–child pairs Population sampled: mother–child pairs enrolled in the Northern Adriatic Cohort II in Italy Excluded: preterm births, babies with congenital malformations or severe perinatal problems or with severe health problems that presented in the following mo and potentially compromised their neurological development; missing outcome assessment n = 456 Sex (% F): 47.8 Ethnicity: NR Mothers' age (yr): 33.4 ± 4.3 |
Neuropsychological development assessed by BSID‐III at 40 mo old. |
Cord‐blood Se (ng/g) 117.4 ± 27.1 Cord‐blood Se (ng/g), tertiles T1: Se ≤ 105 T2: 105 < Se ≤ 125 T3: Se > 125 |
Home size, children fish intake up to 18 mo |
Dichotomised BSID‐III cognitive composite score*, OR (90% CI) T1 vs T2: 2.13 (1.18, 3.85) T3 vs T2: 1.41 (0.76, 2.62) *Children who scored under the 20th percentile of the cognitive composite score were considered as having suboptimal cognitive development and were compared with children who scored above that cut‐off |
BSID: Bayley Scales of Infant Development; BW: body weight; d: day; F: females; HEALS: Health and Environment‐wide Associations based on Large population Surveys; INMA: Spanish Childhood and Environment Project; KSPD: Kyoto Scale of Psychological Development; M: males; MINIMat: Maternal and Infant Nutrition Interventions in Matlab; mo: month; MSCA: McCarthy Scales of Children's Abilities; NA: not applicable; NHBCS: New Hampshire Birth Cohort Study; NR: not reported; PHIME: Public Health Impact of Long‐term Low level Mixed Element Exposure in Susceptible Population Strata; REPRO_PL: Polish Mother and Child Cohort; SD: standard deviation; USA: United States of America; WISC: Wechsler Intelligence Scale for Children; wk: week; WPPSI: Wechsler Preschool and Primary Scale of Intelligence; yr: year.
(a) Mean ± SD, unless specified otherwise.
D.6. Thyroid function
D.6.1. Intervention studies on thyroid function
|
Reference Study Country |
Design N randomised/completed Duration(a) Recruitment criteria |
Subject characteristics at baseline(b) | Intervention(b) | Outcomes assessed | Results(b) | |
|---|---|---|---|---|---|---|
| Baseline | End of trial | |||||
|
Rayman et al. (2008b) UK PRECISE pilot study UK |
RCT G1, placebo: 121/90 G2, 100 Se μg/d: 127/99 G3, 200 Se μg/d: 127/95 G4, 300 Se μg/d: 126/84 Duration: 6 mo Euthyroid volunteers; TSH at baseline within the reference range (0.15–3.5 mU/L); SWOG performance status score ≤ 1; no active liver or kidney disease; no prior diagnosis of cancer (excluding nonmelanoma skin cancer); no diagnosis of HIV infection; not on immunosuppressive therapy; not diminished mental capacity; not taking ≥ 50 μg/d of Se supplements in the previous 6 mo. |
Sex (% F): 44 Age, range: 60–74 yr BMI (kg/m 2 ): NR Ethnicity: Caucasian Plasma Se (ng/g, mean (95% CI)): 88.9 (86.9, 90.8) Se intake: NR |
Se‐enriched yeast (100 μg Se/d or 200 μg Se/d or 300 μg Se/d) vs placebo Adherence, pill counts (%): 97% participants missed < 10% pills Increase in plasma Se at 6 mo follow up, ng/g (mean (95% CI)) G1: 0 G2: +53.5 (48.2, 58.8) G3: +96.4 (89.2, 103.6) G4: +129.7 (119.9, 139.5) |
Plasma levels of T3, FT3, T4, FT4, T3:T4, FT3:FT4, TSH |
T3 (nmol/L) G1: 1.80 ± 0.30 G2: 1.81 ± 0.23 G3: 1.82 ± 0.49 G4: 1.73 ± 0.27 FT3 (pmol/L) G1: 5.25 ± 0.57 G2: 5.14 ± 0.62 G3: 5.14 ± 0.62 G4: 5.17 ± 0.56 T4 (nmol/L) G1: 86.5 ± 17.3 G2: 87.7 ± 18.1 G3: 85.6 ± 15.9 G4: 82.7 ± 15.8 FT4 (pmol/L) G1: 12.2 ± 2.1 G2: 11.8 ± 1.6 G3: 12.0 ± 1.8 G4: 11.6 ± 1.9 T3:T4 (x10 −2 ) G1: 2.13 ± 0.43 G2: 2.12 ± 0.40 G3: 2.16 ± 0.50 G4: 2.14 ± 0.44 FT3:FT4 G1: 0.44 ± 0.08 G2: 0.44 ± 0.06 G3: 0.44 ± 0.08 G4: 0.45 ± 0.07 TSH (mU/L) G1: 1.17 ± 0.66 G2: 1.24 ± 0.73 G3: 1.20 ± 0.61 G4: 1.21 ± 0.61 |
T3 (nmol/L) G1: 1.79 ± 0.23 G2: 1.78 ± 0.22 G3: 1.80 ± 0.47 G4: 1.72 ± 0.25 Adj p = 0.56* FT3 (pmol/L) G1: 5.25 ± 0.61 G2: 5.15 ± 0.65 G3: 5.22 ± 0.55 G4: 5.17 ± 0.59 Adj p = 0.45* T4 (nmol/L) G1: 87.2 ± 18.0 G2: 87.0 ± 16.4 G3: 83.5 ± 14.5 G4: 81.6 ± 14.4 Adj p = 0.10* FT4 (pmol/L) G1: 12.1 ± 2.1 G2: 11.9 ± 1.6 G3: 11.9 ± 1.8 G4: 11.6 ± 1.7 Adj p = 0.92* T3:T4 (× 10 −2 ) G1: 2.12 ± 0.41 G2: 2.09 ± 0.37 G3: 2.19 ± 0.46 G4: 2.15 ± 0.43 Adj p = 0.37* FT3:FT4 G1: 0.44 ± 0.09 G2: 0.44 ± 0.07 G3: 0.45 ± 0.08 G4: 0.45 ± 0.07 Adj p = 0.41* TSH (mU/L) G1: 1.23 ± 0.72 G2: 1.23 ± 0.70 G3: 1.27 ± 0.69 G4: 1.18 ± 0.69 Adj p = 0.24* *Between‐groups comparisons (ANCOVA; adjusted for baseline value, sex, age, and clinic location) |
|
Winther et al. (2015) DK PRECISE Denmark |
RCT G1, placebo: 126/90 G2, 100 μg Se/d: 124/91 G3, 200 μg Se/d: 122/90 G4, 300 μg Se/d: 119/90 Duration (max): 5 yr Aged 60–74 yr; taking > 80% pills in the run‐in phase; SWOG performance status score ≤ 1; no active liver or kidney disease; no previous diagnosis of cancer (excluding NMSC); no diagnosed HIV infection; not receiving immunosuppressive therapy; not receiving ≥ 50 mg/day of Se supplements in the previous 6 mo |
Sex (% F): 48.1 Age (yr): 66.1 ± 4.1 BMI (kg/m 2 ): NR Ethnicity: Caucasian Plasma Se (ng/g, median (IQR)) G1: 85 (20) G2: 86 (18) G3: 88 (22) G4: 84 (19) Se intake: NR |
Se‐enriched yeast (100 μg Se/d or 200 μg Se/d 300 μg Se/d) vs placebo Adherence: NR Serum selenium at 5 yr follow up, μg/L (median (IQR)) G1: 85 (16) G2: 157 (33) G3: 217 (46) G4: 271 (106) |
Plasma levels of FT3, FT4, FT3:FT4, TSH |
FT3 (pmol/L, median (IQR)) G1: 5.44 (0.77) G2: 5.56 (0.71) G3: 5.54 (0.68) G4: 5.56 (0.83) FT4 (pmol/L, median (IQR)) G1: 12.88 (2.67) G2: 13.06 (2.8) G3: 13.43 (2.28) G4: 13.43 (2.38) FT3:FT4 (median, IQR)) G1: 0.43 (0.07) G2: 0.43 (0.10) G3: 0.42 (0.07) G4: 0.42 (0.07) TSH (mU/L, median (IQR)) G1: 1.21 (0.81) G2: 1.28 (0.94) G3: 1.14 (0.95) G4: 1.18 (0.89) |
FT3 (pmol/L, median (IQR)) G1: 5.54 (0.95) G2: 5.59 (0.71) G3: 5.58 (0.78) G4: 5.53 (0.78) FT4 (pmol/L, median (IQR)) G1: 13.32 (3.07) G2: 13.52 (2.88) G3: 13.24 (2.08) G4: 13.25 (2.12) FT3:FT4 (median, IQR)) G1: 0.42 (0.09) G2: 0.42 (0.09) G3: 0.42 (0.07) G4: 0.42 (0.08) TSH (mU/L, median (IQR)) G1: 1.22 (1.02) G2: 1.17 (0.79) G3: 1.32 (0.84) G4: 1.06 (0.85) |
|
Carvalho et al. (2015) Brazil |
RCT G1, placebo: 45/42 G2, 227.5 μg Se/day: 44/35 Duration: 90 d Aged 40–80 yr; with dyslipidemia and hypertension and treated for both conditions in the previous 3 mo; TSH within reference range (0.45–4.50 μUI/mL) and FT4 within reference range (0.70–1.48 ng/dL); no history of thyroid disease or thyroid medication use; no chronic renal failure; not using supplements containing > 20 μg Se/day; no excessive consumption of Brazil nuts; not having plasma Se levels > 125 μg/L; not being current smokers; not having been in a rigorous exercise/ weight‐reduction program in the previous 3 mo |
Sex (% F): 44.2 Age (yr): 60.05 ± 10.27 BMI (kg/m 2 ): 29.54 ± 5.60 Ethnicity: NR Plasma Se (μg/L) G1: 86.6 ± 17.2 G2: 88.7 ± 15.3 Se intake: NR |
13 g/day partially defatted Brazil nut flour (227.5 μg of Se/d) vs 11 g/day of artificially flavoured dyed cassava flour as placebo (0.07 μg Se/d) Plasma Se at 90 d follow up, μg/L G1: 92.7 ± 16.8 G2: 169.5 ± 46.5 |
Plasma levels of FT3, FT4, TSH |
NR |
Change from baseline FT3 (pg/mL) G1: −0.1 ± 0.4 G2: 0.1 ± 1.1 p = 0.030, for intragroup differences in G1, compared to baseline values NS, for intragroup differences in G2 or intergroup differences at end of trial FT4 (ng/dL) G1: −0.1 ± 0.1 G2: 0.1 ± 0.6 NS, for intragroup differences in G1 and G2, or intergroup differences at end of trial TSH (μUI/mL) G1: −0.2 ± 0.9 G2: 0.2 ± 1.8 NS, for intragroup differences in G1 and G2. p = 0.06 for intergroup differences at end of trial |
|
Thomson et al. (2009) New Zealand |
RCT G1, placebo: 25/24 G2, 100 Se μg/d: 25/25 Duration: 12 wk Aged 60–80 yr; noninstitutionalised, free from cancer, diabetes, or cardiovascular disease; not using medications for thyroid function or with any known thyroid problems; not taking supplements containing Se or iodine. |
Sex (% F): 55 Age (yr): 72.4 ± 4.8 BMI (kg/m 2 ): 26.8 ± 5.8 Ethnicity: NR Plasma Se (μmol/L) G1: 1.23 ± 0.29 G2: 1.23 ± 0.31 Se intake: NR |
L‐Selenomethionine (100 Se μg/d) vs placebo Adherence: 90% of consuming all pills and 10% consuming between 97% and 99% pills. |
Plasma levels of FT3, FT4, FT3:FT4, TSH |
FT3 (pmol/L) G1: 4.85 ± 0.47 G2: 4.70 ± 0.46 FT4 (pmol/L) G1: 14.7 ± 2.0 G2: 14.0 ± 2.0 FT3:FT4 (median, IQR)) G1: 0.33 (0.31, 0.37) G2: 0.34 (0.30, 0.39) TSH (mIU/L, median (IQR)) G1: 2.35 (1.59, 3.41) G2: 2.58 (1.76, 3.23) |
Change from baseline FT3 (geometric mean (95% CI)) G1: −0.10 (20.27, 0.08), p = 0.267* G2: 0.15 (20.02, 0.31), p = 0.080* FT4 (geometric mean (95% CI)) G1: −0.16 (20.65, 0.33), p = 0.521* G2: 0.04 (20.43, 0.51), p = 0.881* *Random‐coefficients mixed model, adjusted for age, sex, BMI, baseline plasma Se, medication use, and supplement use |
|
Thomson et al. (2005) Study 3: Dunedin smokers New Zealand |
RCT G1, placebo: 30 G2, 100 μg Se/d: 30 Duration: 20 wk Aged 19–52 yr; smokers; whole blood Se concentration < 1.0 mmol/L, or whole blood Se concentration between 1.0–1.2 mmol/L and whole blood glutathione peroxidase activities < 20 units/g Hb |
Sex (% F): 50 Age (yr): 19–52 BMI (kg/m 2 ): NR Ethnicity: NR Plasma Se (μmol/L) G1: 0.99 ± 0.15 G2: 0.97 ± 0.14 Se intake: NR |
L‐Selenomethionine (100 μg Se/day) vs placebo Adherence: NR |
Plasma levels of T3, T4, TSH |
T4 (μmol/L) G1: 99 ± 31 G2: 106 ± 36 T3:T4 G1: 0.021 ± 0.009 G2: 0.022 ± 0.008 TSH NR |
T4 (μmol/L) G1: 91 ± 32 G2: 98 ± 33 p = NS T3:T4 G1: 0.020 ± 0.007 G2: 0.023 ± 0.008 p = NS TSH NR |
|
Thomson et al. (2005) Study 5: Dunedin residents New Zealand |
RCT G1, placebo: 86 G2, 200 μg Se/d: 86 Duration: 20 wk Aged 18–65 years, healthy |
Sex (% F): 66.28 Age (yr): 18–65 BMI (kg/m 2 ): NR Ethnicity: NR Plasma Se (μmol/L) G1: 1.06 ± 0.23 G2: 1.14 ± 0.28 Se intake: NR |
Se‐enriched yeast (200 μg Se/d) vs placebo Adherence: NR |
Plasma levels of T3, T4, TSH |
T4 (μmol/L) G1: 89 ± 18 G2: 88 ± 23 T3:T4 G1: 0.018 ± 0.003 G2: 0.019 ± 0.006 TSH NR |
T4 (μmol/L) G1: 88 ± 23 G2: 84 ± 22 p = NS T3:T4 G1: 0.018 ± 0.005 G2: 0.018 ± 0.004 p = NS TSH NR |
|
Hawkes et al. (2008) USA |
RCT G1, placebo: 20 G2, 300 μg Se/d: 22 Duration: 48 wk No hypertension, diabetes, sexually transmitted disease, or cancer; clinically normal blood count, blood chemistries and thyrotropin; no smokers; no use of Se shampoos, Se supplements > 50 mg/d, thyroid medications, weight loss drugs, or anabolic steroids; not > 10 lb weight change within last 6 mo; no exercise or physical training in excess of 3 × 1‐h sessions per wk. |
Sex: M Age (yr): 18–45 BW (kg): G1: 77.4 ± 11.9 G2: 76.3 ± 9.9 Ethnicity: NR Plasma Se: NR Se intake (3‐d diet record): 135 ± 57 μg/d |
Se‐enriched yeast (300 μg Se/d) vs placebo Adherence, pills count (%): 93 ± 5.3 |
Plasma levels of T3, FT3, T4, FT4, TSH |
T3 (nmol/L) G1: 1.90 ± 0.38 G2: 2.17 ± 0.43 FT3 (pmol/L) G1: 41 ± 11 G2: 45 ± 7.5 T4 (nmol/L) G1: 91 ± 17 G2: 94 ± 17 FT4 (nmol/L) G1: 18 ± 2.7 G2: 18 ± 2.7 TSH (mU/L) G1: 2.30 ± 1.31 G2: 2.10 ± 0.85 |
T3 (nmol/L) G1: 1.77 ± 0.28 G2: 1.98 ± 0.35 p = NS FT3 (pmol/L) G1: 39 ± 7.5 G2: 45 ± 17 p = NS T4 (nmol/L) G1: 92 ± 18 G2: 92 ± 22 p = NS FT4 (nmol/L) G1: 18 ± 3.0 G2: 18 ± 2.2 p = NS TSH (mU/L) G1: 2.16 ± 1.11 G2: 2.11 ± 1.10 p = NS |
|
Hawkes and Keim (2003) USA |
RCT G1, low Se diet: 6/6 G2, high Se diet: 6/5 Duration: 99 d Healthy; BW for height 125% of ideal; no use of Se supplements or Se‐containing shampoos; normal ECG, blood cell counts, clinical chemistries or semen analysis; no HIV infection; no use of illegal drugs; no use of tobacco or alcohol; no use of medications; no history of psychiatric illness, thyroid or heart disease, syphilis, hepatitis, diabetes, hypertension or hyperlipidaemia. |
Sex: M Age (yr): 20–45 BW (kg): G1: 74.9 ± 9.8 G2: 73.5 ± 12.6 Ethnicity: NR Plasma Se (μg/L)* G1: 118 ± 8 G2: 107 ± 19 Se intake: NR |
Stabilisation period: 47 μg/day of Se for 21‐d; then randomised to receive foods with naturally high (297 μg/d) or low (14 μg/d) Se content; diet controlled in metabolic research unit. |
Plasma levels of T3, T4, TSH |
T3 (nmol/L)* G1: 1.57 ± 0.25 G2: 1.82 ± 0.36 T4 (nmol/L)* G1: 118 ± 26 G2: 113 ± 15 TSH (mU/L)* G1: 1.69 ± 0.30 G2: 2.25 ± 0.81 * Values at 21‐d (end of stabilisation period) |
T3 (nmol/L) G1: 1.64 ± 0.16 G2: 1.57 ± 0.07 p Se = 0.013; p time = NS; p Se × time = 0.048# T4 (nmol/L) G1: 90.3 ± 6.6 G2: 86.8 ± 12.7 p Se = NS; p time = 0.033; p Se × time model = NS# TSH (mU/L) G1: 1.77 ± 0.46 G2: 2.96 ± 1.05 p Se = NS; p time = 0.011; p Se × time = 0.031# #Repeated‐measures ANOVA, controlling for baseline values |
|
Duffield and Thomson (1999) New Zealand |
RCT G1, placebo: 10 G2, 10 Se μg/d: 10 G3, 20 Se μg/d: 11 G4, 30 Se μg/d: 10 G5, 40 Se μg/d: 11 Duration: 20 wk New Zealand residents; whole‐blood Se concentrations < 1.26 mmol/L |
Sex (% F): 67.31 Age (yr): 19–59 y BW (kg): G1: 78.5 G2: 66.4 G3: 76.6 G4: 79.4 G5: 67.8 Ethnicity: NR Plasma Se (μmol/L) G1: 0.783 G2: 0.806 G3: 0.846 G4: 0.869 G5: 0.809 Se intake (μg/day) 3‐d duplicate diets: 29 ± 13 3‐d diet records: 28 ± 15 |
L‐selenomethionine (10 Se μg/day, 20 Se μg/day, 30 Se μg/day or 40 Se μg/day) vs placebo Adherence (assessed by pill counts) NR Increase in whole‐blood Se at 20 kw follow up vs baseline, % (mean) G1: +4 G2: +9 G3: +9 G4: +7 G5: +13 |
Plasma levels of T4 |
T4 (nmol/L) G1: 95 ± 32 G2: 108 ± 21 G3: 97 ± 15 G4: 97 ± 18 G5: 95 ± 23 |
T4 (nmol/L) G1: 99 ± 30 G2: 93 ± 10* G3: 88 ± 15 G4: 90 ± 17 G5: 89 ± 19 G2‐G5 (combined): 89 ± 15* *Significantly different from week 0 after adjustment for baseline value, p < 0.05 |
|
Olivieri et al. (1995) Italy |
RCT G1, placebo: 20/17 G2, 100 Se μg/d: 20/19 Duration: 3 mo No nutritional disturbances, thyroid or gastrointestinal diseases that could influence thyroid hormones or Se status; not taking supplements. |
Sex (% F): 77.8 Age (yr): 85 ± 7 Ethnicity: Caucasian Serum Se (μmol/L) G1: 0.79 ± 0.18 G2: 0.83 ± 0.13 Se intake: NR |
Sodium selenite (100 Se μg/d) vs placebo Adherence: tablets given during breakfast over the supervision of a nurse. Serum Se increased by 61% in the supplemented participants vs no change in the control group |
Plasma levels of T3, T4, FT4, T3:T4, TSH |
T3 (nmol/L) G1: 1.1 ± 0.17 G2: 1.08 ± 0.14 T4 (nmol/L) G1: 70 ± 13 G2: 67 ± 9 FT4 (pmol/L) G1: 9.99 ± 2.2 G2: 9.4 ± 1.5 T3:T4 G1: 0.016 ± 0.003 G2: 0.016 ± 0.002 TSH (mU/L) G1: 1.14 ± 0.51 G2: 1.2 ± 0.5 |
T3 (nmol/L) G1: 1.1 ± 0.09 G2: 0.99 ± 0.2 T4 (nmol/L) G1: 68.5 ± 10.4 G2: 62 ± 10* FT4 (pmol/L) G1: 10 ± 1.65 G2: 9.3 ± 2 T3:T4 G1: 0.015 ± 0.002 G2: 0.016 ± 0.003 TSH (mU/L) G1: 0.99 ± 0.71 G2: 1.18 ± 0.58 *paired Student t‐test: significant difference between values at baseline vs end of trial (p < 0.05). |
CI: confidence interval; d: day; BMI: Body mass index; BW: body weight; DK: Denmark; ECG: electrocardiogram; ERMS: error root mean square; F: females; Gx: group x; HIV: human immunodeficiency virus; M: males; mo: month; NR: not reported; NS: not significant; PRECISE: PREvention of Cancer by Intervention with Selenium; RCT: randomised controlled trial; Se: selenium; SWOG: Southwest Oncology Group; T3: triiodothyronine; T4: thyroxine; TSH: thyroid‐stimulating hormone; FT3: free triiodothyronine; FT4: free thyroxine; T3:T4: triiodothyronine: thyroxine ratio; UK: United Kingdom; USA: United States of America; wk: week; yr: year.
(a) Duration = duration of the treatment phase, unless specified otherwise.
(b): Mean ± SD, unless specified otherwise.
D.6.2. Observational studies on thyroid diseases
|
Cohort name Country Reference Follow‐up Funding |
Original Cohort (N total) Exclusion criteria Study population (n, sex and age at baseline) |
Ascertainment of outcome |
Exposure groups n |
Incident cases | Model covariates | Results |
|---|---|---|---|---|---|---|
|
NIH‐AARP Diet and Healthy Study USA O'Grady et al. (2014) Prospective Cohort 10 yr Public |
N = 566,398 Population Sampled: members of the American Association of Retired Persons (AARP), aged 50–71 yr old. Excluded: participants with proxy respondents, reported poor health or end stage renal disease, with a previous diagnosis of cancer other than NMSC, with extreme or missing values for total energy intake or Se intake. n = 482,807 Sex (% F): 40.34 Ethnicity: Majority white Age (yr, range): 50–71 |
Incident thyroid cancer cases identified via linkage of the NIH‐AARP cohort membership to state cancer registries and the National Death Index; defined according to the International Classification of Disease for Oncology, Third Edition (ICD‐O‐3) |
Se intake assessed through a SFFQ Se intake (μg/day mean ± SD): 94.0 ± 42.9 Quintiles of Se intake (μg/day, median) Q1: 47 Q2: 68.4 Q3: 86.6 Q4: 108.6 Q5: 150.1 n, per quintile of intake Q1: 96,561 (22,396 M) Q2: 96,562 (39,795 M) Q3: 96,561 (60,176 M) Q4: 96,562 (77,287 M) Q5: 96,561 (88,290 M) |
592 incident thyroid cancer cases n thyroid cancer cases, F/M, per quintile of intake Q1: 119/19 Q2: 106/25 Q3: 66/49 Q4: 29/68 Q5: 15/96 |
Model 1 (M1) ‐ age Model 2 (M2) – M1 + sex, calories, smoking status, race, education, BMI, and physical activity. Model 3 (M3) – M2 + vitamin C, vitamin E, beta‐carotene, and folate. |
Incidence of thyroid cancer, HRs (95% CI) M1 Q1 (ref): 1 Q2: 0.96 (0.75, 1.22) Q3: 0.85 (0.66, 1.09) Q4: 0.72 (0.56, 0.94) Q5: 0.83 (0.65, 1.07) M2 Q1 (ref): 1 Q2: 1.00 (0.79, 1.28) Q3: 0.99 (0.76, 1.29) Q4: 1.00 (0.75, 1.33) Q5: 1.23 (0.92, 1.65) M3 Q1 (ref): 1 Q2: 1.07 (0.83, 1.36) Q3: 1.07 (0.81, 1.40) Q4: 1.10 (0.82, 1.48) Q5: 1.35 (0.99, 1.84) |
CI: confidence interval; F: females; HR: hazard ratio; M: males; NIH‐AARP: National Institutes of Health‐American Association of Retired Persons – Diet and Health Study; Qx: quintile x; SD: standard deviation; SFFQ: semi‐quantitative food frequency questionnaire; USA: United States of America; yr: year.
D.7. Prostate cancer
D.7.1. Intervention studies on incidence of prostate cancer
|
Reference Study Country |
Design N randomised/completed Duration(a) Recruitment criteria |
Subject characteristics at baseline(b) | Intervention(b) | Outcomes assessed | Results |
|---|---|---|---|---|---|
|
Algotar et al. (2013b) NBT USA and New Zealand |
RCT G1, placebo: 232/0 G2, 200 μg Se/d: 234/0 G2, 400 μg Se/d: 233/0 Duration (median): 35 mo High risk of prostate cancer, as evidenced by PSA > 4 ng/mL and/or suspicious DRE and/or PSA velocity > 0.75 ng/mL per yr; negative prostate biopsy for cancer within 12 mo of enrolment. |
Sex: M Age (yr) G1: 65.5 ± 7.4 G2: 65.2 ± 8.0 G3: 65.5 ± 7.7 BMI (kg/m 2 ): NR Ethnicity (Caucasians, %) G1: 84.2 G2: 83.7 G3: 82.6 Plasma Se (μg/L) G1: 124.5 ± 24.7 G2: 126.6 ± 26.9 G3: 127.2 ± 24.8 PSA (ng/mL) G1: 6.4 (5.6) G2: 7.2 (6.2) G3: 6.9 (4.5) Se intake: NR |
Selenised yeast (200 μg Se/d or 400 μg Se/d or) vs placebo Adherence, pill counts (%) G1: 92.1 G2: 93.2 G3: 91.2 |
Incidence of prostate cancer, biopsy‐proven (primary endpoint). Tissue samples from the subject's qualifying biopsy requested from the subject's physician and compiled in a biospecimen repository. |
HR for risk of prostate cancer (95% CI) (adjusted for age at baseline, race, baseline PSA, and baseline plasma Se concentration) G1: 1 (ref) G2: 0.94 (0.52, 1.7) G3: 0.90 (0.48, 1.66) |
|
Lippman et al. (2009) Klein et al. (2011) SELECT USA, Canada, Puerto Rico |
RCT G1, placebo: 8,856/8,696 G2, 200 μg Se/d: 8,910/8,752 Duration (median (min‐max)): 5.46 (4.17–7.33) yr (+ additional 3 yr of follow up) Aged ≥ 50 yr (African American men) or 55 yr or older (all other men); serum PSA ≤4 ng/mL; DRE not suspicious for prostate cancer |
Sex: M Age (yr, median (IQR)) G1: 62.6 (58.1–67.8) G2: 62.6 (58.2–68.0) BMI (kg/m 2 ): NR Ethnicity (Caucasian, %): 79 Serum Se (μg/L, median (IQR)) G1: 137.6 (124.7–151.8) G2: 135.0 (123.4–145.9) PSA (ng/mL, mean (IQR)) G1: 1.1 (0.6–1.9) G2: 1.1 (0.6–1.9) Se intake: NR |
L‐selenomethionine (200 μg Se/d) vs placebo Adherence, pill counts (%) G1: 85% at yr 1; 69% at yr 5 G2: 84% at yr 1; 69% at yr 5 Serum Se at 4 yr, μg/L (median (IQR)) G1: 140.1 (124.3–150.8) G2: 251.6 (218.7–275.0) |
Incidence of prostate cancer determined by routine clinical management. Prostate cancer status was determined by self‐report at each 6‐mo study visit; pathology report and tissue forwarded to the central pathology laboratory for confirmation of diagnosis |
N prostate cancer cases; HR for risk of prostate cancer (95% CI) By end of intervention period: G1: 416¦G2: 432; 1.04 (0.90, 1.18), p = 0.62 Intervention period + 3 yr of follow up: G1: 529¦G2: 575; 1.09 (0.93, 1.27), p = 0.18 Of which, prostate cases with Gleason ≥7 G1: 133¦G2: 161; 1.21 (0.90, 1.63), p = 0.11 |
|
Marshall et al. (2011) USA |
RCT G1, placebo: 225/134 G2, 200 μg Se/d: 227/135 Duration: 3 yr Aged ≥ 40 yr; biopsy‐ confirmed diagnosis of high‐grade prostatic intraepithelial neoplasia with no evidence of cancer; PSA ≤ 10 ng/mL; AUA symptom score < 20; ambulatory and able to carry out work of a light or sedentary nature. |
Sex: M Age (yr): ≥ 40 BMI < 25¦> 30 kg/m 2 (%) G1: 26.1¦27.5 G2: 21.7¦26.4 Ethnicity (White, %) G1: 76.8 G2: 83.5 Plasma Se, μg/L (median (IQR)) G1 (n = 51): 135.2 (113.3, 166.8) G2 (n = 46): 138.1 (104.7, 166.4) PSA < 4 ng/mL¦4–10 ng/mL (%) G1: 42.6¦57.4 G2: 38.2¦61.8 Se intake NR |
Selenomethionine (200 μg Se/d) vs placebo Adherence, pills count (%), at 1 yr; 3 yr G1: 90.8; 81.3 G2: 90.5; 78.9 Plasma Se (median, μg/L), at 1 yr; 3 yr G1 (n = 51): 145.7; 152.1 G2 (n = 46): 240.4; 261.2 |
Incidence of prostate cancer; biopsy proven. DRE every 6 mo. Tissue blocks and corresponding pathology reports for all prostate procedures submitted to the central study pathologist for review (blinded to study assignment) |
N prostate cancer cases; RR for prostate cancer (95% CI) G1: 47¦G2: 45; 0.97 (0.68, 1.39) By quartile of baseline plasma Se < 106 μg/L G1: 11¦G2: 9; 0.82 (0.40, 1.69) 106–132 μg/L G1: 9¦G2: 12; 1.38 (0.68, 2.78) 132–162 μg/L G1: 16¦G2: 14; 0.98 (0.58, 1.68) > 162 μg/L G1: 11¦G2: 10; 0.91 (0.45, 1.84) |
|
Duffield‐Lillico et al. (2003a) NPC USA |
RCT G1, placebo: 470 G2, 200 μg Se/day: 457 Duration (mean, max): 7.6 yr, 13 yr Confirmed histories of nonmelanoma skin cancer within the year before randomisation; estimated 5‐year life‐expectancy; no cancer within the previous 5 years. |
Sex: M Age (yr) G1: 63.7 ± 9.4 G2: 64.9 ± 8.8 BMI (kg/m 2 ) G1: 25.9 ± 3.7 G2: 26.0 ± 3.6 Ethnicity: NR Plasma Se (μg/L) G1: 115.1 ± 22.0 G2: 115.1 ± 22.1 PSA (ng/mL) G1: 1.9 (3.3) G2: 2.0 (3.4) Se intake: NR |
Selenised yeast (200 μg Se/d) vs placebo Adherence NR |
Participants visited the clinics every 6 mo and reported new illnesses and medications; medical records documenting any cancer screening procedures (PSA tests, DRE, prostate biopsies and surgery) obtained throughout the course of the trial. Incident prostate cancer cases reviewed and staged by a urological oncologist according to the TNM system. |
N prostate cancer cases; HR for prostate cancer (95% CI) (adjusted for age and smoking) G1: 42¦G2: 22; 0.48 (0.28, 0.80) By tertile of baseline plasma Se ≤ 106.4 μg/L G1: 15¦G2: 2; 0.14 (0.03, 0.61) 106.8–123.2 μg/L G1: 16¦G2: 7; 0.33 (0.13, 0.82) > 123.2 μg/L G1: 11¦G2: 13; 1.14 (0.51, 2.59) |
AUA: American Urological Association; BMI: body mass index; CI: confidence interval; d: day; DRE: digital rectal examination; Gx: group x; HR: hazard ratio; IQR: interquartile range; M: males; mo: month; NBT: Negative Biopsy Trial; NPC: Nutritional Prevention of Cancer Trial; NR: not reported; PC: prostate cancer; PSA: prostate specific antigen; RCT: randomised controlled trial; Se: selenium; SELECT: Selenium and Vitamin E Cancer Prevention Trial; TNM: tumour, nodes, and metastases; USA: United States of America; yr: year.
(a) Duration = duration of the treatment phase, unless specified otherwise.
(b): Mean ± SD, unless specified otherwise.
D.7.2. Observational studies on dietary selenium intake and incidence of prostate cancer
|
Cohort name Country Reference Follow‐up Funding |
Original Cohort (N total) Exclusion criteria Study population (n, sex and age at baseline(a)) |
Ascertainment of outcome |
Exposure groups(a) n/person‐years |
Incident cases | Model covariates | Results |
|---|---|---|---|---|---|---|
|
EPIC Denmark, Italy, The Netherlands, Spain, Sweden, UK, Germany, Greece Allen et al. (2008) 4.3 yr (median; up to 15.1 yr) Nested Case–Control Public |
N ≈ 520,000 Population sampled: general population Excluded: no blood sample, missing information on the date of blood collection or had a history of cancer (except NMSC) n = 2,018 cases: 959 controls: 1,059 (matched for age, time of blood collection) Sex: M Ethnicity: Caucasian Age (yr): 43–76 |
Data on stage and grade at diagnosis extracted from pathology reports stored at cancer registries or from medical records stored at the treating hospital. |
Serum Se (μg/L, geometric mean (95% CI)) Cases: 70.6 (69.7, 71.5) Controls: 71.9 (71.0, 72.7) n, per quintile Q1 < 62: 441 Q2 62–68.5: 391 Q3 68.6–75: 404 Q4 75.1–84.0: 384 Q5 ≥ 84.1: 398 |
Cases per quintile Q1: 229 Q2: 179 Q3: 192 Q4: 172 Q5: 187 |
Model 1: crude Model 2: BMI, smoking status, alcohol intake, physical activity, marital status, and education level |
Incidence of prostate cancer; RR (95% CI) Model 1 Q1(ref.): 1 Q2: 0.80 (0.60, 1.05) Q3: 0.87 (0.65, 1.16) Q4: 0.85 (0.64, 1.14) Q5: 1.00 (0.74, 1.36) p trend = 0.48 Model 2 Q1(ref.): 1 Q2: 0.81 (0.61, 1.07) Q3: 0.85 (0.63, 1.14) Q4: 0.82 (0.61, 1.10) Q5: 0.96 (0.70, 1.31) p trend = 0.25 |
|
MEC USA Park et al. (2015) 13.9 yr (mean) Prospective cohort Public |
N = 96,896 Population sampled: general population Excluded: not belonging to one of the five racial/ethnic groups, prior prostate cancer, implausible dietary data based on total energy intake or its components, and missing or incomplete data n = 75,216 Sex: M Ethnicity: 26% White, 12% African American, 7% Native Hawaiian, 32% Japanese American, 23% Latino Age (yr): 45–75 |
Cases identified by linkage to the Surveillance, Epidemiology, and End Results (SEER) cancer registries covering the states of Hawaii and California. |
Se intake assessed through a SFFQ Quintiles cut‐points, μg/1,000 kcal Q1 < 44 Q2 44–49.4 Q3 49.5–54.3 Q4 54.4–60 Q5 ≥ 60.1 n per quintile: NR |
Total cases: 7,115 Cases per quintile: NR |
Age at cohort entry, race/ethnicity, family history of prostate cancer, BMI, smoking status, education, history of diabetes, physical activity, alcohol consumption, calcium intake, legume intake, lycopene intake. |
Incidence of prostate cancer; RR (95% CI) Q1(ref): 1 Q2: 1.10 (0.96, 1.26) Q3: 1.10 (0.95, 1.27) Q4: 0.98 (0.84, 1.16) Q5: 1.01 (0.84, 1.20) p trend = 0.71 |
|
DCH cohort Denmark Outzen et al. (2021) Up to 19 yr Nested Case–Control Mixed |
N = 27,178 Population sampled: general population, aged 50–64 yr, without prior diagnosis of cancer Excluded: lack of toenail sample, very high toenail Se concentration, very low toenail sample mass, missing data, incomplete case–control pairs n = 2,320 Cases: 1,160 Controls: 1,160 Sex: M Ethnicity: Caucasian Age (yr): 50–64 |
Data on cancer occurrence obtained through record linkage to the Danish Cancer Registry. |
Toenail selenium (μg/g, median (P5, P95): 0.510 (0.394, 0.717) n, per quintile Q1 ≤ 0.447: 481 Q2 0.447–0.488: 441 Q3 0.488–0.533: 474 Q4 0.533–0.599: 461 Q5 ≥ 0.599: 463 Plasma selenoprotein P (n = 993; mg/L, median (P5, P95): 5.5 (3.5, 8.0) n, per quintile Q1 ≤ 4.4: 399 Q2 4.4–5.2: 425 Q3 5.2–5.8: 408 Q4 5.8–6.7: 382 Q5 > 6.7: 372 |
Cases per quintile of toenail Se Q1: 247 Q2: 211 Q3: 239 Q4: 232 Q5: 231 Cases per quintile of plasma selenoprotein P Q1: 200 Q2: 226 Q3: 209 Q4: 184 Q5: 174 |
BMI, smoking status, education, participation in sport |
Incidence of prostate cancer, OR (95% CI) By toenail Se Q1(ref): 1 Q2: 0.87 (0.67, 1.12) Q3: 0.97 (0.75, 1.27) Q4: 0.98 (0.74, 1.30) Q5: 0.95 (0.72, 1.26) p trend = 0.88 By plasma selenoprotein P Model 1 Q1(ref): 1 Q2: 1.13 (0.86, 1.49) Q3: 1.03 (0.78, 1.37) Q4: 0.90 (0.68, 1.20) Q5: 0.83 (0.61, 1.13) p trend = 0.11 |
|
Netherlands Cohort Study The Netherlands Geybels et al. (2013) 17.3 yr Prospective case‐cohort Private |
N = 58,279 Population sampled: general population, aged 55–69 yr Excluded: prevalent cancer other than skin cancer at baseline; incomplete/inconsistent dietary questionnaire n = 2,074 Cases: 898 Sub‐cohort: 1,176 Sex: M Ethnicity: Caucasian Age (yr) Cases: 62.1 (4.1) Sub‐cohort: 61.3 (4.2) |
Cases of advanced prostate cancer (International Union Against Cancer (UICC) stage III/IV) identified by annual record linkage to the Netherlands Cancer Registry and the Dutch Pathology Registry |
Toenail Se (μg/g, mean (SD)) Cases: 0.527 (0.169) Sub‐cohort: 0.550 (0.129) person‐years, per quintile* for sub‐cohort Q1 ≤ 0.469: 3,203 Q2 0.469–0.515: 3,283 Q3 0.515–0.560: 3,336 Q4 0.560–0.617: 3,449 Q5 > 0.617: 3,375 *based on the distribution among sub‐cohort members. |
Total = 898 n, per quintile Q1: 261 Q2: 214 Q3: 178 Q4: 130 Q5: 115 |
Model 1: age Model 2: age, first‐degree family history of prostate cancer, smoking status, duration of smoking, and frequency of smoking |
HR (95% CI) for advanced prostate cancer Model 1 Q1(ref): 1 Q2: 0.78 (0.59, 1.02) Q3: 0.63 (0.48, 0.83) Q4: 0.47 (0.35, 0.63) Q5: 0.39 (0.29, 0.53) p trend < 0.001 Model 2 Q1(ref): 1 Q2: 0.75 (0.57, 1.00) Q3: 0.59 (0.44, 0.79) Q4: 0.43 (0.31, 0.58) Q5: 0.37 (0.27, 0.51) p trend < 0.001 |
|
ULSAM Sweden Grundmark et al. (2011) 26.5 yr (mean) Prospective cohort Mixed |
N = 2,322 Population Sampled: general male population residents in Uppsala Excluded: missing serum Se n = 2,045 Sex: M Ethnicity: Caucasian Age (yr): 50 |
Prostate cancer cases ascertained via linkage with the nationwide Population Register, the Cancer Register, the Hospital Discharge Register and the Causes of Death Register. Cases confirmed by reviewing the medical records |
n, per tertile of serum Se (μg/L) T1 ≤ 70: 759 T2 70.1–81: 653 T3 > 81: 633 |
n, per tertile T1: 84 T2: 65 T3: 59 |
unadjusted |
Incidence of prostate cancer, RR (95% CI) T1(ref): 1 T2: 0.89 (0.65, 1.24) T3: 0.83 (0.60, 1.16) |
|
PCPT USA and Canada Kristal et al. (2010) 9 yr Nested case–control Public |
N = 18,880 Population sampled: men with PSA levels ≤ 3 ng/mL and normal DRE, participating in PCPT trial Excluded: missing end‐of‐study biopsy, BMI, dietary intake or Gleason scores; had prostatectomy for reasons other than cancer; cases diagnosed on or after the trial end‐date; unreliable dietary information n = 9,559 Cases: 1,703 Controls: 7,856 Sex: M Ethnicity: ~94% White Age (yr) ≥ 55 |
Adenocarcinoma identified through biopsies, consisting of a minimum of 6 core samples, reviewed by the pathologist at the local study site and a central pathology laboratory |
Se intake assessed through a nutritional supplement questionnaire n, per supplemental intake (μg/d) category For Gleason score 2–7 C1 < 10: 5,351 C2 10–30: 2,947 C3 > 30: 1,134 For Gleason score 8–10 C1 < 10: 4,559 C2 10–30: 2,466 C3 > 30: 958 |
n, for Gleason score 2–7 C1: 870 C2: 514 C3: 192 n, for Gleason score 8–10 C1: 78 C2: 33 C3: 16 |
age, race/ethnicity, family history of prostate cancer in first‐degree relatives, treatment arm, and BMI |
Incidence of prostate cancer, OR (95% CI) For Gleason score 2–7 C1(ref): 1 C2: 1.08 (0.96, 1.22) C3: 1.06 (0.89, 1.25) For Gleason score 8–10 C1(ref): 1 C2: 0.80 (0.53, 1.21) C3: 1.00 (0.58, 1.73) |
|
PLCOCS USA Peters et al. (2007) Up to 8 yr Nested case–control Public |
N = 38,352 Population sampled: participants from the screening arm for the PLCO trial, aged 55–74 yr Excluded: history of cancer (other than NMSC), unable to be contacted, ethnic or racial background other than non‐Hispanic white, missing data n = 1,603 cases: 879 controls: 724 (matched for age, time since initial screening, race, year of blood draw) Sex: M Ethnicity: non‐Hispanic white Age (yr): 55–74 |
Cases of adenocarcinoma of prostate were identified. PSA measured at entry and annually for 5 yr and DRE at entry and annually for 3 yr; men with PSA levels > 4 ng/mL or suspicious DRE referred to their medical care providers for prostate cancer diagnosis. Follow‐up for recent diagnosis of cancer carried out by annual mailed questionnaires and through searches of the National Death Index; confirmed against death certificates and medical or pathologic records |
Serum Se (ng/mL, median (range)) n, per quartile* Q1 113.7 (50.5 to < 126.8): 414 Q2 135.3 (≥ 126.8 to < 141.9): 409 Q3 149.4 (≥ 141.9 to < 158): 418 Q4 170.4 (≥ 158 to 253): 362 *Based on the distribution among controls |
n, per quartile Q1: 195 Q2: 189 Q3: 198 Q4: 142 |
Incidence of prostate cancer, OR (95% CI) Q1(Ref): 1 Q2: 0.95 (0.72, 1.27) Q3: 1.13 (0.85, 1.51) Q4: 0.84 (0.62, 1.14) p trend = 0.70 |
|
|
PHS USA Li et al. (2004) 13 yr Nested case–control Public |
N = 22,071 Population sampled: male physicians Excluded: history of myocardial infarction, stroke, transient ischemic attack, unstable angina; cancer (except for NMSC); renal or liver disease, peptic ulcer, gout; use of platelet‐active agents, vitamin A, or β‐carotene supplements n = 1,163 cases: 586 controls: 577 Sex: M Ethnicity: majority Caucasian (94%) Age (yr): 40–84 |
Cases of prostate cancer self‐reported; confirmed against hospital records and pathology reports by study physicians from the End Point Committee Stage |
Plasma Se (ppm, median (range)) n, per quintile*Error! Bookmark not defined. Q1 0.09 (0.06–0.09): 236 Q2 0.10 (0.09–0.10): 253 Q3 0.11 (0.10–0.11): 217 Q4 0.12 (0.11–0.12):245 Q5 0.13 (0.12–0.19): 212 *Based on the distribution among controls |
n, per quintile Q1: 121 Q2: 137 Q3: 105 Q4: 127 Q5: 96 |
Age at baseline, smoking status, and duration of follow‐up (duration of follow‐up for case subjects was number of years between baseline and diagnosis; duration of follow‐up for control subjects was the same as that for corresponding case subjects). |
Incidence of prostate cancer, OR (95% CI) Q1(ref): 1 Q2: 1.13 (0.79, 1.61) Q3: 0.88 (0.61, 1.28) Q4: 1.02 (0.71, 1.45) Q5: 0.78 (0.54, 1.13) p trend = 0.16 |
|
CARET USA Goodman et al. (2001) 4.7 yr (mean) Nested case–control Public |
N = 18,306 Population sampled: asbestos workers and heavy smokers participating to CARET trial n = 691 cases: 235 controls: 456 (matched for randomisation year, age group, smoking status, treatment arm, year of blood draw Sex: M Ethnicity: 91% White, 6% Black, 3% other/unknown Age (yr): 45–74 |
Self‐reported prostate cancer; confirmed against medical records and pathology reports |
Serum Se quartiles* (μg/dl) Q1: 5.07–10.12 Q2: 10.13–11.25 Q3: 11.26–12.59 Q4: 12.60–21.96 *Based on the distribution among controls n per quartile: NR |
n, per quartile: NR |
Incidence of prostate cancer, OR (95% CI) Q1 (ref): 1 Q2: 0.85 (0.53, 1.35) Q3: 1.08 (0.69, 1.71) Q4: 1.02 (0.65, 1.60) p trend = 0.69 |
|
|
HHP USA Nomura et al. (2000) 12.4 yr (mean) Nested case–control Public |
N = 9,345 Population sampled: Japanese American men Excluded: history of cancer prior to baseline n = 498 Cases: 249 Controls: 249 (matched on age, smoking status, time of examination) Sex: M Ethnicity: Asian Age (yr): 45–68 |
Prostate cancer cases identified through discharge records of hospitals and linkage with the Hawaii Tumour Registry |
n per quartile of serum Se (ng/mL) Q1 < 119.3: 137 Q2 119.3 to < 130.6: 127 Q3 130.6 to < 147.2: 134 Q4 ≥ 147.2: 100 *Based on the distribution among controls |
n, per quartile Q1: 75 Q2: 64 Q3: 72 Q4: 38 |
Incidence of prostate cancer, OR (95% CI) Q1(ref): 1 Q2: 0.9 (0.5, 1.4) Q3: 1.0 (0.6, 1.6) Q4: 0.5 (0.3, 0.9) p trend = 0.2 |
|
|
CLUE II USA Helzlsouer et al. (2000) 7 yr Nested case–control Public |
N = 10,456 Population sampled: general male population residents of Washington county Excluded: NR n = 350 cases: 117 controls: 233 (matched for age, race, date of participation in the CLUE II program, size of toenail clipping) Sex: M Ethnicity: NR Age (yr): > 45 |
Cases of prostate cancer identified by linkage with Washington County Cancer Registry and the Maryland Cancer Registry (since 1995) |
n, per quintile of toenail Se (ppm) Q1: < 0.69: 77 Q2: 0.69–0.75: 68 Q3: 0.75–0.81: 67 Q4: 0.81–0.91: 71 Q5: > 0.91: 67 *Based on the distribution among controls |
n, per quintile Q1: 32 Q2: 20 Q3: 21 Q4: 24 Q5: 20 |
BMI at age 21 years, education, and hours since last meal |
Incidence of prostate cancer, OR (95% CI) Q1(ref): 1 Q2: 0.41 (0.18, 0.93) Q3: 0.55 (0.26, 1.17) Q4: 0.66 (0.33, 1.33) Q5: 0.38 (0.17, 0.85) |
|
HPFS USA Yoshizawa et al. (1998) 7 yr Nested case–control Public |
N = 51,529 Population sampled: male health professionals, aged 40–75 yr Excluded: energy intake < 800 or > 4,200 kcal/d, incomplete questionnaire, cases occurring in first 2 yr n = 362 Cases: 181 Controls: 181 (matched for age, smoking status, date of toenail return) Sex: M Ethnicity: majority Caucasian Age (yr, median): 64 |
Self‐reported incident cases of prostate cancer identified via biannual questionnaires, confirmed through a review of histopathologic reports from medical records |
n per quintile (median (range)) of toenail Se (ppm) Q1: 0.66 (0.53–0.73): 89 Q2: 0.76 (0.73–0.79): 71 Q3: 0.82 (0.79–0.85): 66 Q4: 0.88 (0.85–0.94): 71 Q5: 1.14 (0.94–7.09): 65 |
n, per quintile Q1: 54 Q2: 34 Q3: 29 Q4: 36 Q5: 28 |
Model 1: crude Model 2: quintiles of lycopene, saturated fat, and calcium, for family history of prostate cancer (binary), for body mass index (quintiles), and for vasectomy (binary). Model 3 (n = 354): model 2 + region (soil selenium content high, medium, low) |
Incidence of prostate cancer, OR (95% CI) Model 1 Q1(ref): 1 Q2: 0.57 (0.29, 1.12) Q3: 0.53 (0.28, 1.01) Q4: 0.67 (0.34, 1.32) Q5: 0.49 (0.25, 0.96) p trend = 0.11 Model 2 Q1(ref): 1 Q2: 0.62 (0.29, 1.35) Q3: 0.35 (0.16, 0.78) Q4: 0.80 (0.35, 1.80) Q5: 0.39 (0.18, 0.84) p trend = 0.05 Model 3 Q1(ref): 1 Q2: 0.59 (0.27, 1.30) Q3: 0.35 (0.16, 0.78) Q4: 0.76 (0.34, 1.73) Q5: 0.35 (0.16, 0.78) p trend = 0.03 |
|
ATBC study Finland Hartman et al. (1998) 7 y (median) Prospective case‐cohort Public |
N = 29,133 Population sampled: smokers, aged 50–69 yr, participating in the ATBC trial Excluded: alcoholics, cirrhosis of the liver, severe angina with exertion, chronic renal insufficiency, previously diagnosed with cancer, use of vitamins E or A or β‐carotene supplements, receiving anticoagulant therapy n = 29,133 cases: 317 controls: 28,816 Sex: M Ethnicity: Caucasian Age (yr): cases: 60.9 ± 5.1 controls: 57.2 ± 5.1 |
Prostate cancer cases identified through the Finnish Cancer Registry and the Register of Causes of Death; confirmed against medical records |
Se intake (μg/d) assessed through a SFFQ Cases: 93.9 ± 40.2 Controls: 95.9 ± 36.5 Quartiles of Se intake (n = 190) Q1: < 71.52 Q2: 71.52–89.12 Q3: 89.13–111.05 Q4: > 111.05 n per quartile: NR |
n, per quartile: NR | Age, BPH, living in an urban area, β‐carotene intervention, and total energy (dietary factors) |
Incidence of prostate cancer, RR (95% CI) Q1(ref): 1 Q2: 1.09 (0.71, 1.68) Q3: 0.97 (0.59, 1.60) Q4: 1.27 (0.70, 2.20) p trend = 0.49 |
|
MCHES Finland Knekt et al. (1990) 10 yr (median) Nested case–control Public |
N = 39,268 Population sampled: general population, aged 15–99 yr Excluded: history of cancer n = 102 Cases: 51 Controls: 51 (matched for sex, age and municipality) Sex: M Ethnicity: Caucasian Age (yr): 15–99 |
Prostate cancer cases identified through the nationwide Finnish Cancer Registry. |
Serum Se (μg/L) Cases: 59.6 ± 19.4 Controls: 58.3 ± 14.8 Quintiles Q1: < 0.49 Q2: 49–57 Q3: 58–66 Q4: 67–77 Q5: ≥ 78 n per quintile: NR |
n, per quintile: NR | Smoking |
Incidence of prostate cancer, RR (95% CI NR) Q1(ref): 1 Q2: 1.37 Q3: 0.85 Q4: 0.87 Q5: 1.15 p trend = 0.707 |
|
Seattle firms USA Coates et al. (1988) 10 yr Nested case–control Public |
N = 6,167 Population sampled: employees from two Seattle firms Excluded: NR n = 37 cases: 13 controls: 24 (matched for employer, age, sex, race, date of blood draw) Sex: M Ethnicity: ~70% white Age (yr): > 18 |
Names and birthdates of the employees who developed prostate cancer were matched against the records of the Cancer Surveillance System. |
Serum Se tertiles (μg/L, n = 241) T1: 98–148 T2: 149–170 T3: 171–240 n per tertile: NR |
n, per tertile: NR |
Incidence of prostate cancer, RR (95% CI: NR) T1(ref): 1 T2: 0.2 T3: 0.3 p trend = 0.18 |
ATBC: Alpha‐Tocopherol, Beta‐Carotene Cancer Prevention; BMI: body mass index; Cx: category x; CARET: Carotene and Retinol Efficacy Trial; CLUE II: Campaign Against Cancer and Heart Disease II; CI: confidence interval; DCH: Diet, Cancer and Health; DRE: digital rectal examination; EPIC: European Prospective Investigation into Cancer and Nutrition; HHP: Honolulu Heart Program; HPFS: Health Professionals Follow‐Up Study; HR: hazard ratio; M: males; MCHES: Mobile Clinic Health Examination Survey; MEC: The Multiethnic cohort; NR: not reported; OR: odds ratio; PCPT: Prostate Cancer Prevention Trial; PH: benign prostatic hyperplasia; PHS: Physicians' Health Study; PLCOCS: Prostate, Lung, Colorectal, and Ovarian Cancer Screening Trial; PSA: prostate specific antigen; Qx: quintile/quartile x; RR: relative risk; SD: standard deviation; SFFQ: semi‐quantitative food frequency questionnaire; Tx: tertile x; ULSAM: Uppsala Longitudinal Study of Adult Men; UPI: unique personal identification; USA: United States of America; yr: year.
(a) Mean ± SD (range), unless specified otherwise.
D.8. Skin cancer
D.8.1. Intervention studies on incidence of skin cancer
|
Reference Study Country |
Design N randomised/completed Duration(a) Recruitment criteria |
Subject characteristics at baseline(b) |
Intervention(b) | Outcomes assessed | Results |
|---|---|---|---|---|---|
|
Duffield‐Lillico et al. (2003b) Duffield‐Lillico et al. (2002) NPC USA |
RCT G1, placebo: 629/465 G2, 200 μg Se/d: 621/472 Duration (mean, max): 7.6 yr; 13 yr Confirmed histories of NMSC within the year before randomisation; estimated 5‐yr life‐expectancy; no cancer within the previous 5 yr. |
Sex (% F) G1: 25 G2: 26 Age (yr) G1: 63.0 ± 9.9 G2: 63.4 ± 10.2 BMI (kg/m 2 ) G1: 25.5 ± 4.1 G2: 25.6 ± 3.9 Ethnicity (non‐Hispanic white, %): 98.4 Plasma Se (μg/L) G1: 114.0 ± 21.5 G2: 114.4 ± 22.6 Se intake: NR |
Selenised yeast (200 μg Se/d) vs placebo Adherence, % missing a pill less than twice a month (self‐reported): G1: 80 G2: 78 |
Incident BCC and SCC diagnosed by biopsy and confirmed by board‐certified dermatopathologists. Recurrent and retreated skin tumours and skin tumours without biopsy confirmation were excluded |
Incidence rate (N cases/total PY); HR (95% CI) (adjusted for sex, age, smoking status, clinic site, plasma Se, clinical sun damage, sunscreen use at baseline, and N of BCCs/SCCs/total NMSCs (analysis dependent) in previous 12 mo) SCC G1: 0.05¦G2: 0.07; 1.25 (1.03, 1.51) By tertile of baseline plasma Se concentration (μg/L) ≤ 105.2 μg/L: 0.87 (0.62, 1.22) 105.6–122 μg/L: 1.49 (1.05, 2.12) ≥ 122.4 μg/L: 1.59 (1.11, 2.30) BCC G1: 0.13¦G2: 0.16; 1.09 (0.94, 1.26) Total NMSC G1: 0.16¦G2: 0.20; 1.17 (1.02, 1.34) N incident cases; HR (95% CI) (adjusted for age, smoking status and gender) Melanoma G1: 9¦G2: 11; 1.18 (0.49, 2.85) |
|
Reid et al. (2008) NPC (Macon site) USA |
RCT G1, placebo: 213 G2, 400 μg Se/d: 210 Duration (mean): 5.2 yr Confirmed history of NMSC in the year before randomisation, had an estimated life expectancy of 5 yr, and had no reported internal cancer in the previous 5 yr |
Sex (% F) G1: 31.9 G2: 33.8 Age (yr) G1: 63.8 ± 10.1 G2: 63.8 ± 10.6 Ethnicity (non‐Hispanic white, %): 98.4 BMI (kg/m 2 ) G1: 26.1 ± 3.9 G2: 25.7 ± 3.8 Plasma Se (μg/L) G1: 114.0 ± 18.1 G2: 119.0 ± 24.3 Se intake NR |
Selenised yeast (400 μg Se/d) vs placebo Adherence, % missing a pill less than twice a month (self‐reported): G1: 81 G2: 78 |
Incident BCC and SCC diagnosed by biopsy and confirmed by board‐certified dermatopathologists. Recurrent and retreated skin tumours and skin tumours without biopsy confirmation excluded |
N incident cases; HR (95% CI) (adjusted for age, smoking status and gender) SCC G1: 53¦G2: 56; 1.05 (0.72, 1.53) BCC G1: 83¦G2: 76; 0.95 (0.69, 1.29) Total NMSC G1: 108¦G2: 98; 0.91 (0.69, 1.20) By tertile of baseline plasma Se ≤ 106.8 μg/L : 0.95 (0.57, 1.55) 106.8–122.4 μg/L : 0.94 (0.57, 1.53) > 122.4 μg/L : 0.79 (0.46, 1.34) By median baseline plasma Se < 113.2 μg/L : 0.98 (0.65, 1.46) ≥ 113.2 μg/L : 0.80 (0.53, 1.21) |
|
Thompson et al. (2016) Sel/Cel USA |
RCT G1, placebo: 914/912 G2, 200 μg Se/d: 910/908 Duration (median): 33 mo Aged 40–80 yrs; had undergone removal of ≥ 1 colorectal adenomas ≥ 3 mm within 6 mo prior to random assignment; 200 participants had one or more advanced adenomas (i.e., adenomas ≥ 10 mm, villous histology, or high‐grade dysplasia). |
Sex (% F) G1: 34.0 G2: 36.7 Age (yr) G1: 62.6 ± 8.9 G2: 63.2 ± 9.0 BMI (kg/m 2 ) G1: 29.2 ± 5.1 G2: 29.1 ± 5.1 Ethnicity (white, %) G1: 93.3 G2: 94.4 Plasma Se (μg/L, median (Q1, Q3)) G1: 135.2 (120.8, 153.3) G2: 135.5 (121.5, 151.8) Se intake: NR Personal history of skin cancer, n (%) G1: 144 (15.8) G2: 142 (15.6) Personal history of SCC, n (%) G1: 28 (3.1) G2: 33 (3.6) |
Selenised yeast (200 μg Se/d) vs placebo Adherence: NR |
Incident SCC; method of ascertainment NR |
N incident cases SCC (event rate/1,000 PY); HR (95% CI) (adjusted for random assignment to celecoxib, aspirin, and clinic) G1: 21 (8.2)¦G2: 27 (10.9); 1.34 (0.76, 2.37) Stratified by sex F: G1: 5 (6.2)¦G2: 3 (3.4); 0.52 (0.13, 2.20) M: G1: 16 (9.2)¦G2: 24 (15.2); 1.64 (0.87, 3.09) Among participants with history of SCC at baseline G1: 5 (68.8)¦G2: 6 (78.3); 1.09 (0.30, 4.04) |
|
Algotar et al. (2013b) NBT USA and New Zealand |
RCT G1, placebo: 232/0 G2, 200 μg Se/d: 234/0 G2, 400 μg Se/d: 233/0 Duration (median): 35 mo High risk of prostate cancer, as evidenced by prostate specific antigen (PSA) > 4 ng/mL and/or suspicious digital rectal examination and/or PSA velocity (rate of PSA change over time) > 0.75 ng/mL per year; undergone a prostate biopsy negative for cancer within 12 mo of enrolment. |
Sex: M Age (yr) G1: 65.5 ± 7.4 G2: 65.2 ± 8.0 G3: 65.5 ± 7.7 BMI (kg/m 2 ): NR Ethnicity (Caucasians, %) G1: 84.2 G2: 83.7 G3: 82.6 Plasma Se (μg/L) G1: 124.5 ± 24.7G2: 126.6 ± 26.9 G3: 127.2 ± 24.8 Se intake: NR |
Selenised yeast (200 μg Se/d or 400 μg Se/d or) vs placebo Adherence, pill counts (%) G1: 92.1 G2: 93.2 G3: 91.2 |
Incidence of melanoma, BCC and SCC; method of ascertainment NR |
N incident cases Melanoma G1: 2¦G2: 3¦G3: 2 (p = 0.87) BCC G1: 15¦G2: 13¦G3: 12 (p = 0.82) SCC G1: 17¦G2: 10¦G3: 2 (p = 0.002) |
BCC: basal cell carcinoma; BMI: body mass index; CI: confidence interval; d: day; F: females; Gx: group x; HR: hazard ratio; M: males; mo: month; N: number; NBT: Negative Biopsy Trial; NMSC: non‐melanoma skin cancer; NPC: Nutritional Prevention of Cancer Trial; NR: not reported; NZ: New Zealand; PY: person‐years; Qx: quartile x; SCC: squamous cell carcinoma; SD: standard deviation; Se: selenium; Sel/Cel: The Selenium and Celecoxib Trial; USA: United States of America; yr: year.
(a) Duration = duration of the treatment phase, unless specified otherwise.
(b): Mean ± SD, unless specified otherwise.
D.8.2. Observational studies on incidence of skin cancer
|
Cohort name Country Reference Follow‐up Funding |
Original Cohort (N total) Exclusion criteria Study population (n, sex and age at baseline(a)) |
Ascertainment of outcome |
Exposure groups(a) n |
Incident cases | Model covariates | Results |
|---|---|---|---|---|---|---|
|
HPFS & NHS USA Matthews et al. (2019) HPFS: 26 yr NHS: 28 yr Prospective cohort Public |
HPFS N = 51,529 NHS N = 121,700 Population sampled: male health professionals (HPFS) and registered nurses (NHS) Excluded: prior history of cancer, non‐Caucasian, no toenail clippings HPFS n = 3,730 NHS n = 6,708 HPFS Sex: males NHS Sex: females Ethnicity: Caucasian HPFS Age (yr): 40–75 NHS Age (yr): 30–55 |
Incident BCC, SCC and MSC identified through self‐administered biennial questionnaires; confirmed on the basis of medical and pathology reports for SCC and melanoma. Self‐reported BCC not confirmed against medical report (validity previously demonstrated, with 96% and 84% of cases, in females and males, respectively, confirmed by pathology records) |
Toenail Se (μg/g, median) HPFS/NHS Q1(ref): 0.67/0.63 Q2: 0.77/0.71 Q3: 0.84/0.77 Q4: 0.94/0.83 Q5: 1.17/0.95 n per quintile NR |
HPFS/NHS BCC Q1(ref): 158/292 Q2: 178/329 Q3: 180/310 Q4: 180/313 Q5: 184/309 SCC Q1(ref): 32/43 Q2: 34/47 Q3: 48/53 Q4: 37/40 MSC Q1(ref): 16/12 Q2: 18/17 Q3: 20/9 Q4: 19/19 |
Assay batch, age (in years), number of severe sunburns, number of moles, hair colour, family history of melanoma, history of SCC or melanoma, UV exposure at residence (quintiles), history of physical examination, and sun reactions (none, burn, painful burn/blisters) (and Fitzpatrick score (I‐VI) for females) |
HR (95% CI) for BCC Q1(ref): 1 Q2: 1.06 (0.93, 1.20) Q3: 1.00 (0.88, 1.13) Q4: 0.99 (0.87, 1.13) Q5: 0.99 (0.87, 1.13) p trend 0.64 HR (95% CI) for SCC* Q1(ref): 1 Q2: 1.06 (0.77, 1.45) Q3: 1.27 (0.93, 1.72) Q4: 0.90 (0.65, 1.26) p trend 0.69 HR (95% CI) for MSC* Q1(ref): 1 Q2: 1.22 (0.74, 2.03) Q3: 0.99 (0.58, 1.68) Q4: 1.34 (0.80, 2.24) p trend 0.43 *Se intake divided in quartiles due to smaller sample sizes |
|
The Nambour Skin Cancer Study Australia van der Pols et al. (2009) 8 yr Prospective cohort Public |
N = 1,621 Population sampled: Adult residents of Nambour, sub‐tropical area of Australia Excluded: skin cancer at baseline; no serum Se measurement n = 485 Sex (% F): 54 Ethnicity: Caucasian Age (yr): 20–69 |
BCC and SCC identified through biannual questionnaires; cases confirmed through histologic reports. |
Serum Se (μmol/L*; median (min‐max)) T1: 0.9 (0.4–1.0) T2: 1.1 (1.1–1.2) T3: 1.4 (1.3–2.8) *1 μmol/L = 79 μg/L BCC, n per tertile T1: 163 T2: 159 T3:163 SCC, n per tertile T1: 162 T2: 158 T3: 165 |
BCC: T1: 20 T2: 22 T3: 17 SCC: T1: 17 T2: 21 T3: 21 |
Model 1: age and sex Model 2: Model 1 + pack‐years of smoking, alcohol intake (continuous), time spent outdoors on weekdays, and history of skin cancer before baseline |
RR (95% CI) for BCC Model 1 T1(ref): 1 T2: 1.09 (0.56, 2.10) T3: 0.57 (0.28, 1.17) p trend 0.14 Model 2 T1(ref): 1 T2: 1.02 (0.56, 1.87) T3: 0.43 (0.21, 0.86) p trend 0.02 RR (95% CI) for SCC Model 1 T1(ref): 1 T2: 0.97 (0.48, 1.95) T3: 0.44 (0.19, 1.00) p trend 0.06 Model 2 T1(ref): 1 T2: 0.86 (0.44, 1.67) T3: 0.36 (0.15, 0.82) p trend 0.02 |
|
The Nambour Skin Cancer Study Australia Heinen et al. (2007) 8 yr Prospective cohort Public |
N = 1,621 Population sampled: Adult residents of Nambour, sub‐tropical area of Australia Excluded: skin cancer at baseline; incomplete FFQ, energy intakes outside the normal ranges n = 1,001 Sex (% F): 54 Ethnicity: Caucasian Age (yr): 20–69 |
BCC and SCC identified through biannual questionnaires; cases confirmed through histologic reports. |
Se intake assessed through a SFFQ Se intake (μg/d; median (min‐max)) T1: 70.1 (34.3–76.2) T2: 82.2 (76.2–89.3) T3: 99.1 (89.3–168.9) BCC/SCC, n per tertile NR |
BCC: T1: 84 T2: 122 T3: 115 SCC: T1: 61 T2: 63 T3: 97 |
Model 1: age, sex, treatment allocation during the Nambour trial of b‐carotene and/or sunscreen (prior to baseline) Model 2: age, sex, energy intake (kJ/day), skin colour, tanning ability of skin, elastosis of the neck, number of painful sunburns, smoking, treatment allocation, use of dietary supplements (yes/no), history of skin cancer before baseline |
RR (95% CI) for BCC Model 1 T1(ref): 1 T2: 1.2 (0.71, 1.9) T3: 1.0 (0.62, 1.7) p trend 0.90 Model 2 T1(ref): 1 T2: 1.2 (0.73, 1.9) T3: 0.95 (0.59, 1.5) p trend 0.81 RR (95% CI) for SCC Model 1 T1(ref): 1 T2: 0.75 (0.43, 1.3) T3: 1.1 (0.63, 1.8) p trend 0.73 Model 2 T1(ref): 1 T2: 1.1 (0.59, 1.9) T3: 1.3 (0.77, 2.3) p trend 0.28 |
|
VITAL cohort USA Asgari et al. (2009) 5 yr (mean) Prospective cohort |
N = 77,719 Population sampled: Adult residents of western Washington Excluded: MSC at baseline, non‐Caucasian or did not report their race n = 69,671 Sex (% F): 54 Ethnicity: Caucasian Age (yr): 50–76 |
Incident cases of MSC identified through linkage with Surveillance, Epidemiology, and End Results (SEER) cancer registry; included melanoma in situ, malignant melanoma NOS, superficial spreading melanoma, lentigo maligna melanoma, nodular melanoma, and other subtypes including melanoma within a junctional nevus, spindle cell melanoma, acral lentiginous melanoma, and desmoplastic melanoma. |
Self‐reported Se intake from food supplements (μg/d) over the 10 y prior to baseline n, per category: G1, none: 23,855 G2, > 0–≤ 20: 28,613 G3, > 20–< 50: 11,414 G4: ≥ 50: 5,392 |
G1: 152 G2: 195 G3: 76 G4: 37 |
Age, gender, education (high school or less, some college, advanced degree), 1st degree family history melanoma (no, yes), personal history of NMSC (no, yes), ever had moles removed (no, yes), freckles between ages 10–20 yr (no, yes), had ≥ 3 severe sunburns between ages 10–20 years (no, yes), natural red/blond hair between ages 10–20 yr (no, yes), and reaction to 1‐h in strong sunlight |
RR (95% CI) for MSC G1(ref): 1 G2: 1.09 (0.88, 1.36) G3: 1.01 (0.77, 1.33) G4: 0.98 (0.69, 1.41) p trend 0.98 |
|
Skin Cancer Prevention Study USA Karagas et al. (1997) 5 yr (mean) Nested case–control Public |
N = 1,805 Population sampled: Adults participating to the Skin Cancer Prevention study (at least one BCC or SCC cancer previously removed) Excluded: NR n = 392 Cases: 132 Controls: 264 (matched for age, sex and study center) Sex (% F): 11 Ethnicity: Caucasian Age (yr): 35–84 |
SCC cases detected at annual examinations by study dermatologists; biopsy specimens read locally and reviewed centrally by the study dermatopathologist. Skin lesions removed at times other than the scheduled study examinations identified through patient questionnaires and confirmed against medical records. |
Plasma Se (ppm, mean (SE)) Cases: 0.127 (0.0018) Controls: 0.128 (0.0012) n, per quartile for first SCC/any SCC: Q1 ≤ 0.12: 111/118 Q2 0.121–0.130: 73/84 Q3 0.131–0.140: 81/91 Q4 > 0.140: 84/99 |
first SCC/any SCC Q1: 49/49 Q2: 18/19 Q3: 24/28 Q4: 28/35 |
Smoking |
OR (95% CI) for first SCC Q1(ref): 1 Q2: 0.45 (0.23, 0.87) Q3: 0.62 (0.31, 1.24) Q4: 0.67 (0.35, 1.29) p trend 0.25 OR (95% CI) for any SCC Q1(ref): 1 Q2: 0.44 (0.23, 0.84) Q3: 0.74 (0.38, 1.44) Q4: 0.86 (0.47, 1.58) p trend 0.89 |
|
MCHES Finland Knekt et al. (1990); Knekt et al. (1991) 10 yr (median) Nested case–control Public |
N = 39,268 Population sampled: general population, aged 15–99 yr Excluded: history of cancer n = 378 Cases: 126 Controls: 252 (matched for sex, age and municipality) Sex (% F): 50 Ethnicity: Caucasian Age (yr): 15–99 |
BCC and MSC cases identified from the nationwide Finnish Cancer Registry |
Serum Se (μg/L) BCC cases: Males: 60.7 ± 16.9 Females: 62.7 ± 15.3 BCC controls: Males: 61.9 ± 14.5 Females: 62.6 ± 14.8 Quintiles Q1: < 0.49 Q2: 49–57 Q3: 58–66 Q4: 67–77 Q5: ≥ 78 Melanoma cases: 59.8 (NR) Melanoma controls: 61.3 (NR) n per quintile of intake NR |
Total BCC cases: 64 males 62 females Melanoma cases: 10 (mixed sex; % NR) Melanoma controls: 18 (mixed sex; % NR) Cases per quintile of intake NR MSC cases = 10 |
Smoking |
RR (95% CI NR) for BCC Males Q1(ref): 1 Q2: 0.94 Q3: 0.38 Q4: 0.41 Q5: 0.54 p trend 0.429 Females Q1(ref): 1 Q2: 1.81 Q3: 1.63 Q4: 0.94 Q5: 1.55 p trend 0.743 RR for MSC, per 1 SD increase of serum Se (crude) 0.79 (95% CI NR) p trend 0.68 |
BCC: basal cell carcinoma; BMI: body mass index; CI: confidence interval; F: females; HR: hazard ratio; HPFS: Health Professionals Follow‐up study; MCHES: Mobile Clinic Health Examination Survey; MSC: melanoma skin cancer; NHS: Nurses' Health Study; NMSC: non‐melanoma skin cancer; NR: not reported; NZ: New Zealand; OR: odds ratio; RR: relative risk; Qx: quintile/quartile x; SCC: squamous cell carcinoma; RR: relative risk; SD: standard deviation; SFFQ: semi‐quantitative food frequency questionnaire; VITAL: VITamins And Lifestyle; yr: year.
(a) Mean ± SD (range), unless specified otherwise.
D.9. Type 2 diabetes mellitus
D.9.1. Intervention studies on incidence of T2DM
|
Reference Study Country |
Design N randomised/completed Duration(a) Recruitment criteria |
Subject characteristics at baseline(b) |
Intervention(b) |
Outcomes assessed |
Results |
|---|---|---|---|---|---|
|
Stranges et al. (2007) NPC USA Trial period: 1983–1996 |
RCT G1, placebo: 659/602 G2, 200 μg Se/d: 653/600 Duration: 7.7 ± 2.7 yr Confirmed history of NMSC in the year before randomisation, estimated life expectancy of 5 yr, and no reported internal cancer in the previous 5 yr, no history of clinically important liver or kidney disorders, no baseline T2DM |
Sex (% F) G1: 25 G2: 26 Age (yr) G1: 63.0 ± 9.9 G2: 63.4 ± 10.2 BMI (kg/m 2 ) G1: 25.5 ± 4.1 G2: 25.6 ± 3.9 Ethnicity (non‐Hispanic white, %): 98.4 Plasma Se (μg/L) G1: 114.0 ± 21.5 G2: 114.4 ± 22.6 Se intake: NR |
Selenised yeast (200 μg/d) vs placebo Adherence, self‐reported (%) G1: 80.3 G2: 78.4 |
Incidence of T2DM: self‐report during the clinical interview, reported use of drugs for diabetes, and reports in medical record documents. About 92% of reports, regardless of source, were corroborated with medical record documentation (obtained from primary physician and reviewed by blinded nurses). |
N T2DM incident cases (N cases/1,000 PY); HRs (95% CI) (adjusted for age, sex, BMI, and smoking status) G1: 39 (8.4)lG2: 58 (12.6); 1.55 (1.03, 2.33) By age ≤ 65 yr: 1.53 (0.83, 2.82) > 65 yr: 1.60 (0.92, 2.76) By sex M: 1.62 (1.04, 2.55) F: 1.38 (0.52, 3.64) By baseline plasma Se median level ≤ 113.4 μg/L : 1.04 (0.60, 1.80) > 113.4 μg/L : 2.50 (1.32, 4.77) By tertile of baseline plasma Se ≤ 105.2 μg/L : 1.13 (0.58, 2.18) 105.3–121.6 μg/L : 1.36 (0.60, 3.09) > 121.6 μg/L : 2.70 (1.30, 5.61) |
|
Lippman et al. (2009) SELECT USA, Canada, and Puerto Rico Trial period: 2001–2008 |
RCT G1, placebo: 8,856/8,696 G2, 200 μg Se/d: 8,910/8,752 Duration (median (min‐max)): 5.46 (4.17–7.33) yr Aged ≥ 50 yr (African American men) or ≥ 55 yr (all other men); serum prostate‐specific antigen level ≤4 ng/mL; DRE not suspicious for prostate cancer |
Sex: M Age (yr, median (IQR)) G1: 62.6 (58.1–67.8) G2: 62.6 (58.2–68.0) BMI (kg/m 2 ): NR Ethnicity (Caucasian, %) G1: 79 G2: 79 Serum Se (μg/L, median (IQR)) G1: 137.6 (124.7–151.8) G2: 135.0 (123.4–145.9) Se intake: NR |
L‐selenomethionine (200 μg/d) vs placebo Adherence, pill counts (%) G1: 85% at yr 1; 69% at yr 5 G2: 84% at yr 1; 69% at yr 5 |
Incidence of T2DM: self‐reported glitazone medication use (as of beginning of 2003) and self‐report of diabetes (as of beginning of 2005) at each clinic visit; prevalent cases at randomisation excluded |
N T2DM incident cases; RR (99% CI) (crude) G1: 699 l G2: 724; 1.07 (0.94, 1.22) |
|
Algotar et al. (2013a) NBT USA and New Zealand Trial period: – |
RCT G1, placebo: 232/0 G2, 200 μg Se/d: 234/0 G3, 400 μg Se/d: 233/0 Duration (median (max)): 3 (5) yr High risk of prostate cancer, as evidenced by PSA > 4 ng/mL and/or suspicious DRE and/or PSA velocity (rate of PSA change over time) > 0.75 ng/mL per year; undergone a prostate biopsy negative for cancer within 12 mo of enrolment. |
Sex: M Age (years) G1: 65.5 ± 7.4 G2: 65.2 ± 8.0 G3: 65.5 ± 7.7 BMI (kg/m 2 ): NR Ethnicity (Caucasian, %) G1: 84.2 G2: 83.7 G3: 82.6 Plasma Se (μg/L) G1: 124.5 ± 24.7 G2: 126.6 ± 26.9 G3: 127.2 ± 24.8 Se intake: NR |
Selenised yeast (200 or 400 μg Se/day) vs placebo Adherence: NR |
Incidence of T2DM: questionnaire at baseline and at every follow‐up visit recorded ‘diabetes status’ (no further information) |
N T2DM incident cases G1: 7¦G2: 12lG3: 12; p = 0.44 |
|
Karp et al. (2013) ECOG USA Trial period: 2000–2009 |
RCT G1, placebo: 521/521 G2, 200 μg Se/d: 1,040/1,040 Duration (mean (max)): NR (4) yr Aged ≥ 18 yr; 6 to 36 mo from complete resection of histologically proven non‐small lung cancer; no concurrent cancers or cancer history within the past 5 yr, except localised NMSC; normal hepatic function. Supplements containing ≤ 70 μg Se allowed throughout study participation. |
Sex (% F) G1: 52 G2: 51 Age (yr, median (range)) G1: 66 (38–86) G2: 66 (24–93) BMI (kg/m 2 ): NR Ethnicity: NR Plasma/serum Se: NR Se intake: NR |
Selenised yeast (200 μg Se/day) vs placebo Adherence, reporting taking ‘1 pill a day almost always’: 96% at 3 months, 1 year and 2 years |
Incidence of T2DM: diabetes‐related questions added in the on‐study, toxicity, and long‐term follow‐up forms following a recommendation of the DMC in 2007 |
N T2DM incident cases G1: 12lG2: 26 |
|
Thompson et al. (2016) Sel/Cel Trial USA Trial period: 2001–2013 |
RCT G1, placebo: 914/912 G2, 200 μg Se/d: 910/908 Duration (median, max): 2.75, 7.0 yr Aged 40–80 yr; had undergone removal of ≥ 1 colorectal adenomas ≥ 3 mm within 6 mo prior to random assignment; 200 participants had one or more advanced adenomas (i.e., adenomas ≥ 10 mm, villous histology, or high‐grade dysplasia). |
Sex (% F) G1: 34 G2: 36.7 Age (yr) G1: 62.6 ± 8.9 G2: 63.2 ± 9.0 BMI (kg/m 2 ) G1: 29.2 ± 5.1 G2: 29.1 ± 5.1 Ethnicity (white, %) G1: 93.3 G2: 94.4 Plasma Se (μg/L, median (Q1, Q3) G1: 135.2 (120.8, 153.3) G2: 135.5 (121.5, 151.8) Se intake: NR |
Selenised yeast (200 μg/d) vs placebo Adherence, pill count (%) G1: 96.4 G2: 96.6 |
Incidence of T2DM: development of T2DM (no further description of outcome ascertainment method) |
N T2DM incident cases (N cases/1,000 PY); HRs (95% CI) (adjusted for random assignment to celecoxib, aspirin, and clinic) G1: 25 (11.0) l G2: 31 (13.7); 1.25 (0.74, 2.11) By sex F: G1: 6 (8) l G2: 12 (15); 1.85 (0.69, 4.97) M: G1: 19 (12.5) l G2: 19 (13); 1.05 (0.56, 1.99) By age < 63 y: G1: 15 (13.5) l G2: 9 (8.1); 0.59 (0.25, 1.35) ≥ 63 y: G1: 10 (8.6) l G2: 22 (19.2); 2.21 (1.04, 4.67) |
BMI: body mass index; CI: confidence interval; d: day; DRE: digital rectal examination; ECOG: Eastern Cooperative Oncology Group; F: females; Gx: group x; HR: hazard ratio; IQR: interquartile range; M: males; mo: month; N: number; NBT: Negative Biopsy Trial; NMSC: non‐melanoma skin cancer; NPC: Nutritional Prevention of Cancer trial; PSA: prostate specific antigen; PY: person‐years; RCT: randomised controlled trial; RR: relative risk; Se: selenium; Sel/Cel: Selenium and Celecoxib trial; SD: standard deviation; SELECT: Selenium and Vitamin E Cancer Prevention Trial; Qx: quartile x; T2DM: type 2 diabetes mellitus; USA: United States of America; wk: week; yr: year.
(a) Duration = duration of the treatment phase, unless specified otherwise.
(b): Mean ± SD, unless specified otherwise.
D.9.2. Intervention studies on measures of blood glucose tolerance
a. Fasting glucose, fasting insulin, Homeostasis Model Assessment (HOMA) indices
|
Reference Study Country |
Design N randomised/completed Duration(a) Reftcruitment criteria |
Subject characteristics at baseline(b) |
Intervention(b) | Outcomes assessed | Results(b) | |
|---|---|---|---|---|---|---|
| Baseline | End of trial | |||||
|
Hawkes et al. (2008) USA |
RCT G1, placebo: 27/20 G2, 300 μg Se/d: 27/22 Duration: 48 wk (+ 48 wk follow up) Aged 19–45 yr, healthy men; non‐smokers; no use of Se shampoos, Se supplements providing > 50 μg/d, thyroid medications, weight loss drugs, or anabolic steroids; no weight loss > 10 lb within last 6 mo; no exercise > 3 h per wk. |
Sex: M Age (yr): 18–45 BMI (kg/m 2 ): NR Ethnicity: NR Plasma/serum Se: NR Se intake (μg/d): 135 ± 57 (by 3‐d diet records, during the 48 wk of supplementation) |
Selenised yeast (300 μg Se/d) vs placebo Adherence, pill count (%): 93 ± 5.3% |
Fasting serum glucose at baseline and at 48 wk and 96 wk |
Fasting serum glucose (mmol/L) G1: 4.83 ± 0.59 G2: 4.97 ± 0.54 |
Fasting serum glucose (mmol/L) At 48 wk G1: 4.80 ± 0.46 G2: 4.90 ± 0.56 At 96 wk G1: 5.04 ± 0.53 G2: 4.92 ± 0.44 |
|
Mesdaghinia et al. (2017) Iran |
RCT G1, placebo: 30/30 G2, 100 Se μg/d: 30/30 Duration: 10 wk, between 17 and 27 wk of gestation Pregnant women at risk for IUGR; no use of Se supplement during past 3 mos; non‐smokers; no hypothyroidism or hyperthyroidism, UTI, preeclampsia, HT, diseases related to increased inflammation, and kidney or liver diseases |
Sex: F Age (yr) G1: 28.1 ± 4.9 G2: 30.5 ± 5.5 BMI (kg/m 2 ) G1: 22.5 ± 3.2 G2: 21.2 ± 4.2 Ethnicity: NR Se intake: NR |
Selenised yeast (100 Se μg/d) vs placebo Adherence, pill count (%): 100 |
Fasting serum glucose, HOMA‐IR, HOMA‐B at baseline and after 10 wk |
Fasting serum glucose (mg/dL) G1: 92.6 ± 9.6 G2: 90.4 ± 11.6 HOMA‐IR G1: 3.5 ± 1.5 G2: 3.7 ± 1.7 HOMA‐B G1: 57.1 ± 24.7 G2: 62.0 ± 26.0 |
Fasting serum glucose (mg/dL) G1: 91.6 ± 11.6 G2: 89.2 ± 12.6 p = 0.90 HOMA‐IR G1: 4.2 ± 2.1 G2: 3.2 ± 1.0 p = 0.02 HOMA‐B G1: 72.5 ± 43.4 G2: 55.6 ± 21.0 p = 0.02 |
|
Navas‐Carretero et al. (2011) Spain |
RCT G1, non‐enriched chicken: 16/13 G2, Se‐enriched chicken: 16/11 Duration: 10 wk Aged 20–45 yr, BMI > 18.5 and < 30 kg/m2, no medication or dietary treatment, and maintained weight (±3 kg) for the last 3 mo; no metabolic diseases (e.g. diabetes, thyroid impairments, other endocrine disturbances); no gastric and peptic ulcer problems, HTN, constipation, or diarrhoea |
Sex: M and F Age (yr): 20–45 BMI (kg/m 2 ) G1: 24.2 ± 2.1 G2: 24.1 ± 2.7 Ethnicity: NR Blood Se (μg/dL) G1: 14.2 ± 1.4 G2: 14.6 ± 1.7 Se intake: NR |
200 g of Se‐enriched chicken breast (25.5 Se μg/100 g), 4 times/wk, vs non‐enriched chicken breasts (6.5 Se μg/100 g) Adherence: NR No significant difference between groups in blood Se changes (μg/dL) G1: +0.7 ± 0.9 G2: +0.2 ± 1.4 |
Fasting serum glucose, fasting insulin and HOMA‐IR at baseline and 10 wk |
Fasting serum glucose (mg/dL) G1: 81.7 ± 6.1 G2: 87.3 ± 5.1 Fasting insulin (mU/L) G1: 4.9 ± 2.2 G2: 5.2 ± 3.6 HOMA‐IR G1: 1.0 ± 0.5 G2: 1.1 ± 0.8 |
Change from baseline Fasting serum glucose (mg/dL) G1: −0.9 ± 4.1 G2: −5.2 ± 4.7 Fasting insulin (mU/L) G1: 0.3 ± 2.3 G2: −0.5 ± 1.4 HOMA‐IR G1: 0.05 ± 0.5 G2: −0.16 ± 0.32 |
|
Richie et al., 2014 USA |
RCT G1, placebo: 34/18 G2, 200 μg Se/d as SY: 33/16 G3: 285 μg Se/d as SY: 32/15 G4: 200 μg Se/d as SeMet: 31/20 Duration: 9 mo (+ 3 mo of follow‐up) Aged 20–79 yr, healthy men, non‐smokers, normal serum PSA, no history or evidence of diabetes, prostate cancer, liver, or kidney disease, no use of Se supplements providing > 50 μg/d |
Sex: M Age (yr) G1: 48.1 ± 14.6 (22–70) G2: 50.7 ± 16.2 (23–78) G3: 51.3 ± 12.0 (25–72) G4: 54.0 ± 13.4 (30–75) BMI (kg/m 2 ) G1: 30.0 ± 4.79 (22.0–38.3) G2: 28.0 ± 3.20 (22.4–34.9) G3: 27.8 ± 3.14 (23.7–34.2) G4: 28.5 ± 3.79 (23.0–36.4) Ethnicity (Caucasians, %) G1: 94 G2: 94 G3: 87 G4: 85 Plasma Se (μg/L): ca. 137 Se intake: NR |
Selenised yeast (200 or 285 μg /d) vs selenomethionine (200 μg /d) vs placebo Adherence, pill count (%): 95 Plasma Se (μg/L) at 9 mo G1: 146 G2: 207 G3: 253 G4: 263 |
Fasting blood glucose at baseline and at 9 mo (data at 3, 6 and 12 mo visits not extracted) |
Fasting blood glucose (mg/dL, mean ± SE) G1: 84.7 ± 2.29 G2: 91.6 ± 1.65 G3: 82.7 ± 2.45 G4: 91.0 ± 2.07 |
Change from baseline Fasting blood glucose (mg/dL, mean ± SE) G1: 3.72 ± 2.76 G2: −1.44 ± 2.75 G3: 1.60 ± 5.31 G4: −1.75 ± 2.46 |
| Diseased individuals | ||||||
|
Jamilian et al. (2015) Iran |
RCT G1, placebo: 35/35 G1, 200 μg Se/d: 35/35 Duration: 8 wk Aged 18–40 yr, with PCOS, before menopause; no use of Se supplements and metformin in the last 3 mo; non‐smokers; no diabetes or hypothyroidism; no special diet, oral conceptive, ovulation induction agents |
Sex: F Age (yr) G1: 25.7 ± 4.8 G2: 25.4 ± 5.1 BMI (kg/m 2 ) G1: 25.2 ± 4.1 G2: 25.0 ± 3.7 Ethnicity: NR Serum/plasma Se: NR Se dietary intake (μg/day, mean ± SD) (by 3‐d dietary records measured at week 2, 4, 6) G1: 58.5 ± 8.0 G2: 56.1 ± 10.5 |
Selenised yeast (200 μg Se/d) vs placebo Adherence, pills count (%): > 90% |
Fasting plasma glucose, fasting serum insulin, HOMA‐IR, HOMA‐B at baseline and at 8 wk |
Fasting plasma glucose (mmol/L) G1: 5.15 ± 0.39 G2: 4.91 ± 0.52 Fasting insulin (pmol/L) G1: 73.58 ± 59.50 G2: 80.69 ± 42.28 HOMA‐IR G1: 2.78 ± 2.25 G2: 3.00 ± 1.69 HOMA‐B G1: 2.78 ± 2.25 G2: 3.00 ± 1.69 |
Change from baseline (adjusted for baseline value, age and BMI) Fasting plasma glucose (mmol/L) G1: 0.05 ± 0.09 G2: −0.29 ± 0.09 p = 0.010 Fasting insulin (pmol/L) G1: 7.32 ± 9.73 G2: −28.09 ± 9.73 p = 0.012 HOMA‐IR G1: 0.38 ± 0.39 G2: −1.11 ± 0.39 p = 0.010 HOMA‐B G1: 3.06 ± 5.97 G2: −17.59 ± 5.97 p = 0.017 |
|
Karamali et al. (2015) Iran |
RCT G1, placebo: 28/28 G2, 200 μg Se/d: 28/28 Duration: 6 mo Aged 18–55 yr, with cervical intraepithelial neoplasia grade 1; no history of cervical cancer or other cancers of the lower genital tract; no history of hysterectomy or destructive therapy of the cervix; not pregnant. |
Sex: F Age (yr) G1: 38.3 ± 9.2 G2: 38.3 ± 9.1 BMI (kg/m 2 ) G1: 28.7 ± 3.9 G2: 28.6 ± 4.0 Ethnicity: NR Serum/plasma Se: NR Se intake: NR |
Selenised yeast (200 μg Se/d) vs placebo Adherence, pills count (%): > 90% |
Fasting plasma glucose, serum insulin, HOMA‐IR, HOMA‐B at baseline and 6 mo |
Fasting plasma glucose (mg/dL) G1: 89.4 ± 8.3 G2: 94.5 ± 12.1 Fasting insulin (μIU/mL) G1: 12.7 ± 4.4 G2: 13.9 ± 4.5 HOMA‐IR G1: 2.8 ± 1.0 G2: 3.3 ± 1.4 HOMA‐B G1: 48.1 ± 18.2 G2: 48.9 ± 14.0 |
Change from baseline (adjusted for baseline value, age and BMI) (mean ± SE) Fasting plasma glucose (mg/dL) G1: 0.3 ± 1.7 G2: −5.9 ± 1.7 p = 0.01 Fasting insulin (μIU/mL) G1: 1.9 ± 1.1 G2: −4.5 ± 1.1 p < 0.001 HOMA‐IR G1: 0.3 ± 0.2 G2: −1.2 ± 0.2 p < 0.001 HOMA‐B G1: 9.7 ± 4.9 G2: −14.7 ± 4.9 p = 0.001 |
|
Hosseinzadeh et al. (2016) Iran |
RCT G1, placebo: 30/27 G2, 200 μg Se/d: 30/26 Duration: 12 wk Aged 18–42 yr, with PCOS; non‐smokers; no congenital adrenal hyperplasia, Cushing's syndrome, androgen‐secreting tumours and hyperprolactinemia; no diabetes, hypo‐ or hyperthyroidism, renal dysfunction, liver disease or cardiovascular disease; no use of medications affecting metabolic and hormonal profile; no use of Se supplement in past 3 mo. |
Sex: F Age (yr, mean ± SE) G1: 28.90 ± 1.17 G2: 29.23 ± 0.96 BMI (kg/m 2 , mean ± SE) G1: 28.39 ± 0.72 G2: 27.4 ± 0.88 Ethnicity: NR Serum/plasma Se: NR Se intake (μg/d, mean ± SE) (6‐d 24‐h recall) G1: 36.4 ± 2.5 G2: 28.3 ± 3.1 |
Selenised yeast (200 μg Se/d) vs placebo Adherence, pills count (%): > 90% |
Fasting serum glucose, fasting insulin, HOMA‐IR at baseline and 12 wk |
Fasting serum glucose (mg/dL, mean ± SE) G1: 87.11 ± 1.90 G2: 87.34 ± 2.45 Fasting insulin (mU/L, mean ± SE) G1: 10.04 ± 1.07 G2: 7.81 ± 0.91 HOMA‐IR (mean ± SE) G1: 2.20 ± 0.26 G2: 1.74 ± 0.25 |
Change from baseline (adjusted for baseline value and BMI) Fasting serum glucose (mg/dL, mean ± SE) G1: 1.53 ± 2.11 G2: 5.38 ± 3.02 p = 0.14 Fasting insulin (mU/L, mean ± SE) G1: −1.5 ± 0.83 G2: 0.74 ± 0.99 p = 0.056 HOMA‐IR (mean ± SE) G1: −0.37 ± 0.20 G2: 0.30 ± 0.25 p = 0.017 |
|
Raygan et al. (2018) Iran |
RCT G1, placebo: 30/27 G2, 200 μg Se/d: 30/26 Duration: 12 wk Aged 45–85 yr; with CHF; no use of Se supplements within the past 3 mo; no acute myocardial infarction or cardiac surgery within the past 3 mo; no renal or hepatic failure |
Sex (% F): 69.81 Age (yr) G1: 68.5 ± 7.7 G2: 70.7 ± 10.3 BMI (kg/m 2 ) G1: 26.2 ± 4.3 G2: 25.7 ± 4.1 Ethnicity: NR Serum/plasma Se: NR Se intake (μg/d) (through 3‐d dietary records at week 1, 5, 9 and 12) G1: 56.3 ± 7.6 G2: 55.6 ± 10.1 |
Selenised yeast (200 μg Se/d) vs placebo Adherence, pills count (%): > 90% |
Fasting plasma glucose, fasting insulin, HOMA‐IR at baseline and 12 wk |
Fasting plasma glucose (mmol/L) G1: 6.85 ± 1.92 G2: 6.18 ± 1.55 Fasting insulin (pmol/L) G1: 69.88 ± 38.49 G2: 79.33 ± 58.94 HOMA‐IR G1: 3.66 ± 2.67 G2: 4.05 ± 3.92 |
Change from baseline (adjusted for baseline value, age and BMI) Fasting plasma glucose (mmol/L) G1: 0.07 ± 1.07 G2: −0.42 ± 1.01 p = 0.05 Fasting insulin (pmol/L) G1: 13.73 ± 23.63 G2: −18.41 ± 27.53 p < 0.001 HOMA‐IR G1: 0.55 ± 1.20 G2: −1.01 ± 1.61 p < 0.001 |
|
Tamtaji et al. (2019) Iran |
RCT G1, placebo: 30/26 G2, 200 Se μg/d: 30/26 Duration: 12 wk Aged 55–100 yr, with AD; no metabolic syndrome, diabetes, cardiovascular disease, chronic infections; no use of Se supplements |
Sex: M and F Age (yr) G1: 78.5 ± 8.0 G2: 78.8 ± 10.2 BMI (kg/m 2 ) G1: 21.5 ± 2.4 G2: 21.2 ± 1.2 Ethnicity: NR Serum/plasma Se: NR Se intake: NR |
Selenised yeast (200 μg Se/d) vs placebo Adherence (checklist filled by a trained staff who was responsible to give the patients their supplements every day): 100% |
Fasting plasma glucose, fasting insulin, HOMA‐IR at baseline and 12 wk |
Fasting plasma glucose (mg/dL) G1: 88.7 ± 9.8 G2: 86.3 ± 13.7 Fasting insulin (μIU/mL) G1: 11.4 ± 2.1 G2: 11.3 ± 2.2 HOMA‐IR G1: 2.5 ± 0.6 G2: 2.4 ± 0.5 |
Change from baseline Fasting plasma glucose (mg/dL) G1: 1.1 ± 10.8 G2: 1.5 ± 10.0 Fasting insulin (μIU/mL) G1: 0.7 ± 2.0 G2: −1.0 ± 1.3 HOMA‐IR G1: 0.1 ± 0.4 G2: −0.2 ± 0.3 |
AD: Alzheimer's disease; BMI: body mass index; CHF: congestive heart failure; d: day; F: females; Gx: group x; HOMA‐IR: Homeostatic model assessment of insulin resistance; HOMA‐B: Homeostatic model assessment of β‐cell function; HTN: hypertension; IUGR: intrauterine growth restriction; M: males; mo: month; NR: not reported; PCOS: polycystic ovary syndrome; PSA: prostate specific antigen; RCT: randomised controlled trial; SD: standard deviation; SE: standard error; Se: selenium; SeMet: selenomethionine; SY: selenised yeast; USA: United States of America; UTI: urinary tract infection; wk: week; yr: year.
(a) Duration = duration of the treatment phase, unless specified otherwise.
(b): Mean ± SD, unless specified otherwise.
b. Modified oral glucose tolerance test
| Reference Study Country | Design N randomised/completed Duration(a) Recruitment criteria | Subject characteristics at baseline(b) | Intervention(b) | Outcomes assessed | Results |
|---|---|---|---|---|---|
|
Jacobs et al. (2019) Sel/Cel (mOGTT sub‐study) USA |
RCT G1, placebo: 914/96* G2, 200 μg Se/day: 910/79* Duration (mean): 2.9 yr Aged 40–80 yr; ≥ 1 colorectal adenomas of diameter ≥ 3 mm; complete removal of all colorectal adenomas within the 6 mo before registration *All participants who remained on the trial near the end and accepted to take part in the mOGTT substudy |
Sex (% F): 33.1 Age (yr) G1: 60.9 ± 8.5 G2: 62.3 ± 8.9 BMI (kg/m 2 ) G1: 29.8 ± 5.4 G2: 28.5 ± 5.0 Ethnicity (white, %) G1: 95.8 G2: 98.7 Plasma Se (μg/L) G1: 139.7 ± 23.8 G2: 136.8 ± 22.8 Diabetes at baseline (yes, %) G1: 2.1 (N = 2) G2: 1.3 (N = 1) |
Selenised yeast (200 μg Se/d) vs placebo Adherence, pill count (%): > 95% in main trial (Thompson et al. 2016). |
mOGTT at end of trial; the test was commenced after an overnight fast with 75 g oral dose of glucose, followed by intravenous blood draws at 0, 10, 20, 30, 60, 90, 120 and 180 min. |
Glucose (mg/dL, mean ± SD [median (Q1, Q3)]) Fasting G1: 96.6 ± 14.6 [94.0 (87.0, 102.5)] G2: 92.3 ± 12.0 [91.0 (85.0, 101.0)] p = 0.04 at 120 min G1: 132.2 ± 49.8 [122.0 (95.0, 168.0)] G2: 129.4 ± 41.4 [119.0 (98.0, 161.0)] p = 0.70 |
BMI: body mass index; d: day; F: females; Gx: group x; mOGTT: modified oral glucose tolerance test; N: number; Qx: quartile x; RCT: randomised controlled trial; SD: standard deviation; Se: selenium; Sel/Cel: Selenium and Celecoxib trial; USA: United states of America; yr: year.
(a) Duration = duration of the treatment phase, unless specified otherwise.
(b): Mean ± SD, unless specified otherwise.
c. Glycated haemoglobin
|
Reference Study Country |
Design N randomised/completed Duration(a) Recruitment criteria |
Subject characteristics at baseline(b) | Intervention(b) | Outcomes assessed | Results(b) | |
|---|---|---|---|---|---|---|
|
Stranges et al. (2019) DK PRECISE Denmark |
RCT G1, placebo: 126/108*/99# G2, 100 μg Se/d: 124/113*/90# G3, 200 μg Se/d: 122/110*/86# G4, 300 μg Se/d: 119/104*/94# Duration: 5 yr SWOG performance‐status score ≤ 1; no active liver or kidney disease; no previous diagnosis of cancer (excluding NMSC); no diagnosed HIV infection; no immunosuppressive therapy; no use of Se supplements ≥ 50 μg/d in the previous 6 mo. *6‐mo HbA1c measurement available #2‐yr HbA1c measurement available |
Sex (% F): 48.1 Age (yr) G1: 65.4 ± 3.8 G2: 66.4 ± 4.2 G3: 66.3 ± 4.4 G4: 66.5 ± 4.1 BMI (kg/m 2 ) G1: 26.5 ± 4 G2: 27.1 ± 4 G3: 27.2 ± 4.3 G4: 26.5 ± 4 Ethnicity: NR Plasma Se (ng/g) G1: 86.0 ± 15.2 G2: 87.5 ± 16.4 G3: 88.3 ± 16.2 G4: 83.9 ± 17.1 Se intake: NR Diabetes at baseline (%): 1.2 |
Selenised yeast (100 or 200 or 300 μg Se/d) vs placebo Adherence NR Plasma Se (ng/g) at 6 mo G1: 85.3 ± 14.2 G2: 152.4 ± 23.7 G3: 209.1 ± 41.5 G4: 253.7 ± 54.1 |
HbA1c measured in red blood cells collected at baseline, 6 mo and 2 yr Number of incident cases of T2DM at 2 years based on use of diabetes medications (insulin or hypoglycaemic drugs)(c) |
HbA1c (mmol/mol) Baseline G1: 35.7 ± 5.7 G2: 37.4 ± 7.4 G3: 36.6 ± 7.9 G4: 36.7 ± 7.0 |
HbA1c (mmol/mol) 6 mo G1: 36.4 ± 5.2 G2: 37.1 ± 8.3 (p = 0.02) G3: 36.9 ± 7.3 (p = 0.32) G4: 36.5 ± 4.8 (p = 0.30) 2 yr G1: 34.0 ± 7.2 G2: 34.8 ± 7.2 (p = 0.35) G3: 34.9 ± 7.7 (p = 0.88) G4: 33.8 ± 7.8 (p = 0.80) The exclusion of visits after participants received diabetes medications did not materially alter the results at 2 years N incident cases of T2DM at 2 yr, after exclusion of prevalent cases at baseline (c) G1: 1 l G2: 5 l G3: 3 l G4: 0 |
BMI: body mass index; d: day; DK PRECISE: The Denmark PREvention of Cancer by Intervention with SElenium pilot trial; F: females; Gx: group x; HbA1c: glycated haemoglobin; mo: month; N: number; NMSC: non‐melanoma skin cancer; NR: not reported; RCT: randomised controlled trial; Se: selenium; SWOG: Southwest Oncology Group; T2DM: type 2 diabetes mellitus; USA: United states of America; yr: year.
(a) Duration = duration of the treatment phase, unless specified otherwise.
(b): Mean ± SD, unless specified otherwise.
(c): Data provided by the authors. The authors also provided data regarding the UK PRECISE trial: after exclusion of prevalent cases at baseline (identified based on self‐reported use of diabetes medications), the number of cases of T2DM at 6 months were 0/107, 0/117, 0/120 and 1/112 in the control group and the groups receiving 100, 200 and 300 ug Se/day, respectively.
D.9.3 Observational studies on incidence of T2DM
|
Study name Country Reference Follow‐up Study design Funding |
Original cohort (N total) Exclusion criteria Study population (n, sex and age at baseline(a)) |
Ascertainment of outcome |
Exposure groups(a) n/person‐years |
Incident cases | Model covariates | Results |
|---|---|---|---|---|---|---|
|
Hortega Study Spain Galan‐Chilet et al. (2017) 13.2 yr (median) Prospective cohort Public |
N = 1,502 Population sampled: adults in the catchment area of the Rio Hortega University Hospital Excluded: missing Se data, smoking or covariate variables; prevalent diabetes; loss to follow up. n = 1,234 Sex (% F): 51 Ethnicity: Caucasian Age (yr): 15–85 |
Incident cases of T2DM identified based on review of health records (including primary care, hospitalisation and mortality records) when: diagnosed with T2DM by a physician; using diabetes medications; with fasting plasma glucose > 126 mg/dl; or with HbA1c > 6.5% |
N per tertile of plasma Se (μg/L) T1 < 76.3: 431 T2 76.3–94.2: 376 T3 ≥ 94.2: 397 |
n, per tertile: T1: 19 T2: 30 T3: 26 |
Model 1: unadjusted Model 2: Age, gender and education Model 3: Age, gender, education, urine cotinine levels, smoking status and alcohol intake |
HR (95% CI) for T2DM Model 1 T1: 1 T2: 1.78 (0.98, 3.26) T3: 1.78 (0.97, 3.28) p lineal: 0.16 Model 2 T1: 1 T2: 1.83 (1.00, 3.35) T3: 1.86 (1.01, 3.41) p lineal: 0.13 Model 3 T1: 1 T2: 1.76 (0.96, 3.22) T3: 1.80 (0.98, 3.31) p lineal: 0.15 |
|
ULSAM Sweden Gao et al. (2014) 10–27 yr Prospective cohort Mixed |
N = 2,322 Population sampled: general male population, aged 50 yr Excluded: missing Se, smoking or covariate variables; prevalent diabetes; loss to follow up. n = 1,925 (n = 1,539 at 60 yr; n = 1,024 at 70 yr; n = 656 at 77 yr) Sex: M Ethnicity: Caucasian Age (yr): 49.1–50.2 |
Incident cases of T2DM defined as elevated fasting glucose levels and/or use of anti‐diabetic medicine at follow up visits. Elevated glucose levels defined as FPG ≥ 6.1 mmol/l at 60 yr and FPG ≥ 7.0 mmol/l at 70 yr and 77 yr |
N per tertile of plasma Se (μg/L), at baseline/60 yr/70 yr/77 yr T1 61.4 ± 6.8: 670/516/326/206 T2 75.1 ± 3.1: 620/504/347/216 T3 91.1 ± 10.2: 635/519/351/234 |
n, per tertile at 60 yr/70 yr/77 yr T1: 15/24/27 T2: 15/33/34 T3: 23/31/30 |
Age at baseline, BMI, cigarette smoking, leisure time physical activity and education level |
OR (95% CI) for T2DM At 60 yr T1: 1 T2: 0.91 (0.43, 1.95) T3: 1.28 (0.64, 2.61) p for trend : 0.437 At 70 yr T1: 1 T2: 1.31 (0.73, 2.36) T3: 1.25 (0.68, 2.27) p trend : 0.497 At 77 yr T1: 1 T2: 1.16 (0.65, 2.08) T3: 0.97 (0.54, 1.75) p trend : 0.880 |
|
NHS & HPFS USA Park et al. (2012) NHS 26 yr HPFS 22 yr Prospective cohort Public |
NHS N = 121,700 HPFS N = 51,529 Population sampled: registered nurses (NHS) and male health professionals (HPFS) Excluded: no toenail Se data; missing covariate information; free of prevalent T2DM or heart disease at baseline (defined as date of toenail sampling) NHS n = 3,630 HPFS n = 3,535 NHS Sex: F HPFS Sex: M Ethnicity: Majority Caucasian Age (yr): NHS: 30–55 HPFS: 40–75 |
Self‐reported incident cases of T2DM identified via biennial questionnaires; confirmed by a validated supplementary questionnaire. Cases before 1998 defined by National Diabetes Data Group criteria(b) and cases after 1998 defined by American Diabetes Association criteria (1997). |
N per quintile of toenail Se (μg/g) NHS Q1 0.62 ± 0.04: 730 Q2 0.70 ± 0.02: 727 Q3 0.75 ± 0.02: 729 Q4 0.82 ± 0.02: 714 Q5 0.96 ± 0.10: 730 HPFS Q1 0.66 ± 0.05: 699 Q2: 0.76 ± 0.02: 700 Q3: 0.82 ± 0.02: 726 Q4: 0.90 ± 0.03: 706 Q5: 1.07 ± 0.12: 704 |
780 (NHS & HPFS) N cases per quintile NR |
Model 1: age, sex, future case–control status. Model 2: Model 1 + geographic region, smoking, alcohol intake, physical activity, BMI, Se supplement use, and multivitamin use. Model 3: Model 2 + consumption of total energy, the ratio of polyunsaturated to saturated fats, trans fat, whole grains, and coffee. |
HR (95% CI) for T2DM NHS Model 1 Q1: 1 Q2: 0.88 (0.65, 1.18) Q3: 0.92 (0.69, 1.23) Q4: 0.85 (0.63, 1.14) Q5: 0.96 (0.72, 1.28) p trend : 0.8 Model 2 Q1: 1 Q2: 0.82 (0.61, 1.11) Q3: 0.81 (0.60, 1.09) Q4: 0.70 (0.51, 0.95) Q5: 0.80 (0.59, 1.07) p trend : 0.1 HPFS Model 1 Q1: 1 Q2: 1.07 (0.78, 1.48) Q3: 0.78 (0.52, 1.06) Q4: 0.74 (0.54, 1.13) Q5: 0.70 (0.49, 1.00) p trend : 0.01 Model 2 Q1: 1 Q2: 1.08 (0.78, 1.50) Q3: 0.78 (0.54, 1.13) Q4: 0.78 (0.54, 1.13) Q5: 0.75 (0.51, 1.10) p trend : 0.047 Results for Model 3 were similar |
|
ORDET Italy Stranges et al. (2010) 16 y (median) Prospective cohort Mixed |
N = 10,786 Population sampled: general population Excluded: T2DM at baseline; missing data; ratio of total energy intake to basal metabolic rate at either extreme of the distribution (cut‐offs 0.5 and 99.5 percentiles); death during follow‐up from causes other than T2DM; loss to follow‐up. n = 7,182 Sex: F Ethnicity: Caucasian Age (yr): 34–70 |
Incident cases self‐reported via telephone interviews (diagnosis of T2DM from a physician or taking medications for treatment of diabetes) or identified via prescription for insulin or oral hypoglycaemic medication (by linkage with regional prescription drug database) or identified via hospital discharge record (by linkage with medical discharge records) |
N per quintile of Se intake* (by SFFQ) (μg/day, mean) Q1 41.7: 1,437 Q2 50.2: 1,436 Q3 55.7: 1,437 Q4 62.0: 1,436 Q5 75.1: 1,436 *Adjusted for total energy intake |
n, per quintile Q1: 32 Q2: 42 Q3: 45 Q4: 55 Q5: 79 |
Model 1: age, education, menopausal status Model 2: age, education, menopausal status, BMI, smoking, alcohol intake, energy intake, saturated/polyunsaturated fatty acids ratio, animal proteins, total carbohydrates, and weight change between baseline and follow‐up examinations |
OR (95% CI) for T2DM Model 1 Q1: 1 Q2: 1.31 (0.82, 2.09) Q3: 1.38 (0.87, 2.19) Q4: 1.74 (1.12, 2.72) Q5: 2.64 (1.73, 4.01) p trend : < 0.001 Model 2 Q1: 1 Q2: 1.42 (0.87, 2.34) Q3: 1.43 (0.86, 2.38) Q4: 1.65 (0.98, 2.78) Q5: 2.39 (1.32, 4.32) p trend : 0.005 OR (95% CI), per 10 μg/day increase in Se Model 1: 1.29 (1.17, 1.41) Model 2: 1.29 (1.10, 1.52) The linearity of the relationship between selenium intake and risk of diabetes confirmed in spline regression models (not shown) |
|
ORDET Italy Vinceti et al. (2015b) 16 y (median) Nested case–control Mixed |
N = 10,786 Population sampled: general population Excluded: history of cancer, bilateral ovariectomy, chronic or acute liver disease or who had received hormone therapy in the 3 mo before recruitment; baseline T2DM; loss to follow up; death during follow‐up from causes other than T2DM n = 621 cases: 226 controls: 395 (matched for age) Sex: F Ethnicity: Caucasian Age (yr): 35–70 |
Incident cases self‐reported via telephone interviews (diagnosis of T2DM from a physician or taking medications for treatment of diabetes) or identified via prescription for insulin or oral hypoglycemic maedication (by linkage with regional prescription drug database) or identified via hospital discharge record (by linkage with medical discharge records). |
N per category of toenail Se (μg/g) Q1 < 0.54: 190 Q2 ≥ 0.54–< 0.59: 150 Q3 ≥ 0.59–< 0.66: 147 Q4 ≥ 0.66: 134 |
n, per category Q1: 83 Q2: 58 Q3: 47 Q4: 38 |
Model 1: BMI Model 2: BMI, education, smoking, coffee and alcohol consumption |
OR (95% CI) for T2DM Model 1 Q1: 1 Q2: 1.04 (0.59, 1.84) Q3: 0.67 (0.36, 1.24) Q4: 1.08 (0.45, 2.58) p trend : 0.275 Model 2 Q1: 1 Q2: 1.09 (0.61, 1.96) Q3: 0.71 (0.38, 1.34) Q4: 1.14 (0.46, 2.80) p trend : 0.362 |
|
Moli‐sani cohort Italy Vinceti et al. (2021) 8.2 yr (median) Prospective cohort Mixed |
N = 24,325 Population sampled: general population Excluded: previous diagnosis of T2DM and/or treated with hypoglycaemic drugs; missing data; implausible energy intakes (4,000 kcal/day in men and > 3,500 kcal/day in women); unreliable dietary or medical questionnaires; lost to follow‐up n = 21,335 Sex (% F): 53 Ethnicity: Caucasian Age (yr): ≥35 |
Hospitalisation for T2DM, ascertained through direct linkage with the regional hospital discharge registry |
Intake Se estimate (by SFFQ) (μg/day, median (SD)) F/M Q1: 38.8 (6.5)/43.6 (6.6) Q2: 51.2 (3.0)/55.9 (3.0) Q3: 61.7 (3.5)/67.1 (3.7) Q4: 78.6 (13.8)/87.8 (14.5) n/person‐years, sex combined: Q1: 5,333/42,481 Q2: 5,332/43,359 Q3: 5,334/43,757 Q4: 5,336/44,826 |
n, per quartile Q1: 33 Q2: 29 Q3: 30 Q4: 43 |
Model 1: age and sex Model 2: Age, sex, and energy intake. Model 3: Model 2 + education, housing, place of residence, smoking status, and physical activity. Model 4: Model 3+ Mediterranean diet score Model 5: Model 4 + BMI |
HR (95% CI) for T2DM Model 1 Q1: 1 Q2: 0.94 (0.57, 1.55) Q3: 0.99 (0.60, 1.63) Q4: 1.44 (0.91, 2.29) Model 2 Q1: 1 Q2: 1.06 (0.63, 1.77) Q3: 1.21 (0.71, 2.08) Q4: 1.96 (1.12, 3.44) Model 3 Q1: 1 Q2: 1.07 (0.64, 1.79) Q3: 1.23 (0.71, 2.10) Q4: 1.99 (1.14, 3.49) Model 4 Q1: 1 Q2: 1.05 (0.63, 1.77) Q3: 1.20 (0.69, 2.07) Q4: 1.92 (1.09, 3.40) Model 5 Q1: 1 Q2: 1.01 (0.60, 1.70) Q3: 1.13 (0.66, 1.96) Q4: 1.75 (0.99, 3.10) |
|
DFTJ cohort China Yuan et al. (2018) 4.6 yr Nested case–control Private |
N = 27,009 Population sampled: retired employees of the Dongfeng Motor Corporation Excluded: baseline cardiovascular disease or cancer; insufficient blood samples; diabetes at baseline n = 2,078 Cases: 1,039 Controls: 1,039 (matched by age) Sex (% F): 55 Ethnicity: Asian Age (yr, mean): 63 |
Incident T2DM identified if FPG ≥ 7.0 mmoL/L; or haemoglobin A1c (HbA1c) ≥ 6.5%; or self‐reported physician diagnosis of diabetes or use of anti‐diabetic medication during the follow‐up visits |
N per category of plasma Se (μg/L) Q1 < 54.10: 470 Q2: 54.10–61.71: 488 Q3: 61.71–72.16: 587 Q4: > 72.16: 533 |
n, per category Q1: 210 Q2: 229 Q3: 326 Q4: 274 |
BMI, smoking status, drinking status, education, physical activity, hypertension, hyperlipidemia, family history of diabetes, and eGFR For subgroups analyses: age, sex, BMI, smoking status, alcohol intake status, education, physical activity, hypertension, hyperlipidemia, family history of diabetes, and eGFR |
OR (95% CI) for T2DM Q1: 1 Q2: 1.08 (0.80, 1.46) Q3: 1.45 (1.09, 1.93) Q4: 1.27 (0.93, 1.74) p trend : 0.05 < 65 yr Q1: 1 Q2: 1.06 (0.74, 1.53) Q3: 2.00 (1.42, 2.83) Q4: 1.36 (0.95, 1.94) p trend : 0.02 ≥ 65 yr Q1: 1 Q2: 1.15 (0.73, 1.80) Q3: 1.40 (0.90, 2.18) Q4: 1.44 (0.92, 2.24) p trend : 0.08 Males Q1: 1 Q2: 1.03 (0.69, 1.55) Q3: 1.34 (0.90, 2.00) Q4: 1.39 (0.93, 2.07) p for trend : 0.06 Females Q1: 1 Q2: 1.14 (0.77, 1.68) Q3: 1.64 (1.13, 2.39) Q4: 1.52 (1.03, 2.23) p trend : 0.02 |
|
EPIC – Potsdam Study Germany Cabral et al. (2021) 6.6 yr Nested‐case cohort Public |
N = 27,548 Population sampled: general population, aged 35–64 yr Excluded: insufficient/no serum; unclear disease status; prevalent T2DM, cancer, myocardial infarction or stroke at baseline; incomplete follow‐up information n = 2,741 Cases: 705 Random sub‐cohort: 2,090 (overlap: 54) Sex (% F): 62.55 Ethnicity: Caucasian Age (yr, median): 49 |
Self‐reported incident cases (diabetes diagnosis, diabetes‐relevant medication, or dietary treatment due to diabetes) every 2 years; confirmed by questionnaires to the diagnosing physician |
Serum Se (μg/L, median (IQR)) 80.0 (19.1) |
705 cases |
Model 1: age, sex, educational attainment, BMI, WC, smoking status, physical activity, alcohol intake, vitamin and mineral preparations, hypertension, lipid‐lowering medication, and Mediterranean diet score. Model 2: model 1 + serum trace elements Manganese, Iron, Copper, Zinc, and Iodine |
HR (95%) for T2DM, per SD increase in serum Se Model 1: 1.26 (1.12, 1.41) Model 2: 1.19 (1.06, 1.34) |
|
CSPPT Zhang et al. (2019) China 4.5 yr Prospective Cohort (sub‐sample of a trial) Public |
N = 20,702 Population sampled: Hypertensive patients, aged 45–75 yr Excluded: history of CVD; diabetic at baseline n = 2,367 (sub‐sample from CSPPT trial) Sex (% F): 53 Ethnicity: Asian Age (yr): 61.4 ± 7.6 |
Physician‐diagnosed diabetes or use of glucose‐lowering drugs, or new onset (FPG ≥ 126.0 mg/dL) at the exit visit. |
Plasma Se (μg/L) 84.8 (21.1) n per quartile of plasma Se Q1 < 71.0: 592 Q2 71.0–< 82.3: 591 Q3 82.3‐< 94.8: 592 Q4 ≥ 94.8: 592 |
n cases, per quartile Q1 (Ref): 63 Q2: 63 Q3: 58 Q4: 86 |
Model 1: Unadjusted Model 2: age, sex, study center, study treatment group, BMI, MTHFR C677 T genotype, smoking, alcohol drinking, family history of diabetes, SBP, fasting glucose, total cholesterol, HDL, triglycerides, creatinine, folate at baseline, and time‐averaged SBP during treatment period. |
OR (95% CI) for T2DM Model 1 Q1 (Ref): 1 Q2: 1.00 (0.69, 1.45), p = 0.992 Q3: 0.91 (0.63, 1.33), p = 0.632 Q4: 1.43 (1.01, 2.02), p = 0.045 Model 2 Q1 (Ref): 1 Q2: 0.99 (0.67, 1.47), p = 0.968 Q3: 0.87 (0.59, 1.30), i = 0.509 Q4: 1.29 (0.89, 1.89), p = 0.184 |
|
Jinchang Cheng et al. (2022) China 5.8 yr Nested case–control Public |
N = 48,001 Population sampled: employees of the Jinchuan Nonferrous Metals Corporation Excluded: diabetes and pre‐diabetes patients at baseline n = 1,244 Cases: 622 Controls: 622 (matched according to age, sex and follow‐up time) Sex (% F) = 26 Ethnicity = Asian Age (yr): 47.2 ± 13.9 |
Self‐reported T2DM, or FPG > 7.0 mmol/L, or glucose tolerance test > 11.0 mmol/L, or with explicit inpatient medical history, or diabetes pharmacotherapy history at any follow up biannual examination |
n per quartile of Serum Se (μg/L) Q1 < 85.45: 278 Q2 85.45–92.51: 282 Q3 92.52–103.43: 331 Q4 ≥ 103.44: 353 |
n cases, per quartile Q1 (Ref.): 123 Q2: 126 Q3: 176 Q4: 197 |
Model 1: unadjusted Model 2: age at diagnosis, family history of diabetes, physical exercise, smoking index, lifetime total alcohol intake, triglyceride, high‐density lipoprotein, low‐density lipoprotein, and hypertension status. Model 3: Model 2 + y serum Nickel, Cobalt, Copper, Zinc, Cadmium, Mercury, Chromium, Arsenic, and Magnesium |
OR (95% CI) for T2DM Model 1 Q1 (Ref): 1 Q2: 1.05 (0.75, 1.47) Q3: 1.42 (1.03, 1.96) Q4: 1.70 (1.01, 2.02) ptrend = < 0.01 Model 2 Q1 (Ref): 1 Q2: 1.26 (0.86, 1.85) Q3: 1.62 (1.17, 2.35) Q4: 1.79 (1.21, 2.64) ptrend = 0.12 Model 3 Q1 (Ref): 1 Q2: 1.29 (0.82, 2.03) Q3: 1.62 (1.05, 2.51) Q4: 1.64 (1.02, 2.65) p trend = 0.20 |
BMI: body mass index; CI: confidence interval; CSPPT: China Stroke Primary Prevention Trial; CVD: cardiovascular disease; DFTJ: Dongfeng‐Tongji cohort; eGFR: estimated glomerular filtration rate; EPIC: European Prospective Investigation into Cancer and Nutrition; F: females; FFQ: Food Frequency Questionnaire; FPG: fasting blood glucose; HbA1c: glycated haemoglobin; HDL: high‐density lipoprotein; HPFS: Health Professional Study; HR: hazard ratio; ICP‐MS: Inductively coupled plasma mass spectrometry; IQR: interquartile range; M: males; MTHFR: Methylenetetrahydrofolate reductase; NHS: Nurses' Health study; OR: odds ratio; ORDET: HORmones and Diet in the ETioliogy of Breast Cancer study; Qx, quartile/quintile; SBP: systolic blood pressure; SD: standard deviation; Se: selenium; SFFQ: semi‐0quantitative food frequency questionnaire; T2DM: type 2 diabetes mellitus; ULSAM: The Uppsala Longitudinal Study of Adult Men; yr: year.
(a) Mean ± SD (range), unless specified otherwise.
(b): National Diabetes Data Group. Classification and diagnosis of diabetes mellitus and other categories of glucose intolerance. Diabetes 1979;28:1039–57.
D.9.4. Observational studies on measures of blood glucose tolerance
Fasting glucose
|
Study name Country Reference Follow‐up Study design Funding |
Original cohort (N total) Exclusion criteria Study population (n, sex and age at baseline(a)) |
Outcome assessed |
Exposure groups(a) n |
Model covariates | Results |
|---|---|---|---|---|---|
|
Japan Oo et al. (2018) 4 yr Prospective cohort Public |
N = 76 Population sampled: general population going to Ishikawa Matto Central Hospital for a complete physical examination Excluded: having T2DM, pregnant n = 76 Sex (% F): 45 Ethnicity: Asian Age (yr): 51.9 ± 10.5 |
Fasting plasma glucose at 4 yr follow up visit |
Plasma selenoprotein P (μg/mL) 2.51 (0.52) |
age, Insulinogenic index, BMI, HbA1c |
β‐coefficient 0.237 p = 0.033 |
BMI: body mass index; F: females; HbA1c: glycated haemoglobin: yr, year.
(a) Mean ± SD (range), unless specified otherwise.
-
B.
Glycated haemoglobin
|
Study name Country Reference Follow‐up Study design Funding |
Original cohort (N total) Exclusion criteria Study population (n, sex and age at baseline(a)) |
Outcome assessed |
Exposure groups(a) n |
Model covariates | Results |
|---|---|---|---|---|---|
|
PROGRESS Mexico Kupsco et al. (2019) 4–6 yr Prospective cohort Public |
N = 609 mother–child pairs Population sampled: pregnant women (recruited before 20 wk gestation) and their child Excluded: < 18 yr old, heart or kidney disease, no telephone, use steroids or anti‐epilepsy drugs, and consume alcohol on a daily basis; not attending 4–6 yr follow up visit n = 466 mother–child pairs Sex (% F): 49 Ethnicity: Hispanic Mothers' age (yr): 28 ± 5.6 (18–44) |
Children fasting blood sampled at 4–6 yr visit (4.8 ± 0.55) and HbA1c analysed |
Maternal blood Se at 2nd trimester (μg/dL) 25 ± 4.5 (12.4, 65.2) |
birth weight, gestational age, maternal age, pre‐pregnancy BMI, education, socioeconomic status, parity, environmental tobacco smoke, date of the follow‐up visit |
HbA1c, β‐coefficient (95% CI) −0.17, (−0.68, 0.34); p = 0.51 |
|
MONICA S3/KORA F3 Germany Schwab et al. (2015) 10 yr Prospective cohort Public |
N = 3,006 Population sampled: general population resident in Augsburg, aged 25–74 yr Excluded: diabetic individuals at baseline n = 2,774 Sex (% F): 52 Ethnicity: Caucasian Age (yr): 25–74 |
Fasting blood sampled at baseline and 10‐yr follow up visit and HbA1c analysed |
Se‐supplement intake assessed through personal interview (μg/d) No intake: ref T1: < 50 T2: 50 to < 75 T3: ≥ 75 |
Model 1: sex and age Model 2: Model 1+ BMI, waist–hip ratio, physical activity, smoking, alcohol intake, healthy diet, total/HDL cholesterol, hypertension, diabetes of the father, diabetes of the mother, intake of HbA1c increasing medication. |
β‐coefficient (95% CI), difference in change in HbA1c compared with the reference group “no intake” Model 1 T1: 0.02 (−0.19, 0.23) T2: −0.02 (−0.33, 0.30) T3: 0.09 (−0.18, 0.37) Model 2 T1: −0.03 (−0.20, 0.15) T2: −0.06 (−0.36, 0.25) T3: 0.09 (−0.21, 0.39) |
CI: confidence interval; F: females; HbA1c: glycated haemoglobin; KORA: Cooperative Health Research in the Region of Augsburg F3 survey; MONICA: Monitoring of Trends and Determinants in Cardiovascular Diseases S3 survey; PROGRESS: Programming Research in Obesity, Growth Environment and Social Stress birth study; Tx: tertile x; yr: year.
(a) Mean ± SD (range), unless specified otherwise.
D.10. All‐cause mortality
D.10.1 Intervention studies on all‐cause mortality
|
Reference Study Country |
Design N randomised/completed Duration(a) Recruitment criteria |
Subject characteristics at baseline(b) | Intervention(b) | Outcomes assessed | Results |
|---|---|---|---|---|---|
|
Rayman et al. (2018) DK PRECISE Denmark |
RCT G1, placebo: 126 G2, 100 Se μg/d: 124 G3, 200 Se μg/d: 122 G4, 300 Se μg/d: 119 Duration: 5 yr (+ follow‐up for another 11 yr) Aged 60–74 yr; taking > 80% pills in the run‐in phase; SWOG performance‐status score ≤ 1; no active liver or kidney disease; no previous diagnosis of cancer (excluding NMSC); no diagnosed HIV infection; no immunosuppressive therapy; no use of Se supplements ≥ 50 μg/d in the previous 6 mo. |
Sex (% F): 48.1 Age (yr): 66.1 ± 4.1 Ethnicity: Caucasians Plasma Se (ng/g, median (IQR)) G1: 86 (15.2) G2: 87.5 (16.4) G3: 88.3 (16.2) G4: 83.9 (17.1) Se intake: NR |
Se‐enriched yeast (100 Se μg/d, 200 Se μg/d or 300 Se μg/d) vs placebo Adherence: NR Serum selenium at 5 yr, μg/L (median (IQR)) (from Winther et al., 2015) G1: 85 (16) G2: 157 (33) G3: 217 (46) G4: 271 (106) |
Vital status and date of death obtained from the Danish Civil Registration System |
N deaths; cumulative mortality (%) (95% CI); HR (95% CI) At end of 5‐yr intervention period G1: 8; 5.7 (3.0, 10.7); 1 (ref) G2: 6; 3.8 (1.7, 8.3); 0.75 (0.26, 2.16) G3: 5; 3.5 (1.5, 8.0); 0.64 (0.21, 1.94) G4: 12; 10.1 (6.2, 16.3); 1.62 (0.66, 3.96) After 16 yr (including 11 yr of follow up) G1: 35; 26.2 (19.6, 34.6); 1 (ref) G2: 41; 26.5 (20.1, 34.4); 1.15 (0.73, 1.80) G3: 35; 24.8 (18.4, 32.9); 0.99 (0.62, 1.59) G4: 47; 37.6 (29.8, 46.7); 1.59 (1.02, 2.46) |
|
Lippman et al. (2009) Klein et al. (2011) SELECT USA, Canada, Puerto Rico |
RCT G1, placebo: 8,696 G2, 200 μg Se/d: 8,752 Duration (median (min‐max)): 5.46 (4.17–7.33) yr (+ additional 3 yr of follow up) Aged ≥ 50 yr (African American men) or 55 yr or older (all other men); serum PSA ≤4 ng/mL; DRE not suspicious for prostate cancer |
Sex: M Age (yr, median (IQR)) G1: 63 (58–67) G2: 63 (58–68) Ethnicity (Caucasian, %): 79 Plasma Se (μg/L, median (IQR)) G1: 137.6 (124.7–151.8) G2: 135.0 (123.4–145.9) Se intake: NR |
L‐selenomethionine (200 μg Se/d) vs placebo Adherence, pill counts (%) G1: 85% at yr 1; 69% at yr 5 G2: 84% at yr 1; 69% at yr 5 Serum Se at 4 yr, μg/L (median (IQR)) G1: 140.1 (124.3–150.8) G2: 251.6 (218.7–275.0) |
Death ascertained through a search in Social Security Death Index for participants who had a last contact date ≥ 18 mo before the search. |
N deaths; HR (99% CI) End of intervention period G1: 382 l G2: 378; 0.99 (0.82, 1.19) After follow up period (including 3 yr of follow up) G1: 564 l G2: 551; 0.98 (0.84, 1.14) |
|
Marshall et al. (2011) USA |
RCT G1, placebo: 211 G2, 200 μg Se/d: 212 Duration: 3 yr Aged ≥ 40 yr; biopsy‐ confirmed diagnosis of High‐grade prostatic intraepithelial neoplasia with no evidence of cancer; PSA < 10 ng/mL; AUA symptom score < 20; ambulatory and able to carry out work of a light or sedentary nature. |
Sex: M Age (yr): ≥ 40 BMI < 25¦> 30 kg/m 2 (%) G1: 26.1¦27.5 G2: 21.7¦26.4 Ethnicity (White, %) G1: 76.8 G2: 83.5 Plasma Se, μg/L (median (IQR)) G1 (n = 51): 135.2 (113.3, 166.8) G2 (n = 46): 138.1 (104.7, 166.4) Se intake NR |
Selenomethionine (200 μg Se/d) vs placebo Adherence, pills count (%), at 1 yr; 3 yr G1: 90.8; 81.3 G2: 90.5; 78.9 Plasma Se (median, μg/L), at 1 yr; 3 yr G1 (n = 51): 145.7; 152.1 G2 (n = 46): 240.4; 261.2 |
Mortality; ascertainment method NR |
N deaths G1: 6 l G2: 4 |
|
Algotar et al. (2013b) NBT USA and New Zealand |
RCT G1, placebo: 232/0 G2, 200 μg Se/d: 234/0 G2, 400 μg Se/d: 233/0 Duration (median): 35 mo High risk of prostate cancer, as evidenced by prostate specific antigen (PSA) > 4 ng/mL and/or suspicious digital rectal examination and/or PSA velocity (rate of PSA change over time) > 0.75 ng/mL per year; undergone a prostate biopsy negative for cancer within 12 mo of enrolment. |
Sex: M Age (yr) G1: 65.5 ± 7.4 G2: 65.2 ± 8.0 G3: 65.5 ± 7.7 Ethnicity (Caucasians, %) G1: 84.2 G2: 83.7 G3: 82.6 Plasma Se (μg/L) G1: 124.5 ± 24.7 G2: 126.6 ± 26.9 G3: 127.2 ± 24.8 Se intake: NR |
Selenised yeast (200 μg Se/d or 400 μg Se/d or) vs placebo Adherence, pill counts (%) G1: 92.1 G2: 93.2 G3: 91.2 |
Mortality; ascertainment method NR |
N deaths G1: 5 l G2: 3 l G3: 2; p = 0.45 |
|
Clark et al. (1996) NPC USA |
RCT G1, placebo: 659 G2, 200 μg Se/d: 653 Duration (mean, max): 4.5 yr, 10.3 yr Confirmed histories of NMSC within the year before randomisation; estimated 5‐yr life‐expectancy; no cancer within the previous 5 yr. |
Sex (% F): G1: 24.4 G2: 26.2 Age (yr) G1: 63.0 ± 10.0 G2: 63.4 ± 10.2 Ethnicity: NR Plasma Se (μg/L) G1: 114.0 ± 21.2 G2: 114.4 ± 22.5 Se intake: NR |
Selenised yeast (200 μg Se/d) vs placebo Adherence (% self‐reporting missing taking a pill less than twice a month): 82 Increase in plasma Se at 9‐mo G1: no change G2: +67% |
Death ascertainment via medical records from death certificates. National Death Index searched each year for patients for whom vital status could not be ascertained. |
N deaths; HR (95% CI) (adjusted for age, sex and smoking status) G1: 129 l G2: 108; G2: 0.79 (0.61, 1.02) |
AUA: American Urological Association; BMI: body mass index; CI: confidence interval; d: day; DK: Denmark; DRE: digital rectal examination; F: females; Gx: group x; HIV: human immunodeficiency virus; HR: hazard ratio; IQR: interquartile range; M: males; mo: month; NBT: Negative Biopsy Trial; NMSC: non‐melanoma skin cancer; NPC: Nutritional Prevention of Cancer Trial; NR: not reported; PRECISE: PREvention of Cancer by Intervention with Selenium; PSA: prostate specific antigen; RCT: randomised controlled trial; Se: selenium; SELECT: Selenium and Vitamin E Cancer Prevention Trial; SWOG: Southwest Oncology Group; USA: United States of America; yr: year.
(a) Duration = duration of the treatment phase, unless specified otherwise.
(b): Mean ± SD, unless specified otherwise.
D.10.2. Observational studies on selenium intake and incidence of all‐cause mortality
|
Study name Country Reference Follow‐up Study design Funding |
Original Cohort (N total) Exclusion criteria Study population (n, sex and age at baseline(a)) |
Ascertainment of outcome |
Exposure groups(a) n/person‐years |
N deaths | Model covariates | Results |
|---|---|---|---|---|---|---|
|
MPP Sweden Schomburg et al. (2019) 9.3 yr (median) Prospective cohort Mixed |
N = 33,346 Population sampled: General population Excluded: CVD event prior to baseline n = 4,366 Sex (% F): 31 Ethnicity: Caucasian Age (yr): 70 |
Death ascertained through record linkage with the Swedish Hospital Discharge Register, the Swedish Cause of Death Register, the Stroke in Malmö Register, and the Swedish Coronary Angiography and Angioplasty Registry. |
N per quintile of plasma Sepp1 (mg/L, median (range)) Q1 3.7 (0.4–4.3): 873 Q2: 4.7 (4.3–5.1): 873 Q3: 5.5 (5.1–5.9): 874 Q4: 6.3 (5.9–6.9): 873 Q5: 7.7 (6.9–20): 873 |
N, per quintile Q1(ref): 314 Q2: 214 Q3: 193 Q4: 175 Q5: 215 |
Age, gender, current smoking, systolic blood pressure, use of antihypertensive medication, diabetes mellitus, LDL‐cholesterol, HDL‐cholesterol, and body mass index |
HR (95% CI) Q1(ref): 1 Q2: 0.73 (0.61, 0.87) Q3: 0.66 (0.55, 0.79) Q4: 0.57 (0.48, 0.69) Q5: 0.69 (0.58, 0.82) |
|
ilSIRENTE Italy Giovannini et al. (2018) 10 yr Prospective cohort Public |
N = 364 Population sampled: General population Excluded: insufficient blood sample n = 347 Sex (% F): 67 Ethnicity: Caucasian Age (yr): 85 |
Survival status was obtained from general practitioners and confirmed by the National Death Registry. |
N above/below median serum Se (μg/L) Low Se ≤ 105.3: 175 High Se > 105.3: 172 |
N, per group Low Se: 135 High Se: 113 |
Model 1: crude Model 2: age, gender, IADL scale score, BMI, Cancer Model 3: age, gender, IADL scale score, BMI, Cancer, HDL‐cholesterol, IL‐6, CRP |
HR (95% CI), high Se vs low Se Model 1: 0.66 (0.51, 0.85) Model 2: 0.69 (0.53, 0.89) Model 3: 0.71 (0.54, 0.92) |
|
Rivalta + Reggio Emilia Italy Vinceti et al. (2016a) 27 yr Prospective cohort Mixed |
N = 97,780 Population sampled: subjects continuously residing in Rivalta from 1974 to 1985, exposed to high‐Se‐contaminated tap water (n = 2,065) and unexposed municipal population as controls (n = 95,715) n = 97,780 Sex (% F): Exposed: 51 Unexposed: 53 Ethnicity: Caucasian Age (yr): 5–95+ |
Death ascertained using Reggio Emilia mortality register |
person‐years, per group of Se in tap water (inorganic Se) (μg/L) Exposed 8–10: 46,268 Unexposed < 1: 2,067,862 |
N, per group Exposed: 663 Unexposed: 34,598 |
age and calendar year |
HR (95% CI), exposed vs unexposed 0.99 (0.91, 1.05) |
|
SWHS/SMHS China Sun et al. (2016) 13.9 yr (F)/8.37 y r (M) (mean) Prospective cohort Public |
N = 136,421 Population Sampled: General population, without history of cancer, resident in Shanghai Excluded: immediately lost to follow‐up after study enrolment, missing data, extreme energy intake n = 133,957 (F 73,854/M 60,103) Ethnicity: Asian Age (yr): 40–70 |
Annual record linkage with the Shanghai Vital Statistics Registry. All possible matches identified through the linkage were verified by home visits |
Energy‐adjusted quintile of Se intake (b) (μg/1,000 kcal per d, median) assessed through SFFQ F/M Q1 16: 14,771/12,021 Q2 21: 14,771/12,022 Q3 25: 14,769/12,022 Q4 30: 14,771/12,016 Q5 42: 14,772/12,022 |
N, per quintile F/M Q1(ref): 1,863/1,136 Q2: 1,285/885 Q3: 1,033/819 Q4: 892/745 Q5: 676/632 |
age, birth cohort, education, income, marital status, occupation, BMI, physical activity, total energy intake, dietary fat intake, supplement use, smoking status, drinking status, history of hypertension, diabetes, CHD or stroke and family history of cancer |
HR (95% CI) Females Q1(ref): 1 Q2: 0.96 (0.89, 1.03) Q3: 0.92 (0.84, 1.00) Q4: 0.90 (0.82, 0.99) Q5: 0.79 (0.71, 0.88) Males Q1(ref): 1 Q2: 0.91 (0.83, 0.99) Q3: 0.86 (0.78, 0.95) Q4: 0.82 (0.73, 0.91) Q5: 0.79 (0.70, 0.89) |
|
PREDIMED Spain Henríquez‐Sánchez et al. (2016) 4.3 yr (median) Prospective cohort Public |
N = 7,447 Population sampled: Participants of the PREDIMED RCT, without CVD at enrolment and with either T2DM or ≥3 risk factors (smoking, hypertension, dyslipidemia, overweight or obesity, or family history of premature CVD) Excluded: no follow‐up; total energy intake < 800 or > 4,000 kcal/d n = 7,015 Sex (% F): 58 Ethnicity: Caucasian Age (yr): 55–80 |
Survival status obtained from the continuous contact with participants and their families (during trial phase), contact with family physicians, yearly comprehensive review of all medical records and yearly consultation of the National Death Index |
Quintile of Se intake assessed through SFFQ NR Person‐years Q1: 6,070 Q2: 6,190 Q3: 6,210 Q4: 6,333 Q5: 6,273 |
N, per quintile Q1(ref): 73 Q2: 73 Q3: 62 Q4: 53 Q5: 58 |
Recruitment center, intervention group, age, sex, education, marital status, BMI, smoking habit, alcohol consumption, total energy intake, energy‐adjusted intake of saturated fatty acids, polyunsaturated fatty acids, monounsaturated fatty acids and glycaemic index and medical history of hypertension, diabetes, dyslipidemia and cancer |
HR (95% CI) Q1(ref): 1 Q2: 0.75 (0.53, 1.05) Q3: 0.88 (0.62, 1.25) Q4: 0.72 (0.49, 1.06) Q5: 0.74 (0.49, 1.10) p trend 0.212 |
|
SES Sweden Alehagen et al. (2016) 6.8 yr Prospective cohort Mixed |
N = 449 Population sampled: General population from a rural municipality n = 449 Sex (% F): 52 Ethnicity: Caucasian Age (yr): 70–80 |
The mortality information was obtained from the National Board of Health and Welfare in Sweden, which registers all deaths of Swedish citizens. |
N, per quartile of serum Se (μg/L) Q1 < 57.2: 107 Q2 57.2–67.1: NR Q3 67.1–76.1: NR Q4 > 76.1: 111 |
N, per quartile Q1: 41 Q2‐4: 81 |
Model 1: crude Model 2: male gender, smoking, ischemic heart disease, diabetes, chronic obstructive pulmonary disease and ejection fraction < 40% (echocardiography) |
HR (95% CI), Q1 vs Q2‐4 (ref) Model 1: 1.67 (1.15, 2.44) Model 2: 1.43 (1.02, 2.00) |
|
NHANES III (1988–1994) USA Eaton et al. (2010) 13.4 yr Prospective cohort Public |
N = 10,531 Population Sampled: General population, ≥ 35 yr Excluded: missing serum Se and serum creatinine; renal insufficiency n = 9,304 Sex (% F): Low Se: 64 Normal Se: 52 Ethnicity: 78% non‐Hispanic, white Age (yr): Low Se: 56.4 ± 1.3 Normal Se: 52.1 ± 0.4 |
Survival status obtained through the National Death Index |
N above/below median serum Se (μg/L) Low Se (≤ 98 ng/mL): 418 Normal Se (> 98 ng/mL): 8,886 |
Age‐standardised death rate per 100,000 person‐years Low Se (≤ 98 ng/mL): 3,509 Normal Se (> 98 ng/mL): 2,305 |
Model 1: age‐adjusted Model 2: age, gender, race, geography, smoking, BMI, systolic BP, diabetes, total‐to‐HDL cholesterol ratio, physical activity, lifetime alcohol use, history of CHD or stroke, and family history of CHD |
HR (95% CI), low vs normal Se Model 1: 1.67 (1.4, 1.91) Model 2: 1.65 (1.41, 1.93) |
|
NHANES (1996–2006) USA Li et al. (2020b) 10.2 yr (median) Prospective cohort Public |
N = 41,474 Population sampled: General population Excluded: missing Se data, aged < 18 yr n = 2,903 Sex (% F): 51 Ethnicity: 56% White, 44% Non‐White Age (yr): 61.94 ± 13.73 |
Mortality data extracted from the 1999–2006 NHANES public‐use linked mortality files |
n, per quartile of serum Se (μg/L) Q1 ≤ 124.0: 696 Q2 125.0–135.0: 746 Q3 136.0–147.0: 721 Q4 ≥ 148.0: 740 |
N, per quartile Q1: 244 Q2: 208 Q3: 197 Q4: 209 |
Model 1: age, gender and BMI Model 2: Model 1 + systolic blood pressure, total cholesterol, C‐reactive protein, alcohol consumption, smoking, race, history of hypertension, cardiovascular disease, diabetes, estimated glomerular filtration rate, use of lipid‐lowering and antiplatelet drugs. |
HR (95% CI) Model 2 Q1(ref): 1 Q2: 0.69 (0.57, 0.84) Q3: 0.63 (0.52, 0.77) Q4: 0.64 (0.53, 0.77) p for trend < 0.01 Model 3 Q1(ref): 1 Q2: 0.62 (0.47, 0.81) Q3: 0.57 (0.42, 0.75) Q4: 0.60 (0.45, 0.78) p for trend < 0.01 |
|
NDNS UK Bates et al. (2011) 14 yr Prospective cohort Public |
N = 1,054 Population Sampled: General population aged ≥ 65 years; community living participants Excluded: missing plasma Se; lost to follow up n = 826 Sex (% F): 48 Ethnicity: Caucasians Age (yr): 76.6 ± 7.4 |
Death registries. All participants agreed to be flagged to the National Register of Births and Deaths, and whose status (i.e. as still alive or registered as having died) was known in September 2008. |
Plasma Se (μmol/L) Males 950 ± 218 (375–2,376) Females 924 ± 211 (461–1,786) |
NR |
Model 1: Age and sex Model 2: Model 1 + other significantly predictive nutrient variables Model 3: Model 2+ inclusion of a1‐antichymotrypsin, plasma creatinine, total and HDL‐cholesterol and albumin concentrations, BMI, systolic blood pressure, current smoking index, number of prescribed drugs being taken, self‐reported health score, physical activity score and index of poverty |
HR (95% CI), per SD plasma Se Model 1: 0.76 (0.69, 0.84) Model 2: 0.82 (0.73, 0.91) Model 3: 0.83 (0.73, 0.94) |
|
InCHIANTI Italy Lauretani et al. (2008) 6 yr Prospective cohort Public |
N = 1,155 Population sampled: General population, aged ≥ 65 yr Excluded: missing blood sample or incomplete data n = 1,042 Sex (% F): 57 Ethnicity: Caucasians Age (yr): 75.6 ± 7.4 |
Mortality data collected from the General Mortality Registry of the Tuscany Region and death certificates deposited at the municipality of residence. |
Quartiles of plasma Se (μmol/L) Q1: < 0.839 Q2: 0.839–0.934 Q3: 0.935–1.037 Q4: > 1.037 n per quartile NR |
N, per quartile Q1: 98 Q2: 64 Q3: 43 Q4: 32 |
Model 1: age and sex Model 2: age, sex, education, BMI, congestive heart failure, peripheral artery disease, stroke, Parkinson's disease and chronic obstructive pulmonary disease |
HR (95% CI) Model 1 Q1: 1.82 (1.20, 2.75) Q2: 1.48 (0.96, 2.29) Q3: 1.14 (0.72, 1.81) Q4 (ref): 1 Model 2 Q1: 1.62 (1.06, 2.43) Q2: 1.42 (0.94, 2.18) Q3: 1.09 (0.68, 1.74) Q4 (ref): 1 |
|
WHAS I and II USA Ray et al. (2006) 5 yr Prospective cohort Public |
N WHAS I = 1,002 N WHAS II = 436 Population sampled: Community living women with and without physical disabilities Excluded: missing serum Se, aged < 70 or > 79 yr n = 632 Sex: females Ethnicity: NR Age (yr): Died 75 Lived 73.9 |
Vital status determined through follow‐up interviews with proxies, obituaries, and matching with the National Death Index |
Serum Se (μmol/L geometric mean (95% CI)) 1.52 Died: 1.43 (1.38–1.49) Lived: 1.54 (1.52–1.57) |
Total = 89 |
Model 1: age and education Model 2: age, education, current smoking, alcohol use, BMI, fair‐to‐poor appetite, diabetes mellitus, cardiovascular disease, and renal disease |
HR (95% CI), per 1 SD of Log e Se Model 1: 0.68 (0.55, 0.83) Model 2: 0.71 (0.56, 0.9) |
|
Asturias Spain González et al. (2007) 6 yr (mean 4.3 yr) Prospective cohort Mixed |
N = 304 Population sampled: Elderly living in institutions Excluded: previous history of cancer, mental impairment or CVD, in a wheelchair, with terminal disease, missing biochemical parameters, use of vitamin and/or mineral supplements or following a special diet n = 215 Sex (% F): 59 Ethnicity: Caucasians Age: ≥ 60 y |
Vital status obtained from the institutions the participants were residing at every year |
N, per quintile of serum Se (μmol/L, range) Q1 ≤ 0.92: 47 Q2 0.93–1.04: 37 Q3 1.05–1.14: 45 Q4 1.15–1.25: 43 Q5 > 1.26: 43 |
N, per quintile Q1: 17 Q2: 14 Q3: 10 Q4: 11 Q5: 8 |
Age, sex, smoking habit, BMI and cognitive score |
RR (95% CI) Q1(ref): 1 Q2: 1.13 (0.54, 2.39) Q3: 0.69 (0.29, 1.60) Q4: 0.81 (0.36, 1.82) Q5: 0.56 (0.23, 1.40) p for trend = 0.158 |
|
EVA France Akbaraly et al. (2005) 9 yr Prospective cohort Mixed |
N = 1,389 Population sampled: General population, residents in Nantes, aged 59–71 y Excluded: NA n = 1,389 Sex (% F): 59 Ethnicity: Caucasians Age (yr): Died 65.4 ± 3.0 Lived 65.0 ± 3.0 |
Vital status collected from town hall civil registries |
N, per quartile of plasma Se (μmol/L, median (range)) Q1: 0.87 (0.18–0.95): 337 Q2: 1.03 (0.96–1.09): 350 Q3: 1.15 (1.10–1.21): 286 Q4: 1.32 (1.22–1.97): 361 |
Total = 101 N per quartile NR |
Age, sex, smoking, alcohol consumption, medication, obesity, diabetes, dyslipidaemia and vascular disease |
RR (95% CI) Q1: 3.34 (1.71, 6.53) Q2: 2.49 (1.25, 4.94) Q3: 1.67 (0.78, 3.56) Q4 (ref): 1 |
|
General Population Trial China Wei et al. (2004) 15 yr Prospective cohort Public |
N = 29,584 Population sampled: healthy individuals aged 40–69 yr from 4 Linxian communes, participants of the General Population Trial Excluded: NR n = 1,103 (sub‐sample from the trial) Sex (% F): 45 Ethnicity: Asian Age (yr): 56.6 ± 8.0 |
Village doctors ascertained mortality among participants through monthly follow‐up |
Quartiles of serum Se (μmol/L) Q1: ≤ 0.77 Q2: > 0.77–0.91 Q3: > 0.91–1.06 Q4: > 1.06 n per quartile of Se NR |
Total = 516 N per quartile of Se NR |
Sex, age, cholesterol, smoking, drinking, and BMI Assignment to treatment during trial period not included as did not affect estimates |
RR (95% CI) Q1(ref): 1 Q2: 1.01 (0.79, 1.30) Q3: 0.96 (0.75, 1.23) Q4: 0.93 (0.72, 1.19) p for trend = 0.57 |
|
Uppsala Sweden Kilander et al. (2001) 25.7 yr Prospective cohort Public |
N = 2,322 Population sampled: men aged 50 yr resident in Uppsala Excluded: died within 2 yr of baseline n = 2,285 Sex: M Ethnicity: Caucasians Age (yr): 48.6–51.1 y |
Ascertainment of deaths from the Swedish death register |
Serum Se (μg/L), by education level Low: 73.3 Medium: 77.7 High: 83.0 |
Total = 630 | age |
RR (95% CI), per 1 SD of serum Se increase 0.87 (0.80, 0.95) |
|
Finnish Rural Finland Virtamo et al. (1985) 5 yr Prospective cohort Public |
N = 1,710 Population sampled: men from rural areas of eastern and western Finland Excluded: serum Se ≥ 45 μg/L n = 328 East 84 West 244 Sex: males Ethnicity: Caucasians Age: 55–74 y |
Data on deaths obtained from the National Death Certificate Register |
Serum Se < 45 μg/L |
NR |
Model 1: age and area Model 2: Model 1 + smoking, serum cholesterol, diastolic blood pressure, previous CHD, blood haemoglobin, FEV0.7 S, alcohol consumption |
RR (95% CI) Model 1 1.5 (1.1–2.0) Model 2 1.4 (1.0–2.0) Among men initially free of CHD Model 1: 1.4 (0.9, 2.4) Model 2: 1.5 (0.9, 2.4) |
BMI: body mass index; BP: blood pressure; CI: confidence interval; CRP: c‐reactive protein; CVD: cardiovascular disease; CHD: coronary heart disease; EVA: Etude du Vieillissement Arte'riel study; F: females; FEV: forced expiratory volume; HDL: high density lipoprotein; HR: hazard ratio; IADL: Instrumental Activities of Daily Living; ilSIRENTE: Invecchiamento e Longevità nel Sirente; InCHIANTI: Invecchiare in Chianti; LDL: low density lipoprotein; M: males; MPP: The Malmö Preventive Project; NDNS: National Diet and Nutrition Survey; NHANES: National Health and Nutrition Examination Survey; NR: not reported; PREDIMED: Prevención con Dieta Mediterránea (Prevention with Mediterranean Diet); PY: person‐years; Qx: quartile/quintile x; RCT: randomised controlled trial; RR: relative risk; SD: standard deviation; Se: selenium; SES: South‐East Sweden cohort; SFFQ: semi‐quantitative food frequency questionnaire; SMHS: Shanghai Men's Health Study; SWHS: Shanghai Women's Health Study; UK: United Kingdom; USA: United States of America; WHAS: Women's Health and Aging Study; yr: year.
(a) Mean ± SD (range), unless specified otherwise.
(b): Dietary intakes were adjusted for energy intake using the nutrient density method and expressed as per μg/4184 kJ (1,000 kcal) per day (Willett al., 1997).
List of annexes
These Annexes can be found in the online version of this output, under the section ‘Supporting Information’, at https://doi.org/10.2903/j.efsa.2023.7704
Annex A. Protocol for the Scientific opinion on the tolerable upper intake level for selenium
Annex B. Statistical analysis of evidence from studies identified in the published scientific literature as preparatory work for the setting of a Tolerable Upper Intake Level for selenium
Annex C. EFSA's intake assessment of selenium
Annex D. Intake data from Competent Authorities in European Member States
Annex E. References excluded at the stages of full‐text screening and data extraction
Annex F. Public consultation outcome
Supporting information
Protocol for the Scientific opinion on the tolerable upper intake level for selenium
Statistical analysis of evidence from studies identified in the published scientific literature as preparatory work for the setting of a Tolerable Upper Intake Level for selenium
EFSA's intake assessment of selenium
Intake data from Competent Authorities in European Member States
References excluded at the stages of full‐text screening and data extraction
Public consultation outcome
Suggested citation: EFSA NDA Panel (EFSA Panel on Nutrition, Novel Foods and Food Allergens) , Turck D, Bohn T, Castenmiller J, de Henauw S, Hirsch‐Ernst K‐I, Knutsen HK, Maciuk A, Mangelsdorf I, McArdle HJ, Peláez C, Pentieva K, Siani A, Thies F, Tsabouri S, Vinceti M, Aggett P, Crous Bou M, Cubadda F, Ciccolallo L, de Sesmaisons Lecarré A, Fabiani L, Titz A and Naska A, 2023. Scientific opinion on the tolerable upper intake level for selenium. EFSA Journal 2023;21(1):7704, 194 pp. 10.2903/j.efsa.2023.7704
Requestor European Commission
Question number EFSA‐Q‐2020‐00618
Panel members Dominique Turck, Torsten Bohn, Jacqueline Castenmiller, Stefaan De Henauw, Karen Ildico Hirsch‐Ernst, Helle Katrine Knutsen, Alexandre Maciuk, Inge Mangelsdorf, Harry J McArdle, Androniki Naska, Carmen Peláez, Kristina Pentieva, Alfonso Siani, Frank Thies, Sophia Tsabouri and Marco Vinceti.
Declarations of interest If you wish to access the declaration of interests of any expert contributing to an EFSA scientific assessment, please contact interestmanagement@efsa.europa.eu.
Acknowledgements The Panel wishes to thank for their contribution to this output: the WG on Upper Levels: Peter Aggett, Marta Crous Bou, Francesco Cubadda, Harry J McArdle, Androniki Naska, and Marco Vinceti; and EFSA staff members: Ionut Craciun, Constanza de Matteu Monteiro, Rita Ferreira de Sousa, Zsuzsanna Horvath, Irene Muñoz Guajardo, and Angeliki Sofroniou. The Panel also wishes to acknowledge the contribution of Daniele Cappellani (University of Pisa, Italy), Roger Sunde (University of Wisconsin–Madison, USA) and Peter Willatts (University of Dundee, UK) as hearing experts, and all national institutions in European countries that provided consumption data for this scientific output and the authors of published papers on selenium who provided additional information upon request.
EFSA may include images or other content for which it does not hold copyright. In such cases, EFSA indicates the copyright holder and users should seek permission to reproduce the content from the original source.
Adopted: 24 November 2022
Notes
Contract No PO/EFSA/NIF/2022/01.
See Table 8 of OHAT's Handbook for Conducting Systematic Reviews for Health Effects Evaluations (OHAT‐NTP, 2019).
The Mintel GNPD contains information on over three million food and beverage products, of which more than one million are or have been available on the European food market. Twenty five out of the 27 EU Member States and Norway are present in the database. The database provides the compulsory ingredient information reported on product labels and the nutrition declaration when available. http://www.mintel.com/globalnew-products-database.
Short term: hours/days; medium term: weeks.
Medium term: weeks; long term: months/years.
Directive (EU) 2020/2184 of the European Parliament and of the Council of 16 December 2020 on the quality of water intended for human consumption (recast). OJ L 435, 23.12.2020, pp. 1–62.
Regulation (EC) No 1925/2006 of the European Parliament and of the Council of 20 December 2006 on the addition of vitamins and minerals and of certain other substances to foods. OJ L 404, 30.12.2006, pp. 26–38.
Regulation (EU) No 609/2013 of the European Parliament and of the Council of 12 June 2013 on food intended for infants and young children, food for special medical purposes, and total diet replacement for weight control and repealing Council Directive 92/52/EEC, Commission Directives 96/8/EC, 1999/21/EC, 2006/125/EC and 2006/141/EC, Directive 2009/39/EC of the European Parliament and of the Council and Commission Regulations (EC) No 41/2009 and (EC) No 953/2009. OJ L 181, 29.6.2013, pp. 35–56.
‘Baby foods’ as categorised by Mintel; the definition applied differs from the EU regulatory category ‘baby food’ as specified in Regulation 609/2013 of the European Parliament and of the Council on food intended for infants and young children, food for special medical purposes, and total diet replacement for weight control. OJ L 181, 29.6.2013, p. 35.
Directive 2002/46/EC of the European Parliament and of the Council of 10 June 2002 on the approximation of the laws of the Member States relating to food supplements. OJ L 183, 12.7.2002, pp. 51–57.
Indicatively, 2.2% of the overall eating occasions reported a fortification descriptor (e.g. ‘F09.Fortification agent’) in the latest version of the Comprehensive Database (updated in July 2021), of which 0.01% report a selenium‐related fortification descriptor, for foods such as milk, foods for sports people, and functional drinks. These figures are likely to underestimate the actual consumption of fortified foods, as some surveys did not address the consumption fortified foods or because the survey participants did not know if the food consumed was fortified.
Findings regarding the incidence of skin cancer in the NPC trial are assessed in Section 3.5.9.1.
National Cancer Institute Common Toxicity Criteria (version 2): Alopecia: Grade 0: normal, Grade 1: mild hair loss; Grade 2: pronounced hair loss; Nail changes: Grade 0: normal, Grade 1: discoloration or ridging (koilonychia) or pitting, Grade 2: partial or complete loss of nail(s) or pain in nailbeds; Fatigue, Grade 0: none, Grade 1: increased fatigue over baseline, but not altering normal activities; Grade 2: moderate (e.g., decrease in performance status by 1 ECOG level or 20% Karnofsky or Lansky) or causing difficulty performing some activities; Nausea: Grade 0: none, Grade 1: able to eat, Grade 2: oral intake significantly decreased, Grade 3: no significant intake, requiring IV fluids.
Criteria defined in the study protocol (provided by the authors): Halitosis (bad breath): Grade 1: mildly altered from baseline, Grade 2: moderately altered from baseline; Dermatitis: Grade 1: faint erythema or dry desquamation, Grade 2: moderate to brisk erythema or a patchy moist desquamation, mostly confined to skin folds and creases; moderate edema, Grade 3: moist desquamation other than skin folds and creases; may include bleeding induced by minor trauma or abrasion, Grade 4: skin necrosis or ulceration of full thickness dermis; may include spontaneous bleeding.
Calculated as the ratio of the increment of plasma insulin (μU/mL) to the increment in glucose (mg/L) during the first 30 min of OGTT.
Directive 2002/46/EC of the European Parliament and of the Council of 10 June 2002 on the approximation of the laws of the Member States relating to food supplements. OJ L 183, 12.7.2002, pp. 51–57.
Commission Delegated Regulation (EU) 2016/127 of 25 September 2015 supplementing Regulation (EU) No 609/2013 of the European Parliament and of the Council as regards the specific compositional and information requirements for infant formula and follow‐on formula and as regards requirements on information relating to infant and young child feeding. OJ L 25, 2.2.2016, pp. 1–29.
References
- AECOSAN (Agencia Española de Consumo, Seguridad Alimentaria y Nutrición) , 2017. Estudio ENALIA 2012–2014: Encuesta Nacional de consumo de Alimentos en población Infantil y Adolescente. Ministerio de Sanidad, Servicios Sociales e Igualdad, Madrid. 258 p. [Google Scholar]
- AFSSA (Agence française de sécurité sanitaire des aliments) , 2009. Étude individuelle nationale des consommations alimentaires 2 (INCA 2) 2006–2007 (version 2). Maisons‐Alfort, France. 225 p. [Google Scholar]
- Akbaraly NT, Arnaud J, Hininger‐Favier I, Gourlet V, Roussel AM and Berr C, 2005. Selenium and mortality in the elderly: results from the EVA study. Clinical Chemistry, 51, 2117–2123. 10.1373/clinchem.2005.055301 [DOI] [PubMed] [Google Scholar]
- Al‐Saleh I and Billedo G, 2006. Determination of selenium concentration in serum and toenail as an indicator of selenium status. Bulletin of Environmental Contamination and Toxicology, 77, 155–163. 10.1007/s00128-006-1045-4 [DOI] [PubMed] [Google Scholar]
- Aldosary BM, Sutter ME, Schwartz M and Morgan BW, 2012. Case series of selenium toxicity from a nutritional supplement. Clinical Toxicology, 50, 57–64. 10.3109/15563650.2011.641560 [DOI] [PubMed] [Google Scholar]
- Alehagen U, Johansson P, Björnstedt M, Rosén A, Post C and Aaseth J, 2016. Relatively high mortality risk in elderly Swedish subjects with low selenium status. European Journal of Clinical Nutrition, 70, 91–96. 10.1038/ejcn.2015.92 [DOI] [PMC free article] [PubMed] [Google Scholar]
- Alexander J, 2022. Selenium. In: Nordberg GF and Costa M (eds.). Handbook on the Toxicology of Metals. 5th Edition. Academic Press. pp. 729–771. [Google Scholar]
- Alfthan G, Aro A, Arvilommi H and Huttunen JK, 1991. Selenium metabolism and platelet glutathione peroxidase activity in healthy Finnish men: effects of selenium yeast, selenite, and selenate. American Journal of Clinical Nutrition, 53, 120–125. [DOI] [PubMed] [Google Scholar]
- Alfthan G and Neve J, 1996. Reference values for serum selenium in various areas evaluated according to the TRACY protocol. Journal of Trace Elements in Medicine and Biology, 10, 77–87. 10.1016/S0946-672X(96)80015-0 [DOI] [PubMed] [Google Scholar]
- Algotar AM, Hsu CH, Singh P and Stratton SP, 2013a. Selenium supplementation has no effect on serum glucose levels in men at high risk of prostate cancer. Journal of Diabetes, 5, 465–470. 10.1111/1753-0407.12041 [DOI] [PMC free article] [PubMed] [Google Scholar]
- Algotar AM, Stratton MS, Ahmann FR, Ranger‐Moore J, Nagle RB, Thompson PA, Slate E, Hsu CH, Dalkin BL, Sindhwani P, Holmes MA, Tuckey JA, Graham DL, Parnes HL, Clark LC and Stratton SP, 2013b. Phase 3 clinical trial investigating the effect of selenium supplementation in men at high‐risk for prostate cancer. Prostate, 73, 328–335. 10.1002/pros.22573 [DOI] [PMC free article] [PubMed] [Google Scholar]
- Allen NE, Appleby PN, Roddam AW, Tjønneland A, Johnsen NF, Overvad K, Boeing H, Weikert S, Kaaks R, Linseisen J, Trichopoulou A, Misirli G, Trichopoulos D, Sacerdote C, Grioni S, Palli D, Tumino R, Bueno‐de‐Mesquita HB, Kiemeney LA, Barricarte A, Larrañaga N, Sánchez MJ, Agudo A, Tormo MJ, Rodriguez L, Stattin P, Hallmans G, Bingham S, Khaw KT, Slimani N, Rinaldi S, Boffetta P, Riboli E and Key TJ, 2008. Plasma selenium concentration and prostate cancer risk: results from the European Prospective Investigation into Cancer and Nutrition (EPIC). American Journal of Clinical Nutrition, 88, 1567–1575. 10.3945/ajcn.2008.26205 [DOI] [PubMed] [Google Scholar]
- Amcoff E, Edberg A, Enghardt HB, Lindroos A‐K, Nälsén C, Pearson M and Warensjö E, 2012. Riksmaten – vuxna 2010–11. Livsmedels‐ och näringsintag bland vuxna i Sverige. Resultat från matvaneundersökning utförd 2010–11. Livsmedelsverket, Uppsala, Sweden. 180 p. [Google Scholar]
- Amorós R, Murcia M, Ballester F, Broberg K, Iñiguez C, Rebagliato M, Skröder H, González L, Lopez‐Espinosa MJ and Llop S, 2018a. Selenium status during pregnancy: Influential factors and effects on neuropsychological development among Spanish infants. Science of the Total Environment, 610–611, 741–749. 10.1016/j.scitotenv.2017.08.042 [DOI] [PubMed] [Google Scholar]
- Amorós R, Murcia M, González L, Rebagliato M, Iñiguez C, Lopez‐Espinosa MJ, Vioque J, Broberg K, Ballester F and Llop S, 2018b. Maternal selenium status and neuropsychological development in Spanish preschool children. Environmental Research, 166, 215–222. 10.1016/j.envres.2018.06.002 [DOI] [PubMed] [Google Scholar]
- Anses (Agence nationale de sécurité sanitaire de l'alimentation, de l'environnement et du travail) , 2017. Étude individuelle nationale des consommations alimentaires 3 (INCA 3). 564 pp.
- Anses (Agence nationale de sécurité sanitaire de l'alimentation, de l'environnement et du travail) , online, 2020. Table de composition nutritionnelle des aliments Ciqual. Available online: https://ciqual.anses.fr/ [Accessed: 3 August 2020]
- Arnund J, Bertrais S, Roussel AM, Arnault N, Ruffieux D, Favier A, Berthelin S, Estaquio C, Galan P, Czernichow S and Hercberg S, 2006. Serum selenium determinants in French adults: The SU.VI.M.AX study. British Journal of Nutrition, 95, 313–320. 10.1079/BJN20051528 [DOI] [PubMed] [Google Scholar]
- Asgari MM, Maruti SS, Kushi LH and White E, 2009. Antioxidant supplementation and risk of incident melanomas: results of a large prospective cohort study. Archives of Dermatology, 145, 879–882. 10.1001/archdermatol.2009.176 [DOI] [PMC free article] [PubMed] [Google Scholar]
- Ashton K, Hooper L, Harvey LJ, Hurst R, Casgrain A and Fairweather‐Tait SJ, 2009. Methods of assessment of selenium status in humans: a systematic review. American Journal of Clinical Nutrition, 89, 2025S–2039S. 10.3945/ajcn.2009.27230F [DOI] [PubMed] [Google Scholar]
- Astrup H, Myhre JB, Andersen LF, Kristiansen AL and Institute of Public Health, University of Oslo , 2020. Småbarnskost 3. Landsomfattende undersøkelse av kostholdet blant 2‐åringer i Norge. Oslo, Norway
- ATSDR (Agency for Toxic Substances and Disease Registry) , 2013. Toxicological profile for selenium. U.S. Department of Health and Human Services, Public Health Service, Atlanta, GA. [Google Scholar]
- Aureli F, Ouerdane L, Bierla K, Szpunar J, Prakash NT and Cubadda F, 2012. Identification of selenosugars and other low‐molecular weight selenium metabolites in high‐selenium cereal crops. Metallomics, 4, 968–978. 10.1039/c2mt20085f [DOI] [PubMed] [Google Scholar]
- Bates CJ, Hamer M and Mishra GD, 2011. Redox‐modulatory vitamins and minerals that prospectively predict mortality in older British people: the National Diet and Nutrition Survey of people aged 65 years and over. British Journal of Nutrition, 105, 123–132. 10.1017/S0007114510003053 [DOI] [PMC free article] [PubMed] [Google Scholar]
- Beilstein MA and Whanger PD, 1986. Deposition of dietary organic and inorganic selenium in rat erythrocyte proteins. Journal of Nutrition, 116, 1701–1710. 10.1093/jn/116.9.1701 [DOI] [PubMed] [Google Scholar]
- Bierla K, Dernovics M, Vacchina V, Szpunar J, Bertin G and Lobinski R, 2008a. Determination of selenocysteine and selenomethionine in edible animal tissues by 2D size‐exclusion reversed‐phase HPLC‐ICP MS following carbamidomethylation and proteolytic extraction. Analytical and Bioanalytical Chemistry, 390, 1789–1798. 10.1007/s00216-008-1883-5 [DOI] [PubMed] [Google Scholar]
- Bierla K, Lobinski R and Szpunar J, 2018. Determination of proteinaceous selenocysteine in selenized yeast. International Journal of Molecular Sciences, 19. 10.3390/ijms19020543 [DOI] [PMC free article] [PubMed] [Google Scholar]
- Bierla K, Szpunar J and Lobinski R, 2008b. Specific determination of selenoaminoacids in whole milk by 2D size‐exclusion‐ion‐paring reversed phase high‐performance liquid chromatography‐inductively coupled plasma mass spectrometry (HPLC‐ICP MS). Analytica Chimica Acta, 624, 195–202. 10.1016/j.aca.2008.06.052 [DOI] [PubMed] [Google Scholar]
- Bierla K, Szpunar J, Yiannikouris A and Lobinski R, 2012. Comprehensive speciation of selenium in selenium‐rich yeast. Trends in Analytical Chemistry, 41, 122–132. 10.1016/j.trac.2012.08.006 [DOI] [Google Scholar]
- Brätter P and Negretti de Brätter VE, 1996. Influence of high dietary selenium intake on the thyroid hormone level in human serum. Journal of Trace Elements in Medicine and Biology, 10, 163–166. 10.1016/s0946-672x(96)80027-7 [DOI] [PubMed] [Google Scholar]
- Brätter P, Negretti de Brätter VE, Jaffe WG and Mendez Castellano H, 1991. Selenium status of children living in seleniferous areas of Venezuela. Journal of Trace Elements and Electrolytes in Health and Disease, 5, 269–270. [PubMed] [Google Scholar]
- Brigelius‐Flohe R and Arner ESJ, 2018. Selenium and selenoproteins in (redox) signaling, diseases, and animal models – 200 year anniversary issue. Free Radical Biology and Medicine, 127, 1–2. 10.1016/j.freeradbiomed.2018.09.026 [DOI] [PubMed] [Google Scholar]
- Brown KM, Pickard K, Nicol F, Beckett GJ, Duthie GG and Arthur JR, 2000. Effects of organic and inorganic selenium supplementation on selenoenzyme activity in blood lymphocytes, granulocytes, platelets and erythrocytes. Clinical Science, 98, 593–599. [PubMed] [Google Scholar]
- Bulka CM, Scannell Bryan M, Persky VW, Daviglus ML, Durazo‐Arvizu RA, Parvez F, Slavkovich V, Graziano JH, Islam T, Baron JA, Ahsan H and Argos M, 2019. Changes in blood pressure associated with lead, manganese, and selenium in a Bangladeshi cohort. Environmental Pollution, 248, 28–35. 10.1016/j.envpol.2019.01.129 [DOI] [PMC free article] [PubMed] [Google Scholar]
- Bulotaitė G, Bartkevičiūtė R, Barzda A, Miliauskė R and Drungilas V, 2021. Suaugusių ir pagyvenusių Lietuvos gyventojų faktinės mitybos, mitybos ir fizinio aktyvumo įpročių bei žinių apie mitybą ir fizinį aktyvumą tyrimas (2019/2020 m.) – IV dalis – Suaugusių ir pagyvenusių Lietuvos gyventojų faktinės mitybos tyrimo ataskaita. Health Education and Disease Prevention Centre, Vilnius, Lithuania. 25 p. [Google Scholar]
- Burk RF and Hill KE, 2015. Regulation of selenium metabolism and transport. Annual Review of Nutrition, 35, 109–134. 10.1146/annurev-nutr-071714-034250 [DOI] [PubMed] [Google Scholar]
- Burk RF, Norsworthy BK, Hill KE, Motley AK and Byrne DW, 2006. Effects of chemical form of selenium on plasma biomarkers in a high‐dose human supplementation trial. Cancer Epidemiology, Biomarkers and Prevention, 15, 804–810. 10.1158/1055-9965.EPI-05-0950 [DOI] [PubMed] [Google Scholar]
- Cabral M, Kuxhaus O, Eichelmann F, Kopp JF, Alker W, Hackler J, Kipp AP, Schwerdtle T, Haase H, Schomburg L and Schulze MB, 2021. Trace element profile and incidence of type 2 diabetes, cardiovascular disease and colorectal cancer: results from the EPIC‐Potsdam cohort study. European Journal of Nutrition., 60, 3267–3278. 10.1007/s00394-021-02494-3 [DOI] [PMC free article] [PubMed] [Google Scholar]
- Calamandrei G, Ricceri L, Meccia E, Tartaglione AM, Horvat M, Tratnik JS, Mazej D, Špirić Z, Prpić I, Vlašić‐Cicvarić I, Neubauer D, Kodrič J, Stropnik S, Janasik B, Kuraś R, Mirabella F, Polańska K and Chiarotti F, 2020. Pregnancy exposome and child psychomotor development in three European birth cohorts. Environmental Research, 181, 108856. 10.1016/j.envres.2019.108856 [DOI] [PubMed] [Google Scholar]
- Cardoso BR, Duarte GBS, Reis BZ and Cozzolino SMF, 2017. Brazil nuts: Nutritional composition, health benefits and safety aspects. Food Research International, 100, 9–18. 10.1016/j.foodres.2017.08.036 [DOI] [PubMed] [Google Scholar]
- Carvalho RF, Huguenin GV, Luiz RR, Moreira AS, Oliveira GM and Rosa G, 2015. Intake of partially defatted Brazil nut flour reduces serum cholesterol in hypercholesterolemic patients – a randomized controlled trial. Nutrition Journal, 14, 59. 10.1186/s12937-015-0036-x [DOI] [PMC free article] [PubMed] [Google Scholar]
- Castriotta L, Rosolen V, Biggeri A, Ronfani L, Catelan D, Mariuz M, Bin M, Brumatti LV, Horvat M and Barbone F, 2020. The role of mercury, selenium and the Se‐Hg antagonism on cognitive neurodevelopment: A 40‐month follow‐up of the Italian mother‐child PHIME cohort. International Journal of Hygiene and Environmental Health, 230, 113604. 10.1016/j.ijheh.2020.113604 [DOI] [PubMed] [Google Scholar]
- Chawla R, Filippini T, Loomba R, Cilloni S, Dhillon KS and Vinceti M, 2020. Exposure to a high selenium environment in Punjab, India: Biomarkers and health conditions. Science of the Total Environment, 719, 134541. 10.1016/j.scitotenv.2019.134541 [DOI] [PubMed] [Google Scholar]
- Cheng Z, Li Y, Young JL, Cheng N, Yang C, Papandonatos GD, Kelsey KT, Wise JP Sr, Shi K, Zheng T, Liu S and Bai Y, 2022. Long‐term association of serum selenium levels and the diabetes risk: Findings from a case‐control study nested in the prospective Jinchang Cohort. Science of the Total Environment, 818, 151848. 10.1016/j.scitotenv.2021.151848 [DOI] [PMC free article] [PubMed] [Google Scholar]
- Clark L, Combs G, Turnbull B, Slate E, Chalker D, Chow J, Davis L, Glover RA, Graham G, Gross EG, Krongrad A, Lesher J, Park HK, Sanders BB, Smith C and Taylo J, 1996. Effects of selenium supplementation for cancer prevention in patients with carcinoma of the skin. A randomized controlled trial. Nutritional Prevention of Cancer Study Group. The Journal of the American Medical Association, 276, 1957–1963. [PubMed] [Google Scholar]
- Coates RJ, Weiss NS, Daling JR, Morris JS and Labbe RF, 1988. Serum levels of selenium and retinol and the subsequent risk of cancer. American Journal of Epidemiology, 128, 515–523. 10.1093/oxfordjournals.aje.a114999 [DOI] [PubMed] [Google Scholar]
- Combs GF, 2001. Selenium in global food systems. British Journal of Nutrition, 85, 517–547. 10.1079/BJN2000280 [DOI] [PubMed] [Google Scholar]
- Combs GF Jr, 2015. Biomarkers of selenium status. Nutrients, 7, 2209–2236. 10.3390/nu7042209 [DOI] [PMC free article] [PubMed] [Google Scholar]
- Combs GF Jr, Jackson MI, Watts JC, Johnson LK, Zeng H, Idso J, Schomburg L, Hoeg A, Hoefig CS, Chiang EC, Waters DJ, Davis CD and Milner JA, 2012. Differential responses to selenomethionine supplementation by sex and genotype in healthy adults. British Journal of Nutrition, 107, 1514–1525. 10.1017/S0007114511004715 [DOI] [PubMed] [Google Scholar]
- Crippa A, Discacciati A, Bottai M, Spiegelman D and Orsini N, 2019. One‐stage dose‐response meta‐analysis for aggregated data. Statistical Methods in Medical Research, 28, 1579–1596. 10.1177/0962280218773122 [DOI] [PubMed] [Google Scholar]
- Cubadda F, Aureli F, Ciardullo S, D'Amato M, Raggi A, Acharya R, Reddy RA and Prakash NT, 2010. Changes in selenium speciation associated with increasing tissue concentrations of selenium in wheat grain. Journal of Agricultural and Food Chemistry, 58, 2295–2301. 10.1021/jf903004a [DOI] [PubMed] [Google Scholar]
- D'Oria L, Apicella M, De Luca C, Licameli A, Neri C, Pellegrino M, Simeone D and De Santis M, 2018. Chronic exposure to high doses of selenium in the first trimester of pregnancy: case report and brief literature review. Birth Defects Res, 110, 372–375. 10.1002/bdr2.1148 [DOI] [PubMed] [Google Scholar]
- Demirci A, Pometto AL 3rd and Cox DJ, 1999. Enhanced organically bound selenium yeast production by fed‐batch fermentation. Journal of Agricultural and Food Chemistry, 47, 2496–2500. [DOI] [PubMed] [Google Scholar]
- Dinh QT, Cui Z, Huang J, Tran TAT, Wang D, Yang W, Zhou F, Wang M, Yu D and Liang D, 2018. Selenium distribution in the Chinese environment and its relationship with human health: a review. Environment International, 112, 294–309. 10.1016/j.envint.2017.12.035 [DOI] [PubMed] [Google Scholar]
- Doherty BT, Romano ME, Gui J, Punshon T, Jackson BP, Karagas MR and Korrick SA, 2020. Periconceptional and prenatal exposure to metal mixtures in relation to behavioral development at 3 years of age. Environmental Epidemiology, 4, e0106. 10.1097/EE9.0000000000000106 [DOI] [PMC free article] [PubMed] [Google Scholar]
- Dosary B, Schwartz M, Sutter M and Morgan B, 2009. Subacute selenium toxicity from a nutritional supplement. Clinical Toxicology, 47, 745. [DOI] [PubMed] [Google Scholar]
- Duffield‐Lillico AJ, Dalkin BL, Reid ME, Turnbull BW, Slate EH, Jacobs ET, Marshall JR and Clark LC, 2003a. Selenium supplementation, baseline plasma selenium status and incidence of prostate cancer: an analysis of the complete treatment period of the Nutritional Prevention of Cancer Trial. British Journal of Urology International, 91, 608–612. 10.1046/j.1464-410x.2003.04167.x [DOI] [PubMed] [Google Scholar]
- Duffield‐Lillico AJ, Reid ME, Turnbull BW, Combs GF Jr, Slate EH, Fischbach LA, Marshall JR and Clark LC, 2002. Baseline characteristics and the effect of selenium supplementation on cancer incidence in a randomized clinical trial: a summary report of the Nutritional Prevention of Cancer Trial. Cancer Epidemiology, Biomarkers and Prevention, 11, 630–639. [PubMed] [Google Scholar]
- Duffield‐Lillico AJ, Slate EH, Reid ME, Turnbull BW, Wilkins PA, Combs GF Jr, Park HK, Gross EG, Graham GF, Stratton MS, Marshall JR, Clark LC and the Nutritional Prevention of Cancer Study Group , 2003b. Selenium supplementation and secondary prevention of nonmelanoma skin cancer in a randomized trial. Journal of the National Cancer Institute, 95, 1477–1481. 10.1093/jnci/djg061 [DOI] [PubMed] [Google Scholar]
- Duffield AJ and Thomson CD, 1999. A comparison of methods of assessment of dietary selenium intakes in Otago, New Zealand. British Journal of Nutrition, 82, 131–138. 10.1017/s0007114599001282 [DOI] [PubMed] [Google Scholar]
- Duffield AJ, Thomson CD, Hill KE and Williams S, 1999. An estimation of selenium requirements for New Zealanders. American Journal of Clinical Nutrition, 70, 896–903. 10.1093/ajcn/70.5.896 [DOI] [PubMed] [Google Scholar]
- Eaton CB, Abdul Baki AR, Waring ME, Roberts MB and Lu B, 2010. The association of low selenium and renal insufficiency with coronary heart disease and all‐cause mortality: NHANES III follow‐up study. Atherosclerosis, 212, 689–694. 10.1016/j.atherosclerosis.2010.07.008 [DOI] [PubMed] [Google Scholar]
- EFSA (European Food Safety Authority) , 2010. Application of systematic review methodology to food and feed safety assessments to support decision making. EFSA Journal 2010;8(6):1637, 90 pp. 10.2903/j.efsa.2010.1637 [DOI] [Google Scholar]
- EFSA (European Food Safety Authority) , 2015. Scientific report on principles and process for dealing with data and evidence in scientific assessments. EFSA Journal 2015;13(5):4121, 35 pp. 10.2903/j.efsa.2015.4121 [DOI] [Google Scholar]
- EFSA (European Food Safety Authority) , 2020. Draft framework for protocol development for EFSA's scientific assessments. EFSA supporting publication 2020;17(4):EN‐1843, 46 pp. 10.2903/sp.efsa.2020.EN-1843 [DOI]
- EFSA (European Food Safety Authority) , 2022. Protocol for the intake assessments performed in the context of the revision of Tolerable Upper Intake Levels for selected nutrients. EFSA supporting publication 2022:e200801. 10.2903/sp.efsa.2022.e200801 [DOI] [Google Scholar]
- EFSA AFC Panel (EFSA Panel on Food Additives, Flavourings, Processing Aids and Materials in Contact with Food) , 2008. Selenium‐enriched yeast as source for selenium added for nutritional purposes in foods for particular nutritional uses and foods (including food supplements) for the general population. EFSA Journal 2008;6(7):766, 42 pp. 10.2903/j.efsa.2008.766 [DOI] [PMC free article] [PubMed] [Google Scholar]
- EFSA ANS Panel (EFSA Panel on Food Additives and Nutrient Sources added to Food) , 2009a. Chromium(III)‐, iron(II)‐ and selenium‐humic acid/fulvic acid chelate and supplemented humifulvate added for nutritional purposes to food supplements EFSA Journal 2009;7(6):1147, 36 pp. 10.2903/j.efsa.2009.1147 [DOI] [Google Scholar]
- EFSA ANS Panel (EFSA Panel on Food Additives and Nutrient Sources added to Food) , 2009b. L‐selenomethionine as a source of selenium added for nutritional purposes to food supplements. EFSA Journal 2009;7(7):1082, 38 pp. 10.2903/j.efsa.2009.1082 [DOI] [Google Scholar]
- EFSA ANS Panel (EFSA Panel on Food Additives and Nutrient Sources added to Food) , 2009c. Se‐methyl‐L‐selenocysteine added as a source of selenium for nutritional purposes to food supplements. EFSA Journal 2009;7:1067, 23 pp. 10.2903/j.efsa.2009.1067 [DOI] [Google Scholar]
- EFSA ANS Panel (EFSA Panel on Food Additives and Nutrient Sources added to Food) , 2009d. Selenious acid as a source of selenium added for nutritional purposes to food supplements. EFSA Journal 2009;7(4):1009, 17 pp. 10.2903/j.efsa.2009.1009 [DOI] [Google Scholar]
- EFSA FEEDAP Panel (EFSA Panel on Additives and Products or Substances used in Animal Feed) , 2013a. Scientific Opinion on safety and efficacy of hydroxy‐analogue of selenomethionine as feed additive for all species. EFSA Journal 2013;11(1):3046, 30 pp. 10.2903/j.efsa.2013.3046 [DOI] [Google Scholar]
- EFSA FEEDAP Panel (EFSA Panel on Additives and Products or Substances used in Animal Feed) , 2013b. Scientific Opinion on the safety and efficacy of L‐selenomethionine as feed additive for all animal species. EFSA Journal 2013;11(5):3219, 18 pp. 10.2903/j.efsa.2013.3219 [DOI] [Google Scholar]
- EFSA FEEDAP Panel (EFSA Panel on Additives and Products or Substances used in Animal Feed) , 2015. Scientific Opinion on the safety and efficacy of selenium compounds (E8) as feed additives for all animal species: sodium selenite (coated granulated preparation), based on a dossier submitted by Doxal Italia S.p.A. EFSA Journal 2015;13(11):4271, 27 pp. 10.2903/j.efsa.2015.4271 [DOI] [Google Scholar]
- EFSA FEEDAP Panel (EFSA Panel on Additives and Products or Substances used in Animal Feed) , 2016a. Safety and efficacy of selenium‐enriched yeast (Saccharomyces cerevisiae NCYC R397) for all animal species. EFSA Journal 2016;14(11):4624, 10 pp. 10.2903/j.efsa.2016.4624 [DOI] [Google Scholar]
- EFSA FEEDAP Panel (EFSA Panel on Additives and Products or Substances used in Animal Feed) , 2016b. Safety and efficacy of selenium compounds (E8) as feed additives for all animal species: sodium selenite, based on a dossier submitted by Retorte GmbH Selenium Chemicals and Metals. EFSA Journal 2016;14(2):4398, 26 pp. 10.2903/j.efsa.2016.4398 [DOI] [Google Scholar]
- EFSA FEEDAP Panel (EFSA Panel on Additives and Products or Substances used in Animal Feed) , 2016c. Safety and efficacy of selenium compounds (E8) as feed additives for all animal species: sodium selenite, based on a dossier submitted by Todini and Co SpA EFSA Journal 2016;14(3):4442, 24 pp. 10.2903/j.efsa.2016.4442 [DOI] [Google Scholar]
- EFSA FEEDAP Panel (EFSA Panel on Additives and Products or Substances used in Animal Feed) , 2018a. Assessment of the application for renewal of authorisation of selenomethionine produced by Saccharomyces cerevisiae CNCM I‐3060 (selenised yeast inactivated) for all animal species. EFSA Journal 2018;16(7):5386, 14 pp. 10.2903/j.efsa.2018.5386 [DOI] [PMC free article] [PubMed] [Google Scholar]
- EFSA FEEDAP Panel (EFSA Panel on Additives and Products or Substances used in Animal Feed) , 2018b. Safety and efficacy of Zinc‐L‐Selenomethionine as feedadditive for all animal species. EFSA Journal 2018;16(3):5197, 18 pp. 10.2903/j.efsa.2018.5197 [DOI] [Google Scholar]
- EFSA FEEDAP Panel (EFSA Panel on Additives and Products or Substances used in Animal Feed) , 2019a. Assessment of the application for renewal of authorisation of selenomethionine produced by Saccharomyces cerevisiae NCYC R397 for all animal species. EFSA Journal 2019;17(1):5539, 16 pp. 10.2903/j.efsa.2019.5539 [DOI] [PMC free article] [PubMed] [Google Scholar]
- EFSA FEEDAP Panel (EFSA Panel on Additives and Products or Substances used in Animal Feed) , 2019b. Safety and efficacy of sodium selenate as feed additive forruminants. EFSA Journal 2019;17(7):5788, 20 pp. 10.2903/j.efsa.2019.5788 [DOI] [PMC free article] [PubMed] [Google Scholar]
- EFSA FEEDAP Panel (EFSA Panel on Additives and Products or Substances used in Animal Feed) , 2021. Safety and efficacy of the feed additive consisting of selenium‐enriched yeast (Saccharomyces cerevisiae CNCM I‐3060) for all animal species (Alltech Ireland). EFSA Journal 2021;19(12):6979, 10 pp. 10.2903/j.efsa.2021.6979 [DOI] [PMC free article] [PubMed] [Google Scholar]
- EFSA NDA Panel (EFSA Panel on Dietetic Products, Nutrition and Allergies) , 2014. Scientific Opinion on Dietary Reference Values for selenium. EFSA Journal 2014;12(10):3846, 67 pp. 10.2903/j.efsa.2014.3846 [DOI] [Google Scholar]
- EFSA NDA Panel (EFSA Panel on Nutrition, Novel Foods and Food Allergens) , 2022. Guidance for establishing and applying tolerable upper intake levels for vitamins and essential minerals. EFSA Journal 2022;20(1):e200102, 27 pp. 10.2903/j.efsa.2022.e200102. [DOI] [PMC free article] [PubMed] [Google Scholar]
- EFSA Scientific Committee , 2011. Statistical significance and biological relevance. EFSA Journal 2011;9(9):2372, 17 pp. 10.2903/j.efsa.2011.2372 [DOI] [Google Scholar]
- EFSA Scientific Committee , 2017a. Guidance on the assessment of the biological relevance of data in scientific assessments. EFSA Journal 2017;15(8):4970, 73 pp. 10.2903/j.efsa.2017.4970 [DOI] [PMC free article] [PubMed] [Google Scholar]
- EFSA Scientific Committee , 2017b. Guidance on the risk assessment of substances present in food intended forinfants below 16 weeks of age. EFSA Journal 2017;15(5):4849, 58 pp. 10.2903/j.efsa.2017.4849 [DOI] [PMC free article] [PubMed] [Google Scholar]
- EFSA Scientific Committee , 2017c. Guidance on the use of the weight of evidence approach in scientific assessments. EFSA Journal 2017;15(8):4971, 69 pp. 10.2903/j.efsa.2017.4971 [DOI] [PMC free article] [PubMed] [Google Scholar]
- EFSA Scientific Committee , 2018. Guidance on uncertainty analysis in scientific assessments. EFSA Journal 2018;16(1):5123, 39 pp. 10.2903/j.efsa.2018.5123 [DOI] [PMC free article] [PubMed] [Google Scholar]
- EFSA Scientific Committee , 2020. Draft for internal testing Scientific Committee guidance on appraising and integrating evidence from epidemiological studies for use in EFSA's scientific assessments. EFSA Journal 2020;18(8):6221, 83 pp. 10.2903/j.efsa.2020.6221 [DOI] [PMC free article] [PubMed] [Google Scholar]
- EVM (Expert Group on Vitamins and Minerals) , 2003. Safe upper levels for vitamins and minerals. Food Standards Agency. 360. [Google Scholar]
- Fairris GM, Lloyd B, Hinks L, Perkins PJ and Clayton BE, 1989. The effect of supplementation with selenium and vitamin‐E in psoriasis. Annals of Clinical Biochemistry, 26, 83–88. 10.1177/000456328902600113 [DOI] [PubMed] [Google Scholar]
- Fairweather‐Tait SJ, Bao Y, Broadley MR, Collings R, Ford D, Hesketh JE and Hurst R, 2011. Selenium in human health and disease. Antioxidants and Redox Signalling, 14, 1337–1383. 10.1089/ars.2010.3275 [DOI] [PubMed] [Google Scholar]
- FAO/WHO (Food and Agriculture Organization of the United Nations/World Health Organization) , 2009. Principles and Methods for the Risk Assessment of Chemicals in Food. Environmental Health Criteria, 240, R41. [Google Scholar]
- Filippini T, Ferrari A, Michalke B, Grill P, Vescovi L, Salvia C, Malagoli C, Malavolti M, Sieri S, Krogh V, Bargellini A, Martino A, Ferrante M and Vinceti M, 2017. Toenail selenium as an indicator of environmental exposure: A cross‐sectional study. Molecular Medicine Reports, 15, 3405–3412. 10.3892/mmr.2017.6388 [DOI] [PubMed] [Google Scholar]
- Filippini T, Michalke B, Wise LA, Malagoli C, Malavolti M, Vescovi L, Salvia C, Bargellini A, Sieri S, Krogh V, Ferrante M and Vinceti M, 2018. Diet composition and serum levels of selenium species: a cross‐sectional study. Food and Chemical Toxicology, 115, 482–490. 10.1016/j.fct.2018.03.048 [DOI] [PubMed] [Google Scholar]
- Finnish Institute for Health and Welfare , online, 2022. Fineli, National Food Composition Database. Available online: https://fineli.fi [Accessed: 3 August 2022].
- Fisinin VI, Papazyan TT and Surai PF, 2008. Producing specialist poultry products to meet human nutrition requirements: selenium enriched eggs. World's Poultry Science Journal, 64, 85–97. [Google Scholar]
- Fordyce FM, 2013. Selenium deficiency and toxicity in the environment. In: Selinus O (ed.). Essentials of Medical Geology. Revised Edition. Springer, Dordrecht, The Netherlands. pp. 375–416. [Google Scholar]
- FSA (Food Safety Authority of Ireland) , 2016. Report on a Total Diet Study carried out by the Food Safety Authority of Ireland in the period 2012–2014. Monitoring and Surveillance Series, 129 pp.
- FSCJ (Food Safety Commission of Japan) , 2012. Selenium in beverages: Risk assessment report. 5 pp.
- Fukumoto Y, Yamada H, Matsuhashi K, Okada W, Tanaka Y, Suzuki N and Ogra Y, 2020. Production of a urinary selenium metabolite, trimethylselenonium, by thiopurine S‐methyltransferase and indolethylamine N‐methyltransferase. Chemical Research in Toxicology, 33, 2467–2474. 10.1021/acs.chemrestox.0c00254 [DOI] [PubMed] [Google Scholar]
- Galan‐Chilet I, Grau‐Perez M, De Marco G, Guallar E, Martin‐Escudero JC, Dominguez‐Lucas A, Gonzalez‐Manzano I, Lopez‐Izquierdo R, Briongos‐Figuero LS, Redon J, Chaves FJ and Tellez‐Plaza M, 2017. A gene‐environment interaction analysis of plasma selenium with prevalent and incident diabetes: the Hortega study. Redox Biology, 12, 798–805. 10.1016/j.redox.2017.04.022 [DOI] [PMC free article] [PubMed] [Google Scholar]
- Gallagher ML, Webb P, Crounse R, Bray J and Webb A, 1984. Selenium levels in new growth hair and in whole blood during ingestion of a selenium supplement for six weeks. Nutrition Research, 4, 577–582. 10.1016/S0271-5317(84)80030-5 [DOI] [Google Scholar]
- Gao H, Hägg S, Sjögren P, Lambert PC, Ingelsson E and van Dam RM, 2014. Serum selenium in relation to measures of glucose metabolism and incidence of type 2 diabetes in an older Swedish population. Diabetic Medicine, 31, 787–793. 10.1111/dme.12429 [DOI] [PubMed] [Google Scholar]
- García‐Esquinas E, Carrasco‐Rios M, Ortolá R, Sotos Prieto M, Pérez‐Gómez B, Gutiérrez‐González E, Banegas JR, Queipo R, Olmedo P, Gil F, Tellez‐Plaza M, Navas‐Acien A, Pastor‐Barriuso R and Rodríguez‐Artalejo F, 2021. Selenium and impaired physical function in US and Spanish older adults. Redox Biology, 38, 101819. 10.1016/j.redox.2020.101819 [DOI] [PMC free article] [PubMed] [Google Scholar]
- Genaidy AM, Lemasters GK, Lockey J, Succop P, Deddens J, Sobeih T and Dunning K 2007. An epidemiological appraisal instrument ‐ a tool for evaluation of epidemiological studies. Ergonomics, 50, 920–960. 10.1080/00140130701237667 [DOI] [PubMed] [Google Scholar]
- Geybels MS, Verhage BA, van Schooten FJ, Goldbohm RA and van den Brandt PA, 2013. Advanced prostate cancer risk in relation to toenail selenium levels. Journal of the National Cancer Institute, 105, 1394–1401. 10.1093/jnci/djt186 [DOI] [PubMed] [Google Scholar]
- Giovannini S, Onder G, Lattanzio F, Bustacchini S, Di Stefano G, Moresi R, Russo A, Bernabei R and Landi F, 2018. Selenium concentrations and mortality among community‐dwelling older adults: results from IlSIRENTE study. Journal of Nutrition, Health and Aging, 22, 608–612. 10.1007/s12603-018-1021-9 [DOI] [PubMed] [Google Scholar]
- González S, Huerta JM, Fernández S, Patterson AM and Lasheras C, 2007. Homocysteine increases the risk of mortality in elderly individuals. British Journal of Nutrition, 97, 1138–1143. 10.1017/S0007114507691958 [DOI] [PubMed] [Google Scholar]
- Goodman GE, Schaffer S, Bankson DD, Hughes MP and Omenn GS, 2001. Predictors of serum selenium in cigarette smokers and the lack of association with lung and prostate cancer risk. Cancer Epidemiology, Biomarkers and Prevention, 10, 1069–1076. [PubMed] [Google Scholar]
- Grundmark B, Zethelius B, Garmo H and Holmberg L, 2011. Serum levels of selenium and smoking habits at age 50 influence long term prostate cancer risk; a 34 year ULSAM follow‐up. BMC Cancer, 11, 431. 10.1186/1471-2407-11-431 [DOI] [PMC free article] [PubMed] [Google Scholar]
- Ha HY, Alfulaij N, Berry MJ and Seale LA, 2019. From selenium absorption to selenoprotein degradation. Biological Trace Element Research, 192, 26–37. 10.1007/s12011-019-01771-x [DOI] [PMC free article] [PubMed] [Google Scholar]
- Hadrup N and Ravn‐Haren G, 2021. Absorption, distribution, metabolism and excretion (ADME) of oral selenium from organic and inorganic sources: A review. Journal of Trace Elements in Medicine and Biology, 67, 126801. 10.1016/j.jtemb.2021.126801 [DOI] [PubMed] [Google Scholar]
- Haldimann M, Venner TY and Zimmerli B, 1996. Determination of selenium in the serum of healthy Swiss adults and correlation to dietary intake. Journal of Trace Elements in Medicine and Biology, 10, 31–45. 10.1016/S0946-672X(96)80006-X [DOI] [PubMed] [Google Scholar]
- Hansen LB, Myhre JB and Andersen LF, 2017. UNGKOST 3. Landsomfattende kostholdsundersøkelse blant 4‐åringer i Norge, 2016. University of Oslo, Norwegian Food Safety Authority, Norwegian Directorate of Health, National Institute of Public Health, Oslo. 63 p. [Google Scholar]
- Hansen LB, Myhre JB, Johansen AMW, Paulsen MM and Andersen LF, 2016. UNGKOST 3. Landsomfattende kostholdsundersøkelse blant elever i 4. ‐og 8. klasse i Norge, 2015. University of Oslo, Norwegian Food Safety Authority, Norwegian Directorate of Health, National Institute of Public Health, 92 pp.
- Harmon JS, Bogdani M, Parazzoli SD, Mak SS, Oseid EA, Berghmans M, Leboeuf RC and Robertson RP, 2009. beta‐Cell‐specific overexpression of glutathione peroxidase preserves intranuclear MafA and reverses diabetes in db/db mice. Endocrinology, 150, 4855–4862. 10.1210/en.2009-0708 [DOI] [PMC free article] [PubMed] [Google Scholar]
- Hartman TJ, Albanes D, Pietinen P, Hartman AM, Rautalahti M, Tangrea JA and Taylor PR, 1998. The association between baseline vitamin E, selenium, and prostate cancer in the alpha‐tocopherol, beta‐carotene cancer prevention study. Cancer Epidemiology, Biomarkers and Prevention, 7, 335–340. [PubMed] [Google Scholar]
- Hawkes WC and Keim NL, 2003. Dietary selenium intake modulates thyroid hormone and energy metabolism in men. Journal of Nutrition, 133, 3443–3448. 10.1093/jn/133.11.3443 [DOI] [PubMed] [Google Scholar]
- Hawkes WC, Keim NL, Diane Richter B, Gustafson MB, Gale B, Mackey BE and Bonnel EL, 2008. High‐selenium yeast supplementation in free‐living North American men: no effect on thyroid hormone metabolism or body composition. Journal of Trace Elements in Medicine and Biology, 22, 131–142. 10.1016/j.jtemb.2007.11.005 [DOI] [PubMed] [Google Scholar]
- Hawkes WC, Kelley DS and Taylor PC, 2001. The effects of dietary selenium on the immune system in healthy men. Biological Trace Element Research, 81, 189–213. 10.1385/bter:81:3:189 [DOI] [PubMed] [Google Scholar]
- Heard JW, Walker GP, Royle PJ, McIntosh GH and Doyle PT, 2004. Effects of short‐term supplementation with selenised yeast on milk production and composition of lactating cows. Australian Journal of Dairy Technology, 59, 199–203. [Google Scholar]
- Heinen MM, Hughes MC, Ibiebele TI, Marks GC, Green AC and van der Pols JC, 2007. Intake of antioxidant nutrients and the risk of skin cancer. European Journal of Cancer, 43, 2707–2716. 10.1016/j.ejca.2007.09.005 [DOI] [PubMed] [Google Scholar]
- Helldan A, Raulio S, Kosola M, Tapanainen H, Ovaskainen M‐L, Virtanen S and National Institute for Health and Welfare , 2013. The National FINDIET 2012 Survey. Helsinki, Finland, 187 pp.
- Helzlsouer KJ, Huang HY, Alberg AJ, Hoffman S, Burke A, Norkus EP, Morris JS and Comstock GW, 2000. Association between alpha‐tocopherol, gamma‐tocopherol, selenium, and subsequent prostate cancer. Journal of the National Cancer Institute, 92, 2018–2023. 10.1093/jnci/92.24.2018 [DOI] [PubMed] [Google Scholar]
- Henríquez‐Sánchez P, Sánchez‐Villegas A, Ruano‐Rodríguez C, Gea A, Lamuela‐Raventós RM, Estruch R, Salas‐Salvadó J, Covas MI, Corella D, Schröder H, Gutiérrez‐Bedmar M, Santos‐Lozano JM, Pintó X, Arós F, Fiol M, Tresserra‐Rimbau A, Ros E, Martínez‐González MA and Serra‐Majem L, 2016. Dietary total antioxidant capacity and mortality in the PREDIMED study. European Journal of Nutrition, 55, 227–236. [DOI] [PubMed] [Google Scholar]
- Hoffman KS, Vargas‐Rodriguez O, Bak DW, Mukai T, Woodward LK, Weerapana E, Söll D and Reynolds NM, 2019. A cysteinyl‐tRNA synthetase variant confers resistance against selenite toxicity and decreases selenocysteine misincorporation. Journal of Biological Chemistry, 294, 12855–12865. 10.1074/jbc.RA119.008219 [DOI] [PMC free article] [PubMed] [Google Scholar]
- Hoppu U, Lehtisalo J, Tapanainen H and Pietinen P, 2010. Dietary habits and nutrient intake of Finnish adolesceents. Public Health Nutrition, 13, 965–972. [DOI] [PubMed] [Google Scholar]
- Hosnedlova B, Kepinska M, Skalickova S, Fernandez C, Ruttkay‐Nedecky B, Malevu TD, Sochor J, Baron M, Melcova M, Zidkova J and Kizek R, 2017. A summary of new findings on the biological effects of selenium in selected animal species – a critical review. International Journal of Molecular Sciences, 18. 10.3390/ijms18102209 [DOI] [PMC free article] [PubMed] [Google Scholar]
- Hosseinzadeh FM, Hosseinzadeh‐Attar MJ, Yekaninejad MS and Rashidi B, 2016. Effects of selenium supplementation on glucose homeostasis and free androgen index in women with polycystic ovary syndrome: A randomized, double blinded, placebo controlled clinical trial. Journal of Trace Elements in Medicine and Biology, 34, 56–61. 10.1016/j.jtemb.2016.01.002 [DOI] [PubMed] [Google Scholar]
- Howe CG, Margetaki K, Vafeiadi M, Roumeliotaki T, Karachaliou M, Kogevinas M, McConnell R, Eckel SP, Conti DV, Kippler M, Farzan SF and Chatzi L, 2021. Prenatal metal mixtures and child blood pressure in the Rhea mother‐child cohort in Greece. Environmental Health, 20, 1. [DOI] [PMC free article] [PubMed] [Google Scholar]
- Hunter DJ, Morris JS, Chute CG, Kushner E, Colditz GA, Stampfer MJ, Speizer FE and Willett WC, 1990. Predictors of selenium concentration in human toenails. American Journal of Epidemiology, 132, 114–122. 10.1093/oxfordjournals.aje.a115623 [DOI] [PubMed] [Google Scholar]
- Hurst R, Armah CN, Dainty JR, Hart DJ, Teucher B, Goldson AJ, Broadley MR, Motley AK and Fairweather‐Tait SJ, 2010. Establishing optimal selenium status: results of a randomized, double‐blind, placebo‐controlled trial. American Journal of Clinical Nutrition, 91, 923–931. 10.3945/ajcn.2009.28169 [DOI] [PMC free article] [PubMed] [Google Scholar]
- Hurst R, Collings R, Harvey LJ, King M, Hooper L, Bouwman J, Gurinovic M and Fairweather‐Tait SJ, 2013. EURRECA‐estimating selenium requirements for deriving dietary reference values. Critical Reviews in Food Science and Nutrition, 53, 1077–1096. 10.1080/10408398.2012.742861 [DOI] [PubMed] [Google Scholar]
- Ibrahim SAZ, Kerkadi A and Agouni A, 2019. Selenium and health: an update on the situation in the Middle East and North Africa. Nutrients, 11, 1457. 10.3390/nu11071457 [DOI] [PMC free article] [PubMed] [Google Scholar]
- IOM (Institute of Medicine) , 2000. Dietary Reference Intakes for Vitamin C, Vitamin E, Selenium, and Carotenoids. Food and Nutrition Board, National Academy Press, Washington, DC. 531 p. [Google Scholar]
- Isobe Y, Asakura H, Tsujiguchi H, Kannon T, Takayama H, Takeshita Y, Ishii K‐a, Kanamori T, Hara A, Yamashita T, Tajima A, Kaneko S, Nakamura H and Takamura T, 2021. Alcohol intake is associated with elevated serum levels of selenium and selenoprotein P in humans. Frontiers in Nutrition, 8. 10.3389/fnut.2021.633703 [DOI] [PMC free article] [PubMed] [Google Scholar]
- Jablonska E and Vinceti M, 2015. Selenium and human health: witnessing a copernican revolution? Journal of Environmental Science and Health. Part C, Environmental Carcinogenesis & Ecotoxicology Reviews, 33, 328–368. 10.1080/10590501.2015.1055163 [DOI] [PubMed] [Google Scholar]
- Jacobs ET, Lance P, Mandarino LJ, Ellis NA, Chow HHS, Foote J, Martinez JA, Hsu CHP, Batai K, Saboda K and Thompson PA, 2019. Selenium supplementation and insulin resistance in a randomized, clinical trial. British Medical Journal Open Diabetes Research & Care, 7, e000613. 10.1136/bmjdrc-2018-000613 [DOI] [PMC free article] [PubMed] [Google Scholar]
- Jäger T, Drexler H and Göen T, 2016a. Human metabolism and renal excretion of selenium compounds after oral ingestion of sodium selenate dependent on trimethylselenium ion (TMSe) status. Archives of Toxicology, 90, 149–158. 10.1007/s00204-014-1380-x [DOI] [PubMed] [Google Scholar]
- Jäger T, Drexler H and Göen T, 2016b. Human metabolism and renal excretion of selenium compounds after oral ingestion of sodium selenite and selenized yeast dependent on the trimethylselenium ion (TMSe) status. Archives of Toxicology, 90, 1069–1080. 10.1007/s00204-015-1548-z [DOI] [PubMed] [Google Scholar]
- Jamilian M, Razavi M, Kashan ZF, Ghandi Y, Bagherian T and Asemi Z, 2015. Metabolic response to selenium supplementation in women with polycystic ovary syndrome: a randomized, double‐blind, placebo‐controlled trial. Clinical Endocrinology, 82, 885–891. 10.1111/cen.12699 [DOI] [PubMed] [Google Scholar]
- Janghorbani M, Xia Y, Ha P, Whanger PD, Butler JA, Olesik JW and Daniels L, 1999. Quantitative significance of measuring trimethylselenonium in urine for assessing chronically high intakes of selenium in human subjects. British Journal of Nutrition, 82, 291–297. [PubMed] [Google Scholar]
- Jenny‐Burri J, Haldimann M and Dudler V, 2010. Estimation of selenium intake in Switzerland in relation to selected food groups. Food Additives and Contaminants, 27, 1516–1531. 10.1080/19440049.2010.506603 [DOI] [PubMed] [Google Scholar]
- Jiang L, Lu Y, Zheng L, Li G, Chen L, Zhang M, Ni J, Liu Q and Zhang Y, 2020. The algal selenoproteomes. BMC Genomics, 21, 699. 10.1186/s12864-020-07101-z [DOI] [PMC free article] [PubMed] [Google Scholar]
- Johnson CC, Fordyce FM and Rayman MP, 2010. Symposium on 'geographical and geological influences on nutrition': factors controlling the distribution of selenium in the environment and their impact on health and nutrition. Proceedings of the Nutrition Society, 69, 119–132. 10.1017/S0029665109991807 [DOI] [PubMed] [Google Scholar]
- Karagas MR, Greenberg ER, Nierenberg D, Stukel TA, Morris JS, Stevens MM and Baron JA, 1997. Risk of squamous cell carcinoma of the skin in relation to plasma selenium, alpha‐tocopherol, beta‐carotene, and retinol: a nested case‐control study. Cancer Epidemiology, Biomarkers and Prevention, 6, 25–29. [PubMed] [Google Scholar]
- Karamali M, Nourgostar S, Zamani A, Vahedpoor Z and Asemi Z, 2015. The favourable effects of long‐term selenium supplementation on regression of cervical tissues and metabolic profiles of patients with cervical intraepithelial neoplasia: a randomised, double‐blind, placebo‐controlled trial (Publication with Expression of Concern. See vol. 127, pg. 152, 2022). British Journal of Nutrition, 114, 2039–2045. 10.1017/s0007114515003852 [DOI] [PubMed] [Google Scholar]
- Karp DD, Lee SJ, Keller SM, Wright GS, Aisner S, Belinsky SA, Johnson DH, Johnston MR, Goodman G, Clamon G, Okawara G, Marks R, Frechette E, McCaskill‐Stevens W, Lippman SM, Ruckdeschel J and Khuri FR, 2013. Randomized, double‐blind, placebo‐controlled, phase III chemoprevention trial of selenium supplementation in patients with resected stage I non‐small‐cell lung cancer: ECOG 5597. Journal of Clinical Oncology, 31, 4179–4187. 10.1200/JCO.2013.49.2173 [DOI] [PMC free article] [PubMed] [Google Scholar]
- Katarzyna B, Taylor RM, Szpunar J, Lobinski R and Sunde RA, 2020. Identification and determination of selenocysteine, selenosugar, and other selenometabolites in Turkey liver. Metallomics, 12, 758–766. 10.1039/d0mt00040j [DOI] [PubMed] [Google Scholar]
- Kilander L, Berglund L, Boberg M, Vessby B and Lithell H, 2001. Education, lifestyle factors and mortality from cardiovascular disease and cancer. A 25‐year follow‐up of Swedish 50‐year‐old men. International Journal of Epidemiology, 30, 1119–1126. 10.1093/ije/30.5.1119 [DOI] [PubMed] [Google Scholar]
- Kippler M, Bottai M, Georgiou V, Koutra K, Chalkiadaki G, Kampouri M, Kyriklaki A, Vafeiadi M, Fthenou E, Vassilaki M, Kogevinas M, Vahter M and Chatzi L, 2016. Impact of prenatal exposure to cadmium on cognitive development at preschool age and the importance of selenium and iodine. European Journal of Epidemiology, 31, 1123–1134. 10.1007/s10654-016-0151-9 [DOI] [PMC free article] [PubMed] [Google Scholar]
- Klein EA, Thompson IM Jr, Tangen CM, Crowley JJ, Lucia MS, Goodman PJ, Minasian LM, Ford LG, Parnes HL, Gaziano JM, Karp DD, Lieber MM, Walther PJ, Klotz L, Parsons JK, Chin JL, Darke AK, Lippman SM, Goodman GE, Meyskens FL and Baker LH, 2011. Vitamin E and the risk of prostate cancer: the Selenium and Vitamin E Cancer Prevention Trial (SELECT). The Journal of the American Medical Association, 306, 1549–1556. 10.1001/jama.2011.1437 [DOI] [PMC free article] [PubMed] [Google Scholar]
- Knekt P, Aromaa A, Maatela J, Alfthan G, Aaran RK, Hakama M, Hakulinen T, Peto R and Teppo L, 1990. Serum selenium and subsequent risk of cancer among Finnish men and women. Journal of the National Cancer Institute, 82, 864–868. [DOI] [PubMed] [Google Scholar]
- Knekt P, Aromaa A, Maatela J, Alfthan G, Aaran RK, Nikkari T, Hakama M, Hakulinen T and Teppo L, 1991. Serum micronutrients and risk of cancers of low incidence in Finland. American Journal of Epidemiology, 134, 356–361. 10.1093/oxfordjournals.aje.a116097 [DOI] [PubMed] [Google Scholar]
- Kocyigit A, Erel O and Gur S, 2001. Effects of tobacco smoking on plasma selenium, zinc, copper and iron concentrations and related antioxidative enzyme activities. Clinical Biochemistry, 34, 629–633. 10.1016/s0009-9120(01)00271-5 [DOI] [PubMed] [Google Scholar]
- Krachler M, Prohaska T, Koellensperger G, Rossipal E and Stingeder G, 2000. Concentrations of selected trace elements in human milk and in infant formulas determined by magnetic sector field inductively coupled plasma‐mass spectrometry. Biological Trace Element Research, 76, 97–112. 10.1385/BTER:76:2:97 [DOI] [PubMed] [Google Scholar]
- Kremer D, Ilgen G and Feldmann J, 2005. GC‐ICP‐MS determination of dimethylselenide in human breath after ingestion of (77)Se‐enriched selenite: monitoring of in‐vivo methylation of selenium. Analytical and Bioanalytical Chemistry, 383, 509–515. 10.1007/s00216-005-0001-1 [DOI] [PubMed] [Google Scholar]
- Kristal AR, Arnold KB, Neuhouser ML, Goodman P, Platz EA, Albanes D and Thompson IM, 2010. Diet, supplement use, and prostate cancer risk: results from the prostate cancer prevention trial. American Journal of Epidemiology, 172, 566–577. 10.1093/aje/kwq148 [DOI] [PMC free article] [PubMed] [Google Scholar]
- Kristal AR, Darke AK, Morris JS, Tangen CM, Goodman PJ, Thompson IM, Meyskens FL Jr, Goodman GE, Minasian LM, Parnes HL, Lippman SM and Klein EA, 2014. Baseline selenium status and effects of selenium and vitamin e supplementation on prostate cancer risk. Journal of the National Cancer Institute, 106, djt456. 10.1093/jnci/djt456 [DOI] [PMC free article] [PubMed] [Google Scholar]
- Kryscio RJ, Abner EL, Caban‐Holt A, Lovell M, Goodman P, Darke AK, Yee M, Crowley J and Schmitt FA, 2017. Association of antioxidant supplement use and dementia in the Prevention of Alzheimer's Disease by Vitamin E and Selenium Trial (PREADViSE). The Journal of the American Medical Association Neurology, 74, 567–573. 10.1001/jamaneurol.2016.5778 [DOI] [PMC free article] [PubMed] [Google Scholar]
- Kuehnelt D, Engstrom K, Skroder H, Kokarnig S, Schlebusch C, Kippler M, Alhamdow A, Nermell B, Francesconi K, Broberg K and Vahter M, 2015. Selenium metabolism to the trimethylselenonium ion (TMSe) varies markedly because of polymorphisms in the indolethylamine N‐methyltransferase gene. American Journal of Clinical Nutrition, 102, 1406–1415. 10.3945/ajcn.115.114157 [DOI] [PubMed] [Google Scholar]
- Kuehnelt D, Juresa D, Francesconi KA, Fakih M and Reid ME, 2007. Selenium metabolites in urine of cancer patients receiving L‐selenomethionine at high doses. Toxicology and Applied Pharmacology, 220, 211–215. 10.1016/j.taap.2007.01.005 [DOI] [PubMed] [Google Scholar]
- Kuehnelt D, Kienzl N, Traar P, Le NH, Francesconi KA and Ochi T, 2005. Selenium metabolites in human urine after ingestion of selenite, L‐selenomethionine, or DL‐selenomethionine: a quantitative case study by HPLC/ICPMS. Analytical and Bioanalytical Chemistry, 383, 235–246. 10.1007/s00216-005-0007-8 [DOI] [PubMed] [Google Scholar]
- Kukk M, Kanarbik MT and National Institute for Health Development , 2021. Intake of Selected Micronutrients by the Estonian Population. NIHD, Tallinn. [Google Scholar]
- Kupsco A, Kioumourtzoglou MA, Just AC, Amarasiriwardena C, Estrada‐Gutierrez G, Cantoral A, Sanders AP, Braun JM, Svensson K, Brennan KJM, Oken E, Wright RO, Baccarelli AA and Téllez‐Rojo MM, 2019. Prenatal metal concentrations and childhood cardiometabolic risk using Bayesian kernel machine regression to assess mixture and interaction effects. Epidemiology, 30, 263–273. 10.1097/EDE.0000000000000962 [DOI] [PMC free article] [PubMed] [Google Scholar]
- Labunskyy VM, Hatfield DL and Gladyshev VN, 2014. Selenoproteins: molecular pathways and physiological roles. Physiological Reviews, 94, 739–777. 10.1152/physrev.00039.2013 [DOI] [PMC free article] [PubMed] [Google Scholar]
- Lajin B and Francesconi KA, 2016. The association between the urinary excretion of trimethylselenonium and trimethylsulfonium in humans. PLoS One, 11, e0167013. 10.1371/journal.pone.0167013 [DOI] [PMC free article] [PubMed] [Google Scholar]
- Lajin B, Kuehnelt D and Francesconi KA, 2016a. Exploring the urinary selenometabolome following a multi‐phase selenite administration regimen in humans. Metallomics, 8, 774–781. 10.1039/c6mt00051g [DOI] [PubMed] [Google Scholar]
- Lajin B, Kuehnelt D, Jensen KB and Francesconi KA, 2016b. Investigating the intra‐individual variability in the human metabolic profile of urinary selenium. Journal of Trace Elements in Medicine and Biology, 37, 31–36. 10.1016/j.jtemb.2016.06.008 [DOI] [PubMed] [Google Scholar]
- Larvie DY, Doherty JL, Donati GL and Armah SM, 2019. Relationship between selenium and hematological markers in young adults with normal weight or overweight/obesity. Antioxidants, 8. 10.3390/antiox8100463 [DOI] [PMC free article] [PubMed] [Google Scholar]
- Lauretani F, Semba RD, Bandinelli S, Ray AL, Ruggiero C, Cherubini A, Guralnik JM and Ferrucci L, 2008. Low plasma selenium concentrations and mortality among older community‐dwelling adults: the InCHIANTI Study. Aging Clinical and Experimental Research, 20, 153–158. 10.1007/BF03324762 [DOI] [PMC free article] [PubMed] [Google Scholar]
- LeBlanc KL, Kumkrong P, Mercier PHJ and Mester Z, 2018. Selenium analysis in waters. Part 2: Speciation methods. Science of the Total Environment, 640–641, 1635–1651. 10.1016/j.scitotenv.2018.05.394 [DOI] [PubMed] [Google Scholar]
- Lemire M, Philibert A, Fillion M, Passos CJS, Guimarães JRD, Barbosa F Jr and Mergler D, 2012. No evidence of selenosis from a selenium‐rich diet in the Brazilian Amazon. Environ Int, 40, 128–136. 10.1016/j.envint.2011.07.005 [DOI] [PubMed] [Google Scholar]
- Lemming EW, Moraeus L, Sipinen JP and Lindroos AK, 2018. Riksmaten ungdom 2016‐17 – Del 2 – Näringsintag och näringsstatus bland ungdomar i Sverige. Livsmedelverkets rapportserie nr 23/2018, Uppsala, Sweden, 79 pp.
- Levander OA, Alfthan G, Arvilommi H, Gref CG, Huttunen JK, Kataja M, Koivistoinen P and Pikkarainen J, 1983. Bioavailability of selenium to Finnish men as assessed by platelet glutathione peroxidase activity and other blood parameters. American Journal of Clinical Nutrition, 37, 887–897. 10.1093/ajcn/37.6.887 [DOI] [PubMed] [Google Scholar]
- Li C, Xia W, Jiang Y, Liu W, Zhang B, Xu S and Li Y, 2020a. Low level prenatal exposure to a mixture of Sr, Se and Mn and neurocognitive development of 2‐year‐old children. Science of the Total Environment, 735, 139403. 10.1016/j.scitotenv.2020.139403 [DOI] [PubMed] [Google Scholar]
- Li H, Stampfer MJ, Giovannucci EL, Morris JS, Willett WC, Gaziano JM and Ma J, 2004. A prospective study of plasma selenium levels and prostate cancer risk. Journal of the National Cancer Institute, 96, 696–703. 10.1093/jnci/djh125 [DOI] [PubMed] [Google Scholar]
- Li J, Lo K, Shen G, Feng YQ and Huang YQ, 2020b. Gender difference in the association of serum selenium with all‐cause and cardiovascular mortality. Postgraduate Medicine, 132, 148–155. 10.1080/00325481.2019.1701864 [DOI] [PubMed] [Google Scholar]
- Lima LW, Stonehouse GC, Walters C, El Mehdawi AF, Fakra SC and Pilon‐Smits EAH, 2019. Selenium accumulation, speciation and localization in Brazil Nuts (Bertholletia excelsa H.B.K.). Plants‐Basel, 8. 10.3390/plants8080289 [DOI] [PMC free article] [PubMed] [Google Scholar]
- Lipiec E, Siara G, Bierla K, Ouerdane L and Szpunar J, 2010. Determination of selenomethionine, selenocysteine, and inorganic selenium in eggs by HPLC‐inductively coupled plasma mass spectrometry. Analytical and Bioanalytical Chemistry, 397, 731–741. 10.1007/s00216-010-3544-8 [DOI] [PubMed] [Google Scholar]
- Lippman SM, Klein EA, Goodman PJ, Lucia MS, Thompson IM, Ford LG, Parnes HL, Minasian LM, Gaziano JM, Hartline JA, Parsons JK, Bearden JD 3rd, Crawford ED, Goodman GE, Claudio J, Winquist E, Cook ED, Karp DD, Walther P, Lieber MM, Kristal AR, Darke AK, Arnold KB, Ganz PA, Santella RM, Albanes D, Taylor PR, Probstfield JL, Jagpal TJ, Crowley JJ, Meyskens FL Jr, Baker LH and Coltman CA Jr, 2009. Effect of selenium and vitamin E on risk of prostate cancer and other cancers: the Selenium and Vitamin E Cancer Prevention Trial (SELECT). The Journal of the American Medical Association, 301, 39–51. 10.1001/jama.2008.864 [DOI] [PMC free article] [PubMed] [Google Scholar]
- Lloyd B, Lloyd RS and Clayton BE, 1983. Effect of smoking, alcohol, and other factors on the selenium status of a healthy population. Journal of Epidemiology and Community Health, 37, 213–217. 10.1136/jech.37.3.213 [DOI] [PMC free article] [PubMed] [Google Scholar]
- Loh K, Deng H, Fukushima A, Cai X, Boivin B, Galic S, Bruce C, Shields BJ, Skiba B, Ooms LM, Stepto N, Wu B, Mitchell CA, Tonks NK, Watt MJ, Febbraio MA, Crack PJ, Andrikopoulos S and Tiganis T, 2009. Reactive oxygen species enhance insulin sensitivity. Cell Metabolism, 10, 260–272. 10.1016/j.cmet.2009.08.009 [DOI] [PMC free article] [PubMed] [Google Scholar]
- Longnecker MP, Stampfer MJ, Morris JS, Spate V, Baskett C, Mason M and Willett WC, 1993. A 1‐y trial of the effect of high‐selenium bread on selenium concentrations in blood and toenails. American Journal of Clinical Nutrition, 57, 408–413. 10.1093/ajcn/57.3.408 [DOI] [PubMed] [Google Scholar]
- Longnecker MP, Stram DO, Taylor PR, Levander OA, Howe M, Veillon C, McAdam PA, Patterson KY, Holden JM, Morris JS, Swanson CA and Willett WC, 1996. Use of selenium concentration in whole blood, serum, toenails, or urine as a surrogate measure of selenium intake. Epidemiology, 7, 384–390. 10.1097/00001648-199607000-00008 [DOI] [PubMed] [Google Scholar]
- Longnecker MP, Taylor PR, Levander OA, Howe M, Veillon C, McAdam PA, Patterson KY, Holden JM, Stampfer MJ, Morris JS and Willett WC, 1991. Selenium in diet, blood, and toenails in relation to human health in a seleniferous area. American Journal of Clinical Nutrition, 53, 1288–1294. 10.1093/ajcn/53.5.1288 [DOI] [PubMed] [Google Scholar]
- Loomba R, Filippini T, Chawla R, Chaudhary R, Cilloni S, Datt C, Singh S, Dhillon KS and Vinceti M, 2020. Exposure to a high selenium environment in Punjab, India: effects on blood chemistry. Science of the Total Environment, 716, 135347. 10.1016/j.scitotenv.2019.135347 [DOI] [PubMed] [Google Scholar]
- Lv Q, Liang X, Nong K, Gong Z, Qin T, Qin X, Wang D and Zhu Y, 2021. Advances in research on the toxicological effects of selenium. Bulletin of Environmental Contamination and Toxicology, 106, 715–726. 10.1007/s00128-020-03094-3 [DOI] [PubMed] [Google Scholar]
- MacFarquhar JK, Broussard DL, Melstrom P, Hutchinson R, Wolkin A, Martin C, Burk RF, Dunn JR, Green AL, Hammond R, Schaffner W and Jones TF, 2010. Acute selenium toxicity associated with a dietary supplement. Archives of Internal Medicine, 170, 256–261. 10.1001/archinternmed.2009.495 [DOI] [PMC free article] [PubMed] [Google Scholar]
- Mao J and Teng W, 2013. The relationship between selenoprotein P and glucose metabolism in experimental studies. Nutrients, 5, 1937–1948. 10.3390/nu5061937 [DOI] [PMC free article] [PubMed] [Google Scholar]
- Marshall JR, Tangen CM, Sakr WA, Wood DP Jr, Berry DL, Klein EA, Lippman SM, Parnes HL, Alberts DS, Jarrard DF, Lee WR, Gaziano JM, Crawford ED, Ely B, Ray M, Davis W, Minasian LM and Thompson IM Jr, 2011. Phase III trial of selenium to prevent prostate cancer in men with high‐grade prostatic intraepithelial neoplasia: SWOG S9917. Cancer Prevention Research, 4, 1761–1769. 10.1158/1940-6207.CAPR-10-0343 [DOI] [PMC free article] [PubMed] [Google Scholar]
- Martens IB, Cardoso BR, Hare DJ, Niedzwiecki MM, Lajolo FM, Martens A and Cozzolino SM, 2015. Selenium status in preschool children receiving a Brazil nut‐enriched diet. Nutrition, 31, 1339–1343. 10.1016/j.nut.2015.05.005 [DOI] [PubMed] [Google Scholar]
- Martin RF, Janghorbani M and Young VR, 1989. Experimental selenium restriction in healthy adult humans – Changes in selenium metabolism studied with stable‐isotope methodology. American Journal of Clinical Nutrition, 49, 854–861. 10.1093/ajcn/49.5.854 [DOI] [PubMed] [Google Scholar]
- Matthews NH, Koh M, Li WQ, Li T, Willett WC, Stampfer MJ, Christiani DC, Morris JS, Qureshi AA and Cho E, 2019. A prospective study of toenail trace element levels and risk of skin cancer. Cancer Epidemiology, Biomarkers and Prevention, 28, 1534–1543. 10.1158/1055-9965.EPI-19-0214 [DOI] [PMC free article] [PubMed] [Google Scholar]
- McClung JP, Roneker CA, Mu W, Lisk DJ, Langlais P, Liu F and Lei XG, 2004. Development of insulin resistance and obesity in mice overexpressing cellular glutathione peroxidase. Proceedings of the National Academy of Sciences of the United States of America, 101, 8852–8857. 10.1073/pnas.0308096101 [DOI] [PMC free article] [PubMed] [Google Scholar]
- Mehdi Y, Hornick JL, Istasse L and Dufrasne I, 2013. Selenium in the environment, metabolism and involvement in body functions. Molecules, 18, 3292–3311. 10.3390/molecules18033292 [DOI] [PMC free article] [PubMed] [Google Scholar]
- Meplan C, Crosley LK, Nicol F, Beckett GJ, Howie AF, Hill KE, Horgan G, Mathers JC, Arthur JR and Hesketh JE, 2007. Genetic polymorphisms in the human selenoprotein P gene determine the response of selenoprotein markers to selenium supplementation in a gender‐specific manner (the SELGEN study). FASEB Journal, 21, 3063–3074. 10.1096/fj.07-8166com [DOI] [PubMed] [Google Scholar]
- Mesdaghinia E, Rahavi A, Bahmani F, Sharifi N and Asemi Z, 2017. Clinical and metabolic response to selenium supplementation in pregnant women at risk for intrauterine growth restriction: Randomized, double‐blind, placebo‐controlled trial. Biological Trace Element Research, 178, 14–21. 10.1007/s12011-016-0911-0 [DOI] [PubMed] [Google Scholar]
- Miklavcic A, Casetta A, Snoj Tratnik J, Mazej D, Krsnik M, Mariuz M, Sofianou K, Spiric Z, Barbone F and Horvat M, 2013. Mercury, arsenic and selenium exposure levels in relation to fish consumption in the Mediterranean area. Environmental Research, 120, 7–17. 10.1016/j.envres.2012.08.010 [DOI] [PubMed] [Google Scholar]
- Miller L, Mills BJ, Blotcky AJ and Lindeman RD, 1983. Red blood cell and serum selenium concentrations as influenced by age and selected diseases. Journal of the American College of Nutrition, 2, 331–341. 10.1080/07315724.1983.10719930 [DOI] [PubMed] [Google Scholar]
- Misra S, Boylan M, Selvam A, Spallholz JE and Bjornstedt M, 2015. Redox‐active selenium compounds‐From toxicity and cell death to cancer treatment. Nutrients, 7, 3536–3556. 10.3390/nu7053536 [DOI] [PMC free article] [PubMed] [Google Scholar]
- Misu H, Takamura T, Takayama H, Hayashi H, Matsuzawa‐Nagata N, Kurita S, Ishikura K, Ando H, Takeshita Y, Ota T, Sakurai M, Yamashita T, Mizukoshi E, Yamashita T, Honda M, Miyamoto K, Kubota T, Kubota N, Kadowaki T, Kim HJ, Lee IK, Minokoshi Y, Saito Y, Takahashi K, Yamada Y, Takakura N and Kaneko S, 2010. A liver‐derived secretory protein, selenoprotein P, causes insulin resistance. Cell Metabolism, 12, 483–495. 10.1016/j.cmet.2010.09.015 [DOI] [PubMed] [Google Scholar]
- Mitsopoulou AV, Magriplis E, Dimakopoulos I, Karageorgou D, Bakogianni I, Micha R, Michas G, Chourdakis M, Ntouroupi T, Tsaniklidou SM, Argyri K, Panagiotakos DB and Zampelas A, 2020. Micronutrient intakes and their food sources among Greek children and adolescents. Public Health Nutrition, 23, 2314–2326. 10.1017/s136898001900449x [DOI] [PMC free article] [PubMed] [Google Scholar]
- Mitsopoulou AV, Magriplis E, Michas G, Micha R, Chourdakis M, Chrousos GP, Roma E, Panagiotakos DB, Zampelas A, Karageorgou D, Bakogianni I, Dimakopoulos I, Ntouroupi T, Tsaniklidou SM, Argyri K, Fappa E, Theodoraki EM, Trichia E, Sialvera TE, Varytimiadi A, Spyreli E, Koutelidakis A, Karlis G, Zacharia S, Papageorgiou A, Dedoussis G, Dimitriadis G and Manios I, 2021. Micronutrient dietary intakes and their food sources in adults: the Hellenic National Nutrition and Health Survey (HNNHS). Journal of Human Nutrition and Dietetics, 34, 616–628. 10.1111/jhn.12840 [DOI] [PubMed] [Google Scholar]
- Močenić I, Kolić I, Nišević JR, Belančić A, Tratnik JS, Mazej D, Falnoga I, Vlašić‐Cicvarić I, Štimac T, Špirić Z, Horvat M and Prpić I, 2019. Prenatal selenium status, neonatal cerebellum measures and child neurodevelopment at the age of 18 months. Environmental Research, 176, 108529. 10.1016/j.envres.2019.108529 [DOI] [PubMed] [Google Scholar]
- Mora ML, Durán P, Acuña J, Cartes P, Demanet R and Gianfreda L, 2015. Improving selenium status in plant nutrition and quality. Journal of Soil Science and Plant Nutrition, 15, 486–503. [Google Scholar]
- Morris JS and Crane SB, 2013. Selenium toxicity from a misformulated dietary supplement, adverse health effects, and the temporal response in the nail biologic monitor. Nutrients, 5, 1024–1057. 10.3390/nu5041024 [DOI] [PMC free article] [PubMed] [Google Scholar]
- Morris JS, Stampfer MJ and Willett W, 1983. Dietary selenium in humans toenails as an indicator. Biological Trace Element Research, 5, 529–537. 10.1007/bf02988944 [DOI] [PubMed] [Google Scholar]
- Muecke R, Klotz T, Giedl J, Buentzel J, Kundt G, Kisters K, Prott FJ and Micke O, 2009. Whole blood selenium levels (WBSL) in patients with prostate cancer (PC), benign prostatic hyperplasia (BPH) and healthy male inhabitants (HMI) and prostatic tissue selenium levels (PTSL) in patients with PC and BPH. Acta Oncologica, 48, 452–456. 10.1080/02841860802403721 [DOI] [PubMed] [Google Scholar]
- Muecke R, Waldschock K, Schomburg L, Micke O, Buentzel J, Kisters K, Adamietz IA and Huebner J, 2018. Whole blood selenium levels and selenium supplementation in patients treated in a family doctor practice in Golßen (state of Brandenburg, Germany): A laboratory study. Integrative Cancer Therapies, 17, 1132–1136. 10.1177/1534735418807971 [DOI] [PMC free article] [PubMed] [Google Scholar]
- Muller SM, Dawczynski C, Wiest J, Lorkowski S, Kipp AP and Schwerdtle T, 2020. Functional biomarkers for the selenium status in a human nutritional intervention study. Nutrients, 12. 10.3390/nu12030676 [DOI] [PMC free article] [PubMed] [Google Scholar]
- Muntau AC, Streiter M, Kappler M, Röschinger W, Schmid I, Rehnert A, Schramel P and Roscher AA, 2002. Age‐related reference values for serum selenium concentrations in infants and children. Clinical Chemistry, 48, 555–560. [PubMed] [Google Scholar]
- Naderi M, Puar P, Zonouzi‐Marand M, Chivers DP, Niyogi S and Kwong RWM, 2021. A comprehensive review on the neuropathophysiology of selenium. Science of the Total Environment, 767, 144329. 10.1016/j.scitotenv.2020.144329 [DOI] [PubMed] [Google Scholar]
- Navas‐Carretero S, Cuervo M, Abete I, Zulet MA and Martínez JA, 2011. Frequent consumption of selenium‐enriched chicken meat by adults causes weight loss and maintains their antioxidant status. Biological Trace Element Research, 143, 8–19. 10.1007/s12011-010-8831-x [DOI] [PubMed] [Google Scholar]
- Nawrot TS, Staessen JA, Roels HA, Den Hond E, Thijs L, Fagard RH, Dominiczak AF and Struijker‐Boudier HA, 2007. Blood pressure and blood selenium: a cross‐sectional and longitudinal population study. European Heart Journal, 28, 628–633. 10.1093/eurheartj/ehl479 [DOI] [PubMed] [Google Scholar]
- Neve J, 1995. Human selenium supplementation as assessed by changes in blood selenium concentration and glutathione peroxidase activity. Journal of Trace Elements in Medicine and Biology, 9, 65–73. 10.1016/S0946-672X(11)80013-1 [DOI] [PubMed] [Google Scholar]
- NHMRC (National Health and Medical Research Council. Government of Australia and New Zealand) , 2006. Nutrient reference values for Australia and New Zealand. 8 pp. Available online: https://www.nrv.gov.au/nutrients/selenium
- Nichol C, Herdman J, Sattar N, O'Dwyer PJ, St JORD, Littlejohn D and Fell G, 1998. Changes in the concentrations of plasma selenium and selenoproteins after minor elective surgery: further evidence for a negative acute phase response? Clinical Chemistry, 44, 1764–1766. [PubMed] [Google Scholar]
- No authors listed , 1984. Selenium intoxication – New York. Morbidity and Mortality Weekly Report, 33, 157–158. [PubMed] [Google Scholar]
- Noisel N, Carrier G and Bouchard M, 2014. Study of selenium intake and disposition in various matrices based on mathematical algorithms derived from pooled biomonitoring data. International Journal of Hygiene and Environmental Health, 217, 796–804. 10.1016/j.ijheh.2014.04.005 [DOI] [PubMed] [Google Scholar]
- Nomura AM, Lee J, Stemmermann GN and Combs GF, 2000. Serum selenium and subsequent risk of prostate cancer. Cancer Epidemiology, Biomarkers and Prevention, 9, 883–887. [PubMed] [Google Scholar]
- Nuttall KL, 2006. Evaluating selenium poisoning. Annals of Clinical Laboratory Science, 36, 409–420. [PubMed] [Google Scholar]
- O'Grady TJ, Kitahara CM, DiRienzo AG and Gates MA, 2014. The association between selenium and other micronutrients and thyroid cancer incidence in the NIH‐AARP Diet and Health Study. PLoS One, 9, e110886. 10.1371/journal.pone.0110886 [DOI] [PMC free article] [PubMed] [Google Scholar]
- O'Toole D, Raisbeck M, Case JC and Whitson TD, 1996. Selenium‐induced “blind staggers” and related myths. A commentary on the extent of historical livestock losses attributed to selenosis on western US rangelands. Veterinary Pathology, 33, 104–116. 10.1177/030098589603300117 [DOI] [PubMed] [Google Scholar]
- O'Toole D and Raisbeck MF, 1995. Pathology of experimentally‐induced chronic selenosis (alkali disease) in yearling cattle. Journal of Veterinary Diagnostic Investigation, 7, 364–373. 10.1177/104063879500700312 [DOI] [PubMed] [Google Scholar]
- OHAT‐NTP (Office of Health Assessment and Translation‐Division of the National Toxicology Program) , 2015. OHAT risk of bias rating tool for human and animal studies. 37 pp. Available online: https://ntp.niehs.nih.gov/ntp/ohat/pubs/riskofbiastool_508.pdf
- OHAT‐NTP (Office of Health Assessment and Translation‐Division of the National Toxicology Program) , 2019. Handbook for conducting a literature‐based health assessment using OHAT approach for systematic review and evidence integration. Available online: https://ntp.niehs.nih.gov/ntp/ohat/pubs/handbookjan2015_508.pdf
- Oldfield J, 2002. Selenium World Atlas, Selenium‐tellurium development association. 59 pp.
- Olivieri O, Girelli D, Azzini M, Stanzial AM, Russo C, Ferroni M and Corrocher R, 1995. Low selenium status in the elderly influences thyroid hormones. Clinical Science, 89, 637–642. 10.1042/cs0890637 [DOI] [PubMed] [Google Scholar]
- Oo SM, Misu H, Saito Y, Tanaka M, Kato S, Kita Y, Takayama H, Takeshita Y, Kanamori T, Nagano T, Nakagen M, Urabe T, Matsuyama N, Kaneko S and Takamura T, 2018. Serum selenoprotein P, but not selenium, predicts future hyperglycemia in a general Japanese population. Scientific Reports, 8, 16727. 10.1038/s41598-018-35067-2 [DOI] [PMC free article] [PubMed] [Google Scholar]
- Orsini N, Li R, Wolk A, Khudyakov P and Spiegelman D, 2012. Meta‐analysis for linear and nonlinear dose‐response relations: examples, an evaluation of approximations, and software. American Journal of Epidemiology, 175, 66–73. 10.1093/aje/kwr265 [DOI] [PMC free article] [PubMed] [Google Scholar]
- Oster O and Prellwitz W, 1990. The renal excretion of selenium. Biological Trace Element Research, 24, 119–146. 10.1007/BF02917201 [DOI] [PubMed] [Google Scholar]
- Outzen M, Tjønneland A, Hughes DJ, Jenab M, Frederiksen K, Schomburg L, Morris S, Overvad K and Olsen A, 2021. Toenail selenium, plasma selenoprotein P and risk of advanced prostate cancer: a nested case‐control study. International Journal of Cancer, 148, 876–883. 10.1002/ijc.33267 [DOI] [PubMed] [Google Scholar]
- Pacheco AM and Scussel VM, 2007. Selenium and aflatoxin levels in raw Brazil nuts from the Amazon basin. Journal of Agricultural and Food Chemistry, 55, 11087–11092. 10.1021/jf072434k [DOI] [PubMed] [Google Scholar]
- Park K, Rimm EB, Siscovick DS, Spiegelman D, Manson JE, Morris JS, Hu FB and Mozaffarian D, 2012. Toenail selenium and incidence of type 2 diabetes in U.S. men and women. Diabetes Care, 35, 1544–1551. 10.2337/dc11-2136 [DOI] [PMC free article] [PubMed] [Google Scholar]
- Park SY, Haiman CA, Cheng I, Park SL, Wilkens LR, Kolonel LN, Le Marchand L and Henderson BE, 2015. Racial/ethnic differences in lifestyle‐related factors and prostate cancer risk: the Multiethnic Cohort Study. Cancer Causes and Control, 26, 1507–1515. 10.1007/s10552-015-0644-y [DOI] [PMC free article] [PubMed] [Google Scholar]
- Paulsen MM, Myhre JB, Andersen LF and Kristiansen AL, Folkehelseinstituttet og Universitetet i Oslo , 2020. Spedkost 3. Landsomfattende undersøkelse av kostholdet blant spedbarn i Norge, 12 måneder" [Spedkost 3. Nationwide dietary survey among infants in Norway, age 12 months]. Rapport 2020, Oslo.
- Pedersen AN, Christensen T, Matthiessen J, Knudsen VK, Rosenlund‐Sørensen M, Biltoft‐Jensen A, Hinsch HJ, Ygil KH, Kørup K, Saxholt E, Trolle E, Søndergaard AB, Fag S and DTU Fødevareinstituttet , 2015. Danskernes kostvaner 2011–2013. Hovedresultater. 208 pp.
- Persson‐Moschos MEK, Stavenow L, Akesson B and Lindgarde P, 2000. Selenoprotein P in plasma in relation to cancer morbidity in middle‐aged Swedish men. Nutrition and Cancer, 36, 19–26. 10.1207/s15327914nc3601_4 [DOI] [PubMed] [Google Scholar]
- Peters S, Broberg K, Gallo V, Levi M, Kippler M, Vineis P, Veldink J, van den Berg L, Middleton L, Travis RC, Bergmann MM, Palli D, Grioni S, Tumino R, Elbaz A, Vlaar T, Mancini F, Kühn T, Katzke V, Agudo A, Goñi F, Gómez JH, Rodríguez‐Barranco M, Merino S, Barricarte A, Trichopoulou A, Jenab M, Weiderpass E and Vermeulen R, 2021. Blood metal levels and amyotrophic lateral sclerosis risk: a prospective cohort. Annals of Neurology, 89, 125–133. 10.1002/ana.25932 [DOI] [PMC free article] [PubMed] [Google Scholar]
- Peters U, Foster CB, Chatterjee N, Schatzkin A, Reding D, Andriole GL, Crawford ED, Sturup S, Chanock SJ and Hayes RB, 2007. Serum selenium and risk of prostate cancer – a nested case‐control study. American Journal of Clinical Nutrition, 85, 209–217. 10.1093/ajcn/85.1.209 [DOI] [PMC free article] [PubMed] [Google Scholar]
- Petrovski BÉ, Pataki V, Jenei T, Ádány R and Vokó Z, 2012. Selenium levels in men with liver disease in Hungary. Journal of Trace Elements in Medicine and Biology, 26, 31–35. 10.1016/j.jtemb.2012.01.001 [DOI] [PubMed] [Google Scholar]
- Plateau P, Saveanu C, Lestini R, Dauplais M, Decourty L, Jacquier A, Blanquet S and Lazard M, 2017. Exposure to selenomethionine causes selenocysteine misincorporation and protein aggregation in Saccharomyces cerevisiae. Scientific Reports, 7, 44761. 10.1038/srep44761 [DOI] [PMC free article] [PubMed] [Google Scholar]
- Pograjc L, Stibilj V and Falnoga I, 2012. Impact of intensive physical activity on selenium status. Biological Trace Element Research, 145, 291–299. 10.1007/s12011-011-9204-9 [DOI] [PubMed] [Google Scholar]
- Polanska K, Hanke W, Krol A, Gromadzinska J, Kuras R, Janasik B, Wasowicz W, Mirabella F, Chiarotti F and Calamandrei G, 2017. Micronutrients during pregnancy and child psychomotor development: opposite effects of zinc and selenium. Environmental Research, 158, 583–589. 10.1016/j.envres.2017.06.037 [DOI] [PubMed] [Google Scholar]
- Polanska K, Krol A, Sobala W, Gromadzinska J, Brodzka R, Calamandrei G, Chiarotti F, Wasowicz W and Hanke W, 2016. Selenium status during pregnancy and child psychomotor development‐Polish Mother and Child Cohort study. Pediatric Research, 79, 863–869. 10.1038/pr.2016.32 [DOI] [PMC free article] [PubMed] [Google Scholar]
- Public Health England , online, 2021. Composition of Foods Integrated Dataset’ (CoFID). Available online: https://quadram.ac.uk/UKfoodcomposition [Accessed: 3rd August 2021].
- Ray AL, Semba RD, Walston J, Ferrucci L, Cappola AR, Ricks MO, Xue QL and Fried LP, 2006. Low serum selenium and total carotenoids predict mortality among older women living in the community: the women's health and aging studies. Journal of Nutrition, 136, 172–176. 10.1093/jn/136.1.172 [DOI] [PubMed] [Google Scholar]
- Raygan F, Behnejad M, Ostadmohammadi V, Bahmani F, Mansournia MA, Karamali F and Asemi Z, 2018. Selenium supplementation lowers insulin resistance and markers of cardio‐metabolic risk in patients with congestive heart failure: a randomised, double‐blind, placebo‐controlled trial (Publication with Expression of Concern. See vol. 127, pg. 157, 2022). British Journal of Nutrition, 120, 33–40. 10.1017/s0007114518001253 [DOI] [PubMed] [Google Scholar]
- Rayman MP, 2012. Selenium and human health. Lancet, 379, 1256–1268. 10.1016/S0140-6736(11)61452-9 [DOI] [PubMed] [Google Scholar]
- Rayman MP, 2020. Selenium intake, status, and health: a complex relationship. Hormones, 19, 9–14. 10.1007/s42000-019-00125-5 [DOI] [PMC free article] [PubMed] [Google Scholar]
- Rayman MP, Blundell‐Pound G, Pastor‐Barriuso R, Guallar E, Steinbrenner H and Stranges S, 2012. A randomized trial of selenium supplementation and risk of type‐2 diabetes, as assessed by plasma adiponectin. PLoS One, 7, e45269. 10.1371/journal.pone.0045269 [DOI] [PMC free article] [PubMed] [Google Scholar]
- Rayman MP, Infante HG and Sargent M, 2008a. Food‐chain selenium and human health: spotlight on speciation. British Journal of Nutrition, 100, 238–253. 10.1017/S0007114508922522 [DOI] [PubMed] [Google Scholar]
- Rayman MP, Thompson AJ, Bekaert B, Catterick J, Galassini R, Hall E, Warren‐Perry M and Beckett GJ, 2008b. Randomized controlled trial of the effect of selenium supplementation on thyroid function in the elderly in the United Kingdom. American Journal of Clinical Nutrition, 87, 370–378. 10.1093/ajcn/87.2.370 [DOI] [PubMed] [Google Scholar]
- Rayman MP, Winther KH, Pastor‐Barriuso R, Cold F, Thvilum M, Stranges S, Guallar E and Cold S, 2018. Effect of long‐term selenium supplementation on mortality: Results from a multiple‐dose, randomised controlled trial. Free Radical Biology and Medicine, 127, 46–54. 10.1016/j.freeradbiomed.2018.02.015 [DOI] [PubMed] [Google Scholar]
- Razmi TM, Attri SV and Handa S, 2017. Haemorrhagic onychomadesis: a cutaneous clue to chronic selenosis – case series. Journal of the European Academy of Dermatology and Venereology, 31, e425–e427. 10.1111/jdv.14241 [DOI] [PubMed] [Google Scholar]
- Rea HM, Thomson CD, Campbell DR and Robinson MF, 1979. Relation between erythrocyte selenium concentrations and glutathione peroxidase (EC 1.11.1.9) activities of New Zealand residents and visitors to New Zealand. British Journal of Nutrition, 42, 201–208. 10.1079/bjn19790107 [DOI] [PubMed] [Google Scholar]
- Reid ME, Duffield‐Lillico AJ, Slate E, Natarajan N, Turnbull B, Jacobs E, Combs GF Jr, Alberts DS, Clark LC and Marshall JR, 2008. The nutritional prevention of cancer: 400 mcg per day selenium treatment. Nutrition and Cancer, 60, 155–163. 10.1080/01635580701684856 [DOI] [PubMed] [Google Scholar]
- Reid ME, Stratton MS, Lillico AJ, Fakih M, Natarajan R, Clark LC and Marshall JR, 2004. A report of high‐dose selenium supplementation: response and toxicities. Journal of Trace Elements in Medicine and Biology, 18, 69–74. 10.1016/j.jtemb.2004.03.004 [DOI] [PubMed] [Google Scholar]
- Richie JP, Das A, Calcagnotto AM, Sinha R, Neidig W, Liao JG, Lengerich EJ, Berg A, Hartman TJ, Ciccarella A, Baker A, Kaag MG, Goodin S, DiPaola RS and El‐Bayoumy K, 2014. Comparative effects of two different forms of selenium on oxidative stress biomarkers in healthy men: a randomized clinical trial. Cancer Prevention Research, 7, 796–804. 10.1158/1940-6207.Capr-14-0042 [DOI] [PMC free article] [PubMed] [Google Scholar]
- Robinson MF, Thomson CD, Jenkinson CP, Luzhen G and Whanger PD, 1997. Long‐term supplementation with selenate and selenomethionine: urinary excretion by New Zealand women. British Journal of Nutrition, 77, 551–563. 10.1079/bjn19970056 [DOI] [PubMed] [Google Scholar]
- Rodriguez Rodriguez EM, Sanz Alaejos MT and Diaz Romero C, 1995. Urinary selenium status of healthy people. European Journal of Clinical Chemistry and Clinical Biochemistry, 33, 127–133. 10.1515/cclm.1995.33.3.127 [DOI] [PubMed] [Google Scholar]
- Roe MA, Bell S, Oseredczuk M, Christensen T, Westenbrink S, Pakkala H, Presser K, Finglas PM and Consortium E, 2013. Updated food composition database for nutrient intake. EFSA supporting publication. 10.2903/sp.efsa.2013.EN-355 [DOI]
- Ruhl CE and Everhart JE, 2003. Relation of elevated serum alanine aminotransferase activity with iron and antioxidant levels in the United States. Gastroenterology, 124, 1821–1829. 10.1016/s0016-5085(03)00395-0 [DOI] [PubMed] [Google Scholar]
- Saito Y, 2020. Selenoprotein P as an in vivo redox regulator: disorders related to its deficiency and excess. Journal of Clinical Biochemistry and Nutrition, 66, 1–7. 10.3164/jcbn.19-31 [DOI] [PMC free article] [PubMed] [Google Scholar]
- Saito Y, 2021. Selenium transport mechanism via selenoprotein P‐Its physiological role and related diseases. Frontiers in Nutrition, 8, 685517. 10.3389/fnut.2021.685517 [DOI] [PMC free article] [PubMed] [Google Scholar]
- Sanz Alaejos M and Diaz Romero C, 1993. Urinary selenium concentrations. Clinical Chemistry, 39, 2040–2052. [PubMed] [Google Scholar]
- Satia JA, King IB, Morris JS, Stratton K and White E, 2006. Toenail and plasma levels as biomarkers of selenium exposure. Annals of Epidemiology, 16, 53–58. 10.1016/j.annepidem.2005.02.011 [DOI] [PubMed] [Google Scholar]
- SCF (Scientific Committee for Food) , 1993. Nutrient and energy intakes for the European Community. Reports of the Scientific Committee for Food, 31st Series. 248 pp. [DOI] [PubMed]
- SCF (Scientific Committee on Food) , 2000a. Opinion of the Scientific Committee on Food on the Tolerable Upper Intake Level of selenium. 18 pp.
- SCF (Scientific Committee on Food) , 2000b. Guidelines of the Scientific Committee on Food for the development of tolerable upper intake levels for vitamins and minerals. Available online: https://www.efsa.europa.eu/sites/default/files/efsa_rep/blobserver_assets/ndatolerableuil.pdf
- Schomburg L, 2022. Selenoprotein P – Selenium transport protein, enzyme and biomarker of selenium status. Free Radical Biology and Medicine, 191, 150–163. 10.1016/j.freeradbiomed.2022.08.022 [DOI] [PubMed] [Google Scholar]
- Schomburg L, Orho‐Melander M, Struck J, Bergmann A and Melander O, 2019. Selenoprotein‐P deficiency predicts cardiovascular disease and death. Nutrients, 11. 10.3390/nu11081852 [DOI] [PMC free article] [PubMed] [Google Scholar]
- Schwab S, Zierer A, Heier M, Fischer B, Huth C, Baumert J, Meisinger C, Peters A and Thorand B, 2015. Intake of vitamin and mineral supplements and longitudinal association with HbA1c levels in the general non‐diabetic population‐Results from the MONICA/KORA S3/F3 study. PLoS One, 10, e0139244. 10.1371/journal.pone.0139244 [DOI] [PMC free article] [PubMed] [Google Scholar]
- Sele V, Ørnsrud R, Sloth JJ, Berntssen MHG and Amlund H, 2018. Selenium and selenium species in feeds and muscle tissue of Atlantic salmon. Journal of Trace Elements in Medicine and Biology, 47, 124–133. 10.1016/j.jtemb.2018.02.005 [DOI] [PubMed] [Google Scholar]
- Senthilkumaran S, Balamurugan N, Vohra R and Thirumalaikolundusubramanian P, 2012. Paradise nut paradox: alopecia due to selenosis from a nutritional therapy. International Journal of Trichology, 4, 283–284. 10.4103/0974-7753.111206 [DOI] [PMC free article] [PubMed] [Google Scholar]
- Serwin AB, Mysliwiec H, Hukalowicz K, Porebski P, Borawska M and Chodynicka B, 2003. Soluble tumor necrosis factor‐alpha receptor type 1 during selenium supplementation in psoriasis patients. Nutrition, 19, 847–850. 10.1016/s0899-9007(03)00165-5 [DOI] [PubMed] [Google Scholar]
- Shearer TR and Hadjimarkos DM, 1975. Geographic distribution of selenium in human milk. Archives of Environmental Health, 30, 230–233. 10.1080/00039896.1975.10666686 [DOI] [PubMed] [Google Scholar]
- Sheehan TM and Halls DJ, 1999. Measurement of selenium in clinical specimens. Annals of Clinical Biochemistry, 36(Pt 3), 301–315. 10.1177/000456329903600302 [DOI] [PubMed] [Google Scholar]
- Skröder H, Kippler M, Tofail F and Vahter M, 2017. Early‐life selenium status and cognitive function at 5 and 10 years of age in Bangladeshi children. Environmental Health Perspectives, 125, 117003. 10.1289/EHP1691 [DOI] [PMC free article] [PubMed] [Google Scholar]
- Skröder HM, Hamadani JD, Tofail F and Persson L, 2015. Selenium status in pregnancy influences children's cognitive function at 1.5 years of age. Clinical Nutrition, 34, 923–930. 10.1016/j.clnu.2014.09.020 [DOI] [PubMed] [Google Scholar]
- Slotnick MJ and Nriagu JO, 2006. Validity of human nails as a biomarker of arsenic and selenium exposure: a review. Environmental Research, 102, 125–139. 10.1016/j.envres.2005.12.001 [DOI] [PubMed] [Google Scholar]
- Speckmann B, Walter PL, Alili L, Reinehr R, Sies H, Klotz LO and Steinbrenner H, 2008. Selenoprotein P expression is controlled through interaction of the coactivator PGC‐1alpha with FoxO1a and hepatocyte nuclear factor 4alpha transcription factors. Hepatology, 48, 1998–2006. 10.1002/hep.22526 [DOI] [PubMed] [Google Scholar]
- Státní zdravotní ústav , 2021. Systém monitorování zdravotního stavu obyvatelstva ČR ve vztahu k životnímu prostředí, Subsystém IV, Zdravotní důsledky zátěže lidského organismu cizorodými látkami z potravinových řetězců, dietární expozice. Prague, Czech Republic, 51 pp.
- Stefanowicz FA, Talwar D, O'Reilly DS, Dickinson N, Atkinson J, Hursthouse AS, Rankin J and Duncan A, 2013. Erythrocyte selenium concentration as a marker of selenium status. Clinical Nutrition, 32, 837–842. 10.1016/j.clnu.2013.01.005 [DOI] [PubMed] [Google Scholar]
- Steinbrenner H, 2013. Interference of selenium and selenoproteins with the insulin‐regulated carbohydrate and lipid metabolism. Free Radical Biology and Medicine, 65, 1538–1547. 10.1016/j.freeradbiomed.2013.07.016 [DOI] [PubMed] [Google Scholar]
- Steinbrenner H, Duntas LH and Rayman MP, 2022. The role of selenium in type‐2 diabetes mellitus and its metabolic comorbidities. Redox Biology, 50, 102236. 10.1016/j.redox.2022.102236 [DOI] [PMC free article] [PubMed] [Google Scholar]
- Stoffaneller R and Morse NL, 2015. A review of dietary selenium intake and selenium status in Europe and the Middle East. Nutrients, 7, 1494–1537. 10.3390/nu7031494 [DOI] [PMC free article] [PubMed] [Google Scholar]
- Stos K, Wozniak A, Rychlik E, Ziolkowska I, Glowala A and Oltarzewski M, 2021. Assessment of food supplement consumption in Polish population of adults. Frontiers in Nutrition, 8. 10.3389/fnut.2021.733951 [DOI] [PMC free article] [PubMed] [Google Scholar]
- Stranges S, Marshall JR, Natarajan R, Donahue RP, Trevisan M, Combs GF, Cappuccio FP, Ceriello A and Reid ME, 2007. Effects of long‐term selenium supplementation on the incidence of type 2 diabetes: a randomized trial. Annals of Internal Medicine, 147, 217–223. 10.7326/0003-4819-147-4-200708210-00175 [DOI] [PubMed] [Google Scholar]
- Stranges S, Rayman MP, Winther KH, Guallar E, Cold S and Pastor‐Barriuso R, 2019. Effect of selenium supplementation on changes in HbA1c: results from a multiple‐dose, randomized controlled trial. Diabetes, Obesity and Metabolism, 21, 541–549. 10.1111/dom.13549 [DOI] [PubMed] [Google Scholar]
- Stranges S, Sieri S, Vinceti M, Grioni S, Guallar E, Laclaustra M, Muti P, Berrino F and Krogh V, 2010. A prospective study of dietary selenium intake and risk of type 2 diabetes. BMC Public Health, 10, 564. 10.1186/1471-2458-10-564 [DOI] [PMC free article] [PubMed] [Google Scholar]
- Su L, Jin Y, Unverzagt FW, Liang C, Cheng Y, Hake AM, Kuruppu D, Ma F, Liu J, Chen C, Bian J, Li P and Gao S, 2016. Longitudinal association between selenium levels and hypertension in a rural elderly Chinese cohort. Journal of Nutrition, Health and Aging, 20, 983–988. 10.1007/s12603-016-0700-7 [DOI] [PubMed] [Google Scholar]
- Sun JW, Shu XO, Li HL, Zhang W, Gao J, Zhao LG, Zheng W and Xiang YB, 2016. Dietary selenium intake and mortality in two population‐based cohort studies of 133 957 Chinese men and women. Public Health Nutrition, 19, 2991–2998. 10.1017/S1368980016001130 [DOI] [PMC free article] [PubMed] [Google Scholar]
- Sun XF, Ting BT and Janghorbani M, 1987. Excretion of trimethylselenonium ion in human urine. Analytical Biochemistry, 167, 304–311. 10.1016/0003-2697(87)90169-2 [DOI] [PubMed] [Google Scholar]
- Sunde R, 2012. Selenium. In: Shils M, Shike M, Ross C, Caballero B and Cousins R (eds.). Modern Nutrition in Health and Disease. 11th Edition. US, Lippincott Williams and Wilkins, Philadelphia. pp. 225–237. [Google Scholar]
- Sutter ME, Thomas JD, Brown J and Morgan B, 2008. Selenium toxicity: a case of selenosis caused by a nutritional supplement. Annals of Internal Medicine, 148, 970–971. 10.7326/0003-4819-148-12-200806170-00015 [DOI] [PubMed] [Google Scholar]
- Suzuki KT, Kurasaki K and Suzuki N, 2007. Selenocysteine β‐lyase and methylselenol demethylase in the metabolism of Se‐methylated selenocompounds into selenide. Biochimica et Biophysica Acta (BBA) – General Subjects, 1770, 1053–1061. 10.1016/j.bbagen.2007.03.007 [DOI] [PubMed] [Google Scholar]
- Swanson CA, Longnecker MP, Veillon C, Howe M, Levander OA, Taylor PR, McAdam PA, Brown CC, Stampfer MJ and Willett WC, 1990. Selenium intake, age, gender, and smoking in relation to indices of selenium status of adults residing in a seleniferous area. American Journal of Clinical Nutrition, 52, 858–862. 10.1093/ajcn/52.5.858 [DOI] [PubMed] [Google Scholar]
- Swart R, Schutte AE, van Rooyen JM and Mels CMC, 2019. Selenium and large artery structure and function: a 10‐year prospective study. European Journal of Nutrition, 58, 3313–3323. 10.1007/s00394-018-1875-y [DOI] [PubMed] [Google Scholar]
- Tamtaji OR, Heidari‐Soureshjani R, Mirhosseini N, Kouchaki E, Bahmani F, Aghadavod E, Tajabadi‐Ebrahimi M and Asemi Z, 2019. Probiotic and selenium co‐supplementation, and the effects on clinical, metabolic and genetic status in Alzheimer's disease: a randomized, double‐blind, controlled trial. Clinical Nutrition, 38, 2569–2575. 10.1016/j.clnu.2018.11.034 [DOI] [PubMed] [Google Scholar]
- Tatsuta N, Murata K, Iwai‐Shimada M, Yaginuma‐Sakurai K, Satoh H and Nakai K, 2017. Psychomotor ability in children prenatally exposed to methylmercury: the 18‐month follow‐up of Tohoku study of child development. Tohoku Journal of Experimental Medicine, 242, 1–8. 10.1620/tjem.242.1 [DOI] [PubMed] [Google Scholar]
- Tessier F, Margaritis I, Richard MJ, Moynot C and Marconnet P, 1995. Selenium and training effects on the glutathione system and aerobic performance. Medicine and Science in Sports and Exercise, 27, 390–396. [PubMed] [Google Scholar]
- Thiry C, Ruttens A, De Temmerman L, Schneider Y‐J and Pussemier L, 2012. Current knowledge in species‐related bioavailability of selenium in food. Food Chemistry, 130, 767–784. 10.1016/j.foodchem.2011.07.102 [DOI] [Google Scholar]
- Thompson PA, Ashbeck EL, Roe DJ, Fales L, Buckmeier J, Wang F, Bhattacharyya A, Hsu CH, Chow HH, Ahnen DJ, Boland CR, Heigh RI, Fay DE, Hamilton SR, Jacobs ET, Martinez ME, Alberts DS and Lance P, 2016. Selenium supplementation for prevention of colorectal adenomas and risk of associated type 2 diabetes. Journal of the National Cancer Institute, 108. 10.1093/jnci/djw152 [DOI] [PMC free article] [PubMed] [Google Scholar]
- Thomson CD, Campbell JM, Miller J, Skeaff SA and Livingstone V, 2009. Selenium and iodine supplementation: effect on thyroid function of older New Zealanders. American Journal of Clinical Nutrition, 90, 1038–1046. 10.3945/ajcn.2009.28190 [DOI] [PubMed] [Google Scholar]
- Thomson CD, McLachlan SK, Grant AM, Paterson E and Lillico AJ, 2005. The effect of selenium on thyroid status in a population with marginal selenium and iodine status. British Journal of Nutrition, 94, 962–968. 10.1079/bjn20051564 [DOI] [PubMed] [Google Scholar]
- Thomson CD, Robinson MF, Campbell DR and Rea HM, 1982. Effect of prolonged supplementation with daily supplements of selenomethionine and sodium selenite on glutathione peroxidase activity in blood of New Zealand residents. American Journal of Clinical Nutrition, 36, 24–31. 10.1093/ajcn/36.1.24 [DOI] [PubMed] [Google Scholar]
- Totland TH, Melnæs BK, Lundberg‐Hallén N, Helland‐Kigen KM, Lund‐Blix NA, Myhre JB, Wetting Johansen AM, Løken EB, Andersen LF and Universitetet i Oslo, Mattilsynet og Helsedirektoratet , 2012. Norkost 3 En landsomfattende kostholdsundersøkelse blant menn og kvinner i Norge i alderen 18–70 år, 2010–11. Oslo, Norway.
- Unrine JM, Jackson BP and Hopkins WA, 2007. Selenomethionine biotransformation and incorporation into proteins along a simulated terrestrial food chain. Environmental Science and Technology, 41, 3601–3606. 10.1021/es062073+ [DOI] [PubMed] [Google Scholar]
- Välimäki M, Alfthan G, Vuoristo M and Ylikahri R, 1991. Effects of selenium supplementation on blood and urine selenium levels and liver function in patients with primary biliary cirrhosis. Clinica Chimica Acta, 196, 7–15. 10.1016/0009-8981(91)90203-o [DOI] [PubMed] [Google Scholar]
- Valsta L, Kaartinen N, Tapanainen H, Männistö S and Sääksjärvi K, 2018. Ravitsemus Suomessa – FinRavinto 2017 ‐tutkimus (Nutrition in Finland – The National FinDiet 2017 Survey). THL Raportti 12/2018, Helsinki, Finland. 311 pp.
- van Buuren S, Schönbeck Y and van Dommelen P, 2012. Collection, collation and analysis of data in relation toreference heights and reference weights for female and male children and adolescents (0–18 years) in the EU,as well as in relation to the age of onset of puberty and the age at which different stages of puberty arereached in adolescents in the EU. Project developed on the procurement project CT/EFSA/NDA/2010/01. EFSA supporting publication 2012:EN‐255, 59 pp.
- van den Brandt PA, Goldbohm RA, van't Veer P, Bode P, Hermus RJ and Sturmans F, 1993. Predictors of toenail selenium levels in men and women. Cancer Epidemiology, Biomarkers and Prevention, 2, 107–112. [PubMed] [Google Scholar]
- van der Pols JC, Heinen MM, Hughes MC, Ibiebele TI, Marks GC and Green AC, 2009. Serum antioxidants and skin cancer risk: an 8‐year community‐based follow‐up study. Cancer Epidemiology, Biomarkers and Prevention, 18, 1167–1173. 10.1158/1055-9965.EPI-08-1211 [DOI] [PubMed] [Google Scholar]
- van Rossum CTM, Buurma‐Rethans EJM, Dinnissen CS, Beukers MH, Brants HAM, Dekkers ALM and Ocké MC, 2020. The diet of the Dutch. Results of the Dutch National Food Consumption Survey 2012–2016. National Institute for Public Health and the Environment, RIVM report, 2020‐0083, 388 pp.
- van Rossum CTM, Fransen HP, Verkaik‐Kloosterman J, Buurma‐Rethans EJM and Ocke M, 2011. Dutch National Food Consumption Survey 2007–2010: diet of children and adults aged 7 to 69 years. National Institute for Public Health and the Environment, RIVM report number: 350050006/2011, 148 pp.
- Varsi K, Bolann B, Torsvik I, Rosvold Eik TC, Høl PJ and Bjørke‐Monsen AL, 2017. Impact of maternal selenium status on infant outcome during the first 6 months of life. Nutrients, 9. 10.3390/nu9050486 [DOI] [PMC free article] [PubMed] [Google Scholar]
- Vinceti M, Ballotari P, Steinmaus C, Malagoli C, Luberto F, Malavolti M and Rossi PG, 2016a. Long‐term mortality patterns in a residential cohort exposed to inorganic selenium in drinking water. Environmental Research, 150, 348–356. 10.1016/j.envres.2016.06.009 [DOI] [PubMed] [Google Scholar]
- Vinceti M, Bonaccio M, Filippini T, Costanzo S, Wise LA, Di Castelnuovo A, Ruggiero E, Persichillo M, Cerletti C, Donati MB, Gaetano G and Iacoviello L, 2021. Dietary selenium intake and risk of hospitalization for type 2 diabetes in the Moli‐sani study cohort. Nutrition, Metabolism and Cardiovascular Diseases, 31, 1738–1746. 10.1016/j.numecd.2021.02.016 [DOI] [PubMed] [Google Scholar]
- Vinceti M, Burlingame B, Filippini T, Naska A, Bargellini A and Borella P, 2016b. The epidemiology of selenium and human health. In: Hatfield DL, Schweizer U, Tsuji PA and Gladyshev VN (eds.). Selenium. Springer Science+Business Media, New York, USA. pp. 365–376. [Google Scholar]
- Vinceti M, Chiari A, Eichmuller M, Rothman KJ, Filippini T, Malagoli C, Weuve J, Tondelli M, Zamboni G, Nichelli PF and Michalke B, 2017a. A selenium species in cerebrospinal fluid predicts conversion to Alzheimer's dementia in persons with mild cognitive impairment. Alzheimer's Research and Therapy, 9, 100. 10.1186/s13195-017-0323-1 [DOI] [PMC free article] [PubMed] [Google Scholar]
- Vinceti M, Crespi CM, Malagoli C, Bottecchi I, Ferrari A, Sieri S, Krogh V, Alber D, Bergomi M, Seidenari S and Pellacani G, 2012. A case‐control study of the risk of cutaneous melanoma associated with three selenium exposure indicators. Tumori, 98, 287–295. 10.1700/1125.12394 [DOI] [PMC free article] [PubMed] [Google Scholar]
- Vinceti M, Filippini T, Cilloni S, Bargellini A, Vergoni AV, Tsatsakis A and Ferrante M, 2017b. Health risk assessment of environmental selenium: emerging evidence and challenges. Molecular Medicine Reports, 15, 3323–3335. 10.3892/mmr.2017.6377 [DOI] [PMC free article] [PubMed] [Google Scholar]
- Vinceti M, Filippini T, Jablonska E, Saito Y and Wise LA, 2022. Safety of selenium exposure and limitations of selenoprotein maximization: Molecular and epidemiologic perspectives. Environmental Research, 211, 113092. 10.1016/j.envres.2022.113092 [DOI] [PubMed] [Google Scholar]
- Vinceti M, Filippini T, Malagoli C, Violi F, Mandrioli J, Consonni D, Rothman KJ and Wise LA, 2019. Amyotrophic lateral sclerosis incidence following exposure to inorganic selenium in drinking water: A long‐term follow‐up. Environmental Research, 179, 108742. 10.1016/j.envres.2019.108742 [DOI] [PubMed] [Google Scholar]
- Vinceti M, Filippini T and Rothman KJ, 2018a. Selenium exposure and the risk of type 2 diabetes: a systematic review and meta‐analysis. European Journal of Epidemiology, 33, 789–810. 10.1007/s10654-018-0422-8 [DOI] [PubMed] [Google Scholar]
- Vinceti M, Filippini T and Wise LA, 2018b. Environmental selenium and human health: an update. Current Environmental Health Reports, 5, 464–485. 10.1007/s40572-018-0213-0 [DOI] [PubMed] [Google Scholar]
- Vinceti M, Grill P, Malagoli C, Filippini T, Storani S, Malavolti M and Michalke B, 2015a. Selenium speciation in human serum and its implications for epidemiologic research: a cross‐sectional study. Journal of Trace Elements in Medicine and Biology, 31, 1–10. 10.1016/j.jtemb.2015.02.001 [DOI] [PubMed] [Google Scholar]
- Vinceti M, Grioni S, Alber D, Consonni D, Malagoli C, Agnoli C, Malavolti M, Pala V, Krogh V and Sieri S, 2015b. Toenail selenium and risk of type 2 diabetes: the ORDET cohort study. Journal of Trace Elements in Medicine and Biology, 29, 145–150. 10.1016/j.jtemb.2014.07.017 [DOI] [PubMed] [Google Scholar]
- Vinceti M, Mandrioli J, Borella P, Michalke B, Tsatsakis A and Finkelstein Y, 2014. Selenium neurotoxicity in humans: bridging laboratory and epidemiologic studies. Toxicology Letters, 230, 295–303. 10.1016/j.toxlet.2013.11.016 [DOI] [PubMed] [Google Scholar]
- Virtamo J, Valkeila E, Alfthan G, Punsar S, Huttunen JK and Karvonen MJ, 1985. Serum selenium and the risk of coronary heart disease and stroke. American Journal of Epidemiology, 122, 276–282. 10.1093/oxfordjournals.aje.a114099 [DOI] [PubMed] [Google Scholar]
- Virtanen SM, van't Veer P, Kok F, Kardinaal AF and Aro A, 1996. Predictors of adipose tissue tocopherol and toenail selenium levels in nine countries: the EURAMIC study. European Multicentre Case‐Control Study on Antioxidants, Myocardial Infarction, and Cancer of the Breast. European Journal of Clinical Nutrition, 50, 599–606. [PubMed] [Google Scholar]
- Wallenberg M, Misra S, Wasik AM, Marzano C, Björnstedt M, Gandin V and Fernandes AP, 2014. Selenium induces a multi‐targeted cell death process in addition to ROS formation. Journal of Cellular and Molecular Medicine, 18, 671–684. 10.1111/jcmm.12214 [DOI] [PMC free article] [PubMed] [Google Scholar]
- Wang X, Seo YA and Park SK, 2021. Serum selenium and non‐alcoholic fatty liver disease (NAFLD) in U.S. adults: National Health and Nutrition Examination Survey (NHANES) 2011–2016. Environmental Research, 197, 111190. 10.1016/j.envres.2021.111190 [DOI] [PMC free article] [PubMed] [Google Scholar]
- Wang X, Vatamaniuk MZ, Roneker CA, Pepper MP, Hu LG, Simmons RA and Lei XG, 2011. Knockouts of SOD1 and GPX1 exert different impacts on murine islet function and pancreatic integrity. Antioxidants and Redox Signalling, 14, 391–401. 10.1089/ars.2010.3302 [DOI] [PMC free article] [PubMed] [Google Scholar]
- Ward‐Deitrich CL, Whyte E, Hopley C, Rayman MP, Ogra Y and Goenaga‐Infante H, 2021. Systematic study of the selenium fractionation in human plasma from a cancer prevention trial using HPLC hyphenated to ICP‐MS and ESI‐MS/MS. Analytical and Bioanalytical Chemistry, 413, 331–344. 10.1007/s00216-020-02988-9 [DOI] [PubMed] [Google Scholar]
- Waschulewski IH and Sunde RA, 1988a. Effect of dietary methionine on tissue selenium and glutathione peroxidase (EC 1.11.1.9) activity in rats given selenomethionine. British Journal of Nutrition, 60, 57–68. 10.1079/bjn19880076 [DOI] [PubMed] [Google Scholar]
- Waschulewski IH and Sunde RA, 1988b. Effect of dietary methionine on utilization of tissue selenium from dietary selenomethionine for glutathione peroxidase in the rat. Journal of Nutrition, 118, 367–374. 10.1093/jn/118.3.367 [DOI] [PubMed] [Google Scholar]
- Webb A and Kerns W, 2009. What is the origin of these nail changes in an otherwise healthy young patient? Journal of Medical Toxicology, 5(31), 39. 10.1007/BF03160980 [DOI] [PMC free article] [PubMed] [Google Scholar]
- Wei WQ, Abnet CC, Qiao YL, Dawsey SM, Dong ZW, Sun XD, Fan JH, Gunter EW, Taylor PR and Mark SD, 2004. Prospective study of serum selenium concentrations and esophageal and gastric cardia cancer, heart disease, stroke, and total death. American Journal of Clinical Nutrition, 79, 80–85. 10.1093/ajcn/79.1.80 [DOI] [PubMed] [Google Scholar]
- White PJ, 2018. Selenium metabolism in plants. Biochimica et Biophysica Acta (BBA) – General Subjects, 1862, 2333–2342. 10.1016/j.bbagen.2018.05.006 [DOI] [PubMed] [Google Scholar]
- WHO (World Health Organization) , 2011. Selenium in drinking‐water – background document for development of WHO Guidelines for drinking‐water quality. WHO/HSE/WSH/10.01/14. 14 pp.
- WHO Multicentre Growth Reference Study Group , 2006. WHO Child Growth Standards based on length/height, weight and age. Acta Paediatrica Supplement, 450, 76–85. 10.1111/j.1651-2227.2006.tb02378.x [DOI] [PubMed] [Google Scholar]
- WHO/FAO (World Health Organization/Food and Agriculture Organization of the United Nations) , 2004. Vitamin and mineral requirements in human nutrition: report of a Joint FAO/WHO Expert Consultation. Bangkok, Thailand, 21–30 September 1998. 341 pp.
- WHO/IPCS (World Health Organization/International Programme on Chemical Safety) , 1993. Biomarkers and risk assessment: concepts and principles. Environmental Health Criteria, 155, 86. Available online. https://apps.who.int/iris/handle/10665/39037 [Google Scholar]
- Willett WC, Howe GR and Kushi LH, 1997. Adjustment for total energy intake in epidemiologic studies. The American Journal of Clinical Nutrition, 65, 1220S–1228S. 10.1093/ajcn/65.4.1220S [DOI] [PubMed] [Google Scholar]
- Winther KH, Bonnema SJ, Cold F, Debrabant B, Nybo M, Cold S and Hegedus L, 2015. Does selenium supplementation affect thyroid function? Results from a randomized, controlled, double‐blinded trial in a Danish population. European Journal of Endocrinology, 172, 657–667. 10.1530/EJE-15-0069 [DOI] [PubMed] [Google Scholar]
- Wu J, Zeng C, Yang Z, Li X, Lei G, Xie D, Wang Y, Wei J and Yang T, 2020. Association between dietary selenium intake and the prevalence of nonalcoholic fatty liver disease: a cross‐sectional study. Journal of the American College of Nutrition, 39, 103–111. 10.1080/07315724.2019.1613271 [DOI] [PubMed] [Google Scholar]
- Xia Y, Hill KE, Byrne DW, Xu J and Burk RF, 2005. Effectiveness of selenium supplements in a low‐selenium area of China. American Journal of Clinical Nutrition, 81, 829–834. 10.1093/ajcn/81.4.829 [DOI] [PubMed] [Google Scholar]
- Xia Y, Hill KE, Li P, Xu J, Zhou D, Motley AK, Wang L, Byrne DW and Burk RF, 2010. Optimization of selenoprotein P and other plasma selenium biomarkers for the assessment of the selenium nutritional requirement: a placebo‐controlled, double‐blind study of selenomethionine supplementation in selenium‐deficient Chinese subjects. American Journal of Clinical Nutrition, 92, 525–531. [DOI] [PMC free article] [PubMed] [Google Scholar]
- Xun P, Bujnowski D, Liu K, Morris JS, Guo Z and He K, 2011. Distribution of toenail selenium levels in young adult Caucasians and African Americans in the United States: the CARDIA Trace Element Study. Environmental Research, 111, 514–519. 10.1016/j.envres.2011.01.016 [DOI] [PMC free article] [PubMed] [Google Scholar]
- Yamashita Y and Yamashita M, 2010. Identification of a novel selenium‐containing compound, selenoneine, as the predominant chemical form of organic selenium in the blood of bluefin tuna. Journal of Biological Chemistry, 285, 18134–18138. 10.1074/jbc.C110.106377 [DOI] [PMC free article] [PubMed] [Google Scholar]
- Yang G, Yin S, Zhou R, Gu L, Yan B, Liu Y and Liu Y, 1989a. Studies of safe maximal daily dietary Se‐intake in a seleniferous area in China. Part II: Relation between Se‐intake and the manifestation of clinical signs and certain biochemical alterations in blood and urine. Journal of Trace Elements and Electrolytes in Health and Disease, 3, 123–130. [PubMed] [Google Scholar]
- Yang G and Zhou R, 1994. Further observations on the human maximum safe dietary selenium intake in a seleniferous area of China. Journal of Trace Elements and Electrolytes in Health and Disease, 8, 159–165. [PubMed] [Google Scholar]
- Yang G, Zhou R, Yin S, Gu L, Yan B, Liu Y, Liu Y and Li X, 1989b. Studies of safe maximal daily dietary selenium intake in a seleniferous area in China. Part I. Selenium intake and tissue selenium levels of the inhabitants. Journal of Trace Elements and Electrolytes in Health and Disease, 3, 77–87. [PubMed] [Google Scholar]
- Yang GQ, Zhu LZ, Liu SJ and Gu LZ, 1987. Human selenium requirements in China. In: Combs GF, Spallholz JE, Levander OA and Oldfield JE (eds.). Selenium in Biology and Medicine (Part B). Van Nostrand Reinhold Company, New York. pp. 589–607. [Google Scholar]
- Yang Z, Yan C, Liu G, Niu Y, Zhang W, Lu S, Li X, Zhang H, Ning G, Fan J, Qin L and Su Q, 2016. Plasma selenium levels and nonalcoholic fatty liver disease in Chinese adults: a cross‐sectional analysis. Scientific Reports, 6, 37288. 10.1038/srep37288 [DOI] [PMC free article] [PubMed] [Google Scholar]
- Yoshizawa K, Willett WC, Morris SJ, Stampfer MJ, Spiegelman D, Rimm EB and Giovannucci E, 1998. Study of prediagnostic selenium level in toenails and the risk of advanced prostate cancer. Journal of the National Cancer Institute, 90, 1219–1224. 10.1093/jnci/90.16.1219 [DOI] [PubMed] [Google Scholar]
- Yu V, Juhász M, Chiang A and Atanaskova Mesinkovska N, 2018. Alopecia and associated toxic agents: a systematic review. Skin Appendage Disorders, 4, 245–260. 10.1159/000485749 [DOI] [PMC free article] [PubMed] [Google Scholar]
- Yuan Y, Xiao Y, Yu Y, Liu Y, Feng W, Qiu G, Wang H, Liu B, Wang J, Zhou L, Liu K, Xu X, Yang H, Li X, Qi L, Zhang X, He M, Hu FB, Pan A and Wu T, 2018. Associations of multiple plasma metals with incident type 2 diabetes in Chinese adults: the Dongfeng‐Tongji Cohort. Environmental Pollution, 237, 917–925. 10.1016/j.envpol.2018.01.046 [DOI] [PubMed] [Google Scholar]
- Zachariah M, Maamoun H, Milano L, Rayman MP, Meira LB and Agouni A, 2021. Endoplasmic reticulum stress and oxidative stress drive endothelial dysfunction induced by high selenium. Journal of Cellular Physiology, 236, 4348–4359. 10.1002/jcp.30175 [DOI] [PubMed] [Google Scholar]
- Zhang Y, Li H, Lin T, Guo H, Jiang C, Xie L, Li Y, Zhou Z, Song Y, Wang B, Liu C, Liu L, Li J, Zhang Y, Wang G, Liang M, Cui Y, Huo Y, Yang Y, Ling W, Yang J, Wang X, Zhang H, Qin X and Xu X, 2019. Plasma selenium levels and risk of new‐onset diabetes in hypertensive adults. Journal of Trace Elements in Medicine and Biology, 56, 6–12. 10.1016/j.jtemb.2019.07.003 [DOI] [PubMed] [Google Scholar]
Associated Data
This section collects any data citations, data availability statements, or supplementary materials included in this article.
Supplementary Materials
Protocol for the Scientific opinion on the tolerable upper intake level for selenium
Statistical analysis of evidence from studies identified in the published scientific literature as preparatory work for the setting of a Tolerable Upper Intake Level for selenium
EFSA's intake assessment of selenium
Intake data from Competent Authorities in European Member States
References excluded at the stages of full‐text screening and data extraction
Public consultation outcome