

Abstract
Rett syndrome causing missense mutations in the methyl-CpG-binding domain (MBD) of methyl CpG-binding protein 2 (MeCP2) were investigated both in silico and in vitro to reveal their effect on protein stability. It is demonstrated that the vast majority of frequently occurring mutations in the human population indeed alter the MBD folding free energy by a fraction of a kcal/mol up to more than 1 kcal/mol. While the absolute magnitude of the change of the free energy is small, the effect on the MBD functionality may be substantial since the folding free energy of MBD is about 2 kcal/mol only. Thus, it is emphasized that the effect of mutations on protein integrity should be evaluated with respect to the wild-type folding free energy but not with the absolute value of the folding free energy change. Furthermore, it was observed that the magnitude of the effect is correlated neither with the burial of the mutation sites nor with the basic amino acid physico-chemical property change. Mutations that strongly perturb the immediate structural features were found to have little effect on folding free energy while very conservative mutations resulted in large changes of the MBD stability. This observation was attributed to the protein’s ability to structurally relax and re-organize to reduce the effect of mutation. Comparison between in silico and in vitro results indicated that some webservers perform relatively well while the free energy perturbation approach frequently over-predicts the magnitude of the free energy change especially when a charged amino acid is involved.
Keywords: Rett syndrome, RTT, MeCP2, stability changes, folding free energy
Graphical Abstract
Effects of mutations on folding free energy change
Introduction
Rett Syndrome (RTT) is a progressive neurodevelopmental disease (1–3) manifested by loss of hand skills, impaired mobility and speech, and development of stereotypical hand movements. (4–7) It is a leading cause of severe mental retardation in girls. (8–11) RTT is a monogenic and relatively common disorder affecting 1 in 10,000 females with 20,000 RTT patients in the US and 50,000 worldwide. (12)
Most cases of RTT are caused by mutations in the X-linked MECP2 gene coding for methyl CpG-binding protein 2, MeCP2. (9) The MeCP2 protein is an abundant mammalian protein with two major domains namely methyl-CpG-binding domain (MBD) and transcriptional repression domain (TRD). (13–16) As the names suggest, its main functions include specific binding to methylated DNA and transcriptional repression from methylated gene promoters. It may also have additional roles in regulating gene expression and chromatin structure. (17, 18) Other functions were implicated as well (19), specifically the MeCP2 has been suggested to function as a transcription activator (17) and to be essential for embryonic development (1).
Significant number of RTT-causing mutations in MeCP2 has been identified. (20) Currently, there are 1573 single nucleotide polymorphisms (SNPs) known in MeCP2 spanning over different parts of the protein mainly being in the MBD, TRD and C-terminal regions. (21) Some of them are harmless others are disease-causing. Considering the mutations with a frequency of 0.05% or more, the 20% of the RTT cases are caused by mutations in the MBD domain of MeCP2 (Figure 1). However, in general, the severity of symptoms was found not to be correlated with the frequency of mutations. (22)
Figure 1.

Frequency (%) of MBD mutations studied.
Despite the numerous clinically identified cases, the details of molecular mechanism of RTT and how different mutations lead to disruption in brain function remain to be understood. Among many, one plausible cause of MeCP2 function failure may be that the RTT mutations de-stabilize or over-stabilize the MeCP2 protein. A few of these high frequency mutations were subjected to a number of previous experimental investigations and it was shown that most of them are indeed destabilizing. (23–26) In particular, the de-stabilized MBD domain may be targeted by proteases and degraded before being involved in their function. Alternatively, over-stabilized MBD domain may be too rigid to carry the corresponding reaction. Both cases could result in a dysfunctional MeCP2 protein. Therefore, revealing the effects of RTT causing mutations could be suggestive for plausible treatment. For example, a restoration of the MeCP2 protein in MeCP2-deficient mice with advanced neurological symptoms was shown to lead to reversal of many aspects of the phenotype, suggesting that RTT may be therapeutically reversible in humans as well. (27)
The stability change upon single point mutations is characterized and quantified through folding free energy change (ΔΔG). Only several RTT mutations have been studied previously. (23–26) The current work not only encompasses all major RTT mutations but also quantifies the effects of mutations through both in silico and in vitro experiments. In addition, the current work utilizes, along with others, the free energy perturbation (FEP) method to calculate the ΔΔG. Previous computational studies regarding effects of mutations on stability utilize methods other than FEP and almost always point out that FEP along with thermodynamic integration is the most accurate method for this purpose (31). However, it has not been exploited extensively due to the cost of the calculations. We utilized several different FEP protocols in the current work. However, despite the general expectation, the FEP results were not only in less agreement with the experiment but also several of them were unrealistically high. In general, it is demonstrated through urea unfolding that indeed some of the RTT-associated mutations dramatically affect the stability of MBD domain and thus, affect the normal function of the MeCP2 protein. Quite interestingly, chemically modest mutations were found to cause the largest effects on ΔΔG while in some cases, dramatic amino acid property changes cause only a minimal change in protein stability.
Materials and Methods
Mutations investigated
The most common RTT-causing mutations in the MBD of MeCP2 from RettBase (20) are studied in this work. The list of mutations starting from the most common are: T158M, R133C, R106W, P152R, A140V, S134C, R106Q, D156E, R133H, L100V, F155S, T158A and R111G. Although the last two are rare, they were added to the list because there is previous experimental data available for T158A and also R111 is located at a critical position in direct interaction with the DNA same as the R133. The frequency of each mutation and the mutation positions within the 3D structure of MBD domain are shown in Figure 1 and 2, respectively.
Figure 2.

Superimposition of 91–162 regions in 1QK9 (orange) and 3C2I (blue) structures. The 10 target mutational sites are shown in yellow (3C2I) and cyan (1QK9) colors. The two DNA binding sites are put in gray squares (R111 and R133).
In silico modeling
There have been several simulation protocols developed to calculate the folding free energy changes upon mutations from sequence, structure and physics based methods to more rigorous statistical mechanics based equilibrium or non-equilibrium approaches. (28–31) We utilized the free energy perturbation (FEP) (32, 33) method based on standard molecular dynamics sampling and also several other methods that are known to be fast to obtain a consensus prediction. Below, the FEP method implementation in the current work is described along with other methods and webservers utilized.
Initial Structure Preparation for the FEP protocol
All structural preparations and analyses of simulations were done using the VMD software (34) and the FEP simulations were run using the NAMD program. (35) Both the solution NMR structure (1QK9) (15) and the crystal structure (3C2I) (36) were used. Superimposition of the two structures along with the target mutation sites (yellow and turquoise) are shown in Figure 2. Except the A140 and R106, which are located on a helix and a strand, all mutation sites are in loop regions.
First, the wild-type (WT) and mutant structures were prepared by adding hydrogen atoms and also N- and C-termini patches following 20,000 steps of energy minimization.
A set of initial structures for FEP was formed by subjecting the minimized WT and mutant structures to fast conformational sampling by CONCOORD (37) and CRANKITE (38) programs. For this set, both the 1QK9 and 3C2I structures were used. 10 structures for each WT protein structure and also 10 structures for each mutant were generated via each sampling algorithm listed above. Then, the dual topology files were prepared. Therefore, the procedure ensures 40 dual topology structures for each of the 1QK9 and 3C2I structures making the total number 80 for each mutation type.
After generating the dual topology files for each structure in each set, the structures were solvated with 10 Å thick water layers in 3-dimensions and then Na+ and Cl− ions were added to ensure the charge neutrality and the physiological salt concentration of 0.15 M.
Free Energy Perturbation
The free energy difference between state A and state B is represented as where the averages are taken over the ensemble generated in states A and B, and UA and UB are their potential energies, respectively. In this work, the sampling of potential energies in the above equation are done through molecular dynamics (MD). In the framework of FEP, the free energy difference between two states is calculated by a gradual ‘alchemical’ transformation of the initial state to the final through intermediate states along a well-defined pathway that connects states A and B. This pathway is characterized by a coupling parameter, λ, by making the potential energy and hence the free energy a continuous function of this parameter between states A (λ=0) and B (λ=1). In the FEP approach (33):
| 1 |
Here, N stands for the number of intermediate states, while λ=0 represents the wild-type structure and λ=1 represents the mutant. During the transformation, the side chains of the wild-type residue ‘disappear’ while the mutant residue side chain atoms ‘appear’ when λ being changed from 0 to 1.
Computational Details and Analysis of FEP
Langevin dynamics with periodic boundary conditions was performed in NPT (constant pressure, constant temperature) ensemble using the CHARMM22 (39) force field with CMAP corrections. (40, 41) vdW interactions were truncated with a switching function in 10 Å distance with 8 to 10 Å cutoff. Electrostatic interactions were truncated with particle mesh Ewald (PME). (42) Each dual topology structure was subjected to 700 steps of minimization and 100 ps of equilibration. After that the alchemical transformation was done in total of 14 intermediate steps with 0.5 ps of sampling for each in forward and backward directions. Different length of simulations, such as total simulation times of 280 ps, 2 ns and 20 ns were also tried. Computational details of the 20 ns-long (forward and backward sampling) FEP simulations along with the results can be found in the SI.
The overall free energy change was obtained with combined forward and backward calculations using the Bennett’s acceptance ratio (BAR) method (as implemented in parseFEP plugin of VMD) (43). More details are provided in the SI.
Unfolded State for the FEP
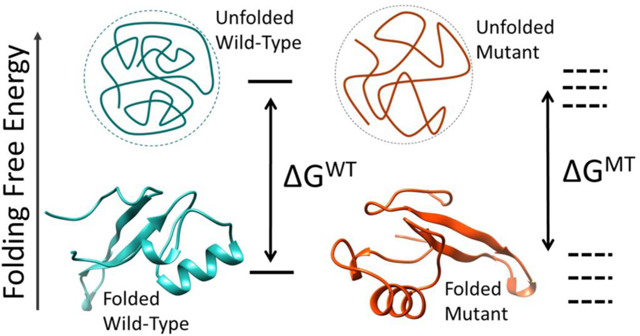
The unfolded state was modeled as a three residue segment with the mutation site in the middle extracted from the protein and the terminal groups were capped by ACE and CT3 groups. This approach has been used in considerable success by our group and other groups in the past. (44–46) Then, the same initial preparation procedures and simulation details were applied as described above. Finally, the change in folding free energy for each mutation was determined by taking the difference between the wild-type and mutant ΔG values (ΔG1-ΔG2) as shown in Figure 3, where the positive ΔΔG means destabilizing effect due to mutation. The results were averaged from the ΔΔG values obtained from using 80 different structures.
Figure 3.

Thermodynamic cycle for folding and mutational modeling. WT – wild-type; U – unfolded state; MT- mutant; F – folded.
Webservers Utilized: FoldX, NeEMO, I-Mutant3.0, DUET, mCSM and PoPMuSiC
The structures for webservers were prepared in the following way. First, the 1QK9 and 3C2I structures (sequence 91–162) were prepared using VMD, i.e. hydrogens are added and the mutation in the 3C2I structure (A140M) was mutated back to the canonical sequence. The mutants were prepared by mutating the residue in question from these WT protein structures. Then, the WT and mutant structures were solvated with TIP3P waters and Na+ and Cl− ions were added to ensure 0.15 M salt solution and neutrality. Then, the solvated structures were relaxed for 20,000 steps. Below we briefly outline the methods utilized in the webservers used in this study.
PoPMuSiC (47) method utilizes a knowledge-based statistical potential, based on a formalism that highlights the coupling between four protein sequence and structure descriptors, and takes into account the amino acid volume variation upon mutation. The stability change is expressed as a linear combination of these energy functions, whose proportionality coefficients vary with the solvent accessibility of the mutated residue.
DUET (48) is a consensus predictor utilizing the results from the SDM server (49), which utilizes a statistical potential, and the mCSM server (50) using support vector machine, which was shown to provide superior accuracy compared to each of the individual methods.
FoldX (51) uses a physics-based potential function, which takes several different contributions into account when calculating the folding free energy differences for WT and mutant, and then the difference between the two reveals the effect of mutations on the folding free energy. These contributions are van der Waals, solvation free energy for polar and apolar groups, formation of intra-molecular hydrogen bonds compared to inter-molecular hydrogen bond formation, water bridges, electrostatic contribution of charged groups including the helix dipole and entropic contributions. The final free energy change is calculated by combining these contributions with assigned weights.
NeEMO method (52) utilizes machine learning (non-linear neural network), where relevant features considered in training are evolutionary information, residue conformational propensities, amino acid information and network topology. Basically, the impact of amino acid changes on protein stability is calculated based on residue interaction networks.
In Vitro Experiments
Plasmid Construction, Cloning and Expression of Recombinant MeCP2 and Mutants
The human MeCP2 and the mutant R133C were kindly supplied by Dr. Timur Yusufzai at Harvard Medical School (53). The MBD region (residues 77–167) was amplified by PCR using the forward primer MBD_77_F (5’- CATGCCATGGCTTCTGCCTCCCCCAA-3’, the NcoI site is underlined) and the reverse primer MBD_167_R (5’- CCGCTCGAGCCGGGAGGGGCT-3’, the XhoI site is underlined). The resulting amplicons and expression vector pET28b were digested by NcoI and XhoI, ligated and transformed into E.coli strain DH5α competent cells. The resulting plasmid with wild-type MBD was used as the template plasmid for all other 12 MBD mutants. Overlapping extension PCR procedures were performed as previously described by using primers carrying the desired mutations (54), listed below:
MBD_T158M_F: 5’-GGACCCTAATGATTTTGACTTCATGGTAACTGGGAGAG-3’; MBD_T158M_R: 5’-CTCTCCCAGTTACCATGAAGTCAAAATCATTAGGGTCC-3’; MBD_R106W_F: 5’-CTGCCTGAAGGCTGGACATGGAAGCTTAAGCAAA-3’; MBD_R106W_R: 5’-TTTGCTTAAGCTTCCATGTCCAGCCTTCAGGCAG-3’; MBD_R106Q_F: 5’- CCTTTGCTTAAGCTTCTGTGTCCAGCCTTCAGG-3’; MBD_R106Q_R: 5’- CCTGAAGGCTGGACACAGAAGCTTAAGCAAAGG-3’; MBD_R111G_F: 5’- GCGGCCAGATTTCCCTTGCTTAAGCTTCCGTGTC-3’; MBD_R111G_R: 5’- GACACGGAAGCTTAAGCAAGGGAAATCTGGCCGC-3’; MBD_A140V_F: 5’-TCTAAAGTGGAGTTGATTGTGTACTTCGAAAAGGTAGGC-3’; MBD_A140V_R: 5’-GCCTACCTTTTCGAAGTACACAATCAACTCCACTTTAGA-3’; MBD_S134C_F: 5’-GGGAAAAGCCTTTCGCTGTAAAGTGGAGTTGATTG-3’; MBD_S134C_R: 5’-CAATCAACTCCACTTTACAGCGAAAGGCTTTTCCC-3’; MBD_P152R_F: 5’- GTGAAGTCAAAATCATTACGGTCCAGGGATGTGTCG-3’; MBD_P152R_R: 5’- CGACACATCCCTGGACCGTAATGATTTTGACTTCAC-3’; MBD_D156E_F: 5’-CTGGACCCTAATGATTTTGAGTTCACGGTAACTGGG-3’; MBD_D156E_R: 5’-CCCAGTTACCGTGAACTCAAAATCATTAGGGTCCAG-3’; MBD_R133H_F: 5’-CCAGGGAAAAGCCTTTCACTCTAAAGTGGAGTTGA-3’; MBD_R133H_R: 5’-TCAACTCCACTTTAGAGTGAAAGGCTTTTCCCTGG-3’; MBD_L100V_F: 5’-GTATGATGACCCCACCGTGCCTGAAGGCTGGAC-3’; MBD_L100V_R: 5’-GTCCAGCCTTCAGGCACGGTGGGGTCATCATAC-3’; MBD_F155S_F: 5’-CATCCCTGGACCCTAATGATAGTGACTTCACGGTAACTGG-3’; MBD_F155S_R: 5’-CCAGTTACCGTGAAGTCACTATCATTAGGGTCCAGGGATG-3’; MBD_T158A_F: 5’-CTAATGATTTTGACTTCGCGGTAACTGGGAGAGGG-3’; MBD_T158A_R: 5’-CCCTCTCCCAGTTACCGCGAAGTCAAAATCATTAG-3’.
All constructs were confirmed by DNA sequencing and transformed into E. coli strain ArcticExpress (DE3) competent cells. All C-terminal 6-His-tagged MBD proteins were purified following similar procedures previously described (54). Briefly, single colony producing the corresponding protein was grown overnight in 10 ml LB containing 80 μg/ml kanamycin, 50 μg/ml tetracycline and 10 μg/ml gentamicin at 37 °C. A cell culture was diluted 100-fold into LB medium (500 mL) and grown at 30°C with shaking at 250 rpm until the optical density at 595 nm reached about 0.8. After cool down to 11°C (about one hour), isopropyl-1-thio-α-d-galctopyranoside (IPTG) was added to a final concentration of 0.8 mM, and the culture was further shaken at 11°C for 20 hours to overexpress proteins. The cells were collected by centrifugation at 5,000 rpm with JLA-81000 rotor at 4°C and washed once with pre-cooled Buffer A (20 mM Tris-HCl (pH 7.5), 300 mM NaCl and 40 mM imidazole). The cell pellet was suspended in 10 ml Buffer A and sonicated at output 5 for 3 × 1 min with 5 min rest on ice between intervals using Qsonica model Q125. The cell lysate was clarified by centrifugation at 12,000 rpm with JLA-16.250 rotor at 4°C for 20 minutes. The supernatant was transferred into a fresh tube and applied onto 1 ml HisTrap FF column (GE-Healthcare). The bound proteins were eluted with a linear gradient of 0–100% Buffer B (20 mM Tris-HCl (pH 7.5), 300 mM NaCl and 500 mM imidazole). Fractions containing a MBD protein were identified by SDS-PAGE, pooled, and applied to a 1 ml HiTrap SP FF column, which was pre-equilibrated with buffer A without imidazole (20 mM Tris-HCl (pH 7.5), 300 mM NaCl). By linear gradient elution (300 mM-1000 mM NaCl), MBD was eluted at around 550 mM NaCl. The eluted MBD protein (residues 77–167) was concentrated and exchanged to a storage buffer (10 mM potassium phosphate buffer (pH 7.5), 1 mM DTT and 100 mM KCl) through Microcon YM 10 (Millipore). The protein concentration was quantified by spectrophotometrically using a calculated extinction coefficient of 0.99 OD280/mg/ml/cm for the wild-type and mutant MBD proteins with the exception of R106W, in which a calculated extinction coefficient of 1.47 OD280/mg/ml/cm was used (55).
Circular Dichroism Spectrum and Urea-induced Unfolding
Circular dichroism (CD) spectra of MBD proteins (0.05 mg/ml) at 25°C were measured in quartz cuvette (Starna Cells) of 0.1 cm path length using JASCO J-810 spectropolarimeter at different concentrations of urea to induce MBD unfolding (56). Reverse titration was carried out by diluting urea-unfolded MBDs to indicated concentration and kept at 18°C at least 4 hours. For each CD spectrum, ellipticity and absorbance values were obtained over a wavelength from 220 to 300 nm, at a scan rate of 50 nm/min and a response time of 0.25 s. At least five spectra were collected per protein at indicated concentration of urea and averaged. The difference between the absorbance at 280 nm and 300 nm was used for calibrating protein concentration. The mean residue ellipticity ([θ]) (degrees cm2 dmol−1 residue−1) was converted from buffer-subtracted CD signals by equation (2) (57)
| 2 |
where l is the path length of the cuvette, is the MBD protein concentration in solution, M is the mean residue molecular weight for each mutants. The fraction of denatured protein () with certain concentration of urea and the apparent free energy on denaturation () were calculated from the mean residue ellipticity at 222 nm () using equations (3) and (4) by assuming a two-state transition model (58)
| 3 |
| 4 |
where is the mean residue ellipticity at 222 nm of protein with native state, is the mean residue ellipticity at 222 nm of protein in fully denatured state, R is the ideal gas constant and T is the absolute temperature. A plot of free energy versus urea concentration was constructed, and the free energy of denaturation in H2O () was obtained by fitting the curve with equation (5)
| 5 |
where [Urea] is concentration of urea and m is the slope of the straight line. The difference of the apparent free-energy change on denaturation for each mutants compare to wild-type MBD was calculated as equation (6) (58, 59)or equation (7) (60, 61),
| 6 |
| 7 |
where is the average value of all urea denature curves and is the difference between the value of denaturation midpoint (, obtained from logistic function) for the wild-type and mutant MBD proteins.
Results and Discussion
Two experimental structures are available for the MBD region of MeCP2 namely, PDB IDs 3C2I (X-ray crystallographic structure of MBD with DNA) and 1QK9 (NMR structure of MBD). The MBD forms a wedge-like structure with two beta strands and an alpha helix. The strands and the helical regions form two faces of the wedge as shown in Figure 2. Assessment of the protein structure reveals that the protein has a number of salt bridges that help maintain the structured helical and strand regions, as well as a number of intramolecular hydrogen bonds. It is expected that mutations disrupting these structural features may have severe implications in regards to the stability of the protein and subsequently in disease mechanism.
Impact of Mutations on MBD Stability
Most common RTT mutations were studied with regards to their impact on folding free energy of MBD using FEP simulations as well as a diverse set of fast methods as outlined in the methods section. In parallel, experiments were carried out to measure the same quantity.
Experimental measurements.
All MBD variants were first transformed into E. coli strain Rosetta 2 (DE3) pLyss for overexpression and purification. Most of the MBD mutants except for R133C, R111G, A140V and R133H either did not expressed well (< 50 μg per 500 ml cell culture) or formed inclusion bodies. These results indicated that the expressed proteins were either unstable or failed to fold properly. By changing the host strain to E. coli ArcticExpress (DE3), which co-expressed the cold-adapted chaperonins Cpn10 and Cpn60 to overcome misfolding and insolubility (62), the yields of soluble recombinant proteins were substantially increased as shown in Table 1. The denaturation of wild-type and mutant MBD proteins was measured from the changes of the mean residue ellipticity at 222 nm with an increasing urea concentration. Urea-induced denaturation of MBD proteins was reversible and hysteresis-free, as the data trace for the unfolding titration is fixed with that of the reverse titration, and showed a two-state transition (Figure 4(a)). The apparent free-energy change in the absence of urea was obtained by using linear extrapolation method as described in the Materials and Methods, and the representative fitting curves are shown in Figure 4(b). The differences of the apparent free-energy change were calculated via two different methods. Results of denaturation are presented in Table 1. Most of the mutants were found to be destabilizing, and in particular, P152R, S134C and L100V showed a free energy difference of unfolding by over 1 kcal mol−1 from both calculations (note that WT unfolding free energy is only 2.07kcal/mol, Table 1). In contrast, R106W, R111G and A140V were more stable as indicated by a negative free energy difference (Table 1). In general, the low-yield mutants during protein preparation (P152R, S134C and L100V) were found to destabilize MBD domain by similar amount (Table 1).
Table 1.
Equilibrium denaturation of MBD for WT (Wild-type) and mutants
| MBD variants | Protein Prep Yield* (mg) | Cm (M) | m (kcal mol−1 M−1) | (kcal mol−1 ) | (kcal mol−1 ) | (kcal mol−1) |
|---|---|---|---|---|---|---|
| WT | 1.0 | 4.1 ± 0.2 | 0.54 ± 0.04 | 2.07 ± 0.15 | ||
| T158M | 0.9 | 3.8 ± 0.3 | 0.43 ± 0.02 | 1.71 ± 0.09 | 0.36 | 0.14 |
| R133C | 0.7 | 3.7 ± 0.2 | 0.41 ± 0.05 | 1.55 ± 0.18 | 0.52 | 0.21 |
| R106W | 0.8 | 4.0 ± 0.2 | 0.47 ± 0.03 | 2.02 ± 0.12 | 0.05 | 0.03 |
| P152R | 0.4 | 0.8 ± 0.3 | 1.01 ± 0.14 | 0.97 ± 0.14 | 1.10 | 1.82 |
| A140V | 1.4 | 5.2 ± 0.4 | 0.53 ± 0.03 | 2.8 ± 0.16 | −0.73 | −0.61 |
| S134C | 0.4 | 2.0 ± 0.3 | 0.56 ± 0.11 | 1.13 ± 0.23 | 0.94 | 1.15 |
| R106Q | 0.7 | 3.9 ± 0.2 | 0.51 ± 0.02 | 1.91 ± 0.09 | 0.16 | 0.08 |
| D156E | 0.4 | 2.8 ± 0.2 | 0.41 ± 0.04 | 1.03 ± 0.09 | 1.04 | 0.71 |
| R133H | 0.8 | 3.7 ± 0.3 | 0.58 ± 0.07 | 1.83 ± 0.23 | 0.24 | 0.23 |
| L100V | 0.5 | 1.9 ± 0.2 | 0.67 ± 0.05 | 1.08 ± 0.09 | 0.99 | 1.22 |
| F155S | 0.3 | 3.2 ± 0.3 | 0.44 ± 0.03 | 1.70 ± 0.10 | 0.37 | 0.49 |
| T158A | 1.2 | 2.7 ± 0.3 | 0.54 ± 0.05 | 1.90 ± 0.17 | 0.17 | 0.77 |
| R111G | 1.6 | 4.7 ± 0.2 | 0.62 ± 0.06 | 2.59 ± 0.23 | −0.52 | −0.33 |
The protein prep yield was estimated by the final concentration and total volume from 500 ml cell culture.
Figure 4.


Representative curves of urea-induced denaturation of the wild-type and mutant MBD proteins monitored by CD.(a). Native MBDs (closed square) or urea-unfold MBDs (open circle) were diluted to indicated concentration of urea. The mean residue ellipticity at 222 nm was converted from buffer-subtracted CD signals at 222 nm and was used to calculate unfolded fraction accordingly to equation 3. The solid line represents a nonlinear fit of unfolding and refolding data to a two-state transition. The residues for the fit are shown below. (b) Representative free-energy change of MBDs at indicated concentration of urea, The dash lines represent linear extrapolation method to obtain the free-energy change in the absence of urea (64).
In silico results from web servers.
The minimized WT structures were provided to the webservers and the servers generated their own mutant structures and produced the ΔΔG predictions. Several servers generated predictions which are inconsistent with the rest of predictors or are unrealistically large. These predictions were removed from our analysis (they are available in SI, Table S1). The results from the rest of the servers, which provide consistent predictions are shown in Table 2. Using experimentally determined ΔΔG as a criterion for a correct prediction and assuming a tolerance of 0.5 kcal/mol, one can see that the NeEMO and PoPMuSiC perform better (~50% accuracy) compared to others. Also, I-Mutant3.0 and FoldX results predict 40–50% of the cases within the tolerance. The predictions from webservers indicate that all mutations studied are destabilizing with varying degrees. Also, the most destabilizing mutations were predicted to be R133H, L100V, F155S, while R106W mutation, which drastically changes the physicochemical properties of the WT residue, is measured and predicted to have less effect. In addition, it is important to mention that the webservers significantly overestimate the free energy change for F155S mutation.
Table 2:
Folding free energy differences of RTT-causing single point mutations. First number reported for each mutation is for 1QK9 structure and the second value is for 3C2I structure. Also, since Pro does not have a standard backbone, FEP simulations cannot be applied to Pro-involving mutations. Note that negative value of the predicted folding free energy change means stabilizing effect of the mutation.
| MBD Mutants | ΔΔG (kcal/mol) | |||||||
|---|---|---|---|---|---|---|---|---|
| NeEMO | IMutant3 | FoldX | DUET | mCSM | PoPMuSiC | FEP | Exp | |
| T158M | −0.25 −0.24 |
0.83 0.75 |
−0.24 −0.32 |
−0.07 −0.03 |
−0.06 −0.01 |
0.93 0.90 |
1.81 1.23 |
0.25 |
| R133C | 0.63 0.49 |
0.91 1.06 |
0.79 0.97 |
1.45 0.59 |
1.27 0.62 |
0.62 0.59 |
6.03 8.01 |
0.37 |
| R106W | 1.80 2.01 |
0.61 0.67 |
1.95 2.58 |
0.98 0.34 |
1.00 0.44 |
−0.38 −0.27 |
1.66 4.71 |
0.04 |
| P152R | 0.03 0.09 |
0.96 0.96 |
1.82 2.21 |
0.57 1.23 |
0.87 1.20 |
0.43 1.40 |
- - |
1.46 |
| A140V | 0.49 0.73 |
0.07 0.07 |
1.18 0.33 |
0.16 −0.02 |
0.34 0.24 |
0.88 0.67 |
1.08 0.28 |
−0.67 |
| S134C | 0.90 1.34 |
0.47 0.44 |
1.03 0.08 |
0.34 0.31 |
0.34 0.32 |
0.57 0.68 |
0.40 0.69 |
1.05 |
| R106Q | 1.73 1.94 |
1.14 1.19 |
2.04 2.08 |
1.42 0.94 |
0.25 0.42 |
0.86 1.55 |
1.05 2.81 |
0.12 |
| D156E | 0.89 0.62 |
0.86 0.56 |
0.55 2.65 |
0.05 0.35 |
0.25 0.42 |
0.86 1.55 |
1.05 2.81 |
0.88 |
| R133H | 1.35 1.22 |
1.19 1.38 |
1.77 0.74 |
1.86 1.19 |
1.58 1.24 |
0.24 0.22 |
7.40 7.33 |
0.24 |
| L100V | 1.97 2.69 |
1.08 0.93 |
2.23 2.46 |
1.45 1.23 |
1.43 1.00 |
1.24 1.41 |
0.63 0.28 |
1.11 |
| F155S | 1.23 1.11 |
1.73 2.07 |
6.48 2.15 |
2.90 3.31 |
2.70 3.05 |
3.46 3.43 |
1.90 −0.36 |
0.43 |
| T158A | 0.19 0.25 |
1.59 1.31 |
−0.06 −0.10 |
0.26 −0.58 |
0.43 0.65 |
0.77 1.24 |
0.40 −1.28 |
0.47 |
| R111G | 1.81 1.96 |
1.28 1.10 |
1.30 2.20 |
0.70 1.85 |
0.74 1.59 |
0.59 1.11 |
5.30 4.47 |
−0.43 |
In silico results from FEP.
The FEP method is known to be rigorous and is assumed to be more accurate compared to other methods although it has not been widely applied for determining effects of mutations on folding free energy changes of proteins. However, our applications of FEP indicated less agreement with the experimental values. Several different FEP protocols were used. First, 20 ns-long (including both forward and backward sampling) simulations were performed. However, the results obtained were not only in disagreement with the experiment but were also unrealistically large, particularly for mutations that involve charged residues (see SI for details). Then, another methodology was followed, where an initial conformational sampling were performed and a total of 80 initial structures using two different programs and the two experimental structures were generated for each mutant. Then, short FEP simulations (14 ps of total sampling) were performed for each of the distinct structures and the results were averaged. This protocol produced more realistic values although still not in very impressive agreement with the experiment. The worse results were obtained for mutations involving charged residue mutations, for which the folding free energy change tend to be grossly overestimated. The results from FEP simulations along with the webserver results were averaged to obtain a consensus prediction, as shown in Figure 5. Further studies aiming at understanding the origin of lack of success in FEP results for this particular application and also ways to improve the results are underway in the lab.
Figure 5.

Comparison of overall computational prediction of ΔΔG values (predictions from webservers and FEP shown in orange, the results shown in columns 2–8 of Table 2 are averaged for each mutation) with the experimental ΔΔG measurements (shown in gray, the results in columns 6 and 7 in Table 1 are averaged for each mutation type). Standard errors are provided as well.
Structural Assessment of Wild-Type MBD and Mutants
The crystal structure (3C2I) and solution structure (1QK9) span over the MeCP2 sequence regions of 77–168 and 91–162, respectively. The full structures and the superimposition of the minimized structures of the 91–162 regions are shown in Figure 2. The backbone RMSD between the two structures is 2.28 Å.
Before continuing with the immediate structural consequences of each mutation, it is useful to examine the mutation positions shown in Figure 2. First of all, all of the positions targeted in this study are located in loop regions, except the position 106, which is located on a strand and the position 140, which is located on the helix. Visual inspection of the two structures indicates that the two structures share similar features with the main differences being in the loop region close to the N-terminal. Although the C-terminal region is also a loop, it shows a high degree of similarity, which will be explained later. Below, we continue with the structural consequences of each mutation particularly focusing on the effect of mutations on salt bridges, hydrogen bonds and solvent accessibility. The results are presented for each structure, X-ray and NMR structures, separately. In addition, how these changes compare with the measured free energy changes associated with each mutant is discussed. Comparison of experimental ΔΔG with the overall computational predictions is shown in Figure 5 and immediate structural effects of each mutation are summarized in Table 3. These predicted structural effects are obtained by comparing the minimized wild-type experimental structures and the mutant structures obtained by modeling using VMD Mutate plugin followed by minimization.
Table 3:
Summary of immediate structural consequences of mutants and their corresponding experimental folding free energy change. NC: No change, (−): decrease. Also, buried (Solvent Accessible Surface Area, SASA, %SASA<10) wild-type residues are marked in parenthesis under the SASA column (all others are exposed). Highlighted areas indicate the most pronounced structural effects in structure and folding free energy. For each mutation, two rows are provided when the mutational effects for 1QK9 (top row) and 3C2I (bottom row) are different.
| Mutation | Δ(H-Bond) | Δ(Salt Bridge) | Δ(SASA) (%) | ΔΔG(kcal/mol) |
|---|---|---|---|---|
| T158M | NC (2 lost, 2 new) |
NC | NC | 0.09 |
| R133C | 3 lost | 1 lost | NC −10 |
0.29 |
| R106W | 4 lost, 3 new | 2 lost | NC (buried) | −0.10 |
| P152R | 1 lost, 3 new | NC 1 lost |
NC | 1.65 |
| A140V | NC | NC | 11 NC |
−0.67 |
| S134C | NC | NC | 22 NC |
1.32 |
| R106Q | 4 lost, 3 new | 2 lost 3 lost |
NC | 0.13 |
| D156E | NC | 1 lost, 1 new 2 lost |
11 NC |
0.92 |
| R133H | 3 lost, 1 new | 1 lost NC |
NC −22 |
0.39 |
| L100V | NC | NC | −10 NC |
1.28 |
| F155S | NC (2 lost, 1 new) |
1 lost, 1 new 2 lost |
28 (buried) NC (buried) |
0.41 |
| T158A | NC | NC 1 lost |
−11 −13 |
0.43 |
| R111G | 3 lost, 1 new | 1 lost 2 lost |
NC | −0.54 |
T158M and T158A
The T158 is located in a loop in the C-terminal region. First of all, as shown in Table 3, the T158M mutation does not alter the salt bridges in both structures (3C2I and 1QK9) and the salt bridges are only slightly affected in the case of T158A. Regarding the solvent accessibility, the T158M mutation caused no change as shown in Table 3. However, the T158A mutation caused about 12% decrease in solvent accessibility of position 158 on average (Table 3).
On the other hand, hydrogen bonding pattern of both wild-type and mutant structures are different in each experimental structure. That is to say the position 158 is not involved in any hydrogen bonding in 1QK9 structure however it is located sufficiently close to R162 forming a turn. Also, the side chain of the wild-type T158 in 1QK9 forms two hydrogen bonds with the backbone of R162 and the mutant M158 in 1QK9 also has two intramolecular hydrogen bonds, one with the R162 and the other one with D156. The C-terminal region of MBD, where the T158 is, forms an Asx-ST motif held together by hydrogen bonds with R162 and further stabilized by interaction with R106 through the D156. While the structural differences upon mutations are significant as the mutations change the hydrogen bonding network around position 158, the experimental folding free energy change is negligibly small (Figure 5). Similarly, the calculated free energy changes are small as well (Table 2). Considering that the position 158 is solvent exposed (details provided in SI, S1 Figure 1), the protein may be able to reorganize itself to account for the mutation effect. Based on the experiment and calculated results, it is reasonable to expect a disease-causing mechanism other than a stability change. This is consistent with previous findings, where the T158M mutation was found to significantly reduce the binding affinity to DNA. (63)The T158A mutation also reduces the DNA binding (15, 26) indicating that the elimination of DNA binding was not because of the steric hindrance due to the larger size of Met.
R133C and R133H
The R133 is located on the loop between the helix and the second strand. An important immediate consequence of R133C mutation is the loss of the salt bridge between R133 and E137 in both wild-type structures. Also, both structures indicate that R133 makes several hydrogen bonds with E137. These bonds are lost upon the mutation to Cys as shown in Figure 6. Both the loss of a salt bridge and hydrogen bonds are expected to have crucial consequences for the stability of the MBD. Interestingly, R133 is involved in key intra-molecular contacts but at the same time, it is one of the most solvent exposed residues in wild-type structures compared to other target mutation sites (see SI). The R133H mutation causes a significant change (more than 20%) in solvent accessibility in 3C2I structure, however there is an insignificant change in solvent accessibility (less than 10%) in 1QK9 structure upon mutation.
Figure 6.

Hydrogen bonding network of position 133 in WT (a), R133C (b) and R133H (c). The summary of changes in structure and folding free energy caused by these mutations are given in the bottom right panel. The C-terminal loop is shown in turquoise color for clarity and other parts are in orange/red in Figures 6 through 9. Also, the structures shown in Figures 6–9 are minimized wild-type NMR structures and minimized mutant structures obtained by in silico mutating the NMR structure. The ΔΔG values shown in Figures 6 and 7 are from CD experiments.
Both the R133C and R133H mutations cause loss of a salt bridge and hydrogen bonds, however unlike Cys, the His is able to form new hydrogen bonds. Therefore, a large change in ΔΔG is expected particularly for R133C mutation with little to no difference between results across the 1QK9 and 3C2I structures. None of the servers predict relatively large change for R133C mutation compared to others despite the changes in local structure. The FEP simulations show unrealistically high degree of destabilization (~7 kcal/mol). The most surprising result is that the experimental folding free energy change for both substitutions are less than 0.5 kcal/mol indicating only a modest destabilizing effect (however, this “modest” effect accounts for the 25% of the wild-type folding free energy as can be seen in Table 2). One may suggest that since the position 133 is on a solvent exposed loop region, it may adopt a new conformation upon mutation to accommodate the effects of the substitutions. However, it is quite puzzling that the R133 is relatively rigid based on the root mean fluctuations of backbone atoms in the NMR structure and also the low B-factors in the crystal structure. Considering that the R133 makes direct hydrogen bonds with the DNA, the major disease causing effect is likely to be the change in its binding affinity to DNA which was previously indicated experimentally. (25)
R106W and R106Q
The R106 is located on the second strand next to the N-terminal loop. The R106W mutation is disruptive to the salt bridges that the R106 is involved in both wild-type, X-ray and NMR, structures and indirectly destabilizes the Asx-ST motif in the C-terminal. In addition, R106 makes key hydrogen bonds with D97 and D156 in both wild-type structures. Upon mutation, two of those hydrogen bonds are broken as shown in Figure 7, however a new contact is formed with the backbone of M94 in both mutant structures. Turning to solvent accessibility data, the position 106 is almost fully buried in both 1QK9 and 3C2I structures and the mutation R106W does not significantly change the degree of burial. Regarding the solvent accessibility, hydrogen bonding and salt bridges near position 106, the R106Q mutation also indicates similar effects as the R106W (Figure 7).
Figure 7.

Hydrogen bonding network of position 106 in WT (a), R106W (b) and R106Q (c). The summary of changes in structure and experimental CD folding free energy caused by these mutations are given in the bottom right panel.
From the structural point, both mutations are expected to change the ΔΔG similarly to R133 mutations. Interestingly, circular dichroism data shows that the mutation is neutral with a minimal change (−0.1 kcal/mol) of the folding free energy (Table 1 and 2). In contrast, the results from servers predict large ΔΔG and FEP overestimates (3 kcal/mol) the change. The comparison of overall computational predictions and the CD measurements are given in Figure 5 and the comparison of structural changes caused by mutations in position 106 along with the corresponding experimental folding free energy change is given in Figure 7. Considering that the position 106 is buried, it is quite puzzling how the protein overcomes the effects of these structural changes and that the folding free energy remains almost unchanged.
Although both Arg substitutions in positions 133 and 106 are severely disruptive to the structure with minimal effect on the stability, the severity of RTT phenotypes are different. While the R133C, which is seen much more common than the rest of mutations, is associated with a mild phenotype, R106W causes one of the most severe RTT cases. The difference might be due to the fact that R133 is mostly exposed, but R106 is almost fully buried. The fact that R133 is on a loop and exposed may suggest that the protein may be able to adapt a conformation that can tolerate the change but the same may not be true in the case of R106 since it is buried and also located on a structured region. In this context, the negligibly small folding free energy change is quite puzzling.
P152R
The position 152 is located in a loop region in MBD between the C-terminal and the helix. The backbone of P152 forms a hydrogen bond with F155 backbone stabilizing the loop region in 152–155 as shown in Figure 7. The Arg substitution in position 152 causes the loss of this interaction. However, Arg forms three new favorable contacts with L135 in the helix (Figure 8). The CD measurements show that the P152R mutations is highly destabilizing. The webservers also show destabilization but not as pronounced as the seen in the experiment (Figure 5). Note that the FEP method cannot be applied for mutations involving Pro.
Figure 8.

Hydrogen bonding network of position 152 in wild-type (a) and mutant (b) P152R.
A140V
The A140V is located on the helical region of MBD. Not surprisingly, the A140V mutation has no effect on salt bridges or hydrogen bonding network due to the nature of both amino acids. The position is partially exposed in wild-type structures (~40% solvent accessibility) and while the mutation has no effect on solvent accessibility in 3C2I structure, it causes a significant increase (more than 20%) in 1QK9 structure. Interestingly, the circular dichroism experiments show that the A140V is stabilizing (−0.67 kcal/mol) for the isolated MBD domain, although the substitution can be considered as conservative substitution since Ala and Val are both hydrophobic residues. On the contrary to CD measurements, both the FEP and servers predict a destabilizing effect (~0.6 kcal/mol). Perhaps the relatively large ΔΔG effect can be attributed to little or no structural re-arrangement seen in in silico modeling (Table 3 and SI).
S134C
The S134 is located at the end of the helical region between the helix and the second strand. The S134C mutation has no effect on neither salt bridges nor hydrogen bonding network. Similarly, the solvent accessibility is not affected by the mutation. However, it is quite puzzling that this mutation is highly destabilizing (1.52 kcal/mol) for the MBD as shown by the circular dichroism experiments. Both the servers and the FEP also show a destabilizing effect (~0.5 kcal/mol) but not as pronounced as the experimental degree of destabilization. Similarly as above, the experimental observation of large ΔΔG can be rationalized with the findings of in silico modeling indicating little or no structural changes.
D156E
The D156 is located on the loop near the C-terminal region. The D156E mutation is disruptive to salt bridges in both, X-ray and NMR, structures. The D156 is involved in several hydrogen bonds with residues R106 and R162 and the hydrogen bonding network remains unchanged upon mutation. Turning to solvent accessibility, while the D156 is buried in 3C2I structure, it is partially exposed in 1QK9 and the D156E mutation increases solvent exposure even more in 1QK9.
Regarding the amino acid type properties in mutations studied here, the D156E substitution may be considered to be the minimal change of the physico-chemical properties of the wild-type site since both Asp and Glu are of the same charge and both polar. Structural assessment indicates that the mutation does not alter the hydrogen bonding network but is disruptive to a salt bridge (Table 3). Interestingly, the consensus prediction from the webservers predicts that this mutation is as destabilizing as R106W. Again, although this is one of the most modest mutations regarding the change in basic amino acid properties, the experimental results indicate that the D156E is one of the most destabilizing mutations that are studied here. The FEP calculations also show a strong destabilization (~1.9 kcal/mol on average as shown in Table 2). These observations shows that in this particular case the conservation of physico-chemical properties of the wild-type amino acid are not indicator for preserving wild-type ΔG.
Apart from the ΔΔG predictions, an interesting point that may help explain the harmfulness of D156E mutation despite the minimal change in basic amino acid properties is that the D156 is conserved among all MBD-containing proteins along with residues 155 and 157.
L100V
The L100 is located on the loop in the N-terminal region. As expected, the L100V mutation has no effect on salt bridges or hydrogen bonding. Both wild-type structures show that L100 is buried (16% and 23% solvent accessibility for 1QK9 and 3C2I). The L100V mutation slightly decreases the solvent accessibility in 1QK9 and increases in 3C2I, therefore the mutant in 1QK9 is highly buried (~5% solvent accessible) while the mutant in 3C2I is partially exposed (~31% solvent accessible).
Both the wild-type and the mutant amino acids are hydrophobic. However, our experiments show that the L100V is one of the most destabilizing mutations. Similarly, the webservers also predict that L100V is one of the most destabilizing mutations. The FEP simulations also predict a destabilizing effect but not as pronounced as the effect predicted by the experiment and webservers as shown in Table 2. This should be taken as another indication that preserving physico-chemical properties of wild-type residue does not guarantee preservation of wild-type folding free energy.
F155S
The F155 is located in the loop in the C-terminal. Although it is not part of the Asx-ST motif, it affects the local structure where the motif is located. The F155S mutation is disruptive to the salt bridges that involve D156 and D121. Although the F155 itself is not involved in any specific interaction, it still affects the salt bridges because of its location. Neither F155 nor S155 in 3C2I wild-type and mutant structures is involved in any hydrogen bonding. However, the F155 backbone makes a hydrogen bond with R162 side chain causing a more compact C-terminal. Upon mutation, this hydrogen bond is lost; however, S155 side chain forms a hydrogen bond with D156 backbone. Regarding the solvent accessibility, both wild-type structures indicate that the F155 is highly buried (less than 5% solvent accessibility). Although the mutation did not affect the solvent accessibility in 3C2I structure, it caused a strong increase (~30%) in solvent exposure of position 155 in 1QK9 structure.
Since the F155 is buried and also the hydrophobic and large Phe is substituted by hydrophilic and smaller Ser, it is expected to have a significant impact on ΔΔG. However, the experimental folding free energy change shows only a slight destabilization. The FEP simulations predict similar degree of destabilization as the experiment. Surprisingly, the webservers predict the F155S as the most destabilizing mutation causing 2 to 3 times higher ΔΔG value than that of R133 and R106 substitutions. The conservation of F155 across all MBD family proteins could be the reason for the webservers producing the highest value of ΔΔG for F155S mutation since most webservers utilized here take evolutionary information into account. The experimental observation that a non-conservative mutation occurring in buried site causes minimal effect on folding free energy also indicates that in some cases the degree of burial and the conservation of physico-chemical properties may be misleading in making predictions about ΔΔG. The same is true for the R106 mutations.
R111G
The R111 is located at the end of the first strand and nearly in the loop between the two strands as seen in Figure 2. The R111 makes key hydrogen bonding with L113 and D115 and the Gly substitution causes the loss of the D115 contact which is located on the second strand (Figure 9). As seen in Table 3, the R111G mutation is predicted to cause, along with R133 and R106 substitutions, one of the most disruptive changes regarding the immediate structural consequences based on the minimized mutant structure obtained by using VMD Mutate plugin. Perhaps most surprisingly, the CD experiments predict the mutation to be stabilizing (−0.54 kcal/mol). On the contrary, the in silico results show a significant destabilization caused by this mutation (Figure 5). In addition, the RMSF values of NMR structures shows the positions 109–112 as the most flexible while the B-factors in the crystal structure for those are lower compared to others. This points out that there is DNA-induced stabilization near position 111. The MBD makes direct hydrogen bonding with the DNA through R111 and R133 residues. Therefore, perhaps the flexibility of this region plays an important role in its binding to DNA and once it is bound, these positions are stabilized. Since the R111G has a stabilizing effect on the MBD as shown by CD experiments, we speculate that it may rigidify the region which disrupts its binding to DNA and this consequently this may be the disease causing effect.
Figure 9.

Hydrogen bonding network of position 111 in wild-type (a) and mutant (b) R111G.
Conclusion
Effects of most common RTT-causing mutations on stability of MBD of MeCP2 have been investigated through in silico and in vitro studies. In particular, the change in folding free energy upon each mutation was measured through urea unfolding and modeled via several computational methods. In addition, the change in structural features of each mutation site was assessed. Interestingly, the mutations that cause the least immediate structural changes were found to be the most destabilizing mutations. In contrast, the mutations that have critical immediate structural consequences were found to have negligibly small changes in folding free energy. In such cases, if the residue in question is solvent exposed, then the protein may adapt necessary changes both structurally and energetically to accommodate the unwanted effects of mutation on stability. However, the fact that these mutations are still disease-causing indicates the mutations may affect other functions of the protein such as its binding to DNA.
Experimental measurements of wild-type MBD folding free energy resulted in 1.99 kcal/mol, which is a relatively small number. At the same time, the changes of the folding free energy caused by studied mutations were within fraction of kcal/mol up to more than 1kcal/mol. Thus, it is emphasized that the effect of mutations on protein stability should be evaluated with respect to the wild-type folding free energy, not the absolute value of the folding free energy change. Thus, a mutation altering the folding free energy of MBD by a large percentage compared to the wild-type folding free energy of 1.99 kcal/mol, while being small by absolute value, still could dramatically affect the MBD functionality.
The webservers utilized provided realistic folding free energy change values. However, the agreement with the experiment was about 50% for best performing servers. On the other hand, the FEP method, particularly when it includes sufficiently long sampling, is expected to reproduce the experimental values with better accuracy. However, the results from longer FEP simulations (20 ns) were not only in less agreement with the experiment but also were unrealistically high particularly for mutations that involve charged residues. Our second strategy, where we used short FEP simulations on pre-sampled protein conformations improved its performance for nearly all mutations. However, the same problem with the charged residues persists. More in depth studies on improving the application of FEP on calculations of folding free energy changes upon single point mutations are underway in our group.
Understanding the impact of mutations on folding free energy change is an important step toward deciphering the molecular mechanism of RTT and other diseases. It is reasonable to assume that the mechanism of RTT caused by single point mutations in MBD (DNA binding domain) is largely related to either the mutation-induced stability changes or the changes in its binding affinity to DNA, which is also currently under investigation in our group. However, the overall MeCP2 function may also be affected by factors such as folding of the rest of the protein and its interactions with other proteins as well as post translational modifications. Further studies aiming to link these stability changes to functional consequences are needed as understanding the interplay between protein stability and function is crucial not only in understanding the causes of RTT and other diseases, and relevant therapeutic applications but also in protein design and applied protein science.
Supplementary Material
ACKNOWLEDGMENT
We thank the Latour group at Clemson University for the use of CD spectrophotometer and assistance, supported by a grant from NIGMS of the National Institutes of Health under award number 5P20GM103444-07. We also thank the members of Alexov and Cao groups for their help and useful discussions. EA was supported by a grant from NIH R01GM093937.
Footnotes
Supplementary Information (SI) includes the longer FEP calculation and full webserver results. This material is available free of charge via the Internet at http://pubs.acs.org.
References
- 1.Dunn HG (2001) Importance of Rett syndrome in child neurology, Brain Dev 23 Suppl 1, S38–43. [DOI] [PubMed] [Google Scholar]
- 2.Hagberg BA (1989) Rett syndrome: clinical peculiarities, diagnostic approach, and possible cause, Pediatr Neurol 5, 75–83. [DOI] [PubMed] [Google Scholar]
- 3.Naidu SB (1997) Rett syndrome, Indian J Pediatr 64, 651–659. [DOI] [PubMed] [Google Scholar]
- 4.Abbes Z, Bouden A, Halayem S, Othman S, and Bechir Halayem M. (2011) [Clinical characteristics of Rett Syndrome], Tunis Med 89, 733–737. [PubMed] [Google Scholar]
- 5.Han ZA, Jeon HR, Kim SW, Park JY, and Chung HJ (2012) Clinical characteristics of children with rett syndrome, Ann Rehabil Med 36, 334–339. [DOI] [PMC free article] [PubMed] [Google Scholar]
- 6.Armstrong DD (1997) Review of Rett syndrome, J Neuropathol Exp Neurol 56, 843–849. [DOI] [PubMed] [Google Scholar]
- 7.Armstrong DD (2005) Neuropathology of Rett syndrome, J Child Neurol 20, 747–753. [DOI] [PubMed] [Google Scholar]
- 8.Hagberg B, Aicardi J, Dias K, and Ramos O. (1983) A progressive syndrome of autism, dementia, ataxia, and loss of purposeful hand use in girls: Rett’s syndrome: report of 35 cases, Annals of neurology 14, 471–479. [DOI] [PubMed] [Google Scholar]
- 9.Amir RE, Van den Veyver IB, Wan M, Tran CQ, Francke U, and Zoghbi HY (1999) Rett syndrome is caused by mutations in X-linked MECP2, encoding methyl-CpG-binding protein 2, Nat Genet 23, 185–188. [DOI] [PubMed] [Google Scholar]
- 10.Neul JL, and Zoghbi HY (2004) Rett syndrome: a prototypical neurodevelopmental disorder, Neuroscientist 10, 118–128. [DOI] [PubMed] [Google Scholar]
- 11.Carney RM, Wolpert CM, Ravan SA, Shahbazian M, Ashley-Koch A, Cuccaro ML, Vance JM, and Pericak-Vance MA (2003) Identification of MeCP2 mutations in a series of females with autistic disorder, Pediatr Neurol 28, 205–211. [DOI] [PubMed] [Google Scholar]
- 12.Laurvick CL, de Klerk N, Bower C, Christodoulou J, Ravine D, Ellaway C, Williamson S, and Leonard H. (2006) Rett syndrome in Australia: a review of the epidemiology, J Pediatr 148, 347–352. [DOI] [PubMed] [Google Scholar]
- 13.Lewis JD, Meehan RR, Henzel WJ, Maurer-Fogy I, Jeppesen P, Klein F, and Bird A. (1992) Purification, sequence, and cellular localization of a novel chromosomal protein that binds to methylated DNA, Cell 69, 905–914. [DOI] [PubMed] [Google Scholar]
- 14.Free A, Wakefield RI, Smith BO, Dryden DT, Barlow PN, and Bird AP (2001) DNA recognition by the methyl-CpG binding domain of MeCP2, J Biol Chem 276, 3353–3360. [DOI] [PubMed] [Google Scholar]
- 15.Wakefield RI, Smith BO, Nan X, Free A, Soteriou A, Uhrin D, Bird AP, and Barlow PN (1999) The solution structure of the domain from MeCP2 that binds to methylated DNA, J Mol Biol 291, 1055–1065. [DOI] [PubMed] [Google Scholar]
- 16.Adkins NL, and Georgel PT (2011) MeCP2: structure and function, Biochem Cell Biol 89, 1–11. [DOI] [PubMed] [Google Scholar]
- 17.Zachariah RM, and Rastegar M. (2012) Linking epigenetics to human disease and Rett syndrome: the emerging novel and challenging concepts in MeCP2 research, Neural Plast 2012, 415825. [DOI] [PMC free article] [PubMed] [Google Scholar]
- 18.Chadwick LH, and Wade PA (2007) MeCP2 in Rett syndrome: transcriptional repressor or chromatin architectural protein?, Curr Opin Genet Dev 17, 121–125. [DOI] [PubMed] [Google Scholar]
- 19.Adams VH, McBryant SJ, Wade PA, Woodcock CL, and Hansen JC (2007) Intrinsic disorder and autonomous domain function in the multifunctional nuclear protein, MeCP2, J Biol Chem 282, 15057–15064. [DOI] [PubMed] [Google Scholar]
- 20.Christodoulou J, Grimm A, Maher T, and Bennetts B. (2003) RettBASE: The IRSA MECP2 variation database-a new mutation database in evolution, Hum Mutat 21, 466–472. [DOI] [PubMed] [Google Scholar]
- 21.Safran M, Dalah I, Alexander J, Rosen N, Iny Stein T, Shmoish M, Nativ N, Bahir I, Doniger T, Krug H, Sirota-Madi A, Olender T, Golan Y, Stelzer G, Harel A, and Lancet D. (2010) GeneCards Version 3: the human gene integrator, Database (Oxford) 2010, baq020. [DOI] [PMC free article] [PubMed] [Google Scholar]
- 22.Cuddapah VA, Pillai RB, Shekar KV, Lane JB, Motil KJ, Skinner SA, Tarquinio DC, Glaze DG, McGwin G, Kaufmann WE, Percy AK, Neul JL, and Olsen ML (2014) Methyl-CpG-binding protein 2 (MECP2) mutation type is associated with disease severity in Rett syndrome, J Med Genet 51, 152–158. [DOI] [PMC free article] [PubMed] [Google Scholar]
- 23.Ballestar E, Yusufzai TM, and Wolffe AP (2000) Effects of Rett syndrome mutations of the methyl-CpG binding domain of the transcriptional repressor MeCP2 on selectivity for association with methylated DNA, Biochemistry 39, 7100–7106. [DOI] [PubMed] [Google Scholar]
- 24.Yusufzai TM, and Wolffe AP (2000) Functional consequences of Rett syndrome mutations on human MeCP2, Nucleic Acids Res 28, 4172–4179. [DOI] [PMC free article] [PubMed] [Google Scholar]
- 25.Ghosh RP, Horowitz-Scherer RA, Nikitina T, Gierasch LM, and Woodcock CL (2008) Rett syndrome-causing mutations in human MeCP2 result in diverse structural changes that impact folding and DNA interactions, J Biol Chem 283, 20523–20534. [DOI] [PMC free article] [PubMed] [Google Scholar]
- 26.Goffin D, Allen M, Zhang L, Amorim M, Wang ITJ, Reyes A-RS, Mercado-Berton A, Ong C, Cohen S, Hu L, Blendy JA, Carlson GC, Siegel SJ, Greenberg ME, and Zhou Z. (2012) Rett syndrome mutation MeCP2 T158A disrupts DNA binding, protein stability and ERP responses, Nat Neurosci 15, 274–283. [DOI] [PMC free article] [PubMed] [Google Scholar]
- 27.Gadalla KK, Bailey ME, and Cobb SR (2011) MeCP2 and Rett syndrome: reversibility and potential avenues for therapy, Biochem J 439, 1–14. [DOI] [PubMed] [Google Scholar]
- 28.Gonzalez-Castejon M, Marin F, Soler-Rivas C, Reglero G, Visioli F, and Rodriguez-Casado A. (2011) Functional Non-Synonymous Polymorphisms Prediction Methods: Current Approaches and Future Developments, Current Medicinal Chemistry 18, 5095–5103. [DOI] [PubMed] [Google Scholar]
- 29.Peterson TA, Doughty E, and Kann MG (2013) Towards Precision Medicine: Advances in Computational Approaches for the Analysis of Human Variants, Journal of Molecular Biology 425, 4047–4063. [DOI] [PMC free article] [PubMed] [Google Scholar]
- 30.Stefl S, Nishi H, Petukh M, Panchenko AR, and Alexov E. (2013) Molecular mechanisms of disease-causing missense mutations, J Mol Biol 425, 3919–3936. [DOI] [PMC free article] [PubMed] [Google Scholar]
- 31.Kucukkal TG, Yang Y, Chapman SC, Cao W, and Alexov E. (2014) Computational and experimental approaches to reveal the effects of single nucleotide polymorphisms with respect to disease diagnostics, Int J Mol Sci 15, 9670–9717. [DOI] [PMC free article] [PubMed] [Google Scholar]
- 32.Kirkwood JG (1935) Statistical Mechanics of Fluid Mixtures, Journal of Chemical Physics 3, 300–313. [Google Scholar]
- 33.Chipot C. (2007) Free Energy Calculations: Theory and Applications in Chemistry and Biology, Vol. 86, Springer-Verlag, Berlin. [Google Scholar]
- 34.Humphrey W, Dalke A, and Schulten K. (1996) VMD: visual molecular dynamics, Journal of molecular graphics 14, 33–38. [DOI] [PubMed] [Google Scholar]
- 35.Phillips JC, Braun R, Wang W, Gumbart J, Tajkhorshid E, Villa E, Chipot C, Skeel RD, Kalé L, and Schulten K. (2005) Scalable molecular dynamics with NAMD, Journal of Computational Chemistry 26, 1781–1802. [DOI] [PMC free article] [PubMed] [Google Scholar]
- 36.Ho KL, McNae IW, Schmiedeberg L, Klose RJ, Bird AP, and Walkinshaw MD (2008) MeCP2 binding to DNA depends upon hydration at methyl-CpG, Mol Cell 29, 525–531 LID - 510.1016/j.m. [DOI] [PubMed] [Google Scholar]
- 37.deGroot BL, vanAalten DMF, Scheek RM, Amadei A, Vriend G, and Berendsen HJC (1997) Prediction of protein conformational freedom from distance constraints, Proteins-Structure Function and Genetics 29, 240–251. [DOI] [PubMed] [Google Scholar]
- 38.Podtelezhnikov AA, and Wild DL (2008) CRANKITE: A fast polypeptide backbone conformation sampler, Source Code Biol Med 3, 12. [DOI] [PMC free article] [PubMed] [Google Scholar]
- 39.MacKerell AD, Bashford D, Bellott M, Dunbrack RL, Evanseck JD, Field MJ, Fischer S, Gao J, Guo H, Ha S, Joseph-McCarthy D, Kuchnir L, Kuczera K, Lau FT, Mattos C, Michnick S, Ngo T, Nguyen DT, Prodhom B, Reiher WE, Roux B, Schlenkrich M, Smith JC, Stote R, Straub J, Watanabe M, Wiorkiewicz-Kuczera J, Yin D, and Karplus M. (1998) All-atom empirical potential for molecular modeling and dynamics studies of proteins, J Phys Chem B 102, 3586–3616. [DOI] [PubMed] [Google Scholar]
- 40.MacKerell AD, Feig M, and Brooks CL (2004) Improved treatment of the protein backbone in empirical force fields, Journal of the American Chemical Society 126, 698–699. [DOI] [PubMed] [Google Scholar]
- 41.Mackerell AD, Feig M, and Brooks CL (2004) Extending the treatment of backbone energetics in protein force fields: Limitations of gas-phase quantum mechanics in reproducing protein conformational distributions in molecular dynamics simulations, Journal of computational chemistry 25, 1400–1415. [DOI] [PubMed] [Google Scholar]
- 42.Darden T, York D, and Pedersen L. (1993) Particle Mesh Ewald - an N.Log(N) Method for Ewald Sums in Large Systems, Journal of Chemical Physics 98, 10089–10092. [Google Scholar]
- 43.Liu P, Dehez F, Cai W, and Chipot C. (2012) A toolkit for the analysis of free-energy perturbation calculations, J. Chem. Theor. Comput 8, 2606–2616. [DOI] [PubMed] [Google Scholar]
- 44.Benedix A, Becker CM, de Groot BL, Caflisch A, and Bockmann RA (2009) Predicting free energy changes using structural ensembles, Nat Methods 6, 3–4. [DOI] [PubMed] [Google Scholar]
- 45.Zhang Z, Wang L, Gao Y, Zhang J, Zhenirovskyy M, and Alexov E. (2012) Predicting folding free energy changes upon single point mutations, Bioinformatics 28, 664–671. [DOI] [PMC free article] [PubMed] [Google Scholar]
- 46.Wickstrom L, Gallicchio E, and Levy RM (2012) The linear interaction energy method for the prediction of protein stability changes upon mutation, Proteins-Structure Function and Bioinformatics 80, 111–125. [DOI] [PMC free article] [PubMed] [Google Scholar]
- 47.Dehouck Y, Kwasigroch JM, Gilis D, and Rooman M. (2011) PoPMuSiC 2.1: a web server for the estimation of protein stability changes upon mutation and sequence optimality, Bmc Bioinformatics 12. [DOI] [PMC free article] [PubMed] [Google Scholar]
- 48.Pires DEV, Ascher DB, and Blundell TL (2014) mCSM: predicting the effects of mutations in proteins using graph-based signatures, Bioinformatics 30, 335–342. [DOI] [PMC free article] [PubMed] [Google Scholar]
- 49.Worth CL, Preissner R, and Blundell TL (2011) SDM-a server for predicting effects of mutations on protein stability and malfunction, Nucleic Acids Research 39, W215–W222. [DOI] [PMC free article] [PubMed] [Google Scholar]
- 50.Pires DE, Ascher DB, and Blundell TL (2014) mCSM: predicting the effects of mutations in proteins using graph-based signatures, Bioinformatics 30, 335–342. [DOI] [PMC free article] [PubMed] [Google Scholar]
- 51.Schymkowitz J, Borg J, Stricher F, Nys R, Rousseau F, and Serrano L. (2005) The FoldX web server: an online force field, Nucleic Acids Research 33, W382–W388. [DOI] [PMC free article] [PubMed] [Google Scholar]
- 52.Giollo M, Martin AJ, Walsh I, Ferrari C, and Tosatto SC (2014) NeEMO: a method using residue interaction networks to improve prediction of protein stability upon mutation, BMC Genomics 15 Suppl 4, S7. [DOI] [PMC free article] [PubMed] [Google Scholar]
- 53.Yusufzai TM, and Wolffe AP (2000) Functional consequences of Rett syndrome mutations on human MeCP2, Nucleic Acids Res 28, 4172–4179. [DOI] [PMC free article] [PubMed] [Google Scholar]
- 54.Xia B, Liu Y, Li W, Brice AR, Dominy BN, and Cao W. (2014) Specificity and catalytic mechanism in family 5 uracil DNA glycosylase, J Biol Chem 289, 18413–18426. [DOI] [PMC free article] [PubMed] [Google Scholar]
- 55.Wilkins MR, Gasteiger E, Bairoch A, Sanchez JC, Williams KL, Appel RD, and Hochstrasser DF (1999) Protein identification and analysis tools in the ExPASy server, Methods Mol Biol 112, 531–552. [DOI] [PubMed] [Google Scholar]
- 56.Wei Y, Thyparambil AA, and Latour RA (2014) Protein helical structure determination using CD spectroscopy for solutions with strong background absorbance from 190 to 230nm, Biochim Biophys Acta 1844, 2331–2337. [DOI] [PMC free article] [PubMed] [Google Scholar]
- 57.Daniel HA Corrêa CHIR (2009) The use of circular dichroism spectroscopy to study protein folding, form and function, African Journal of Biochemistry Research 3, 10. [Google Scholar]
- 58.Ahmad F, Yadav S, and Taneja S. (1992) Determining stability of proteins from guanidinium chloride transition curves, Biochem J 287 (Pt 2), 481–485. [DOI] [PMC free article] [PubMed] [Google Scholar]
- 59.Suryadi J, Tran EJ, Maxwell ES, and Brown BA, 2nd. (2005) The crystal structure of the Methanocaldococcus jannaschii multifunctional L7Ae RNA-binding protein reveals an induced-fit interaction with the box C/D RNAs, Biochemistry 44, 9657–9672. [DOI] [PubMed] [Google Scholar]
- 60.Rohman MS, Tadokoro T, Angkawidjaja C, Abe Y, Matsumura H, Koga Y, Takano K, and Kanaya S. (2009) Destabilization of psychrotrophic RNase HI in a localized fashion as revealed by mutational and X-ray crystallographic analyses, FEBS J 276, 603–613. [DOI] [PubMed] [Google Scholar]
- 61.Bullock AN, Henckel J, DeDecker BS, Johnson CM, Nikolova PV, Proctor MR, Lane DP, and Fersht AR (1997) Thermodynamic stability of wild-type and mutant p53 core domain, Proc Natl Acad Sci U S A 94, 14338–14342. [DOI] [PMC free article] [PubMed] [Google Scholar]
- 62.Belval L, Marquette A, Mestre P, Piron MC, Demangeat G, Merdinoglu D, and Chich JF (2015) A fast and simple method to eliminate Cpn60 from functional recombinant proteins produced by E. coli Arctic Express, Protein Expr Purif 109, 29–34. [DOI] [PubMed] [Google Scholar]
- 63.Ghosh RP, Horowitz-Scherer RA, Nikitina T, Gierasch LM, and Woodcock CL (2008) Rett syndrome-causing mutations in human MeCP2 result in diverse structural changes that impact folding and DNA interactions, J Biol Chem 283, 20523–20534 LID - 20510.21074/jbc. [DOI] [PMC free article] [PubMed] [Google Scholar]
- 64.Santoro MM, and Bolen DW (1988) Unfolding free energy changes determined by the linear extrapolation method. 1. Unfolding of phenylmethanesulfonyl alpha-chymotrypsin using different denaturants, Biochemistry 27, 8063–8068. [DOI] [PubMed] [Google Scholar]
Associated Data
This section collects any data citations, data availability statements, or supplementary materials included in this article.