

Abstract
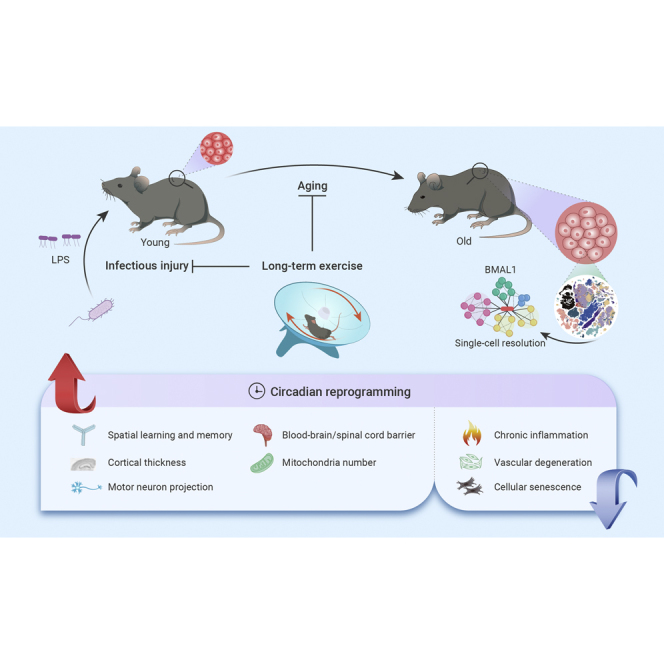
Exercise benefits the whole organism, yet, how tissues across the body orchestrally respond to exercise remains enigmatic. Here, in young and old mice, with or without exercise, and exposed to infectious injury, we characterized the phenotypic and molecular adaptations to a 12-month exercise across 14 tissues/organs at single-cell resolution. Overall, exercise protects tissues from infectious injury, although more effectively in young animals, and benefits aged individuals in terms of inflammaging suppression and tissue rejuvenation, with structural improvement in the central nervous system and systemic vasculature being the most prominent. In vascular endothelial cells, we found that readjusting the rhythmic machinery via the core circadian clock protein BMAL1 delayed senescence and facilitated recovery from infectious damage, recapitulating the beneficial effects of exercise. Our study underscores the effect of exercise in reconstituting the youthful circadian clock network and provides a foundation for further investigating the interplay between exercise, aging, and immune challenges across the whole organism.
Keywords: exercise, aging, inflammation, circadian clock, BMAL1, single-cell RNA sequencing
Graphical abstract
Public summary
-
•
An atlas of age-, tissue-, and cell-type-specific benefits of long-term exercise.
-
•
Exercise protects tissues from infectious injury, especially in younger ones.
-
•
Exercise promotes rejuvenation in aged tissues, especially in the nervous system.
-
•
Exercise exerts geroprotective effects, especially by resetting circadian programs via the circadian clock protein BMAL1.
Introduction
Physical exercise profoundly affects multiple tissues and is well accepted to be beneficial to numerous aspects of human health.1,2,3 The nervous system governs the execution of physical exercise and its coordination with activities of the cardiovascular and pulmonary systems to increase blood flow to the working skeletomuscular system.4,5 Accordingly, exercise is beneficial not only to the musculoskeletal system but also to the heart, lung, and nervous systems.2,6,7 As exercise engages multiple tissues and organs in synchronized and integrated activities, it ultimately benefits physical and mental health.6,7,8 However, how tissues and organs are coordinated to execute such whole-body physiological functions is poorly understood. Conventionally, the majority of studies on exercise biology have focused on the skeletal muscle in an isolated setting, and led to the identification of a panel of critical signaling pathways induced by exercise, including IGF1/PI3K/Akt, AMPK, mTOR, and PGC-1α.9,10,11,12 However, the molecular events associated with exercise, especially beyond the experimental paradigm of skeletal muscle, remain largely unknown. Hence, to identify exercise-associated molecular mechanisms that drive a broader spectrum of biological processes in a variety of tissues and organs, there is a need to complement the current “myocentric” paradigm by pursuing investigations of non-skeletal muscle tissues across the whole body.
An unresolved question in exercise biology is whether exercise confers similar effects in young and aged individuals. And, relatedly, whether exercise confers a similar degree of protective effects against external and internal stimulus (e.g., acute severe infection and chronic low degree of inflammation) in individuals of different ages. For example, studies on young animals show that exercise counteracts obesity.13,14 Although studies of exercise biology have been conducted in older animals, many of them focused on investigating exercise as a robust intervention to restore mitochondrial function and achieve reactivation of aged adult stem cells, such as muscle stem cells.15,16,17,18 However, how the whole-body transcriptomic landscape adapts as a result of a long-term exercise regimen and whether such adaptations differ between young and old animals remain largely unknown. Moreover, investigations stand to identify age-associated underlying molecular processes mediating the beneficial effects of exercise, which in turn might help inform the development of strategies that promote healthy aging.19,20
Since both aging and exercise involve distinct organs, tissues, and cell types,4,6,21,22,23,24 a systemic and integrative study across multiple tissues, dissecting the molecular programs in tissue- and cell type-specific manner, is of critical importance.25,26,27,28,29 In the past few years, high-throughput single-cell transcriptomes have been constructed for aging and its interventions,30,31,32 such as caloric restriction and heterochronic parabiosis in mammalian species,33,34,35,36,37,38,39,40 providing unprecedented resolution of the cellular and molecular changes in aged animals. However, whether and how exercise rewires the transcriptome at the systemic level, especially in aged animals, remains largely unexplored.
Here, we subjected young and aged mice to up to 12 months of voluntary exercise or standard housing, and constructed a comprehensive single-cell transcriptomic atlas that integrates exercise, aging, and acute infectious challenges across multiple tissues/organs. We also dissected divergent tissue- and cell type-specific responses to long-term exercise in young and aged individuals, and established molecular programs linked with protection against acute severe infection in young individuals and geroprotective effects in their aged counterparts. We further unraveled that exercise rebuilds the BMAL1-mediated rhythmic regulatory network and dampens the expression of pro-inflammatory genes that become dysregulated as a consequence of aging. Our rich dataset constitutes a valuable resource for exploring targets that can be investigated for therapeutic potential in mediating exercise-like effects on delaying aging and age-related degenerative diseases.
Results
Exercise exerts an overall health-promoting effect
Here, we investigated the effects of long-term aerobic exercise on physical function and gene expression regulation at the systemic level in young (2 months old) and old (16 months old) male C57BL/6J mice (Figure 1A). Throughout the exercise process, during which we recorded voluntary exercise activity on the rotating running wheel in real time, we found that young individuals generally exercised faster and longer per day than old individuals (Figures 1B and S1A). This difference was particularly pronounced in the first 3 months, but gradually diminished between the two age groups later in the 12-month process, indicating that young and old mice adapt convergently in physical activity during the process of long-term exercise (Figures 1B and S1A).
Figure 1.

Construction of single-cell transcriptomic atlas of exercise-induced effects across multiple tissues in mice
(A) Schematic diagram of mouse exercise and multi-dimensional analysis of its systematic effects. Y-Ctrl, young control; Y-Ex, young exercise; O-Ctrl, old control; O-Ex, old exercise.
(B) Boxplot showing the average running distance (km per day) of mice in the Y-Ex and O-Ex groups every 3 months. n = 22–24 mice per group.
(C) Body weights (top) and physical score (bottom) of mice from different groups as indicated. n = 22–24 mice per group.
(D) Bar plots showing the mean time on a rotarod (top left), grip strength of four limbs (top right), distance on the treadmill (bottom left), and the percentage of correct alternations by Y-maze test (bottom right) of mice from indicated groups. n = 15–24 mice per group.
(E) ELISA analysis of the concentration of IL-1β (top) and the concertation ratio of AST to ALT (bottom) in the serum of indicated groups. n = 5–12 mice per group.
(F) t-SNE plots showing different cell types across the five tissues based on data from snRNA-seq (left) or nine tissues by scRNA-seq (right). Oligo, oligodendrocyte; Ast, astrocyte; ExN, excitatory neuron; InN, inhibitory neuron; Granule, granule cell; MLI, molecular layer interneuron; Epe, ependymal cell; OPC, oligodendrocyte precursor cell; Mic, microglia; Men, meningeal cell; Tendon, tendon fibroblast; Fast IIX, type IIX fast-twitch fiber; Fast IIA, type IIA fast-twitch fiber; Fast IIB, type IIB fast-twitch fiber; NMJ_post, postsynaptic muscle fiber of neuromuscular junction; Adi, adipocyte; MTJ, myotendinous junction; MuSC, muscle stem cell; Fib, fibroblast; Car, cardiocyte; Per, pericyte; EC, endothelial cell; SMC, smooth muscle cell; TC, T cell; M1, type I macrophage; M2, type II macrophage; AT1, type I alveolar epithelial cell; AT2, type II alveolar epithelial cell; Epi, epithelial cell; AM, alveolar macrophage; CD-IC, collecting duct intercalated cell; CD-PC, collecting duct principal cell; CD-Trans, collecting duct transitional cell; DCT, distal convoluted tubule; LOH, ascending loop of Henle; DLOH, descending loop of Henle; PT-S1, segment1 of proximal tubule; PT-S2, segment2 of proximal tubule; PT-S3, segment3 of proximal tubule; Hep, hepatocyte; Cho, cholangiocyte; Kup, Kupffer cell; NKT, natural killer T cell; SPG, spermatogonia; RS, round spermatid; ES, elongated spermatid; SPC, spermatocyte; Neu, neutrophil; Mono, monocyte; Bas, basophil; LP-B, late pro-B cell; Mega, megakaryocyte; mDC, myeloid dendritic cell; pDC, plasmacytoid dendritic cell; CD4_Naive, CD4+ naive T cell; CD4_Mem, CD4+ memory T cell; CD8_Naive, CD8+ naive T cell; CD8_Mem, CD8+ memory T cell; CD8_CTL, CD8+ cytotoxic T cell; BC, B cell; Pla, plasmocyte. The quantification data in (C)–(E) are shown as the means ± SEM, and two-tailed Student's t test p values are indicated.
After 12 months of spontaneous exercise, the body weight of the exercising groups was reduced, with the overall physiological status remaining stable, as examined by the metabolic cage, compared with control groups of both young and old mice without exercise (Y-Ex versus Y-Ctrl, O-Ex versus O-Ctrl) (Figures 1C, S1B, and S1C). Both exercising groups achieved higher physical scores (Figure 1C) and stronger motor coordination and endurance, as demonstrated by better performance in the treadmill and rotarod tests (Figure 1D). In contrast, all these parameters declined with age in sedentary mice (Figures 1C and 1D). Grip strength was also enhanced with exercise in young and old mice (Figure 1D). As proof of the effect of exercise on systems other than the skeletomuscular system, long-term exercise also improved spatial learning and memory in aged mice, as assessed by Y maze performance (Figure 1D). At the systemic level, the plasma concentration of IL-1β, an inflammatory cytokine, was reduced by exercise in aged mice (Figure 1E). Likewise, the ratio between the concentrations of aspartate transaminase (AST) and alanine transaminase (ALT), a prognostic indicator in plasma for monitoring liver damage,41 which increased during aging in the control group, was suppressed by exercise in the O-Ex group (Figure 1E). These observations validate that exercise can provide comprehensive health benefits throughout the body in both young and aged mice.
Construction of a comprehensive transcriptomic atlas across multiple tissues with different ages and physical activities
To investigate how exercise modulates gene expression across tissues, we performed genome-wide RNA sequencing (RNA-seq) on 13 types of tissue samples (brain, spinal cord, skeletal muscle, heart, lung, aorta, kidney, liver, small intestine, testis, spleen, bone marrow, and peripheral blood) from the Y-Ex, Y-Ctrl, O-Ex, and O-Ctrl groups (Figures 1A and S1D). Interestingly, based on principal-component analysis (PCA), broad patterns of gene expression of each tissue segregate with age on one dimension, and with or without exercise, albeit to a various extent between tissues, in the other direction (Figures S1E and S1F). In addition, PCA indicated that the tissue-specific transcriptome often changed in divergent directions between young and old tissues after exercise (e.g., liver and skeletal muscle) (Figure S1E), suggesting that exercise-associated tissue adaptation may vary in relation to age. Collectively, these RNA-seq results capture both an age-dependent and tissue-specific effect of exercise, which prompted us to further dissect the response of exercise in young and old mice by molecular profiling at a higher resolution.
To achieve single-cell resolution across diverse tissues, we performed single-cell RNA-seq (scRNA-seq) for lung, aorta, kidney, liver, small intestine, testis, spleen, bone marrow, and peripheral blood, as well as single-nucleus RNA-seq (snRNA-seq) for the brain, cerebellum, spinal cord, heart, and skeletal muscle (Figures 1F and S2A). After stringent quality control, we obtained 507,636 high-quality transcriptomes from which we constructed an unprecedentedly comprehensive cellular atlas of exercise encompassing 14 tissues of different ages and diverse physical activities at the single-cell level (Figures S1G, and S2A).
Overall, we identified 305 cell clusters that could be classified into 101 major cell types in 14 tissues (Figures 1F, S2B, and S2C; Table S1). Of these cell types, more than 38 were tissue specific, such as Pcp4+ Purkinje cells in the cerebellum and Tnnt2+ cardiomyocytes in heart tissue (Figures 1F, S1G, S2B, and S2C). In contrast, Pecam1+ endothelial cells (ECs) were present in most tissues, including the brain, spinal cord, skeletal muscle, heart, liver, and aorta (Figures 1F, S1G, and S2C). Likewise, mesenchymal and stromal cells, including fibroblasts (as in skeletal muscle, heart, lung, aorta, small intestine, and testis), pericytes (as in the brain, spinal cord, skeletal muscle, and heart), and smooth muscle cells (as in the brain, skeletal muscle, heart, and aorta), were identified from at least four organs (Figure S1G). Notably, immune cells marked by specific expression of protein tyrosine phosphatase receptor type C were present in the bone marrow, blood, and spleen but also in the other 10 solid tissues we analyzed (Figure S1G). These immune cells were further classified into 27 immune cell subtypes, including microglia, Kupffer cell, alveolar macrophage, megakaryocyte, neutrophil, basophil, mast cell, monocyte, M1 (pro-inflammatory) macrophage (M1), M2 (anti-inflammatory) macrophage (M2), dendritic cell, natural killer cell, CD4+ T cell, CD8+ T cell, B cell, and plasma cell (Figures 1F, S2B, and S2C). In conclusion, we present a multi-tissue atlas covering a broad spectrum of cellular identities that establishes a framework to untangle the effects of exercise and aging, and constitutes a cellular roadmap for follow-up studies.
Exercise induces extensive molecular reprogramming across tissues in an age-dependent manner
To further discern age-dependent and cell type-specific effects of exercise, we initially characterized exercise-related differentially expressed genes (DEGs) in the young group (YE DEGs, Y-Ex versus Y-Ctrl) and old group (OE DEGs, O-Ex versus O-Ctrl) (Figure 2A; Table S2, see materials and methods). Upon characterizing YE and OE DEGs in each tissue, we found that the majority of YE DEGs and OE DEGs were different between the two age groups, and distributed unevenly among tissues (Figure 2B). In most tissues, the extent of gene expression changes, reflected in the number of DEGs, is highly age dependent. For example, young kidney, small intestine, aorta, and testis appear more responsive to exercise than their older tissue counterparts, and YE DEGs were strongly concentrated in specific cell types, including ECs, smooth muscle cells, and macrophages of the kidney (Figures 2B, 2C, S3A, and S3B). In contrast, tissues from the nervous system (i.e., spinal cord, cerebellum, and brain) were more prone to be affected by exercise in aged mice compared with their counterparts from young mice; and OE DEGs were overpowered in ECs, pericytes, and excitatory and inhibitory neurons of the brain, as well as Purkinje cells and granule cells of the cerebellum (Figures 2B, 2C, S3A, and S3B).
Figure 2.

Exercise reprograms transcriptional profiles across tissues in an age-dependent manner
(A) Venn diagram showing the YE-specific DEGs, OE-specific DEGs, as well as common DEGs overlapping between YE DEGs (Y-Ex/Y-Ctrl) and OE DEGs (O-Ex/O-ctrl) based on data from scRNA-seq and snRNA-seq. The DEG numbers were calculated by summing the cell type-specific DEGs from the 14 tissues or organs, yielding the total number of upregulated and downregulated genes.
(B) Bar plots showing the DEG number (left) or DEG relative ratio (corresponding DEG number to total number of DEGs including YE-specific DEGs, common DEGs, and OE-specific DEGs, right) of indicated DEGs across different tissues based on data from scRNA-seq and snRNA-seq.
(C) Bubble plot showing the difference in the DEG ratio of YE DEG number or OE DEG number to total DEG number in different cell types of the 14 tissues based on data from scRNA-seq and snRNA-seq. Cell types that have a DEG ratio difference of more than 60% are named YE-specific cell types or OE-specific cell types. Cell types that have a DEG ratio difference lower than 20% are named Common cell types.
(D) Network plots showing the enriched GO terms/pathways of upregulated DEGs during exercise in the indicated groups (left) or indicated tissues (right) based on data from scRNA-seq and snRNA-seq.
(E) WGA staining of skeletal muscle tissues from the indicated groups. The relative cross-sectional areas are quantified as fold changes. Scale bars, 100 μm. n = 7–12 mice per group.
(F) Electron microscopy analysis of the number of intermyofibrillar mitochondria in skeletal muscle (top) and the percentage of total interfibrillar mitochondrial area in heart tissues (bottom) from the indicated groups. Scale bars, 1 μm. n = 4 mice per group and 10 images were taken from each mouse.
(G) Immunofluorescence analysis of ChAT-positive motor neurons (MNs) in the motor cortex and spinal cord from the indicated groups. Scale bars, 50 μm. n = 7–12 mice per group.
(H) Immunofluorescence analysis of neurofilament (NF)-positive terminal buttons in skeletal muscle tissues from the indicated groups. The number of terminal buttons per 0.6 mm2 is measured across different groups. Scale bars, 50 μm. n = 7–12 mice per group.
(I) Immunochemistry analysis of NeuN-positive neurons in the brain cortex from the indicated groups. The thickness of the cortex from the indicated regions was measured across different groups. Scale bars, 50 μm. n = 7–12 mice per group. 1# and 2# cortexes are the motor and sensory cortex above the corpus callosum (CC) and dentate gyrus (DG) regions, respectively. The quantification data in (F)–(I) are shown as the means ± SEM, and two-tailed Student's t test p values are indicated.
Consistently, overall functional profiling of YE and OE DEGs also revealed such age-dependent effects of exercise in different tissues (Figures 2D, S3C, and S3D). For example, exercise activates genes enriched in nervous system function-related pathways (such as neuron projection development and cognition) mainly in the aged brain, cerebellum, and spinal cord, while it promotes the expression of genes related to small-molecule catabolic processes and oxidative phosphorylation mainly in the young kidney, aorta, and lung (Figures 2D and S3C). Also, in the young group, exercise downregulated genes associated with immune activation and cell death in most tissues (Figure S3D). These data show that exercise reprograms transcriptional regulatory networks in an age-dependent and tissue-specific manner.
There were also tissues in which we detected a similar extent of transcriptional changes between age groups but through different genes (Table S2). For example, the skeletal muscle and heart harbored almost comparable numbers of exercise-induced DEGs between young and old mice (Figure 2B). At the single-cell level, the numbers of YE and OE DEGs were similar across ECs, fibroblasts, cardiomyocytes, pericytes from the heart, and fast-twitch myofibers in the skeletal muscle (Figures 2C and S3A). Although very few in number, common DEGs shared between age groups were identified in fast-twitch myofibers in the skeletal muscle and ECs in the heart (Figures 2C and S3A). Moreover, nuclear-encoded mitochondrial genes related to mitochondrial function and genes related to AMPK, a master signaling pathway for cellular energy homeostasis, were preferentially activated in the kidney and aorta of the Y-Ex group and in the nervous system of the O-Ex group, and convergently upregulated in the heart and skeletal muscle of both the Y-Ex and O-Ex groups (Figures S3E and S4A). Finally, the bone marrow, peripheral blood, and spleen were much less responsive to exercise compared with other tissues, regardless of age (Figures 2B, 2C, S3A, and S3B). For example, gene expression changes affected by exercise were quite modest in the bone marrow, which may reflect a relatively stable cellular state and microenvironment.
Finally, we tested whether the molecular changes observed were reflected at the phenotypic level. When we evaluated the effect of long-term exercise on the skeletal muscle, we observed an enlarged overall fiber cross-sectional area with an increased number of intermyofibrillar mitochondria in both young and aged mice (Figures 2E, 2F, and S4B). Likewise, voluntary physical training also increased the contents of interfibrillar mitochondria in the hearts of both young and old mice (Figure 2F). Moreover, exercise increased motor neuron numbers in the motor cortex and spinal cord, along with a higher content of neurofilaments in the motor terminals of the skeletal muscle, indicating strengthened muscle innervation in the skeletal muscle of both the Y-Ex and O-Ex groups relative to their counterparts in sedentary groups (Figures 2G and 2H). Strikingly, in the nervous system, the thickness of the cortex was substantially increased in both young and old mice after 12 months of exercise compared with non-exercising young and old animals (Figures 2I and S4C). These tissue phenotypes were in overall accordance with the exercise-induced transcriptional changes profiled in corresponding tissues and cell types, and helped explain the previously reported enhancement of physical and cognitive capacity conferred by exercise.42,43 Thus, exercise reshapes the transcriptomic landscape in an age-dependent manner, albeit at divergent degrees and through different programs in different cell types and tissues, conferring multifaceted health benefits across the body.
Exercise protects young individuals from severe inflammatory injury
Next, we asked whether exercise can precondition young and old animals against damage from acute infection. To this end, four groups of mice (Y-Ex, O-Ex, and their respective controls) received a single intraperitoneal injection of lipopolysaccharide (LPS) at a dose previously proven to induce systemic inflammation (Figure 3A; see materials and methods).43,44 After 24 hours, the organism usually starts to recover from acute infection, whereas a prolonged inflammatory response may lead to tissue damage.45 Tissues harboring first-line responders to LPS and critical tissues susceptible to acute inflammatory injury, i.e., liver, lung, aorta, bone marrow, and peripheral blood, were subjected to scRNA-seq or snRNA-seq (Figures 3A, S5A, and S5B). To unveil molecular hallmarks associated with a protective role of exercise, DEGs upregulated by LPS but repressed by exercise and DEGs downregulated by LPS but restored by exercise were identified for each age group, hence the Rev-LPS DEGs (Figure 3B). Their ratios in relation to DEGs induced by LPS in the non-exercising group (i.e., Rev-LPS DEGs versus LPS DEGs) in the corresponding cell and tissue type of each age group were calculated, and a higher ratio implied stronger potential to repress acute inflammatory injury upon exercise (Figures 3C and 3D; Table S2).
Figure 3.

Exercise safeguards young mice against acute inflammatory damage
(A) Schematic diagram of mice treated with vehicle or LPS after a 12-month exercise period and subsequent analysis of five tissues as indicated.
(B) Venn diagrams showing the overlapped genes between Y-LPS (Y-LPS/Y-Ctrl) and YE-LPS (Y-Ex-LPS/Y-LPS) (top), as well as between O-LPS (O-LPS/Y-Ctrl) and OE-LPS (O-Ex-LPS/O-LPS) (bottom), based on data from scRNA-seq and snRNA-seq. YE-rev-LPS-DEGs or OE-rev-LPS-DEGs were defined as subsets of overlapped DEGs that were changed in the opposite direction in young control and young exercise samples, or old control and old exercise samples, respectively.
(C) Bar plots showing the DEG number (top) and DEG ratio (bottom) of LPS-specific DEGs and Ex-rev-LPS DEGs to total LPS DEGs (Y-LPS and O-LPS) across different tissues in both young and aged mice based on data from scRNA-seq and snRNA-seq (left) or bulk RNA-seq (right). LPS DEGs excluding EX-rev-LPS DEGs are defined as LPS-specific DEGs.
(D) Bar plots showing the DEG number (top) and DEG ratio (bottom) of LPS DEGs and Ex-rev-LPS DEGs to total LPS DEGs in different cell types across five tissues in both young and aged mice based on data from scRNA-seq and snRNA-seq.
(E) Heatmaps showing the expression profile of genes in response to LPS across different tissues in indicated groups based on data from scRNA-seq and snRNA-seq.
(F) Network plots showing enriched GO terms/pathways for the Rev-LPS DEGs downregulated by exercise in the indicated comparisons (top) or indicated tissues (bottom).
(G) Immunofluorescence analysis of CD45-positive cells (immune cells) in liver (left) and lung (right) tissues from the indicated groups. The percentages of CD45-positive cells were quantified. Scale bars, 50 μm. n = 7–12 mice per group.
(H) Immunofluorescence analysis of neutrophils (anti-granulocytes antibody, HIS48) in liver (left) and lung (right) tissues from the indicated groups. The percentage of neutrophils was quantified. Scale bars, 50 μm. n = 7–12 mice per group.
(I) Immunochemistry analysis of F4/80-positive cells in liver (left) and lung (right) tissues from the indicated groups. The percentages of F4/80-positive cells were quantified. Scale bars, 50 μm. n = 7–12 mice per group.
(J) TUNEL staining in liver tissues from the indicated groups. The percentages of TUNEL-positive cells were quantified. Scale bars, 50 μm. n = 7–12 mice per group.
(K) Immunochemistry analysis of IL-1β-positive cells in liver tissues from the indicated groups. The percentages of IL-1β-positive cells were quantified. Scale bars, 50 μm. n = 7–12 mice per group.
The quantification data in (G)–(K) are shown as the means ± SEM, and two-tailed Student's t test p values are indicated.
Overall, preconditioning young mice with exercise prevented the otherwise dramatic gene expression changes triggered by LPS in the sedentary group (Figures 3C and 3D). The most prominent exercise-associated protection was observed in hepatocytes, ECs, Kupffer cells in the liver, and various immune cells (e.g., neutrophils and CD8+ naive T cells) in the lung in young mice post-LPS treatment (Figure 3D). This tissue-specific tendency to suppress LPS-induced genes was consistent, but to a much lesser extent, in corresponding groups of aged mice, suggesting that aged individuals are susceptible to acute inflammation even with routine exercise (Figures 3C and 3D). Consistently, a stronger age bias in the protective effects of the exercise was observed at the bulk tissue level, as the ratio of Rev-LPS DEGs to LPS DEGs remained comparable with that detected by scRNA-seq with younger age, while few Rev-LPS DEGs were identified in the aged group for all four tissues tested (Figures 3C and S5C).
Enrichment analysis of Rev-LPS DEGs showed that the expression of classic LPS-responsive genes, such as Gbp2, Arid5a, Hmgb1, and Hmgb2, was ameliorated by exercise in young mice (Figure 3E). Moreover, genes known to drive detrimental signaling events in response to LPS, including genes enriched in the NF-κB signaling pathway, mitogen-activated protein kinase signaling pathway, complement and coagulation, NOD-like receptor, autophagy, and chemokine signaling pathway, along with other pathways promoting inflammatory responses or cell death, were attenuated in the liver and lung of young exercised mice compared with sedentary control mice (Figures 3F, S6A–S6E, and S7A). Indeed, multiple pro-inflammatory pathways, such as cytokine production and neutrophil degranulation, as well as apoptotic pathways that were activated by LPS, were convergently suppressed by long-term exercise in young mice (Figures 3F, and S6A). Accordingly, transcriptional network analysis revealed that LPS-triggered activation of Hif1α, Stat2/3, Cebpb, and Arid5a-regulated networks in the Y-Ctrl group was abolished in the Y-Ex group (Figures S7B and S7C). Similar protective effects were also detected by bulk RNA-seq, indicating that exercise can protect multiple cell types in the same tissue against LPS-induced damage (Figures S7D and S8A).
Consistent with the bioinformatic results, LPS-induced immune cell infiltration (as shown by marker immunostaining of CD45 (total immune cells), neutrophil, and F4/80 (macrophages)) in the liver and lung and excessive expression of IL-1β with elevated apoptosis in the liver were both effectively prevented by exercise in young mice (Figures 3G–3K, and S7E). Moreover, LPS-induced secretion of ALT and increased lung weight/body weight ratio, all of which are indicators of acute inflammatory injury to the liver and lung, were ameliorated by exercise in young mice (Figures S8B and S8C). Together, these results indicate that exercise can at least partially protect against LPS-induced systemic inflammation and acute tissue damage, although with a strong age bias towards younger animals.
A global reversal of aging-related gene expression changes across tissues by exercise
Next, we asked whether long-term voluntary exercise started in middle-aged mice could prevent the progressive loss of tissue homeostasis associated with aging. To dissect the underlying molecular changes, we classified cell type-specific DEGs into several types. First, we defined genes that were differentially expressed between the young and old sedentary groups as Aging DEGs (O-Ctrl versus Y-Ctrl) (Figure 4A). Then, when comparing the exercising and sedentary groups of old mice, we classified aging-DEGs that change further in the same direction with exercise as Pro-aging DEGs, while aging-DEGs reversed by exercise were classified as Rev-aging DEGs. Overall, and in each tissue type, Rev-aging DEGs were found in much higher ratios than Pro-aging DEGs, with the exception of bone marrow, which may be hardly responsive to exercise with only a few DEGs identified with exercise (Figures 4B, 4C, and S9A; Table S2). These data indicate that exercise exerts a globally beneficial effect across the body, attenuating aging-associated cell type-specific gene expression changes in a tissue-dependent manner.
Figure 4.

Exercise reverses aging-related gene expression across tissues
(A) Venn diagrams showing the overlapped DEGs between Aging DEGs (O-Ctrl/Y-Ctrl) and OE DEGs (O-Ex/O-Ctrl) based on data from scRNA-seq and snRNA-seq. Pro-aging DEGs were the subset of OE DEGs changed in the same direction as Aging DEGs, and Rev-aging DEGs were the subset of OE DEGs changed in the opposite direction as Aging DEGs. The DEG numbers were calculated by summing the cell type-specific DEGs from the 14 tissues or organs, yielding the total number of upregulated and downregulated genes.
(B) Bar plots showing the DEG ratio (left) and DEG number (right) of Rev-aging, Pro-aging DEGs, and Aging-specific DEGs across different tissues based on data from scRNA-seq and snRNA-seq. The DEG ratio was calculated by comparing Rev-aging, Pro-aging DEGs, and Aging-specific DEGs with total Aging DEGs. Aging DEGs excluding Rev-aging and Pro-aging DEGs are defined as Aging-specific DEGs.
(C) Bar plots showing the DEG number (top) and DEG ratio (bottom) of Rev-aging, Pro-aging DEGs, and Aging-specific DEGs to total Aging DEGs across different cell types based on data from scRNA-seq and snRNA-seq.
(D) Dot plot showing the ratios of rescued DEGs (comparing upregulated or downregulated Rev-aging DEGs with total aging-DEGs) across all cell types of different tissues. The size of dots indicates the number of Rev-aging DEGs.
(E) Bar plots showing the DEG ratio of Rev-aging DEGs, Pro-aging DEGs, and Aging-specific DEGs to total Aging DEGs in endothelial cell and seven T cell subpopulations as indicated across different tissues.
(F) Heatmaps showing the enriched GO terms/pathways for upregulated (top) and downregulated (down) Rev-aging DEGs by exercise across different tissues in aged mice based on data from scRNA-seq and snRNA-seq.
(G) Heatmaps showing the changes in ligand-receptor interactions between different cell types across all the tissues in the Aging (O-Ctrl/Y-Ctrl) and OE (O-Ex/O-Ctrl) comparison groups based on data from scRNA-seq and snRNA-seq.
(H) Bubble plots showing the enriched GO terms/pathways for exercise-erased (left) or exercise-rescued (right) ligand-receptor interactions across all the cells in the indicated tissues.
Strikingly, out of all tissues examined in this study, we found that the aged nervous system was most strongly rescued by exercise, i.e., the spinal cord, brain, and cerebellum (Figures 4B and 4C). To further unravel cell type-specific aging-reversing effects caused by exercise, we quantified the corresponding rescued ratio by dividing the number of Rev-aging DEGs by total aging DEGs in the given cell type, and distinguished cell types with high rescued ratios (Figure 4D). At the cellular level, we found that a variety of cell types were strongly transcriptionally rescued to a younger state in the O-Ex group (namely ependymal and meningeal cells, pericytes, oligodendrocytes, and ECs in the spinal cord, as well as astrocytes and excitatory neurons in the brain (Figures 4C and 4D).
Outside of the nervous system, the skeletal muscle and heart in the O-Ex group also harbored aging DEGs that were rescued by exercise (Figure 4B). Myofibers, including slow and fast-twitch fiber types in the skeletal muscle, and pericytes and fibroblasts in the heart, were also rescued to a similar extent as neural cell types (Figures 4C and 4D). In addition, major cell types in the aorta (e.g., ECs, pericytes, and fibroblasts), kidney (e.g., PT-S1, PT-S2, and PT-S3), lung (e.g., ECs, CD8+ memory T cells, and CD8+ naive T cells), liver (e.g., Kupffer cells, neutrophils, and ECs), and testis (e.g., SPC) were also reprogrammed by exercise with discernable proportional Rev-aging DEGs (Figure 4C).
Of note, a few cell types that were distributed across divergent tissue types were generally rescued by exercise with a small degree of variability across tissues. For example, we found that ECs in the spinal cord, skeletal muscle, aorta, heart, and lung were universally reprogrammed by exercise to a younger state (Figure 4E). This was also the case for immune cells, especially CD8+ naive T cells in the peripheral blood, liver, lung, and bone marrow, although the overall rescue effect was not prominent in tissues of the hematopoietic and immune systems (Figure 4E). In addition, we found that aged CD8+ cytotoxic T lymphocytes and CD8+ memory T cells in the peripheral blood and spleen of O-Ex mice were still effectively rescued by exercise (Figure 4E).
Functionally, enrichment analysis showed that the upregulated Rev-aging DEGs converged into cell morphogenesis- and regeneration-related GO terms, such as tube morphogenesis (e.g., Egfr, Col3a1, and Nrp1), vasculature development (e.g., Angpt1, Fgfr2, and Errfi1), and Wnt signaling (e.g., Wnt5b, Foxo1, and Arntl), as well as neurogenesis-related Gene Ontology terms, such as synapse organization (e.g., App, Nptn, and Grm5), axon guidance (e.g., Epha4, Nptn, and Nrp1), and neuron projection development (e.g., Actb, Aplp1, and Cdc42), especially concentrated in the spinal cord and brain (Figure 4F). In contrast, the downregulated Rev-aging DEGs across cell types were enriched in Gene Ontology terms associated with inflammation (e.g., Relb, Hif1a, and Hp), and the apoptotic signaling pathway (e.g., Atf3, Egr1, and Timp3), especially concentrated in the liver and aorta of the O-Ex group (Figures 4F and S9B). Furthermore, aberrant intercellular communication, an integrative hallmark of aging, was also largely reset to a younger pattern, as indicated by computational prediction (Figures 4G, 4H, and S9C–S9E). For instance, interactions between ECs and immune cells mediated by VCAM-1 were elevated in the aged brain, whereas those mediated by ICAM-1 were elevated in the aged aorta and spinal cord (Table S5). These deleterious interactions, which may lead to increased leukocyte recruitment and excessive vascular inflammation and damage, were predicted to be abolished by exercise (Table S5). Altogether, our results suggest that exercise confers a systemic rejuvenation and anti-inflammatory effect.
We next verified the tissue-specific anti-inflammatory and geroprotective effects of exercise by examining a spectrum of aging-related hallmarks. In the O-Ex group, we found that exercise reduced aging-associated expression of IBA1 (a classic marker for microglia, the activation of which indicates neuroinflammation) and GFAP (a classic marker for astrocytes, the activation of which indicates reactive astrocytosis)-positive cells in multiple anatomic regions in the aged central nervous system, including the cerebral cortex, hippocampus, cerebellum, and spinal cord (Figures 5A and 5B). As for the inflammation status in other aged tissues, exercise ameliorated the exacerbated infiltration of CD45+ immune cells and neutrophils in the liver, lung, and kidney (Figures 5C and 5D). Exercise also decreased aging-associated IL-1β expression in the liver and kidney (Figure 5E). In addition, other hallmarks of aging, including elevated SA-β-gal-positive cells in the cerebellum, higher levels of p21 expression in the liver, lung, spleen, and kidney, fibrosis in the liver, lung, and spleen, as well as accumulation of lipid droplets in the liver, were all inhibited in old mice subjected to exercise (Figures S10A–S10D). Moreover, the decreased expression of GLUT-1, associated with aging in both the hippocampus and spinal cord, was restored by exercise, indicating that exercise prevents the breakdown of the blood-brain barrier or blood-spinal cord barrier (Figures S10E and S10F). At the histological level, and related to organ function in the liver, lung, testis, and kidney, we observed rescue of inflammation area, the diameter of alveoli and seminiferous tubules, and area of glomeruli, respectively (Figure S10G). In aged skeletal muscle, the proportion of type IIA fast fibers that normally decreased was replenished by exercise in the O-Ex group (Figure S10H). Altogether, exercise reversed aging-related gene expression changes and thereby senescence and chronic inflammation phenotypes across tissues of the whole organism, through tissue- and cell type-specific molecular events.
Figure 5.

Exercise alleviates a panel of aging-associated phenotypes across tissues
(A) Immunofluorescence analysis of IBA1-labeled microglial cells in the cortex and hippocampal DG region, cerebellum, spinal gray matter (GM), and white matter (WM) from the indicated groups. Scale bars, 50 μm. The percentages of IBA1-positive microglia were quantified. n = 7–12 mice per group.
(B) Immunostaining of GFAP in the hippocampus, cerebellum, spinal gray matter (GM), and white matter (WM) from the indicated groups. Scale bars, 50 μm. The percentages of GFAP-positive cells were quantified. n = 7–12 mice per group.
(C) Immunostaining of CD45 in lung, liver, heart, kidney, skeletal muscle, and small intestine tissues from the indicated groups. Scale bars, 50 μm. The percentages of CD45-positive immune cells were quantified. n = 5–12 mice per group.
(D) Immunofluorescence analysis of neutrophils in liver, lung, and kidney tissues from the indicated groups. Scale bars, 50 μm. The percentages of neutrophils were quantified. n = 5–12 mice per group.
(E) Immunochemistry analysis of IL-1β-positive areas in liver and kidney tissues from the indicated groups. The percentages of IL-1β-positive cells were quantified. Scale bars, 50 μm. n = 7–12 mice per group.
The quantification data in (A)–(E) are shown as the means ± SEM, and two-tailed Student's t test p values are indicated.
Exercise resets circadian clock-centered molecular programs in aged tissues to a younger state
To pinpoint key exercise-driven mediators capable of delaying aging across tissues, we utilized three levels of screening strategies. These included transcriptional network analysis to identify core transcription factors, projection of cell type-specific DEGs with bulk RNA-seq DEGs to identify those with significant changes even at the tissue level, and cross-reference cell type-specific DEGs for high-frequency ones shared by more than 20 cell types (Figures 6A–6C). Accordingly, we first used SCENIC to predict core transcription factors regulating transcriptional changes during aging or induced by exercise in all tissues (Figure 6A; Table S4). Strikingly, a combination of core circadian transcriptional regulators dysregulated during aging was restored by exercise in aged mice, including Dbp, Tef, Nr1d1, Nr1d2, and Bhlhe41 (Figure 6A). Key regulators of the circadian rhythm, Bmal1 and Dbp, were among the top DEGs whose expression changes were clearly detectable even at the tissue level by bulk RNA-seq (Figure 6B). In addition, Bmal1 and Dbp stood out as genes that were rescued by exercise in more than 30 cell types across tissues (Figure 6C).
Figure 6.

Exercise resets the circadian clock machinery across aged tissues
(A) Network plots showing the upregulated aging TFs (left) and downregulated aging TFs (right).
(B) Heatmaps showing the expression profiles of overlapped Rev-aging DEGs based on the sc/snRNA-seq and bulk RNA-seq data across different cell types from different tissues. The color key from blue to yellow indicates gene expression levels from low to high.
(C) Bubble plots showing the cell type frequency and tissue frequency (more than 5 tissues and 20 cell types) of upregulated (left) and downregulated (right) rescued DEGs.
(D) Heatmaps showing the expression profiles of circadian rhythm-related Rev-aging DEGs for different cell types across different tissues. The color key from blue to red indicates gene expression levels from low to high.
The circadian clock consists of two interwoven loops, one positive loop dictated by the BMAL1/CLOCK heterodimer, and a negative feedback loop controlled through Dbp, Nr1d1, Nr1d2, and Per2.46,47,48,49,50 When inspecting the expression of rescued circadian clock genes in each cell type, we found that the aging-related disruption of the circadian regulatory machinery was reestablished by exercise via three patterns in different tissues. First, both the downregulated positive loop and the upregulated negative loop were rescued by exercise in the aged heart (e.g., cardiomyocytes and ECs) and skeletal muscle (e.g., ECs and FAP) in the O-Ex group (Figure 6D). Second, circadian genes controlling the positive loop (e.g., Bmal1) that were downregulated in the aged spinal cord (e.g., ECs and astrocytes) were reactivated by exercise (Figure 6D). Third, circadian genes controlling the negative loop (e.g., Dbp, Nr1d1, and Nr1d2) that were upregulated in the aged aorta (e.g., ECs and fibroblasts), intestine (e.g., ECs and fibroblasts), kidney (e.g., ECs), lung (e.g., ECs), and liver (e.g., ECs) were repressed by exercise (Figure 6D). Taken together, all three exercise-driven programs converge to rescue dysregulated circadian genes across a broad spectrum of tissues and in a cell type-restricted manner.
BMAL1-dependent regulation of exercise-mediated circadian reprogramming
We hypothesized that the circadian clock is one of the central mediators through which exercise defies tissue aging. Indeed, the expression of Bmal1, the core component of the positive loop and necessary for clock function, was restored in 27 cell types (i.e., cardiomyocytes in the heart), especially in various ECs distributed across the heart, skeletal muscle, and spinal cord (Figure 7A). Accordingly, the rhythmic index, indicating the overall expression level of circadian-related genes, was especially rescued in ECs by prolonged exercise (Figure 7B), including cardiac ECs (CAECs), the main vascular ECs in the heart, and the inner lining of the coronary artery, which are critical to the blood supply to the heart and, in turn, the blood supply to the whole body.51,52 Therefore, we focused on CAECs for further investigation of circadian reprogramming and phenotypic validation. RNA in situ hybridization confirmed that Bmal1 mRNA in CAECs declined during aging and was restored by exercise (Figure 7C). BMAL1 expression was also decreased in senescent primary CAECs (Figure 7D). Consistently, knockdown of Bmal1 led to accelerated senescence demonstrated by increased SA-β-gal activity, upregulated expression of p16 and p21, and increased monocyte-EC adhesion with augmented VCAM-1, ICAM-1, and Il1b expression in CAECs (Figures 7E–7H). Moreover, BMAL1 deficiency in cardiomyocytes also resulted in accelerated aging (Figures S11A–S11E).
Figure 7.

BMAL1 plays a protective role in endothelial cells
(A) Bar plot showing the expression changes of Arntl (Bmal1) in different cell types from all the tissues analyzed in the indicated groups.
(B) Bar plots showing the rhythm index of different cell types from all the tissues analyzed in the indicated groups.
(C) Transverse sections of heart tissues from the indicated groups of mice were subjected to RNA in situ hybridization (RNA-ISH) with Bmal1 riboprobes. Left, representative ISH images; right, the relative expression level of Bmal1 in mouse hearts was quantified. Scale bars, 50 μm. n = 7 mice per group.
(D) Western blotting of BMAL1 protein levels in CAECs at the indicated passages. n = 3 biological repeats per group. Young, passage 4; Senescent, passage 11. RS, replicative senescence.
(E) Western blotting of BMAL1 protein levels in CAECs transduced with lentivirus with non-targeting or Bmal1-targeting sgRNAs in the CRISPR-Cas9-mediated knockout system.
(F) SA-β-gal analysis of CAECs transduced with lentivirus with non-targeting or Bmal1-targeting sgRNAs in the CRISPR-Cas9-mediated knockout system. Scale bars, 100 μm. n = 4 biological repeats per group.
(G) Transcript levels of indicated genes in CAECs transduced with lentivirus with non-targeting or Bmal1-targeting sgRNAs in the CRISPR-Cas9-mediated knockout system. n = 3 biological repeats per group.
(H) Monocyte adhesion assay in CAECs transduced with lentivirus with non-targeting or Bmal1-targeting sgRNAs in the CRISPR-Cas9-mediated knockout system. Scale bars, 50 μm. n = 3 biological repeats per group.
(I) Western blotting of BMAL1 protein levels in CAECs transduced with lentivirus-expressing Flag-tagged GAL4 or BMAL1. n = 3 biological repeats per group.
(J) SA-β-gal analysis of CAECs transduced with lentivirus-expressing Flag-tagged GAL4 or BMAL1. The percentage of SA-β-gal-positive cells was quantified. Scale bars, 100 μm. n = 3 biological repeats per group.
(K) Transcript levels of the indicated genes associated with endothelial cell dysfunction in CAECs transduced with lentivirus-expressing Flag-tagged GAL4 or BMAL1. n = 3 biological repeats per group.
(L) ELISA analysis of the secretion of IL-6 in CAECs transduced with lentivirus-expressing Flag-tagged GAL4 or BMAL1. The absorption value is normalized to the cell number. n = 3 biological repeats per group.
(M) Immunofluorescence staining of Ki67 in CAECs transduced with lentivirus-expressing Flag-tagged GAL4 or BMAL1. Scale bars, 50 μm. n = 4 biological repeats per group.
(N) Assessment of tube formation capability in CAECs transduced with lentivirus-expressing Flag-tagged GAL4 or BMAL1. The relative branch points (right upper) and total length of tubes (right lower) were quantified as fold changes. Scale bar, 100 μm. n = 3 biological repeats per group.
(O) Wound scratch assay showing the migration ability of CAECs transduced with lentivirus-expressing Flag-tagged GAL4 or BMAL1. Red lines represent scar boundaries. The relative migration ability was quantified as the fold change. Scale bar, 100 μm. n = 3 biological repeats per group.
(P) Immunochemistry analysis of CD31-positive (left) and VCAM-1-positive (right) cells in the heart using adjacent tissue sections from the indicated groups. The percentages of CD31- or VCAM-1-positive areas were quantified. Scale bars, 50 μm. n = 5–12 mice per group.
The quantification data in (C)–(P) are shown as the means ± SEM, and two-tailed Student's t test p values are indicated.
Given that BMAL1 expression was reactivated by exercise in aged ECs, we tested whether the age-defying effects of exercise can be mimicked by overexpressing Bmal1 alone in CAECs (Figure 7I). Indeed, BMAL1 overexpression delayed the cellular senescence of CAECs with decreased SA-β-gal levels as well as p16 and p21 expression (Figures 7J and 7K). BMAL1 overexpression also inhibited VCAM-1, ICAM-1, and Il1b expression, and IL-6 secretion, in line with overall repression of endothelial aging (Figures 7K and 7L), and led to reinforced proliferation, migration, and tube formation capabilities of CAECs (Figures 7M−7O). Moreover, overexpression of BMAL1 protected CAECs from LPS-induced damages, reducing the accumulation of endothelial dysfunction indicators (e.g., VCAM-1, ICAM-1, p16, p21, and Il1b) and alleviating monocyte adhesion to LPS-treated CAECs (Figures S11F and S11G). These results underscored the vasoprotective and angiogenic effects of BMAL1, which is consistent with the histological analysis that demonstrates a pronounced exercise-induced recovery of CD31+ ECs and reduction of VCAM-1+ ECs in aged individuals, with a distribution pattern resembling that of the young heart (Figures 7P and S11H). These results indicate that cardiovascular cells are particularly responsive to a reset of the BMAL1-centered circadian clock by exercise, and that this sensitive response may mediate the geroprotective effect of exercise on aging-related cardiovascular degeneration.
Discussion
Here, we comprehensively survey the health-promoting effects of exercise in 14 important mouse tissues/organs at the single-cell level. We found that exercise imposes strong protection against infectious inflammation in young animals. In older animals, we found that exercise, as a systemic intervention known to affect several different tissues, rescues a wide spectrum of age-related phenotypes. Furthermore, we found that long-term exercise reprograms dysregulated circadian activity in aged mice to a youthful state and identified that BMAL1, as a central mediator of exercise-driven geroprotective effects, coordinates downstream circadian genes in multiple tissues and cell types. Thus, we have unraveled the effect of exercise in a systematic and integrated fashion, taking into consideration age, external stimuli, tissues, and cell types, thereby greatly expanding our understanding of whole-body mechanisms underpinning exercise-induced benefits to both physical and mental health (Figure S11I).
LPS administration, conventionally used to mimic acute bacterial infection, is recognized as a potent initiator of systemic inflammatory response syndrome and sepsis. Here we dissected the effects of the combination of exercise and age in the acute infection setting, thereby addressing critical questions about the physiology of exercise biology in disease and aging. Consistent with our findings, recent studies report an anti-inflammatory role associated with exercise in mice and humans.43,53,54 Our study advances the current knowledge by implying that the extent of protection against acute inflammatory injury is more robust in young individuals.
Importantly, we examined how exercise segregates with delayed aging at the cellular, tissue, and organismal levels, describing strong preferential impacts on nervous tissues and ECs across different systems. Our data highlight that the neural cells of the spinal cord, as well as structural support cells, harbor the highest percentages of aging-related transcriptomic signatures that were rescued by exercise, consistent with the coordinating role of the spinal cord in movement control.55,56 In support of our data, the geroprotective effect of exercise has been linked with both neurons and glial cells of the brain, which may help explain why regular exercise also confers mental benefits in elderly adults.2,57,58 Furthermore, by combining our comprehensive bioinformatic analysis with histological validation across tissues, we unveiled core features of exercise-induced geroprotective effects, namely minimized vascular degeneration, strengthened peripheral muscles, counteracted fibrosis, and lipid accumulation, as well as alleviated inflammation across the whole body. In support of our results, both aged male and female mice benefit from aerobic exercise,43,58,59,60,61 in terms of muscle strengthening,61,62 cardiac remodeling,63,64 etc., as reported previously. Here, we focused on male mice in this study as other previous studies did,15,65 and further work with both genders will broaden our understanding of exercise. Altogether, these studies including ours help pave the way for the development of therapies that mitigate the severity of chronic diseases, such as neurodegenerative disorders and cardiovascular diseases.64,65,66,67,68
Disturbance of circadian rhythms can negatively affect mental and physical health and is a well-known hallmark of aging.69,70 Although previous reports demonstrated that physical activity could resynchronize the circadian clock,71,72 little is known about whether circadian rhythms are regulators of cellular homeostasis and aging during exercise. Here, we found that voluntary exercise corrects cellular circadian disorders in aged mice and that exercise rescued the expression of circadian genes dysregulated with aging in a broad spectrum of tissues in a cell type-restricted manner. Our data pinpoint BMAL1 as a central mediator of such exercise-driven geroprotective effects, at least in part due to its critical role in resetting the dysregulated circadian clock to a youthful state in multiple aged tissues and cell types, especially in vascular ECs.73,74 We found that overexpression of BMAL1 in cardiac ECs consolidated angiogenesis and conferred protection against senescence and LPS-induced hyperinflammation and cell death. Supporting our findings, a recent study found that Bmal1 exerted a vasoprotective role in an ischemic injury model.75 Taken together, our work links exercise to vasoprotective and vascular regeneration effects downstream of BMAL1, thereby achieving geroprotective effects at a systemic level. Consistent with the well-established central role of BMAL1 in circadian regulation,76,77,78,79,80 our study now positioned BMAL1 as a core downstream effector of long-term exercise via circadian reprogramming, thus providing further understanding of the molecular mechanism underlying exercise-induced benefits and for the development of potential surrogate compound of exercise.
Collectively, we have constructed a comprehensive single-cell roadmap that provides insights into the complexity of cellular networks responsive to exercise in young and old animals and helps guide investigations of molecular events mediating the effects of exercise. By generating this atlas, we captured core mechanisms underlying exercise-associated geroprotective effects across organ systems. Our work underscores the vital role of the circadian regulatory network in orchestrating adaptations to exercise, and lays the groundwork for future therapeutic development of “exercise mimetics” that can combat sedentarism-mediated disorders and aging.
Materials and methods
Materials and methods related to this work are available in the supplemental information.
Acknowledgments
We thank Jingyi Jia and Lukai Huang for assisting with the animal experiments. We thank Dandan Li and Yuxuan Liu for assisting with phenotypic analysis. We thank Wei Li, Cui Wang, Yanxia Ye, Lingling Geng, Hezhen Shan, Miyang Ma, Yaobin Jing, Fangmin Lin, Zehua Wang, Yingjie Ding, Yixin Zhang, Jinghui Lei, Mingheng Li, Muzhao Xiong, Jian Yin, Shanshan Yang, Qiaoran Wang, Ying Jing, Ping Yang, Xiaoyan Sun, Liyun Zhao, Chengyu Liu, Yanling Fan, Lanzhu Li, Jingyi Jia, Min Wang, Lixiao Liu, Feifei Liu, Shanshan Che, Qiao Zhao, Daoyuan Huang, Guoqiang Sun, Baohu Zhang, Huifang Hu, Zhiran Zou, Tianling Cao, and Sheng Zhang for participating in the tissue dissociation and single-cell isolation from specific mouse tissues. We thank Chuqian Liang for help in cell culture. We thank Lei Bai, Ruijun Bai, Jing Lu, Qun Chu, Ying Yang, Luyang Tian, Shangyi Qiao, Jing Chen, Xiao Zhuo, Shikun Ma, and Xiangmei Jin for administrative assistance. We are grateful to Junying Jia from the Institute of Biophysics, Chinese Academy of Sciences, for the fluorescence-activated cell sorting (FACS), to Shiwen Li and Hua Qin from Institute of Zoology, Chinese Academy of Sciences, for image scanning, to Junfeng Hao from the Institute of Biophysics, Chinese Academy of Sciences, for image scanning, and Can Peng from the Institute of Biophysics, Chinese Academy of Sciences, for transmission electron microscopy work. We also thank the Aging Biomarker Consortium, China (ABC) for supporting our study. This work was supported by the National Key R&D Program of China (2022YFA1103700, 2020YFA0804000, 2018YFC2000100, 2018YFA0107203, 2020YFA0112200, 2019YFA0802202, 2020YFA0803401, 2021YFF1201005, and 2022YFA1103800), the STI2030-Major Projects (2021ZD0202400), the Strategic Priority Research Program of the Chinese Academy of Sciences (XDA16000000), the National Natural Science Foundation of China (81921006, 82125011, 31900523, 92149301, 92168201, 91949209, 92049304, 92049116, 32121001, 82192863, 82122024, 82071588, 31970597, 81861168034, 82271600, 32000500, 82201727, and 81901432), the CAS Project for Young Scientists in Basic Research (YSBR-076 and YSBR-012), the Program of the Beijing Natural Science Foundation (Z190019), the K.C. Wong Education Foundation (GJTD-2019-06, GJTD-2019-08), the Pilot Project for Public Welfare Development and Re-form of Beijing-affiliated Medical Research Institutes (11000022T000000461062), the Youth Innovation Promotion Association of CAS (E1CAZW0401 and 2022083), the Young Elite Scientists Sponsorship Program by CAST (YESS20200012 and YESS20210002), the Informatization Plan of the Chinese Academy of Sciences (CAS-WX2021SF-0301, CAS-WX2022SDC-XK14, and CAS-WX2021SF-0101), and the Tencent Foundation (2021-1045).
Author contributions
G.-H.L., J.Q., and W.Z. conceptualized this project and supervised the overall experiments. S.S., Y.C., Y.Y., and Y.Y. performed animal experiments and single-cell isolation of mouse tissues. S.M., J.P., X.W., and H.Y. performed bioinformatics analysis of the sc/snRNA-seq and bulk RNA-seq. S.S., Y.Y., and Y.Z. performed the cell culture. S.S., Y.Y., and Y.Y. performed immunostaining and tissue section analyses. Y.C. performed FACS analyses and TEM. W.L. and F.L. conducted the experiments of 12-month exercise on mice. S.S. and Y.Y. performed single-nucleus isolation. G.-H.L., J.Q., W.Z., S.W., J.R., S.S., M.S., Y.Y., C.R.E., and J.C.I.B. wrote, reviewed, and edited the manuscript.
Declaration of interests
The authors declare no competing interests.
Published Online: January 5, 2023
Footnotes
It can be found online at https://doi.org/10.1016/j.xinn.2023.100380.
Contributor Information
Weiqi Zhang, Email: zhangwq@big.ac.cn.
Jing Qu, Email: qujing@ioz.ac.cn.
Guang-Hui Liu, Email: ghliu@ioz.ac.cn.
Lead contact website
http://sourcedb.ioz.cas.cn/yw/scs/pi/201905/t20190514_5294619.html.
Supplemental information
Data and code availability
The accession numbers for the raw sc/snRNA-seq and bulk RNA-seq data reported in this paper are in the GSA (Genome Sequence Archive) under accession number CRA007207. In addition, we have uploaded the process files, including the barcodes and expression matrix for each sample in the Omix database: OMIX002605.
The custom codes were upload in the GitHub (https://github.com/wxb1998/Mouse-exercise-Project). Moreover, to make our data more accessible with a visualization function, we uploaded the dataset and DEG list to Aging Atlas (https://ngdc.cncb.ac.cn/aging/landscape?project=mouse_exercise_tissues).
References
- 1.Ruegsegger G.N., Booth F.W. Health benefits of exercise. Cold Spring Harb. Perspect. Med. 2018;8:a029694. doi: 10.1101/cshperspect.a029694. [DOI] [PMC free article] [PubMed] [Google Scholar]
- 2.Hötting K., Röder B. Beneficial effects of physical exercise on neuroplasticity and cognition. Neurosci. Biobehav. Rev. 2013;37:2243–2257. doi: 10.1016/j.neubiorev.2013.04.005. [DOI] [PubMed] [Google Scholar]
- 3.Boström P.A., Graham E.L., Georgiadi A., et al. Impact of exercise on muscle and nonmuscle organs. IUBMB Life. 2013;65:845–850. doi: 10.1002/iub.1209. [DOI] [PubMed] [Google Scholar]
- 4.Hawley J.A., Hargreaves M., Joyner M.J., et al. Integrative biology of exercise. Cell. 2014;159:738–749. doi: 10.1016/j.cell.2014.10.029. [DOI] [PubMed] [Google Scholar]
- 5.Freeman J.V., Dewey F.E., Hadley D.M., et al. Autonomic nervous system interaction with the cardiovascular system during exercise. Prog. Cardiovasc. Dis. 2006;48:342–362. doi: 10.1016/j.pcad.2005.11.003. [DOI] [PubMed] [Google Scholar]
- 6.Carapeto P.V., Aguayo-Mazzucato C. Effects of exercise on cellular and tissue aging. Aging (Albany NY) 2021;13:14522–14543. doi: 10.18632/aging.203051. [DOI] [PMC free article] [PubMed] [Google Scholar]
- 7.Penedo F.J., Dahn J.R. Exercise and well-being: a review of mental and physical health benefits associated with physical activity. Curr. Opin. Psychiatry. 2005;18:189–193. doi: 10.1097/00001504-200503000-00013. [DOI] [PubMed] [Google Scholar]
- 8.Nieman D.C. Special feature for the Olympics: effects of exercise on the immune system: exercise effects on systemic immunity. Immunol. Cell Biol. 2000;78:496–501. doi: 10.1111/j.1440-1711.2000.t01-5-.x. [DOI] [PubMed] [Google Scholar]
- 9.Egan B., Zierath J.R. Exercise metabolism and the molecular regulation of skeletal muscle adaptation. Cell Metab. 2013;17:162–184. doi: 10.1016/j.cmet.2012.12.012. [DOI] [PubMed] [Google Scholar]
- 10.Feng L., Li B., Xi Y., et al. Aerobic exercise and resistance exercise alleviate skeletal muscle atrophy through IGF-1/IGF-1R-PI3K/Akt pathway in mice with myocardial infarction. Am. J. Physiol. Cell Physiol. 2022;322:C164–C176. doi: 10.1152/ajpcell.00344.2021. [DOI] [PubMed] [Google Scholar]
- 11.Baar K., Wende A.R., Jones T.E., et al. Adaptations of skeletal muscle to exercise: rapid increase in the transcriptional coactivator PGC-1. FASEB J. 2002;16:1879–1886. doi: 10.1096/fj.02-0367com. [DOI] [PubMed] [Google Scholar]
- 12.Barrès R., Yan J., Egan B., et al. Acute exercise remodels promoter methylation in human skeletal muscle. Cell Metab. 2012;15:405–411. doi: 10.1016/j.cmet.2012.01.001. [DOI] [PubMed] [Google Scholar]
- 13.Li V.L., He Y., Contrepois K., et al. An exercise-inducible metabolite that suppresses feeding and obesity. Nature. 2022;606:785–790. doi: 10.1038/s41586-022-04828-5. [DOI] [PMC free article] [PubMed] [Google Scholar]
- 14.Swift D.L., McGee J.E., Earnest C.P., et al. The effects of exercise and physical activity on weight loss and maintenance. Prog. Cardiovasc. Dis. 2018;61:206–213. doi: 10.1016/j.pcad.2018.07.014. [DOI] [PubMed] [Google Scholar]
- 15.Brett J.O., Arjona M., Ikeda M., et al. Exercise rejuvenates quiescent skeletal muscle stem cells in old mice through restoration of Cyclin D1. Nat. Metab. 2020;2:307–317. doi: 10.1038/s42255-020-0190-0. [DOI] [PMC free article] [PubMed] [Google Scholar]
- 16.Lanza I.R., Nair K.S. Muscle mitochondrial changes with aging and exercise. Am. J. Clin. Nutr. 2009;89:467S–471S. doi: 10.3945/ajcn.2008.26717D. [DOI] [PMC free article] [PubMed] [Google Scholar]
- 17.Hood D.A., Memme J.M., Oliveira A.N., et al. Maintenance of skeletal muscle mitochondria in health, exercise, and aging. Annu. Rev. Physiol. 2019;81:19–41. doi: 10.1146/annurev-physiol-020518-114310. [DOI] [PubMed] [Google Scholar]
- 18.Wu C.W., Chang Y.T., Yu L., et al. Exercise enhances the proliferation of neural stem cells and neurite growth and survival of neuronal progenitor cells in dentate gyrus of middle-aged mice. J. Appl. Physiol. 2008;105:1585–1594. doi: 10.1152/japplphysiol.90775.2008. [DOI] [PubMed] [Google Scholar]
- 19.Wang K., Liu H., Hu Q., et al. Epigenetic regulation of aging: implications for interventions of aging and diseases. Signal Transduct. Target. Ther. 2022;7:374. doi: 10.1038/s41392-022-01211-8. [DOI] [PMC free article] [PubMed] [Google Scholar]
- 20.Cai Y., Song W., Li J., et al. The landscape of aging. Sci. China Life Sci. 2022;65:2354–2454. doi: 10.1007/s11427-022-2161-3. [DOI] [PMC free article] [PubMed] [Google Scholar]
- 21.He X., Memczak S., Qu J., et al. Single-cell omics in ageing: a young and growing field. Nat. Metab. 2020;2:293–302. doi: 10.1038/s42255-020-0196-7. [DOI] [PubMed] [Google Scholar]
- 22.Yan H., Wang R., Ma S., et al. Lineage Landscape: a comprehensive database that records lineage commitment across species. Nucleic Acids Res. 2022. 51(D1):D1061-D1066. [DOI] [PMC free article] [PubMed]
- 23.Kang W., Jin T., Zhang T., et al. Regeneration Roadmap: database resources for regenerative biology. Nucleic Acids Res. 2022;50:D1085–D1090. doi: 10.1093/nar/gkab870. [DOI] [PMC free article] [PubMed] [Google Scholar]
- 24.Liu G.H., Bao Y., Zhuo X. Aging Atlas: a multi-omics database for aging biology. Nucleic Acids Res. 2021;49:D825–D830. doi: 10.1093/nar/gkaa894. [DOI] [PMC free article] [PubMed] [Google Scholar]
- 25.Leng S.X., Pawelec G. Single-cell immune atlas for human aging and frailty. Life Medicine. 2022;1:67–70. doi: 10.1093/lifemedi/lnac013. [DOI] [PMC free article] [PubMed] [Google Scholar]
- 26.Zou X., Dai X., Mentis A.-F.A., et al. From monkey single-cell atlases into a broader biomedical perspective. Life Medicine. 2022:lnac028. [Google Scholar]
- 27.Zhao D., Chen S. Failures at every level: breakdown of the epigenetic machinery of aging. Life Medicine. 2022;1:81–83. [Google Scholar]
- 28.Zhou T., Kiran M., Lui K.O., et al. Decoding liver fibrogenesis with single-cell technologies. Life Medicine. 2022 [Google Scholar]
- 29.Liu L., Buckley M.T., Reyes J.M., et al. Exercise reprograms the inflammatory landscape of multiple stem cell compartments during mammalian aging. bioRxiv. 2022 doi: 10.1016/j.stem.2023.03.016. Preprint at. [DOI] [PMC free article] [PubMed] [Google Scholar]
- 30.Jing Y., Zuo Y., Yu Y., et al. Single-nucleus profiling unveils a geroprotective role of the FOXO3 in primate skeletal muscle aging. Protein Cell. 2022 doi: 10.1093/procel/pwac061. [DOI] [PMC free article] [PubMed] [Google Scholar]
- 31.Zhao Q., Zheng Y., Zhao D., et al. Single-cell profiling reveals a potent role of quercetin in promoting hair regeneration. Protein Cell. 2022 doi: 10.1093/procel/pwac062. [DOI] [PMC free article] [PubMed] [Google Scholar]
- 32.Huang D., Zuo Y., Zhang C., et al. A single-nucleus transcriptomic atlas of primate testicular aging reveals exhaustion of the spermatogonial stem cell reservoir and loss of Sertoli cell homeostasis. Protein Cell. 2022 doi: 10.1093/procel/pwac057. [DOI] [PMC free article] [PubMed] [Google Scholar]
- 33.Wang W., Vilella F., Alama P., et al. Single-cell transcriptomic atlas of the human endometrium during the menstrual cycle. Nat. Med. 2020;26:1644–1653. doi: 10.1038/s41591-020-1040-z. [DOI] [PubMed] [Google Scholar]
- 34.Ma S., Wang S., Ye Y., et al. Heterochronic parabiosis induces stem cell revitalization and systemic rejuvenation across aged tissues. Cell Stem Cell. 2022;29:990–1005.e10. doi: 10.1016/j.stem.2022.04.017. [DOI] [PubMed] [Google Scholar]
- 35.Tabula Muris C. A single-cell transcriptomic atlas characterizes ageing tissues in the mouse. Nature. 2020;583:590–595. doi: 10.1038/s41586-020-2496-1. [DOI] [PMC free article] [PubMed] [Google Scholar]
- 36.Pálovics R., Keller A., Schaum N., et al. Molecular hallmarks of heterochronic parabiosis at single-cell resolution. Nature. 2022;603:309–314. doi: 10.1038/s41586-022-04461-2. [DOI] [PMC free article] [PubMed] [Google Scholar]
- 37.Wang L., Liu J., Liu H., et al. The secret of youth - how is systemic rejuvenation achieved at the single cell level? Life Medicine. 2022:lnac018. [Google Scholar]
- 38.Cai Y., Ji Z., Wang S., et al. Genetic enhancement: a new avenue to combat aging-related diseases. Life Medicine. 2022:lnac054. [Google Scholar]
- 39.Sun Y., Li Q., Kirkland J.L. Targeting senescent cells for a healthier longevity: the roadmap for an era of global aging. Life Medicine. 2022;1:103–109. doi: 10.1093/lifemedi/lnac030. [DOI] [PMC free article] [PubMed] [Google Scholar]
- 40.Zhang Y., Zheng Y., Wang S., et al. Single-nucleus transcriptomics reveals a gatekeeper role for FOXP1 in primate cardiac aging. Protein Cell. 2022 doi: 10.1093/procel/pwac038. [DOI] [PMC free article] [PubMed] [Google Scholar]
- 41.Nyblom H., Berggren U., Balldin J., Olsson R. High AST/ALT ratio may indicate advanced alcoholic liver disease rather than heavy drinking. Alcohol Alcohol. 2004;39:336–339. doi: 10.1093/alcalc/agh074. [DOI] [PubMed] [Google Scholar]
- 42.Grevendonk L., Connell N.J., McCrum C., et al. Impact of aging and exercise on skeletal muscle mitochondrial capacity, energy metabolism, and physical function. Nat. Commun. 2021;12:4773. doi: 10.1038/s41467-021-24956-2. [DOI] [PMC free article] [PubMed] [Google Scholar]
- 43.De Miguel Z., Khoury N., Betley M.J., et al. Exercise plasma boosts memory and dampens brain inflammation via clusterin. Nature. 2021;600:494–499. doi: 10.1038/s41586-021-04183-x. [DOI] [PMC free article] [PubMed] [Google Scholar]
- 44.Wang H., Jiang C., Cai J., et al. Nestin prevents mesenchymal stromal cells from apoptosis in LPS-induced lung injury via inhibition of unfolded protein response sensor IRE1α. Life Medicine. 2022:lnac049. [Google Scholar]
- 45.Seemann S., Zohles F., Lupp A. Comprehensive comparison of three different animal models for systemic inflammation. J. Biomed. Sci. 2017;24:60. doi: 10.1186/s12929-017-0370-8. [DOI] [PMC free article] [PubMed] [Google Scholar]
- 46.Ripperger J.A., Shearman L.P., Reppert S.M., et al. CLOCK, an essential pacemaker component, controls expression of the circadian transcription factor DBP. Genes Dev. 2000;14:679–689. [PMC free article] [PubMed] [Google Scholar]
- 47.Yamaguchi S., Mitsui S., Yan L., et al. Role of DBP in the circadian oscillatory mechanism. Mol. Cell Biol. 2000;20:4773–4781. doi: 10.1128/mcb.20.13.4773-4781.2000. [DOI] [PMC free article] [PubMed] [Google Scholar]
- 48.Ripperger J.A., Schibler U. Rhythmic CLOCK-BMAL1 binding to multiple E-box motifs drives circadian Dbp transcription and chromatin transitions. Nat. Genet. 2006;38:369–374. doi: 10.1038/ng1738. [DOI] [PubMed] [Google Scholar]
- 49.Takahashi J.S. Transcriptional architecture of the mammalian circadian clock. Nat. Rev. Genet. 2017;18:164–179. doi: 10.1038/nrg.2016.150. [DOI] [PMC free article] [PubMed] [Google Scholar]
- 50.Ye R., Selby C.P., Chiou Y.Y., et al. Dual modes of CLOCK:BMAL1 inhibition mediated by Cryptochrome and Period proteins in the mammalian circadian clock. Genes Dev. 2014;28:1989–1998. doi: 10.1101/gad.249417.114. [DOI] [PMC free article] [PubMed] [Google Scholar]
- 51.Segers V.F.M., Brutsaert D.L., De Keulenaer G.W. Cardiac remodeling: endothelial cells have more to say than just NO. Front. Physiol. 2018;9:382. doi: 10.3389/fphys.2018.00382. [DOI] [PMC free article] [PubMed] [Google Scholar]
- 52.Brutsaert D.L. Cardiac endothelial-myocardial signaling: its role in cardiac growth, contractile performance, and rhythmicity. Physiol. Rev. 2003;83:59–115. doi: 10.1152/physrev.00017.2002. [DOI] [PubMed] [Google Scholar]
- 53.Littlefield A.M., Setti S.E., Priester C., et al. Voluntary exercise attenuates LPS-induced reductions in neurogenesis and increases microglia expression of a proneurogenic phenotype in aged mice. J. Neuroinflammation. 2015;12:138. doi: 10.1186/s12974-015-0362-0. [DOI] [PMC free article] [PubMed] [Google Scholar]
- 54.Mota B.C., Kelly Á.M. Exercise alters LPS-induced glial activation in the mouse brain. Neuronal Signal. 2020;4:NS20200003. doi: 10.1042/NS20200003. [DOI] [PMC free article] [PubMed] [Google Scholar]
- 55.Field-Fote E.C. Spinal cord control of movement: implications for locomotor rehabilitation following spinal cord injury. Phys. Ther. 2000;80:477–484. [PubMed] [Google Scholar]
- 56.Dietz V. Spinal cord pattern generators for locomotion. Clin. Neurophysiol. 2003;114:1379–1389. doi: 10.1016/s1388-2457(03)00120-2. [DOI] [PubMed] [Google Scholar]
- 57.Cho C., Han C., Sung M., et al. Six-month lower limb aerobic exercise improves physical function in young-old, old-old, and oldest-old adults. Tohoku J. Exp. Med. 2017;242:251–257. doi: 10.1620/tjem.242.251. [DOI] [PubMed] [Google Scholar]
- 58.Horowitz A.M., Fan X., Bieri G., et al. Blood factors transfer beneficial effects of exercise on neurogenesis and cognition to the aged brain. Science. 2020;369:167–173. doi: 10.1126/science.aaw2622. [DOI] [PMC free article] [PubMed] [Google Scholar]
- 59.White Z., Terrill J., White R.B., et al. Voluntary resistance wheel exercise from mid-life prevents sarcopenia and increases markers of mitochondrial function and autophagy in muscles of old male and female C57BL/6J mice. Skelet. Muscle. 2016;6:45. doi: 10.1186/s13395-016-0117-3. [DOI] [PMC free article] [PubMed] [Google Scholar]
- 60.Kohman R.A., Bhattacharya T.K., Wojcik E., et al. Exercise reduces activation of microglia isolated from hippocampus and brain of aged mice. J. Neuroinflammation. 2013;10:114. doi: 10.1186/1742-2094-10-114. [DOI] [PMC free article] [PubMed] [Google Scholar]
- 61.Murach K.A., Dimet-Wiley A.L., Wen Y., et al. Late-life exercise mitigates skeletal muscle epigenetic aging. Aging Cell. 2022;21:e13527. doi: 10.1111/acel.13527. [DOI] [PMC free article] [PubMed] [Google Scholar]
- 62.Wohlwend M., Laurila P.P., Williams K., et al. The exercise-induced long noncoding RNA CYTOR promotes fast-twitch myogenesis in aging. Sci. Transl. Med. 2021;13:eabc7367. doi: 10.1126/scitranslmed.abc7367. [DOI] [PubMed] [Google Scholar]
- 63.Bronikowski A.M., Carter P.A., Morgan T.J., et al. Lifelong voluntary exercise in the mouse prevents age-related alterations in gene expression in the heart. Physiol. Genomics. 2003;12:129–138. doi: 10.1152/physiolgenomics.00082.2002. [DOI] [PubMed] [Google Scholar]
- 64.Roh J.D., Houstis N., Yu A., et al. Exercise training reverses cardiac aging phenotypes associated with heart failure with preserved ejection fraction in male mice. Aging Cell. 2020;19:e13159. doi: 10.1111/acel.13159. [DOI] [PMC free article] [PubMed] [Google Scholar]
- 65.Lerchenmüller C., Vujic A., Mittag S., et al. Restoration of cardiomyogenesis in aged mouse hearts by voluntary exercise. Circulation. 2022;146:412–426. doi: 10.1161/CIRCULATIONAHA.121.057276. [DOI] [PMC free article] [PubMed] [Google Scholar]
- 66.Pedersen B.K., Saltin B. Exercise as medicine - evidence for prescribing exercise as therapy in 26 different chronic diseases. Scand. J. Med. Sci. Sports. 2015;25(Suppl 3):1–72. doi: 10.1111/sms.12581. [DOI] [PubMed] [Google Scholar]
- 67.Handschin C., Spiegelman B.M. The role of exercise and PGC1alpha in inflammation and chronic disease. Nature. 2008;454:463–469. doi: 10.1038/nature07206. [DOI] [PMC free article] [PubMed] [Google Scholar]
- 68.Booth F.W., Roberts C.K., Laye M.J. Lack of exercise is a major cause of chronic diseases. Compr. Physiol. 2012;2:1143–1211. doi: 10.1002/cphy.c110025. [DOI] [PMC free article] [PubMed] [Google Scholar]
- 69.Acosta-Rodríguez V.A., Rijo-Ferreira F., Green C.B., et al. Importance of circadian timing for aging and longevity. Nat. Commun. 2021;12:2862. doi: 10.1038/s41467-021-22922-6. [DOI] [PMC free article] [PubMed] [Google Scholar]
- 70.Manoogian E.N.C., Panda S. Circadian rhythms, time-restricted feeding, and healthy aging. Ageing Res. Rev. 2017;39:59–67. doi: 10.1016/j.arr.2016.12.006. [DOI] [PMC free article] [PubMed] [Google Scholar]
- 71.Acosta-Rodríguez V., Rijo-Ferreira F., Izumo M., et al. Circadian alignment of early onset caloric restriction promotes longevity in male C57BL/6J mice. Science. 2022;376:1192–1202. doi: 10.1126/science.abk0297. [DOI] [PMC free article] [PubMed] [Google Scholar]
- 72.Partch C.L., Green C.B., Takahashi J.S. Molecular architecture of the mammalian circadian clock. Trends Cell Biol. 2014;24:90–99. doi: 10.1016/j.tcb.2013.07.002. [DOI] [PMC free article] [PubMed] [Google Scholar]
- 73.Liang C., Ke Q., Liu Z., et al. BMAL1 moonlighting as a gatekeeper for LINE1 repression and cellular senescence in primates. Nucleic Acids Res. 2022;50:3323–3347. doi: 10.1093/nar/gkac146. [DOI] [PMC free article] [PubMed] [Google Scholar]
- 74.Liang C., Liu Z., Song M., et al. Stabilization of heterochromatin by CLOCK promotes stem cell rejuvenation and cartilage regeneration. Cell Res. 2021;31:187–205. doi: 10.1038/s41422-020-0385-7. [DOI] [PMC free article] [PubMed] [Google Scholar]
- 75.Xu L., Liu Y., Cheng Q., et al. Bmal1 downregulation worsens critical limb ischemia by promoting inflammation and impairing angiogenesis. Front. Cardiovasc. Med. 2021;8:712903. doi: 10.3389/fcvm.2021.712903. [DOI] [PMC free article] [PubMed] [Google Scholar]
- 76.Wang N., Yang G., Jia Z., et al. Vascular PPARgamma controls circadian variation in blood pressure and heart rate through Bmal1. Cell Metab. 2008;8:482–491. doi: 10.1016/j.cmet.2008.10.009. [DOI] [PMC free article] [PubMed] [Google Scholar]
- 77.Welz P.S., Zinna V.M., Symeonidi A., et al. BMAL1-Driven tissue clocks respond independently to light to maintain homeostasis. Cell. 2019;178:1029–1447.e1412. doi: 10.1016/j.cell.2019.07.030. [DOI] [PMC free article] [PubMed] [Google Scholar]
- 78.Ray S., Valekunja U.K., Stangherlin A., et al. Circadian rhythms in the absence of the clock gene Bmal1. Science. 2020;367:800–806. doi: 10.1126/science.aaw7365. [DOI] [PubMed] [Google Scholar]
- 79.Nguyen K.D., Fentress S.J., Qiu Y., et al. Circadian gene Bmal1 regulates diurnal oscillations of Ly6C(hi) inflammatory monocytes. Science. 2013;341:1483–1488. doi: 10.1126/science.1240636. [DOI] [PMC free article] [PubMed] [Google Scholar]
- 80.Liu B., Qu J., Zhang W., et al. A stem cell aging framework, from mechanisms to interventions. Cell Rep. 2022;41:111451. doi: 10.1016/j.celrep.2022.111451. [DOI] [PubMed] [Google Scholar]
Associated Data
This section collects any data citations, data availability statements, or supplementary materials included in this article.
Supplementary Materials
Data Availability Statement
The accession numbers for the raw sc/snRNA-seq and bulk RNA-seq data reported in this paper are in the GSA (Genome Sequence Archive) under accession number CRA007207. In addition, we have uploaded the process files, including the barcodes and expression matrix for each sample in the Omix database: OMIX002605.
The custom codes were upload in the GitHub (https://github.com/wxb1998/Mouse-exercise-Project). Moreover, to make our data more accessible with a visualization function, we uploaded the dataset and DEG list to Aging Atlas (https://ngdc.cncb.ac.cn/aging/landscape?project=mouse_exercise_tissues).