Abstract
Genome-wide association studies (GWAS) provide a powerful means to identify loci and genes contributing to disease, but in many cases the related cell types/states through which genes confer disease risk remain unknown. Deciphering such relationships is important for identifying pathogenic processes and developing therapeutics. Here, we introduce sc-linker, a framework for integrating single-cell RNA-seq (scRNA-seq), epigenomic maps and GWAS summary statistics to infer the underlying cell types and processes by which genetic variants influence disease. The inferred disease enrichments recapitulated known biology and highlighted notable cell-disease relationships, including GABAergic neurons in major depressive disorder, a disease-dependent M cell program in ulcerative colitis, and a disease-specific complement cascade process in multiple sclerosis. In autoimmune disease, both healthy and disease-dependent immune cell type programs were associated, whereas only disease-dependent epithelial cell programs were prominent, suggesting a role in disease response over initiation. Our framework provides a powerful approach for identifying the cell types and cellular processes by which genetic variants influence disease.
INTRODUCTION
Genome wide association studies (GWAS) have successfully identified thousands of disease-associated variants1–3, but the cellular mechanisms through which these variants drive complex diseases and traits remain largely unknown. This is due to several challenges, including the difficulty of relating the approximately 95% of risk variants that reside in non-coding regulatory regions to the genes they regulate4–7, and our limited knowledge of the specific cells and functional programs in which these genes are active8. Previous studies have linked traits to functional elements9–15 and to cell types from bulk RNA-seq profiles16–18. Considerable work remains to analyze cell types and states at finer resolutions across a breadth of tissues, incorporate disease tissue-specific gene expression patterns, model cellular processes within and across cell types, and leverage enhancer-gene links19–23 to improve power.
ScRNA-seq data provide a unique opportunity to tackle these challenges24. Single-cell profiles allow the construction of multiple gene programs to more finely relate GWAS variants to function, including programs that reflect cell-type-specific signatures25–28, disease-dependent signatures within cell types29,30, and key cellular processes that vary within and/or across cell types31. Initial studies have related single-cell profiles with human genetics in post hoc analyses by mapping candidate genes from disease-associated genomic regions to cell types by their expression relative to other cell types32–34. More recent studies have begun to leverage genome-wide polygenic signals to map traits to cell types from single cells within the context of a single tissue35–37. However, focusing on a single tissue could in principle result in misleading conclusions, because disease mechanisms span tissue types across the human body. For example, in the context of the colon, a neural gene associated with psychiatric disorders would appear highly specific to enteric neurons, but this cell population may no longer be strongly implicated when the analysis also includes cells from the human central nervous system (CNS)38. Thus, there is a need for a principled method that combines human genetics and comprehensive scRNA-seq applied across multiple tissues and organs.
Here, we develop and apply sc-linker, an integrated framework to relate human disease and complex traits to cell types and cellular processes by integrating GWAS summary statistics, epigenomics and scRNA-seq data from multiple tissue types, diseases, individuals and cells. Unlike previous studies, we analyze gene programs that represent different facets of cells, including discrete types, processes activated specifically in a cell type in disease, and gene programs that vary across cells irrespective of cell type definitions (recovered by latent factor models). We transform gene programs to SNP annotations using tissue-specific enhancer-gene links19–23 in preference to standard gene window-based linking strategies used in existing gene-set enrichment methods such as MAGMA39, RSS-E13 and LDSC-SEG18. We then link SNP annotations to diseases by applying stratified LD score regression11 (S-LDSC) with the baseline-LD model40,41 to the resulting SNP annotations. We further integrate cellular expression and GWAS to prioritize specific genes in the context of disease-critical gene programs, thus shedding light on underlying disease mechanisms.
RESULTS
Overview of sc-linker
We developed a framework to link gene programs derived from scRNA-seq with diseases and complex traits (Figure 1a). First, we use scRNA-seq to construct gene programs, defined as continuous-valued gene sets, that characterize (1) individual cell types, (2) disease-dependent (disease vs. healthy cells of the same type), or (3) cellular processes. (The continuous values are on the probabilistic 0–1 scale, but do not formally represent probabilities (Methods).) Then, we link the genes underlying these programs to SNPs that regulate them by incorporating two tissue-specific enhancer-gene linking strategies: Roadmap Enhancer-Gene Linking19–21 and the Activity-by-Contact (ABC) model22,23. Finally, we evaluate the disease informativeness of the resulting SNP annotations by applying S-LDSC11 conditional on a broad set of coding, conserved, regulatory and LD-related annotations from the baseline-LD model40,41. Altogether, our approach links diseases and traits with gene programs recapitulating cell types and cellular processes. We have released open-source software implementing the approach (sc-linker; Code Availability), a web interface for visualizing the results (Data Availability), postprocessed scRNA-seq data, gene programs, enhancer-gene linking strategies, and SNP annotations analyzed in this study (Data Availability). A more comprehensive overview is provided in the Supplemental Note.
Figure 1. Approach for identifying disease-critical cell types and cellular processes by integration of single-cell profiles and human genetics.
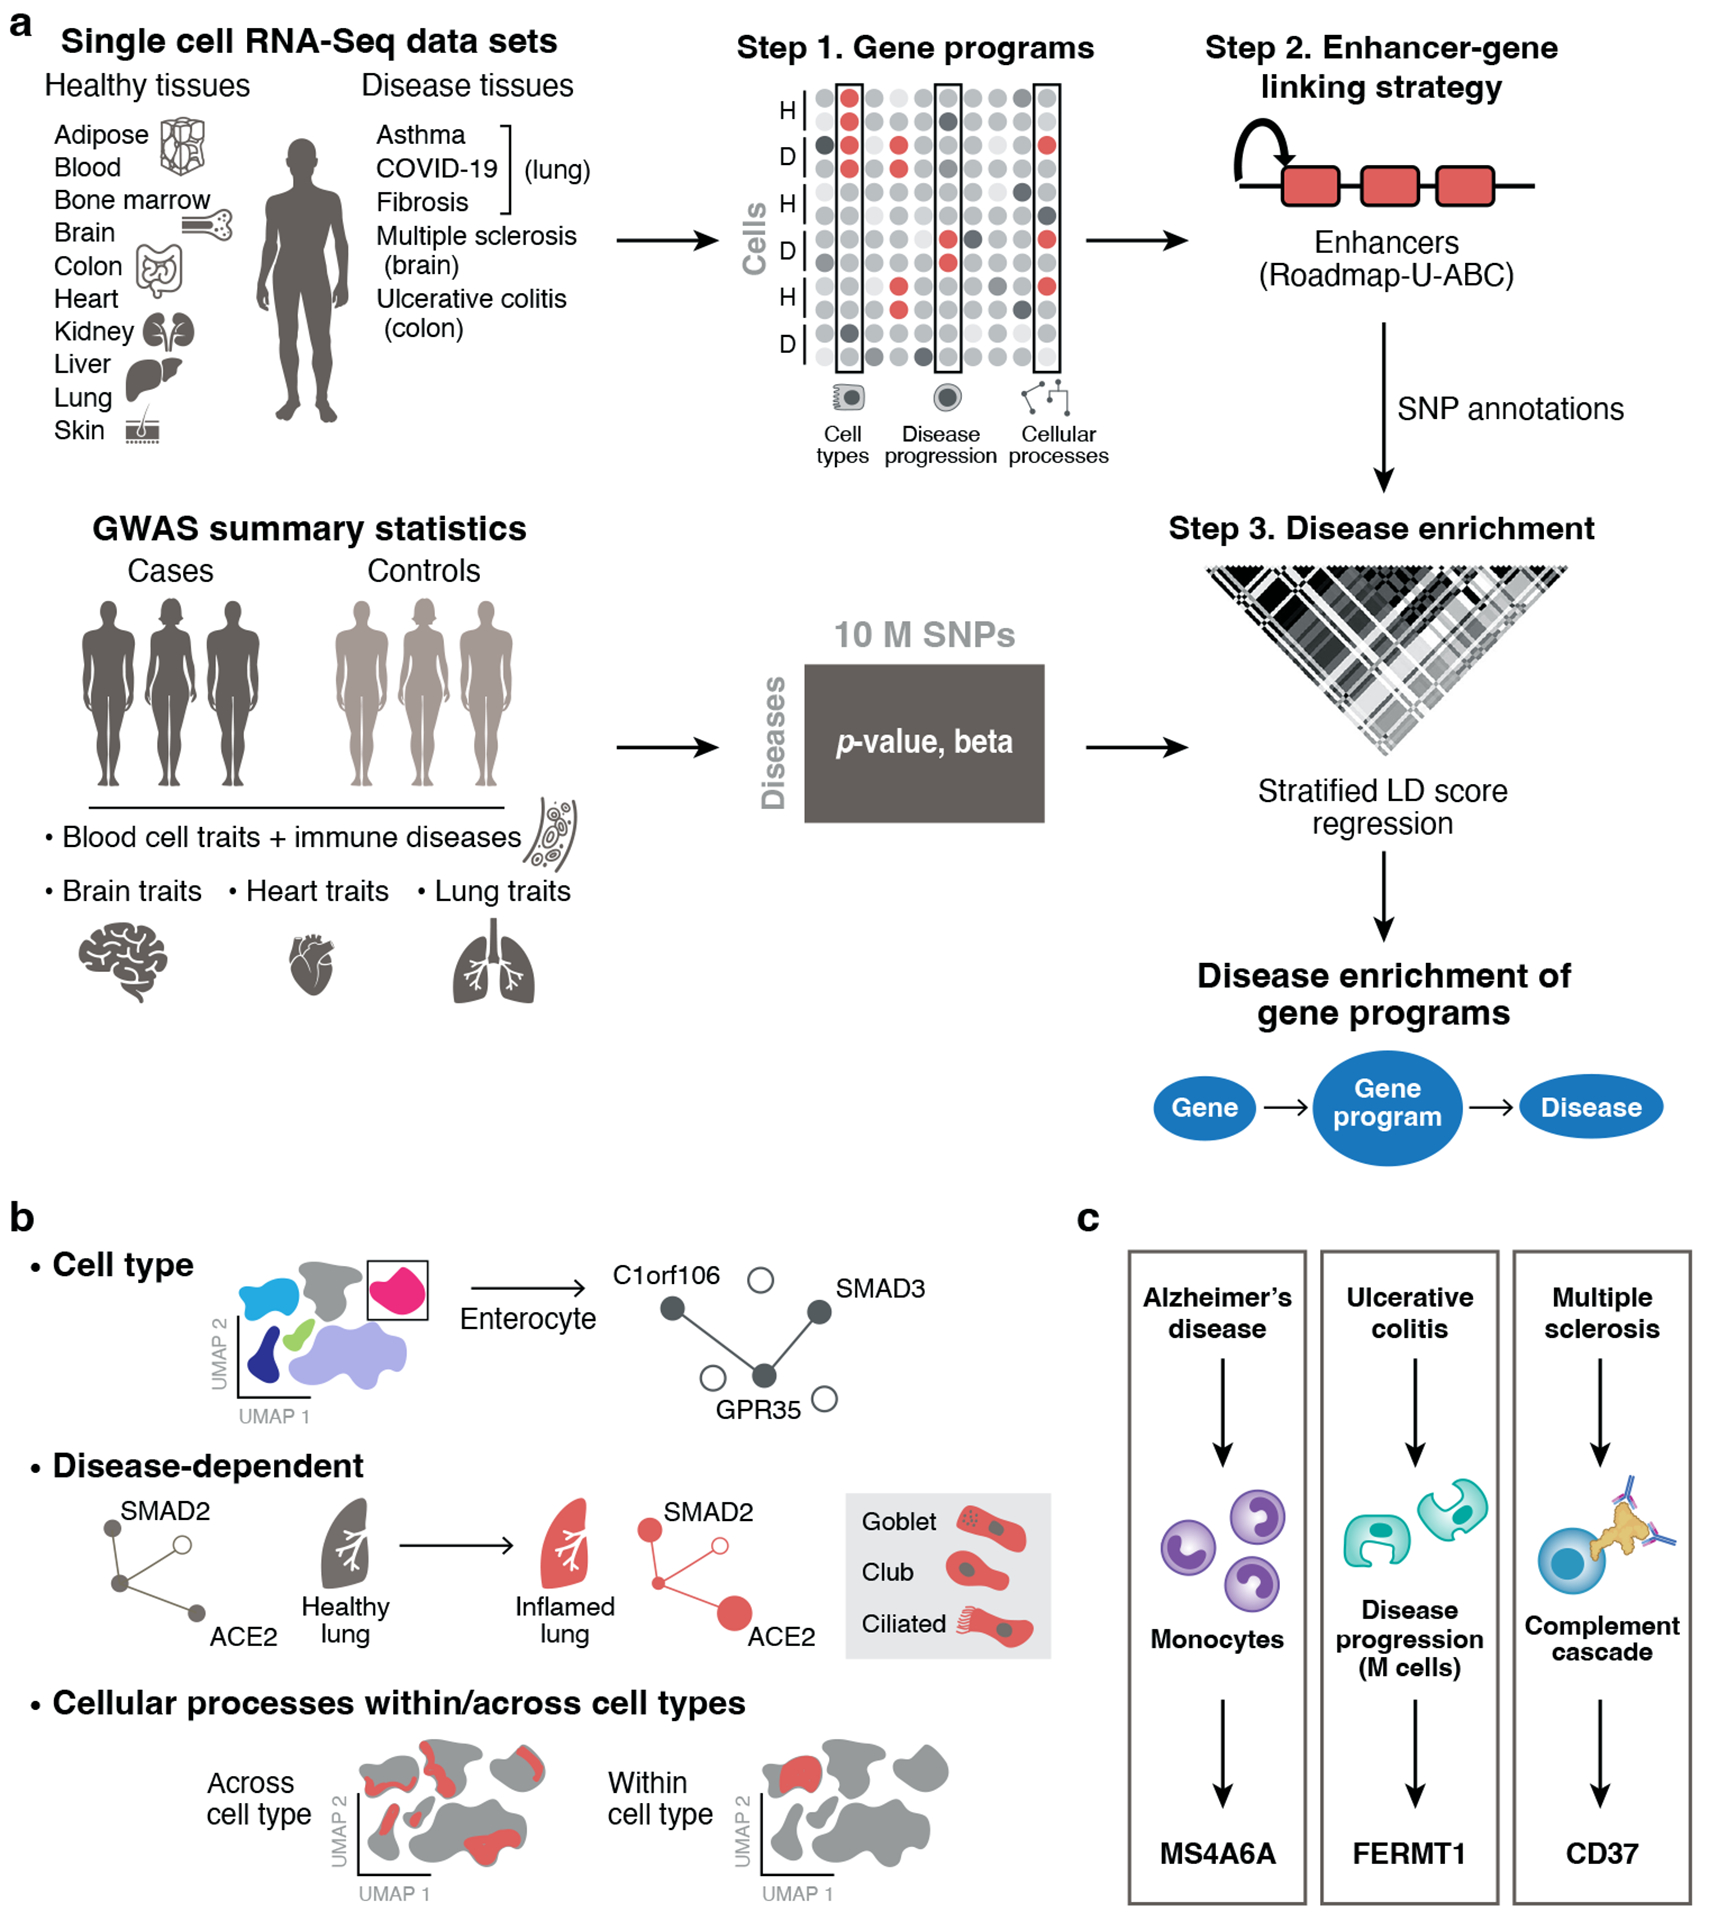
a. sc-linker framework. Left: Input. scRNA-seq (top) and GWAS (bottom) data. Middle and right: Step 1: Deriving cell type, disease-dependent, and cellular process gene programs from scRNA-seq (top) and associating SNPs with traits from human GWAS (bottom). Step 2: Generation of SNP annotations. Gene programs are linked to SNPs by enhancer-gene linking strategies to generate SNP annotations. Step 3: S-LDSC is applied to the resulting SNP annotations to evaluate heritability enrichment for a trait. b. Constructing gene programs. Top: Cell type programs of genes specifically expressed in one cell type vs. others. Middle: disease-dependent programs of genes specifically expressed in cells of the same type in disease vs. healthy samples. Bottom: cellular process programs of genes co-varying either within or across cell subsets; these programs may be healthy-specific, disease-specific, or shared. c. Examples of disease-gene program-gene relationships recovered by our framework.
We analyzed a broad range of human scRNA-seq data, spanning 17 data sets from 11 tissues and 6 disease conditions. The 11 non-disease tissues include immune (peripheral blood mononuclear cells (PBMCs)26,42, cord blood27, and bone marrow27), brain28, kidney43, liver44, heart25, lung29, colon34, skin45 and adipose44. The 6 disease conditions include multiple sclerosis (MS) brain46, Alzheimer’s disease brain30, ulcerative colitis (UC) colon34, asthma lung47, idiopathic pulmonary fibrosis (IPF) lung29 and COVID-19 bronchoalveolar lavage fluid48 (Extended Data Fig. 1). In total, the scRNA-seq data includes 209 individuals, 1,602,614 cells and 256 annotated cell subsets (Methods, Supplementary Table 1). We also compiled publicly available GWAS summary statistics for 60 unique diseases and complex traits (genetic correlation < 0.9; average N=297K) (Methods, Supplementary Table 2). We analyzed gene programs from each scRNA-seq dataset in conjunction with each of 60 diseases and complex traits, but we primarily report those that are most pertinent for each program.
Benchmarking sc-linker
As a proof of principle, we benchmarked sc-linker by analyzing 5 blood cell traits that biologically correspond to specific immune cell types (Supplementary Table 2) using immune cell type programs constructed from scRNA-seq data (Figure 2a,b, Extended Data Fig. 1). We constructed 6 immune cell type programs that were identified across 4 data sets – two from PBMCs (k=4,640 cells; n=2 individuals26; k=68,551; n=8 individuals42), and one each of cord blood27 (k=263,828; n=8) and bone marrow27 (k=283,894; n=8). We identified enrichment of erythroid cells for red blood cell count, megakaryocytes for platelet count, monocytes for monocyte count, and of B cells and T cells for lymphocyte percentage (Figure 2d, Extended Data Fig. 2a); these enrichments reflect biological correspondences and have been reported in previous studies49,50, such that we refer to them as expected enrichments.
Figure 2. Linking immune cell types and cellular processes to immune-related diseases and blood cell traits.
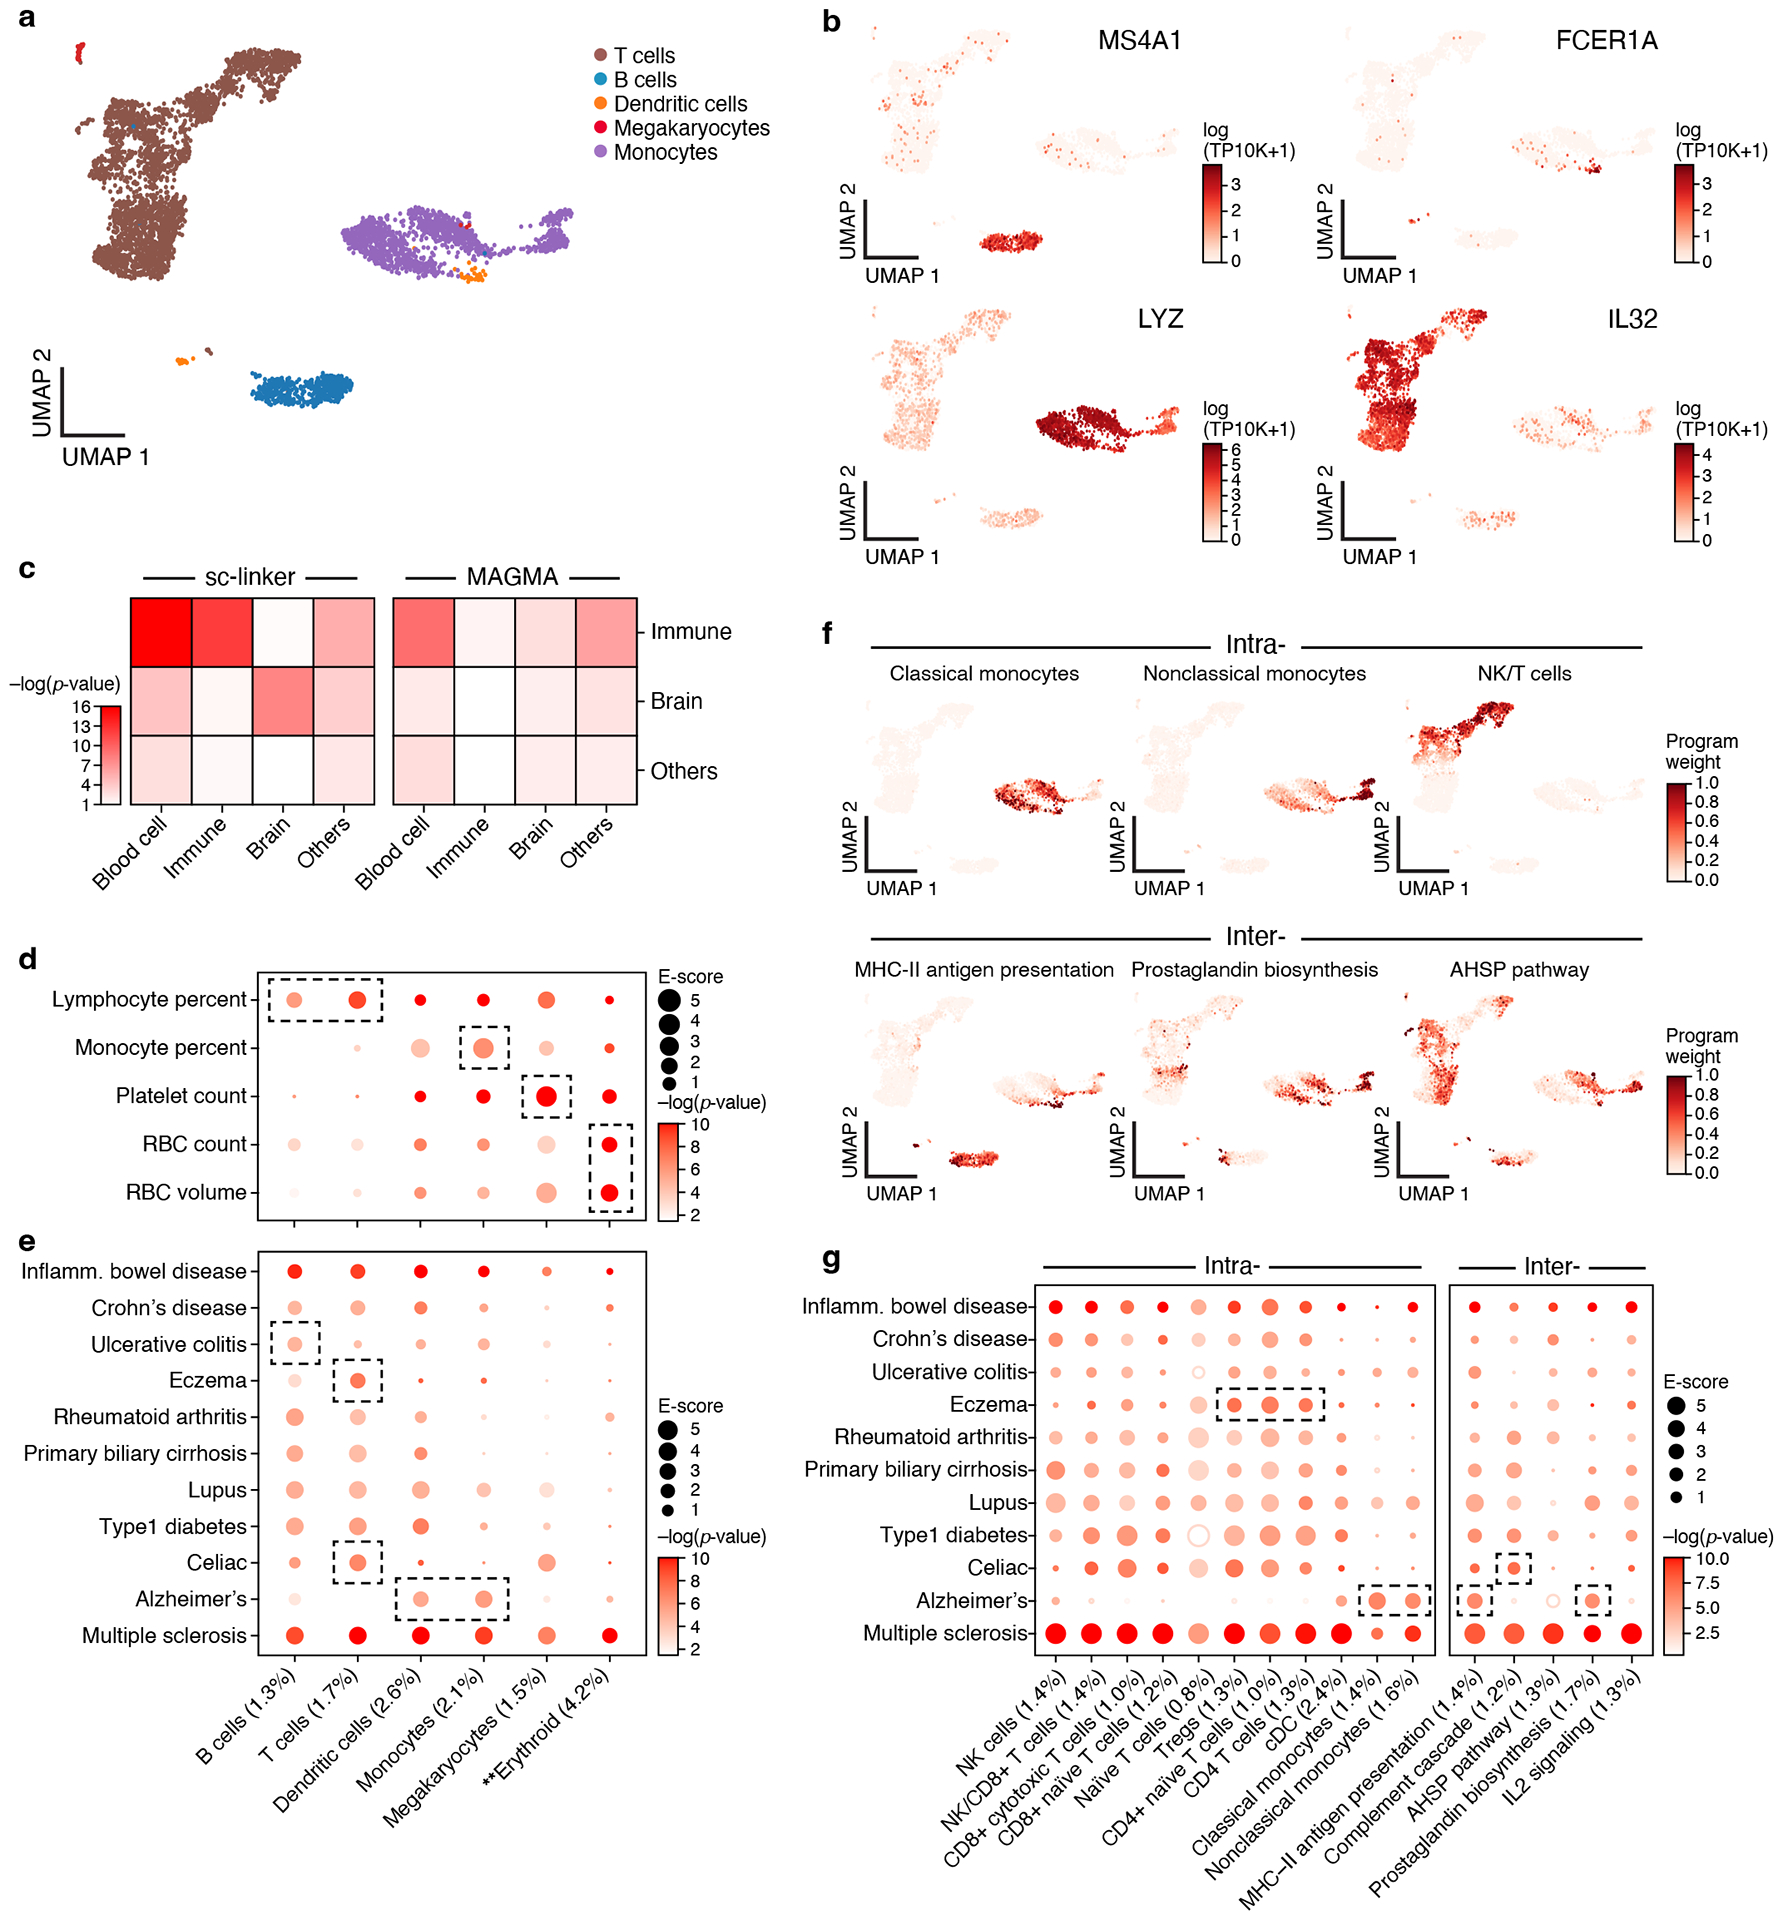
a,b. Immune cell types. Uniform Manifold Approximation and Projection (UMAP) embedding of peripheral blood mononuclear cell (PBMC) scRNA-seq profiles (dots) colored by cell type annotations (a) or expression of cell-type-specific genes (b). c. Benchmarking of sc-linker vs. MAGMA. Significance (average −log10(p-value)) of association between immune, brain and other tissue cell type programs (rows) and blood cell, immune-related, brain-related and other traits (columns) for sc-linker (left) and MAGMA gene set analysis (right). Other cell types × other diseases/traits are not included in the specificity calculation, due to the broad set of cell types and diseases/traits in this category. For the MAGMA analysis, the gene program is binarized using a threshold=0.95; numerical results for other binarization thresholds and continuous variable based approaches are reported in Supplementary Data 7. d,e. Enrichments of immune cell type programs for blood cell traits and immune-related diseases. Magnitude (E-score, dot size) and significance (−log10(P-value), dot color) of the heritability enrichment of immune cell type programs (columns) for blood cell traits (rows, d) or immune-related diseases (rows, e). f. Examples of inter- and intra-cell type cellular process programs. UMAP of PBMC (as in a), colored by each program weight (color bar) from non-negative matrix factorization (NMF). g. Enrichments of immune cellular process programs for immune-related diseases. Magnitude (E-score, dot size) and significance (−log10(p-value), dot color) of the heritability enrichment of cellular process programs (columns) for immune-related diseases (rows). In panels d,e,g, the size of each corresponding SNP annotation (% of SNPs) is reported in parentheses, and the dashed boxes denote results that are highlighted in the main text. Numerical results are reported in Supplementary Data 1,3. Further details of all diseases and traits analyzed are provided in Supplementary Table 2. **Erythroid cells were observed in only bone marrow and cord blood datasets.
We defined a sensitivity/specificity index quantifying the presence of expected enrichments and absence of other enrichments (Methods). A limitation of this index is that other enrichments may be biologically real in some cases; thus, we also consider sensitivity to detect expected enrichments (Methods). Sc-linker outperformed the MAGMA39 gene set-level association method in terms of the sensitivity/specificity index (Figure 2c). Benchmarks on the sc-linker method, the choice of enhancer gene linking strategies and cell type programs are included in the Supplementary Note.
Distinguishing the cells involved in immune-related diseases
We next analyzed 11 autoimmune diseases (Supplementary Table 2) using the 6 immune cell type programs above (Figure 2a,b, Extended Data Fig. 1) and 10 (intra-cell type and inter-cell type) immune cellular process programs (Figure 2f). (Enrichment results for the remaining 49 diseases and traits with immune cell type programs are reported in Extended Data Fig. 3; we did not construct disease-dependent programs, as these datasets included healthy samples only). We identified cell type-disease enrichments that conform to known disease biology (Figure 2e, Extended Data Fig. 2b), including T cells for eczema51,52, B and T cells for primary biliary cirrhosis (PBC)18, and dendritic cells and monocytes for Alzheimer’s disease53. Additionally, the highly significant enrichments for MS across all 6 immune cell type programs analyzed are consistent with previous analyses18,54,55,56, supporting the validity of our approach.
Several of the significant cell type-disease enrichments are not as widely established and may implicate previously unexplored biological mechanisms (Figure 2e, Table 1, Extended Data Fig. 2b). For example, we detected significant enrichment in B cells for UC; B cells have been detected in basal lymphoid aggregates in the ulcerative colitis (UC) colon, but their pathogenic significance remains unknown57. In addition, T cells were highly enriched for celiac disease; the top driving genes including ETS1 (ranked 1), associated with T cell development and IL2 signaling58, and CD28 (ranked 3), critical for T cell activation. This suggests that aberrant T cell maintenance and activation may impact inflammation in celiac disease. Recent reports of a permanent loss of resident gamma delta T cells in the celiac bowel and the subsequent recruitment of inflammatory T cells may further support this hypothesis59. These results were recapitulated across an independent immune cell scRNA-seq dataset, both in the gene programs (average correlation: 0.78 for the same cell type) and disease enrichments (0.86 correlation of the E-score over all cell type and trait pairs). A cross-trait analysis of the patterns of cell type enrichments suggests that Celiac disease and rheumatoid arthritis involves cell-mediated adaptive immune response, UC and primary biliary cirrhosis involve antibody-mediated adaptive immune response, Alzheimer’s disease has a strong signal of innate immune, and MS and IBD involve contributions from a wide range of immune cell types (Extended Data Fig. 4).
Table 1.
Notable enrichments from analyses of cell type, disease-dependent and cellular process gene programs.
| Cell type programs | ||||||
|---|---|---|---|---|---|---|
| GWAS disease/trait | Tissue (scRNA-seq) | Cell Type | E-score | p(E-score) | q-value | Top genes |
| Ulcerative colitis | Blood | B cells | 3.2 | 1.50E-05 | 2.33E-05 | REL,GPX1,LSP1 |
| Celiac disease | Blood | T cells | 4.5 | 2.30E-07 | 7.16E-07 | ETS1,CD247,CD28 |
| MDD | Brain | GABAergic | 4 | 1.00E-04 | 3.39E-04 | TCF4,BEND4,TMX2 |
| Atrial fibrillation | Heart | Atrial cardiomyocyte | 5.6 | 3.2E-09 | 2.2E-08 | CAV2,PKD2L2,FAM13B |
| Blood pressure(dia) | Heart | Smooth muscle | 3.4 | 2.9E-06 | 1.2E-05 | CACNB2,TMEM165,MRVI1 |
| Eczema | Skin | Langerhans cells | 3.7 | 0.004 | 0.03 | IL1R1,RUNX3,FCER1G |
| IBD | Colon | Endothelial | 2.8 | 0.002 | 0.01 | RHOA,PDLIM4,STARD3 |
| Disease-dependent programs | ||||||
| GWAS disease/trait | Tissue (scRNA-seq) | Cell Type | E-score | p (E-score) | q-value | Top genes |
| Multiple sclerosis | MS Brain | Microglia | 11.6 | 5.70E-06 | 3.66E-05 | PRDX5,RPL5,SKP1, |
| Alzheimer’s disease | AD Brain | Microglia | 9.1 | 7.10E-05 | 6.82E-04 | PICALM, APOE, APOC1 |
| Ulcerative colitis | UC Colon | Enterocytes | 2.6 | 2.70E-07 | 1.66E-06 | RNF186,APEH,DLD |
| IBD | UC Colon | M cells | 2.2 | 1.07E-04 | 2.2E-04 | UQCR10,FERMT1,PPP1R1B |
| Asthma | Asthma Lung | T cells | 12.8 | 4.82E-05 | 3.99E-04 | FMNL1,RORA,GPR183 |
| Cellular process programs | ||||||
| GWAS disease/trait | Tissue (scRNA-seq) | Cellular process | E-score | p (E-score) | q-value | Top genes |
| Eczema | Blood | CD4+ T cells | 3.8 | 1.32E-07 | 4.83E-07 | IL7R,STMN3,NDFIP1 |
| Celiac disease | Blood | Complement cascade | 2.8 | 4.84E-08 | 1.92E-07 | DCC,PDIA5,PPCDC |
| Alzheimer’s disease | Blood | MHC-II antigen processing | 4.9 | 7.11E-0 | 2.08E-06 | MS4A6A,MS4A4A,CD33 |
| BMI | Brain | LAMP5 | 2.7 | 6.33E-08 | 7.01E-07 | FLRT1,COL4A2,SBF2 |
| MDD | Brain | SST | 3.9 | 4.37E-05 | 1,22E-04 | TCF4,PCLO,ZNF462 |
| Years of education | Brain | Electron Transport | 3.5 | 4.42E-08 | 5.49E-07 | ATP6V0B,NSF,GPX1 |
| Multiple sclerosis | MS Brain | Complement cascade** | 4.9 | 5.49E-11 | 9.62E-10 | CD37,RGS14,NCF4 |
| Alzheimer’s disease | AD Brain | Apelin signaling* | 1.5 | 9.27E-07 | 6.50E-06 | MS4A6A,SORL1,SYK |
| Ulcerative colitis | UC Colon | EGFR1 pathway* | 3.0 | 8.81E-04 | 2.14E-03 | C1orf106,SLC26A3,NXPE4 |
| Asthma | Asthma Lung | Mac-neutrophil trans.* | 6.6 | 0.002 | 0.006 | CCL20,IL6,GPR183 |
For each notable enrichment, we report the GWAS disease/trait, tissue source for scRNA-seq data, cell type, enrichment score (E-score), 1-sided stratified LD score regression p-value for positive E-score, and top genes driving the enrichment. Multiple testing correction was performed across cell types and traits at the level of each tissue. MDD is an abbreviation for major depressive disorder, blood pressure (dia.) is an abbreviation for diastolic blood pressure, mac-neutrophil trans. is an abbreviation for macrophage-neutrophil transition.
denotes cellular process programs shared across healthy and disease states.
denotes cellular process programs specific to disease states.
The full list of genes driving these associations is provided in Supplementary Data 4.
Analyzing the 10 immune cellular process programs (Figure 2f) across the 11 immune-related diseases and 5 blood cell traits, we identified both disease-specific enrichments and others shared across diseases (Figure 2g, Table 1). For example, while T cells have been previously linked to eczema, we pinpointed higher enrichment in CD4+ T cells compared to CD8+ T cells. The IL2 signaling cellular process program in T and B cells was significantly enriched for both eczema and celiac disease, though the genes driving the enrichment were not significantly overlapping (p-value: 0.21). Additionally, the complement cascade cellular process program in plasma, B, and hematopoietic stem cells (HSCs) was most highly enriched among all inter cellular programs for celiac disease. For Alzheimer’s disease, there was a strong enrichment in both classical and non-classical monocyte intra-cell type cellular programs, and in MHC class II antigen presentation (inter cell type; dendritic cells (DCs) and B cells) and prostaglandin biosynthesis (inter cell type; monocytes, DCs, B cells and T cells) programs. Among the notable driver genes were: IL7R (ranked 1) and NDFIP1 (ranked 3) for CD4+ T cells in eczema, which respectively play key roles in Th2 cell differentiation60,61 and in mediating peripheral CD4 T cell tolerance and allergic reactions62,63; and CD33 (ranked 1) in MHC class II antigen processing in Alzheimer’s disease, a microglial receptor strongly associated with increased risk in previous GWAS64,65.
Linking GABA and gluta neurons to psychiatric disease
We next focused on brain cells and psychiatric disease, by analyzing 9 cell type programs (Figure 3a) and 12 cell process programs (Figure 3e, 10 intra- and 2 inter-cell type programs) from scRNA-seq data of brain prefrontal cortex (k=73,191, n=10)28 (Supplementary Table 1) with 11 psychiatric or neurological diseases and traits (Supplementary Table 2).
Figure 3. Linking neuron cell subsets and cellular processes to brain-related diseases and traits.
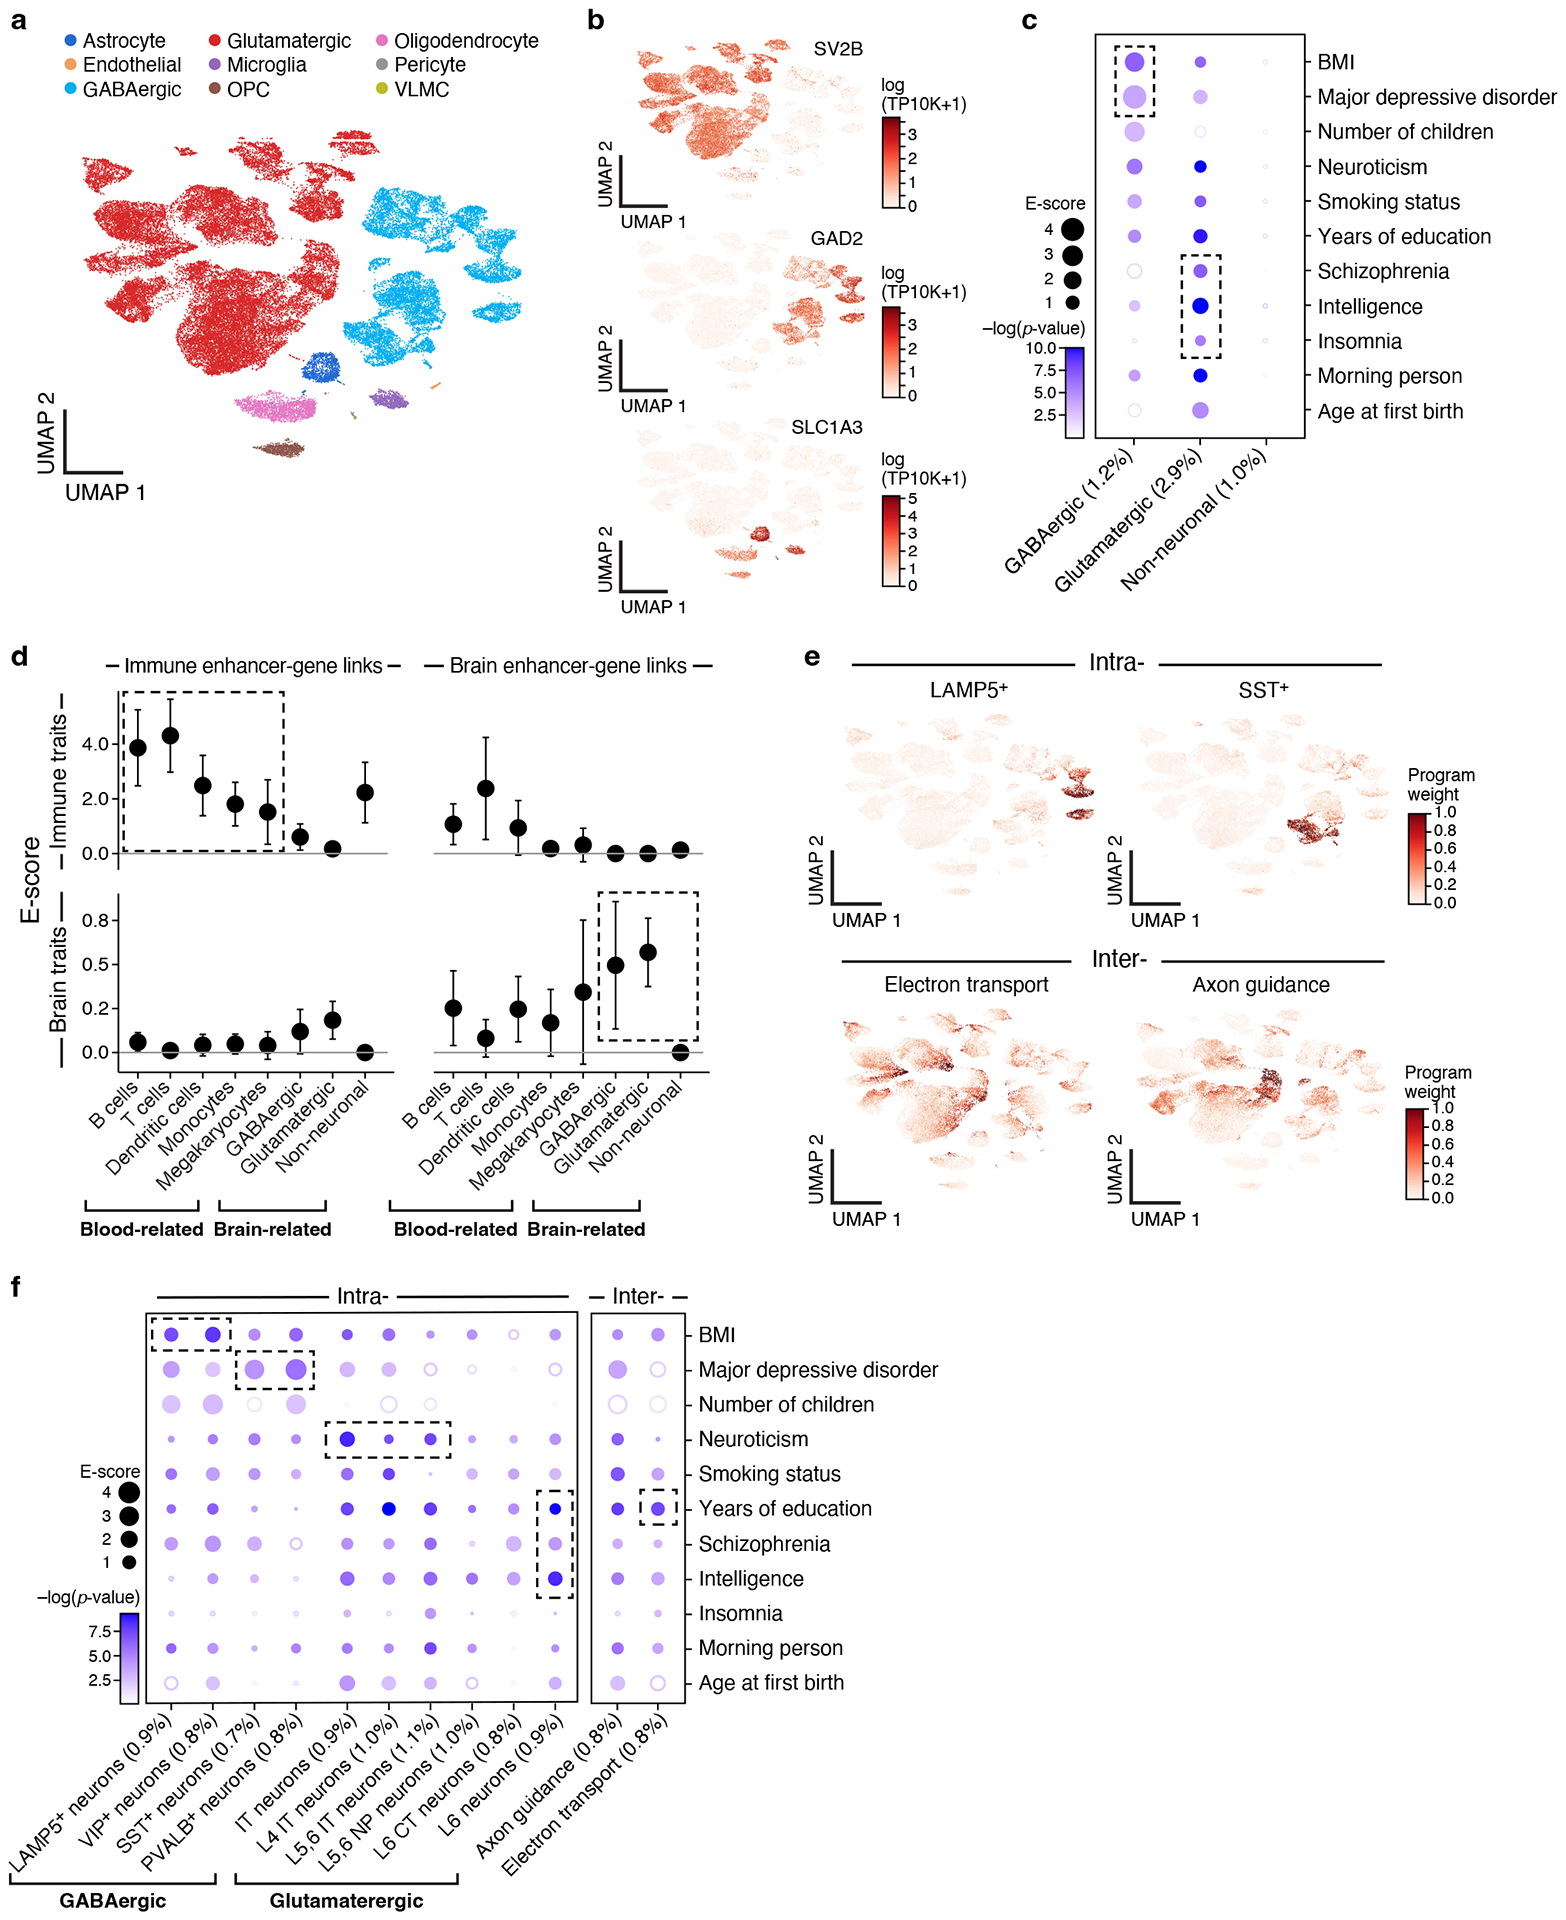
a,b. Major brain cell types. UMAP embedding of brain scRNA-seq profiles (dots) colored by cell type annotations (a) or expression of cell-type-specific genes (b). c. Enrichments of brain cell type programs for brain-related diseases and traits. Magnitude (E-score, dot size) and significance (−log10(P-value), dot color) of the heritability enrichment of brain cell type programs (columns) for brain-related diseases and traits (rows). d. Comparison of immune vs. brain cell type programs, enhancer-gene linking strategies, and diseases/traits. Magnitude (E-score and SE) of the heritability enrichment of immune vs. brain cell type programs (columns) constructed using immune vs. brain enhancer-gene linking strategies (left and right panels) for immune-related (n=11) vs. brain-related (n=11) diseases and traits (top and bottom panels). Data are presented as mean values +/− SEM. e. Examples of inter- and intra-cell type cellular processes. UMAP (as in a), colored by each program weight (color bar) from non-negative matrix factorization (NMF). f. Enrichments of brain cellular process programs for brain-related diseases and traits. Each of the cellular process programs is constructed using NMF to decompose the cells by genes matrix into two matrices, cells by programs and programs by genes. Magnitude (E-score, dot size) and significance (−log10(P-value), dot color) of the heritability enrichment of cellular process programs (columns) for brain-related diseases and traits (rows). In panels c and f, the size of each corresponding SNP annotation (% of SNPs) is reported in parentheses. Numerical results are reported in Supplementary Data 1,3. Further details of all diseases and traits analyzed are provided in Supplementary Table 2.
Notably, we observed enrichments of major depressive disorder (MDD) and body mass index (BMI) specifically in GABAergic neurons, while insomnia, schizophrenia (SCZ), and intelligence were highly enriched specifically in glutamatergic neurons, and neuroticism was highly enriched in both. GABAergic neurons regulate the brain’s ability to control stress levels, which is the most prominent vulnerability factor in MDD66 (Figure 3b,c, Table 1, Extended Data Fig. 2c). Among the top genes driving this enrichment were TCF4 (ranked 1), a critical component for neuronal differentiation that affects neuronal migration patterns67,68, and PCLO (ranked 4), which is important for synaptic vesicle trafficking and neurotransmitter release69. Although predominant therapies for MDD target monoamine neurotransmitters, especially serotonin, the enrichment for GABAergic neurons is independent of serotonin pathways, suggesting that they might include other therapeutic targets for MDD. These results were robustly detected in an independent brain scRNA-seq dataset, both in the gene programs (average correlation: 0.77 for the same cell type and −0.21 otherwise) and disease enrichments (0.77 correlation of the E-score over all cell type and trait pairs), including GABAergic neurons in MDD and BMI as well as glutamatergic neurons in insomnia and SCZ. Enrichment results for the remaining 49 diseases and traits in conjunction with brain cell type programs are reported in Extended Data Fig. 3.
Tissue specificity of both the cell type program and enhancer-gene strategy was important for successful linking, which we found by comparing the enrichment of all four possible combinations of immune or brain cell type programs with immune- or brain-specific enhancer-gene linking strategies, meta-analyzed across 11 immune-related diseases or 11 psychiatric/neurological diseases and traits (Figure 3d). This highlights the importance of leveraging the tissue specificity of enhancer-gene strategies.
The 12 brain cellular process programs showed that the significant enrichment of brain-related diseases in neuronal cell types above is primarily driven by finer programs reflecting neuron subtypes (Figure 3f, Table 1, Supplemental Note). For example, the enrichment of GABAergic neurons for BMI was driven by programs reflecting LAMP5+ and VIP+ subsets. Furthermore, the enrichment of GABAergic neurons for MDD reflects SST+ and PVALB+ subsets. We also observed enrichment in more specific cell subsets within glutamatergic neurons (e.g. IT neurons were enriched for neuroticism).
Linking cell types from diverse human tissues to disease
Analysis of kidney, liver, heart, skin and adipose cell types (Supplementary Table 1) and corresponding relevant traits (Supplementary Table 2) revealed the role of particular immune, stromal and epithelial cellular compartments across different diseases/traits. For example, kidney and liver cell type programs (Extended Data Fig. 1) highlighted relations with urine biomarker traits (Figure 4a, Extended Data Fig. 3 and 5a,b), such as enrichment for creatinine level in kidney proximal and connecting tubule cell types, but not in liver cell types, as expected70,71, or a significant enrichment for bilirubin level only in liver hepatocytes (driven by ANGPTL3; ranked 4)72,73. In heart (Figure 4B, Extended Data Fig. 3 and 5c, Table 1), atrial cardiomyocytes were enriched for atrial fibrillation, and pericyte and smooth muscle cells for blood pressure, consistent with their respective roles in determining heart rhythm through activity74 of ion channels (top genes included the ion channel genes PKD2L2 (ranked 2), CASQ2 (ranked 7) and KCNN2 (ranked 18)) and blood pressure regulation through vascular tone75 (top genes driving included adrenergic pathway genes PLCE1 (ranked 1), CACNA1C (ranked 21), and PDE8A (ranked 23)). In skin (Figure 4c, Extended Data Fig. 3, Table 1), both BDNF signaling and Langerhans cells were enriched for eczema. Langerhans cells have been implicated in inflammatory skin processes related to eczema76 (top driving genes included IL-2 signaling pathway genes (FCER1G (ranked 3), NR4A2 (ranked 26), and CD52 (ranked 43), which modulate eczema pathogenesis77). In adipose (Figure 4d, Extended Data Fig. 3 and 5e), adipocytes were enriched for BMI, driven by adipogenesis pathway genes78 (STAT5A (ranked 15), EBF1 (ranked 29), LIPE (ranked 45) and triglyceride biosynthesis genes78 (GPAM (ranked 14), LIPE (ranked 45), both of which contribute to the increase in adipose tissue mass in obesity79).
Figure 4. Linking cell types from diverse human tissues to disease.
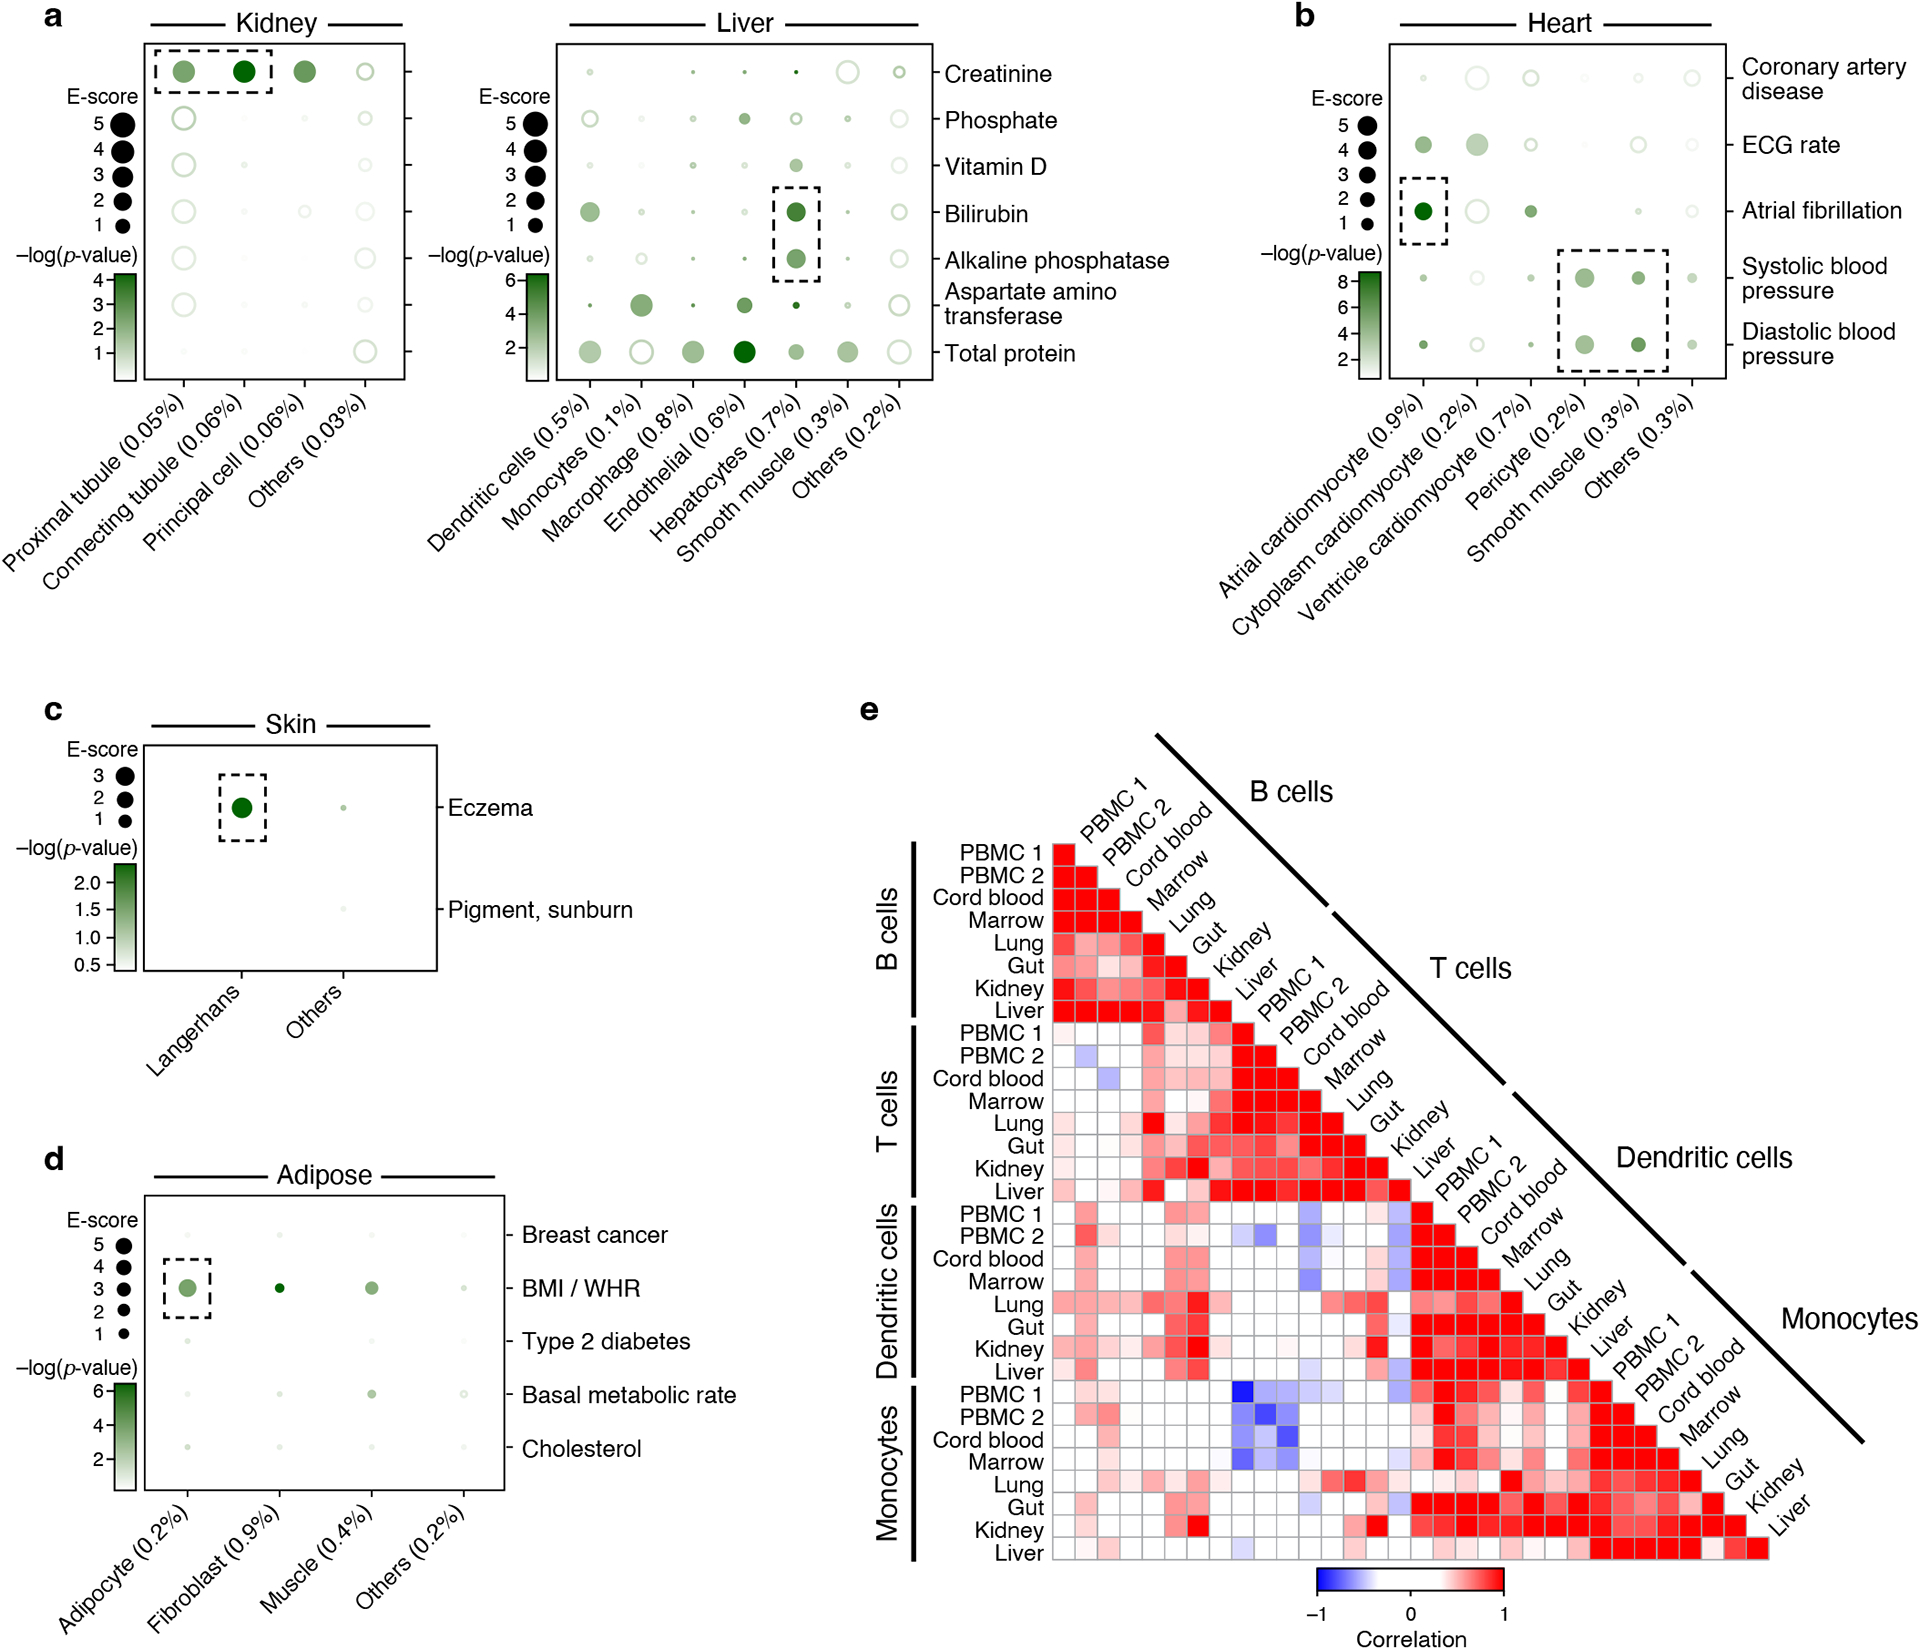
a-d. Enrichments of cell type programs for corresponding diseases and traits. Magnitude (E-score, dot size) and significance (−log10(P-value), dot color) of the heritability enrichment of cell type programs (columns) for diseases and traits relevant to the corresponding tissue (rows) for kidney and liver (a), heart (b), skin (c) and adipose (d). The size of each corresponding SNP annotation (% of SNPs) is reported in parentheses. Numerical results are reported in Supplementary Data 1. Further details of all traits analyzed are provided in Supplementary Table 2. e. Correlation of immune cell type programs across tissues. Pearson correlation coefficients (color bar) of gene-level program memberships for immune cell type programs across different tissues (rows, columns), grouped by cell type (labels).
We expanded our analysis to evaluate all cell type programs for all diseases, irrespective of the tissue locus of disease aiming to identify cell type enrichments involving “mismatched” cell type -disease/trait pairs (Supplementary Figure 5). As expected, in most cases “mismatched” cell type programs and disease/trait pairs do not yield significant association. Notable exceptions included enrichments of skin Langerhans cells for Alzheimer’s disease (AD) (E-score: 15.2, p=10−4), M cells (in colon) for asthma (E-score: 2.2, p=10−4), and heart smooth muscle cells for lung capacity (E-score: 5.6, p=3*10−4). In some cases, the association may indicate a direct relationship, whereas in other cases the associated cell type may only “tag” the causal cell type in the disease tissue, as cell type programs derived from cells of the same type across tissues were found to be highly correlated (Figure 4e) with consistent enrichment in these correlated cell type programs (Extended Data Fig. 3, Supplementary Note).
Linking neuronal cells to MS and AD progression
We next turned to cases where both healthy and disease tissue have been profiled, allowing us to identify heritability in programs associated with disease-specific biology. Such understanding is especially important for identifying therapeutic targets associated with disease progression rather than disease onset mechanisms.
We first examined disease-dependent programs in multiple sclerosis (MS) and Alzheimer’s disease (AD) , where aberrant interactions between neurons and immune cells are thought to play an important role. We analyzed MS and AD GWAS data (Supplementary Table 2) along with cell type, disease-dependent, and cellular process programs from scRNA-seq of healthy and MS46 or AD30 brain (Figure 5a,e, Supplementary Table 1). We considered brain enhancer-gene links (since MS and AD are neurological diseases), immune enhancer-gene links (since MS and AD are immune-related diseases) and non-tissue-specific enhancer-gene links (Extended Data Fig. 6) and detected strongest enrichment results for the immune enhancer-gene links. In both MS and AD, disease-dependent programs in each cell type differed substantially from cell type programs constructed from cells from healthy (r=0.16) or disease (r=0.29) samples alone (Extended Data Fig. 7). Furthermore, we confirmed that disease GWAS matched to the corresponding disease-dependent programs produced the strongest enrichments, although there was substantial cross-disease enrichment (Extended Data Fig. 8).
Figure 5. Linking MS and AD disease-dependent and cellular process programs to MS and AD.
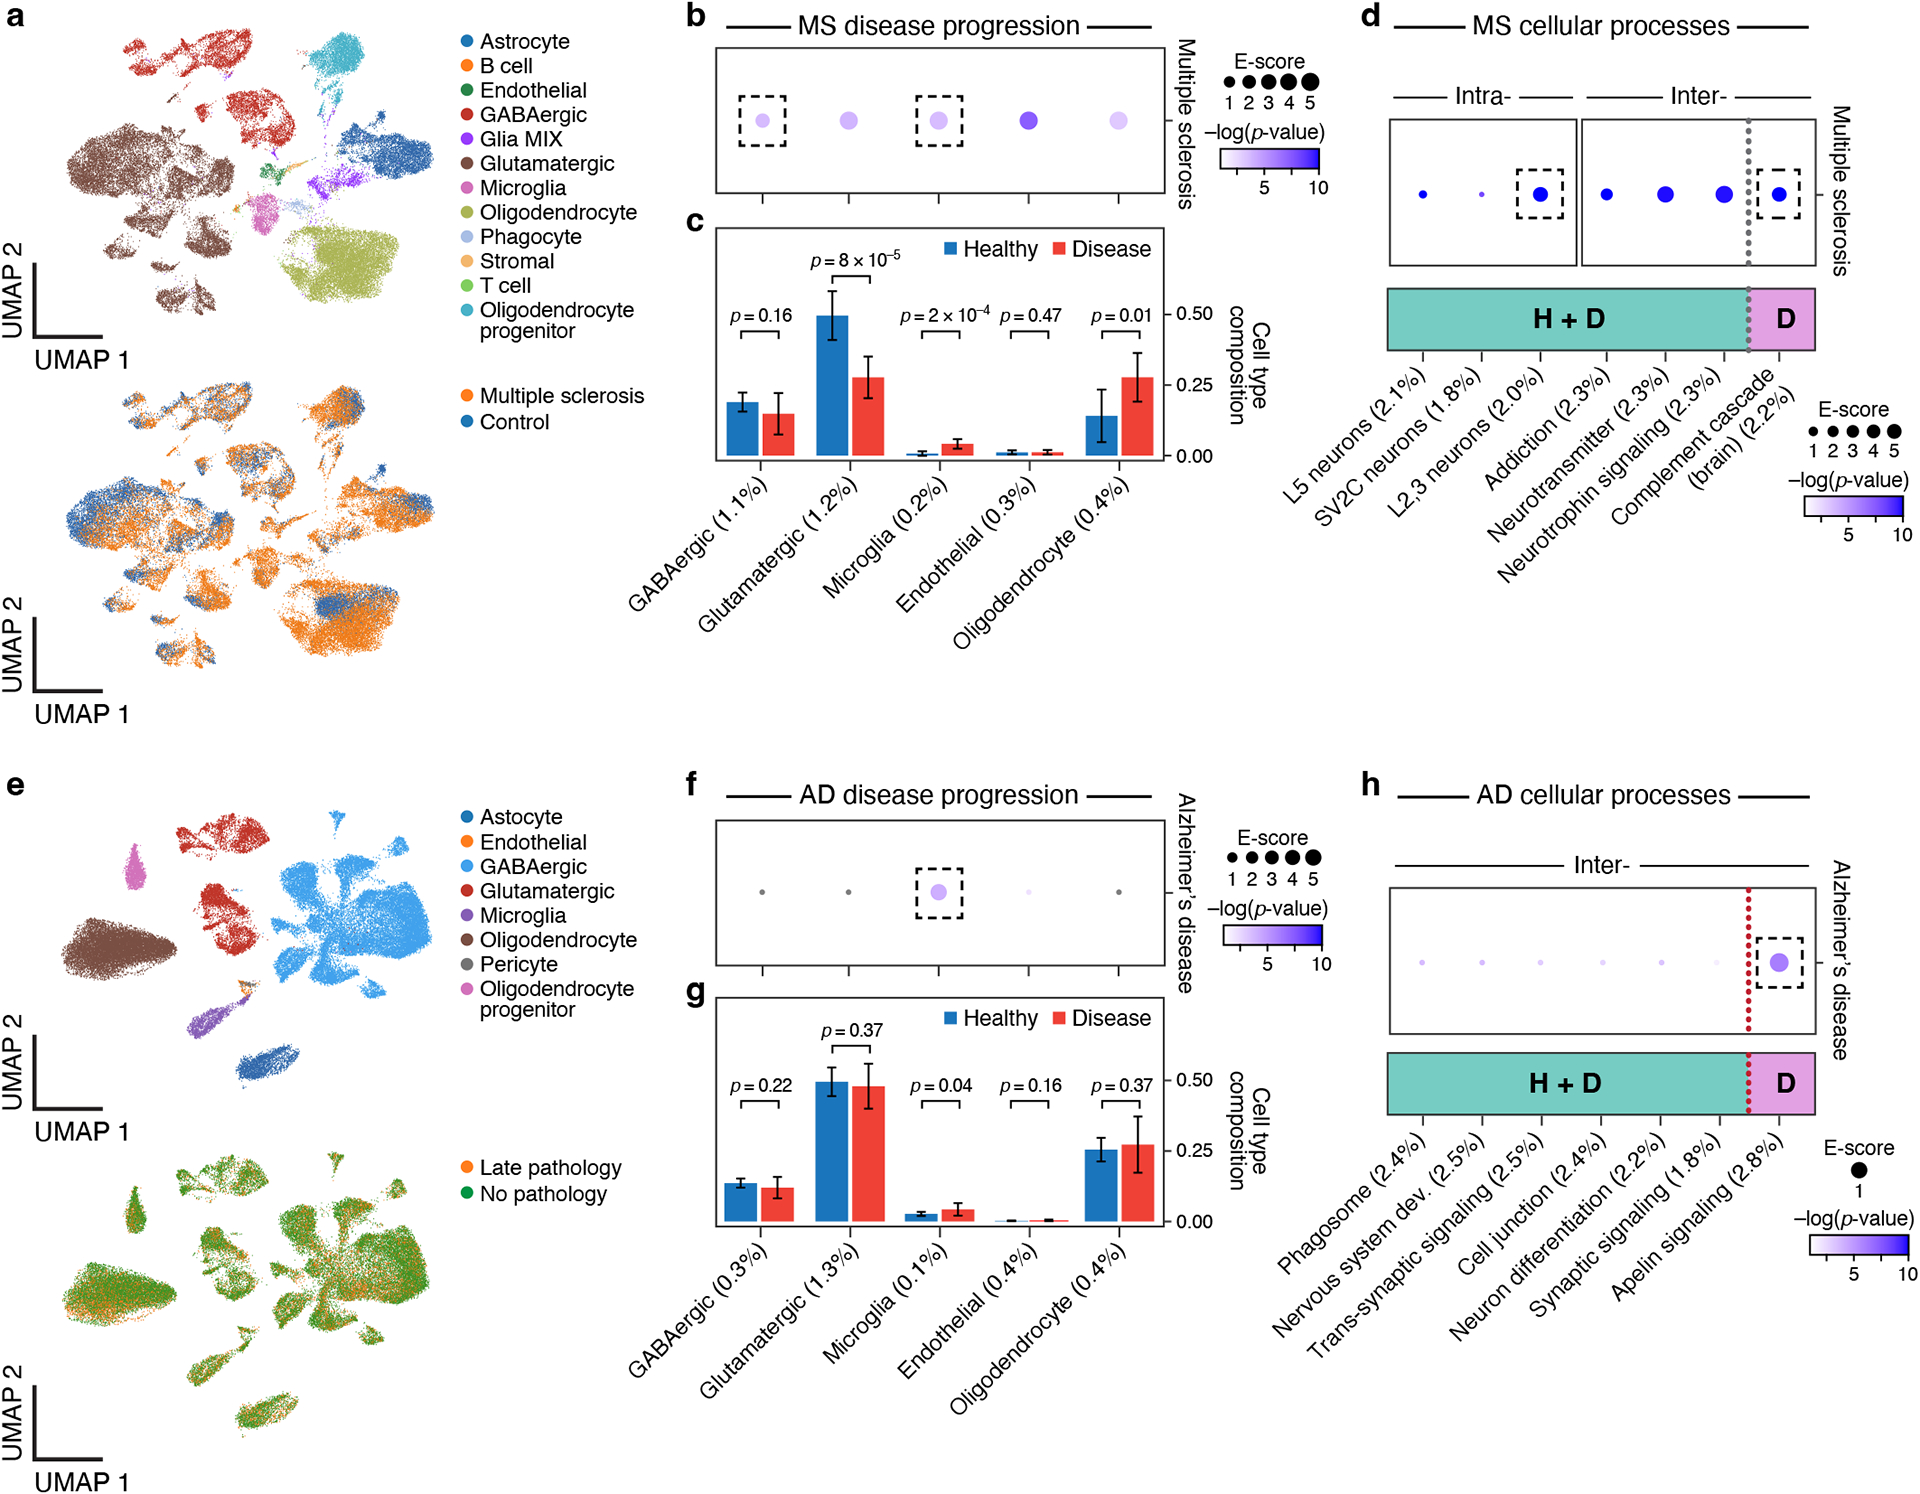
a. UMAP embedding of scRNA-seq profiles (dots) from MS and healthy brain tissue, colored by cell type annotations (top) or disease status (bottom). b. Enrichments of MS disease-dependent programs for MS. Magnitude (E-score, dot size) and significance (−log10(P-value), dot color) of the heritability enrichment of MS disease-dependent programs (columns), based on the Roadmap∪ABC-immune enhancer-gene linking strategy. c. Proportion (mean and SE) of the corresponding cell types (columns) in healthy (blue) and MS (red) n=21 biologically independent brain samples. P-value: one-sided Fisher’s exact test. d. Enrichments of MS cellular process programs for MS. Magnitude (E-score, dot size) and significance (−log10(P-value), dot color) of the heritability enrichment of intra-cell type (left) or inter-cell type (right) cellular processes (healthy-specific (H), MS-specific (D) or shared (H+D)) (columns), based on the Roadmap∪ABC-immune enhancer-gene linking strategy. e. UMAP embedding of scRNA-seq profiles (dots) from AD and healthy brain tissue, colored by cell type annotations (top) or disease status (bottom). f. Enrichments of AD disease-dependent programs for AD. Magnitude (E-score, dot size) and significance (−log10(P-value), dot color) of the heritability enrichment of AD disease-dependent programs (columns), based on the Roadmap∪ABC-immune enhancer-gene linking strategy. g. Proportion (mean and SE) of the corresponding cell types (columns) in healthy (blue) and AD (red) n=48 biologically independent brain samples. P-value: one-sided Fisher’s exact test. h. Enrichments of AD cellular process programs for AD. Magnitude (E-score, dot size) and significance (−log10(P-value), dot color) of the heritability enrichment of inter-cell type cellular processes (AD-specific (D) or shared (H+D)) (columns), based on the Roadmap∪ABC-immune enhancer-gene linking strategy. In panels b,c,d,f,g,h, the size of each corresponding SNP annotation (% of SNPs) is reported in parentheses. Numerical results are reported in Supplementary Data 2,3. Further details of all traits analyzed are provided in Supplementary Table 2.
In MS, there was enrichment in disease-dependent programs in GABAergic neurons and microglia (Figure 5b, Extended Data Fig. 9), as well as in Layer 2,3 glutamatergic neurons and the complement cascade (in multiple cell types) (Figure 5d). The specific enrichment of the GABAergic neuron disease-dependent program (but not the healthy cell type program) for MS is consistent with the observation that inflammation inhibits GABA transmission in MS81. The GABAergic disease-dependent program was enriched with hydrogen ion transmembrane transporter activity genes, while the GABAergic cell type program was enriched in genes with general neuronal functions (Supplementary Data 10). The enrichment of the microglia disease-dependent program for MS is consistent with the role of microglia in inflammation and demyelination in MS lesions82,83 and highlights a contribution of microglia in both disease onset and response. The top driving genes for the microglia disease-dependent program enrichment included MERTK (ranked 2) and TREM2 (ranked 4), both having roles in myelin destruction in MS patients84,85. Supporting this finding, there is a significant increase in the number of microglia (p-value: 2×10⁻⁴, Fisher’s exact test) and a significant decrease in number of glutamatergic neurons (p-value: 8×10⁻⁵) in MS lesions (Figure 5c, Supplementary Data 11).
In AD, all associations highlighted the central role of microglia, suggesting that different processes may be at play at microglia or microglia subsets in healthy brain and after disease initiation: only the microglia disease-dependent program was enriched out of 8 disease-dependent programs tested (Figure 5e,f, Extended Data Fig. 10), along with the healthy microglia program, and the apelin signaling pathway disease-specific cellular process program (inter cell type; GABAergic neurons and microglia). The microglia program enrichments are consistent with the contribution of microglia-mediated inflammation to AD progression86. Supporting this finding, there is a significant increase in the number of microglia in AD brain (Figure 5g, Supplementary Data 11).
Thus, in both MS and AD, heritability was enriched in distinct ways in microglia cell type, disease-dependent and cellular process programs, suggesting therapeutic opportunities to combat the role of microglia in varying contexts for disease risk.
Linking enterocytes and M cells to ulcerative colitis
We next examined the role of cell type, disease-dependent and cellular process programs in ulcerative colitis (UC), where failure to maintain the colon’s epithelial barrier results in chronic inflammation. We analyzed UC and IBD GWAS data (Supplementary Table 2) with healthy cell type, UC disease-dependent and UC cellular process programs constructed from scRNA-seq from healthy colon, and from matched uninflamed and inflamed colon of UC patients (Figure 6a, Supplementary Table 1). We compared colon enhancer-gene links (Figure 6) and non-tissue-specific enhancer-gene links (Extended Data Fig. 6) and detected strongest enrichment results for the colon enhancer-gene links. As in MS and AD, UC disease-dependent programs in each cell type differed substantially from corresponding healthy or disease colon cell type programs (average Pearson r=0.24; Extended Data Fig. 7, Supplementary Data 12).
Figure 6. Linking UC disease-dependent and cellular process programs to UC and IBD.
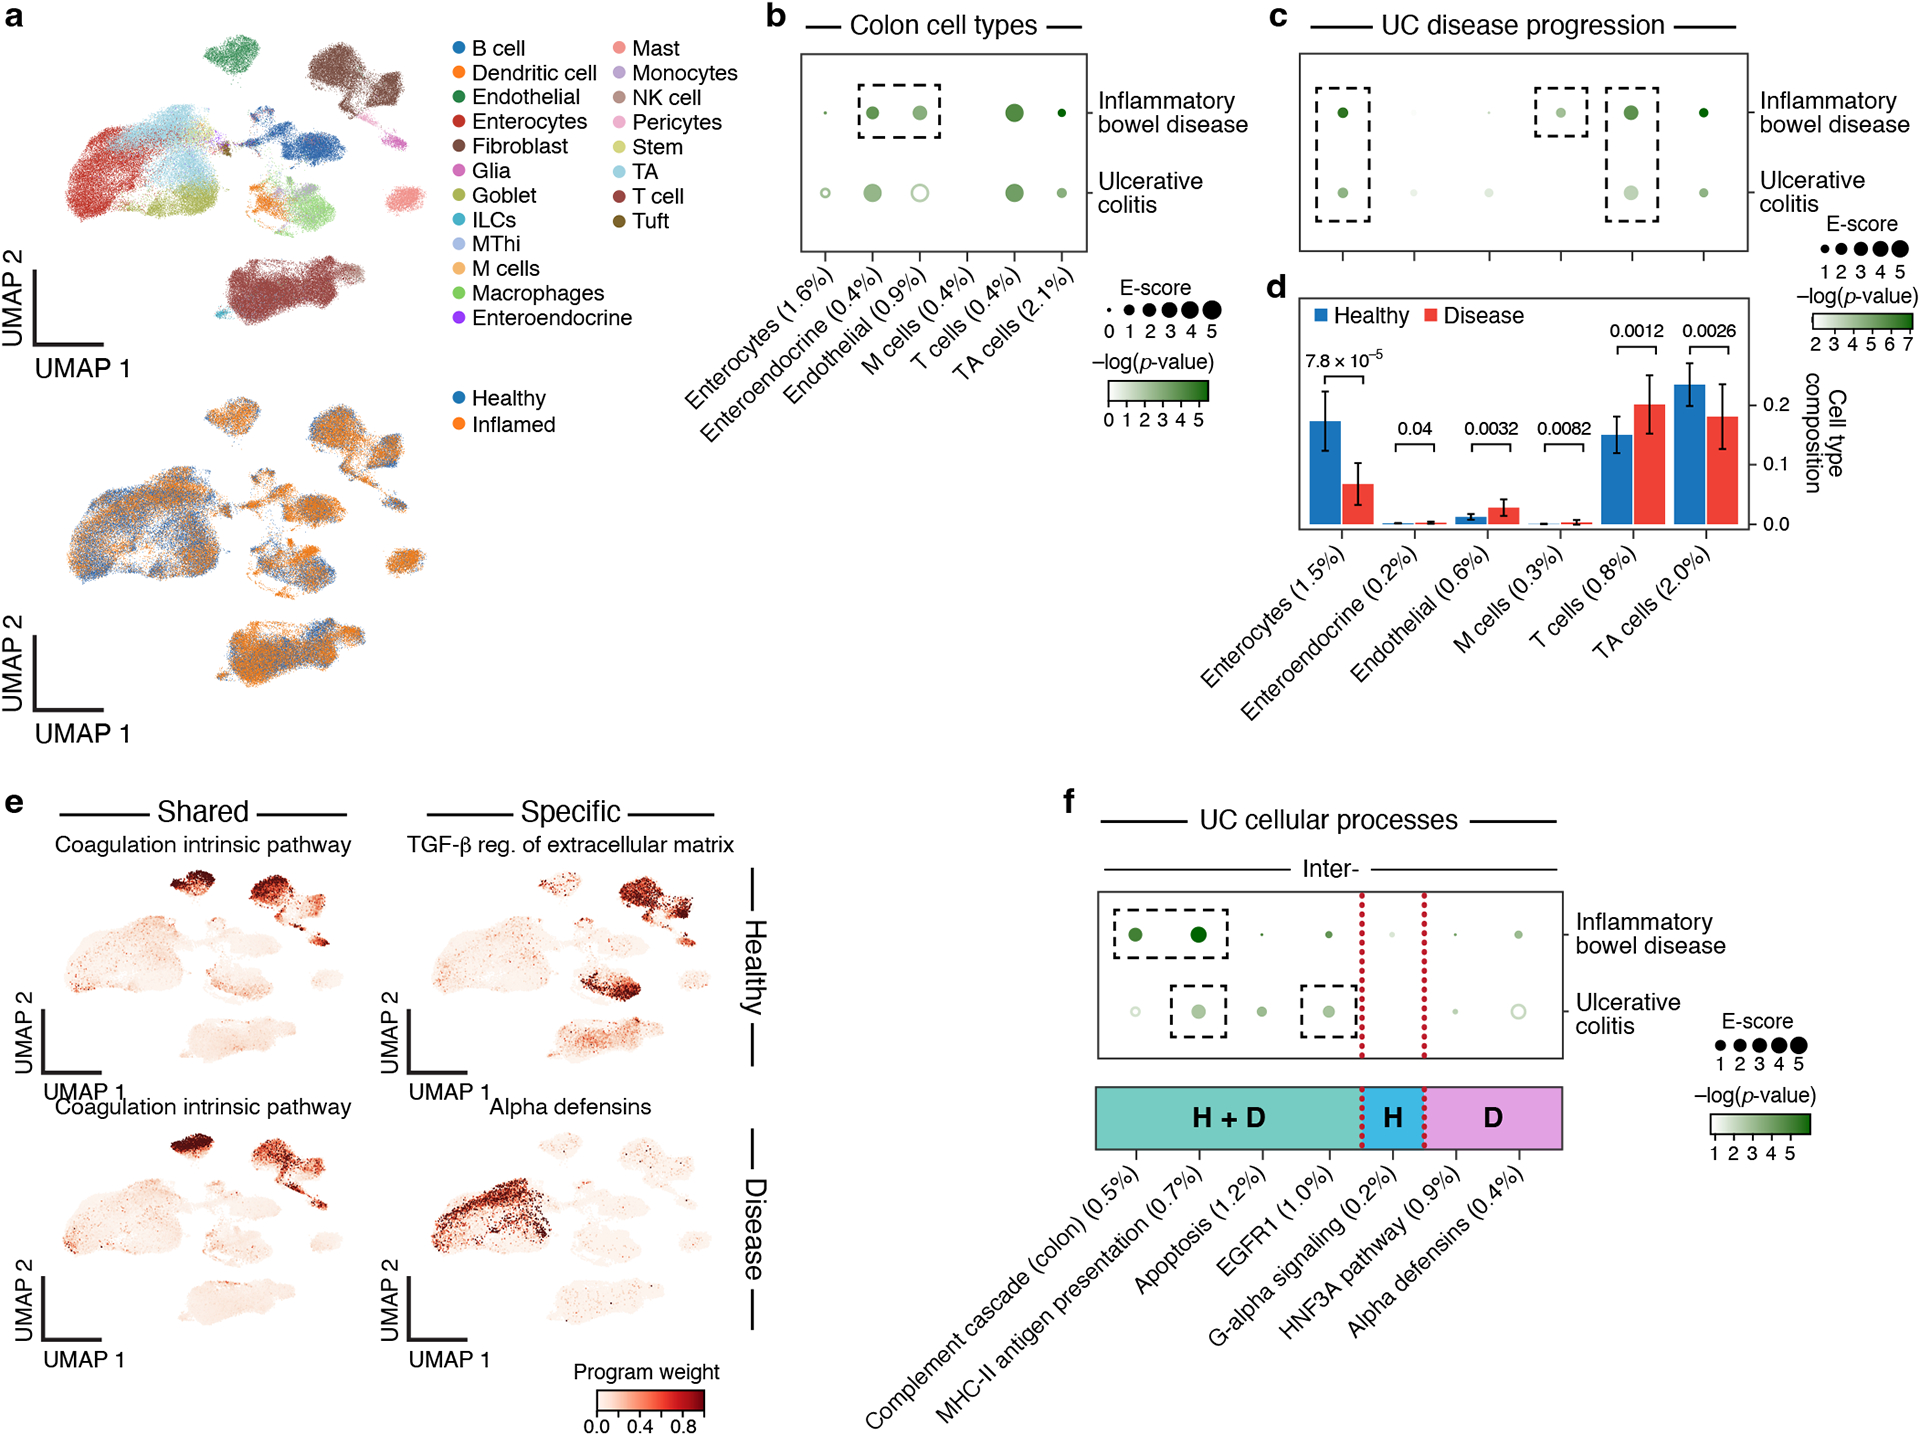
a. UMAP embedding of scRNA-seq profiles (dots) from UC and healthy colon tissue, colored by cell type annotations (top) or disease status (bottom). b. Enrichments of healthy colon cell types for disease. Magnitude (E-score, dot size) and significance (−log10(P-value), dot color) of the heritability enrichment of colon cell type programs (columns) for IBD or UC (rows). Results for additional cell types, including immune cell types in colon, are reported in Extended Data Fig. 3 and Supplementary Data 1. c. Enrichments of UC disease-dependent programs for disease. Magnitude (E-score, dot size) and significance (−log10(P-value), dot color) of the heritability enrichment of UC disease-dependent programs (columns) for IBD or UC (rows). d. Proportion (mean and SE) of the corresponding cell types (columns) in healthy (blue) and UC (red) n=36 biologically independent colon samples. P-value: one sided Fisher’s exact test. e. Examples of shared (healthy and disease), healthy-specific, and disease-specific cellular process programs. UMAP (as in a), colored by each program weight (color bar) from NMF. f. Enrichments of UC cellular process programs for disease. Magnitude (E-score, dot size) and significance (−log10(P-value), dot color) of the heritability enrichment of inter-cell type cellular processes (shared (H+D), healthy-specific (H), or disease-specific (D)) (columns) for IBD or UC (rows). In panels b,c,d,f, the size of each corresponding SNP annotation (% of SNPs) is reported in parentheses. Numerical results are reported in Supplementary Data 1,2,3. Further details of all traits analyzed are provided in Supplementary Table 2.
In addition to previously observed enrichments in healthy immune cell type programs, our analysis highlighted healthy cell type programs of enteroendocrine and endothelial cells, disease-dependent programs of enterocytes and M cells, as well as the complement cascade (in plasma, B cells, enterocytes and fibroblasts), MHC-II antigen presentation (macrophages, monocytes and dendritic cells), and EGFR1 signaling (macrophages and enterocytes) in both healthy and disease cells (Figure 6, Extended Data Fig. 3, Supplementary Data 1). The strong enrichment in endothelial cells, which comprise the gut vascular barrier, is consistent with their rapid changes in UC87; the top driving genes included members of the TNF-α signaling pathway (EFNA1, NFKBIA, CD40, ranked 18, 26, 29), a key pathway in UC88.
The disease-dependent programs (Figure 6c, Table 1, Extended Data Fig. 9 and 10) highlighted M cells, a rare cell type in healthy colon that increases in UC34 (Figure 6d, Supplementary Data 11). M cells surveil the lumen for pathogens and play a key role in immune–microbiome homeostasis89. Supporting this finding, mutations in FERMT1, a top driving gene in the M cell disease-dependent program (ranked 3), cause Kindler syndrome, a monogenic form of IBD with UC-like symptoms90. Notably, there was no enrichment in M cell healthy cell type programs (Figure 6b), emphasizing that M cells are activated specifically in UC disease, as their proportions increase (p=0.008) (Figure 6d).
Immune and connective tissue cell types linked to asthma
We analyzed GWAS data for asthma, IPF, COVID-19 (both general COVID-19 and severe COVID-19), and lung capacity (Supplementary Table 2) with healthy cell type, disease-dependent and cellular process programs from asthma, IPF, COVID-19 and healthy29 (lower lung lobes) tissue scRNA-seq (Figure 7a,c,f, Supplementary Figure 13d-f and 15, Supplementary Data 12), using either lung enhancer or immune enhancer gene links. For asthma, there was significant enrichment for healthy cell type and disease-dependent programs in T cells (see Supplemental Note). For lung capacity (height-adjusted FEV1adjRVC), there was significant enrichment for healthy cell type and disease-dependent programs in fibroblasts (Figure 7b, Supplementary Data 1) and the MAPK cellular process program (in basal, club, fibroblast and endothelial cells) (Figure 7f, g, Table 1). Genes driving these enrichments and enrichment results for IPF and COVID-19 are detailed in the Supplemental Note.
Figure 7. Linking asthma disease-dependent and cellular process programs to asthma and lung capacity.
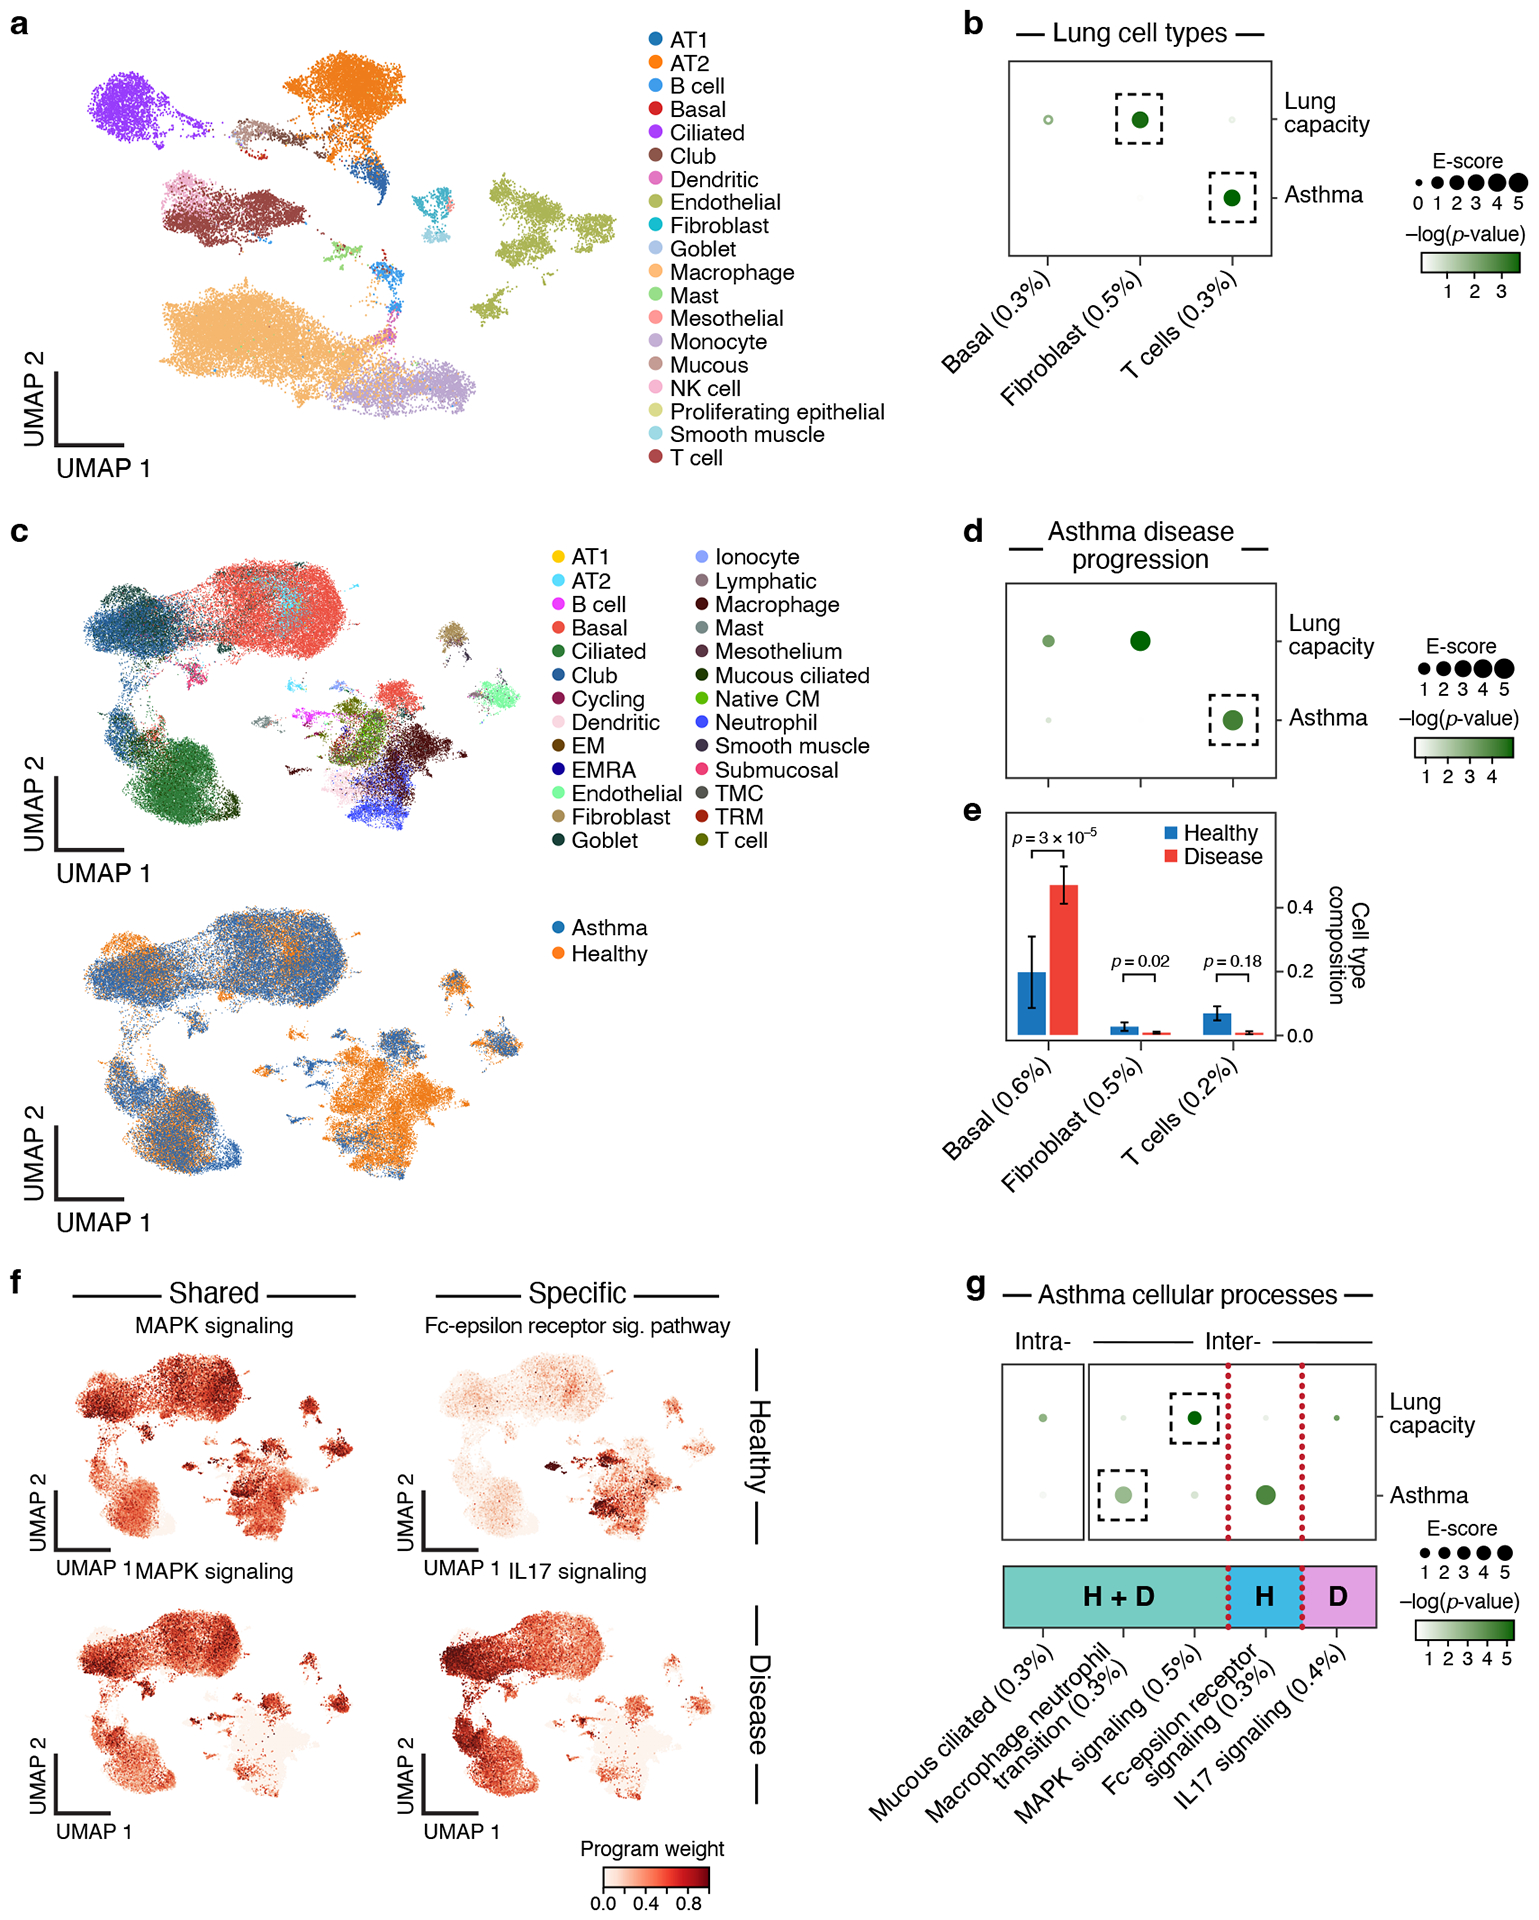
a. UMAP embedding of healthy lung scRNA-seq profiles (dots) colored by cell type annotations. b. Enrichments of healthy lung cell types for disease. Magnitude (E-score, dot size) and significance (−log10(P-value), dot color) of the heritability enrichment of healthy lung cell type programs (columns) for lung capacity or asthma (rows). c. UMAP embedding of scRNA-seq profiles (dots) from asthma and healthy lung tissue, colored by cell type annotations (top) or disease status (bottom). d. Enrichments of asthma disease-dependent programs for disease. Magnitude (E-score, dot size) and significance (−log10(P-value), dot color) of the heritability enrichment of asthma disease-dependent programs (columns) for lung capacity or asthma (rows). e. Proportion (mean and SE) of the corresponding cell types (columns), in healthy (blue) and asthma (red) n=54 biologically independent lung samples. P-value: one-sided Fisher’s exact test. f. Examples of shared (healthy and disease), healthy-specific, and disease-specific cellular process programs. UMAP (as in c), colored by each program weight (color bar) from NMF. g. Enrichments of asthma cellular process programs for disease. Magnitude (E-score, dot size) and significance (−log10(P-value), dot color) of the heritability enrichment of intra-cell type (left) and inter-cell type (right) cellular processes (shared (H+D), healthy-specific (H), or disease-specific (D)) (columns) for lung capacity and asthma GWAS summary statistics (rows). In panels b,d,e,g, the size of each corresponding SNP annotation (% of SNPs) is reported in parentheses. Numerical results are reported in Supplementary Data 1,2,3. Further details of all traits analyzed are provided in Supplementary Table 2.
DISCUSSION
Prior work on identifying disease-critical tissues and cell types by combining expression profiles and human genetics signals has largely focused on the direct mapping of the expression of individual genes34 and genome-wide polygenic signals18,36 to discrete cell categories. Our study demonstrates that there is much to be gained by linking inferred representations of the underlying biological processes beyond cell types in different cell and tissue contexts with genome-wide polygenic disease signals, by integrating scRNA-seq, epigenomic and GWAS data sets.
Our work introduces three main conceptual advances. First, by integrating scRNA-seq data and GWAS summary statistics using tissue-specific enhancer-gene linking strategies, we detect subtle differences in SNP to gene mapping between tissues which upon aggregation over the full GWAS signal produce strong differences in disease heritability across cell types. Second, by constructing disease-dependent programs comparing cells of the same type in disease vs. healthy tissue, we project GWAS signals across disease-specific cell states. Third, by using NMF to construct cellular process programs that do not rely on known cell type categories, we identify cellular mechanisms that vary across a continuum of cells of one type or are shared between cells of different types such as the MAPK signaling pathway identified in the lung.
Leveraging these advances, we identified notable enrichments (Table 1) that have not previously been identified using GWAS data and are biologically plausible but not clearly expected, thus providing important knowledge. We also observed patterns across datasets that offer additional insights. For example, we observed that disease-dependent programs, but not healthy cell type programs, of epithelial cells (M cells and basal cells) tend to be enriched in autoimmune diseases (UC and asthma). In contrast, for immune cells healthy and disease-dependent programs tended to be similarly enriched. We posit that this suggests a role for epithelial cells in disease-dependent over initiation. Future studies are required to experimentally validate these hypotheses.
Our work has several limitations that highlight directions for future research. First, the cell types and states covered in this work are not exhaustive and there will continue to be other cell types and more granular cell states uncovered as the scale of sequencing continues to grow. Second, the enhancer-gene linking strategies can continue to be improved beyond the Roadmap and Activity-By-Contact (ABC) models incorporated here. Finally, we focus on genome-wide disease heritability (rather than a particular locus); however, our approach can be used to implicate specific genes and gene programs. Additional limitations are discussed in the Supplementary Note.
Looking forward, the gene program-disease links identified by our analyses can be used to guide downstream studies, including designing systematic perturbation experiments91 in cell and animal models for functional follow up. In the long term, with the increasing success of PheWAS and the integration of multi modal single cell resolution epigenomics, this framework will continue to be useful in identifying biological mechanisms driving a broad range of diseases.
METHODS
This research complies with all relevant ethical regulations and the research protocols are approved by the Harvard School of Public Health.
scRNA-seq data pre-processing
All scRNA-seq datasets in this study1–14 are publicly available cell by gene expression matrices that are aligned to the hg38 human transcriptome (Supplementary Table 1). Each dataset included metadata information for each cell describing the total number of reads in the cell and which sample the cell corresponds to and, if applicable, its disease status. We transformed each expression matrix to a count matrix by reversing any log normalization processing (because each downloaded dataset contained either (i) raw counts, (ii) normalized log2 TP10K, or (iii) normalized log10 TP10K), and standardized the normalization approach across all datasets to account for differences in sequencing depth across cells by normalizing by the total number of UMIs per cell, converting to transcripts-per-10,000 (TP10K) and taking the log of the result to obtain log(10,000*UMIs/total UMIs + 1) “log2(TP10K+1)” as the final expression unit.
Dimensionality reduction, batch correction, clustering and annotation of scRNA-seq
The log2(TP10K+1) expression matrix for each dataset was used for the following downstream analyses. For each dataset, we identified the top 2,000 highly variable genes across the entire dataset using Scanpy’s15 highly_variable_genes function with the sample ID as input for the batch. We then performed a Principal Component Analysis (PCA) with the top 2,000 highly variable genes and identified the top 40 principal components (PCs), beyond which negligible additional variance was explained in the data (the analysis was performed with 30, 40, and 50 PCs and was robust to this choice). We used Harmony16 for batch correction, where each sample was considered its own batch. Subsequently, we built a k-nearest neighbors graph of cell profiles (k = 10) based on the top 40 batch corrected components computed by Harmony and performed community detection on this neighborhood graph using the Leiden graph clustering method17 with resolution 1. For each dataset, individual single-cell profiles were visualized using the Uniform Manifold Approximation and Projection (UMAP)18. If prior annotations were available they are used as a reference to annotate each cell in each dataset. If prior annotations were not available, we used established cell type-specific expression signatures and gene markers described in the data source to annotate cells at the resolution of Leiden clusters.
Cell type gene programs
We constructed cell type programs for every cell type in a given tissue by applying a non-parametric Wilcoxon rank sum test for differential expression (DE) between each cell type vs. other cell types and computed a p value for each gene. Using a previously published strategy19, we transform these p-values to X = −2 log (p), which follow a distribution, and these transformed values to a grade between 0 and 1 using the min max normalization g = (X – min (X))/(max(X) – min(X)) resulting in a relative weighting of genes in each program. We note that these scores do not formally represent probabilities. In brief, cell type programs constructed from healthy cells were termed as healthy cell type programs and similarly cell type programs constructed from disease cells were termed as disease cell type programs.
Disease-dependent gene programs
We constructed disease-dependent programs for each cell type observed in both healthy and matching disease tissue. For each cell type, we computed a gene-level non-parametric Wilcoxon rank sum DE test between cells from healthy and disease tissues of the same cell type. The p-values for each gene were transformed to a grade between 0 and 1 using the same strategy as in the cell type program to form a relative weighting of genes in each program. In the COVID-19 BAL scRNA-seq, we also constructed viral progression programs based on differential expression between viral infected and uninfected cells of the same cell type in COVID-19 disease individuals. We observed low correlation between healthy cell type gene programs and disease-dependent gene programs (see Supplementary Figure 13 and Supplementary Data 12).
Cellular process gene programs
Using latent factors derived from non-negative matrix factorization (NMF)20 (see below), we define a cellular process program based on genes with high correlation (across cells) between their expression in each cell and the contribution of the factor to each cell (collapsing latent factors with high correlation). The correlations were transformed to a continuous-valued scale (between 0 and 1) by scaling their values (negative correlations are assigned to 0). We then annotated each factor (program) by the pathway most enriched in the top driving genes for the factor and labeled each as an ‘intra-cell type’ or ‘inter-cell type’ latent factor if the pathway was highly correlated with only one or multiple cell type programs, respectively.
We constructed cellular process programs using an unsupervised approach, by applying non-negative matrix factorization (NMF)20 to the scRNA-seq cells-by-genes matrix. The solution to this formulation can be identified by solving the following minimization problem:
| (1) |
where Xn,m represents the log-normalized expression of gene m in sample n, Wn,p denotes the grade of membership of latent factor p in sample n, and Hp,m represents the factor weight of factor p in gene m. NMF identifies cellular processes as latent factors with a grade of contribution to each cell. For each dataset, we specified the number of latent factors p to be the number of annotated cell types in the dataset plus 10. For each latent factor, we define a cellular process gene program by identifying genes with high correlation (across cells) between expression in a cell and the contribution of each factor to each cell. Latent factors with correlation above 0.8 are collapsed to only consider a single latent factor. We annotated each cellular process program by the pathway most enriched in the genes with highest correlation (across cells) between expression levels and factor weights (H) underlying the cellular process program (not necessarily the most highly expressed genes, Supplementary Fig. 17) and labeled it as an ‘intra-cell type’ or ‘inter-cell type’ cellular process program if highly correlated with only one or multiple cell type programs, respectively.
Cellular process gene programs constructed from healthy and disease tissues
For scRNA-seq from healthy and disease tissue contexts, we propose a modified NMF approach to construct gene programs that are either shared across both tissues, specific to healthy tissue or specific to disease tissue. Let be the observed gene expression data for a tissue T from a healthy individual and be the observed gene expression data for the corresponding tissue from a disease individual. P is the number of features (genes) and N1 and N2 denote the number of samples from the healthy and disease tissues, respectively.
We assume a non-negative matrix factorization for H and D as follows
| (2) |
| (3) |
where KC is the number of shared programs between the healthy and the disease samples, KH is the number of healthy specific programs and KD is the number of disease-specific programs. LCH and LCD are used to denote the shared programs between healthy and disease states. Therefore, we assume that LCH is very close to LCD but not exact to account for other factors like experimental conditions perturbing the estimates slightly. On the other hand, LUH and LUD are used to denote the healthy-specific and disease-specific programs respectively. FH and FD denote the program weights in the healthy and disease samples respectively. frame this in the form of the following optimization problem
| (4) |
Where and and γ is a tuning parameter that controls how close LCH is to LCD. μ represents a tuning parameter that controls for the size of the loadings and the factors.
To determine the multiplicative updates of the NMF optimization problem in Equation 4 we compute the derivatives of the optimization criterion with respect to each parameter of interest. We call the optimization criterion as Q:
| (5) |
| (6) |
| (7) |
| (8) |
Following the multiplicative update rules of NMF as per Lee and Seung (NIPS 2001), we get the following iterative updates and assume convergence has been achieved after 100 iterations or when the reconstruction error is below a user-specified error threshold (here the threshold is taken to be 1e-04).
| (9) |
| (10) |
| (11) |
| (12) |
Enhancer-gene linking strategies
We define an enhancer-gene linking strategy as an assignment of 0, 1 or more genes to each SNP with a minor allele count >5 in the 1000 Genomes Project European reference panel21. Here, we primarily considered an enhancer-gene linking strategy defined by the union of the Roadmap22,23 and Activity-By-Contact (ABC)24,25 strategies. Roadmap and ABC enhancer gene links are publicly available for a broad set of tissues and have been shown to outperform other enhancer-gene linking strategies in previous work26. We consider tissue-specific Roadmap and ABC enhancer-gene linking strategies for gene programs corresponding to any of the biosamples (cell types or tissues) associated with the relevant tissue. Based on analysis in immune cell types, 87% of genes expressed in the scRNA-seq were observed to have enhancer-gene links. We also consider non-tissue specific Roadmap and ABC strategies (Supplementary Fig. 12). Besides this enhancer-gene linking strategy, we also considered a standard 100kb window-based strategy27,28.
Genomic annotations and the baseline-LD models
We define an annotation as an assignment of a numeric value to each SNP in a predefined reference panel (e.g., 1000 Genomes Project21; see Data Availability). Binary annotations can have value 0 or 1 only; continuous-valued annotations can have any real value; our focus is on continuous-valued annotations with values between 0 and 1. Annotations that correspond to known or predicted functions are referred to as functional annotations. The baseline-LD model29,30 (v.2.1) contains 86 functional annotations (see Data Availability), including binary coding, conserved, and regulatory annotations (e.g., promoter, enhancer, histone marks, TFBS) and continuous-valued linkage disequilibrium (LD)-related annotations.
Stratified LD score regression
Stratified LD score regression (S-LDSC) assesses the contribution of a genomic annotation to disease and complex trait heritability31. S-LDSC assumes that the per-SNP heritability or variance of effect size (of standardized genotype on trait) of each SNP is equal to the linear contribution of each annotation.
| (14) |
where ajc is the value of annotation c at SNP j, with the annotation either continuous or binary (0/1), and tc is the contribution of annotation c to per SNP heritability conditional on the other annotations. S-LDSC estimates tc for each annotation using the following equation:
| (15) |
where is the stratified LD score of SNP j with respect to annotation c, rjk is the genotypic correlation between SNPs j and k computed using 1000 Genomes Project, and N is the GWAS sample size.
We assess the informativeness of an annotation c using two metrics. The first metric is Enrichment score (E-score), which relies on the enrichment of annotation c (EC), defined for binary annotations as follows (for binary and continuous-valued annotations only):
| (16) |
where is the heritability explained by the SNPs in annotation c, weighted by the annotation values where M is the total number of SNPs on which this heritability is computed (5,961,159 in our analyses). The Enrichment score (E-score) is defined as the difference between the enrichment for annotation c corresponding to a particular program against a SNP annotation for all protein coding genes with a predicted enhancer-gene link in the relevant tissue. The E-score metric generalizes to continuous-valued annotations with values between 0 and 132. We primarily focus on the p-value for nonzero enrichment score greater than 2. We chose the threshold of 2 because it is a round number that is roughly the geometric mean of the value of 1 (no enrichment) and the median value of 3.7 among the notable enrichments highlighted in Table 1.
The second metric is standardized effect size (τ*), the proportionate change in per-SNP heritability associated with a one standard deviation increase in the value of the annotation, conditional on other annotations included in the model29.
| (17) |
where sdc is the standard error of annotation c, is the total SNP heritability and M is as defined previously. is the proportionate change in per-SNP heritability associated with an increase of one standard deviation in the value of a annotation.
We assessed the statistical significance of the enrichment score and τ* via block-jackknife, as in previous work31, with significance thresholds determined via False Discovery Rate (FDR) correction (q-value < 0.05)33. FDR was calculated over all relevant relatively independent traits for a tissue and all programs of a particular type (cell type programs, disease-dependent programs, cellular process programs) derived from that tissue. We used the p-value for nonzero enrichment score as our primary metric, because τ* is often non-significant for small cell-type-specific annotations when conditioned on the baseline-LD model34.
MAGMA gene-level and gene set-level enrichment analyses
MAGMA assesses the enrichment of genes and gene sets with disease. MAGMA version 1.08 was run using a 0kb window around each gene to link SNPs to genes, using all default MAGMA parameters for running the gene-level analysis, and using the 1000 Genomes reference panel for the genotype LD reference. For the gene set level analysis, two types of analysis were performed: (1) a binary gene set analysis by thresholding the gene programs at different thresholds of program score (ranging from 0.2 to 0.95) (using the –set-annot flag in MAGMA) and (2) a continuous variable based analysis by treating the gene program probabilistic grade or negative log odds of the probabilistic grade as continuous gene-level variables (using the –gene-covar flag in MAGMA).
GWAS summary statistics
We analyzed publicly available GWAS summary statistics for 60 unique diseases and traits with genetic correlation less than 0.9. Each trait passed the filter of being well powered enough for heritability studies (z score for observed heritability > 5). We used the summary statistics for SNPs with minor allele count >5 in a 1000 Genomes Project European reference panel21. The lung FEV1FVC trait was corrected for height data. For COVID-19, we analyzed two phenotypes – general COVID-19 (covid vs. population, liability scale heritability h2 = 0.05, se. = 0.01), and severe COVID-19 (hospitalized covid vs population, liability scale heritability h2 = 0.03, se. = 0.01)35 (meta-analysis round 4, October 20, 2020, https://www.covid19hg.org/).
Computing a sensitivity/specificity index
We define a sensitivity/specificity index to benchmark (i) sc-linker vs. MAGMA gene-set enrichment analysis, and (ii) different versions of sc-linker corresponding to varying ways to define cell type programs and SNP-to-gene linking strategies
For the comparison of sc-linker with MAGMA, we define the sensitivity/specificity index as the difference of (i) the average of −log10(P-values) of enrichment score (association) using sc-linker (MAGMA) for “expected enrichments” (gene program, trait) combinations (sensitivity) and (ii) the average of −log10(P-values) of gene-set level enrichment score (association) using sc-linker (MAGMA) for “other enrichments” (gene program, trait) combinations (specificity). In Figure 4e, the expected enrichment combinations include immune programs for blood cell traits and immune diseases, and brain programs for brain related traits36,37; all other combinations are considered to be other enrichments. In Supplementary Fig. 8, the expected enrichment combinations include B and T cells for lymphocyte percentage, monocytes for monocyte percentage, megakaryocytes for platelet count, erythroid for RBC count and RBC distribution width; all other combinations of cell types and traits are considered as other enrichments36,37. A limitation of the sensitivity/specificity index is that other enrichments may be biologically real in some cases; thus, we also consider sensitivity to detect expected enrichments.
For the comparison of the different versions of the sc-linker approach using either varying definitions of cell type programs (Supplementary Fig. 6 and 7) or different ways to link SNPs to genes beyond Roadmap∪ABC enhancer-gene linking strategy (Figure 3d,e and Supplementary Fig. 3), we use a slightly different definition of sensitivity/specificity index. Instead of the −log P-value, we use the τ* metric from the S-LDSC method, which evaluates conditional information in the SNP annotation corresponding to a gene program, corrected for the annotation size. This metric is preferred when comparing across cell-type programs or enhancer-gene linking strategies that are widely different in their corresponding SNP annotation sizes, as is the case in these comparisons (we note that use of this metric is not possible in comparisons involving MAGMA, which does not estimate τ*).
Identifying genes driving heritability enrichment
For each gene program, we first subset the full gene list to only consider genes with greater than 80% probability grade of membership in the gene program. Subsequently, we ranked all remaining genes using MAGMA (v 1.08) gene level significance score and considered the top 50 ranked genes for further downstream analysis, which is different from the top 200 genes used for a “baseline” method for scoring cell type enrichments for disease that we used as a benchmark for sc-linker.
Identifying statistically significant differences in cell type proportions
To identify changes in cell type proportions between healthy and disease tissue, we used a multinomial regression test to jointly test changes across all cell types simultaneously. This helps account for all cell type changes simultaneously, as an increase in the number of cells of one cell types implies fewer cells of the other cell type will be captured. This regression model and the associated p-values were calculated using the multinom function in the nnet R package.
STATISTICS & REPRODUCIBILITY
All data used in this study was generated and designed by the original studies in which they appear. No statistical method was used to predetermine sample size. No data were excluded from the analyses. The experiments were not randomized. The Investigators were not blinded to allocation during experiments and outcome assessment. All sc-linker heritability enrichment and significance p-values are computed using a one-sided stratified LD score regression test. Multiple hypothesis correction was performed at the level of each scRNA-seq dataset across all cell type and disease pairs.
Extended Data
Extended Data Fig. 1. Single-cell RNA-seq datasets.
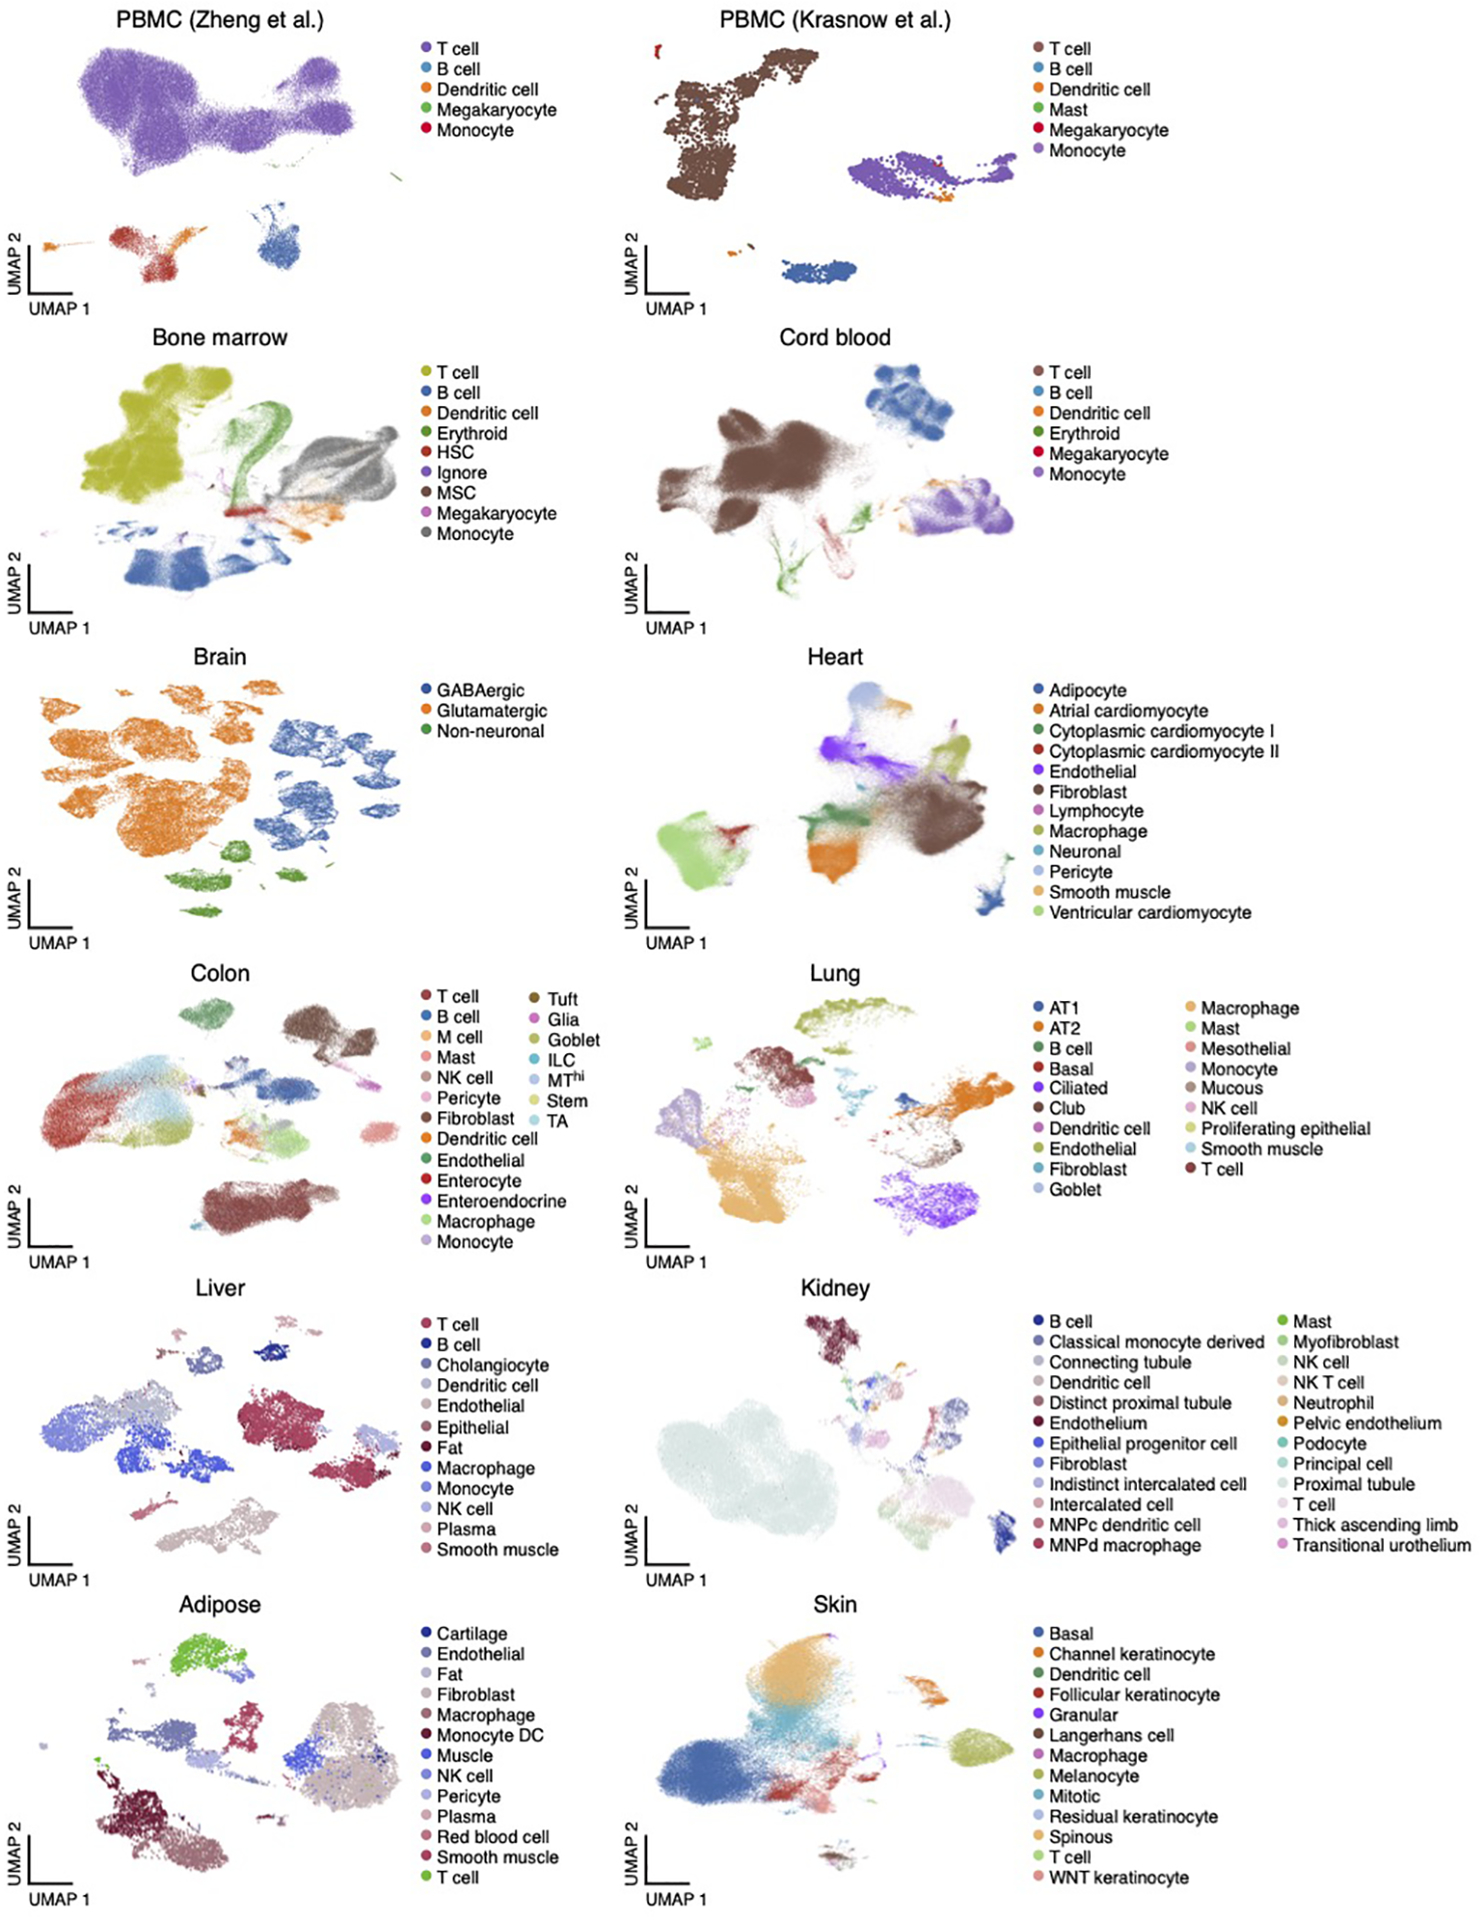
UMAP embedding of scRNA-seq profiles (dots) colored by cell type annotations from 12 datasets (labels on top).
Extended Data Fig. 2. Standardized effect sizes of immune and brain cell type programs.
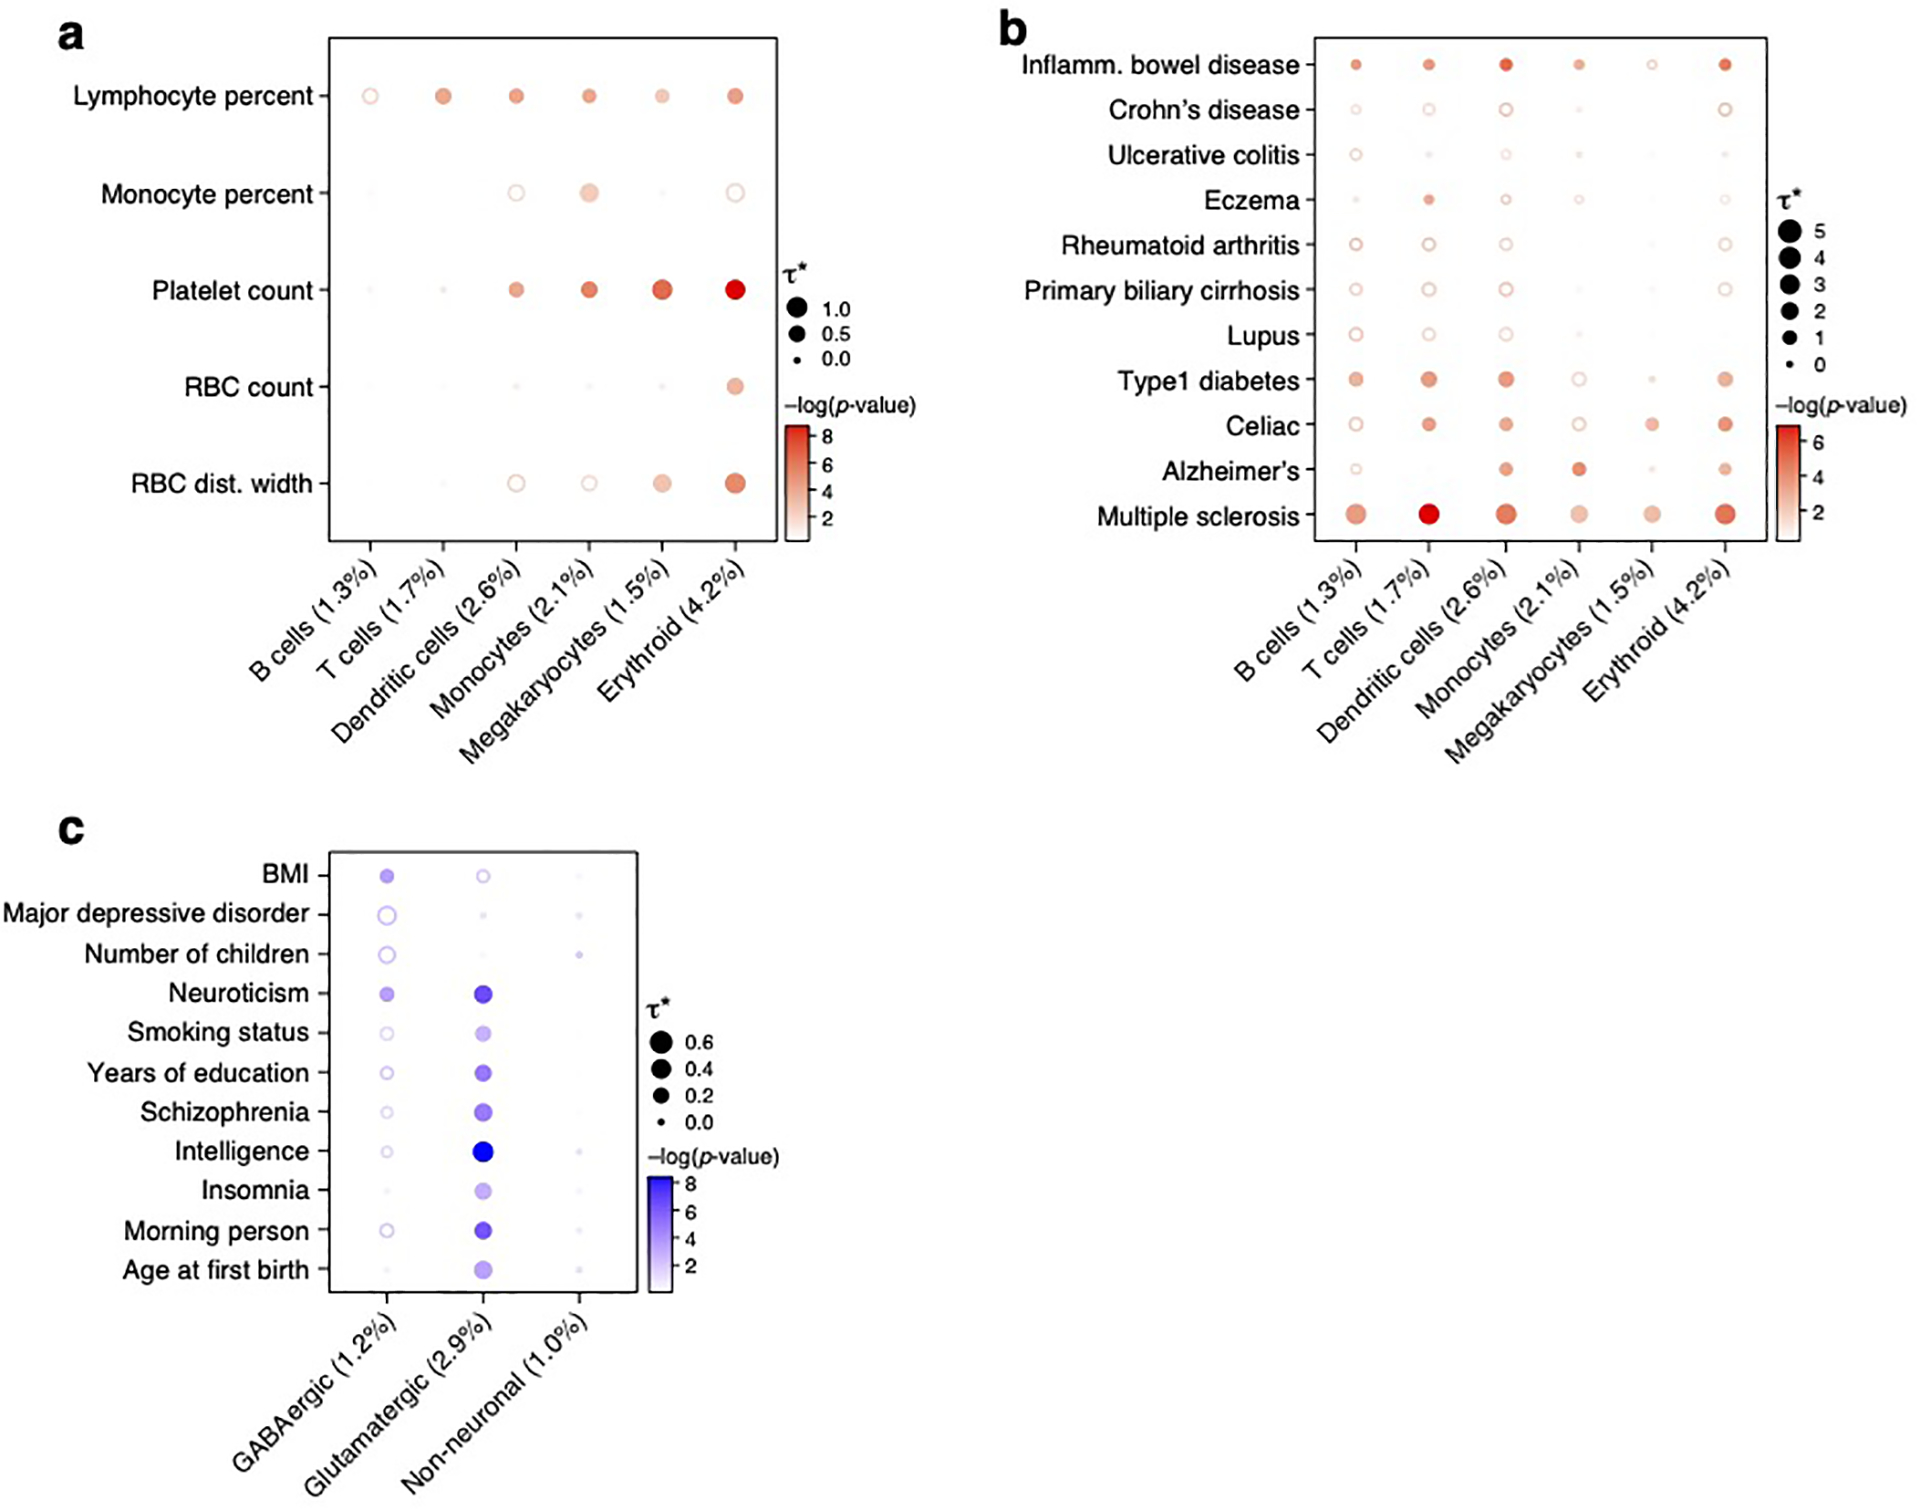
Standardized effect size (τ*) (dot size) and significance (−log10(P-value), dot color) of the heritability enrichment of immune (a,b) or brain (c) cell type programs (columns) for blood cell traits (a), immune disease traits (b), or neurological/psychological related traits (c), based on SNP annotations generated with the Roadmap∪ABC-immune (a,b) or Roadmap∪ABC-brain (c) enhancer-gene linking strategy. Numerical results are reported in Supplementary Data 1. Details for all traits analyzed are in Supplementary Table 2.
Extended Data Fig. 3. Linking cell type programs to diseases and traits across all analyzed tissues.
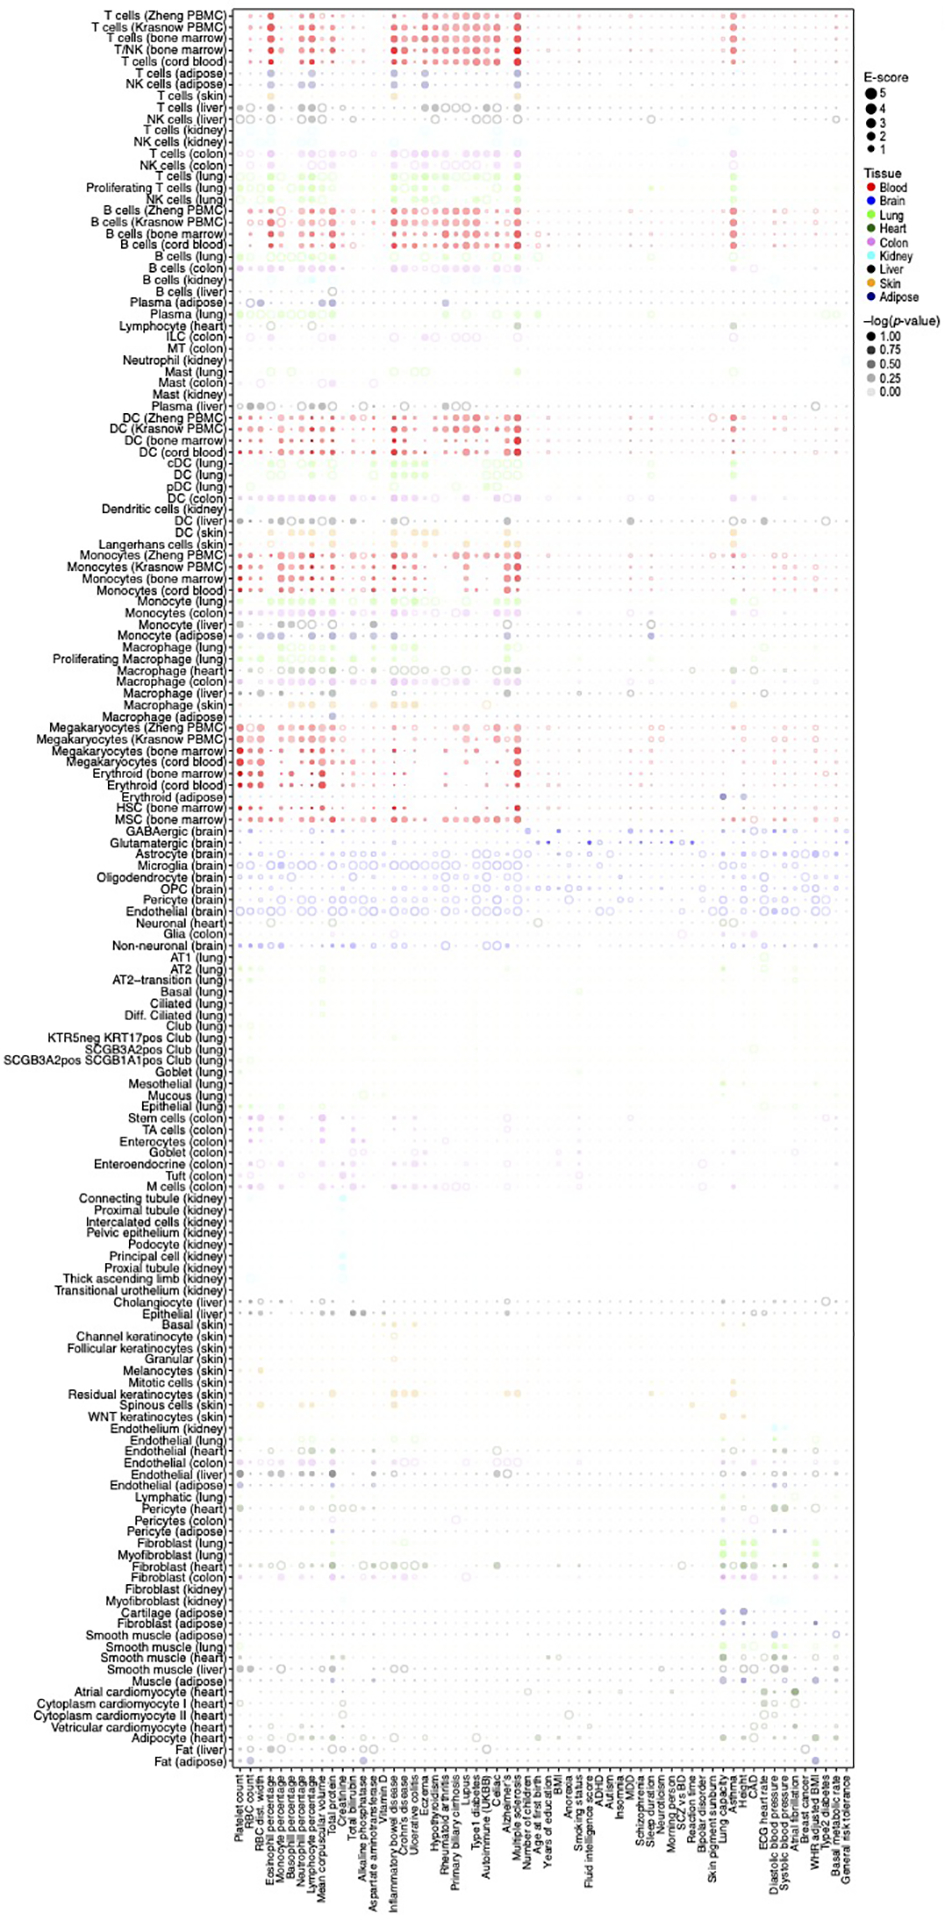
Magnitude (E-score, dot size) and significance (−log10(P-value), dot color) of the heritability enrichment of cell type programs (columns) from each of nine tissues (color code, legend) for GWAS summary statistics of diverse traits and diseases (rows), based on the Roadmap∪ABC enhancer-gene linking strategy for the corresponding tissue. Details for all traits analyzed are in Supplementary Table 2. See Data Availability for higher resolution version of this figure.
Extended Data Fig. 4. Cross trait analysis of cell type enrichments.
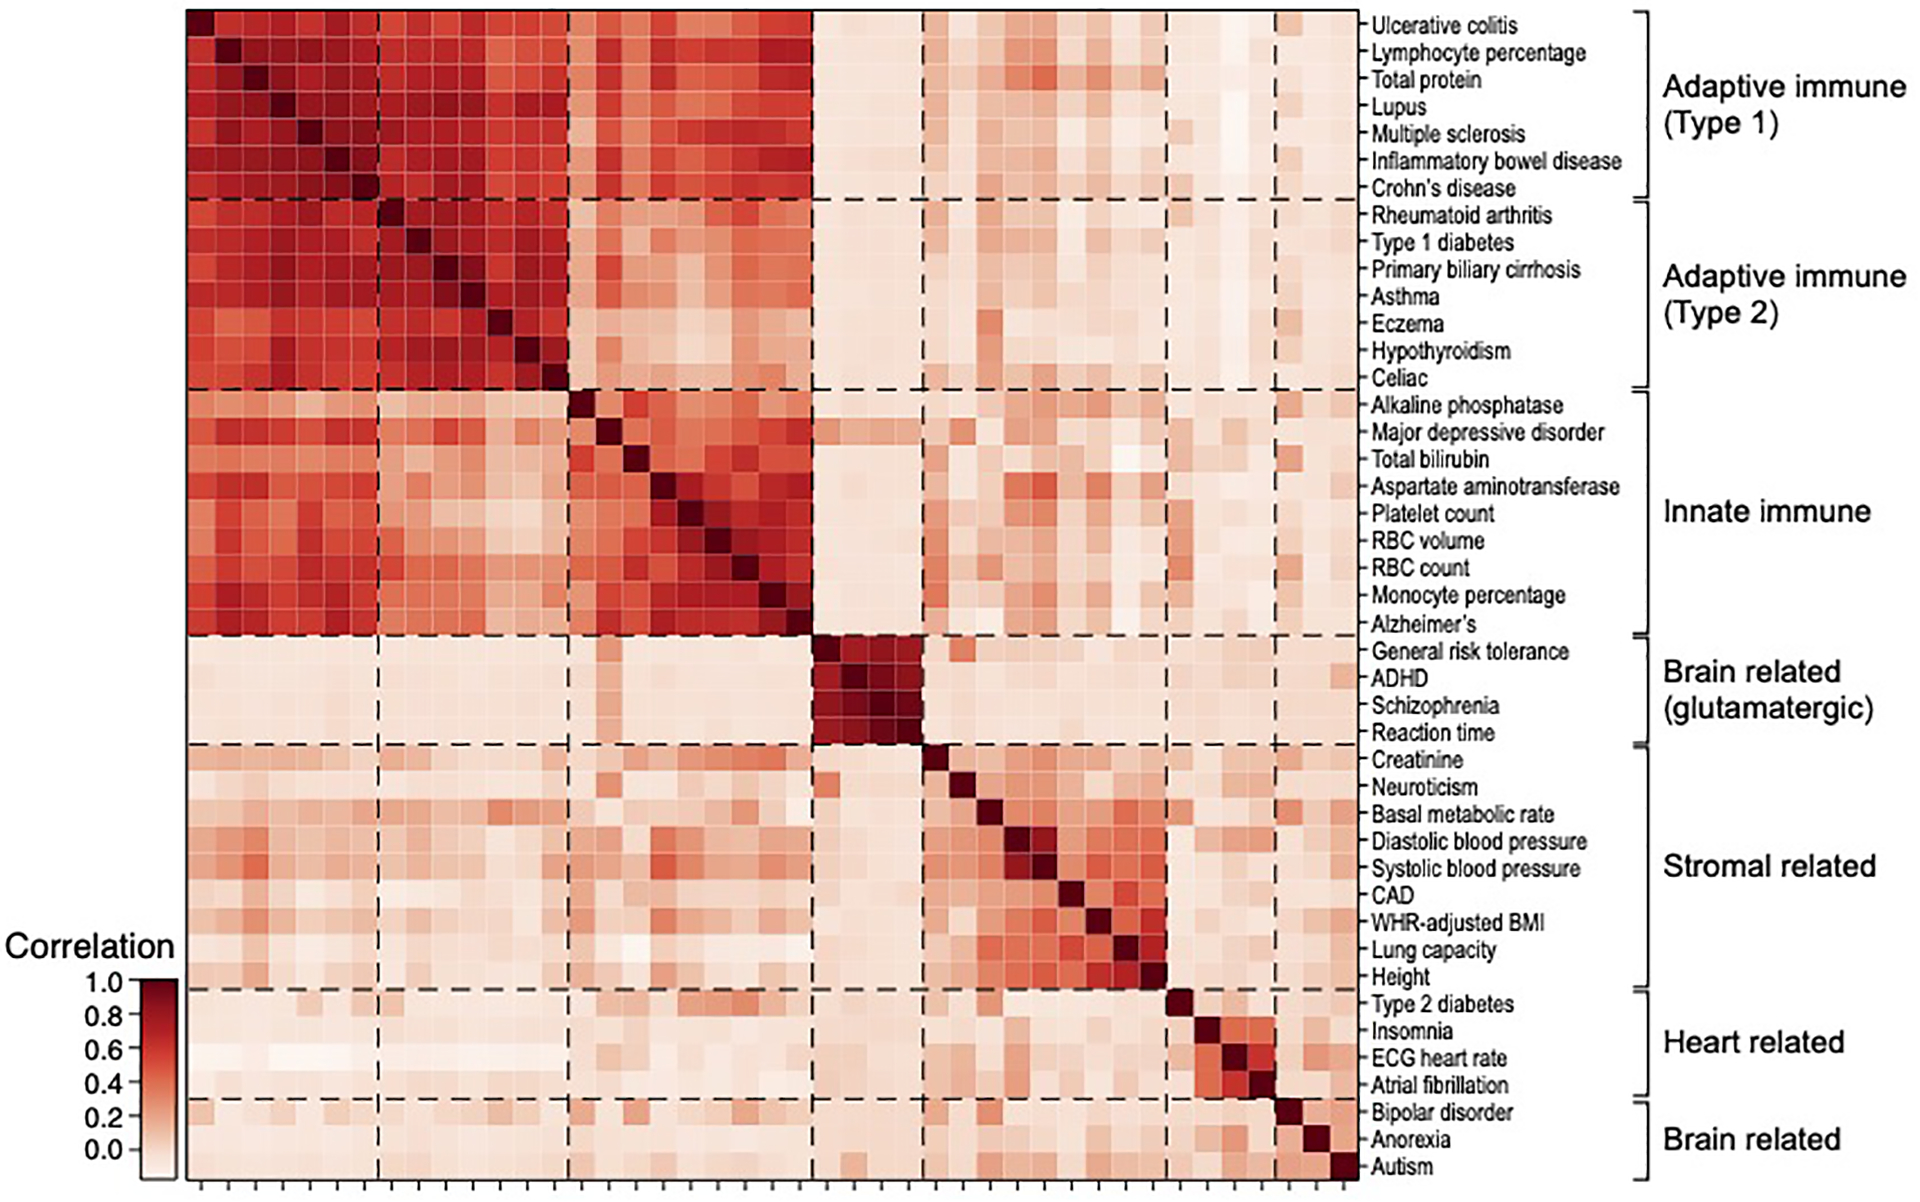
Pearson correlation coefficient (colorbar) between the cell type enrichment profiles of each pair of traits (rows, columns), clustered (dashed lines) hierarchically. Trait clusters labeled by their overall cell type enrichments.
Extended Data Fig. 5. Linking cellular process programs to relevant diseases and traits in each of six tissues.
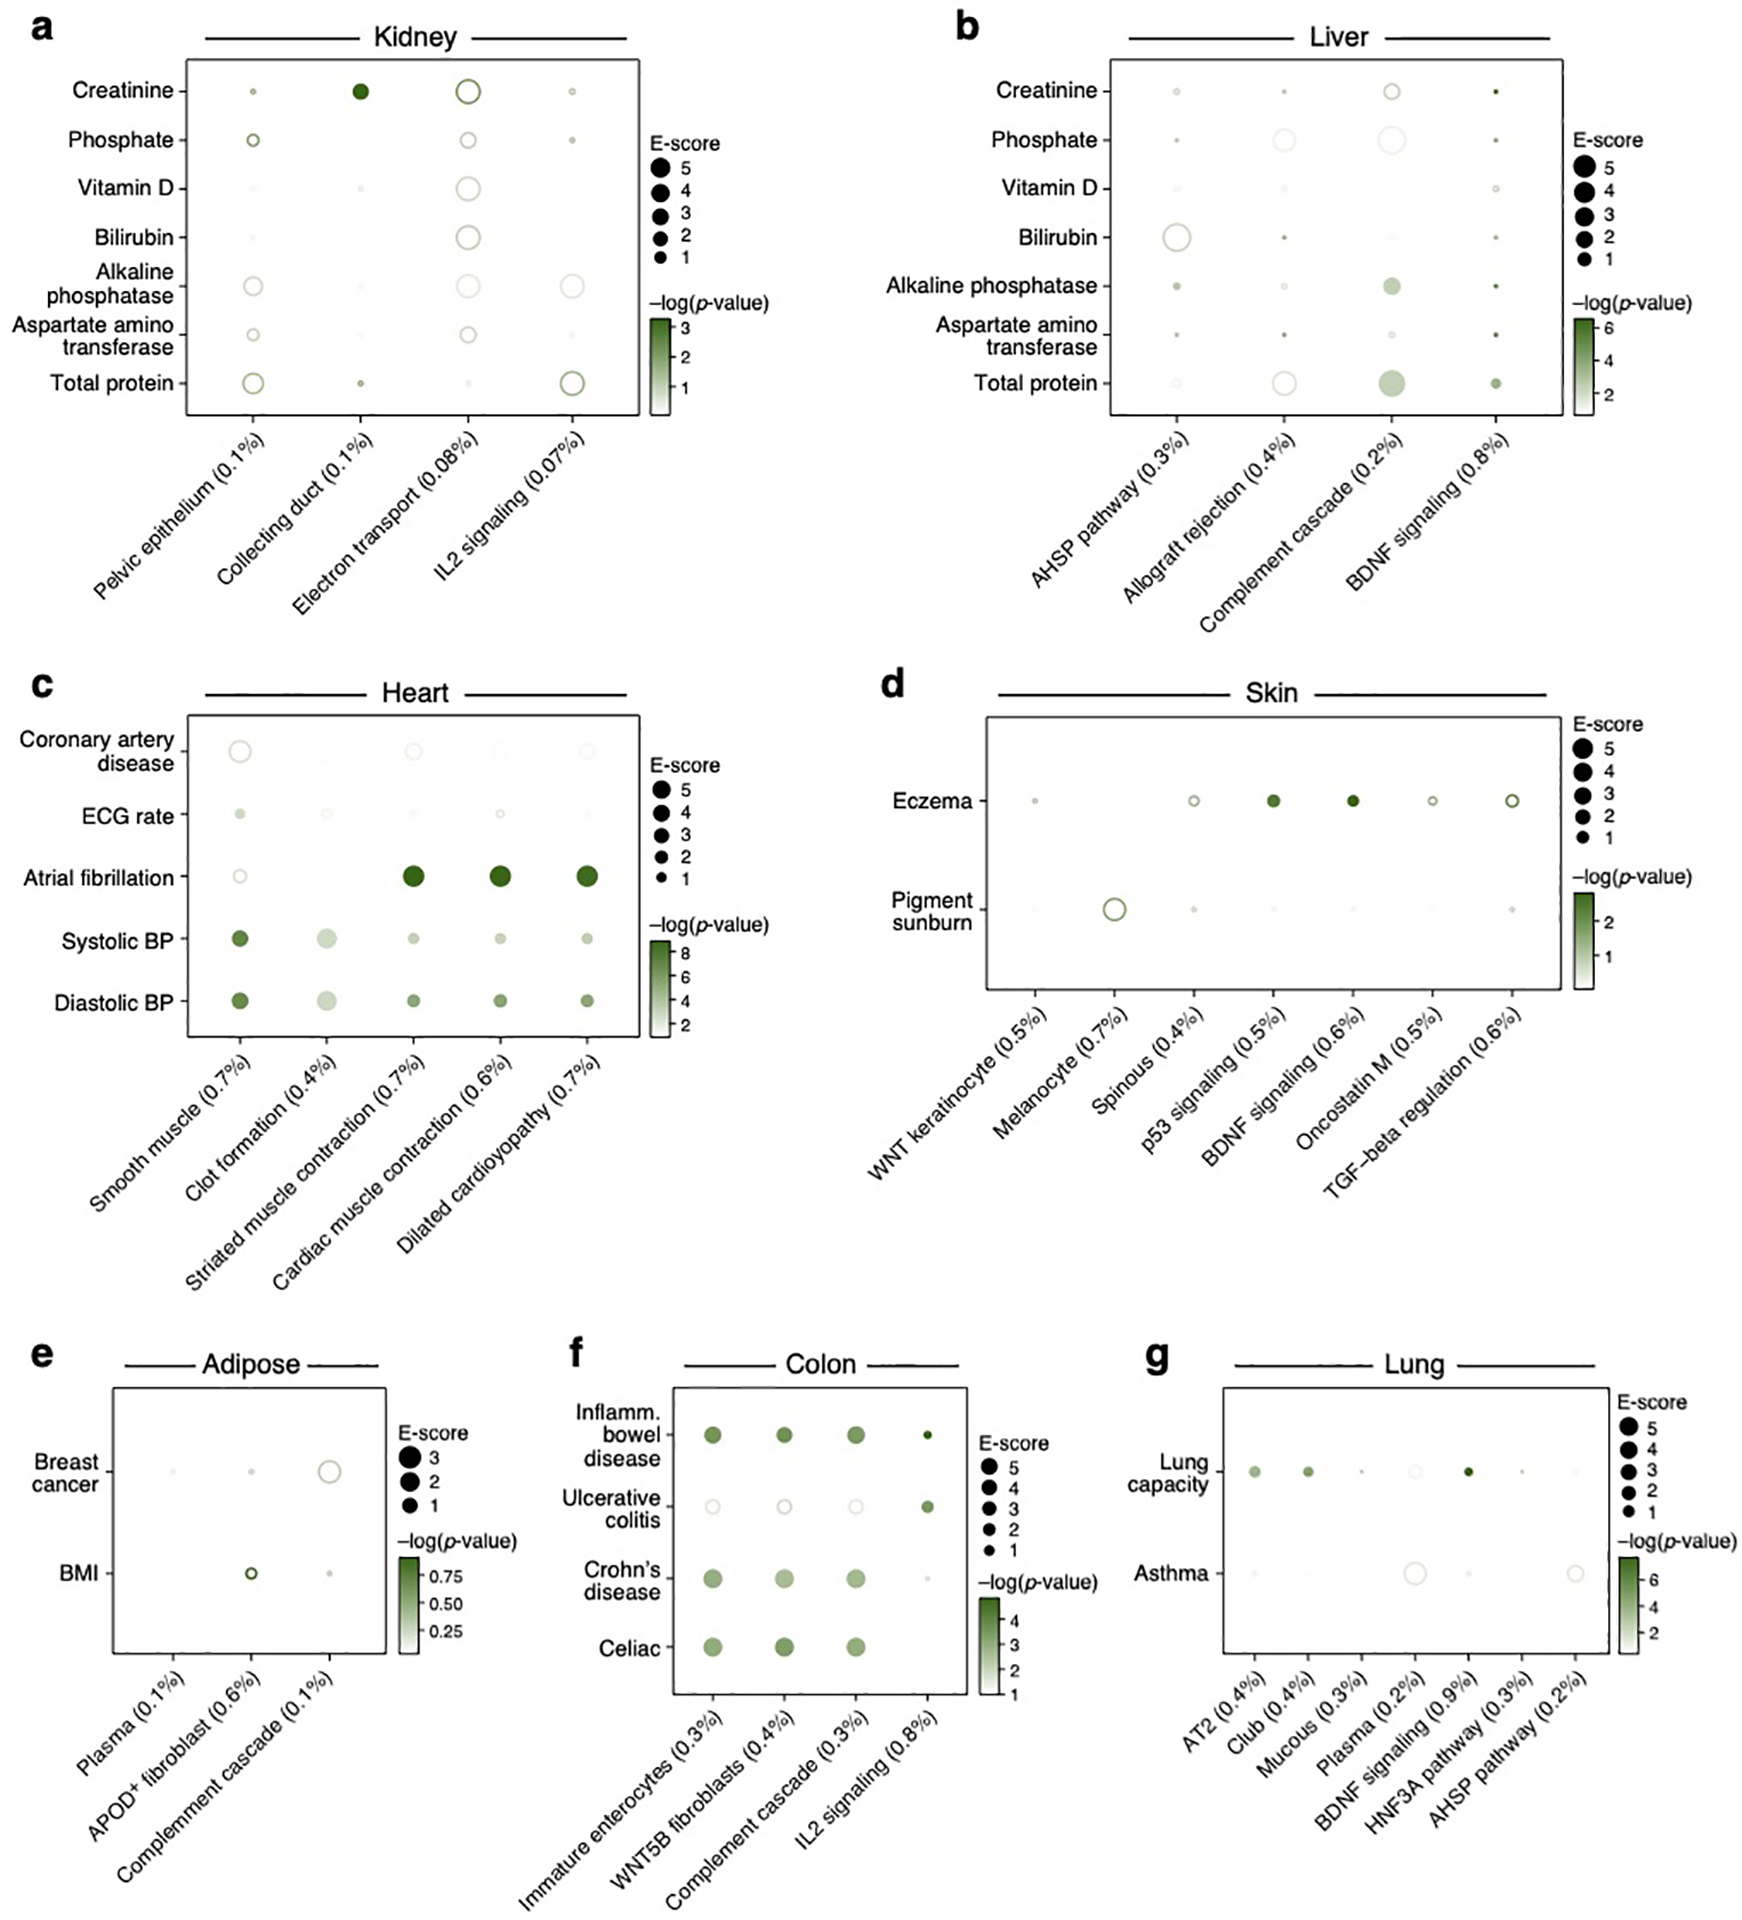
Magnitude (E-score, dot size) and significance (−log10(P-value), dot color) of the heritability enrichment of cellular process programs (columns; obtained by NMF) in each of seven tissues (label on top) for traits relevant in that tissue (rows) using the Roadmap∪ABC strategy for the corresponding tissue. Details for all traits analyzed are in Supplementary Table 2.
Extended Data Fig. 6. Analysis of cell type programs using a non-tissue-specific enhancer-gene linking strategy.
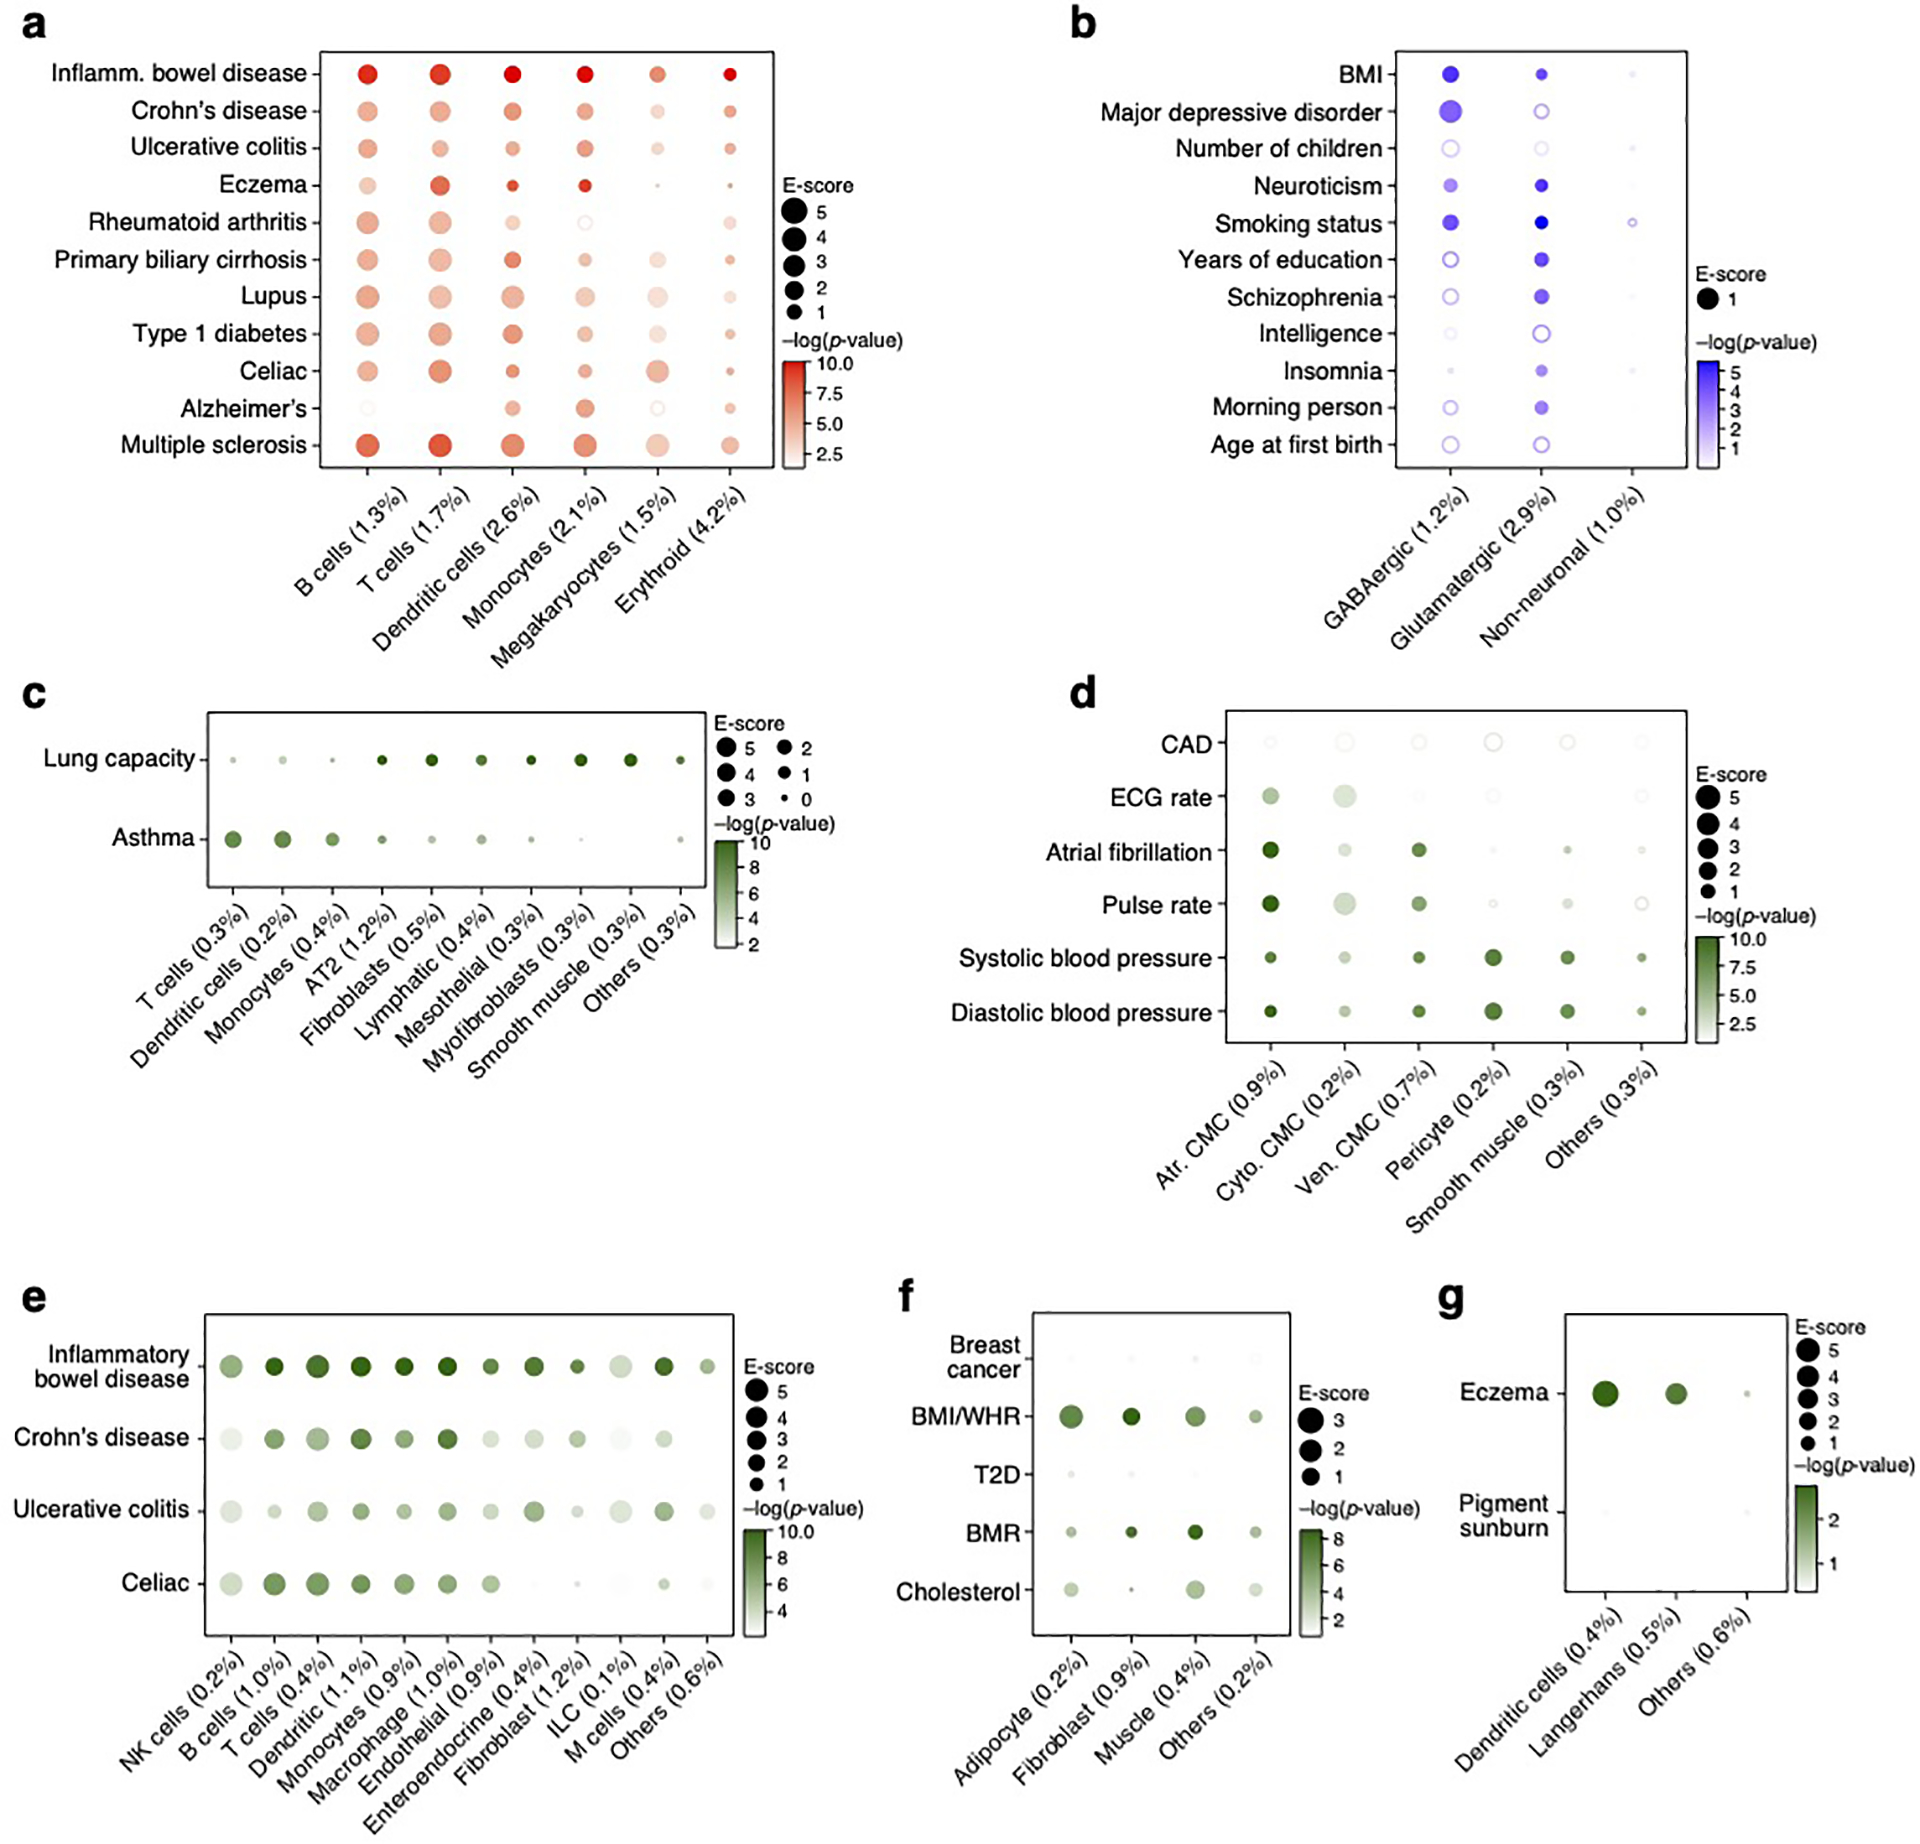
Magnitude (E-score, dot size) and significance (−log10(P-value), dot color) of the heritability enrichment of immune (a), brain (b), lung (c), heart (d), colon (e), adipose (f) and skin (g) cell type programs (columns) for traits relevant in that tissue (rows) using a non-tissue-specific Roadmap∪ABC strategy. Details for all traits analyzed are in Supplementary Table 2.
Extended Data Fig. 7. Disease-dependent programs have low correlations with healthy and disease cell type programs.
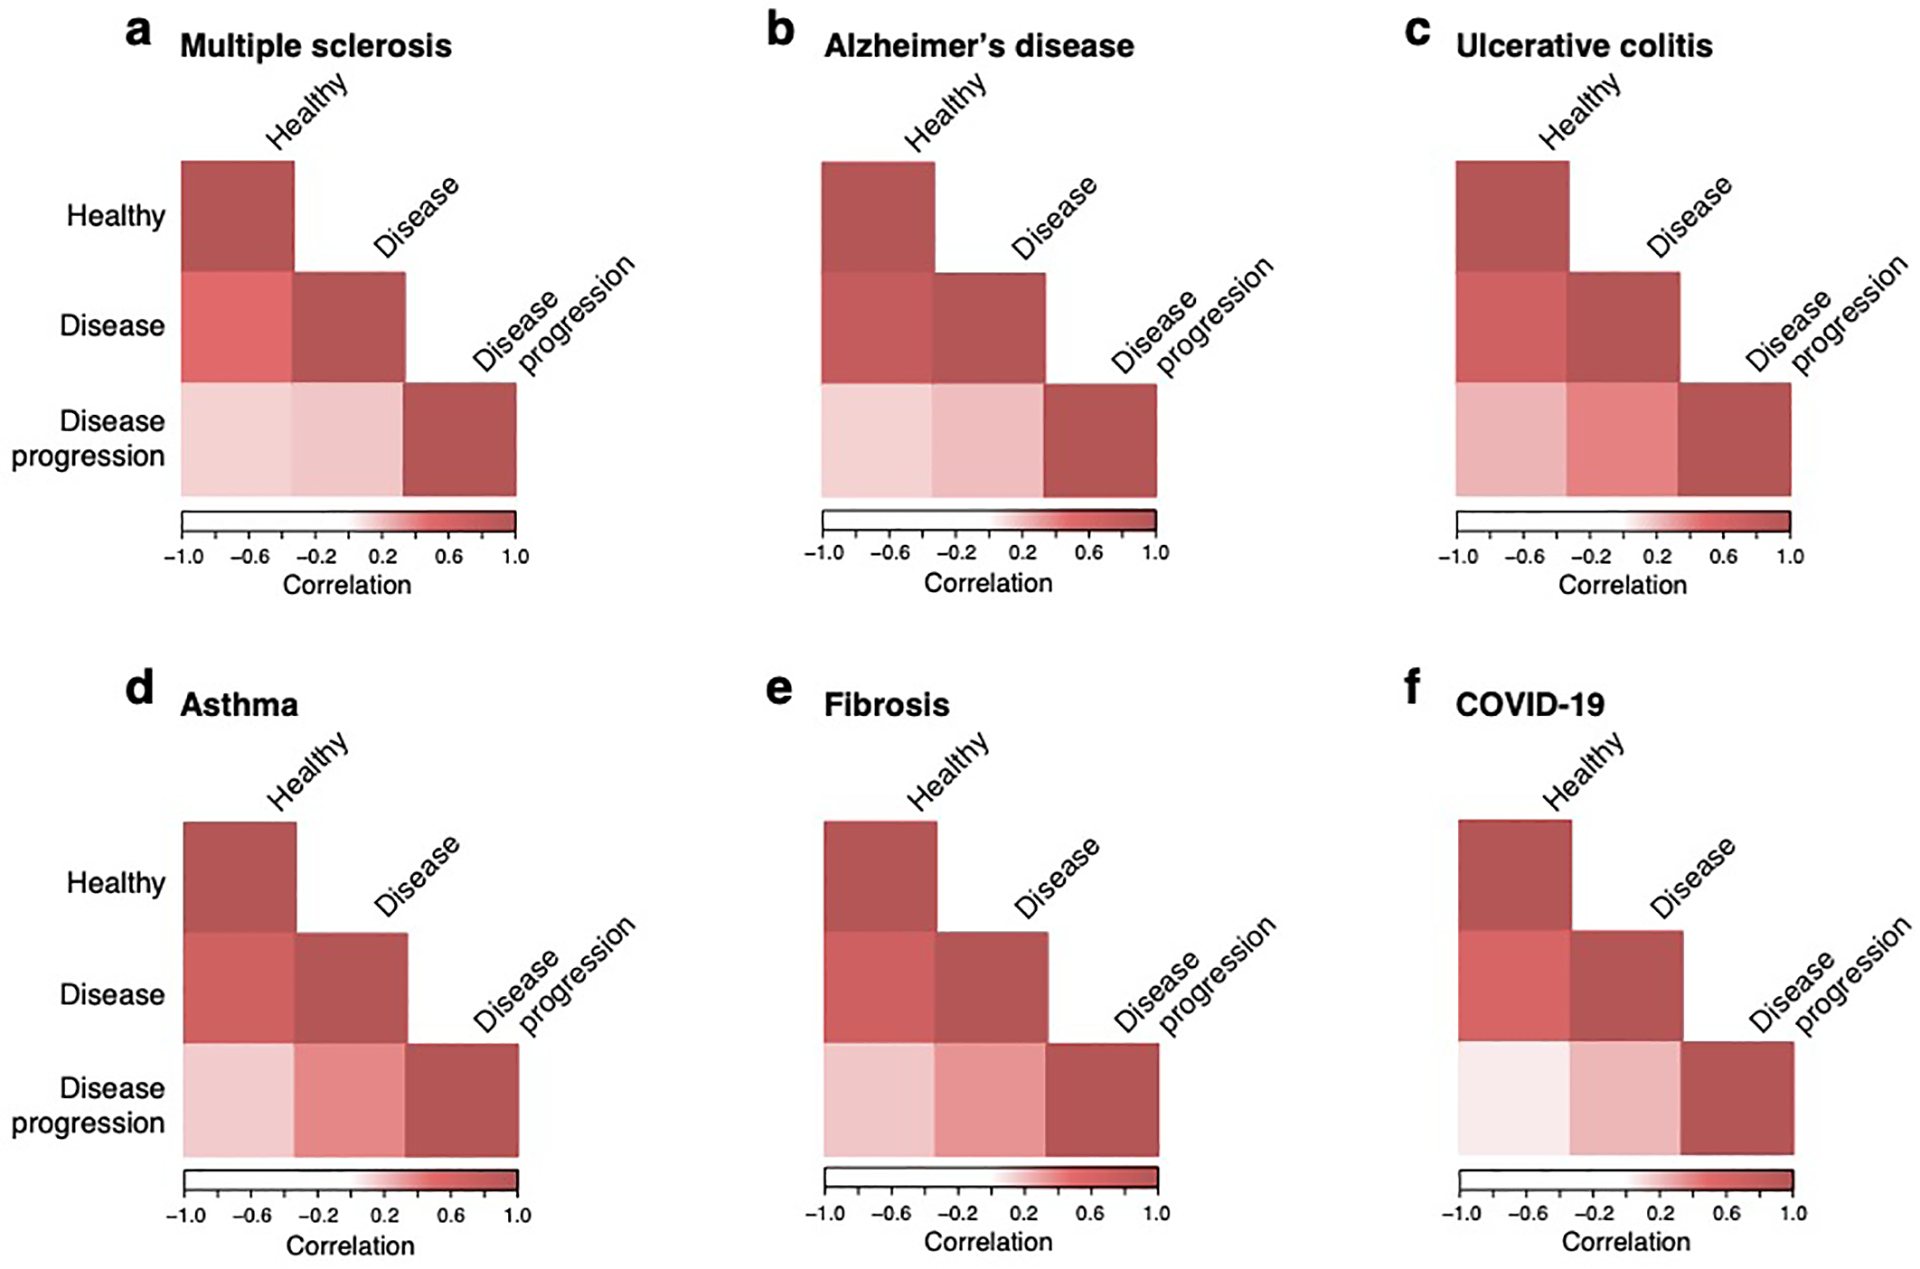
Pearson correlation coefficient (color bar) of gene program membership vectors between healthy cell type, disease cell type and disease-dependent programs in scRNA-seq studies from a disease tissue (label on top) and the corresponding healthy tissue.
Extended Data Fig. 8. Disease specificity of disease-dependent programs.
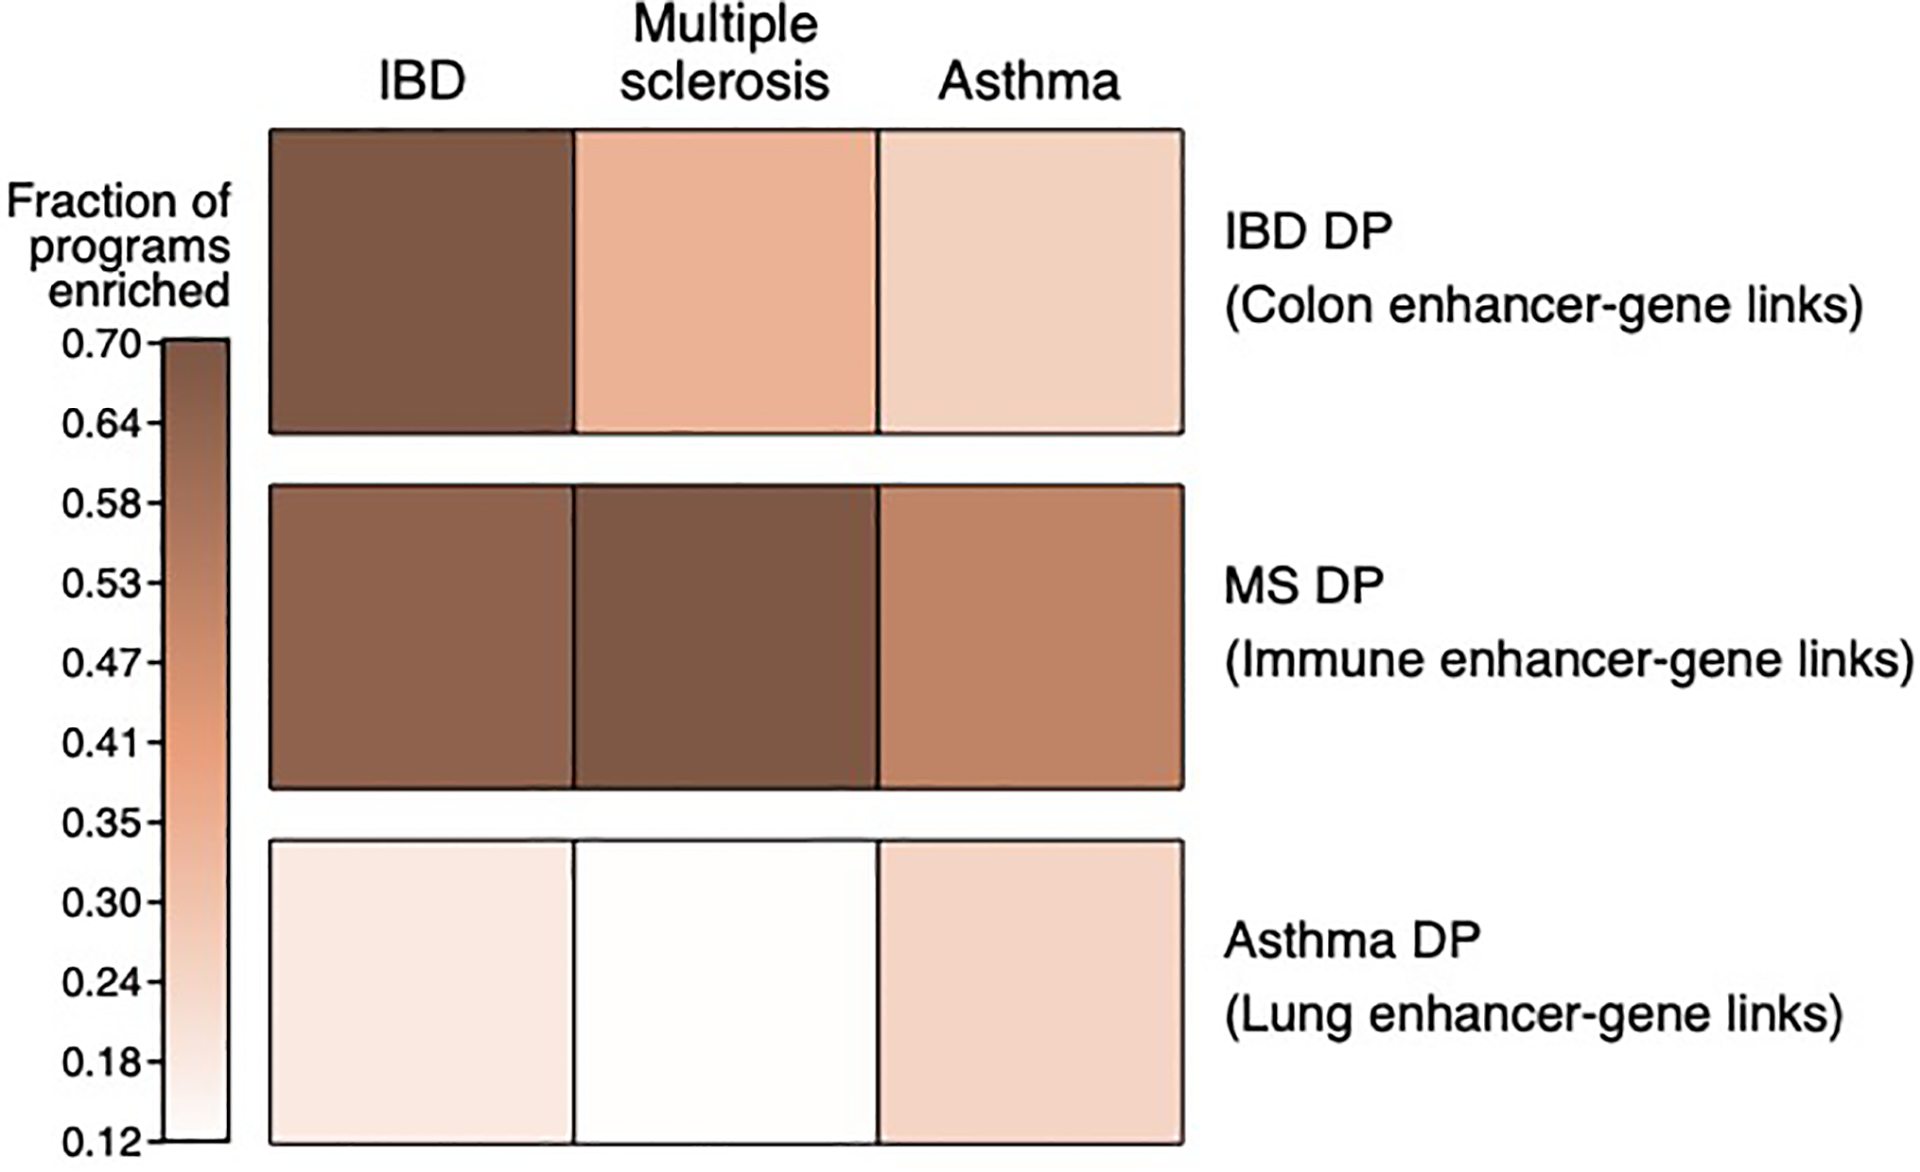
Proportion of disease-dependent programs with a −log10(P-value) of enrichment score (p.E-score) > 3 in IBD, MS and asthma GWAS summary statistics (column) for disease-dependent programs from IBD, MS and asthma (columns), when combined with tissue-specific Roadmap∪ABC (row).
Extended Data Fig. 9. Analysis of disease-dependent programs using alternative Roadmap∪ABC enhancer-gene linking strategies.
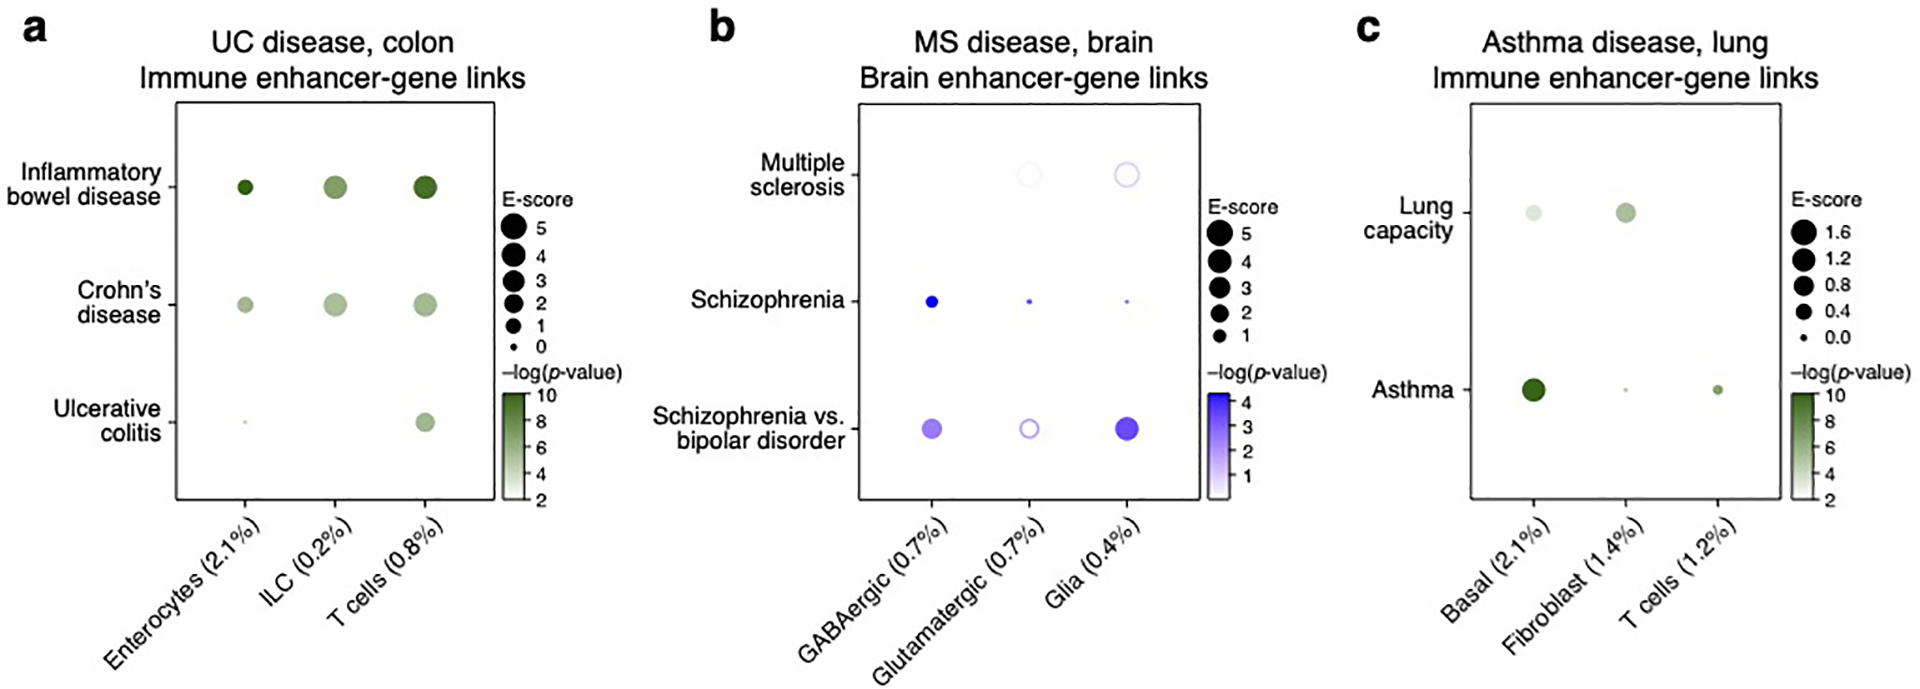
Magnitude (E-score, dot size) and significance (−log10(P-value), dot color) of the heritability enrichment of disease-dependent programs (columns) in UC (colon cells) using Roadmap∪ABC-immune (a), asthma (lung cells) using Roadmap∪ABC-immune (b), and MS (brain cells) using Roadmap∪ABC-brain (c). Details for all traits analyzed are in Supplementary Table 2.
Extended Data Fig. 10. Analysis of disease-dependent programs across all tissues and traits.
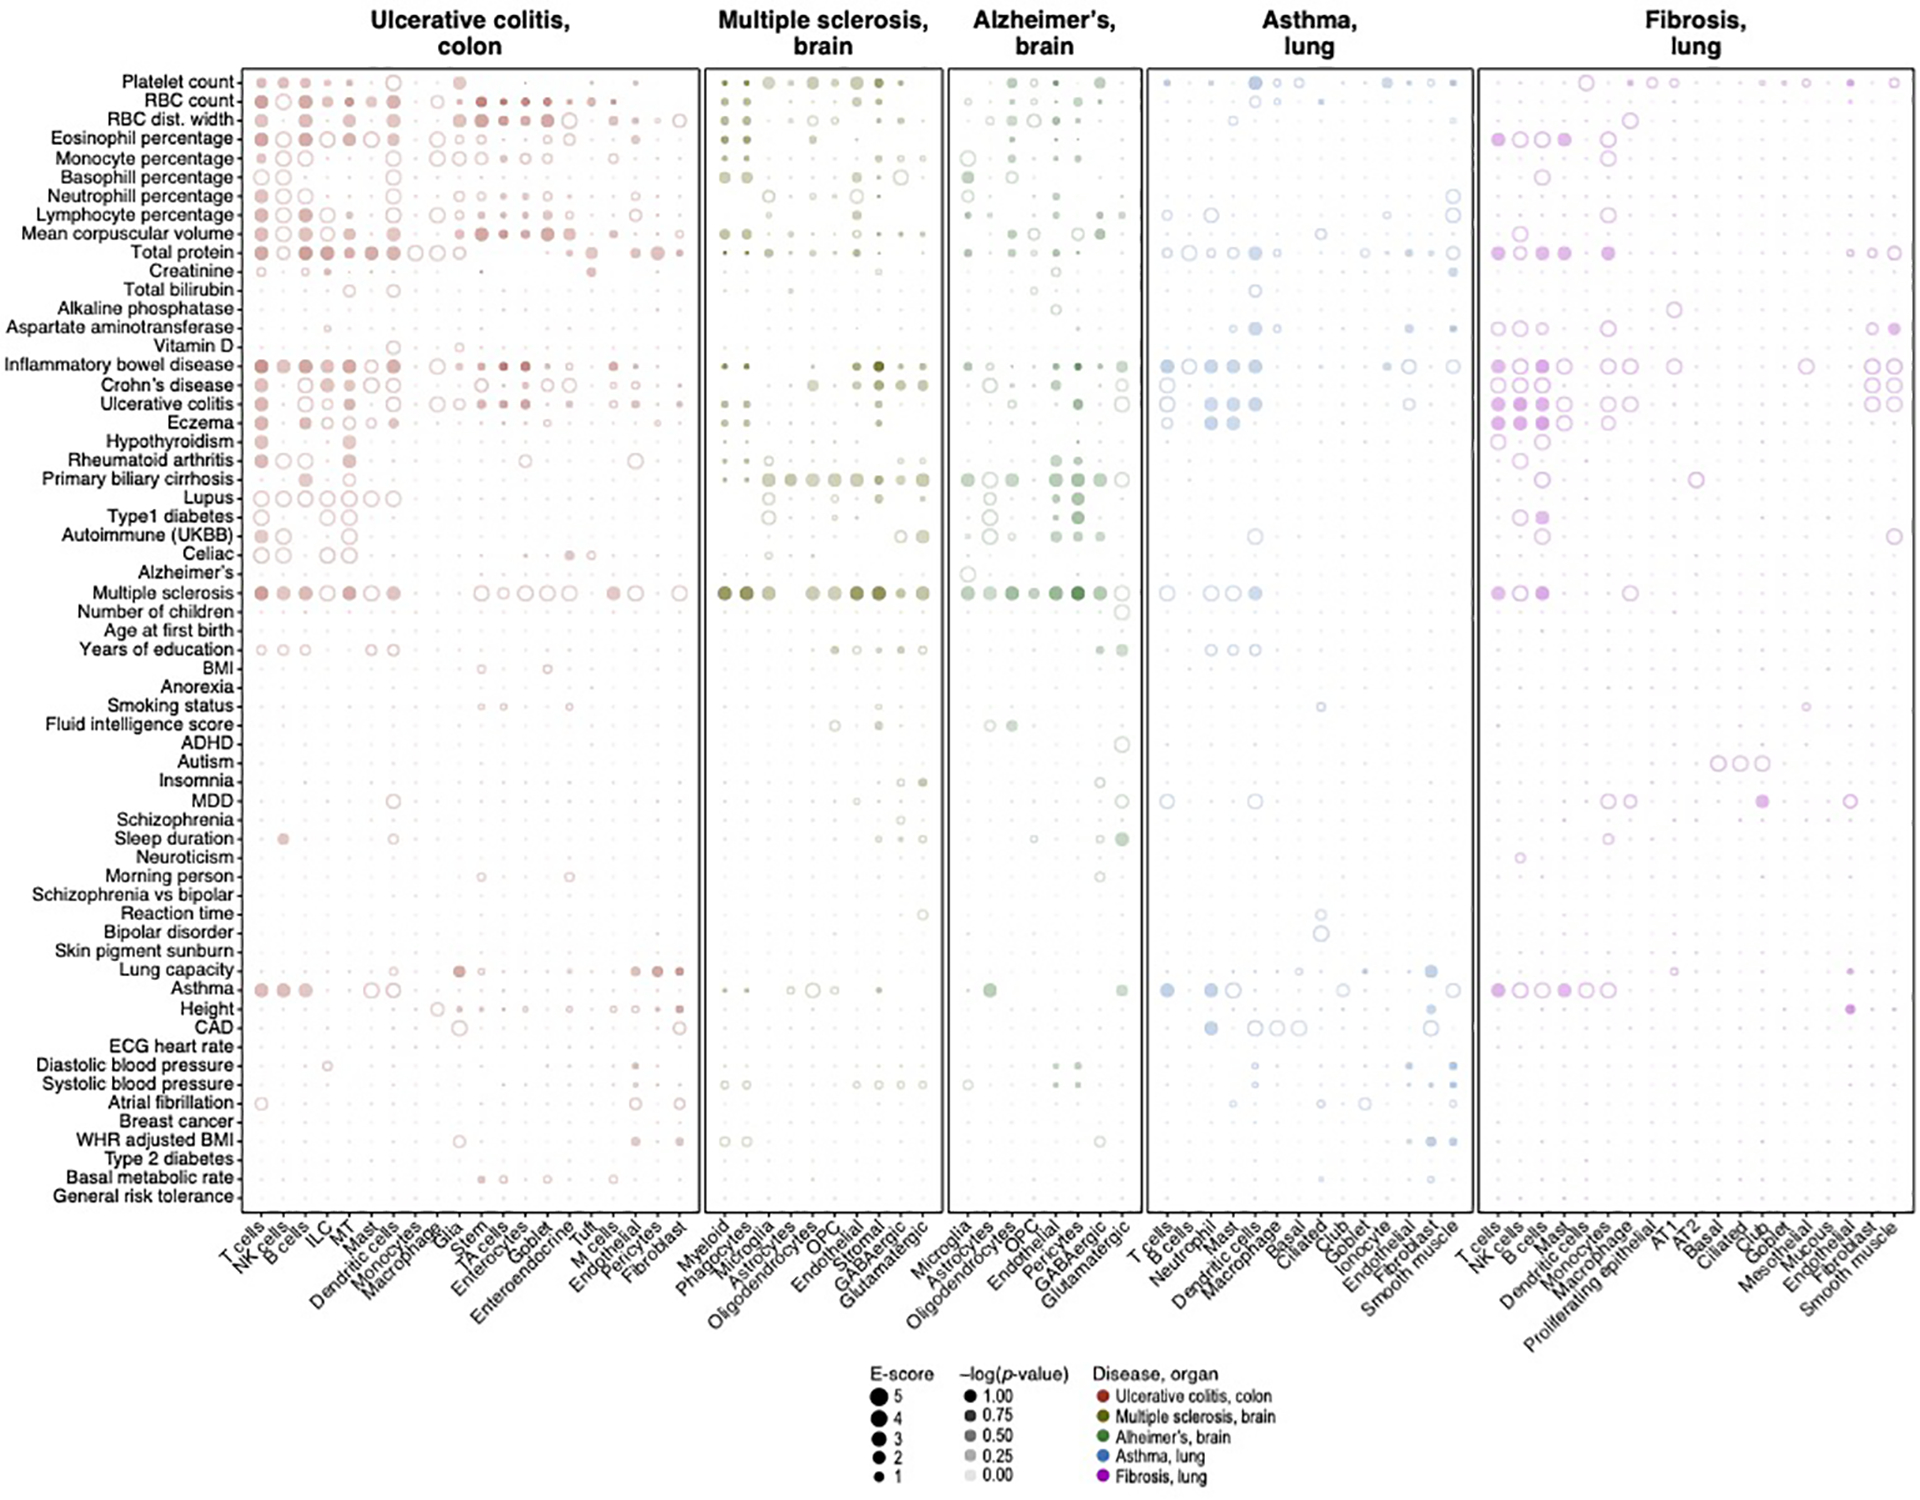
Magnitude (E-score, dot size) and significance (−log10(P-value), dot color) of the heritability enrichment of disease-dependent programs (columns) from UC, MS, Alzheimer’s, asthma and pulmonary fibrosis (labels on top, color code, legend), for GWAS summary statistics of diverse traits and diseases (rows), based on the Roadmap∪ABC enhancer-gene linking strategy for the corresponding tissue. Details for all traits analyzed are in Supplementary Table 2. See Data Availability for higher resolution version of this figure.
Supplementary Material
ACKNOWLEDGMENTS:
We thank Leslie Gaffney for assistance with preparing figures as well as Sijia Chen, Chris Smillie, Basak Eraslan, Alok Jaiswal, and the entire Price and Regev groups for helpful scientific discussions.
Funding:
This work was funded through NIH F32 Fellowship (K.A.J), NIH grants U01 HG009379, R01 MH101244, R37 MH107649, R01 HG006399, R01 MH115676 and R01 MH109978 (A.L.P), and Klarman Cell Observatory, HHMI, the Manton Foundation and NIH grant 5U24AI118672 (A.R.). The funders had no role in study design, data collection and analysis, decision to publish or preparation of the manuscript.
Footnotes
COMPETING INTERESTS
A.R. is a co-founder and equity holder of Celsius Therapeutics, an equity holder in Immunitas, and was an SAB member of ThermoFisher Scientific, Syros Pharmaceuticals, Neogene Therapeutics and Asimov. From August 1, 2020, A.R. is an employee of Genentech. The remaining authors declare no competing interests.
DATA AVAILABILITY
All postprocessed scRNA-seq data (except for Alzheimer’s disease; see below) are available through the original publications with PMIDs: 28091601, 33208946, 31316211, 31097668, 31042697, 31348891, 32832598, 31209336, 31604275, 33654293, 32403949, 30355494. Additionally, gene programs, enhancer-gene linking annotations, supplementary data files and high-resolution figures are publicly available online at https://data.broadinstitute.org/alkesgroup/LDSCORE/Jagadeesh_Dey_sclinker. The Alzheimer’s disease scRNA-seq data8 is available exclusively at https://www.radc.rush.edu/docs/omics.htm per its data usage terms. This work used summary statistics from the UK Biobank study (http://www.ukbiobank.ac.uk/). The summary statistics for UK Biobank used in this paper are available at https://data.broadinstitute.org/alkesgroup/UKBB/. The 1000 Genomes Project Phase 3 data are available at ftp://ftp.1000genomes.ebi.ac.uk/vol1/ftp/release/2013050. The baseline-LD annotations are available at https://data.broadinstitute.org/alkesgroup/LDSCORE/. We provide a web interface to visualize the enrichment results for different programs used in our analysis at: https://share.streamlit.io/karthikj89/scgenetics/www/scgwas.py.
CODE AVAILABILITY
This work uses the S-LDSC software (https://github.com/bulik/ldsc) to process GWAS summary statistics as well as S-LDSC software and MAGMA v1.08 (https://ctg.cncr.nl/software/magma) for post-hoc analysis. Code for constructing cell type, disease-dependent and cellular process gene programs from scRNA-seq data and performing the healthy and disease shared NMF can be found at https://github.com/karthikj89/scgenetics (DOI 10.5281/zenodo.6516048)38. Code for processing gene programs and combining with enhancer-gene links can be found at https://github.com/kkdey/GSSG (DOI 10.5281/zenodo.6513166)39.
REFERENCES
- 1.Consortium, S. W. G. of the P. G. et al. Biological Insights From 108 Schizophrenia-Associated Genetic Loci. Nature 511, 421 (2014). [DOI] [PMC free article] [PubMed] [Google Scholar]
- 2.Visscher PM et al. 10 Years of GWAS Discovery: Biology, Function, and Translation. Am. J. Hum. Genet 101, 5 (2017). [DOI] [PMC free article] [PubMed] [Google Scholar]
- 3.Buniello A et al. The NHGRI-EBI GWAS Catalog of published genome-wide association studies, targeted arrays and summary statistics 2019. Nucleic Acids Res. 47, D1005–D1012 (2019). [DOI] [PMC free article] [PubMed] [Google Scholar]
- 4.Maurano MT et al. Systematic Localization of Common Disease-Associated Variation in Regulatory DNA. Science 337, 1190 (2012). [DOI] [PMC free article] [PubMed] [Google Scholar]
- 5.Price AL, Spencer CCA & Donnelly P Progress and promise in understanding the genetic basis of common diseases. Proc. R. Soc. B Biol. Sci 282, (2015). [DOI] [PMC free article] [PubMed] [Google Scholar]
- 6.Shendure J, Findlay GM & Snyder MW Genomic medicine -- progress, pitfalls, and promise. Cell 177, 45–57 (2019). [DOI] [PMC free article] [PubMed] [Google Scholar]
- 7.Zeggini E, Gloyn AL, Barton AC & Wain LV Translational genomics and precision medicine: Moving from the lab to the clinic. Science 365, 1409–1413 (2019). [DOI] [PubMed] [Google Scholar]
- 8.Hekselman I & Yeger-Lotem E Mechanisms of tissue and cell-type specificity in heritable traits and diseases. Nat. Rev. Genet 21, 137–150 (2020). [DOI] [PubMed] [Google Scholar]
- 9.Trynka G et al. Chromatin marks identify critical cell types for fine mapping complex trait variants. Nat. Genet 45, (2013). [DOI] [PMC free article] [PubMed] [Google Scholar]
- 10.Pickrell JK Joint Analysis of Functional Genomic Data and Genome-wide Association Studies of 18 Human Traits. Am. J. Hum. Genet 95, 126 (2014). [DOI] [PMC free article] [PubMed] [Google Scholar]
- 11.Finucane HK et al. Partitioning heritability by functional annotation using genome-wide association summary statistics. Nat. Genet 47, 1228 (2015). [DOI] [PMC free article] [PubMed] [Google Scholar]
- 12.Zhou J et al. Deep learning sequence-based ab initio prediction of variant effects on expression and disease risk. Nat. Genet 50, 1171–1179 (2018). [DOI] [PMC free article] [PubMed] [Google Scholar]
- 13.Zhu X & Stephens M Large-scale genome-wide enrichment analyses identify new trait-associated genes and pathways across 31 human phenotypes. Nat. Commun 9, (2018). [DOI] [PMC free article] [PubMed] [Google Scholar]
- 14.Wang Q et al. A Bayesian framework that integrates multi-omics data and gene networks predicts risk genes from schizophrenia GWAS data. Nat. Neurosci 22, 691 (2019). [DOI] [PMC free article] [PubMed] [Google Scholar]
- 15.Fang H et al. A genetics-led approach defines the drug target landscape of 30 immune-related traits. Nat. Genet 51, 1082 (2019). [DOI] [PMC free article] [PubMed] [Google Scholar]
- 16.Calderon D et al. Inferring Relevant Cell Types for Complex Traits by Using Single-Cell Gene Expression. Am. J. Hum. Genet 101, 686 (2017). [DOI] [PMC free article] [PubMed] [Google Scholar]
- 17.Ongen H et al. Estimating the causal tissues for complex traits and diseases. Nat. Genet 49, 1676–1683 (2017). [DOI] [PubMed] [Google Scholar]
- 18.Finucane HK et al. Heritability enrichment of specifically expressed genes identifies disease-relevant tissues and cell types. Nat. Genet 50, 621 (2018). [DOI] [PMC free article] [PubMed] [Google Scholar]
- 19.Ernst J et al. Systematic analysis of chromatin state dynamics in nine human cell types. Nature 473, 43 (2011). [DOI] [PMC free article] [PubMed] [Google Scholar]
- 20.Roadmap Epigenomics Consortium et al. Integrative analysis of 111 reference human epigenomes. Nature 518, 317–330 (2015). [DOI] [PMC free article] [PubMed] [Google Scholar]
- 21.Liu Y, Sarkar A, Kheradpour P, Ernst J & Kellis M Evidence of reduced recombination rate in human regulatory domains. Genome Biol. 18, 193 (2017). [DOI] [PMC free article] [PubMed] [Google Scholar]
- 22.Fulco CP et al. Activity-by-Contact model of enhancer-promoter regulation from thousands of CRISPR perturbations. Nat. Genet 51, 1664 (2019). [DOI] [PMC free article] [PubMed] [Google Scholar]
- 23.Nasser J et al. Genome-wide enhancer maps link risk variants to disease genes. Nature 593, 238–243 (2021). [DOI] [PMC free article] [PubMed] [Google Scholar]
- 24.Tanay A & Regev A Scaling single-cell genomics from phenomenology to mechanism. Nature 541, 331–338 (2017). [DOI] [PMC free article] [PubMed] [Google Scholar]
- 25.Tucker N et al. Transcriptional and Cellular Diversity of the Human Heart. Circulation (2020) doi: 10.1161/CIRCULATIONAHA.119.045401. [DOI] [PMC free article] [PubMed] [Google Scholar]
- 26.Travaglini KJ et al. A molecular cell atlas of the human lung from single cell RNA sequencing. bioRxiv 742320 (2020) doi: 10.1101/742320. [DOI] [PMC free article] [PubMed] [Google Scholar]
- 27.Kowalczyk MS Census of Immune Cells (Human Cell Atlas; ). https://data.humancellatlas.org/explore/projects/cc95ff89-2e68-4a08-a234-480eca21ce79. (2018). [Google Scholar]
- 28.Sunkin SM et al. Allen Brain Atlas: an integrated spatio-temporal portal for exploring the central nervous system. Nucleic Acids Res. 41, D996 (2013). [DOI] [PMC free article] [PubMed] [Google Scholar]
- 29.Habermann AC et al. Single-cell RNA sequencing reveals profibrotic roles of distinct epithelial and mesenchymal lineages in pulmonary fibrosis. Sci. Adv 6, (2020). [DOI] [PMC free article] [PubMed] [Google Scholar]
- 30.Mathys H et al. Single-cell transcriptomic analysis of Alzheimer’s disease. Nature 570, 332 (2019). [DOI] [PMC free article] [PubMed] [Google Scholar]
- 31.Jerby-Arnon L et al. A Cancer Cell Program Promotes T Cell Exclusion and Resistance to Checkpoint Blockade. Cell 175, 984–997.e24 (2018). [DOI] [PMC free article] [PubMed] [Google Scholar]
- 32.Montoro DT et al. A revised airway epithelial hierarchy includes CFTR-expressing ionocytes. Nature 560, 319–324 (2018). [DOI] [PMC free article] [PubMed] [Google Scholar]
- 33.Peng Y-R et al. Molecular Classification and Comparative Taxonomics of Foveal and Peripheral Cells in Primate Retina. Cell 176, 1222–1237.e22 (2019). [DOI] [PMC free article] [PubMed] [Google Scholar]
- 34.Smillie CS et al. Intra- and Inter-cellular Rewiring of the Human Colon during Ulcerative Colitis. Cell 178, 714–730.e22 (2019). [DOI] [PMC free article] [PubMed] [Google Scholar]
- 35.Watanabe K, Umićević Mirkov M, de Leeuw CA, van den Heuvel MP & Posthuma D Genetic mapping of cell type specificity for complex traits. Nat. Commun 10, 3222 (2019). [DOI] [PMC free article] [PubMed] [Google Scholar]
- 36.Bryois J et al. Genetic identification of cell types underlying brain complex traits yields insights into the etiology of Parkinson’s disease. Nat. Genet 52, 482–493 (2020). [DOI] [PMC free article] [PubMed] [Google Scholar]
- 37.Corces MR et al. Single-cell epigenomic analyses implicate candidate causal variants at inherited risk loci for Alzheimer’s and Parkinson’s diseases. Nat. Genet 52, 1158–1168 (2020). [DOI] [PMC free article] [PubMed] [Google Scholar]
- 38.Drokhlyansky E et al. The Human and Mouse Enteric Nervous System at Single-Cell Resolution. Cell 182, 1606–1622.e23 (2020). [DOI] [PMC free article] [PubMed] [Google Scholar]
- 39.Leeuw C. A. de, Mooij JM, Heskes T & Posthuma D MAGMA: Generalized Gene-Set Analysis of GWAS Data. PLOS Comput. Biol 11, e1004219 (2015). [DOI] [PMC free article] [PubMed] [Google Scholar]
- 40.Gazal S et al. Linkage disequilibrium dependent architecture of human complex traits shows action of negative selection. Nat. Genet 49, 1421 (2017). [DOI] [PMC free article] [PubMed] [Google Scholar]
- 41.Gazal S, Marquez-Luna C, Finucane HK & Price AL Reconciling S-LDSC and LDAK functional enrichment estimates. Nat. Genet 51, 1202 (2019). [DOI] [PMC free article] [PubMed] [Google Scholar]
- 42.Zheng GXY et al. Massively parallel digital transcriptional profiling of single cells. Nat. Commun 8, (2017). [DOI] [PMC free article] [PubMed] [Google Scholar]
- 43.Stewart BJ et al. Spatio-temporal immune zonation of the human kidney. Science 365, 1461 (2019). [DOI] [PMC free article] [PubMed] [Google Scholar]
- 44.Muus C et al. Integrated analyses of single-cell atlases reveal age, gender, and smoking status associations with cell type-specific expression of mediators of SARS-CoV-2 viral entry and highlights inflammatory programs in putative target cells. bioRxiv 2020.04.19.049254 (2020) doi: 10.1101/2020.04.19.049254. [DOI] [Google Scholar]
- 45.Cheng JB et al. Transcriptional Programming of Normal and Inflamed Human Epidermis at Single-Cell Resolution. Cell Rep. 25, 871 (2018). [DOI] [PMC free article] [PubMed] [Google Scholar]
- 46.Schirmer L et al. Neuronal vulnerability and multilineage diversity in multiple sclerosis. Nature 573, 75 (2019). [DOI] [PMC free article] [PubMed] [Google Scholar]
- 47.Braga F et al. A cellular census of human lungs identifies novel cell states in health and in asthma. Nat. Med 25, (2019). [DOI] [PubMed] [Google Scholar]
- 48.Liao M et al. Single-cell landscape of bronchoalveolar immune cells in patients with COVID-19. Nat. Med 26, 842–844 (2020). [DOI] [PubMed] [Google Scholar]
- 49.Ulirsch JC et al. Interrogation of human hematopoiesis at single-cell and single-variant resolution. Nat. Genet 51, 683–693 (2019). [DOI] [PMC free article] [PubMed] [Google Scholar]
- 50.Chen M-H et al. Trans-ethnic and Ancestry-Specific Blood-Cell Genetics in 746,667 Individuals from 5 Global Populations. Cell 182, 1198–1213.e14 (2020). [DOI] [PMC free article] [PubMed] [Google Scholar]
- 51.Biedermann T, Skabytska Y, Kaesler S & Volz T Regulation of T Cell Immunity in Atopic Dermatitis by Microbes: The Yin and Yang of Cutaneous Inflammation. Front. Immunol 6, (2015). [DOI] [PMC free article] [PubMed] [Google Scholar]
- 52.Hennino A et al. Skin-Infiltrating CD8+ T Cells Initiate Atopic Dermatitis Lesions. J. Immunol 178, 5571–5577 (2007). [DOI] [PubMed] [Google Scholar]
- 53.Thériault P, ElAli A & Rivest S The dynamics of monocytes and microglia in Alzheimer’s disease. Alzheimers Res. Ther 7, (2015). [DOI] [PMC free article] [PubMed] [Google Scholar]
- 54.Nuyts AH, Lee WP, Bashir-Dar R, Berneman ZN & Cools N Dendritic cells in multiple sclerosis: key players in the immunopathogenesis, key players for new cellular immunotherapies? Mult. Scler. Houndmills Basingstoke Engl 19, 995–1002 (2013). [DOI] [PubMed] [Google Scholar]
- 55.Haschka D et al. Expansion of Neutrophils and Classical and Nonclassical Monocytes as a Hallmark in Relapsing-Remitting Multiple Sclerosis. Front. Immunol 11, 594 (2020). [DOI] [PMC free article] [PubMed] [Google Scholar]
- 56.Momeni A et al. Fingolimod and changes in hematocrit, hemoglobin and red blood cells of patients with multiple sclerosis. Am. J. Clin. Exp. Immunol 8, 27–31 (2019). [PMC free article] [PubMed] [Google Scholar] [Retracted]
- 57.Yeung M et al. Characterisation of mucosal lymphoid aggregates in ulcerative colitis: immune cell phenotype and TcR-γδ expression. Gut 47, 215–227 (2000). [DOI] [PMC free article] [PubMed] [Google Scholar]
- 58.Mouly E et al. The Ets-1 transcription factor controls the development and function of natural regulatory T cells. J. Exp. Med 207, 2113 (2010). [DOI] [PMC free article] [PubMed] [Google Scholar]
- 59.Mayassi T et al. Chronic Inflammation Permanently Reshapes Tissue-Resident Immunity in Celiac Disease. Cell 176, 967–981.e19 (2019). [DOI] [PMC free article] [PubMed] [Google Scholar]
- 60.Pandey A et al. Cloning of a receptor subunit required for signaling by thymic stromal lymphopoietin. Nat. Immunol 1, 59–64 (2000). [DOI] [PubMed] [Google Scholar]
- 61.Gao P-S et al. Genetic Variants in TSLP are Associated with Atopic Dermatitis and Eczema Herpeticum. J. Allergy Clin. Immunol 125, 1403–1407.e4 (2010). [DOI] [PMC free article] [PubMed] [Google Scholar]
- 62.Altin JA et al. Ndfip1 mediates peripheral tolerance to self and exogenous antigen by inducing cell cycle exit in responding CD4+ T cells. Proc. Natl. Acad. Sci 111, 2067–2074 (2014). [DOI] [PMC free article] [PubMed] [Google Scholar]
- 63.Yip KH et al. The Nedd4-2/Ndfip1 axis is a negative regulator of IgE-mediated mast cell activation. Nat. Commun 7, (2016). [DOI] [PMC free article] [PubMed] [Google Scholar]
- 64.Villegas-Llerena C, Phillips A, Garcia-Reitboeck P, Hardy J & Pocock JM Microglial genes regulating neuroinflammation in the progression of Alzheimer’s disease. Curr. Opin. Neurobiol 36, 74–81 (2016). [DOI] [PubMed] [Google Scholar]
- 65.Efthymiou AG & Goate AM Late onset Alzheimer’s disease genetics implicates microglial pathways in disease risk. Mol. Neurodegener 12, (2017). [DOI] [PMC free article] [PubMed] [Google Scholar]
- 66.Luscher B, Shen Q & Sahir N The GABAergic Deficit Hypothesis of Major Depressive Disorder. Mol. Psychiatry 16, 383–406 (2011). [DOI] [PMC free article] [PubMed] [Google Scholar]
- 67.Mossakowska-Wójcik J, A O, M T, J S & P G The importance of TCF4 gene in the etiology of recurrent depressive disorders. Prog. Neuropsychopharmacol. Biol. Psychiatry 80, (2018). [DOI] [PubMed] [Google Scholar]
- 68.Li L et al. Disruption of TCF4 regulatory networks leads to abnormal cortical development and mental disabilities. Mol. Psychiatry 24, (2019). [DOI] [PMC free article] [PubMed] [Google Scholar]
- 69.Mbarek H et al. Genome-Wide Significance for PCLO as a Gene for Major Depressive Disorder. Twin Res. Hum. Genet. Off. J. Int. Soc. Twin Stud 20, (2017). [DOI] [PubMed] [Google Scholar]
- 70.Ciarimboli G et al. Proximal Tubular Secretion of Creatinine by Organic Cation Transporter OCT2 in Cancer Patients. Clin. Cancer Res 18, 1101 (2012). [DOI] [PMC free article] [PubMed] [Google Scholar]
- 71.Zhang X et al. Tubular secretion of creatinine and kidney function: an observational study. BMC Nephrol. 21, (2020). [DOI] [PMC free article] [PubMed] [Google Scholar]
- 72.Cui C, J K, I L, U B & D K Hepatic uptake of bilirubin and its conjugates by the human organic anion transporter SLC21A6. J. Biol. Chem 276, (2001). [DOI] [PubMed] [Google Scholar]
- 73.Wang X, Chowdhury JR & Chowdhury NR Bilirubin metabolism: Applied physiology. Curr. Paediatr 16, 70–74 (2006). [Google Scholar]
- 74.Barth AS & Tomaselli GF Cardiac metabolism and arrhythmias. Circ. Arrhythm. Electrophysiol 2, 327–335 (2009). [DOI] [PMC free article] [PubMed] [Google Scholar]
- 75.Yamazaki T & Mukouyama Y Tissue Specific Origin, Development, and Pathological Perspectives of Pericytes. Front. Cardiovasc. Med 5, (2018). [DOI] [PMC free article] [PubMed] [Google Scholar]
- 76.Deckers J, Hammad H & Hoste E Langerhans Cells: Sensing the Environment in Health and Disease. Front. Immunol 9, (2018). [DOI] [PMC free article] [PubMed] [Google Scholar]
- 77.Hsieh KH, Chou CC & Huang SF Interleukin 2 therapy in severe atopic dermatitis. J. Clin. Immunol 11, 22–28 (1991). [DOI] [PubMed] [Google Scholar]
- 78.Kuleshov MV et al. Enrichr: a comprehensive gene set enrichment analysis web server 2016 update. Nucleic Acids Res. 44, W90–97 (2016). [DOI] [PMC free article] [PubMed] [Google Scholar]
- 79.Attie AD & Scherer PE Adipocyte metabolism and obesity. J. Lipid Res 50, S395–S399 (2009). [DOI] [PMC free article] [PubMed] [Google Scholar]
- 80.Heneka MT An immune-cell signature marks the brain in Alzheimer’s disease. Nature 577, 322–323 (2020). [DOI] [PubMed] [Google Scholar]
- 81.Rossi S et al. Inflammation inhibits GABA transmission in multiple sclerosis. Mult. Scler. Houndmills Basingstoke Engl 18, 1633–1635 (2012). [DOI] [PubMed] [Google Scholar]
- 82.Cannella B et al. The neuregulin, glial growth factor 2, diminishes autoimmune demyelination and enhances remyelination in a chronic relapsing model for multiple sclerosis. Proc. Natl. Acad. Sci. U. S. A 95, 10100–10105 (1998). [DOI] [PMC free article] [PubMed] [Google Scholar]
- 83.Horstmann L et al. Inflammatory demyelination induces glia alterations and ganglion cell loss in the retina of an experimental autoimmune encephalomyelitis model. J. Neuroinflammation 10, 120 (2013). [DOI] [PMC free article] [PubMed] [Google Scholar]
- 84.Healy LM et al. MerTK-mediated regulation of myelin phagocytosis by macrophages generated from patients with MS. Neurol. Neuroimmunol. Neuroinflammation 4, (2017). [DOI] [PMC free article] [PubMed] [Google Scholar]
- 85.Cignarella F et al. TREM2 activation on microglia promotes myelin debris clearance and remyelination in a model of multiple sclerosis. Acta Neuropathol. (Berl.) 140, 513–534 (2020). [DOI] [PMC free article] [PubMed] [Google Scholar]
- 86.Hemonnot A-L, Hua J, Ulmann L & Hirbec H Microglia in Alzheimer Disease: Well-Known Targets and New Opportunities. Front. Aging Neurosci 11, (2019). [DOI] [PMC free article] [PubMed] [Google Scholar]
- 87.Cromer WE, Mathis JM, Granger DN, Chaitanya GV & Alexander JS Role of the endothelium in inflammatory bowel diseases. World J. Gastroenterol. WJG 17, 578–593 (2011). [DOI] [PMC free article] [PubMed] [Google Scholar]
- 88.Ruder B, Atreya R & Becker C Tumour Necrosis Factor Alpha in Intestinal Homeostasis and Gut Related Diseases. Int. J. Mol. Sci 20, (2019). [DOI] [PMC free article] [PubMed] [Google Scholar]
- 89.Graham DB & Xavier RJ Pathway paradigms revealed from the genetics of inflammatory bowel disease. Nature 578, 527–539 (2020). [DOI] [PMC free article] [PubMed] [Google Scholar]
- 90.Bianco AM, Girardelli M & Tommasini A Genetics of inflammatory bowel disease from multifactorial to monogenic forms. World J. Gastroenterol 21, 12296–12310 (2015). [DOI] [PMC free article] [PubMed] [Google Scholar]
- 91.Dixit A et al. Perturb-seq: Dissecting molecular circuits with scalable single cell RNA profiling of pooled genetic screens. Cell 167, 1853–1866.e17 (2016). [DOI] [PMC free article] [PubMed] [Google Scholar]
- 92.Jin X et al. In vivo Perturb-Seq reveals neuronal and glial abnormalities associated with autism risk genes. Science 370, (2020). [DOI] [PMC free article] [PubMed] [Google Scholar]
- 1.Travaglini KJ et al. A molecular cell atlas of the human lung from single cell RNA sequencing. bioRxiv 742320 (2020) doi: 10.1101/742320. [DOI] [PMC free article] [PubMed] [Google Scholar]
- 2.Zheng GXY et al. Massively parallel digital transcriptional profiling of single cells. Nat. Commun 8, (2017). [DOI] [PMC free article] [PubMed] [Google Scholar]
- 3.Kowalczyk MS Census of Immune Cells (Human Cell Atlas; ). https://data.humancellatlas.org/explore/projects/cc95ff89-2e68-4a08-a234-480eca21ce79. (2018). [Google Scholar]
- 4.Sunkin SM et al. Allen Brain Atlas: an integrated spatio-temporal portal for exploring the central nervous system. Nucleic Acids Res. 41, D996 (2013). [DOI] [PMC free article] [PubMed] [Google Scholar]
- 5.Stewart BJ et al. Spatio-temporal immune zonation of the human kidney. Science 365, 1461 (2019). [DOI] [PMC free article] [PubMed] [Google Scholar]
- 6.Muus C et al. Integrated analyses of single-cell atlases reveal age, gender, and smoking status associations with cell type-specific expression of mediators of SARS-CoV-2 viral entry and highlights inflammatory programs in putative target cells. bioRxiv 2020.04.19.049254 (2020) doi: 10.1101/2020.04.19.049254. [DOI] [Google Scholar]
- 7.Schirmer L et al. Neuronal vulnerability and multilineage diversity in multiple sclerosis. Nature 573, 75 (2019). [DOI] [PMC free article] [PubMed] [Google Scholar]
- 8.Mathys H et al. Single-cell transcriptomic analysis of Alzheimer’s disease. Nature 570, 332 (2019). [DOI] [PMC free article] [PubMed] [Google Scholar]
- 9.Smillie CS et al. Intra- and Inter-cellular Rewiring of the Human Colon during Ulcerative Colitis. Cell 178, 714–730.e22 (2019). [DOI] [PMC free article] [PubMed] [Google Scholar]
- 10.Habermann AC et al. Single-cell RNA sequencing reveals profibrotic roles of distinct epithelial and mesenchymal lineages in pulmonary fibrosis. Sci. Adv 6, (2020). [DOI] [PMC free article] [PubMed] [Google Scholar]
- 11.Tucker N et al. Transcriptional and Cellular Diversity of the Human Heart. Circulation (2020) doi: 10.1161/CIRCULATIONAHA.119.045401. [DOI] [PMC free article] [PubMed] [Google Scholar]
- 12.Braga F et al. A cellular census of human lungs identifies novel cell states in health and in asthma. Nat. Med 25, (2019). [DOI] [PubMed] [Google Scholar]
- 13.Liao M et al. Single-cell landscape of bronchoalveolar immune cells in patients with COVID-19. Nat. Med 26, 842–844 (2020). [DOI] [PubMed] [Google Scholar]
- 14.Cheng JB et al. Transcriptional Programming of Normal and Inflamed Human Epidermis at Single-Cell Resolution. Cell Rep. 25, 871 (2018). [DOI] [PMC free article] [PubMed] [Google Scholar]
- 15.Wolf FA, Angerer P & Theis FJ SCANPY: large-scale single-cell gene expression data analysis. Genome Biol. 19, 15 (2018). [DOI] [PMC free article] [PubMed] [Google Scholar]
- 16.Korsunsky I et al. Fast, sensitive and accurate integration of single-cell data with Harmony. Nat. Methods 16, 1289–1296 (2019). [DOI] [PMC free article] [PubMed] [Google Scholar]
- 17.Traag VA, Waltman L & van Eck NJ From Louvain to Leiden: guaranteeing well-connected communities. Sci. Rep 9, 5233 (2019). [DOI] [PMC free article] [PubMed] [Google Scholar]
- 18.McInnes L, Healy J & Melville J UMAP: Uniform Manifold Approximation and Projection for Dimension Reduction. ArXiv180203426 Cs Stat (2020). [Google Scholar]
- 19.Fang H et al. A genetics-led approach defines the drug target landscape of 30 immune-related traits. Nat. Genet 51, 1082 (2019). [DOI] [PMC free article] [PubMed] [Google Scholar]
- 20.Lee DD & Seung HS Algorithms for non-negative matrix factorization. in Proceedings of the 13th International Conference on Neural Information Processing Systems 535–541 (MIT Press, 2000). [Google Scholar]
- 21.Auton A et al. A global reference for human genetic variation. Nature 526, 68–74 (2015). [DOI] [PMC free article] [PubMed] [Google Scholar]
- 22.Liu Y, Sarkar A, Kheradpour P, Ernst J & Kellis M Evidence of reduced recombination rate in human regulatory domains. Genome Biol. 18, 193 (2017). [DOI] [PMC free article] [PubMed] [Google Scholar]
- 23.Kundaje A et al. Integrative analysis of 111 reference human epigenomes. Nature 518, 317–330 (2015). [DOI] [PMC free article] [PubMed] [Google Scholar]
- 24.Fulco CP et al. Activity-by-Contact model of enhancer-promoter regulation from thousands of CRISPR perturbations. Nat. Genet 51, 1664 (2019). [DOI] [PMC free article] [PubMed] [Google Scholar]
- 25.Nasser J et al. Genome-wide maps of enhancer regulation connect risk variants to disease genes. bioRxiv 2020.09.01.278093 (2020) doi: 10.1101/2020.09.01.278093. [DOI] [Google Scholar]
- 26.Dey KK et al. Unique contribution of enhancer-driven and master-regulator genes to autoimmune disease revealed using functionally informed SNP-to-gene linking strategies. bioRxiv 2020.09.02.279059 (2020) doi: 10.1101/2020.09.02.279059. [DOI] [Google Scholar]
- 27.Finucane HK et al. Heritability enrichment of specifically expressed genes identifies disease-relevant tissues and cell types. Nat. Genet 50, 621 (2018). [DOI] [PMC free article] [PubMed] [Google Scholar]
- 28.Zhu X & Stephens M Large-scale genome-wide enrichment analyses identify new trait-associated genes and pathways across 31 human phenotypes. Nat. Commun 9, (2018). [DOI] [PMC free article] [PubMed] [Google Scholar]
- 29.Gazal S et al. Linkage disequilibrium dependent architecture of human complex traits shows action of negative selection. Nat. Genet 49, 1421 (2017). [DOI] [PMC free article] [PubMed] [Google Scholar]
- 30.Gazal S, Marquez-Luna C, Finucane HK & Price AL Reconciling S-LDSC and LDAK functional enrichment estimates. Nat. Genet 51, 1202 (2019). [DOI] [PMC free article] [PubMed] [Google Scholar]
- 31.Finucane HK et al. Partitioning heritability by functional annotation using genome-wide association summary statistics. Nat. Genet 47, 1228 (2015). [DOI] [PMC free article] [PubMed] [Google Scholar]
- 32.Hormozdiari F et al. Leveraging molecular quantitative trait loci to understand the genetic architecture of diseases and complex traits. Nat. Genet 50, 1041 (2018). [DOI] [PMC free article] [PubMed] [Google Scholar]
- 33.Storey JD The positive false discovery rate: a Bayesian interpretation and the q-value. Ann. Stat 31, 2013–2035 (2003). [Google Scholar]
- 34.van de Geijn B et al. Annotations capturing cell type-specific TF binding explain a large fraction of disease heritability. Hum. Mol. Genet 29, 1057–1067 (2020). [DOI] [PMC free article] [PubMed] [Google Scholar]
- 35.The COVID-19 Host Genetics Initiative, a global initiative to elucidate the role of host genetic factors in susceptibility and severity of the SARS-CoV-2 virus pandemic. Eur. J. Hum. Genet 1–4 (2020) doi: 10.1038/s41431-020-0636-6. [DOI] [PMC free article] [PubMed] [Google Scholar]
- 36.Ulirsch JC et al. Interrogation of human hematopoiesis at single-cell and single-variant resolution. Nat. Genet 51, 683–693 (2019). [DOI] [PMC free article] [PubMed] [Google Scholar]
- 37.Chen M-H et al. Trans-ethnic and Ancestry-Specific Blood-Cell Genetics in 746,667 Individuals from 5 Global Populations. Cell 182, 1198–1213.e14 (2020). [DOI] [PMC free article] [PubMed] [Google Scholar]
- 38.Jagadeesh K, Mohan R & Dey KK karthikj89/scgenetics: v1.0.0. (Zenodo, 2022). doi: 10.5281/zenodo.6516048. [DOI] [Google Scholar]
- 39.Dey KK kkdey/GSSG: sclinker_NatGenet. (Zenodo, 2022). doi: 10.5281/zenodo.6513166. [DOI] [Google Scholar]
Associated Data
This section collects any data citations, data availability statements, or supplementary materials included in this article.
Supplementary Materials
Data Availability Statement
All postprocessed scRNA-seq data (except for Alzheimer’s disease; see below) are available through the original publications with PMIDs: 28091601, 33208946, 31316211, 31097668, 31042697, 31348891, 32832598, 31209336, 31604275, 33654293, 32403949, 30355494. Additionally, gene programs, enhancer-gene linking annotations, supplementary data files and high-resolution figures are publicly available online at https://data.broadinstitute.org/alkesgroup/LDSCORE/Jagadeesh_Dey_sclinker. The Alzheimer’s disease scRNA-seq data8 is available exclusively at https://www.radc.rush.edu/docs/omics.htm per its data usage terms. This work used summary statistics from the UK Biobank study (http://www.ukbiobank.ac.uk/). The summary statistics for UK Biobank used in this paper are available at https://data.broadinstitute.org/alkesgroup/UKBB/. The 1000 Genomes Project Phase 3 data are available at ftp://ftp.1000genomes.ebi.ac.uk/vol1/ftp/release/2013050. The baseline-LD annotations are available at https://data.broadinstitute.org/alkesgroup/LDSCORE/. We provide a web interface to visualize the enrichment results for different programs used in our analysis at: https://share.streamlit.io/karthikj89/scgenetics/www/scgwas.py.
This work uses the S-LDSC software (https://github.com/bulik/ldsc) to process GWAS summary statistics as well as S-LDSC software and MAGMA v1.08 (https://ctg.cncr.nl/software/magma) for post-hoc analysis. Code for constructing cell type, disease-dependent and cellular process gene programs from scRNA-seq data and performing the healthy and disease shared NMF can be found at https://github.com/karthikj89/scgenetics (DOI 10.5281/zenodo.6516048)38. Code for processing gene programs and combining with enhancer-gene links can be found at https://github.com/kkdey/GSSG (DOI 10.5281/zenodo.6513166)39.


