Abstract
The sequencing of the human genome has allowed us to observe globally and in detail the arrangement of genes along the chromosomes. There are multiple lines of evidence that this arrangement is not random, both in terms of intergenic distances and orientation of neighbouring genes. We have undertaken a systematic evaluation of the spatial distribution and orientation of known genes across the human genome. We used genome level information including phylogenetic conservation, SNP density and correlation of gene expression to assess the importance of this distribution. In addition to confirming and extending known properties of the genome like the significance of gene deserts and the importance of “head to head” orientation of gene pairs in proximity, we provide significant new observations that include a smaller average size for intervals separating the 3’ ends of neighbouring genes, a correlation of gene expression across tissues for genes as far as 100 Kb apart and signatures of increasing positive selection with decreasing interval size, surprisingly relaxing for intervals smaller that ~500 bp. Further, we provide extensive graphical representations of the genome-wide data to allow for observations and comparisons beyond what we address.
Keywords: genome, gene orientation, gene expression, gene function, phylogenetic conservation
Introduction
With the sequencing of the human genome 1,2 the identification of most human genes, a goal of geneticists for many years, has become a reality. Additionally most human protein coding genes have been placed in the genome through sequence alignments and their localization and direction of transcription is known. The positioning of genes within the genome expands what we know for each gene to include the neighbouring genes and genomic context.
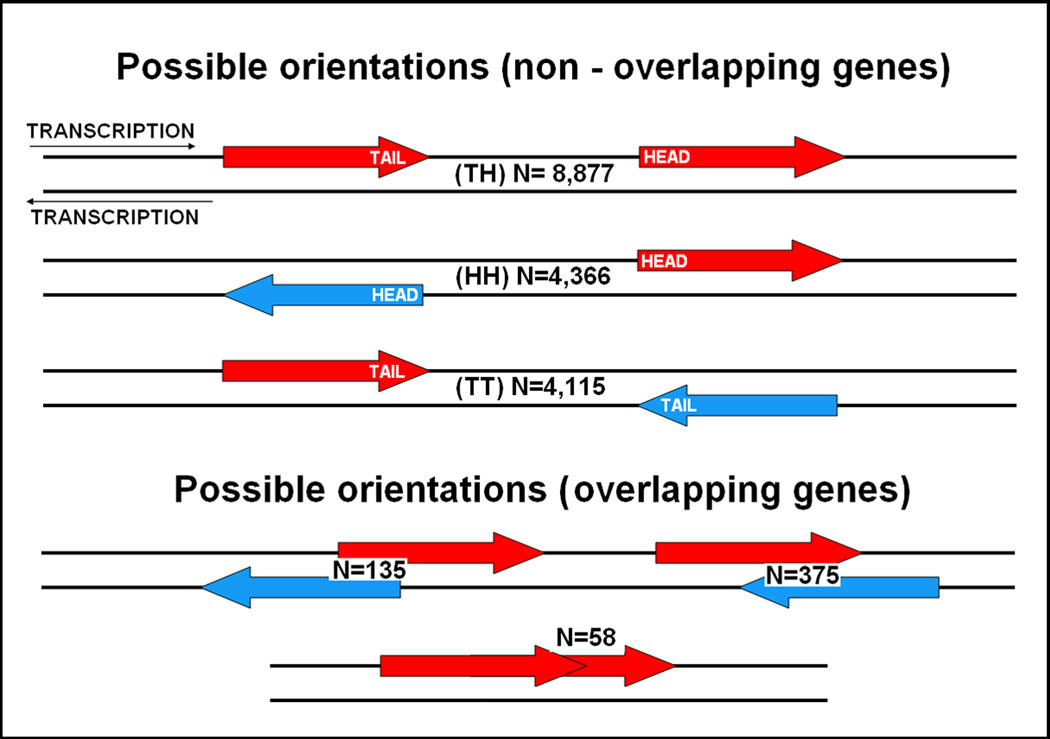
The distance and relative transcriptional direction of adjacent genes is known to be important in some organisms, but has not been studied intensively in humans. For example in prokaryotes genes are often arranged in operons, transcribed in a single transcript and thus co-regulated. Such polycistronic transcription has been described in eukaryotes yet its extent and importance remains unclear 3–5. Co-regulation of genes transcribed on opposite strands with their transcription start sites in proximity has been described in humans and the existence of common regulatory elements has been experimentally shown in some cases 6–11. The literature refers to this orientation as “Head to Head” (HH) and we will keep this nomenclature here, naming the three possible orientations as shown in Figure 1. A number of studies to date have addressed the importance of HH orientation for genes that are close to each other. Adachi et al 12 examining DNA repair genes, housekeeping genes but also a functionally unbiased set first observed that among genes that are in close proximity HH genes are more common. Trinklein et al 13 greatly expanded the number of genes studied and showed that those HH pairs also show correlated expression, that many involve shared regulatory elements and that their arrangement is conserved in the mouse genome. Koyanagi et al14 expanded the analysis to many species showing that this is a property specific to mammalian genomes. A study by Li et al15 further supported these results showing conservation of the HH arrangement, correlation of expression and similarity of function. Studies confined to other organisms have also provided interesting data. Cho et al 16 and Kruglyak et al 17 showed that adjacent genes are co regulated in yeast while Williams et al 18 showed the same in Arabidopsis Thaliana with HH genes showing higher correlations but longer average distances than TT genes. Similarly Roy et al 19 showed clustering of co expressed genes in the C. elegans. Finally, Fukuora et al 20 compared gene distance and co expression in six eukaryotes and found a correlation in all six, however with significant differences between them. In contrast to nearby HH genes little research has focused on longer intergenic distance and other orientations. Some reported work on TT oriented gene has focused in how anti-sense transcription might play a role in their regulation 21–24.
Figure 1. Possible orientations of neighboring genes.
The possible orientations of neighboring genes, how they are referred to in the text (in parenthesis) and the number of such pairs we observed in the genome are shown.
In contrast to previous work, in this study we expand the search for evidence of functional importance to all non-overlapping gene orientations and distances and study the properties of the intergenic intervals as well as the genes themselves.
Materials and Methods
Gene location data
Our primary data source was the UCSC genome database and browser (UCSC Genome Bioinformatics, http://genome.ucsc.edu, University of California, Santa Cruz) 25,26 and we used scripts written in Perl (www.perl.org) for data parsing and analysis. We used the March 2006 assembly of the human genome which was annotated at the time of data acquisition using RefSeq version 21 26. We downloaded information for all genes in RefSeq and used exon coordinates to define their locations, start and end. We excluded from the analysis all genes located entirely within other genes. For overlapping genes we searched for shared exons and if present we concatenated the genes into one. If no shared exons were identified, we analyzed each gene only in relation to its non-overlapping neighbours. Of the remaining 17,531 intergenic intervals 173 were removed from the analysis because they contained sequence gaps and/or were across centromeres, leaving us with a final set of 17,358 intervals ranging from 1 base pair to ~ 4.9Mbp. The distribution of intervals if genes were positioned at random was calculated using a random number generator to assign 17,358 random points on the total intergenic length (1.7 Mb) and examining the distribution of the distances between them in multiple iterations.
Phylogenetic conservation data
We retrieved coordinates of phylogenetically conserved elements from the UCSC Genome Browser, in a table generated by the phastcons algorithm which uses sequences from 28 species and a phylogenetic hidden Markov model to identify varying lengths of sequence likely to be conserved. 27. Using these and the intergenic interval coordinates we calculated the fraction of conserved bases for each interval, as well as separately for each half of each interval, closer to each of the neighbouring genes. The later was performed to investigate whether in TH intervals there is a difference in conservation toward the end of one gene or the beginning of the next, the latter being expected to carry more regulatory elements.
Conserved Transcription Factor Binding Sites (TFBS)
We retrieved the coordinates of predicted TFBS from 3-species (human/mouse/rat) comparisons 28 from the UCSC Genome Browser. The scores and threshold for identifying TFBS are computed using the Transfac Matrix Database (v7.0). A binding site is considered conserved across the alignment if its score meets the threshold score for its binding matrix in all 3 species. 28. We mapped the predicted TFBS locations to the intergenic intervals and also calculated TFBS statistics for each half of each interval.
Expression Data from the GNF2 Atlas
Were obtained the GNF2 data (Genomic Institute of the Novartis Research Foundation - Gene Express Atlas 2 29) from the UCSC Genome database. This dataset consists of genome wide gene expression (mRNA) measurements from 79 different human healthy and diseased tissues. We excluded seven tissues because they were neoplastic and could confound our results. Data were available for both genes of the pair for 10,397 pairs. For those we calculated the correlation coefficient r of the 72 expression level measurements. The calculated r was Fisher transformed to make the correlation coefficients normally distributed and allow the use in statistical tests for comparisons 30.
Microarray gene expression data
Data on RNA from the superior temporal lobe of 23 brain donors with no gross brain pathology was generated in our laboratory using the Illumina Sentrix HumanRef-8 Expression BeadChips (Illumina, San Diego, CA 92121-1975, cat. no. 11201828) containing 24,000 genes recognized by NCBI at the time of production. We extracted total RNA using Trizol (Invitrogen, Carlsbad, California 92008, cat. no. 15596-026) with additional purification on RNAeasy columns (Qiagen, Valencia, CA 913555, cat. no. 74104). We assessed the quality of total RNA on an Agilent 2100 Bioanalyzer (Agilent Technologies, Palo Alto, CA) and 0.5 µg of total RNA from each sample was labeled by using the Illumina TotalPrep RNA Amplification Kit (Ambion, Austin, TX 78744-1832, cat. no. IL1791) in a process of cDNA synthesis and in vitro transcription. We generated and labeled Single-stranded RNA (cRNA) by incorporating biotin-16-UTP (Roche Diagnosics GmbH, Mannheim, Germany, cat. no. 11388908910) and hybridized (16 hours) a total of 0.85 µg of biotin-labeled cRNA to the BeadChips. The hybridized biotinylated cRNA was detected with streptavidin-Cy3 and quantitated using Illumina's BeadStation 500GX Genetic Analysis Systems scanner. The primary Illumina data was returned from the scanner in the form of an “.idat” file which contains single intensity data values/gene following the computation of a trimmed mean average for each probe type represented on the array by a variable number of bead probes. We performed preliminary analyses of the scanned data using Illumina BeadStudio software which returns a detection call D based on a comparison between the intensity of a single probe and the intensities of a large number of negative control beads. Genes with calls consistently below D=.98 were eliminated from further analysis, leaving data for 11,328 named genes expressed in temporal lobe for analysis. Normalization by Z-transformation was performed on each sample/array on a stand-alone basis 31.
This study was carried out in accordance with the Declaration of Helsinki (2000) of the World Medical Association and was approved by the appropriate institutional review board and appropriate consent was obtained from human subjects.
Functional relatedness based on Gene Ontology (GO) and pathway membership data
We used the DAVID Bioinformatics website tools 32 (DAVID Bioinformatics Resources, http://david.abcc.ncifcrf.gov/home.jsp, National Cancer Institute, Frederick, MD) to generate functional annotation clusters for all human RefSeq genes. We selected two annotation categories for our analysis: GO Biological Processes and the KEGG Pathways (Kyoto Encyclopedia of Genes and Genomes). For each annotation category all clusters of size 2 or larger were considered and similarity scores for each pair of neighbouring genes were calculated. To take into account the fact that some clusters are more broadly defined than other and thus contain more genes, we increased the score by 1 divided by the cluster size each time the gene pair was found together in a cluster, thus giving higher scores to pairs in smaller narrowly defined functional clusters. Binary scores were also used for analysis, only considering whether the pair did or did not co-occur in any cluster.
Single nucleotide polymorphisms
We obtained SNP data from the UCSC database, querying for all SNPs available in dbSNP located within each interval. SNP density was measured in SNPs/Kb.
Tajima’s D
Tajima’s D values 33 across the genome have been pre-calculated using data from the Perlegen data set 34 and integrated in the UCSC browser 35. The data is only available for the May 2004 version of the human reference sequence so this version had to be used for this analysis. Values are calculated in adjacent 10 Kb blocks and are likely to be inflated due to the SNP selection criteria applied by Perlegen, however they remain useful for comparisons between regions. We assigned values to the intergenic intervals by calculating the average Tajima’s D values across each interval. When the 10Kb block covered the entire intergenic interval the value of D for that interval was used for the region, while when it contained more than one 10 Kb block those were weighted according to the size included in the interval and averaged.
Results
We exported from the March 2006 release of the UCSC genome database 18,123 mapped RefSeq genes that defined a total of 17,358 intergenic intervals between non-overlapping genes, excluding intervals containing centromeres or sequence gaps. A total of 568 gene pairs were overlapping without sharing exons, 510 of them transcribed from opposite strands and most often (375/510) overlapping at their 3’ ends (see Figure 1). It should be noted that based on the results of the ENCODE project 36 there are likely more overlapping pairs than we have identified using the current annotations. For consistency, as the encode project is limited to a small fraction of the genome, we did not incorporate encode data in our analyses. Therefore our results must be viewed keeping in mind that likely more intervals should be excluded.
Orientation and size distribution
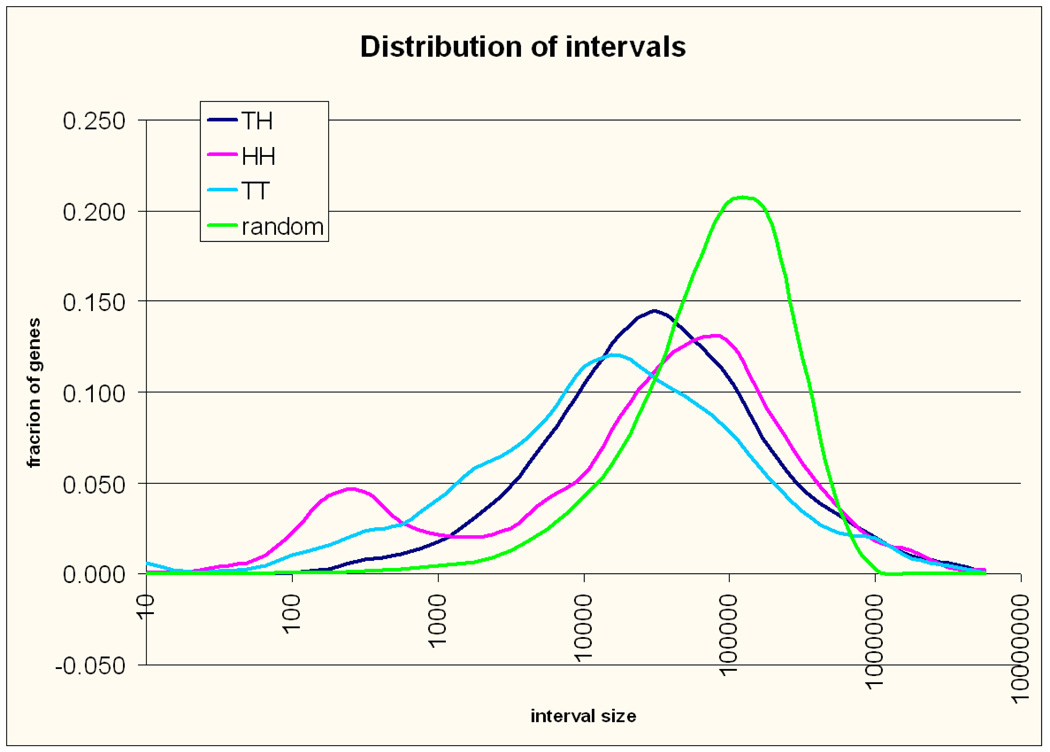
There were 8,877 TH, 4,366 HH and 4,115 TT intergenic intervals. The apparent deficit in TT intervals is because most (375/568) of the excluded overlapping gene pairs were oriented in TT fashion. Taking this into account the number of neighbouring genes transcribed in the same orientation was not different from the number of those transcribed in opposite orientations (8935 vs. 8991 chi-squared p = 0.7), and overall those transcribed in opposite orientations were equally divided between those with adjacent start sites and those with adjacent 3’ untranslated regions(4490 vs. 4501 chi-squared p =0.9). The size distribution for the three types of intervals and the expected distribution if the genes were positioned across the genome at random is shown in Figure 2. This graph is similar to a histogram with the Y axis showing the percentage of all observations in each size bin. The size bins start at the size shown on the X- axis and extends up to 1.78 times that size, a 10 fold increment every five bins. Due to the logarithmic scale of the X axis the bins are of equal width on the axis but not in base pairs. The sum of fractions of intervals over all bins (the area under the curve) represents all intervals (100%) of the specific type allowing for direct comparisons. The size distribution of the intergenic intervals is strikingly different from random in all three categories. There are more intervals smaller than 50 Kb than expected, but also more intervals greater than 500 Kb (gene deserts), where the three categories are equally represented. In smaller intervals there are remarkable differences between orientation categories. First, as reported previously 13,14 HH gene intervals show a bimodal length distribution with one peak at 20 Kb and a second peak at 300 bp, arguing for the significance of this orientation especially at distances < 1000 bp. The abundance of so arranged genes prompted us to use the bioinformatics tools provided by PANTHER (PANTHER-classifications of genes and proteins, http://www.pantherdb.org/tools/, SRI International) to test them for enrichment of specific functional annotations. We found a highly significant excess of genes involved in DNA metabolism and repair (see Table 1) confirming previous observations 13 and supporting a biological importance for this gene arrangement. A new observation is that HH intervals are overrepresented at larger sizes, 50 – 500 Kb (Chi-test p =5.2E-08 compared to the expected if the three categories had a single distribution), and underrepresented between 2–;50 Kb thus their distribution is not only bimodal but also biased to the extremes. Our result suggests that the HH arrangement might be avoided or reserved for special gene pairs at distances 2–100 Kb. Interestingly pairs at 2–100 Kb were significantly enriched for Cell adhesion (p=0.002), and Developmental processes genes (p=0.018), suggesting the latter scenario. HT and TT intervals also showed very significant differences from a random size distribution, the most striking being a large excess of small sizes for TT intervals compared not only to a random distribution but also to the other two interval types (45% of TT intervals <10 Kb compared to 30% of other types of intervals, p<10−68). The average size of TT intervals (101 Kb) was significantly smaller than TH (124 Kb) or HH (128Kb) intervals (all p<10−14; log transformed sizes were compared to achieve normality) which has not been previously reported for humans and is reminiscent of the results of Williams et al in Arabidopsis Thaliana 18. Genes around TT intervals <10 Kb showed an highly significant overrepresentation of genes coding for protein modifying enzymes, Hydrolases, Kinases and Transferases (see Table 2), which further argues for the importance of this arrangement.
Figure 2. Distribution of intervals.
The size distribution of the three types of intervals is shown in different colors, The expected distribution for random positioning across the genome is shown in green. The Y axis is showing the percentage of observations of each type and the Y axis marks size bins. The size bins start at the size shown on the axis and extend to 1.78 times that size. Due to the logarithmic scale of the X axis the bins are of equal width on the axis but not in base pairs.
Table 1. Biological processes and molecular function enrichment in HH genes closer than 500 bp.
Biological processes and molecular functions enriched in the genes that are oriented HH and closer than 1 Kb from each other. The number of genes observed with annotation for each process out of the 942 total genes in the group is shown, as well as the expected number based on the frequencies of annotations for all RefSeq genes. All values are calculated using the PANTHER bioinformatics engine and p values are Bonferroni corrected.
| Biological Process | observed | expected | P value |
|---|---|---|---|
| DNA metabolism | 39 | 13.14 | 6.0E-07 |
| Nucleoside, nucleotide and nucleic acid metabolism | 181 | 121.99 | 1.2E-06 |
| DNA repair | 24 | 6.17 | 6.9E-06 |
| rRNA metabolism | 12 | 2.41 | 1.2E-03 |
| Other intracellular protein traffic | 11 | 2.26 | 3.6E-03 |
| Protein biosynthesis | 40 | 21.57 | 2.9E-02 |
| Chromatin packaging and remodeling | 21 | 8.65 | 3.5E-02 |
| Protein complex assembly | 10 | 2.48 | 3.7E-02 |
| Molecular Function | observed | expected | P value |
| Nucleic acid binding | 170 | 104 | 3.51E-09 |
| Histone | 12 | 3.14 | 1.67E-02 |
| Dehydrogenase | 21 | 8.21 | 1.97E-02 |
| Oxidoreductase | 38 | 22 | 3.06E-02 |
Table 2. Biological processes and molecular function enrichment in TT genes closer than 10 Kb.
Biological processes and molecular functions enriched in the 3,734 genes forming TT pairs closer than 10 Kb, a size range significantly enriched in TT gene pairs. Methods and column labels are like in Table 1.
| Biological Process | observed | expected | P value |
|---|---|---|---|
| Protein modification | 236 | 167.74 | 2.87E-05 |
| Protein metabolism and modification | 536 | 440.74 | 4.44E-05 |
| Chromatin packaging and remodeling | 64 | 34.36 | 5.13E-04 |
| Cell structure and motility | 221 | 166.44 | 6.28E-04 |
| DNA repair | 48 | 24.5 | 3.19E-03 |
| Nucleoside, nucleotide and nucleic acid metabolism | 561 | 484.67 | 4.48E-03 |
| Intracellular protein traffic | 189 | 146.14 | 9.02E-03 |
| Protein phosphorylation | 134 | 95.69 | 2.01E-02 |
| Molecular Function | observed | expected | P value |
| Select regulatory molecule | 248 | 172.53 | 5.07E-07 |
| Hydrolase | 166 | 106.71 | 1.16E-06 |
| Kinase | 155 | 99.17 | 2.46E-06 |
| Transferase | 180 | 128.16 | 1.78E-04 |
| Nucleic acid binding | 491 | 413.19 | 1.18E-03 |
| Other enzyme regulator | 27 | 10.44 | 2.10E-03 |
| Transporter | 129 | 93.95 | 8.47E-03 |
| Protein kinase | 112 | 76.69 | 1.25E-02 |
| Histone | 28 | 12.47 | 1.63E-02 |
| Non-receptor serine/threonine protein kinase | 71 | 43.93 | 1.91E-02 |
Phylogenetic Conservation
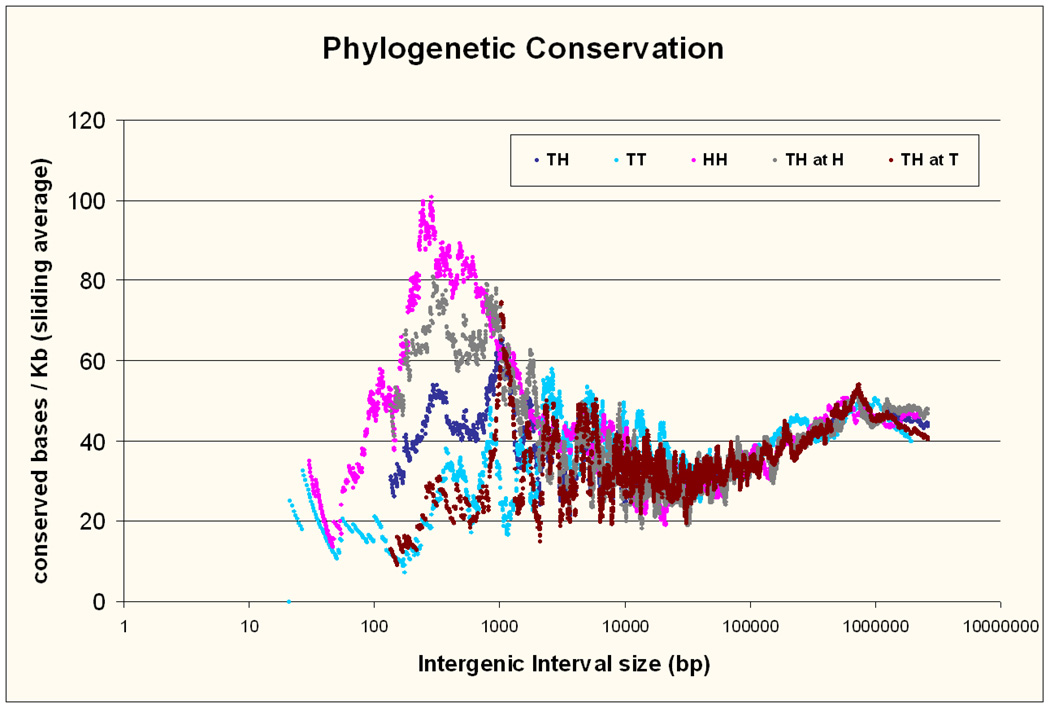
Conservation over evolutionary time is considered an indication of functional significance. The conservation by interval type and size is shown in Figure 3 (PhastCons conserved bases per 1000). Because of the large variability in conservation among intervals the y axis is showing a sliding average of 100 intervals consecutive in size. For example the conservation at size 1kb in figure 3 corresponds to the average conservation of 100 intervals, of which the median interval has a size of 1kb. This was done in this and other figures to reduce the variance between individual points and make the trends visible. Although useful and necessary, it must be noted that this illustration can generate some artefacts at the smallest intervals, where the inclusion of a single small interval with, for example, high conservation leads to a sudden increase in the average, which then again slowly declines as more intervals without conservation are added (see figure 3). The reported statistical analyses always use individual, not average values.
Figure 3. Phylogenetic conservation.
Conservation in the three types of intervals arranged by size, measured as the number of bases within conserved elements identified by the PhastCons algorithm per 1000 bp. The Y axis is showing the sliding average of the conservation of 100 intervals consecutive in size, while the X axis shows the average size of the same 100 intervals. This artificially reduces the variance between individual points and is done for illustration. All reported statistics use the individual values, not these sliding averages.
We observed a gradual increase in conservation for all types of intervals larger than 50 Kb as they increase in size, which peaks at around 500 Kb. Higher conservation in gene deserts has been previously reported 37,38. Here we show that the increase is gradual starting well below the conventional gene desert threshold size of 500 Kb. The correlation between distance and conservation was strong for intervals greater than 50 Kb (R=0.21, p=1×10−55; distance in logarithmic scale) even when we excluded gene deserts (size 50–500 Kb, R=0.17, p=6×10⁻³²). Around 50 Kb conservation was at a minimum and increased again for all types of interval with decreasing size. Below 1Kb we observed differences between the three interval types, with TT intervals showing the least conservation (for intervals <1kb conservation in HH>TH, p=0.003; TH>TT p=7.4×10⁻⁵; HH>TT p=6.4×10⁻¹³). When we examined the conservation on the two halves of TH intervals separately, we found the side adjacent to the 5’ end of the next gene (which we term “TH at H”) to be about as conserved as HH intervals, while the side adjacent to the 3’ end of the previous gene (“TH at T”) was about as conserved as TT intervals, which suggests that most of the conservation is likely due to elements regulating the downstream gene in this type of arrangement. Finally we observed a unexected reduction in conservation in intervals smaller than 250 bp that was obvious in all three types, providing most statistical evidence in HH intervals (HH 0–250 bp compared to HH 250–1000 bp intervals p = 3.1×10⁻⁵, for TT intervals p = 0.003 and for HH intervals p = 0.07). The possible implications of this novel observation will be addressed in our discussion.
Density of Predicted transcription factor binding sites (TFBS)
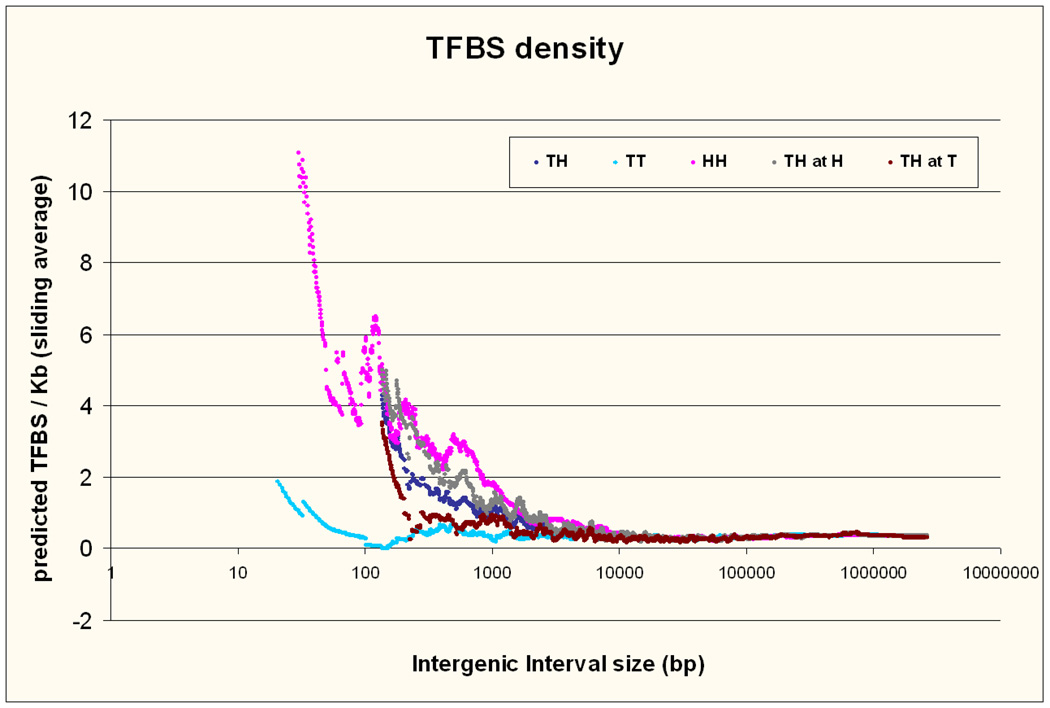
The density of predicted TFBS for the three types of intervals relative to their size is shown in Figure 4. It is interesting to view this in comparison to the phylogenetic conservation. First it is obvious and probably expected that the increased conservation in gene deserts is not related to TFBS density. It is also expected that TFBS density increases in shorter TH and HH intervals as those are in proximity to the 5’ends of genes. The apparent increase in TT intervals below 100 bp is the result of two outliers and is not significant. The proximity of two 5’ ends of genes seems to account for the large increase in TFBS in HH intervals. The reduction in phylogenetic conservation for intervals < 250 bp is not reflected in TFBS density.
Figure 4. Predicted TFBS density.
Predicted TFBS density for the three types of intervals according to size. The same sliding average technique as in Figure 3 is used. TH at H notes the density in the half of the TH interval that is closer to the gene beginning adjacent to the interval while TH at T notes the density toward the gene that ends there.
Gene ontology
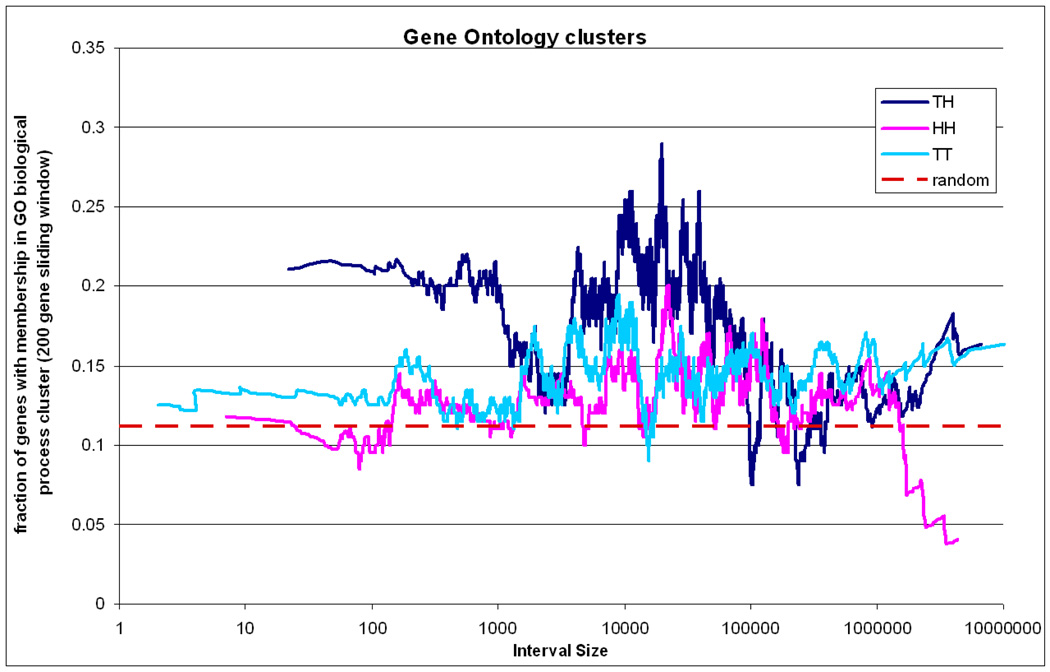
Joint membership of neighbouring genes in functional clusters based on biological process in the GO database was observed more frequently than expected by chance for all three categories of neighbours and for all distances between adjacent genes (see Figure 5). TT and HH genes showed the same increased functional relatedness with each other across all interval sizes. TH genes showed the same increase at distances > 100 Kb but significantly greater relatedness at smaller distances. Very similar results were obtained using clusters based on the KEGG pathways database. This observation which has not been previously reported could reflect the importance of physical proximity of related genes which facilitates their co-regulation, the generation of functionally related genes through tandem duplications or the combination of both phenomena.
Figure 5. Gene Ontology clusters.
Fraction of gene pairs with membership in common biological process clusters for the three types of gene pairs and according to distance. The sliding average approach as in Figure 3 is also applied here. The random expectation is shown with a dashed red line.
Gene expression
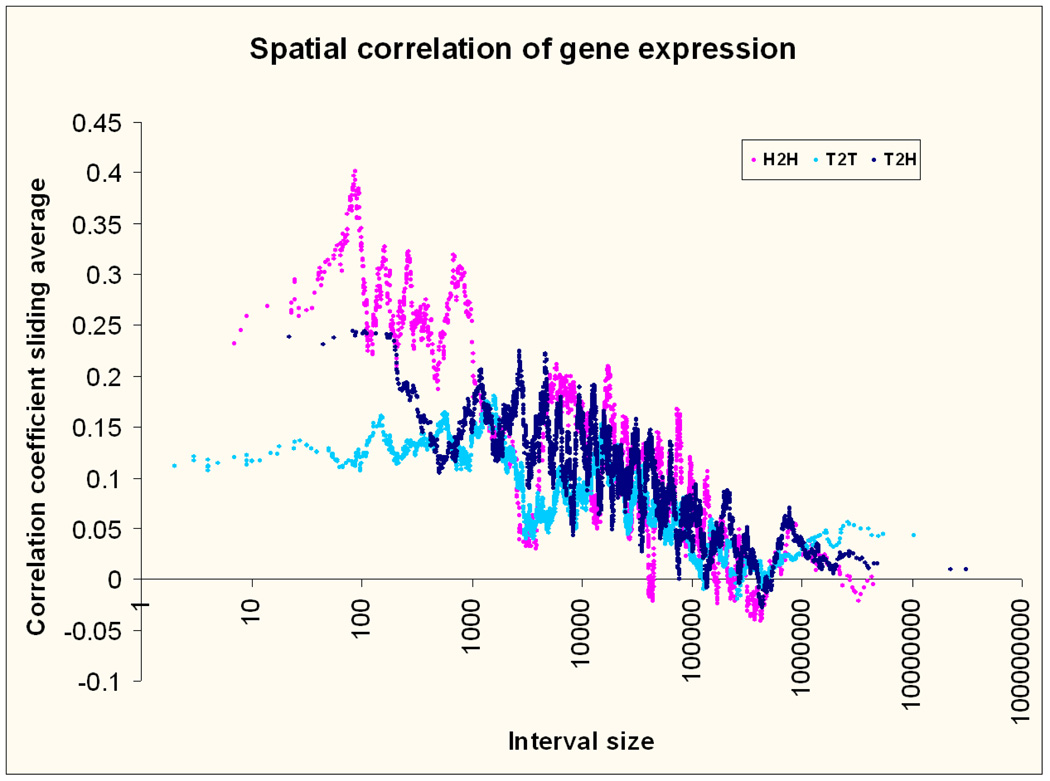
Correlation of expression across tissues suggests shared tissue specific regulatory elements. Based on GNF2 expression data from multiple tissues, the expression of neighbouring genes was more correlated than for randomly selected genes across all types of intervals (average Pearson’s r =0.1 for all pairs vs. 0.03 for 10,000 randomly selected pairs of genes) (Figure 6). This correlation was stronger with decreasing distance, a phenomenon most pronounced for HH intervals below 1 Kb. This is is in agreement with the results of Trinklein et al 13 who only studied short HH intervals, but expands their observations showing that the correlations are present across distances and orientations. Figure 6 includes both positive and negative correlations (anti-correlations; Pearson’s r less than 0). When anti-correlations are examined separately there is no change with distance, nor are they stronger than randomly observed anti –correlations.
Figure 6. Spatial correlation of gene expression.
Correlation of neighboring gene expression across multiple tissue types and according to gene pair type and distance. The sliding average approach of Figure 3 is also applied here.
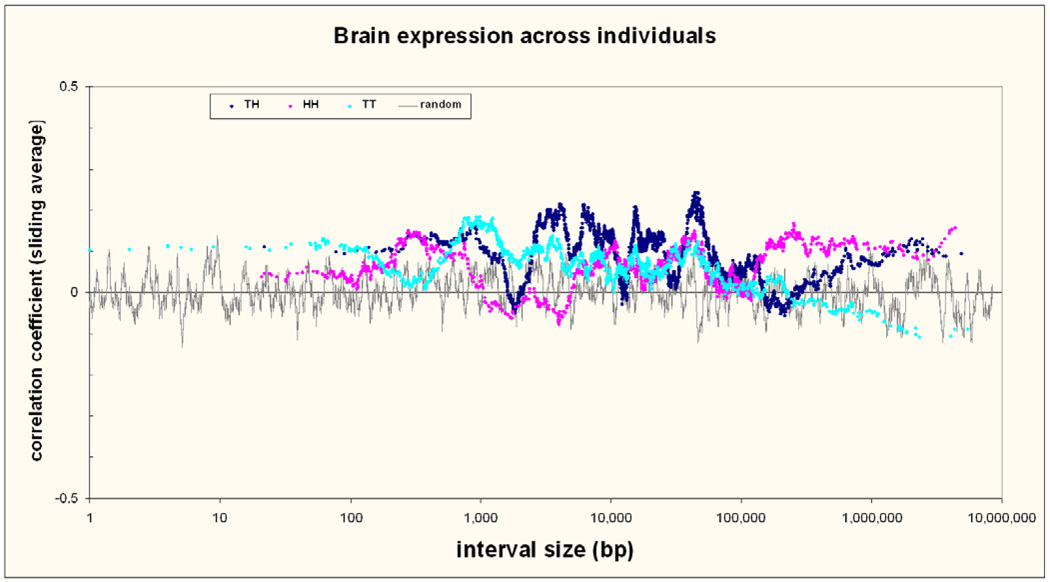
Correlation of expression across individuals within the same tissue type examines a different aspect of co-regulation, suggesting polymorphic sequence variants acting on both genes and/or common regulation in response to exposures or sample properties (age, sex, cause of death etc.). We examined 13 males and 10 females with an average age of 76 years (range 35 to 95). Both genes were expressed in the brain and had available data for 4,837 pairs (2,372 TH, 1,267 HH and 1,198 TT). For all pairs we observed higher inter-individual expression correlation (average r= 0.086) than for 20,000 random gene pairs (r= 0.004; p< 10−22). This remained constant up to interval sizes of about 100 Kb, at which size it was no longer increased for TT or TH intervals. The examination of inter-individual correlation of expression for neighbouring genes is novel and it is interesting that the results are different from analyses across tissues, with increased correlation but a lack of change with distance. This suggests that gene distance of coregulated genes is only important for factors determining tissue specificity, and not so important for variation of expression within a tissue.
Gene ontology and gene expression
Using the GNF2 data we found that neighboring genes with joint membership in any GO cluster (referred to as GO(+) genes) had stronger expression correlation than GO(−) genes (mean r = 0.19 v.s 0.084, p<10−39). This was most pronounced in TH oriented genes (mean r = 0.2 vs. 0.076, p<10−34) but was significant in all three categories. It was also more pronounced in short intervals (<50 Kb) but remained significant in long intervals. The level of functional relatedness (see methods for scoring algorithm) and the correlation of expression were correlated with each other. This was weak in short (<50 Kb) (r=0.05, p=0.056), but stronger in long intervals (r=0.18, p=5×10⁻⁵), especially for HH and TH pairs. Finally negative expression correlations were not stronger or weaker for GO(+) pairs suggesting no co-regulations in opposite directions. The microarray data of expression across individuals gave similar results: Neighbouring GO(+) genes had stronger expression correlation than GO(−) genes (mean r = 0.13 v.s 0.07, p<0.02), which was entirely due to TH oriented genes (mean r = 0.17 v.s 0.08, p<0.004). It was again more pronounced in short intervals (<50 Kb) while it correlated (yet non significantly) with the level of functional relatedness in long intervals (>50Kb). Negative expression correlations were not stronger or weaker for GO(+) pairs. The increased expression correlations in gene pairs with known functional relationships further supports that their coregulation is likely to reflect their functional relatedness.
Single nucleotide polymorphism density
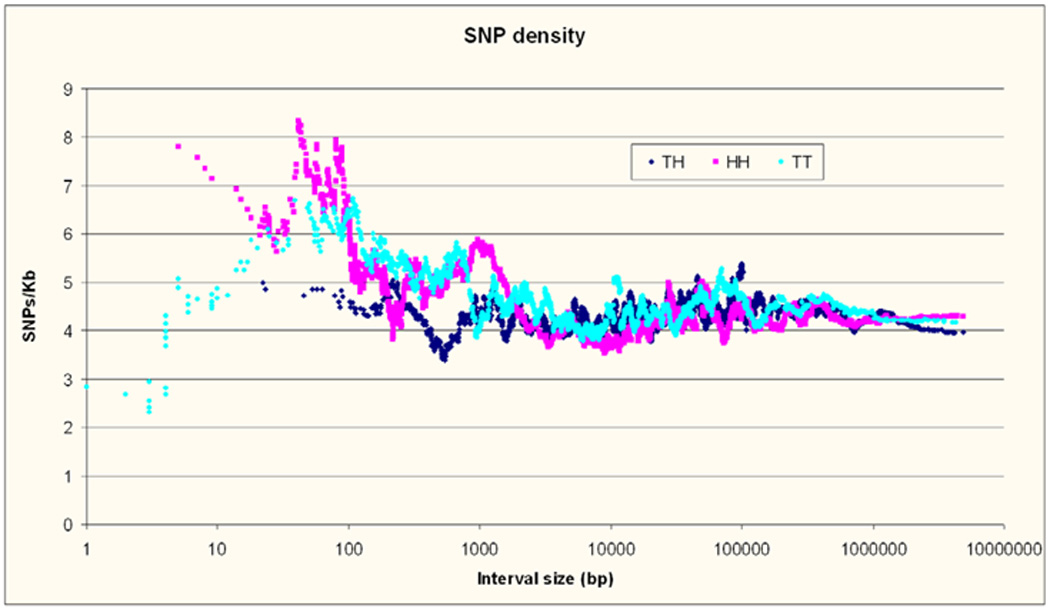
The density of dbSNP SNPs at large interval sizes was very similar in the three intergenic interval categories (see Figure 8). For intervals between 5Kb and 100Kb it increased steadily (regression R=0.06, p=2×10⁻⁸) from 4.0 to 4.5 SNPs / Kb for all types of intervals, and then remained constant (R=0.025, p=0.14) through the size of gene deserts. Below 5 Kb all intervals increased in SNP density with decreasing size (R=0.08, p=4×10⁻⁷), most pronounced below 500 bp. This observation which has not been previously reported suggests the interesting possibility of relaxed conservation in the human lineage. The sharp reduction in SNP density observed in the smallest TT intervals is due to 44 intervals all smaller than 50 bp free of SNPs.
Figure 8. SNP density.
SNP density from dbSNP in SNPs/Kb for the three types of intervals according to their size. The same sliding average technique as in Figure 3 is used.
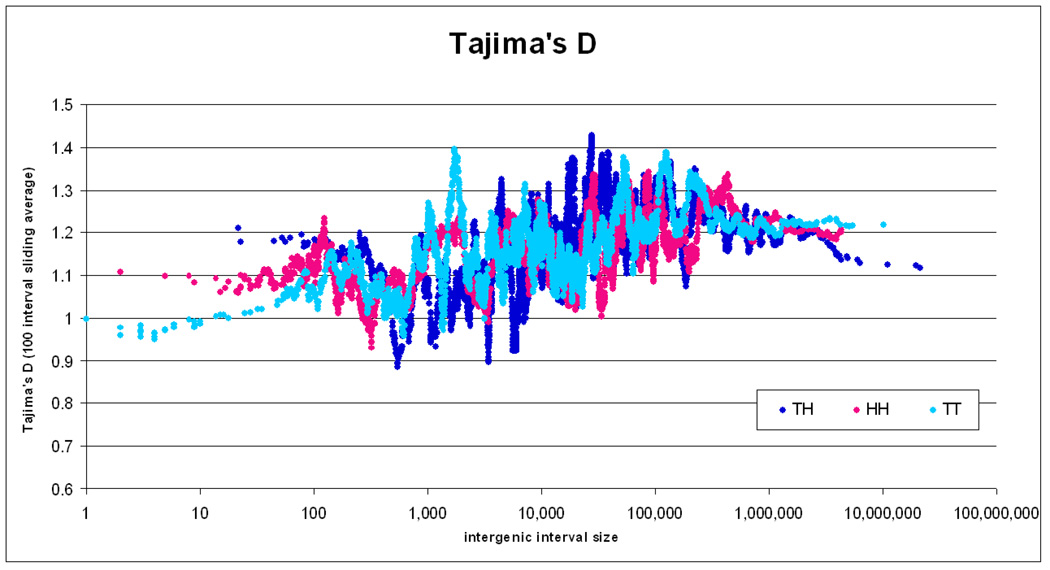
Tajima’s D
This statistic, which measures nucleotide diversity comparing the heterozygosity distribution of randomly selected SNPs against the expected distribution under selective neutrality and constant population size, was examined in order to better understand the significance of the observed differences in SNP density and conservation. High values of D are considered evidence of balancing selection due to an advantage of heterozygosity in the region or the result of reduction in population size. Low values indicate an excess of rare variation and are consistent with purifying selection, positive selection or population growth 35. We found a significant trend for increase of D with increasing intergenic interval size above 500 bp and up to 50 Kb and no change thereafter for all intervals. This was reversed below 500 bp, following the SNP density results discussed above. This is consistent with the relaxed conservation in the human lineage for these intervals as suggested by the SNP data.
Discussion
We have described the properties of the three types of intergenic intervals with regard to their size distribution, phylogenetic conservation, predicted TFBSs and content of polymorphisms across sizes as well as the expression and function of the flanking genes. Our data, strongly rejects the hypothesis of random gene arrangement in the genome.
We found that the size distribution of intergenic intervals is markedly different from the random expectation for all three types of intervals. In agreement with previous reports 13,14 we saw a bimodal distribution that clearly argues for the functional significance of the HH gene orientation especially at short distances. This was further supported by the strong correlation of the expression of genes thus arranged as shown in Figure 6. Among these genes we replicated the finding of a very significant enrichment for products involved in DNA metabolism and repair 13,14. A novel finding was that TT intervals also have a markedly different size distribution than expected (Figure 2), with many more intervals shorter than 10 Kb and a smaller average size than the other types. The strong overrepresentation of protein modifying genes coding for Hydrolases, Kinases and Transferases (Table 2) further argues for a biological significance that needs further investigation.
Our analysis confirmed that there are far more large intergenic intervals (gene deserts) than expected under a random gene distribution, and added to previous work by showing that the transition from small to large intergenic sizes is gradual, with no obvious threshold for defining a gene desert. The increase in phylogenetic conservation as interval sizes approach the size of gene deserts was also gradual. The increasing values of Tajima’s D suggest that the positive conservation in large intervals and gene deserts is more likely due to balancing rather than purifying selection, a suggestion that is further supported by the lack of change in SNP density in contrast to the increased conservation. It would be interesting to examine conservation within primates when enough genome sequences become available to further investigate the natural history of conservation in gene deserts. We found that gene deserts are equally represented in the three types of intervals and there is no significant correlation of expression of the flanking genes across tissues or among individuals. This suggests that if there is control exerted by deserts on the expression immediate neighbours it is probably not bidirectional. It is possible that the functional elements located in deserts are there because they need to be far from genes. To explore this possibility we tested whether conservation near the ends of gene deserts (50 and 100 kb from next gene) is different from conservation in the middle of the desert. We did not observe significant differences, suggesting no strong bias against the presence of putative functional elements close to genes. The answer to the function (or not) of gene deserts remains unclear and further advances in this field of research are necessary.
We found significant correlation of expression of neighbouring genes closer than 100Kb, increasing with decreasing distance for all types of intervals and becoming strongest for HH below 1,000 bp (Figure 6). The similarly increased phylogenetic conservation suggests that part of this co-regulation regulation might be due to DNA sequences. Conservation and co-regulation however do not reflect predicted TFBS density which does not increase except for intervals below 5 Kb not including TT intervals. Other types of shared regulatory elements and/or the propagation of chromatin states are possible explanations. It is tempting to speculate that, whatever the mechanism, the size distribution favouring smaller intervals and gene deserts might be related to the co-regulation of genes.
We found stronger correlation of expression when gene pairs are functionally related, suggesting that their positioning and functional relatedness are relevant to their co-expression. It is strongest for intervals shorter than 50 Kb and most pronounced in TH gene pairs, which raises the possibility that it might be in part the result of tandem duplications generating paralogs. Such paralogs would be expected to have similar functions and to carry similar regulatory elements in their vicinity, providing an explanation for our observations. The well discussed HH gene arrangement and co-regulation in short distances appears to be a special case that remains of interest. Our results on TFBS density and conservation show that there are either no shared TBFS and other regulatory elements in HH pairs or, if there are such elements, more of them are necessary in this type of pairs.
We observed a reduction in phylogenetic conservation in intervals shorter than ~ 250bp in all three types. The opposite pattern was observed in SNP density data, which is consistent with reduced selective pressure at this distance. Tajima’s D 33 further supported this, as it increased in intervals smaller than 500 bp. The congruence of the three types of data is intriguing, yet it is important to consider some important limitations of the SNP and D data. The increase in SNP density in smaller intervals might reflect increased sequencing efforts in areas close to genes by independent researchers. It is hard to tease apart the number of SNPs detected by large scale sequencing projects from those derived from smaller scale gene directed sequencing and reported to the databases. In our study SNPs in areas flanking transcripts (often not included in gene sequencing projects) could bias toward higher SNP density, a possibility we cannot exclude. An increased SNP density might also reflect higher mutation rates in CG rich areas close to gene promoters. We examined the fraction of SNPs forming a CpG with either allelic nucleotide in intervals smaller than 1 Kb. We found that 32% were in CpG dinucleotides with 60% of those (19.2% of total) representing transitions from CG to TG. Among 9,000 random SNPs 27% were in CpG dinucleotides with 80% of those (21.8% of total) representing transitions from CG to TG. Therefore, although there were more SNPs involving CpG in the short intervals as expected by the higher CG content there were fewer transitions from CG to TG, possibly reflecting the lack of CpG methylation in promoter sequences. Another limitation pertains to the available Tajima’s D data that have been generated using the Perlegen dataset 34 which is biased toward high allele frequency SNPs thus higher values are expected. Although the significance of the values per se cannot be evaluated the bias is the same across the genome allowing for comparisons across regions, which is the strategy we used. The ascertainment scheme of Perlegen 34 might introduce an additional bias for Tajima’s D close to genes because a fraction of SNPs were selected to be in transcribed sequences regardless of allele frequency. Those SNPs would influence the entire 10Kb block and when that extended outside a gene it would cause a reduction of D especially in smaller intergenic intervals. This bias however is opposite to our observation of increased D in small intervals. We cannot fully address the limitations regarding SNP density, we feel however that the congruence of conservation, SNP density and Tajima’s D data argues for the existence of a very interesting phenomenon of selective relaxation in very small intergenic intervals.
In Conclusion, our systematic survey of the distribution and orientation of genes and the properties of intergenic intervals has revealed previously unknown properties of the genome, that might reflect unexplored regulatory mechanisms and evolutionary forces. As expected for this type of research our observations have generated more questions than we have answered. We hope that as better annotation of the genome becomes available our results will provide insight for the exploration and interpretation of the new information and a stimulus for specific questions to be addressed experimentally.
Figure 7. Brain expression across individuals.
Correlation of neighboring gene expression in the temporal lobe of the brain across multiple individuals and according to gene pair type and distance. The sliding average approach of Figure 3 is also applied here.
Figure 9. Tajima’s D.
Tajima’s D for the three types of intervals according to their size. The same sliding average technique as in Figure 3 is used. Tajima’s D is calculated from the available 10Kb bin data by weighing and averaging as described in the text.
Acknowledgements
This work was supported in part from an NIA award (R01-AG022099) to D.A., a NARSAD young investigator award to D.A. and an award from the Neurosciences Education and Research Foundation to D.A. We thank Dr. David Valle and Dr. Andrew McCallion for critical suggestions on the manuscript.
References
- 1.Venter JC, Adams MD, Myers EW, et al. The sequence of the human genome. Science. 2001;291:1304–1351. doi: 10.1126/science.1058040. [DOI] [PubMed] [Google Scholar]
- 2.Lander ES, Linton LM, Birren B, et al. Initial sequencing and analysis of the human genome. Nature. 2001;409:860–921. doi: 10.1038/35057062. [DOI] [PubMed] [Google Scholar]
- 3.Ben-Shahar Y, Nannapaneni K, Casavant TL, Scheetz TE, Welsh MJ. Eukaryotic operon-like transcription of functionally related genes in Drosophila. Proc Natl Acad Sci U S A. 2007;104:222–227. doi: 10.1073/pnas.0609683104. [DOI] [PMC free article] [PubMed] [Google Scholar]
- 4.Blumenthal T. Gene clusters and polycistronic transcription in eukaryotes. Bioessays. 1998;20:480–487. doi: 10.1002/(SICI)1521-1878(199806)20:6<480::AID-BIES6>3.0.CO;2-Q. [DOI] [PubMed] [Google Scholar]
- 5.Blumenthal T. Operons in eukaryotes. Brief Funct Genomic Proteomic. 2004;3:199–211. doi: 10.1093/bfgp/3.3.199. [DOI] [PubMed] [Google Scholar]
- 6.Braastad CD, Leguia M, Hendrickson EA. Ku86 autoantigen related protein-1 transcription initiates from a CpG island and is induced by p53 through a nearby p53 response element. Nucleic Acids Res. 2002;30:1713–1724. doi: 10.1093/nar/30.8.1713. [DOI] [PMC free article] [PubMed] [Google Scholar]
- 7.Connelly MA, Zhang H, Kieleczawa J, Anderson CW. The promoters for human DNA-PKcs (PRKDC) and MCM4: divergently transcribed genes located at chromosome 8 band q11. Genomics. 1998;47:71–83. doi: 10.1006/geno.1997.5076. [DOI] [PubMed] [Google Scholar]
- 8.Galgoczy P, Rosenthal A, Platzer M. Human-mouse comparative sequence analysis of the NEMO gene reveals an alternative promoter within the neighboring G6PD gene. Gene. 2001;271:93–98. doi: 10.1016/s0378-1119(01)00492-9. [DOI] [PubMed] [Google Scholar]
- 9.Platzer M, Rotman G, Bauer D, et al. Ataxia-telangiectasia locus: sequence analysis of 184 kb of human genomic DNA containing the entire ATM gene. Genome Res. 1997;7:592–605. doi: 10.1101/gr.7.6.592. [DOI] [PubMed] [Google Scholar]
- 10.Shimada T, Fujii H, Lin H. A 165-base pair sequence between the dihydrofolate reductase gene and the divergently transcribed upstream gene is sufficient for bidirectional transcriptional activity. J Biol Chem. 1989;264:20171–20174. [PubMed] [Google Scholar]
- 11.Xu CF, Chambers JA, Solomon E. Complex regulation of the BRCA1 gene. J Biol Chem. 1997;272:20994–20997. doi: 10.1074/jbc.272.34.20994. [DOI] [PubMed] [Google Scholar]
- 12.Adachi N, Lieber MR. Bidirectional gene organization: a common architectural feature of the human genome. Cell. 2002;109:807–809. doi: 10.1016/s0092-8674(02)00758-4. [DOI] [PubMed] [Google Scholar]
- 13.Trinklein ND, Aldred SF, Hartman SJ, et al. An abundance of bidirectional promoters in the human genome. Genome Res. 2004;14:62–66. doi: 10.1101/gr.1982804. [DOI] [PMC free article] [PubMed] [Google Scholar]
- 14.Koyanagi KO, Hagiwara M, Itoh T, Gojobori T, Imanishi T. Comparative genomics of bidirectional gene pairs and its implications for the evolution of a transcriptional regulation system. Gene. 2005;353:169–176. doi: 10.1016/j.gene.2005.04.027. [DOI] [PubMed] [Google Scholar]
- 15.Li YY, Yu H, Guo ZM, et al. Systematic analysis of head-to-head gene organization: evolutionary conservation and potential biological relevance. PLoS Comput Biol. 2006;2:e74. doi: 10.1371/journal.pcbi.0020074. [DOI] [PMC free article] [PubMed] [Google Scholar]
- 16.Cho RJ, Campbell MJ, Winzeler EA. A genome-wide transcriptional analysis of the mitotic cell cycle. Mol Cell. 1998;2:65–73. doi: 10.1016/s1097-2765(00)80114-8. [DOI] [PubMed] [Google Scholar]
- 17.Kruglyak S, Tang H. Regulation of adjacent yeast genes. Trends Genet. 2000;16:109–111. doi: 10.1016/s0168-9525(99)01941-1. [DOI] [PubMed] [Google Scholar]
- 18.Williams EJ, Bowles DJ. Coexpression of neighboring genes in the genome of Arabidopsis thaliana. Genome Res. 2004;14:1060–1067. doi: 10.1101/gr.2131104. [DOI] [PMC free article] [PubMed] [Google Scholar]
- 19.Roy PJ, Stuart JM, Lund J, Kim SK. Chromosomal clustering of muscle-expressed genes in Caenorhabditis elegans. Nature. 2002;418:975–979. doi: 10.1038/nature01012. [DOI] [PubMed] [Google Scholar]
- 20.Fukuoka Y, Inaoka H, Kohane IS. Inter-species differences of co-expression of neighboring genes in eukaryotic genomes. BMC Genomics. 2004;5:4. doi: 10.1186/1471-2164-5-4. [DOI] [PMC free article] [PubMed] [Google Scholar]
- 21.Robb GB, Carson AR, Tai SC, et al. Post-transcriptional regulation of endothelial nitric-oxide synthase by an overlapping antisense mRNA transcript. J Biol Chem. 2004;279:37982–37996. doi: 10.1074/jbc.M400271200. [DOI] [PubMed] [Google Scholar]
- 22.Katayama S, Tomaru Y, Kasukawa T, et al. Antisense transcription in the mammalian transcriptome. Science. 2005;309:1564–1566. doi: 10.1126/science.1112009. [DOI] [PubMed] [Google Scholar]
- 23.Yelin R, Dahary D, Sorek R, et al. Widespread occurrence of antisense transcription in the human genome. Nat Biotechnol. 2003;21:379–386. doi: 10.1038/nbt808. [DOI] [PubMed] [Google Scholar]
- 24.Dahary D, Elroy-Stein O, Sorek R. Naturally occurring antisense: transcriptional leakage or real overlap? Genome Res. 2005;15:364–368. doi: 10.1101/gr.3308405. [DOI] [PMC free article] [PubMed] [Google Scholar]
- 25.Kent WJ. BLAT--the BLAST-like alignment tool. Genome Res. 2002;12:656–664. doi: 10.1101/gr.229202. [DOI] [PMC free article] [PubMed] [Google Scholar]
- 26.Pruitt KD, Tatusova T, Maglott DR. NCBI reference sequences (RefSeq): a curated non-redundant sequence database of genomes, transcripts and proteins. Nucleic Acids Res. 2007;35:D61–D65. doi: 10.1093/nar/gkl842. [DOI] [PMC free article] [PubMed] [Google Scholar]
- 27.Siepel A, Bejerano G, Pedersen JS, et al. Evolutionarily conserved elements in vertebrate, insect, worm, and yeast genomes. Genome Res. 2005;15:1034–1050. doi: 10.1101/gr.3715005. [DOI] [PMC free article] [PubMed] [Google Scholar]
- 28.Matys V, Fricke E, Geffers R, et al. TRANSFAC: transcriptional regulation, from patterns to profiles. Nucleic Acids Res. 2003;31:374–378. doi: 10.1093/nar/gkg108. [DOI] [PMC free article] [PubMed] [Google Scholar]
- 29.Su AI, Cooke MP, Ching KA, et al. Large-scale analysis of the human and mouse transcriptomes. Proc Natl Acad Sci U S A. 2002;99:4465–4470. doi: 10.1073/pnas.012025199. [DOI] [PMC free article] [PubMed] [Google Scholar]
- 30.Fisher RA. Frequency distribution of the values of the correlation coefficient in samples of an indefinitely large population. Biometrika. 1915:507–521. [Google Scholar]
- 31.Cheadle C, Vawter MP, Freed WJ, Becker KG. Analysis of microarray data using Z score transformation. J Mol Diagn. 2003;5:73–81. doi: 10.1016/S1525-1578(10)60455-2. [DOI] [PMC free article] [PubMed] [Google Scholar]
- 32.Dennis G, Jr, Sherman BT, Hosack DA, et al. DAVID: Database for Annotation, Visualization, and Integrated Discovery. Genome Biol. 2003;4:P3. [PubMed] [Google Scholar]
- 33.Tajima F. Statistical method for testing the neutral mutation hypothesis by DNA polymorphism. Genetics. 1989;123:585–595. doi: 10.1093/genetics/123.3.585. [DOI] [PMC free article] [PubMed] [Google Scholar]
- 34.Hinds DA, Stuve LL, Nilsen GB, et al. Whole-genome patterns of common DNA variation in three human populations. Science. 2005;307:1072–1079. doi: 10.1126/science.1105436. [DOI] [PubMed] [Google Scholar]
- 35.Carlson CS, Thomas DJ, Eberle MA, et al. Genomic regions exhibiting positive selection identified from dense genotype data. Genome Res. 2005;15:1553–1565. doi: 10.1101/gr.4326505. [DOI] [PMC free article] [PubMed] [Google Scholar]
- 36.Birney E, Stamatoyannopoulos JA, Dutta A, et al. Identification and analysis of functional elements in 1% of the human genome by the ENCODE pilot project. Nature. 2007;447:799–816. doi: 10.1038/nature05874. [DOI] [PMC free article] [PubMed] [Google Scholar]
- 37.Nobrega MA, Ovcharenko I, Afzal V, Rubin EM. Scanning human gene deserts for long-range enhancers. Science. 2003;302:413. doi: 10.1126/science.1088328. [DOI] [PubMed] [Google Scholar]
- 38.Ovcharenko I, Loots GG, Nobrega MA, et al. Evolution and functional classification of vertebrate gene deserts. Genome Res. 2005;15:137–145. doi: 10.1101/gr.3015505. [DOI] [PMC free article] [PubMed] [Google Scholar]


