

Abstract
Generating adaptive immunity after infection or immunization requires physical interaction within a lymph node (LN) T-zone between antigen-bearing dendritic cells (DCs) and rare cognate T cells. Many fundamental questions remain regarding the dynamics of DC-CD4+ T cell interactions leading to priming. For example, it is not known how the production of primed CD4+ T cells relates to the numbers of cognate T cells, antigen-bearing DCs, or peptide-MHCII level on the DC.
To address these questions, we developed an agent-based model of a LN to examine the relationships among cognate T cell frequency, DC density, parameters characterizing DC-T interactions and the output of primed T cells. We found that the output of primed CD4+ T cells is linearly related to cognate frequency, but non-linearly related to the number of antigen-bearing DCs present during infection. This addresses the applicability of two photon microscopy studies to understanding actual infection dynamics, as these types of experiments increase the cognate frequency by orders of magnitude as compared to physiologic levels. We found a trade-off between the quantity of peptide-MHCII on the surface of individual DCs and number of antigen-bearing DCs present in the LN in contributing to the production of primed CD4+ T cells. Interestingly, pMHCII half-life plays a minor, although still significant, role in determining CD4+ T cell priming, unlike the primary role that has been suggested for CD8+ T cell priming. Finally, we identify several pathogen-targeted mechanisms that, if altered in their efficiency, can significantly effect the generation of primed CD4+ T cells.
Keywords: infection, pMHC, priming, binding, agent-based model, computer simulation
Introduction
The adaptive immune response to pathogen infection is dependent upon generation of primed CD4+ T cells in the lymph node (LN). Dendritic cells (DCs) in tissues take up pathogens and present antigenic peptides on their surface in the context of major histocompatibility class II molecules (peptide-MHCII complexes, or pMHCII) (1-3). These antigen-bearing DCs migrate via afferent lymphatics to the closest tissue-draining LN. T cells constantly transit between the circulatory and lymphatic systems, entering individual lymph nodes via high endothelial venules (HEVs) and re-entering the circulatory system via the thoracic duct from efferent lymphatics (4). Generation of primed CD4+ T cells requires contact between these antigen-bearing DCs and specific (cognate) CD4+ T cells; their successful binding leads to CD4+ T cell priming (5). While DCs rarely leave the LN, primed CD4+ T cells exit the LN and return to the site of infection to participate in the immune response.
Despite a wealth of information on the immune response, including studies on the dynamics of DC-T cell interactions in a LN via two-photon microscopy (2PM) (3, 6, 7), many fundamental questions remain regarding the functioning of the LN. For example, it is not known how the production of primed CD4+ T cells is related to the numbers of cognate CD4+ T cells, antigen-bearing DCs, or pMHCII level on the DC surface. Will doubling the number of cognate CD4+ T cells or antigen-bearing DCs double the primed CD4+ T cell output? Experimental preparations such as 2PM often increase the density of cognate CD4+ T cells or DCs beyond the physiological range in order to facilitate observation (8, 9), so answering this question will indicate how information from these studies can be interpreted. Do high numbers of DCs with fewer pMHCIIs give equivalent CD4+ T cell priming as low numbers of DCs with more pMHCIIs? Answering this question would give insight into the relationship between antigen dose and T cell priming. A few recent studies have explored these questions for CD8+ T cells (10, 11). However, CD8+ T cells recognize antigen presented on DCs in the context of peptide-MHC class I (pMHCI) molecules. The half-life of pMHCI is on the order of a few hours; it is not surprising then that pMHCI half-life profoundly affects the extent and dynamics of CD8+ T cell priming (10, 11). Interestingly, the half-life of pMHCII is on the order of days (12-14), i.e. it is extended beyond the lifespan of the DC in most cases. Thus additional processes and parameters may play important and as yet undiscovered roles in driving CD4+ T cell priming dynamics, and we explore this here. Several recent computational studies have focused on the details of cell movement within a lymphoid organ (e.g. (10, 15-17)) In contrast, our study here focuses on functionality of the LN during exposure to antigen.
Pathogenic microbes can interfere with the immune response via several mechanisms related to DC-T cell interactions (e.g., reduction of pMHCII on the DC surface during infection with Mycobacterium tuberculosis or interference with trafficking of DCs to the LN) (18, 19). Thus, understanding the relationships between the quantities outlined above – numbers of CD4+ T cell and DC cell levels entering the LN, pMHCII levels on DCs, and numbers of primed CD4+ T cell levels exiting the LN – may give us insight into the mechanisms that pathogens have evolved to evade the immune response at the level of CD4+ T cell priming.
A systems biology approach that incorporates in silico modeling to generate and test hypotheses, run virtual experiments and make experimentally testable predictions is uniquely suited to address these questions. For example modeling can be used to overcome the significant time scale (minutes to a few hours) and length scale (a few microns) limitations of 2PM experiments, allowing us to predict how the observed local cell behavior may translate into the behavior of an entire LN. Modeling can also enable prediction of the outcome of numerous arid simultaneous processes in cases where it is too difficult to intuit the results. Specifically, agent-based models (ABMs) have been used in immunology and can allow an understanding of how local cell-cell interactions can lead to more global behavior (e.g. (10, 15, 16, 20-27)). We are interested in how individual DC and T cell contacts, binding and proliferation events lead to generation of primed T cells, and how this outcome is affected by both immune and pathogen parameters. As compared with alternative approaches (e.g. cellular Potts model (17), cellular automata (28, 29), ordinary differential equations (30)), ABMs have unique advantages for modeling individual cell contacts. For a more complete discussion of ABMs, cellular automata and other types of models as applied to biological systems, see two recent reviews (26, 31). ABMs can be used to simultaneously explore low frequencies of cognate T cells (~10-4 here), to track the history of each individual cell, to incorporate probabilistic events such as cell motion, and to follow the evolution of T cell priming in both space and time (15, 20). Further, we have developed analytical tools both for uncertainty and sensitivity analysis and for assessing compensatory relationships (“tradeoffs”) between parameters (32). We have previously used an ABM to explore the representation of the detailed movement of T cells within the T-zone of a LN via comparison of simulated motion and motion captured in 2PM studies (15). We now extend that framework to allow us to simulate physiological or near-physiological LN cell numbers and cognate frequencies over much longer time periods than 2PM studies capture, enabling us to both compare model results with infection scenarios and address some open questions regarding the dynamics of CD4+ T cell priming.
2. Methods
2.1 Agent Based Model
2.1.1 Overview
Agent-based Models (ABM) are computational tools used to model behavior of a system resulting from interactions between individual components. ABMs consist of an environment, autonomous objects (agents), time steps and rules governing the behavior of individual agents and interactions between agents. We implemented an ABM to simulate the immune response arising from cellular interactions within a LN (Fig. 1). This 2-dimensional (2-D) ABM accurately captures random encounters between T cells and DCs as observed via 2PM, with which it is possible to track individual cells as they interact with other cells and change their location and state (Fig. 1b). Previously, we developed an ABM that represented a small portion of a LN T-zone and had sufficient spatial and time resolution to make observations at the level of individual cells (15). We found that chemotaxis-directed motion of T cells toward DCs increased the total number of contacts but decreased unique contacts and thus inhibited efficient repertoire scanning of T cells and thereby decreased production of primed T cells. That is, our model supported the principle that a persistent random walk strategy of T cells to DCs was more efficient than chemotaxis-directed motion (Persistent random walk implies that the cells do not turn back on the path they just came from; this is observed in 2PM studies (6-8)). Here, we extend the scope of our LN ABM from a cellular level (fine grain) to a more biologically relevant histological level (and coarser grain), that of the T zone.
Figure 1.

Model schematics and rules. (a) The model represents events occurring in the T-zone of the LN, a region in which naïve T cells and DCs have an opportunity to interact. (b) The model geometry is a section of LN represented by a lattice of 25×200 micro-compartments, a section of which is diagrammed here. Cells move onto, off of, and around on the grid. T cells and DCs enter the grid via the high endothelial venules and afferent lymphatics, respectively. Cells can move to any adjacent square and also can divide. The larger DCs occupy an entire square, while up to 4 T cells (which are much smaller) can occupy a single square. Cells in adjacent squares can interact. T cells leave the grid via medullary sinuses that collect into efferent lymphatic vessels. (c) Shown are possible cell-cell interactions. Interaction of an Ab-DC or LDC with a cognate naïve CD4+ T cell can give rise to a primed CD4+ T cell (see also Fig. 3). Similarly, interaction of an LDC with a cognate naïve CD8+ T cells can give rise to a primed CD8+ T cell. The interaction of an Ab-DC with a primed CD4+ T cell can produce a LDC, and the interaction of an Ab-DC or LDC with an IDC can produce an Ab-DC. Finally, LDCs can also license Ab-DCs.
2.1.2 Environment
We built a 2-D model of the T-zone of a lymph node. As compared with a 3-D model, our 2-D model allows us to simulate an entire 2-D slice of the T zone of a LN rather than just a small volume. Since our goal was not to recapitulate and study cell movement, but rather to study the output of a LN during priming events, a 2-D model is reasonable. Further, for the parameter sensitivity studies contained herein, we require a model that can be used to run thousands of simulations in a reasonable amount of time. This is simply not yet possible with a 3-D model of the entire T-zone of a LN or a reasonable portion thereof. Note also that we require large numbers of cells so that we can study the relatively rare cognate GD4+ T cells on our simulation grid and generate statistically meaningful results, imposing a lower limit on the size of the LN model.
The environment of our model represents one complete slice of a whole T zone of a mouse LN (Fig. 1a). We chose to model the mouse rather than human LN because more data are available for the mouse to test and validate our model. The dimensions of the T cell zone in a mouse LN are not available but the volume can be reasonably assumed to be ~25% of the total LN volume of ~1×10⁻³ cm3 (33). Thus the t cell zone volume is ~2.5 × 10⁻⁴ cm3. Our LN is represented by a two dimensional grid of 25 × 200 micro-compartments (Figs. 1b, 2). The width and height of the T cell zone were matched to LN data as derived previously (15), particularly regarding the HEVs (entries) and medullary sinuses (exits). The thickness is set to one compartment. Each micro-compartment is a 20μm × 20μm square, yielding a T cell zone of 0.05 cm by 0.4 cm. Each micro-compartment can hold one DC or up to four T cells. We assume that the field is one compartment deep, and thus the total volume simulated is 4×10⁻⁵ cm3. High endothelial venules (HEV) and afferent lymphatics (AL) are located towards the top of the grid while medullary sinuses (MS) that collect into the efferent lymphatics (EL) are located towards the bottom of the grid. These locations and distances between the HEV entrances and MS exits were established in our previous work, and were based on experimental measurements from murine LNs and were scaled appropriately to the new environment (15), and recent work on mouse LNs agrees with our structural framework (33). Since our studies were not specifically aimed at understanding cell motion and movement, we did not include the fibroblastic reticular cell (FRC) network within the LN in this model, although ongoing work in our group and others are considering this important structural component and its influence [c.f. (17, 34)].
Figure 2.

Simulation snapshots. An enlarged view of a portion of the LN simulation grid is shown. High endothelial venules (red triangles), afferent lymphatics (white cylinders) and medullary sinuses (grey cylinders) are indicated; these are the entrance and exit ports for cells. Individual cells are shown as circles of various colors. See legend for details. 138:24 represents the time the snapshot was taken in hours and minutes.
2.1.3 Agents
Agents in our model are dendritic cells (DCs), helper T cells (CD4+ cells), and effector T cells (CD8+ cells). Agents have attributes such as their unique identifier number (to track each individual cell), state (representing cell type) and location.
CD4+ T cells. CD4+ T cells are naïve or primed. T cells are also either cognate (able to recognize antigen presented on MHC class II molecules on antigen-bearing DCs) or non-cognate; only cognate cells can be primed.
DCs. DCs sample their environment and take up antigen to present on their surface (35). We assign a pMHC level to each DC as it enters the grid. We represent a continuum of antigen-bearing DCs by tracking the quantity of peptide-MHC class complexes (pMHC) on the surface of DCs with time. DCs whose pMHCII value is below a threshold are incapable of priming naïve, cognate CD4+ T cells and are designated as immature (IDC), while those capable of priming are designated as antigen-bearing DCs (Ab-DC). The fraction of the DC population entering the LN that is Ab-DC is varied in some of the simulations, and is referred to as (% Ab-DCs), but otherwise we assume that roughly 60% of all DCs are antigen-bearing as inferred from data (36). We also assume that the levels of pMHC on the surface and the numbers of Ab-DCs reflect the levels of antigen in a system as in (10, 11). A third class of DCs (licensed DCs or LDC) have interacted with a primed CD4+ T cell and have increased numbers of pMHC (see below) (37, 38).
Cognate frequency. The frequency of cognate T cells is estimated to be on the order of 1:105 to 1:106 in actual infection scenarios (39, 40). In 2PM experiments in which antigen is introduced by Ab-DCs that have been exposed to antigen (OVA), in order to increase the number of observable events during the time frame of an experiment, the frequency of cognate cells is enhanced to approximately 1:300 by using transgenic T cells and recipient mice (7). In our simulations, we vary the cognate frequency from 1:300 to 1:10,000. We are limited to a minimum frequency of 1:10,000 to ensure that enough events occur during a simulation to allow statistical significance. This allows us to predict how well the 1:300 ratio represents other more biologically relevant scenarios.
T cell recruitment: Cognate and non-cognate T cells enter the LN via HEVs. Rates of entry of T cells, their levels and the ratio of CD4+ to CD8+ T cells were inferred based on the number of T cells present in a mouse LN (15) and the rate of their exit (less that 24 hours for non-cognate T cells) (4). See Supplement for more details. Recruitment rates via HEV allowed us to maintain the number of T cells in the LN at a steady state for the negative control simulations, i.e. with no Ab-DCs present or entering the LN (data not shown). T cells leave the LN via the MSs that collect into efferent lymphatic (EL) vessels. In the simulation, they exit when they reach defined spots on the grid defined as MSs (Fig. 1b).
DC recruitment. DCs enter the LN via ALs; estimates of the number of DCs are based on murine data (16). DC entry into the LN is described via two distinct infection scenarios (see below). DCs are not allowed to leave the LN in our simulations, as this rarely occurs in the natural system.
CD8+ T cells: Although not the focus of this paper, the model also included CD8+ T cells (naïve and primed). Naïve CD8+ T cells can be activated by contact with an LDC only. Including these cells, which like CD4+ T cells can bind to DC surface, ensures that we do not overestimate the available DC cell area available to CD4+ T cells. More detail on CD8+ T cells and the rules relevant to them can be found in the Supplement.
2.1.4 Rules
ABM rules define individual cell behaviors such as cell motion, life span, changes of state, proliferation and cell-cell interactions (Fig. 1b,c). A full set of rules is in the supplement available at: http://malthus.micro.med.umich.edu/lab/movies/FullLN/. Below we briefly describe key rules of our model that represent biological mechanisms of key interest to this study.
Celt Motion: Cells in our model follow a persistent random walk (Fig. 1b). Detailed data from 2PM tracking of individual T cell motion within a LN are available (7, 8, 41). Our model matches these data on cell speed, mean free path before changing direction and cell motility (relationship between displacement and time from original tracking point) (See Supplement Figure 4 for details on model validation). Similarly, data are available for validation of our model regarding DCs, which move more slowly, as do T cells that have become bound to a DC (7, 8). Our model also matches these data (15).
pMHC display: The half-life of pMHCII complexes on IDCs is typically on the order of 24 hours; however, antigen loaded onto MHC II molecules and presented on the surface of Ab-DCs (or LDCs) extends that half-life to the lifespan of the cell itself (days) (12-14). In our simulations, pMHCII level is allowed to decrease according to a given half-life; we used a range of reported half-life values for our analysis to determine the effects this parameter has on the system (36, 42, 43). As mentioned above, the half-life of pMHC class I is much shorter than that of pMHCII (although it may also be extended) (12-14), and this affects the generation of primed CD8+ T cells. Because LDCs are very efficient antigen presenters, we assume all the co-stimulatory molecules and pMHCI necessary are present for priming CD8+ T cells.
Contact: Contact between cells occurs when immune cells find themselves within the same or adjacent micro-compartments (Fig. 1b). DCs employ a strategy to allow rapid and efficient scanning of many T cells in order to locate the rare cognate T cell whose T cell receptor has sufficient affinity with the pMHC on a DC to result in binding, priming and proliferation of that T cell lineage. DCs may contact up to 5,000 T cells per hour by moving their dendrites within a local “sweep area” (44, 45). We implemented this local “sweep area” by defining DC-T cell contact as a T cell occupying any of eight compartments adjacent to a DC, with a maximum of 32 simultaneous T-cell contacts per DC (since up to 4 T cells can fit into a micro-compartment). A range of 75-250 has been suggested in the literature (7, 44); thus in 2-D the value of 32 is reasonable.
Binding and Priming of CD4+ T cells (Fig. 1c): Following physical contact between a CD4+ T cell and an Ab-DC or LDC, binding occurs only if both the quantity of pMHCII on the DC surface and the TCR affinity are sufficient (43). Priming requires prolonged binding duration (avg. of 6 hours) and the minimum duration has been reported to vary inversely with pMHC level (11, 46). Although data are scant, a sigmoidal relationship between T cell response and antigen dose on a DC has been described (47). Since not all DC-T cell binding leads to T cell priming, we separated binding and priming activities into two sigmoidal functions. Binding occurred with a probability determined by the pMHC level on the DC surface (Fig. 3); the parameters that characterize these curves are binding threshold and binding shape. Binding duration was determined by evaluating on an hourly basis whether pMHC level had decreased below a minimum threshold (since pMHC are lost over time) termed the unbinding threshold. At the conclusion of binding, the product of binding duration and average pMHC level during the binding period is used as a “priming signal” to determine priming probability, based on a second sigmoidal function (Fig. 3). The parameters used to characterize this curve are priming threshold and priming shape. Additional factors also contribute to the ability of DC complexes to activate T cells, including affinity and kinetics of the association of pMHC with TCR and co-stimulation by other molecules (48-50), and are implicit in our representation in Fig. 3. For example, a weaker affinity or fewer co-stimulatory molecules would effectively move either or both curves in Fig. 3 to the right and/or down, while higher affinity or stronger co-stimulation would effectively move the curves left and/or up.
Proliferation: Primed CD4+ T cells proliferate based on a reported doubling time (eight hours) and average number of divisions is 4 (6).
Licensing of DC: Licensing of Ab-DCs can occur either by their contact with primed CD4+ T cells or by direct contact with an LDC via exosomes or exovesicles (51-53). In our model, we consider both mechanisms for licensing, each requiring only cell-to-cell contact (Fig. 1c). In both cases, the “state” of the DC is changed to that of an LDC and its pMHC level is increased to a level above the binding threshold (Fig. 3) to ensure enhanced ability for T cell priming.
Lifespan: Naïve CD4+ T cells live up to 365 days (54). The age of a T cell entering the grid was chosen from a uniform distribution between 165 and 365 days. Primed CD4+ T cells and Ab-DCs have lifespans of 60 hours (55). After becoming licensed, LDCs live for 36 hours (56, 57).
Figure 3.

Interaction of an antigen-bearing dendritic cell (Ab-DC) with a cognate naïve T CD4+ cell can result in binding and priming of a T cell. Shown are the sigmoid relationships used in the model (more details and equations are given in the Supplement 1). Binding probability is assumed to be a function of the number of pMHCII displayed by the Ab-DC; the curve is characterized by the binding threshold and binding shape parameters. Binding threshold defines the number of pMHCII at which the binding probability is 50%; binding shape describes the slope of the binding probability vs. pMHCII level curve at that point. Priming (of a CD4+ T cell already bound to an Ab-DC) is assumed to be a function of the product of pMHCII and time; the curve is characterized by the priming threshold and priming shape parameters.
2.2 Parameter Estimation
All parameters and their values used in the ABM are listed in Table I. Parameters were based on experimental data or estimated based on related systems and the ability of the model to produce reasonable behavior (calibration) during a chronic infection scenario (see below, e.g. Fig. 4). Parameter values are expected to vary slightly from one cell to another. This is captured in the ABM by choosing parameters for each cell from a biologically reasonable defined range that is normally distributed. In addition, because there is uncertainty in the values of many of the parameters, it is important to examine closely the influence of parameter variation on the model output(s) of interest, as described below (sensitivity analysis).
Table I.
All parameters used in ABM simulations. For each parameter, the name, brief description, baseline value and range used for uncertainty and sensitivity analysis is given. Parameter values are based on experimental data or estimated based on related systems and the ability of the model to produce reasonable behavior (calibration) during a chronic infection scenario. For example, recruitment parameters prob_T4_recruitment and prob_T8_recruitment were fixed in order to achieve a ‘normal level’ steady state in the system before infection was introduced. T4 refers to CD4+ T cells, T8 refers to CD8+ T cells.
| Parameter | Baseline value | Range | Description | ||
|---|---|---|---|---|---|
| +* | 1 | pMHC half-life | 60hrs (58) | 30-60 hrs | Half-life of pMHCII on DC |
| +* | 2 | unbinding threshold | 100 | 80 – 120 | pMHC level at which T cell unbinds from DC |
| +* | 3 | binding threshold | 150 (59, 60) | 100–200 | pMHCII level corresponding to 50% CD4+ T cell binding probability |
| +* | 4 | binding shape | 15 | 10-30 | Shape parameter for CD4+ T cell binding probability curve (Fig. 3) |
| +* | 5 | priming threshold | 6 hrs (46) | 4 - 8 hrs | Value of pMHC*binding duration at 50% CD4+ T cell priming probability |
| +* | 6 | priming shape | 0.6 | 0.3-0.9 | Shape parameter for CD4+ T cell priming probability curve (Fig. 3) |
| +* | 7 | binding threshold (CD8 cell) | 200 (11) | 100 - 200 | pMHCI level corresponding to 50% CD8+ T cell binding probability |
| +* | 8 | binding shape (CD8 cell) | 15 | 10-30 | Shape parameter for CD8+ T cell binding probability curve (Fig. 3) |
| +* | 9 | priming threshold (CD8 cell) | 6 hrs | 4 - 8 hrs | Value of pMHC* binding duration at 50% CD8+ T cells priming probability |
| +* | 10 | priming shape (CD8 cell) | 0.6 | 0.3 - 0.9 | Shape parameter for CD8+ T cell priming probability curve (Fig. 3) |
| +* | 11 | LDC lifespan | 36 hrs (56, 57) | 24 – 48 hrs | Lifespan of an LDC |
| +* | 12 | Prob T4 licenses Ab-DC | 50% | 30 – 80 % | Probability of primed CD4+ T cell licensing Ab-DC |
| + | 13 | Cognate Frequency | 0.25 (see text) | 1:100 – 1:10000 | Frequency of cognate naïve T cells |
| + | 14 | Ab-DC lifespan | 60 hrs (61) | 40 – 80 hrs | Lifespan of an Ab-DC |
| + | 15a | Number of divisions primed CD4+ T cells | 4 (7, 58) | 2 – 8 | Max # of divisions allowed for a primed T cell |
| 15b | Number of divisions CD8+ T cells | 8 (7) | 2-12 | Max # of divisions allowed for a primed T cell | |
| + | 16 | Division time | 8 hrs | 2 – 16 hrs | Time for primed CD4/CD8 division |
| 17 | Prob_T4_recruitment | 99% | 50 – 100 % | Probability of naïve CD4+ T cell recruitment at every 20 time steps | |
| 18 | Prob_T8_recruitment | 95% | 50 – 100 % | Probability of naïve CD8 recruitment at every 20 time steps | |
| 19 | Initial_naiveT4_cells | 6000 | initial no. of naïve CD4+ T cells | ||
| 20 | Initial_primedT4_cells | 0 | initial no. of primed CD4+ T cells | ||
| 21 | Initial_naiveT8_cells | 5000 | initial no. of naïve CD8+ T cells | ||
| 22 | Initial_primedT8_cells | 0 | initial no. of primed CD8+ T cells | ||
| 23 | Initial_total DCs_cells | 8 | initial no. of total DCs (IDC+Ab-DC) | ||
| 24 | %AB-DCs | 60% | percent of total DCs that are antigen bearing | ||
| 25 | Peak_DCs_level | 100 | Max no. of total DCs on the grid | ||
| 26 | IDC_Ab-DC_threshold | 50 | pMHC level below which a DC is IDC | ||
| 27 | n_tcells_bind_DC | 32 | Max no. of T cells that bind to a DC | ||
| 28 | max_time_T4_primed | 60 hrs (55) | Max time after which primed T4 cells die | ||
| 29 | max_time_T8_primed | 60 hrs (55) | Max time after which primed T8 cells die | ||
| 30 | min_T4cell_age | 165 days (54) | Minimum age of naïve T4 when it appears on the grid | ||
| 31 | max_T4cell_age | 365 days (54) | Maximum age of naïve T4 when it appears on the grid | ||
| 32 | min_T8cell_age | 165 days (54) | Minimum age of naïve T8 when it appears on the grid | ||
| 33 | min_T8cell age | 365 days (54) | Maximum age of naïve T8 when it appears on the grid | ||
| 34 | min_DC_age | 24 hrs (61) | Minimum age of DC when it appears on the grid | ||
| 35 | max_DC_age | 11 days (61) | Maximum age of DC when it appears on the grid | ||
| 36 | Initial number of pMHC | taken from a distribution (59, 60) | range 125-200 | Initial number of pMHC placed on surface of DC |
Parameters included in 16 parameter (full) lhs
Parameters included in 12 parameter lhs
Figure 4.
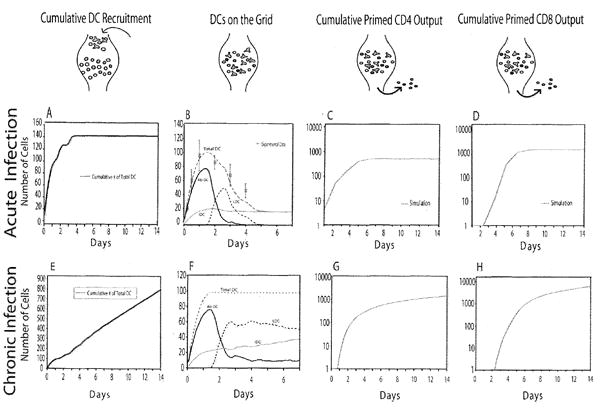
Acute and chronic infection scenarios. The cartoons along the top indicate the flow of cells into, on and out of the LN and correspond to the plots below. (a, e) Cumulative number of DCs that have entered the LN. (b,f) Numbers of each population of DCs in the LN during the infection. In (b), experimental data on the total number of DC in a human LN at particular times (66) is shown for comparison. (c,g) Cumulative number of primed CD4+ T cells exiting the LN. (d,h) Cumulative number of primed CD8+ T cells exiting the LN. In (c,d), experimental data from a mouse spleen are shown for comparison (64). No measure of variability (e.g. standard deviation) is available for these data. Model parameter values used are from Table I with 60% Ab-DCs, cognate frequency 1:300, pMHC half-life 60 h.
2.3 Virtual Infection Simulation
Both Ab-DCs and IDCs enter the LN; the entry of Ab-DCs simulates an infection. We considered two infection scenarios. The first, which we term the acute infection scenario, captures a multi-day pulse of Ab-DCs entering the LN and the production of primed T cells that results. Our simulation is based on murine data (62) representing transport of antigen (FITC) from the airways to thoracic LNs via airway-derived CD11c+/MHC-II DCs (Fig. 4b). Transport of antigen by DCs begins within 6 hours after introduction of FITC antigen into the airways, peaks after 24 hours, and declines to zero by day 7. We used these data to infer the rate of entry of DCs (Fig. 4a; note the cumulative number of DCs entering is shown).
We also considered a chronic infection scenario, an artificial construct to allow us to do a steady state analysis, avoiding confounding effects of changing numbers of Ab-DCs. In these simulations, we maintain a steady-state level of Ab-DCs post peak influx (~ 36 h) through day 14 of the simulation (Fig. 4e-f). This scenario was used for investigating the effect of varying cognate frequency and Ab-DC frequency.
For both infection scenarios, simulations are first run for 15 hours to achieve a steady state of 5000 naïve CD4+ and 4000 naïve CD8+ T cells prior to infection. Infection is then introduced by adding DCs in a given ratio (termed % Ab-DCs) of IDCs and Ab-DCs (Fig. 4a).
2.4 Metrics used to analyze simulations
For each simulation, we track all properties for each cell (agent), including location (within the LN or exiting the LN). We use these data to compute the cumulative output of primed CD4+ T cells; cumulative refers to the summing of exiting cell numbers up to the time point plotted. In addition, we also compute 3 metrics to help us understand T cell – DC contact dynamics within the LN. Search time is the time elapsed from when a cognate CD4+ T cell enters the LN until it first contacts an Ab-DC. Transit time is the time required for a cognate T cell to migrate through the LN T-zone (including any priming and division steps). Match percentage is the percentage of entering cognate CD4+ T cells that contact an Ab-DC during their time in the LN.
2.5 Uncertainty and Sensitivity Analysis
Uncertainty analysis measures the variation in model output based on the variation of inputs (i.e., parameter values). Sensitivity analysis involves the correlation of these variances in parameter values to variances in model output and is particularly useful when parameter values are not known with certainty. We use Latin Hypercube Sampling (LHS) to sample from a large parameter space and partial rank correlation coefficients (PRCC) to determine sensitivity, as we previously described for application to ABMs (32). Parameters varied during sensitivity and uncertainty analysis are indicated in Table I, along with their default values, ranges tested and references based on experimental data. This was done for acute infection scenario. Note, in the LHS the initial number of pMHC on the surface was not varied, because the parameters that describe all the binding and priming curves in Figure 3 are sufficient to capture that effect without redundancy. If initial numbers of pMHC were included in the LHS/PRCC, it would also show up as an important parameter (data not shown) as observed in the trade-off plots.
2.6 Trade-off Plots
We examined the relationship between two parameters, average initial numbers of pMHCII per Ab-DC entering the LN and number of Ab-DCs (as a percent of the total entering, which is fixed), in producing a fixed number of primed CD4+ T cells during a chronic infection scenario. We used the chronic scenario so varying levels of DCs would not impact the results. The distribution for initial levels of pMHC on the surface of the DCs was chosen from a much smaller range that the rest of the simulations and a very small standard deviation of 5. An average of 10 runs was performed and a target value of cumulative CD4+ T cells was achieved (100 for cognate freq. 1/3000 and 500 for cognate freq. 1/300) and the parameters yielding those values (within 10% of the target values) were obtained. These pairs of parameter values that yielded the same number of cumulative (14 day) primed CD4+ T cells leaving the LN were compiled and plotted. Because such plots yield information on how a change in one parameter can compensate for a change in the other parameter, we term these plots trade-off plots (48, 63).
2.7 History
We considered the scenario where T cells retain ‘memory’ of previous interactions with DCs and this memory accumulates to assist in priming. We term this memory history. A control baseline condition had no history, i.e. each T cell binding event is independent of prior contacts of that individual T cell and T cell priming depends solely upon its binding with a particular DC (all results shown in this paper were done for this case). Second, we considered a scenario of binding sensitivity history for T cells in which prior binding events that did not lead to priming can increase the probability that a DC-T cell contact leads to successful binding. In this case, the pMHC value used to compute the binding probability (Fig. 3) is calculated by summing pMHC values from prior contacts (still decreasing with a given half-life). Finally, we considered the case of priming sensitivity history in which prior T cell binding events (that failed to prime) increase the probability that subsequent binding events result in priming. In this case, the pMHC*duration values used to compute the priming probability (see Fig. 3) are calculated by summing the pMHC*duration values from prior contacts (still decreasing with a given half-life). Implementations of history were evaluated independently as well as a scenario where priming and binding sensitivity occurred simultaneously.
2.8 Numerical Methods and Visualization
The ABM was implemented in C++. Code was developed on a Linux Mandriva 2007 operating system and compiled using a GCC compiler. The simulation time step was 6 seconds. To visualize results, we generated text files that record the state and location of every cell on the grid at 2-minute intervals during the simulation. These text files were then converted to .png image files using Java 3D module. Image frames were converted into movies using QuickTime Pro player. Movies of our ABM simulations are available at http://malthus.micro.med.umich.edu/lab/movies/FullLN.
3. Results
3.1 Virtual infections track cell behavior and LN output of primed cells
To understand dynamics of immune cells in the LN during both acute and chronic infections, we developed a computer model known as an ABM. DCs and naïve T cells migrate to a single LN, interact according to a set of rules determined from known biological data, and T cells then leave the LN primed and ready to combat infection (Fig. 1). The cumulative number of primed CD4+ T cells exiting the LN via the MSs serves as a measure of the strength of the immune response generated for particular infection scenarios.
We first describe the dynamics of the acute infection scenario (Fig. 4a-d). Fig. 4a shows the cumulative number of DCs (here 60% Ab-DCs and 40% IDCs) that have entered the LN. The dynamics of all the DC populations in the LN are shown in Fig. 4b; the total DC population increases to a maximum of 100 by 36 hours and then declines. Initially, the population of total DCs in the LN is comprised of IDCs and Ab-DCs; as these DCs become licensed, the number of Ab-DCs declines and the number of LDCs increases. Although data are not to our knowledge available on the rate of entry of DCs into a draining LN, we can assume that for different infections, the dynamics- both timing a net magnitude, will be different. Here we chose the influx of (DC dynamics to represent total numbers of DCs in the LN (the sum of Ab-DCs, LDCs. and IDCs) that represent experimentally determined values from one human study (Fig. 4b) (62). The predicted cumulative predicted numbers of primed CD4+ and CD8+ T cells leaving the LN as shown in Fig. 4c,d. There are no data available on the number of CD4+ T cells leaving a single lymph node. However, a spleen is a secondary lymph organ, and there are data from one group looking at the expansion of cells during LCMV infection (64). Their data show a 3 order of magnitude expansion in CD4+ T cell numbers and a 4 order of magnitude expansion in CD8+ T cell numbers over a 2 week period. Our lymph node outputs (from just a portion of the LN) are similar. The magnitude and timing of the simulated expansion phase are similar to the data; the output from our simulated LN precedes that of the spleen data by a few days, as expected. Thus our simulation captures essential features of an acute infection scenario in a LN. Time-lapse movies of the acute infection scenario for 2 different cognate frequencies are available at http://malthus.micro.med.edu/lab/movies/FullLN.
For comparison with acute infection, we also simulated a chronic infection scenario (Fig. 4e-h). The entry of IDCs and Ab-DCs into the LN is set to reach a steady rate by ~ 1 day, as shown by a nearly constant rate of increase in the number of DCs that have entered the LN (Fig. 4e). In a manner similar to that seen for the acute case, the number of total DCs in the LN is initially comprised of IDCs and Ab-DCs but later switches to predominantly LDCs (Fig. 4f). The corresponding (cumulative) output of primed CD4+ and CD8+ T cells is shown in Fig. 4g,h. The cumulative cell numbers are initially similar to the acute case but continue to increase slowly with time. Although this scenario is an artificial construct and not meant to be compared with experiment, chronic infection simulations will serve as a tool below to observe the effects of varying the number of Ab-DC or cognate frequency without the confounding effect of varying levels of entering DCs.
T cells can potentially contact multiple DCs during their transit through a LN and the extent to which separate contacts might lead to subsequent priming and proliferation has been previously studied in models of CD8+ T cell priming (11, 46, 65). To explore whether previous contacts between naïve CD4+ T cells and DCs influence CD4+ T cell binding and/or priming, we implemented various history scenarios (see Methods; binding sensitivity history, priming sensitivity history, and the sum of the two). We set the “memory” of these contacts to decay with a similar time-frame as pMHC themselves are lost (60 h half-life). We found no significant differences in generation of primed CD4+ T cells when we performed the experiments in any of the history cases versus no history control (Supplemental Figure 3 http://malthus.micro.med.umich.edu/lab/movies/FullLN/). This argues strongly that at least for priming of CD4+ T cells, this concept of history may not be playing a significant role in the generation of primed CD4+ T cells that leave the LN. We note that if the pMHCII half-life is reduced by an order of magnitude to that of pMHCI, we do find an effect of history, in agreement with previous work by Zheng et al. (10) on the priming of CD8+ T cells.
3.2 LN efficiency in producing primed CD4+ T cells is primarily a function of the number of Ab-DCs
The influx of Ab-DCs and cognate CD4+ T cells to a LN is central to the generation of primed T cells; however, the relationship between the numbers of Ab-DCs and cognate T cells entering a LN and primed CD4+ T cells generated and exiting a LN is not known. We investigated a range of cognate frequencies, from the elevated frequency (1:300) typical of 2PM experiments to a frequency approaching physiological (1:10000). Similarly, we varied the fraction of entering DCs carrying sufficient levels of antigen to prime a T cell (% Ab-DCs). Under basal conditions, DCs represent < 1% of cells within LN (15, 66); infections likely generate increased and varying levels of Ab-DCs. To study the influence of these inputs on primed CD4+ T cell production, we used the chronic infection scenario (Fig. 4).
Fig. 5a shows the simulation of cumulative output (through day 14) of primed CD4+ T cells from a LN for 5 different cognate frequencies and a range of % Ab-DCs. For a given cognate frequency, increasing the % Ab-DC increases the cumulative output of primed CD4+ T cell, as expected. Similarly, for a given % Ab-DC, increasing the cognate frequency increases the output of cumulative primed CD4+ T cell.
Figure 5.
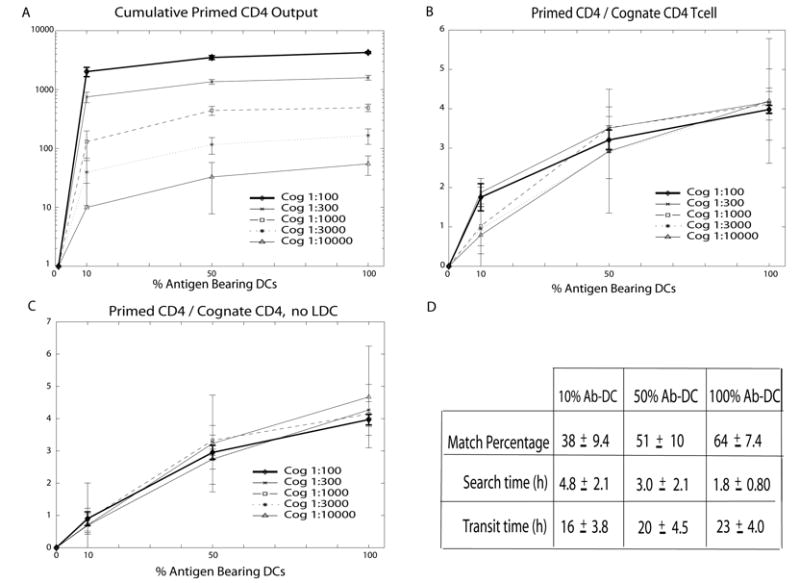
Simulation of primed CD4+ T cell production during chronic infection (i.e. input of DCs is constant). (a) Cumulative (14 day) output of primed CD4+ T cells from the LN as a function of % Ab-DC by differing cognate frequencies (denoted Cog in the figure legend). (b) Data in (a) re-plotted as the ratio of the cumulative primed CD4+ T cell output to the number of naïve cognate CD4+ T cells entering the LN for different cognate frequencies. (c) Simulations results as in (b) but for the case of no licensing of DCs. (d) Average match percentage, search time and transit time for cognate CD4+ T cells entering the LN for the simulations shown in (a,b). Standard deviations are also given. Data in (d) are averaged across all cognate frequencies as differences between cognate frequency were not statistically significant for these outputs. Simulation parameter values are found in Table I.
To determine whether the LN efficiency (i.e. the generation of primed T cells leaving the LN) varies with cognate frequency or % Ab-DC, we plotted the ratio of the cumulative primed CD4+ T cell output to the number of naïve cognate CD4+ T cells entering the LN (primed CD4/cognate CD4 T cell) (Fig. 5b). As the % Ab-DCs is increased, a saturation effect starts to be observed; this is anticipated because DCs can act catalytically – one DC can activate more than one T cell. The curves for each cognate frequency fall nearly on top of each other, indicating that LN efficiency is nearly independent of cognate frequency. The separation between the curves in Figure 5b at low values of % Ab-DC suggests that there is a slight effect of cognate frequency on the output of primed CD4+ T cells per cognate CD4+ T cell entering the LN. This effect is due to the positive feedback provided by LDCs: primed CD4+ T cells interact with Ab-DCs leading to production of LDCs which, by virtue of their higher pMHC levels, are efficient activators of CD4+ T cells. This is only apparent at low values of % Ab-DCs, where contact between T cells and DCs is less frequent. When we remove the pathway leading to LDC production, the data show no significant effect of cognate frequency on the ratio plot (Fig. 5c).
Our finding that LN efficiency is nearly independent of cognate frequency is consistent with the data of (67) who showed that CD4+ T cell populations expanded in proportion to their naïve progenitors. Thus, increasing the % Ab-DC increases the likelihood that a naïve T cell will meet its DC match, but changing the cognate frequency has no effect on LN efficiency. Although there is certainly some crowding on the grid (Fig. 2), we do not find that Ab-DCs are always completely surrounded by cognate T cells and thus unable to activate additional T cells. The evidence for this is that as the cognate CD4+ T cells frequency is increased, approximately the same percentage of T cells become activated (Fig. 5b). Fig. 5b also provides a quick assessment of the function of the LN in priming CD4+ T cells, in that for physiologically realistic values of the numbers of entering Ab-DCs during an infection, on the order of 1-4 primed CD4+ T cells will be produced for every cognate CD4+ T cell entering the LN.
We pooled the data from the simulations shown in Fig. 5b2 in order to calculate the average match percentage, search time and transit time for cognate CD4+ T cells entering the LN (Fig. 5d). As the % Ab-DCs increases, more CD4+ T cells are able to find their DC match, and more quickly, by random walk. Transit times increase with % Ab-DC because many T cells are now binding to DCs for several hours on their path through the LN. These transit times are consistent with data from whole animal experiments (68).
The calculated quantities from Fig. 5d can help us to understand the values of the ratio primed CD4/cognate CD4 T cell in Fig. 5b. For example, notice that at 50% Ab-DCs about half of the naïve cognate CD4+ T cells find their DC match. Those T cells take on average just 3 hours to find their DC match and after binding have time for 2-3 divisions. The other half of the T cells don’t find a match, and thus the primed CD4+/cognate CD4+ T cell ratio of ~ 3 reflects that a significant part of the population of entering T cells do not contribute to generation of primed CD4+ T cells leaving the LN.
3.3 Peptide-MHC levels and numbers of antigen-bearing dendritic cells trade-off to give similar levels of T cell output
There are two key parameters that characterize the role of the Ab-DC in CD4+ T cell priming: the number of Ab-DCs that enter, and the ability of each to successfully prime CD4+ T cells as quantified here by pMHCII levels. Both of these together serve also as a measure of the antigen in the system. To determine whether these parameters play equivalent roles, i.e whether a deficiency in the number of Ab-DCs can be overcome by introducing only Ab-DCs with high levels of pMHCII, we performed simulation experiments with our ABM. Pairs of values of pMHCII and % Ab-DC that gave similar cumulative (14 day) numbers of primed CD4+ T cells exiting the LN were plotted (Fig. 6). These plots demonstrate that a deficiency in one process (e.g. entry of Ab-DCs into the LN) can be compensated for by an efficiency in the other process (e.g. the display of many pMHCII by each Ab-DC). Interestingly, the slopes of the trade-off curves for 2 different cognate frequencies (1:300 vs. 1:3000) are different. At high cognate frequency (1:300), many cognate CD4+ T cells are present and opportunities for multiple T-DC contacts mean that once a minimum number of pMHC are present on the Ab-DC (here ~ 110 pMHC), there are sufficient opportunities for T cell activation, even given the low probabilities of binding and priming implied (see Fig. 3). However, at low cognate frequency (1:3000), there are fewer opportunities for DC-T cell contacting, allowing the DC parameters (% DC, pMHC levels) to play equivalent roles (indicated by the less steep slope of the trade-off curve). This trade off between % Ab-DCs and levels of pMHC has also been observed for CD8+ T cells as well, although they showed that pMHC concentration is more important, as expected because the half-life of pMHCI is much less than for the pMHCII we study here (10, 11).
Figure 6.
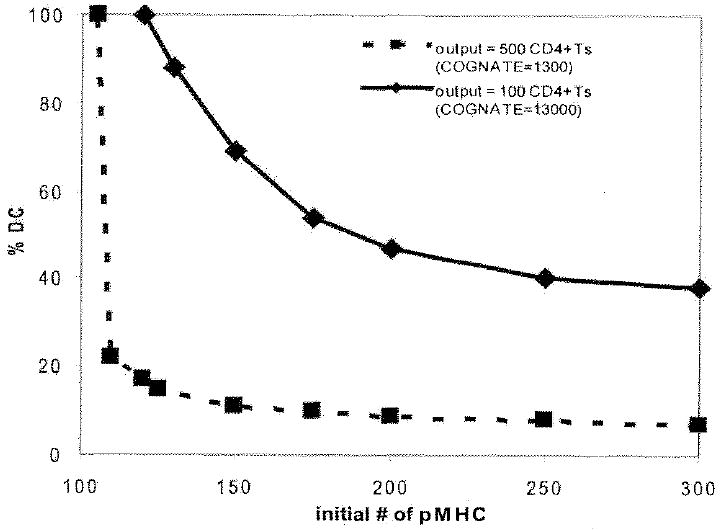
Trade-off between initial pMHC levels on DCs and % Ab-DC affect primed CD4+ T cell production. Pairs of values of the % Ab-DCs and the number of pMHCII per Ab-DC that gave the same cumulative (14 day) output of primed CD4+ T cells are plotted. Cognate frequency 1:3000 (100 cumulative primed CD4+ T cells at day 14, solid line) and cognate frequency 1:300 (500 cumulative primed CD4+ T cells at day 14, dashed line) are shown. See methods for more details of how these plots are generated.
3.4 Identification of key mechanisms that control LN output of primed CD4+ T cells
Our analysis up to this point has focused on the effect of varying the numbers of entering cells (cognate frequency, Ab-DC frequency) and the quality of those cells (pMHC number on an Ab-DC) on the LN output of primed CD4+ T cells. However, parameters that describe the efficiency and kinetics of various processes that occur within the LN also play an important role in generating primed CD4+ T cells. To identify key parameters/processes, we performed a model sensitivity analysis using a technique that allows multiple parameters to be simultaneously varied over physiologically reasonable ranges (see Methods and Supplement). When model parameters were simultaneously varied (parameters 1-16 in Table I), sensitivity analysis identified 4 parameters that have the strongest influence on the generation of primed CD4+ T cells (Table II; “Tier 1 Parameters”). As expected from earlier results (Fig. 5), these include both cognate frequency and Ab-DC frequency. The maximum number of divisions a primed cell can undergo is also significantly and positively correlated with LN output. The time it takes for a T cell to divide (division time) is significantly but negatively correlated with LN output. Note that these Tier 1 parameters identified by sensitivity analysis can be classified as either inputs into the LN or cellular properties that at least at first glance appear unrelated to DC-T cell interactions and more related to cell physiology.
TABLE II.
Results of model sensitivity analysis. Tier 1 parameters are those identified as the most significant factors affecting the cumulative (14 day) output of primed CD4+ T cells when 16 of the model parameters (from Table I) are varied (See Supplementary Tables and data not shown). Tier 2 parameters are identified as significant when 12 parameters from Table I are varied. Results are listed for two sample cognate frequencies, 1:300 and 1:3000. See Supplementary Tables for details. All values shown are p< 0,01.
| Parameter | +/- correlation | |
|---|---|---|
| TIER 1 | ||
| Cognate Frequency | - | |
| Number of divisions | + | |
| Division time | - | |
| %Ab-DC | + | |
| Parameter | +/- correlation | |
|---|---|---|
| TIER 2 | ||
| 1:300 | 1:3000 | |
| pMHC half-life | + | + |
| Unbinding threshold | - | |
| Binding threshold | - | |
| Priming threshold | - | |
To determine whether parameters describing DC-T cell interactions also significantly influence the LN output but perhaps at a more subtle level than the Tier 1 parameters, we performed a second sensitivity analysis fixing the Tier 1 parameters at biologically relevant values but allowing all other model parameters to vary over physiologically reasonable ranges (see Table I). In this way, we identified 4 additional parameters that have a significant effect on the generation of primed CD4+ T cells exiting the LN (Table II; “Tier 2 Parameters”). The Tier 2 parameters identified are all related directly to the interactions of the DC and T cells in the LN. Recall from Fig. 3 that the binding and priming thresholds determine the probability that a particular Ab-DC (or LDC) is able to bind and ultimately prime a cognate T cell. Both the binding and priming thresholds are negatively correlated with primed CD4+ T cell output because increasing either threshold lowers the probability that a T cell will be primed. Similarly, the unbinding threshold is negatively correlated with primed T cell output. At low cognate frequencies (1:3000, see Table II), these three Tier 2 parameters lose significance, indicating that there are differences between dynamics at different cognate frequencies. For a more detailed discussion, see the Supplementary Tables.
Finally, of the Tier 2 parameters, pMHC half-life is strongly correlated with primed CD4+ T cell generation and exit from the LN at both cognate frequencies. This means that if the pMHCII complexes are short-lived (the lower end of the range we tested was 30 hours) there is a significant reduction in the generation of primed CD4+ T cells. However, it is now well-documented that Ab-DCs (and similarly LDCs) can extend the half-life of the pMHCII complexes on the surface to beyond the lifespan of the DC (12-14, 69). This mechanism is evolutionary beneficial as extending the half-life of pMHC allows for continual priming of cognate T cells by DCs. Kinetic stability of peptide-MHC class II complexes has also been found to be a key parameter of immunodominance, as complexes with half-lives < 10 hours were usually cryptic, while dominant immune peptides had very long ( > 150 hours) half-lives (69, 70).
Detailed results of our sensitivity analyses are given in Supplementary Tables. We also note that model parameters not identified as Tier 1 or Tier 2 parameters can still affect LN outcome, but not as significantly, at least within the ranges tested.
3.5 Identification of pathogen-affected processes that may influence generation of primed CD4+ T cells
Pathogens are known to interfere with the immune system via several mechanisms that affect DC-T cell interactions in the LN. If the biological mechanisms identified in the sensitivity analysis (Section 3.4) were targets pathogens evolved to interfere with during infection, would the generation of primed CD4+ T cells be effected? To explore this further, we simulated these ‘pathogen affects’ on DC-T cell interactions by choosing 4 key mechanisms known to have an effect on primed CD4+ T cell generation, as identified in the sensitivity analysis (Table II) pMHCII half-life, unbinding threshold, binding threshold and priming threshold. While it is known that pathogens can affect aspects of immune system function, the extent to which individual mechanisms influence LN output of primed CD4+ T cells is unknown and not possible to quantify experimentally. To simulate these pathogen-related factors, we reduced (or increased) the mechanism under study by a standardized amount to observe the effects these changes have on the output of primed CD4+ T cells. We did this not only for each parameter independently, but also for the four chosen mechanisms (parameters) in different combinations.
Shown in Fig. 7 are cumulative (14 day) totals for primed CD4+ T cells leaving the LN. Our results show that changes in the values for each of the four mechanisms (parameters) individually reduces the output of both primed CD4+ T cells. It is interesting to consider whether pathogens would adopt a strategy that affects only a single process in the DC- T cell interaction, but what if pathogens evolved to affect multiple processes simultaneously? We explored this possibility by first combining effects to the 4 processes in groups of 2. The overall effect on primed CD4+ T cell output can be both greater than or less than the sum of the two processes acting individually. For example, when we affect both pMHC half-life and the unbinding threshold (processes 1 and 2 of Fig. 7), we get a greater than additive affect. However, when both pMHC half-life and the binding threshold (processes 1 and 3 of Fig. 7) are affected, we get a less than additive effect, on average. This follows from the non-linear relationship between binding and priming parameters (Fig. 3). We can also consider a pathogen affecting 3 or 4 processes simultaneously. When mechanisms 1,2 and 4 are simultaneously pathogen-affected, the generation of primed T cells is completed abrogated. This suggests a synergy exists between the mechanisms that operate during DC-T cell dynamics that if disrupted leads to a dramatic effect. Our result argues strongly for selection of pathogens that can interfere with multiple elements of DC-T cell interaction dynamics. In other words, a pathogen that can reduce the numbers of pMHCII (perhaps by reducing pMHC half-life) and in addition can shift the binding threshold, priming threshold, or unbinding threshold (Fig. 3) (perhaps by affecting co-stimulatory molecules) should be more successful than a pathogen that only affects one of these mechanisms.
Figure 7.

Effect of inhibition of particular mechanisms on primed CD4+ T cell output. Cumulative (14 day) CD4+ T cell output (cognate frequency 1:300) from the LN is shown for (1) reduced pMHC half-life, (2) increased unbinding threshold, (3) increased binding threshold, (4) increased priming threshold. Each parameter was reduced (or increased) by a standardized amount (lowest or highest range value and then by half as much more reduced (or added). The effect of combinations of 2,3 and 4 of these changes is also shown.
4. Discussion
Generation of an adaptive immune response begins with physical encounters between antigen-bearing DCs (Ab-DCs) and T cells whose receptors have high affinity for a specific peptide-MHC complex. Trafficking of T cells and DCs into the LN leads to multiple opportunities for contact between Ab-DCs and cognate T cells. Unfortunately, many of the fundamental processes and parameters that describe the functioning of a LN are difficult to measure experimentally. For example, 2PM studies are by necessity limited to small areas of observation (microns) and short times frames (minutes to only a few hours). Most significantly, the relationship between antigen dose (in terms of density of Ab-DCs or how laden individual DCs are with antigen), frequency of matching cognate T cells, and generation of primed CD4+ T cells is not known. Many of these questions have been recently explored for CD8+ T cells (10, 11), but these remain open for CD4+ T cells. In addition, experimental protocols to investigate such phenomena often involve infusion of cognate T cell clones or introduction of large numbers of DCs, both necessary for measurable results, but often outside the usual biological range of cell frequency or density (9). There is often an underlying assumption of proportionality, either explicitly stated in models or implicitly understood while interpreting results. For example, one might assume that if the density of Ab-DCs were reduced to 10% or 1% of the original amount, then the output would be proportionately reduced, but this is currently an open question. The implications of these relationships are important for understanding the roles that pathogens, pharmaceutical interventions, and vaccines can have on the immune response.
In this work, we develop a 2-D computational model of a complete T cell zone of a LN and its ability to generate primed CD4+ T cells, and use it to simulate the dynamics of immune cell interactions in a LN during a virtual infection (Fig. 4) over long time frames (days). The timing and the magnitude of the generation of primed CD4+ and CD8+ T cells are consistent with the (scant) data available, with more primed CD8+ than CD4+ T cells generated (64). Thus, these simulations provide a first time look at how infection (characterized by the introduction of Ab-DCs into the LN) translates into generation of primed CD4+ T cells exiting from a single LN.
Our model allows us to quantify the relationship between cognate frequency and total number of primed T cells leaving the LN over a 14 day period. Interestingly, generation and output of primed CD4+ T cell from a LN scales with naïve cognate CD4+ T cell input for a fixed Ab-DC level, with a small, positive feedback effect from the LDC pathway (Fig. 5) and 1-4 primed CD4+ T cells produced per entering naïve cognate CD4+ T cell.
We can also quantify the relationship between antigen dose and generation of primed CD4+ T cells by the LN. Antigen dose is comprised of two different factors: how many Ab-DCs enter the LN and how many pMHCs are present on the surface of these Ab-DCs (11). Increasing either the number of Ab-DC or the number of pMHC on those Ab-DCs increases the output of primed CD4+ T cells, as expected (see Figs. 5 and 6). This can be visualized as a trade-off (Fig. 6) between the number of Ab-DC and their ability to present antigen. Low values of pMHC can be compensated for by high numbers of Ap-DCs and versa.
One wonders if the 2PM experiments with their (by necessity) high cognate frequency and high numbers of Ab-DCs can give (insight into a more physiological lower frequency situation. Since extrapolation of results to situations outside the range of an experiment is fraught with error, supplementation of experimental results with the in silico simulations here is useful. Thus our results suggest how to how to extrapolate results obtained using 2PM to understand actual infection dynamics: the output of primed CD4+ T cells scales linearly with cognate frequency put non-linearly with the number of antigen-bearing DCs present (Fig. 5).
Physiological cognate frequency is not known definitively, but recent estimates in mouse (67), suggest ~ 20-200 cognate naïve CD4+ T cells out of a total population of 107, thus giving an estimate of. cognate of 1:105; if one considers multiple epitopes from a single antigen being presented by a single DC, one can imagine that the effective cognate frequency is increased by an order of magnitude (i.e. l:104). We are able to consider in our model cognate frequencies as low as 1:104. Unfortunately, estimates of the number of antigen-bearing DCs present in an actual infection are scarce. The number of antigen-bearing DCs tested here is consistent with the (scant) data available (ref), but more data are needed on this point.
Our simulations offer interesting and novel statistics on the passage of a cognate T cell through a LN (Fig. 5). The number of CD4+ T cells that find their DC match is significantly less than 100%, even at the numbers of Ab-DCs tested here, which are likely at the high end of the true physiological range. CD4+ T cells take on the order of 2-5 h to find their DC match and 16-23 h to transit through the LN, consistent with an earlier calculation for a smaller section of a LN (15) and experimental (2PM) data (6-8).
Our analysis allows us to quantify the degree to which mechanisms that are part of the DC-T cell interactions contribute to the generation of primed CD4+ T cells (Table II; Supplementary Tables; Fig. 7). Interestingly, these factors are precisely those that pathogens have been identified to inhibit. Microbes are known to alter DC-T cell interactions in multiple and even overlapping ways. Data support the effects of both bacteria and viruses on DC recruitment, maturation and survival. Herpes virus and poxvirus can encode homologs of chemokine receptors that function as chemokine antagonists and prevent recruitment of additional DCs to the site of an infection (18, 19). Shigella and Salmonella sp. can activate DC apoptosis via caspase 1 (71, 72). Vaccinia can inhibit DC maturation and induce DC death by apoptosis (73). Inhibition of DC maturation has been shown to occur via: (1) secretion of altered receptors that block interferon, TNF-α or IL-1, (2) secretion of regulatory cytokines such as viral IL-10s from Epstein-Barr virus, (3) inactivation of intracellular pathways such as HCMV to prevent surface expression of MHC-peptide complexes or (4) blocking chemokine receptors, e.g., CCR7, resulting in impairment of DC migration to the draining LN (18). Together these effects on recruitment, maturation, and survival map to our model parameters of Ab-DC frequency, licensing of DCs, and DC lifespan.
Similarly, data suggest the role of pathogens on inhibition of T cell dynamics. Bordetella pertussis generates T-reg cells that secrete IL-10 and inhibit DC secretion of IL-12, which not only helps to evade an immune response for whooping cough, but suppresses the immune response towards unrelated pathogens (74); this maps in our model to parameters that lead to priming of T cells. Viruses (e.g., measles or cytomegalovirus) (18, 75, 76) can also interfere with T cell priming, proliferation and differentiation, probably via blocking or altering cytokine secretion. Each of these types of mechanism is represented in some aspect of our model and our model suggests that the acquisition of these inhibitory mechanisms by pathogens evolved in the most optimal of ways (as all of the Tier 1 and Tier 2 parameters are used by pathogens to suppress immunity). Although the details of all of these mechanisms are not specifically represented in our model structure, they would act to shift the priming and binding curves in Figure 3 either right and/or down. In contrast, if a vaccine or drug were developed to enhance aspects of the DC-T cell interaction, then the curves would move up and/or to the right.
In sum, we show here that an in silico model can extend knowledge to spatial and temporal scales that fall well outside the range of what is feasible in actual 2PM studies. Specifically, we describe the efficiency of a LN in producing primed CD4+ T cells, demonstrate the influence of particular pathogen-influenced processes on that priming, and offer insight into the extent to which 2PM studies reflect in vivo infections. Our work compliments other computational studies on understanding priming and dynamics of CD8+ T cells (12-14) and the motion of lymphocytes on the fibroblastic reticular cell (FRC) network within the LN (16, 33). We have now reached the point at which systems biology approaches can simulate the functioning of an entire LN during infection.
Supplementary Material
Acknowledgments
We acknowledge work done by previous members of our laboratory, who helped develop prior versions of model code: Seema Bajaria, Nicholas Perry, Adrienne Walts and Laura Bickle. We thank Robin Kunkel and Kristen Angonese for artwork, and Joe Waliga for management of on-line Supplementary material. Also we thank Steve Kunkel and Joanne Flynn for helpful discussions.
Footnotes
This work was supported under grant numbers HL68526, HL72682, NO1 AI50018, LM00902701, HL092853, HL092844.
The numbers are nearly identical if you use data from the simulations used to construct Fig. 5c.
References
- 1.Randolph GJ, Angeli V, Swartz MA. Dendritic-cell trafficking to lymph nodes through lymphatic vessels. Nat Rev Immunol. 2005;5:617–628. doi: 10.1038/nri1670. [DOI] [PubMed] [Google Scholar]
- 2.Cahalan MD, Parker I. Imaging the choreography of lymphocyte trafficking and the immune response. Curr Opin Immunol. 2006;18:476–482. doi: 10.1016/j.coi.2006.05.013. [DOI] [PMC free article] [PubMed] [Google Scholar]
- 3.von Andrian UH, Mempel TR. Homing and cellular traffic in lymph nodes. Nat Rev Immunol. 2003;3:867–878. doi: 10.1038/nri1222. [DOI] [PubMed] [Google Scholar]
- 4.Catron DM, Itano AA, Pape KA, Mueller DL, Jenkins MK. Visualizing the first 50 hr of the primary immune response to a soluble antigen. Immunity. 2004;21:341–347. doi: 10.1016/j.immuni.2004.08.007. [DOI] [PubMed] [Google Scholar]
- 5.Chicz RM, Urban RG, Gorga JC, Vignali DA, Lane WS, Strominger JL. Specificity and promiscuity among naturally processed peptides bound to HLA-DR alleles. J Exp Med. 1993;178:27–47. doi: 10.1084/jem.178.1.27. [DOI] [PMC free article] [PubMed] [Google Scholar]
- 6.Miller MJ, Wei SH, Parker I, Cahalan MD. Two-photon imaging of lymphocyte motility and antigen response in intact lymph node. Science. 2002;296:1869–1873. doi: 10.1126/science.1070051. [DOI] [PubMed] [Google Scholar]
- 7.Miller MJ, Safrina O, Parker I, Cahalan MD. Imaging the single cell dynamics of CD4+ T cell activation by dendritic cells in lymph nodes. J Exp Med. 2004;200:847–856. doi: 10.1084/jem.20041236. [DOI] [PMC free article] [PubMed] [Google Scholar]
- 8.Miller MJ, Hejazi AS, Wei SH, Cahalan MD, Parker I. T cell repertoire scanning is promoted by dynamic dendritic cell behavior and random T cell motility in the lymph node. Proc Natl Acad Sci U S A. 2004;101:998–1003. doi: 10.1073/pnas.0306407101. [DOI] [PMC free article] [PubMed] [Google Scholar]
- 9.Celli S, Garcia Z, Beuneu H, Bousso P. Decoding the dynamics of T cell-dendritic cell interactions in vivo. Immunol Rev. 2008;221:182–187. doi: 10.1111/j.1600-065X.2008.00588.x. [DOI] [PubMed] [Google Scholar]
- 10.Zheng H, Jin B, Henrickson S, Perelson AS, von Andrian UH, Chakraborty AK. How antigen quantity and quality determine T cell decisions in lymphoid tissue. Mol Cell Biol. 2008;28:4040–4051. doi: 10.1128/MCB.00136-08. [DOI] [PMC free article] [PubMed] [Google Scholar]
- 11.Henrickson SE, Mempel TR, Mazo IB, Liu B, Artyomov MN, Zheng H, Peixoto A, Flynn MP, Senman B, Junt T, Wong HC, Chakraborty AK, von Andrian UH. T cell sensing of antigen dose governs interactive behavior with dendritic cells and sets a threshold for T cell activation. Nat Immunol. 2008;9:282–291. doi: 10.1038/ni1559. [DOI] [PMC free article] [PubMed] [Google Scholar]
- 12.Cella M, Engering A, Pinet V, Pieters J, Lanzavecchia A. Inflammatory stimuli induce accumulation of MHC class II complexes on dendritic cells. Nature. 1997;388:782–787. doi: 10.1038/42030. [DOI] [PubMed] [Google Scholar]
- 13.Rescigno M, Citterio S, Thery C, Rittig M, Medaglini D, Pozzi G, Amigorena S, Ricciardi-Castagnoli P. Bacteria-induced neo-biosynthesis, stabilization, and surface expression of functional class I molecules in mouse dendritic cells. Proc Natl Acad Sci U S A. 1998;95:5229–5234. doi: 10.1073/pnas.95.9.5229. [DOI] [PMC free article] [PubMed] [Google Scholar]
- 14.Rudd BD, Brien JD, Davenport MP, Nikolich-Zugich J. Cutting edge: TLR ligands increase TCR triggering by slowing peptide-MHC class I decay rates. J Immunol. 2008;181:5199–5203. doi: 10.4049/jimmunol.181.8.5199. [DOI] [PMC free article] [PubMed] [Google Scholar]
- 15.Riggs T, Walts A, Perry N, Bickle L, Lynch JN, Myers A, Flynn J, Linderman JJ, Miller MJ, Kirschner DE. A comparison of random vs chemotaxis-driven contacts of T cells with dendritic cells during repertoire scanning. J Theor Biol. 2008;250:732–751. doi: 10.1016/j.jtbi.2007.10.015. [DOI] [PMC free article] [PubMed] [Google Scholar]
- 16.Graw F, Regoes RR. Investigating CTL mediated killing with a 3D cellular automaton. PLoS Comput Biol. 2009;5:e1000466. doi: 10.1371/journal.pcbi.1000466. [DOI] [PMC free article] [PubMed] [Google Scholar]
- 17.Beltman JB, Maree AF, Lynch JN, Miller MJ, de Boer RJ. Lymph node topology dictates T cell migration behavior. J Exp Med. 2007;204:771–780. doi: 10.1084/jem.20061278. [DOI] [PMC free article] [PubMed] [Google Scholar]
- 18.Tortorella D, Gewurz BE, Furman MH, Schust DJ, Ploegh HL. Viral subversion of the immune system. Annu Rev Immunol. 2000;18:861–926. doi: 10.1146/annurev.immunol.18.1.861. [DOI] [PubMed] [Google Scholar]
- 19.McFadden G, Murphy PM. Host-related immunolmodulators encoded by poxviruses and herpesviruses. Curr Opin Immunol. 2000;3:371–378. doi: 10.1016/s1369-5274(00)00107-7. [DOI] [PubMed] [Google Scholar]
- 20.Segovia-Juarez JL, Ganguli S, Kirschner D. Identifying control mechanisms of granuloma formation during M tuberculosis infection using an agent-based model. J Theor Biol. 2004;231:357–376. doi: 10.1016/j.jtbi.2004.06.031. [DOI] [PubMed] [Google Scholar]
- 21.Bailey AM, Thorne BC, Peirce SM. Multi-cell agent-based simulation of the microvasculature to study the dynamics of circulating inflammatory cell trafficking. Ann Biomed Eng. 2007;35:916–936. doi: 10.1007/s10439-007-9266-1. [DOI] [PubMed] [Google Scholar]
- 22.Thorne BC, Bailey AM, DeSimone DW, Peirce SM. Agent-based modeling of multicell morphogenic processes during development. Birth Defects Res C Embryo Today. 2007;81:344–353. doi: 10.1002/bdrc.20106. [DOI] [PubMed] [Google Scholar]
- 23.Thorne BC, Bailey AM, Peirce SM. Combining experiments with multi-cell agent-based modeling to study biological tissue patterning. Brief Bioinform. 2007;8:245–257. doi: 10.1093/bib/bbm024. [DOI] [PubMed] [Google Scholar]
- 24.Casal A, Sumen C, Reddy TE, Alber MS, Lee PP. Agent-based modeling of the context dependency in T cell recognition. J Theor Biol. 2005;236:376–391. doi: 10.1016/j.jtbi.2005.03.019. [DOI] [PubMed] [Google Scholar]
- 25.An G. In silico experiments of existing and hypothetical cytokine-directed clinical trials using agent-based modeling. Crit Care Med. 2004;32:2050–2060. doi: 10.1097/01.ccm.0000139707.13729.7d. [DOI] [PubMed] [Google Scholar]
- 26.Chavali AK, Gianchandani EP, Tung KS, Lawrence MB, Peirce SM, Papin JA. Characterizing emergent properties of immunological systems with multi-cellular rule-based computational modeling. Trends Immunol. 2008;29:589–599. doi: 10.1016/j.it.2008.08.006. [DOI] [PubMed] [Google Scholar]
- 27.Figge MT, Garin A, Gunzer M, Kosco-Vilbois M, Toellner KM, Meyer-Hermann M. Deriving a germinal center lymphocyte migration model from two-photon data. J Exp Med. 2008;205:3019–3029. doi: 10.1084/jem.20081160. [DOI] [PMC free article] [PubMed] [Google Scholar]
- 28.Mallet DG, De Pillis LG. A cellular automata model of tumor-immune system interactions. J Theor Biol. 2006;239:334–350. doi: 10.1016/j.jtbi.2005.08.002. [DOI] [PubMed] [Google Scholar]
- 29.Beauchemin C, Samuel J, Tuszynski J. A simple cellular automaton model for influenza A viral infections. J Theor Biol. 2005;232:223–234. doi: 10.1016/j.jtbi.2004.08.001. [DOI] [PubMed] [Google Scholar]
- 30.Marino S, Pawar S, Fuller CL, Reinhart TA, Flynn JL, Kirschner DE. Dendritic cell trafficking and antigen presentation in the human immune response to Mycobacterium tuberculosis. J Immunol. 2004;173:494–506. doi: 10.4049/jimmunol.173.1.494. [DOI] [PubMed] [Google Scholar]
- 31.Bauer A, Beauchemin C, Perelson A. Agent-based modeling of host-pathogen systems: The successes and challenges. Information Sciences. 2009;179:1379–1389. doi: 10.1016/j.ins.2008.11.012. [DOI] [PMC free article] [PubMed] [Google Scholar]
- 32.Marino S, Hogue IB, Ray CJ, Kirschner DE. A methodology for performing global uncertainty and sensitivity analysis in systems biology. Journal of Theoretical Biology. 2008;254:178–196. doi: 10.1016/j.jtbi.2008.04.011. [DOI] [PMC free article] [PubMed] [Google Scholar]
- 33.Mueller SN, Germain RN. Stromal cell contributions to the homeostasis and functionality of the immune system. Nat Rev Immunol. 2009;9:618–629. doi: 10.1038/nri2588. [DOI] [PMC free article] [PubMed] [Google Scholar]
- 34.Bajenoff M, Glaichenhaus N, Germain RN. Fibroblastic reticular cells guide T lymphocyte entry into and migration within the splenic T cell zone. J Immunol. 2008;181:3947–3954. doi: 10.4049/jimmunol.181.6.3947. [DOI] [PMC free article] [PubMed] [Google Scholar]
- 35.Villadangos JA, Schnorrer P. Intrinsic and cooperative antigen-presenting functions of dendritic-cell subsets in vivo. Nat Rev Immunol. 2007;7:543–555. doi: 10.1038/nri2103. [DOI] [PubMed] [Google Scholar]
- 36.Carreno LJ, Bueno SM, Bull P, Nathenson SG, Kalergis AM. The half-life of the T-cell receptor/peptide-major histocompatibility complex interaction can modulate T-cell activation in response to bacterial challenge. Immunology. 2007;121:227–237. doi: 10.1111/j.1365-2567.2007.02561.x. [DOI] [PMC free article] [PubMed] [Google Scholar]
- 37.Lee BO, Haynes L, Eaton SM, Swain SL, Randall TD. The biological outcome of CD40 signaling is dependent on the duration of CD40 ligand expression: reciprocal regulation by interleukin (IL)-4 and IL-12. J Exp Med. 2002;196:693–704. doi: 10.1084/jem.20020845. [DOI] [PMC free article] [PubMed] [Google Scholar]
- 38.Sporri R, Reis e Sousa C. Inflammatory mediators are insufficient for full dendritic cell activation and promote expansion of CD4+ T cell populations lacking helper function. Nat Immunol. 2005;6:163–170. doi: 10.1038/ni1162. [DOI] [PubMed] [Google Scholar]
- 39.Blattman JN, Antia R, Sourdive DJ, Wang X, Kaech SM, Murali-Krishna K, Altman JD, Ahmed R. Estimating the precursor frequency of naive antigen-specific CD8 T cells. J Exp Med. 2002;195:657–664. doi: 10.1084/jem.20001021. [DOI] [PMC free article] [PubMed] [Google Scholar]
- 40.Casrouge A, Beaudoing E, Dalle S, Pannetier C, Kanellopoulos J, Kourilsky P. Size estimate of the alpha beta TCR repertoire of naive mouse splenocytes. J Immunol. 2000;164:5782–5787. doi: 10.4049/jimmunol.164.11.5782. [DOI] [PubMed] [Google Scholar]
- 41.Mempel TR, Henrickson SE, Von Andrian UH. T-cell priming by dendritic cells in lymph nodes occurs in three distinct phases. Nature. 2004;427:154–159. doi: 10.1038/nature02238. [DOI] [PubMed] [Google Scholar]
- 42.Brophy SE, Jones LL, Holler PD, Kranz DM. Cellular uptake followed by class I MHC presentation of some exogenous peptides contributes to T cell stimulatory capacity. Mol Immunol. 2007;44:2184–2194. doi: 10.1016/j.molimm.2006.11.016. [DOI] [PMC free article] [PubMed] [Google Scholar]
- 43.Skokos D, Shakhar G, Varma R, Waite JC, Cameron TO, Lindquist RL, Schwickert T, Nussenzweig MC, Dustin ML. Peptide-MHC potency governs dynamic interactions between T cells and dendritic cells in lymph nodes. Nat Immunol. 2007;8:835–844. doi: 10.1038/ni1490. [DOI] [PubMed] [Google Scholar]
- 44.Bousso P, Robey E. Dynamics of CD8+ T cell priming by dendritic cells in intact lymph nodes. Nat Immunol. 2003;4:579–585. doi: 10.1038/ni928. [DOI] [PubMed] [Google Scholar]
- 45.Turner SJ, Doherty PC, McCluskey J, Rossjohn J. Structural determinants of T-cell receptor bias in immunity. Nat Rev Immunol. 2006;6:883–894. doi: 10.1038/nri1977. [DOI] [PubMed] [Google Scholar]
- 46.Celli S, Lemaitre F, Bousso P. Real-time manipulation of T cell-dendritic cell interactions in vivo reveals the importance of prolonged contacts for CD4+ T cell activation. Immunity. 2007;27:625–634. doi: 10.1016/j.immuni.2007.08.018. [DOI] [PubMed] [Google Scholar]
- 47.Obst R, van Santen HM, Mathis D, Benoist C. Antigen persistence is required throughout the expansion phase of a CD4(+) T cell response. J Exp Med. 2005;201:1555–1565. doi: 10.1084/jem.20042521. [DOI] [PMC free article] [PubMed] [Google Scholar]
- 48.Chang ST, Linderman JJ, Kirschner DE. Effect of multiple genetic polymorphisms on antigen presentation and susceptibility to Mycobacterium tuberculosis infection. Infect Immun. 2008;76:3221–3232. doi: 10.1128/IAI.01677-07. [DOI] [PMC free article] [PubMed] [Google Scholar]
- 49.Utzny C, Coombs D, Muller S, Valitutti S. Analysis of peptide/MHC-induced TCR downregulation: deciphering the triggering kinetics. Cell Biochem Biophys. 2006;46:101–111. doi: 10.1385/CBB:46:2:101. [DOI] [PubMed] [Google Scholar]
- 50.Lee KH, Dinner AR, Tu C, Campi G, Raychaudhuri S, Varma R, Sims TN, Burack WR, Wu H, Wang J, Kanagawa O, Markiewicz M, Allen PM, Dustin ML, Chakraborty AK, Shaw AS. The immunological synapse balances T cell receptor signaling and degradation. Science. 2003;302:1218–1222. doi: 10.1126/science.1086507. [DOI] [PubMed] [Google Scholar]
- 51.Smith CM, Wilson NS, Waithman J, Villadangos JA, Carbone FR, Heath WR, Belz GT. Cognate CD4(+) T cell licensing of dendritic cells in CD8(+) T cell immunity. Nat Immunol. 2004;5:1143–1148. doi: 10.1038/ni1129. [DOI] [PubMed] [Google Scholar]
- 52.Obregon C, Rothen-Rutishauser B, Gitahi SK, Gehr P, Nicod LP. Exovesicles from human activated dendritic cells fuse with resting dendritic cells, allowing them to present alloantigens. Am J Pathol. 2006;169:2127–2136. doi: 10.2353/ajpath.2006.060453. [DOI] [PMC free article] [PubMed] [Google Scholar]
- 53.Thery C, Duban L, Segura E, Veron P, Lantz O, Amigorena S. Indirect activation of naive CD4+ T cells by dendritic cell-derived exosomes. Nat Immunol. 2002;3:1156–1162. doi: 10.1038/ni854. [DOI] [PubMed] [Google Scholar]
- 54.McCune JM, Hanley MB, Cesar D, Halvorsen R, Hoh R, Schmidt D, Wieder E, Deeks S, Siler S, Neese R, Hellerstein M. Factors influencing T-cell turnover in HIV-1-seropositive patients. J Clin Invest. 2000;105:R1–8. doi: 10.1172/JCI8647. [DOI] [PMC free article] [PubMed] [Google Scholar]
- 55.Sprent J, Tough DF. T cell death and memory. Science. 2001;293:245–248. doi: 10.1126/science.1062416. [DOI] [PubMed] [Google Scholar]
- 56.Lanzavecchia A, Sallusto F. Lead and follow: the dance of the dendritic cell and T cell. Nat Immunol. 2004;5:1201–1202. doi: 10.1038/ni1204-1201. [DOI] [PubMed] [Google Scholar]
- 57.Lindquist RL, Shakhar G, Dudziak D, Wardemann H, Eisenreich T, Dustin ML, Nussenzweig MC. Visualizing dendritic cell networks in vivo. Nat Immunol. 2004;5:1243–1250. doi: 10.1038/ni1139. [DOI] [PubMed] [Google Scholar]
- 58.Foulds KE, Zenewicz LA, Shedlock DJ, Jiang J, Troy AE, Shen H. Cutting edge: CD4 and CD8 T cells are intrinsically different in their proliferative responses. J Immunol. 2002;168:1528–1532. doi: 10.4049/jimmunol.168.4.1528. [DOI] [PubMed] [Google Scholar]
- 59.Bekkhoucha F, Naquet P, Pierres A, Marchetto S, Pierres M. Efficiency of antigen presentation to T cell clones by (B cell X B cell lymphoma) hybridomas correlates quantitatively with cell surface ia antigen expression. Eur J Immunol. 1984;14:807–814. doi: 10.1002/eji.1830140908. [DOI] [PubMed] [Google Scholar]
- 60.Demotz S, Grey HM, Sette A. The minimal number of class II MHC-antigen complexes needed for T cell activation. Science. 1990;249:1028–1030. doi: 10.1126/science.2118680. [DOI] [PubMed] [Google Scholar]
- 61.Kamath AT, Henri S, Battye F, Tough DF, Shortman K. Developmental kinetics and lifespan of dendritic cells in mouse lymphoid organs. Blood. 2002;100:1734–1741. [PubMed] [Google Scholar]
- 62.Vermaelen KY, Carro-Muino I, Lambrecht BN, Pauwels RA. Specific migratory dendritic cells rapidly transport antigen from the airways to the thoracic lymph nodes. J Exp Med. 2001;193:51–60. doi: 10.1084/jem.193.1.51. [DOI] [PMC free article] [PubMed] [Google Scholar]
- 63.Kirschner DE, Chang ST, Riggs TW, Perry N, Linderman JJ. Toward a multiscale model of antigen presentation in immunity. Immunol Rev. 2007;216:93–118. doi: 10.1111/j.1600-065X.2007.00490.x. [DOI] [PubMed] [Google Scholar]
- 64.De Boer RJ, Homann D, Perelson AS. Different dynamics of CD4+ and CD8+ T cell responses during and after acute lymphocytic choriomeningitis virus infection. J Immunol. 2003;171:3928–3935. doi: 10.4049/jimmunol.171.8.3928. [DOI] [PubMed] [Google Scholar]
- 65.Celli S, Garcia Z, Bousso P. CD4 T cells integrate signals delivered during successive DC encounters in vivo. J Exp Med. 2005;202:1271–1278. doi: 10.1084/jem.20051018. [DOI] [PMC free article] [PubMed] [Google Scholar]
- 66.Takahashi K, Kenji A, Norihiro T, Eisaku K, Takashi O, Kazuhiko H, Tadashi Y, Tadaatsu A. Morphological interactions of interdigitating dendritic cells with B and T cells in human mesenteric lymph nodes. Am J Pathol. 2001;159:131–138. doi: 10.1016/S0002-9440(10)61680-X. [DOI] [PMC free article] [PubMed] [Google Scholar]
- 67.Moon JJ, Chu HH, Pepper M, McSorley SJ, Jameson SC, Kedl RM, Jenkins MK. Naive CD4(+) T cell frequency varies for different epitopes and predicts repertoire diversity and response magnitude. Immunity. 2007;27:203–213. doi: 10.1016/j.immuni.2007.07.007. [DOI] [PMC free article] [PubMed] [Google Scholar]
- 68.Westermann J, Puskas Z, Pabst R. Blood transit and recirculation kinetics of lymphocyte subsets in normal rats. Scand J Immunol. 1988;28:203–210. doi: 10.1111/j.1365-3083.1988.tb02432.x. [DOI] [PubMed] [Google Scholar]
- 69.Sant AJ, Chaves FA, Jenks SA, Richards KA, Menges P, Weaver JM, Lazarski CA. The relationship between immunodominance, DM editing, and the kinetic stability of MHC class II: peptide complexes. Immunol Rev. 2005;207:261–278. doi: 10.1111/j.0105-2896.2005.00307.x. [DOI] [PubMed] [Google Scholar]
- 70.Lazarski CA, Chaves FA, Jenks SA, Wu S, Richards KA, Weaver JM, Sant AJ. The kinetic stability of MHC class II: peptide complexes is a key parameter that dictates immunodominance. Immunity. 2005;23:29–40. doi: 10.1016/j.immuni.2005.05.009. [DOI] [PubMed] [Google Scholar]
- 71.Yrlid U, Svensson M, Kirby A, Wick MJ. Antigen-presenting cells and anti-Salmonella immunity. Microbes Infect. 2001;3:1239–1248. doi: 10.1016/s1286-4579(01)01484-8. [DOI] [PubMed] [Google Scholar]
- 72.Yrlid U, Wick MJ. Salmonella-induced apoptosis of infected macrophages results in presentation of a bacteria-encoded antigen after uptake by bystander dendritic cells. J Exp Med. 2000;191:613–624. doi: 10.1084/jem.191.4.613. [DOI] [PMC free article] [PubMed] [Google Scholar]
- 73.Engelmayer J, Larsson M, Subklewe M, Chahroudi A, Cox WI, Steinman RM, Bhardwaj N. Vaccinia virus inhibits the maturation of human dendritic cells: a novel mechanism of immune evasion. J Immunol. 1999;163:6762–6768. [PubMed] [Google Scholar]
- 74.McGuirk P, McCann C, Mills KH. Pathogen-specific T regulatory 1 cells induced in the respiratory tract by a bacterial molecule that stimulates interleukin 10 production by dendritic cells: a novel strategy for evasion of protective T helper type 1 responses by Bordetella pertussis. J Exp Med. 2002;195:221–231. doi: 10.1084/jem.20011288. [DOI] [PMC free article] [PubMed] [Google Scholar]
- 75.Raftery MJ, Schwab M, Eibert SM, Samstag Y, Walczak H, Schonrich G. Targeting the function of mature dendritic cells by human cytomegalovirus: a multilayered viral defense strategy. Immunity. 2001;15:997–1009. doi: 10.1016/s1074-7613(01)00239-4. [DOI] [PubMed] [Google Scholar]
- 76.Kelleher P, Maroof A, Knight SC. Retrovirally induced switch from production of IL-12 to IL-4 in dendritic cells. Eur J Immunol. 1999;29:2309–2318. doi: 10.1002/(SICI)1521-4141(199907)29:07<2309::AID-IMMU2309>3.0.CO;2-5. [DOI] [PubMed] [Google Scholar]
Associated Data
This section collects any data citations, data availability statements, or supplementary materials included in this article.