

Abstract
We previously provided evidence that plastid signaling regulates the downstream components of a light signaling network and that this signal integration coordinates chloroplast biogenesis with both the light environment and development by regulating gene expression. We tested these ideas by analyzing light- and plastid-regulated transcriptomes in Arabidopsis (Arabidopsis thaliana). We found that the enrichment of Gene Ontology terms in these transcriptomes is consistent with the integration of light and plastid signaling (1) down-regulating photosynthesis and inducing both repair and stress tolerance in dysfunctional chloroplasts and (2) helping coordinate processes such as growth, the circadian rhythm, and stress responses with the degree of chloroplast function. We then tested whether factors that contribute to this signal integration are also regulated by light and plastid signals by characterizing T-DNA insertion alleles of genes that are regulated by light and plastid signaling and that encode proteins that are annotated as contributing to signaling, transcription, or no known function. We found that a high proportion of these mutant alleles induce chloroplast biogenesis during deetiolation. We quantified the expression of four photosynthesis-related genes in seven of these enhanced deetiolation (end) mutants and found that photosynthesis-related gene expression is attenuated. This attenuation is particularly striking for Photosystem II subunit S expression. We conclude that the integration of light and plastid signaling regulates a number of END genes that help optimize chloroplast function and that at least some END genes affect photosynthesis-related gene expression.
Chloroplasts underpin agriculture and indeed life on earth because they perform photosynthesis and other essential metabolic activities in plants. Chloroplasts are derived from nonphotosynthetic proplastids during the development of photosynthetic organs such as cotyledons and leaves and are maintained until these photosynthetic organs senesce (Wise, 2007; Pogson and Albrecht, 2011). Regulated gene expression plays a major role in chloroplast biogenesis and maintenance and is complex on at least two levels: (1) chloroplast function requires the coordinated expression of both the nuclear and chloroplast genomes; and (2) the gene expression that drives chloroplast biogenesis is regulated by a number of environmental and endogenous cues. Light is a major driver of chloroplast biogenesis and function, not only because light is a major regulator of chloroplast-related gene expression but also because a light-dependent enzyme is required for chlorophyll biosynthesis (Masuda and Fujita, 2008; Waters and Langdale, 2009; Pogson and Albrecht, 2011). In addition to light, endogenous cues such as the circadian rhythm, hormones, and carbohydrates are important regulators of photosynthesis-related gene expression (Rook et al., 2006; Pruneda-Paz and Kay, 2010). All of these extraplastidic cues constitute the anterograde control of chloroplast biogenesis and function. Anterograde control is not the sole regulator of chloroplast biogenesis and function. The chloroplast emits signals that have major effects on the expression of nuclear genes. This retrograde plastid-to-nucleus signaling helps coordinate nuclear gene expression with the functional state of the chloroplast. A bidirectional exchange of information between the nucleus and the plastid (i.e. anterograde control and retrograde signaling) is thought to help coordinate the expression of the nuclear and chloroplast genomes and promote chloroplast biogenesis and function (Woodson and Chory, 2008). Such bidirectional communication that promotes homeostasis in various conditions is well established between the mitochondria and the nucleus and between the endoplasmic reticulum and the nucleus (Liu and Butow, 2006; Ron and Walter, 2007).
Light signaling regulates approximately 20% of the transcriptome in Arabidopsis (Arabidopsis thaliana) and rice (Oryza sativa). Light signals affect transcription by regulating a number of photoreceptors and downstream signaling components. Light signaling mechanisms include the regulation of activity, subcellular localization, and the concentration of particular photoreceptors and downstream signaling components (Jiao et al., 2007; Chory, 2010).
Plastid signals help coordinate the expression of photosynthesis-related genes and stress-related nuclear genes with plastid function. These signals can contribute to the biogenesis of chloroplasts and to the maintenance of chloroplasts (Larkin and Ruckle, 2008; Pogson et al., 2008; Woodson and Chory, 2008; Galvez-Valdivieso and Mullineaux, 2010; Lemeille and Rochaix, 2010; Padmanabhan and Dinesh-Kumar, 2010). Plastid signals can also help coordinate development with chloroplast function (Yu et al., 2007; Ruckle and Larkin, 2009; Cottage et al., 2010). Although plastid signaling is linked to the production of 3′-phosphoadenosine 5′-phosphate, reactive oxygen species (ROS), photosynthetic electron transport, chloroplast dysfunction, defective plastid-protein import, and tetrapyrrole metabolism, major gaps remain in our understanding of most plastid signaling mechanisms (Larkin and Ruckle, 2008; Pogson et al., 2008; Woodson and Chory, 2008; Kakizaki et al., 2009; Galvez-Valdivieso and Mullineaux, 2010; Liu et al., 2010; Enami et al., 2011; Estavillo et al., 2011; Woodson et al., 2011). Nonetheless, we do have information on several plastid-to-nucleus signaling mechanisms. 3′-Phosphoadenosine 5′-phosphate is a plastid signal that contributes to drought tolerance and intense-light tolerance at least in part by inhibiting the 5′-to-3′ exoribonucleases that affect nuclear gene expression (Estavillo et al., 2011). Plastid-to-nucleus signaling that is triggered by chloroplast dysfunction contributes to chloroplast biogenesis by means of mechanisms that depend on the chloroplastic pentatricopeptide repeat protein GENOMES UNCOUPLED1 (GUN1) and on light signaling (Danon et al., 2006; Ruckle et al., 2007; Woodson and Chory, 2008). GUN1-dependent plastid signals require a chloroplast-tethered transcription factor (Sun et al., 2011) and the nuclear transcription factor ABA-INSENSITIVE4 (ABI4) to regulate transcription (Koussevitzky et al., 2007). Plastidic tetrapyrrole metabolism is suggested to affect nuclear gene expression by means of a mechanism that depends on the cytosolic heat shock 90-type proteins and the bZIP transcription factor LONG HYPOCOTYL5 (HY5) (Kindgren et al., 2011). In Cyanidioschyzon merolae and potentially in BY2 cells, the chlorophyll precursor Mg-protoporphyrin IX helps coordinate DNA replication in the nucleus and in other organelles by binding and regulating an F-box protein that targets proteins for degradation by the proteasome (Kobayashi et al., 2009, 2011).
Light and plastid signals are known to regulate the expression of a number of the same photosynthesis-related genes (Oelmüller, 1989; Gray et al., 2003; Larkin and Ruckle, 2008; Woodson and Chory, 2008). The finding that plastid signals can regulate photosynthesis-related gene expression in the dark (Sullivan and Gray, 1999; Ruckle et al., 2007; Cottage et al., 2008) provides evidence that light and plastid-to-nucleus signaling can independently regulate photosynthesis-related gene expression. However, recent findings indicate that although the plastid signals that depend on GUN1 can regulate photosynthesis-related gene expression in the dark, genetically distinct plastid signals can affect light signaling (Ruckle et al., 2007). Ruckle et al. (2007) demonstrated that the plastid dysfunction caused by inhibitors of chloroplast biogenesis can convert the light signaling that positively regulates Lhcb1 expression in seedlings that contain well-functioning chloroplasts to a negative regulator of Lhcb1 expression in seedlings that contain dysfunctional chloroplasts. This “rewiring” of light signaling largely results from plastid signals converting the bZIP transcription factor HY5 that acts downstream of cryptochrome 1 (cry1) from a positive to a negative regulator of Lhcb1. This integration of light and plastid signaling appears important for efficient chloroplast biogenesis (Ruckle et al., 2007). Additionally, Danon et al. (2006) demonstrated that a light-induced programmed cell death response that is triggered by the overaccumulation of singlet oxygen in the chloroplast depends on cry1. Based on these findings, the integration of light and plastid signaling was proposed to help balance the many processes that are required for optimal chloroplast function (Ruckle et al., 2007; Larkin and Ruckle, 2008). This signal integration also appears to help coordinate development and chloroplast function (Ruckle and Larkin, 2009).
A number of studies have tested for effects of light signaling and plastid-to-nucleus signaling on transcriptomes. However, previous analyses of light-regulated transcriptomes did not test for effects of plastid signaling (Ma et al., 2003; Tepperman et al., 2004, 2006; Jiao et al., 2007; Leivar et al., 2009; Shin et al., 2009). Previous analyses of plastid-regulated transcriptomes did not distinguish between the effects of light signaling, plastid signaling, and the integration of light and plastid signaling on transcriptomes (Strand et al., 2003; Koussevitzky et al., 2007; Aluru et al., 2009). Previous analyses of transcriptomes regulated by the plastidic ROS that converts cry1 signaling from a process that promotes chloroplast function to one that promotes albinism and cell death focused only on rapidly regulated genes (op den Camp et al., 2003; Danon et al., 2006), which may explain the low abundance of photosynthesis-related genes in the data sets of op den Camp et al. (2003) and Danon et al. (2006).
In this study, our objectives were (1) to determine the biological significance of the integration of light and plastid signaling and (2) to identify genes that contribute to the integration of light and plastid signaling. To determine the biological significance, we tested for the enrichment of Gene Ontology (GO) terms in the transcriptomes that are regulated by light signaling, plastid signaling, and the integration of light and plastid signaling. We analyzed transcriptomes over a period of 24 h to ensure that we determined the full impact of the integration of light and plastid signaling on the transcriptome. To determine which biological processes are positively and negatively regulated by the integration of light and plastid signaling, we tested whether particular GO terms are significantly enriched in each expression pattern. To identify genes that contribute to the integration of light and plastid signaling, we obtained T-DNA insertion alleles of genes that are significantly regulated by light and plastid signaling and that are annotated as encoding proteins that contribute to signaling, transcription, or no known function. We then used our list of significantly enriched GO terms to guide our phenotypic characterization of these mutants. Similar reverse genetic strategies previously yielded signaling factors for light, plastid, and jasmonic acid (JA) signaling (Khanna et al., 2006; Thines et al., 2007; Kakizaki et al., 2009). The findings from our transcriptome and reverse genetic analyses provide evidence that plastid signaling promotes chloroplast function by regulating light signaling and that the plastid can rewire light signaling by regulating the expression of particular genes.
RESULTS AND DISCUSSION
Light signaling induces the expression of photosynthesis-related nuclear genes such as the Lhcb1 and RbcS genes in seedlings that contain well-functioning chloroplasts (Tyagi and Gaur, 2003; Jiao et al., 2007). In contrast, when seedlings are grown on medium that contains lincomycin, increasing the fluence rate of white light represses the expression of Lhcb1 and attenuates the light-induced expression of RbcS (Ruckle et al., 2007). Blue and red light appear mostly if not entirely responsible for this repressive effect of white light (Ruckle et al., 2007). Lincomycin is an antibiotic that functions as a light-independent inhibitor of chloroplast biogenesis by inhibiting plastid translation. Lincomycin does not appear to affect translation in mitochondria or the biogenesis of mitochondria (Sullivan and Gray, 1999; Mulo et al., 2003; Doyle et al., 2010).
To further study these interactions between light and plastid signaling, we grew Arabidopsis ecotype Columbia-0 seedlings in 40% blue and 60% red (BR) light in either the presence or the absence of lincomycin, as described previously (Ruckle et al., 2007). After 6 d of growth in 0.5 μmol m−2 s−1 BR light, we transferred these seedlings to 60 μmol m−2 s−1 BR light. We observed a 2-fold increase in the levels of mRNA transcribed from Lhcb1 and an 11-fold increase in the levels of mRNA transcribed from RbcS in untreated seedlings at 24 h after this fluence-rate shift (Fig. 1), which is consistent with previous reports (Gao and Kaufman, 1994; Reed et al., 1994; Terzaghi and Cashmore, 1995; Mazzella et al., 2001; Martínez-Hernández et al., 2002). We also observed 2- and 6-fold decreases in Lhcb1 mRNA levels at 4 and 24 h after this fluence-rate shift in lincomycin-treated seedlings (Fig. 1A). In contrast, the light-induced expression of RbcS was attenuated in lincomycin-treated relative to untreated seedlings (Fig. 1B). These data are consistent with previous work (Ruckle et al., 2007) and also indicate that the repression of Lhcb1 expression by light in lincomycin-treated seedlings is a rapid response. RNA-blot hybridization analysis indicates that these RNA preparations are of high integrity (Supplemental Fig. S1, A and B). Based on this analysis of Lhcb1 and RbcS expression, we conclude that this 0.5 to 60 μmol m−2 s−1 BR fluence-rate-shift procedure is useful for studying the impact of the integration of light and plastid signaling on the transcriptome.
Figure 1.
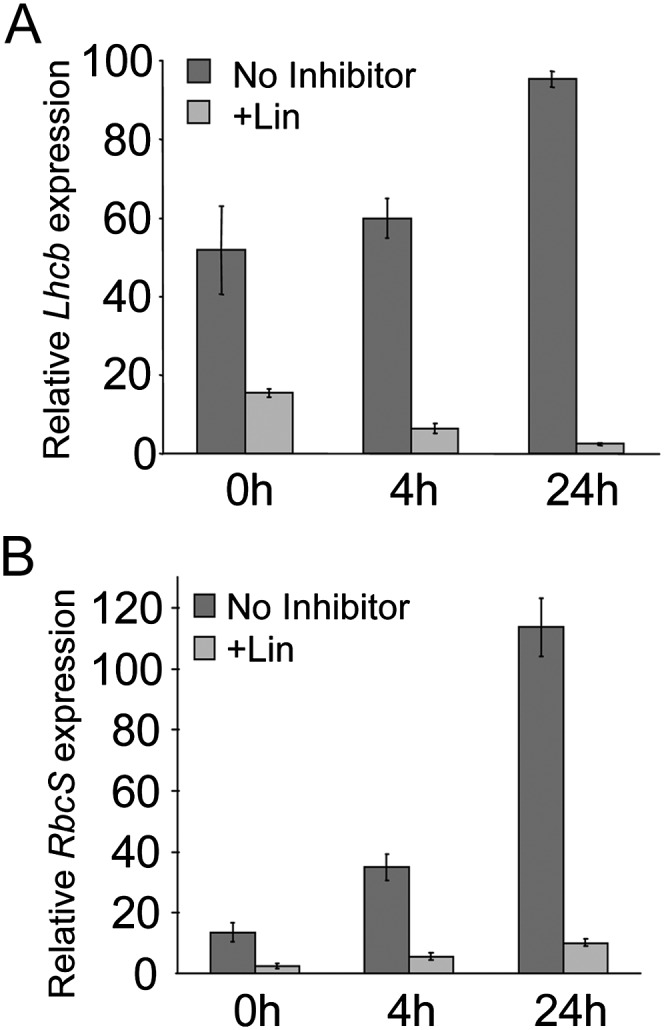
Lhcb1 and RbcS expression following a fluence-rate shift. A, Lhcb1 expression following a fluence-rate shift. Seedlings were grown for 6 d in 0.5 μmol m−2 s−1 BR light and then transferred to 60 μmol m−2 s−1 BR light. Seedlings were collected and RNA was extracted at 0, 0.5, 1, 4, and 24 h following the fluence-rate shift. The levels of Lhcb1 mRNA relative to Lhcb1 mRNA levels at 24 h were determined from four biological replicates and quantified from RNA blots as described by Ruckle et al. (2007). B, RbcS expression following a fluence-rate shift. RNA was extracted and quantified as described in A.
The Plastid Regulates Approximately Half of Light-Regulated Genes
To test the extent to which plastid signals remodel the light-regulated transcriptome, we analyzed transcriptomes in lincomycin-treated and untreated seedlings before (0 h) and 0.5, 1, 4, and 24 h after a 0.5 to 60 μmol m−2 s−1 BR fluence-rate shift, as described above, using the Affymetrix GeneChip ATH1. We found that the fluence-rate shift significantly changes the expression of 6,424 genes by 2-fold or more relative to the 0-h control (Fig. 2A). By comparing transcriptomes in lincomycin-treated and untreated seedlings, we found that nearly half of these light-regulated genes were also significantly regulated by the plastid, as judged by the lincomycin treatment (Fig. 2A). Only 680 genes were significantly regulated by only the lincomycin treatment and were not significantly regulated by the fluence-rate shift (Fig. 2A).
Figure 2.

The light-regulated transcriptomes of lincomycin-treated and untreated seedlings. A, Venn diagram of light- and plastid-regulated genes. Light-regulated genes are defined as those that are expressed 2-fold higher or lower (P ≤ 0.01) at 0.5, 1, 4, or 24 h after the fluence-rate shift than before the shift (0 h). Plastid-regulated genes are those that meet the same fold change and significance criteria used to classify a gene as light regulated when the expression level of a particular gene in lincomycin-treated (+Lin) seedlings is normalized to the expression level in untreated (−Lin) seedlings at the same time point. The numbers of significantly regulated genes are indicated. B, Numbers of genes regulated by light and lincomycin treatment after a BR fluence-rate shift. Numbers of genes that exhibited a significantly different expression level in +Lin or −Lin seedlings at 0.5, 1, 4, and 24 h after a BR fluence-rate shift are indicated. The 3,335 genes that are significantly regulated only by light are indicated with red and light red. The 3,089 genes that are regulated by both light and lincomycin treatment are indicated with purple and light purple. Plastid regulation is presented for the 3,089 genes that are regulated by light and plastid signals in blue and light blue. The plastid regulation for the 680 genes regulated only by the plastid is presented in green and light green. C, Principal component analysis of the lincomycin treatment affecting the light-regulated transcriptome. Trajectory plots show the first principal component (PC1) and the second principal component (PC2), which are two orthogonal factors that describe 61% and 18%, respectively, of the variance caused by the BR fluence-rate shift. D, Principal component analysis of the BR fluence-rate shift affecting the lincomycin-regulated transcriptome. These trajectory plots show PC1 and PC2, which account for 79% and 21%, respectively, of the variance in the data set. E, Agglomerative hierarchical clustering of the 7,104 significantly regulated genes based on their regulation by the BR fluence-rate shift. Nine basic expression patterns were identified (A–I). F, Agglomerative hierarchical clustering of the 7,104 significantly regulated genes based on their regulation by lincomycin treatment. Eight basic expression patterns were identified (J–Q).
We found that the number of light-regulated genes only increases with time after the BR fluence-rate shift (Fig. 2B), which is consistent with previous work (Jiao et al., 2007). We observed this trend regardless of whether seedlings were grown on medium that contained lincomycin. We found that 2- to 4-fold more of the genes that are significantly regulated by the fluence-rate shift are regulated by the fluence-rate shift in untreated seedlings than in lincomycin-treated seedlings (Fig. 2B, red and purple bars). The lincomycin treatment reducing photoreceptor activity is an unlikely explanation for these results because Arabidopsis seedlings that are treated with inhibitors of chloroplast biogenesis retain phytochrome and cry1 activity (Mochizuki et al., 2001; Ruckle and Larkin, 2009). Thus, like hormones and organ-specific signals (Jiao et al., 2007; Jaillais and Chory, 2010), plastid signals can serve as major regulators of light signaling.
A trajectory plot indicates a large divergence between the first principal component of the variance and the second principal component of the variance of lincomycin-treated and untreated seedlings at the later time points (Fig. 2C). Thus, the transcriptomes of lincomycin-treated seedlings and untreated seedlings become more distinct as time increases following the BR fluence-rate shift. Consistent with these data, agglomerative hierarchical clustering of the expression patterns indicates that light regulates the expression of more genes in untreated seedlings than in lincomycin-treated seedlings, especially at 4 and 24 h (Fig. 2, E and F; Supplemental Fig. S2, A–F). Agglomerative hierarchical clustering was also useful for identifying genes in several clusters that resemble the Lhcb1 genes in that plastid dysfunction converts light from a positive to a negative regulator or vice versa (Fig. 2E; Supplemental Fig. S2, B, C, and F). Similarly, from a manual categorization of expression patterns, we found that the lincomycin treatment converts light from a positive to a negative regulator or vice versa for more than 100 genes (Supplemental Fig. S3, A and B).
Light Affects the Plastid-Regulated Transcriptome
In contrast to the genes that are significantly regulated by light (i.e. genes expressed at significantly different levels at 0.5, 1, 4, or 24 h following the fluence-rate shift relative to 0 h), the number of genes that are significantly regulated by the plastid (i.e. genes expressed at significantly different levels in lincomycin-treated relative to untreated seedlings at a particular time point) does not increase as time increases. Among genes whose expression is significantly regulated by lincomycin, the expression of 2- to 3-fold more genes is significantly regulated by the lincomycin treatment at 0 and 24 h than at 4 h following the BR fluence-rate shift (Fig. 2B, blue and green bars). The relatively large distance between the three time points on a trajectory plot and agglomerative hierarchical clustering are consistent with (1) light converting the plastid-regulated transcriptome at 0 h to a different transcriptome at 24 h and (2) the 4-h time point representing an intermediate state between the 0- and 24-h transcriptomes (Fig. 2, D and F). Agglomerative hierarchical clustering and manual clustering indicate that light can convert the plastid from a positive to a negative regulator of particular genes and vice versa (Fig. 2F; Supplemental Figs. S2D and S3A).
The Enrichment of GO Terms in Light- and Plastid-Regulated Transcriptomes Indicates the Biological Significance of the Integration of Light and Plastid Signaling
To gain insight into the biological significance of the integration of light and plastid signaling, we first tested whether particular GO terms are significantly enriched among the significantly regulated genes (Rhee et al., 2008). We performed agglomerative hierarchical clustering of GO terms to determine whether particular GO terms are significantly enriched among particular expression patterns (Supplemental Figs. S4 and S5). We also performed agglomerative hierarchical clustering of the significantly regulated genes that are associated with each significantly enriched GO term (Supplemental Fig. S6, A–C). Our analysis of transcriptomes at four time points after the fluence-rate shift in both lincomycin-treated seedlings and untreated seedlings allows for the identification of expression trends for groups of genes that contribute to a particular GO term. These analyses indicate whether the expression of groups of genes that contribute to particular GO terms is regulated by only light signaling, only plastid signaling, or the integration of light and plastid signaling. This approach also indicates whether the expression of genes is induced or repressed by these signals. Summaries of this GO analysis are presented in Figures 3 and 4. The expression patterns of individual genes that are associated with each GO term are presented in Supplemental Figure S6, A to C. We used this method rather than the commonly used MapMan (Thimm et al., 2004) because MapMan does not allow for the presentation of complex gene expression patterns for a large number of individual genes.
Figure 3.

Summary of biological process and cellular component GO terms that are enriched in particular expression patterns. User-defined expression patterns were obtained as described in Supplemental Figure S3, and clusters of expression were obtained as described in Figure 2 and Supplemental Figure S2. Significant enrichment of 19 GO terms defined as biological processes (P) and 16 GO terms defined as cellular components (C) was determined as described in Supplemental Figures S4 and S5. Briefly, Ontologizer 2.0 was used to quantify the significance of GO term enrichment in the user-defined expression patterns, clusters of expression, or the entire data set of 7,104 genes (Supplemental Table S1). For each significantly enriched GO term, the most significantly enriched expression pattern and cluster is presented. Up-regulated (red) and down-regulated (blue) expression is indicated at 0.5, 1, 4, and 24 h following the BR fluence-rate shift in lincomycin-treated (+LIN) and untreated (−LIN) seedlings. Plastid-regulated expression is similarly indicated at 0, 4, and 24 h relative to the fluence-rate shift. Color intensity is proportional to the degree of regulation. Positive correlation describes a similar response to the BR fluence-rate shift regardless of whether seedlings were treated with lincomycin. For genes that exhibit positive correlation, the correlation coefficient between the expression patterns in lincomycin-treated and untreated seedlings is greater than 0.95. The major cluster letters and pattern numbers are defined in Figure 2, E and 2F, and Supplemental Figures S2, A to F, and S3.
Figure 4.

Summary of biological process and biological response to stimulus GO terms that are enriched in particular expression patterns. User-defined expression patterns were obtained as described in Supplemental Figure S3. Clusters of expression were obtained as described in Figure 2 and Supplemental Figure S2. Significant enrichment of four GO terms defined as biological processes (P) and 16 GO terms defined as biological responses to stimulus (R) was determined as described in Supplemental Figures S4 and S5. Briefly, Ontologizer 2.0 was used to quantify the significance of GO term enrichment in the user-defined expression patterns, clusters of expression, or the entire data set of 7,104 genes (Supplemental Table S2). For each significantly enriched GO term, the most significantly enriched expression pattern and cluster is presented. Up-regulated (red) and down-regulated (blue) expression is indicated at 0.5, 1, 4, and 24 h following the BR fluence-rate shift in lincomycin-treated (+LIN) and untreated (−LIN) seedlings. Plastid-regulated expression is similarly indicated at 0, 4, and 24 h relative to the fluence-rate shift. Color intensity is proportional to the degree of regulation. Positive correlation is as described in Figure 3. The major clusters and patterns are defined in Figure 2, E and F, and Supplemental Figures S2, A to F, and S3.
We found that the expression of genes annotated as contributing to the regulation of transcription dominated the transcriptomes at 0.5 and 1 h following the fluence-rate shift (Figs. 3 and 4; Supplemental Fig. S6C) and that the expression of genes annotated as contributing to metabolism, translation, growth, development, biotic and abiotic stress, and oxidative stress was regulated at 4 to 24 h (Figs. 3 and 4). These findings are consistent with previous findings for untreated seedlings (Tepperman et al., 2001, 2004, 2006; Jiao et al., 2003).
Regulation of Chloroplast- and Mitochondria-Related Gene Expression
Photosynthesis and 14 additional plastid-related GO terms were the most significantly enriched GO terms in the entire data set (Supplemental Table S1). In general, the expression of the genes that are associated with these GO terms is induced following the BR fluence-rate shift. These genes are expressed at lower levels in lincomycin-treated relative to untreated seedlings (Fig. 3; Supplemental Fig. S6, A and B). In general, the expression of genes that are annotated as encoding proteins that contribute to thylakoid function shows a greater degree of plastid regulation than those annotated as contributing to other plastid-related processes (Fig. 3; Supplemental Fig. S6, A and B).
A number of genes that are annotated as contributing to plastid functions deviate from this typical expression pattern in that their expression is more highly induced by the fluence-rate shift in lincomycin-treated than in untreated seedlings (Supplemental Fig. S6, A and B, plastid organization, purple cluster; cellular protein catabolic process, red cluster; photosynthesis, green cluster; thylakoid membrane, yellow cluster). A number of these genes contribute to chloroplast biogenesis and to chloroplast stress tolerance (Chen et al., 2000, 2006; Heddad and Adamska, 2000; Lindahl et al., 2000; Takechi et al., 2000; Sakamoto et al., 2002; Andersson et al., 2003; Zaltsman et al., 2005; Allahverdiyeva et al., 2009; Kato et al., 2009; Goral et al., 2010; Lemeille and Rochaix, 2010). We quantified the expression of Photosystem II subunit S (PsbS) and CHALCONE SYNTHASE (CHS) because they each exhibit a distinct class of this expression pattern and because they also contribute to chloroplast stress tolerance (Gould, 2004; Ferrer et al., 2008; Murchie and Niyogi, 2011). The fluence-rate shift induces PsbS expression 28-fold by 4 h in lincomycin-treated seedlings (Fig. 5). This induced expression is reduced to only 7-fold by 8 h (Fig. 5). In contrast, the fluence-rate shift induces PsbS expression only 12-fold by 8 h in untreated seedlings (Fig. 5). CHS is expressed from 2- to 14-fold higher levels in lincomycin-treated seedlings relative to untreated seedlings at 0, 4, and 8 h (Fig. 5). Based on these data, we propose that the integration of light and plastid signaling optimizes chloroplast biogenesis and function by tailoring gene expression to both the particular degree of chloroplast function and the particular light environment. By integrating light and plastid signaling, we propose that plants react not only to chloroplast dysfunction but also to the potential for light-induced chloroplast dysfunction. Consistent with this idea, plastid signaling affects the gene expression response to increasing light intensity (Ruckle et al., 2007) and promotes chloroplast biogenesis when seedlings are irradiated with intense light (Mochizuki et al., 1996; Ruckle et al., 2007). Also consistent with this idea, distinct light signaling mechanisms promote the expression of genes that contribute to photosynthesis and to chloroplast stress tolerance (Bowler et al., 1994; Cho et al., 2003; Yang et al., 2003). Based on the finding that transformative effects of plastid signaling on light signaling can occur by 4 h (Danon et al., 2006), we suggest that rewiring light signaling is a primary effect of plastid signaling. Alternative models, such as light signaling promoting plastid stress by regulating nuclear gene expression, require extremely complex mechanisms to fit with previously published analyses of light and plastid signaling mutants (Ruckle et al., 2007). Furthermore, such models are counterintuitive. Why would a major signaling network such as the light signaling network make stress tolerance more difficult?
Figure 5.
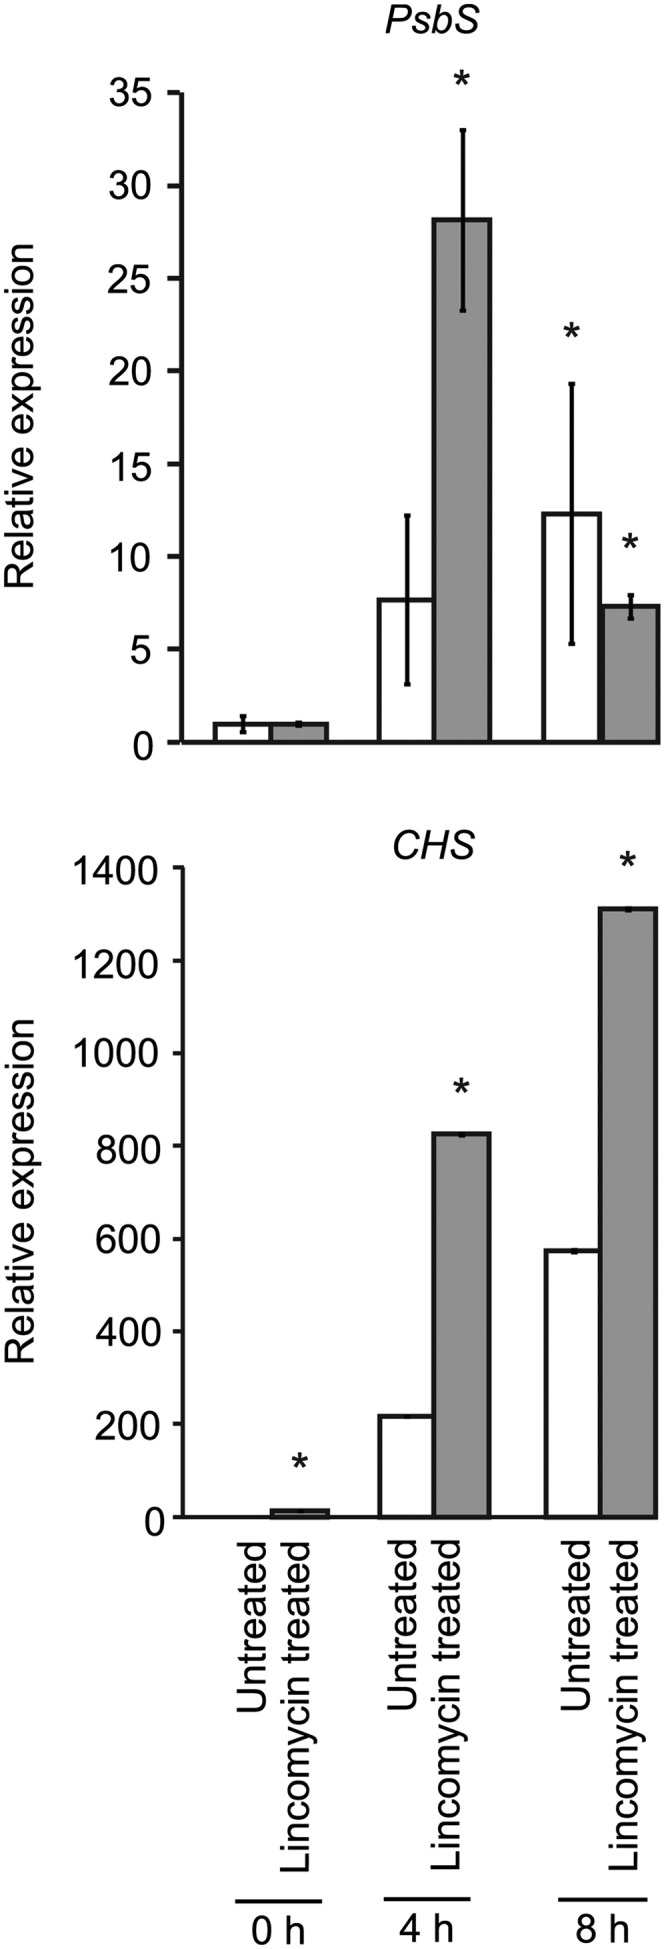
Light-regulated expression of PsbS and CHS in lincomycin-treated and untreated seedlings. The expression of PsbS and CHS at 0, 4, and 8 h relative to the BR fluence-rate shift was quantified using qRT-PCR. Three biological replicates were analyzed for each time point. For PsbS expression, expression in lincomycin-treated seedlings and untreated seedlings at 4 and 8 h is normalized to expression in lincomycin-treated seedlings at 0 h and untreated seedlings at 0 h, respectively. For CHS expression, expression is normalized to CHS expression in untreated seedlings at 0 h. * Statistically significant difference (P < 0.0001–0.049).
Mitochondria-related GO terms were also significantly enriched (Supplemental Table S1). The BR fluence-rate shift generally induces the expression of these genes. The lincomycin treatment has diverse effects on the expression of these genes, both before and after the fluence-rate shift (Fig. 3; Supplemental Fig. S6B). These data are consistent with complex interactions between chloroplasts and mitochondria (Noctor et al., 2007; Noguchi and Yoshida, 2008; Woodson and Chory, 2008; Van Aken et al., 2009; Vanlerberghe et al., 2009) and with the integration of light and plastid signaling helping to coordinate their functions. The expression of the AOX1a and AOX1c genes that encode the alternative oxidase is up-regulated by the BR fluence-rate shift (Supplemental Fig. S6B). This up-regulation is not surprising, because red and blue light induce the expression of AOX1a and AOX1c (Zhang et al., 2010). Although the induced expression of AOX1a and AOX1c is a well-known marker for mitochondrial stress (Van Aken et al., 2009), these genes are expressed in the absence of mitochondrial stress (Thirkettle-Watts et al., 2003). The higher expression of AOX1a and AOX1c in lincomycin-treated seedlings (Supplemental Fig. S6B) is unlikely to result from lincomycin directly inhibiting mitochondrial translation (Sullivan and Gray, 1999; Mulo et al., 2003; Doyle et al., 2010). This elevated expression is likely caused by chloroplast dysfunction. Indeed, other plastid-specific inhibitors induce the expression of these genes (Clifton et al., 2005), presumably because AOX proteins contribute to the interactions between chloroplasts and mitochondria (Van Aken et al., 2009; Vanlerberghe et al., 2009).
Plastid Dysfunction Affects the Nature of Light Signaling
Light induces the expression of Lhcb1 when chloroplasts are functional and represses the expression of Lhcb1 when chloroplasts are dysfunctional (Fig. 1A; Ruckle et al., 2007). The highly similar members of the Lhcb1 gene family do not appear in this data set because probe sets that were assigned to more than one gene were removed from the data set when the raw data were processed. We found that plastid dysfunction does not convert light signaling into a negative regulator of most photosynthesis-related genes but only attenuates their expression. This difference may explain the long-standing observation that plastid dysfunction down-regulates the expression of Lhcb genes more than other photosynthesis-related genes (Oelmüller, 1989).
We did observe that plastid dysfunction converts light from a positive to a negative regulator or vice versa of genes that are annotated as contributing to diverse functions. The expression of genes that are annotated as contributing to the cell cycle, DNA replication, and the response to JA stimulus is induced by the fluence-rate shift in untreated seedlings and repressed by the fluence-rate shift in lincomycin-treated seedlings (Figs. 3 and 4; Supplemental Fig. S6, A and C, yellow clusters). We quantified these expression patterns for representative genes from these groups, namely CDKB2.2, MCM5, AOS, and LOX2. We found that the fluence-rate shift induces the expression of these genes from 2- to 30-fold relative to the levels that we observed at 0 h in untreated seedlings and reduces their expression from 80% to 30% of the levels that we observed at 0 h in lincomycin-treated seedlings (Fig. 6). In addition to these effects on genes that contribute to the cell cycle and DNA replication, we observed that light promotes the expression of genes that are annotated as contributing to cytosolic ribosomes in untreated seedlings and that this light-induced expression is attenuated in lincomycin-treated seedlings (Fig. 3; Supplemental Fig. S6B). Light was previously reported to promote the expression of genes that contribute to these growth-related functions (López-Juez et al., 2008). Although these effects on growth-related gene expression could partially result from the lincomycin treatment attenuating metabolism, the possibility of the integration of light and plastid signaling primarily affecting growth-related gene expression is supported by reports that a burst of chloroplastic singlet oxygen production in the Arabidopsis flu mutant rapidly affects cry1 signaling (Danon et al., 2006) and causes a rapid inhibition of growth (op den Camp et al., 2003). Our findings that chloroplast dysfunction (1) can attenuate the light-regulated expression of genes that are annotated as contributing to the JA response and (2) can convert light from a positive to a negative regulator of genes that contribute to JA biosynthesis provide evidence that chloroplast dysfunction can affect the integration of light and JA signaling (Zhai et al., 2007; Moreno et al., 2009; Robson et al., 2010). These findings also provide evidence that the integration of light and plastid signaling might attenuate JA signaling. A role for the plastid in this signal integration is further supported by the observation that light signaling promotes JA signaling in green tissues and Suc attenuates this JA signaling (Robson et al., 2010), because carbohydrates can repress chloroplast function (To et al., 2003; Rook et al., 2006; Stettler et al., 2009).
Figure 6.

Distinct light-regulated expression of six genes in lincomycin-treated and untreated seedlings. The expression of CDKB2.2, MCM5, AOS, LOX2, CCA1, and PRR5 at 0, 4, and 24 h relative to the BR fluence-rate shift was quantified using qRT-PCR. Four biological replicates were analyzed for each time point. The expression of a particular gene in untreated seedlings is normalized to the expression of that same gene in untreated seedlings at 0 h. The expression of a particular gene in lincomycin-treated seedlings is normalized to the expression of that same gene in lincomycin-treated seedlings at 0 h. * Statistically significant difference relative to 0 h (P ≤ 0.0001–0.04).
For many genes that are annotated as contributing to the circadian rhythm, expression is down-regulated following the BR fluence-rate shift in untreated seedlings. In lincomycin-treated seedlings, the BR fluence-rate shift induces the expression of these same genes or attenuates the negative regulation (Fig. 4; Supplemental Fig. S6A). We found that in untreated seedlings, the BR fluence-rate shift reduces CAA1 and PRR5 expression from 80% to 50% of the levels that we observed at 0 h, and that in lincomycin-treated seedlings, the fluence-rate shift induces CCA1 and PRR5 expression from 2- to 3-fold higher levels than we observed at 0 h (Fig. 6). Consistent with these findings, chloroplast-localized RNA-binding proteins and transcription factors that regulate chloroplast function were previously reported to affect the circadian rhythm (Hassidim et al., 2007; Stephenson et al., 2009). We propose that natural stresses might affect the circadian rhythm by inducing chloroplast stress that affects light signaling. Subsequent effects on the circadian rhythm could attenuate the expression of genes that contribute to photosynthesis and therefore attenuate potential chloroplast stress. Indeed, low temperatures induce chloroplast dysfunction (Takahashi and Murata, 2008), and both low temperatures (Bieniawska et al., 2008) and the lincomycin treatment used here affect the expression of genes that encode core components of the circadian clock.
The Integration of Light and Plastid Signaling Affects Stress-Related Gene Expression
Abiotic stress response-related genes are significantly enriched in our data set (Supplemental Table S2). In many instances, the lincomycin treatment attenuated the down-regulated expression of stress-related genes that followed the BR fluence-rate shift. This response is also observable as the BR fluence-rate shift converting the lincomycin treatment from a negative to a positive regulator of these genes (Fig. 4; Supplemental Fig. S6C). Like the lincomycin treatment used here, both biotic and abiotic stress down-regulate photosynthesis-related gene expression and attenuate growth (Herms and Mattson, 1992; Ballaré, 2009; Saibo et al., 2009; Bilgin et al., 2010). This diversion of resources from growth to stress tolerance is a major component of stress responses that remains poorly understood (Herms and Mattson, 1992; Ballaré, 2009). Our finding that light up-regulates the expression of photosynthesis- and growth-related genes but down-regulates the expression of stress-related genes in untreated seedlings provides evidence that light signaling helps plants invest in growth rather than stress tolerance when seedlings contain well-functioning chloroplasts. Our finding that blocking chloroplast biogenesis with lincomycin attenuates this down-regulated expression of stress-related genes is consistent with the integration of light and plastid signaling helping plants divert resources from growth to stress tolerance.
The Integration of Light and Plastid Signaling Does Not Necessarily Depend on ROS
Although the production of chloroplastic ROS can trigger plastid-to-nucleus signaling (Pogson et al., 2008; Woodson and Chory, 2008; Galvez-Valdivieso and Mullineaux, 2010), treatments with inhibitors of chloroplast biogenesis that trigger robust plastid-to-nucleus signaling do not necessarily yield ROS (Strand et al., 2003; Voigt et al., 2010; Zhang et al., 2011). We found that genes annotated as contributing to oxidative stress are enriched in our data set (Supplemental Table S2). The expression of these genes was similar following the BR fluence-rate shift, regardless of whether seedlings were treated with lincomycin (Fig. 4, positive correlation; Supplemental Fig. S6C). We also tested whether genes whose expression is induced at least 5-fold by diverse ROS (Gadjev et al., 2006) are regulated by light and plastid signals. We found that the majority of these genes are either not significantly enriched in our data set or that the BR fluence-rate shift and the lincomycin treatment cause diverse expression patterns (Supplemental Fig. S6D). Thus, lincomycin-treated seedlings and untreated seedlings would appear to contain similar levels of oxidative stress following the BR fluence-rate shift.
We also tested whether the fluence-rate shift affects the expression of five genes whose expression is induced by chloroplastic ROS, namely AAA, BAP1, NodL, FER1, and ZAT12 (Saini et al., 2011). The expression of AAA, BAP1, and NodL is induced by singlet oxygen (Baruah et al., 2009a, 2009b). Using quantitative reverse transcription (qRT)-PCR and previously described oligonucleotides (Baruah et al., 2009a, 2009b), we could not reliably detect transcripts from AAA, BAP1, and NodL in the RNA preparations that we used for transcriptome analyses (R.M. Larkin, unpublished data). The expression of FER1 is induced by superoxide and hydrogen peroxide (Petit et al., 2001), but the BR fluence-rate shift did not induce the expression of FER1 relative to untreated seedlings at 0 h (Supplemental Fig. S7). The expression of ZAT12 is highly induced by multiple types of ROS (Gadjev et al., 2006). The fluence-rate shift induced the expression of ZAT12 less than 2-fold (Supplemental Fig. S7). We conclude that light and plastid signals can likely regulate the expression of FER1 and ZAT12 using signaling mechanisms that do not depend on the production of chloroplastic ROS and that ROS is likely not always essential for the rewiring of light signaling by plastid signals.
A Screen for Genes That Contribute to the Integration of Light and Plastid Signaling
The integration of light and plastid signaling is proposed to depend on both light and plastid signaling inducing the activity of proteins that contribute to this signal integration (Ruckle et al., 2007; Larkin and Ruckle, 2008). If this model is correct and if the activities of these proteins and the expression of the genes that encode these proteins are similarly regulated, then genes whose expression is more highly induced by light in lincomycin-treated seedlings than in untreated seedlings could contribute to this rewiring of light signaling by plastid signals.
To test this idea, we identified genes that (1) exhibit increases in expression 1 h following the BR fluence-rate shift, (2) are expressed at levels at least 1.5-fold higher in lincomycin-treated seedlings than in untreated seedlings, and (3) are annotated as encoding proteins that contribute to transcription, signaling, and no known functions. We identified 38 genes that meet these criteria (Table I; Supplemental Table S3). T-DNA insertion mutants were publicly available for 25 of these genes, and two T-DNA alleles were available for seven of these genes (Table I). T-DNA alleles were not publicly available for the remaining 13 genes (Supplemental Table S3). We propagated these mutants and obtained homozygous lines for 32 of these T-DNA insertion mutants. Most of these T-DNA alleles are nulls or severe loss-of-function alleles based on an RT-PCR analysis (Supplemental Fig. S8). For a control group of mutants that are not expected to affect this rewiring of light signaling by plastid signals, we identified genes that (1) exhibit increases in expression 1 h after the BR fluence-rate shift, (2) exhibit similar levels of expression in lincomycin-treated and untreated seedlings, and (3) are also annotated as encoding proteins with functions related to transcription, signaling, or no known functions. We obtained 28 publicly available mutants, of which 22 had T-DNA insertions. We propagated these mutants and obtained lines that are homozygous for each T-DNA insertion. Most of these T-DNA alleles are nulls or severe loss-of-function alleles based on RT-PCR analysis (Supplemental Fig. S9). The naming system for both groups of alleles is described in the legend for Figure 7.
Table I. Genes that exhibit enhanced light-induced expression in lincomycin-treated seedlings and their publicly available T-DNA alleles.
Twenty-five genes are ranked by their light induction. Light induction is defined as the ratio of light-induced expression in lincomycin-treated seedlings to light-induced expression in untreated seedlings at 1 h following the BR fluence-rate shift. Plastid regulation is represented as the ratio of induced or repressed (−) expression in lincomycin-treated seedlings to expression in untreated seedlings at 0 h relative to the BR fluence-rate shift. Gene names and descriptions are based on available literature or on The Institute for Genomic Research gene annotation records. Biological function, process, and locations are based on current literature or GO with the following evidence codes: IC, inferred by curator; IEA, inferred from electronic annotation; ISS, inferred from sequence or structural similarity; TAS, traceable author statement. The publicly available T-DNA insertion alleles used in this study are listed. For each homozygous line, the RNA phenotype caused by the particular T-DNA insertion allele was determined by RT-PCR (Supplemental Fig. S8).
| No. | AGI Code | Light Induction | Plastid Regulation | Name/Description | Biological Function, Process, and location | T-DNA Line(s) | Transcript Phenotype in the Homozygote |
| 1 | At5g24120 | 3.92 | −7.69 | SIGE, SIG5, SIGMA FACTOR 5a | Transcription factor activityISS,TAS, chloroplastb | SAIL_1232_H11 | Null |
| Salk_141383 | Null | ||||||
| 2 | At3g56290 | 3.16 | −4.35 | Expressed protein | Unknown | Salk_053531 | Strong knockdown |
| 3 | At2g30040 | 2.78 | −2.70 | MAPKKK14, MEK KINASE 14 | Kinase activityISS | SAIL_1175_F12 | Null |
| 5 | At5g08050 | 2.35 | −3.22 | Expressed protein | Unknown, thylakoid membraneb | Salk_048774 | Null |
| 6 | At5g24660 | 2.35 | 2.48 | LSU2, RESPONSE TO LOW SULFUR 2 | Unknown | Salk_031648 | Strong knockdown |
| 7 | At3g17040 | 2.19 | −3.56 | HCF107, HIGH CHLOROPHYLL FLUORESCENT 107c, tetratricopeptide repeat-containing protein | RNA processingc, regulation of translationc, chloroplast membraned | Salk_079285 | Knockdown |
| 8 | At1g44000 | 2.06 | −2.69 | SGR-Like, STAY GREEN LIKE, subfamily proteine | Unknown | Salk_084849 | Knockdown |
| SAIL_682_D01 | Knockdown | ||||||
| 10 | At2g24540 | 2.00 | −1.67 | AFR, ATTENUATED FAR-RED RESPONSE, Kelch repeat-containing F-box family proteing | Far-red light phototransductionf | SAIL_897_A11 | Weak knockdown |
| 11 | At5g35970 | 1.99 | −4.63 | Putative DNA-binding protein, DEAD-like helicase domain | DNA bindingISS/chloroplastg | Salk_149757 | Strong knockdown |
| 13 | At4g11360 | 1.97 | −1.98 | RHA1b, RING-H2 FINGER A1B | Protein bindingISS, E3 ligase activityh | Salk_094834 | Null |
| 14 | At5g14970 | 1.94 | −2.32 | Expressed protein | Unknown | SAIL_210_E05 | Null |
| Salk_036830 | Null | ||||||
| 15 | At5g58650 | 1.93 | −2.47 | PSY1, PLANT PEPTIDE CONTAINING SULFATED TYRi | Cell proliferation and expansioni | SAIL_1256_F11 | Null |
| SAIL_129_H05 | Null | ||||||
| 16 | At2g41660 | 1.92 | −1.21 | MIZ1, MIZU-KUSSEI1j | Hydrotropismj | Salk_076560 | Null |
| 17 | At5g13770 | 1.88 | −4.38 | Pentatricopeptide repeat (PPR)-containing protein | ChloroplastIEA | Salk_011143 | Strong knockdown |
| Salk_051012 | Strong knockdown | ||||||
| 19 | At2g16365 | 1.86 | −1.43 | F-box family protein | Unknown | Salk_024229 | Null |
| 20 | At5g52780 | 1.84 | −1.85 | Unknown protein | Chloroplast thylakoid membranek | Salk_143426 | Null |
| 21 | At3g54990 | 1.84 | −1.11 | SMZ, SCHLAFMUTZE, AP2 domain transcription factorl | Transcription factor activityISS, floral repressionl, nucleusi,c | Salk_108235 | Null |
| Salk_135576 | Null | ||||||
| 22 | At5g62430 | 1.78 | −2.33 | CDF1, CYCLING DOF FACTOR 1, Dof-type zinc finger domain-containing protein | Transcription factor activityISS, DNA bindingm, protein bindingm, regulation of flowering timem, nucleusm | SAIL_381_B11 | Null |
| 23 | At3g02380 | 1.78 | −9.32 | COL2, CONSTANS-LIKE 2, zinc-finger protein, CCT domain, B-box domain, transcription factor | Transcription factor activityISS | SAIL_70_F03 | Knockdown |
| SAIL_265_D06 | Knockdown | ||||||
| 25 | At1g43160 | 1.75 | −7.30 | RAP2.6, RELATED TO AP2 6, AP2 domain transcription factor | Transcription factor activityISS,TAS, nucleusISS, biotic stress responsen, abiotic stress responseo | SAIL_1225_G09 | Null |
| 28 | At5g52250 | 1.72 | 5.80 | Transducin family protein, WD-40 repeat family protein, COP1-like | Heterotrimeric G-protein complexISS, CUL4 RING ubiquitin ligase complexISS | Salk_060638 | Null |
| 29 | At1g04770 | 1.71 | 1.68 | Male sterility MS5 family protein, tetratricopeptide TPR domain | Unknown | Salk_091618 | Null |
| 35 | At2g33250 | 1.57 | −1.19 | Expressed protein | ChloroplastIEA | Salk_033583 | Null |
| 36 | At2g46340 | 1.56 | −1.27 | SPA1, SUPPRESSOR OF PHYA, Ser/Thr kinase-like motif, WD-repeat domainp | Photomorphogenesisq, signal transducer activityISS, nucleusr | Salk_023840 | Strong knockdown |
| 38 | At4g28740 | 1.52 | −1.92 | Similar to LPA1, LOW PSII ACCUMULATION1s | Unknown, chloroplasts,t | Salk_133844 | Null |
Kanamaru and Tanaka (2004). bFriso et al. (2004). cFelder et al. (2001). dSane et al. (2005). eBarry et al. (2008). fHarmon and Kay (2003). gKleffmann et al. (2004). hStone et al. (2005). iAmano et al. (2007). jKobayashi et al. (2007). kPeltier et al. (2004). lSchmid et al. (2003). mImaizumi et al. (2005). nHe et al. (2004). oZhu et al. (2010). pHoecker et al. (1998). qFankhauser et al. (1999). rLariguet et al. (2006). sZybailov et al. (2008). tPeng et al. (2006).
Figure 7.

Chlorophyll phenotypes caused by T-DNA insertion alleles. A, Chlorophyll phenotypes caused by T-DNA insertion alleles of genes that are more highly expressed in lincomycin-treated seedlings than in untreated seedlings following a BR fluence-rate shift. The wild type, gun1-101, and mutants containing T-DNA insertion alleles of genes that are expressed at least 1.5-fold higher in lincomycin-treated relative to untreated seedlings at 1 h following a BR fluence-rate shift were grown for 4 d in the dark and then transferred to continuous, broad-spectrum white light of 125 μmol m−2 s−1 for 24 h. Chlorophyll was extracted, quantified from four biological replicates for each line, and normalized to the wild type. Mean chlorophyll levels that were at least 2-fold greater than the chlorophyll levels of the wild type are indicated with a red dashed line and red bars. Mean chlorophyll levels that were at least 2-fold less than in the wild type are indicated with a blue dashed line and blue bars. Error bars represent 95% confidence intervals. T-DNA alleles were named using the arbitrary number assigned to each gene (Supplemental Fig. S8) and the last two numbers of the Salk accession code or the last three digits of the SAIL accession code. For example, the T-DNA alleles of gene 1 (At5g24120) are SAIL_1232_H11 and Salk_141383. These alleles are named 1-83 and 1-H11. B, Chlorophyll phenotypes caused by T-DNA insertion alleles of genes that are similarly expressed in lincomycin-treated and untreated seedlings following a BR fluence-rate shift. The deetiolation of mutants and the extraction and quantification of chlorophyll were performed as described in A.
A Reverse Genetic Analysis Yields a High Frequency of enhanced deetiolation Mutants
To determine whether these T-DNA insertion alleles can affect chloroplast function, we tested the efficiencies of the etioplasts-to-chloroplast conversion in these mutants and the wild type. Dark-grown seedlings contain etioplasts rather than chloroplasts and do not contain chlorophyll. When dark-grown seedlings are transferred to the light, etioplasts are converted into chloroplasts. Chloroplast biogenesis from etioplasts is marked by the accumulation of chlorophyll (Wise, 2007; Pogson and Albrecht, 2011). Thus, we grew wild-type Arabidopsis and each of these mutants for 4 d in the dark, transferred them to 125 μmol m−2 s−1 broad-spectrum white light for 24 h, and then quantified chlorophyll levels in each mutant. For a comparison, we included gun1-101; gun1-101 and other gun1 alleles cause inefficient greening, especially when fluence rates are increased (Mochizuki et al., 1996; Ruckle et al., 2007). Of the 32 T-DNA insertion alleles derived from genes that are more highly expressed in lincomycin-treated than in untreated seedlings following the BR fluence-rate shift, 20 (63%) caused enhanced deetiolation (end) phenotypes. These 20 mutants accumulate at least 2-fold more chlorophyll than the wild type during deetiolation (Fig. 7A). This group of mutants defines 16 genes. Two independently isolated alleles caused an end phenotype for six of these genes, but only single alleles were publicly available for the remaining 10 genes (Fig. 7A). Nonetheless, the high proportion of the end phenotype in this group of mutants provides evidence that for the majority of these 10 alleles, the end phenotype is probably not caused by unlinked alleles. Only four mutants from this group (i.e. 13-34, 14-30, 20-26, and 35-83) accumulated essentially the same amount of chlorophyll as the wild type (Fig. 7A). Only one mutant (i.e. 7-85) accumulated significantly less chlorophyll than the wild type (Fig. 7A). The remaining seven mutants from this group accumulated significantly more chlorophyll than the wild type during deetiolation but did not accumulate a mean quantity of chlorophyll that was at least 2-fold more than the wild type (Fig. 7A). Although we did not classify the mutants with these more modest phenotypes as end mutants, the genes defined by these alleles contribute to chloroplast biogenesis.
In contrast to the high frequency of end phenotypes caused by T-DNA insertion alleles of genes that are more highly expressed in lincomycin-treated than untreated seedlings following the BR fluence-rate shift, T-DNA insertion alleles of genes whose expression is similarly induced in lincomycin-treated and untreated seedlings following the BR fluence-rate shift do not yield a high frequency of end phenotypes. Indeed, only three mutants that define only two of the 22 genes (9%) from this group accumulate at least 2-fold more chlorophyll than the wild type (Fig. 7B; Supplemental Table S4). Eleven of these alleles caused significantly more chlorophyll to accumulate than in the wild type but not at least 2-fold more chlorophyll than in the wild type, as observed among end mutants. Only one T-DNA allele was available for these 11 genes (Fig. 7B). In addition to the low frequency of end phenotypes, this group of mutants is further distinguished from the previous group in that there was no significant difference in the amount of chlorophyll accumulation relative to the wild type for 50% of these mutants (Fig. 7B). In contrast, only 9% of the mutants from the previous group accumulated levels of chlorophyll that were not significantly different from the wild type (Fig. 7A).
To further test the specificity of this screen, we examined the end phenotypes in a group of light signaling mutants, because light signaling is a major regulator of chloroplast biogenesis. Only 25% of mutant alleles from this group that defines 40 genes cause more chlorophyll to accumulate during deetiolation than the wild type (Supplemental Figs. S10 and S11). The overaccumulation of chlorophyll in cry1-92, phyA-75, and phyB-35 would appear to conflict with previously published data showing that loss-of-function alleles of CRY1, PHYA, and PHYB cause chlorophyll deficiencies (Neff and Chory, 1998). However, specific parameters of deetiolation experiments cause particular light signaling mutants to either overaccumulate or underaccumulate chlorophyll (Stephenson et al., 2009). We suggest that the end phenotypes of cry1-92, phyA-75, and phyB-35 are possibly conditional. Analysis of the chlorophyll accumulation phenotypes of other light signaling mutants indicates that Atmyc2-05, hfr1-27, gbf1-12, hrb1-68, and spa1-40 can promote the accumulation of chlorophyll and that det1-1, cop1-4, pif1-72, fhy3-11, and pif3-27 can attenuate the accumulation of chlorophyll during deetiolation (Supplemental Fig. S11). Consistent with these findings, an AtMYC2 mutant accumulates more chlorophyll than the wild type (Yadav et al., 2005) and det1-1 causes chlorophyll deficiencies (Chory et al., 1989). cop1-4, pif1, and pif3 alleles attenuate greening in deetiolation experiments (Ang and Deng, 1994; Stephenson et al., 2009).
To test whether the end mutants are partially resistant to lincomycin, we tested whether seven end mutants express higher levels of photosynthesis-related genes than the wild type when grown on medium that contains lincomycin. Blocking chloroplast biogenesis with inhibitors such as lincomycin severely down-regulates the expression of photosynthesis-related genes (Sullivan and Gray, 1999). Thus, mutants that are partially resistant to lincomycin would express higher levels of photosynthesis-related genes than the wild type when grown on medium that contains lincomycin. We grew the wild type and seven end mutants under exactly the same conditions as the seedlings that were used for transcriptome analyses. We grew them on medium that contained 0.5 mm lincomycin in 0.5 μmol m−2 s−1 BR light for 6 d and then transferred them to 60 μmol m−2 s−1 BR light. We analyzed the expression of Lhcb1.4, RbcS1A, PsbS, and CHS immediately before (0 h) and at 4 and 8 h after the fluence-rate shift (Supplemental Fig. S12, A–D). We also analyzed the expression of these same genes in seedlings that were grown for 6 d in continuous 60 μmol m−2 s−1 BR light (Supplemental Fig. S13, A–D). We found that in general, these genes are expressed at significantly lower levels in these end mutants than in the wild type when seedlings are grown on medium that contains lincomycin (Supplemental Figs. S12, A–D, and S13, A–D). However in 1-83, 3-F12, and 5-74, Lhcb1.4 mRNA accumulates to at least 2-fold higher levels than in the wild type but only by 8 h and in continuous 60 μmol m−2 s−1 BR light (Supplemental Figs. S12A and S13A). Additionally, depending on the light conditions, a number of lincomycin-treated end mutants tested accumulate significantly more or significantly less CHS mRNA than the wild type (Supplemental Figs. S12D and S13D). The reduced expression of photosynthesis-related genes in these lincomycin-treated end mutants and the variable effects of these end alleles on Lhcb1.4 and CHS expression indicate that these mutants are not resistant to lincomycin. We also tested whether the end mutants accumulate more chlorophyll than the wild type when they are treated with low concentrations of lincomycin, an expected phenotype for mutants that are resistant to inhibitors of chloroplast biogenesis (Saini et al., 2011). We found that the end mutants appear indistinguishable from the wild type regardless of whether they are grown on medium that lacks lincomycin or medium that contains 0.005, 0.015, 0.05, 0.15, or 0.5 mm lincomycin (Supplemental Figs. S14–S16). We did find that gun1-101 appears to accumulate less chlorophyll than the wild type when grown on medium that contains 0.05, 0.015, and 0.005 mm lincomycin. This effect is especially striking when seedlings are grown on medium that contains 0.015 mm lincomycin (Supplemental Fig. S14). The enhanced sensitivity of gun1-101 to lincomycin is consistent with gun1 alleles inhibiting chloroplast biogenesis (Mochizuki et al., 1996; Ruckle et al., 2007).
Inhibitors of Chloroplast Biogenesis Are Useful Tools for Studying Signaling
Although the lincomycin treatment used here attenuates growth and may also affect development to some degree, a visual comparison of lincomycin-treated and untreated seedlings indicates that the development of lincomycin-treated seedlings resembles that of untreated seedlings (Larkin and Ruckle, 2008; Ruckle and Larkin, 2009; Supplemental Figs. S14–S16). Our transcriptome analyses also provide evidence that blocking chloroplast biogenesis with lincomycin affects gene expression related to development, the response to light and hormones, and the circadian rhythm. Despite these effects, we were able to use our transcriptome data to identify a number of genes that affect chloroplast biogenesis. If lincomycin is not useful because it causes too many secondary effects, we would expect to randomly isolate mutants that exhibit such enhanced chloroplast biogenesis phenotypes from this screen at a low frequency. The high frequency of end phenotypes yielded by this screen demonstrates that lincomycin treatments are useful for studying the signaling that contributes to chloroplast biogenesis. Consistent with this finding, forward genetic screens for alleles that disrupt plastid-to-nucleus signaling can involve screening Arabidopsis mutants that are grown on norflurazon-containing media that block chloroplast biogenesis. These gun mutant screens yielded alleles that disrupt only a few different processes (Mochizuki et al., 2001; Larkin et al., 2003; Koussevitzky et al., 2007; Ruckle et al., 2007; Woodson et al., 2011). Indeed, alleles of the same genes were repeatedly isolated from these screens (Mochizuki et al., 2001; Koussevitzky et al., 2007; Ruckle et al., 2007; Cottage et al., 2008; Adhikari et al., 2011). These data indicate that these gun mutant screens suffer from few if any secondary effects and that these inhibitors are useful for screens that specifically interrogate chloroplast-related signaling mechanisms.
end Alleles Induce Chlorophyll Accumulation without Affecting Photooxidative Stress
The T-DNA alleles that cause end phenotypes may up-regulate thylakoid biogenesis or down-regulate chloroplast stress, such as the sort of photooxidative stress that can attenuate the accumulation of chlorophyll. Testing whether increasing fluence rates affect chlorophyll accumulation during deetiolation can provide evidence of photooxidative stress. Thus, we performed deetiolation experiments with these end mutants in three fluence rates of broad-spectrum white light: 15, 100, and 300 μmol m−2 s−1. In general, end phenotypes are more striking when deetiolation is performed in 100 μmol m−2 s−1 and less striking when deetiolation is performed in either 15 or 300 μmol m−2 s−1 (Fig. 8A). We suggest that 15 μmol m−2 s−1 provides insufficient light for optimal deetiolation, 300 μmol m−2 s−1 provides excess light that causes photooxidative stress during deetiolation, and 100 μmol m−2 s−1 provides sufficient light for deetiolation without causing excessive photooxidative stress. end mutants that exhibit enhanced thylakoid biogenesis relative to the wild type and that experience similar levels of photooxidative stress as the wild type are expected to accumulate more chlorophyll than the wild type when deetiolation is performed in 15 and 100 μmol m−2 s−1. The end mutants in this class are not expected to accumulate significantly more chlorophyll than the wild type when deetiolation is performed at 300 μmol m−2 s−1. Several end alleles that define six genes cause such phenotypes (i.e. 1-83, 3-F12, 5-74, 15-H05, 15-F11, 17-12, 17-43, 23-D06, and 23-F03; Fig. 8A). end mutants that perform similar rates of thylakoid biogenesis as the wild type and that experience less photooxidative stress than the wild type are expected to accumulate more chlorophyll than the wild type when deetiolation is performed in both 100 and 300 μmol m−2 s−1 and to accumulate similar levels of chlorophyll as the wild type when deetiolation is performed at 15 μmol m−2 s−1. Although end alleles that define seven genes (i.e. 2-31, 6-48, 8-49, 8-D01, 19-29, 21-35, 21-76, 25-G09, and 29-18) cause significantly more chlorophyll to accumulate than in the wild type when deetiolation is performed in both 100 and 300 μmol m−2 s−1, these alleles also cause more chlorophyll to accumulate when deetiolation is performed in 15 μmol m−2 s−1 (Fig. 8A). Thus, end alleles attenuating photooxidative stress is not a satisfactory explanation for these end phenotypes. Two of the end alleles (i.e. 22-B11 and 38-44) cause more chlorophyll to accumulate than in the wild type only when deetiolation is performed at 100 μmol m−2 s−1 (Fig. 8A). 7-85 was the only allele yielded by this screen that attenuates the accumulation of chlorophyll during deetiolation (Fig. 8A).
Figure 8.

Deetiolation efficiencies of end mutants in various fluence rates. A, Deetiolation efficiencies of end mutants in three different fluence rates. The end mutants, gun1-101, and the wild type (ecotype Columbia-0 [Col-0]) were grown in the dark for 4 d and then irradiated with broad-spectrum white light at fluence rates of 15, 100, or 300 μmol m−2 s−1 for 24 h. Chlorophyll was extracted from four biological replicates for each line in each condition. Chlorophyll levels of the wild type (Col-0) are indicated with blue bars. Chlorophyll levels of mutants are indicated with red bars and green bars. Error bars represent 95% confidence intervals. B, Deetiolation rates of end mutants in 1 μmol m−2 s−1 BR light. The end mutants, gun1-101, and the wild type (Col-0) were grown in the dark for 4 d and then transferred to 1 μmol m−2 s−1 BR light. Chlorophyll was extracted from four biological replicates for each line at 0, 6, 12, and 24 h from the wild type (Col-0; blue curves) and the end mutants (red and green curves indicate distinct alleles). A Col-0 control was grown on the same plate for each end mutant. Error bars represent 95% confidence intervals.
The bulk of the end mutants yielded from this screen either (1) accumulate more chlorophyll than the wild type when deetiolation is performed at 15, 100, and 300 μmol m−2 s−1 or (2) accumulate more chlorophyll than the wild type when deetiolation is performed at 15 and 100 μmol m−2 s−1 but accumulate essentially the same levels of chlorophyll as the wild type when deetiolation is performed at 300 μmol m−2 s−1 (Fig. 8A). Thus, none of the end alleles appear to induce photooxidative stress. If this interpretation is correct, all of these end mutants should accumulate chlorophyll more rapidly than the wild type when deetiolation is performed under conditions that essentially abolish photooxidative stress. To test this idea, we performed a deetiolation experiment in BR light that was 1 μmol m−2 s−1 and extracted and quantified chlorophyll at four intervals from 0 to 24 h. Consistent with 1 μmol m−2 s−1 BR light not promoting photooxidative stress, chlorophyll accumulated at similar rates in the wild type and in mutants that appear to experience excessive photooxidative stress (i.e. gun1-101 and 7-85; Fig. 8B). All of the end mutants tested accumulated chlorophyll more rapidly than the wild type when deetiolation was performed in 1 μmol m−2 s−1 BR light. More chlorophyll was apparent at 12 and 24 h for 15 of the end mutants (Fig. 8B). The remaining five end mutants accumulated more chlorophyll than the wild type at only one time point (Fig. 8B).
Although these end mutants accumulate significantly more chlorophyll than the wild type during deetiolation, we found that they all accumulate essentially the same levels of chlorophyll as the wild type when grown for 7 d in continuous 125 μmol m−2 s−1 white light (Supplemental Fig. S17). In these conditions, the light signaling mutants that exhibit end phenotypes accumulated either the same levels of chlorophyll as the wild type or levels of chlorophyll that were more similar to the wild type relative to the deetiolation experiments (Supplemental Fig. S17). At least two interpretations are consistent with these data. (1) Partially redundant signaling mechanisms promote chloroplast function. Deetiolation provides a sensitive assay for detecting chloroplast defects that are not detected after 7 d of growth in 125 μmol m−2 s−1 white light because partially redundant mechanisms restore chlorophyll to wild-type levels. (2) The alleles that cause end phenotypes either knock out or attenuate the activity of genes that are important for the conversion of etioplasts to chloroplasts but are not important for maintaining chloroplasts.
Seven Different end Alleles Affect Photosynthesis-Related Gene Expression
If the END genes contribute to chloroplast maintenance, the end mutants should exhibit other chloroplast-related phenotypes when the end mutants contain chloroplasts. Believing that gene expression assays could reveal other chloroplast-related phenotypes, we tested whether end alleles might cause gene expression defects by quantifying chloroplast-related gene expression in seven end mutants. We quantified the expression of Lhcb1.4 and RbcS1A because these genes contribute to different components of chloroplast function. We also quantified the expression of CHS and PsbS. PsbS and CHS contribute to different components of chloroplast stress tolerance, namely nonphotochemical quenching (Murchie and Niyogi, 2011) and phenylpropanoid biosynthesis (Gould, 2004; Ferrer et al., 2008). Additionally, these four genes are expressed when seedlings are subjected to the conditions described here and they exhibit distinct light-regulated expression patterns in lincomycin-treated and untreated seedlings (Fig. 5; Supplemental Figs. S1, A and B, and S6, A and B).
We tested whether alleles of the five genes with the highest ratio of light-induced expression in lincomycin-treated seedlings to light-induced expression in untreated seedlings (i.e. 1-83, 2-31, 3-F12, 5-74, and 6-48; Table I) and whether alleles of two genes with lower ratios (i.e. 19-29 and 25-G09; Table I) express abnormal levels of these photosynthesis-related genes. We grew the wild type and these seven end mutants under exactly the same conditions as the seedlings that were used for transcriptome analyses, because we know that these END genes are expressed when seedlings are grown in these conditions (Table I; Supplemental Fig. S8). We grew them without lincomycin in 0.5 μmol m−2 s−1 BR light for 6 d and then transferred them to 60 μmol m−2 s−1 BR light. We analyzed the expression of these genes immediately before (0 h) and at 4 and 8 h after the fluence-rate shift (Fig. 9). We also analyzed the expression of these genes in seedlings that were grown for 6 d in continuous 60 μmol m−2 s−1 BR light (Fig. 10). Although these seven end mutants exhibited a number of Lhcb1.4, RbcS1A, PsbS, and CHS expression phenotypes, the PsbS expression phenotypes were the most striking. PsbS mRNA accumulated from 2- to 6-fold lower levels than in the wild type in all of the end mutants and in the four light conditions that we tested (Figs. 9C and 10C). Lincomycin-treated end mutants also accumulated significantly less PsbS mRNA in three or all four of the light conditions tested (Supplemental Figs. S12C and S13C).
Figure 9.

Lhcb1.4, RbcS1A, PsbS, and CHS expression in particular end mutants after an increase in fluence rate. A, Expression of Lhcb1.4 in particular end mutants after an increase in fluence rate. The wild type (ecotype Columbia-0 [Col-0]) and the indicated mutants were grown without lincomycin for 6 d in 0.5 μmol m−2 s−1 BR light and then transferred to 60 μmol m−2 s−1 BR light. Seedlings were collected immediately before the fluence-rate shift (0 h) and at 4 and 8 h following the fluence-rate shift. We used qRT-PCR to quantify transcript levels. The order of the lines from left to right is as follows: the wild type (Col-0; white bars), gun1-101 (gray bars), hy5 (brown bars), 1-83 (pink bars), 2-31 (red bars), 3-F12 (orange bars), 5-74 (yellow bars), 6-48 (green bars), 19-29 (blue bars), and 25-G09 (purple bars). Three biological replicates were analyzed for the wild type (Col-0) and each mutant in each condition. Error bars indicate sd. * Statistically significant difference between the wild type (Col-0) and a mutant (P = 0.0001–0.049). B, Expression of RbcS1A in particular end mutants after an increase in fluence rate. Analysis of RbcS1A expression was as described in A. * Statistically significant difference between the wild type (Col-0) and a mutant (P = 0.0002–0.03). C, Expression of PsbS in particular end mutants after an increase in fluence rate. Analysis of PsbS expression was as in A. * Statistically significant difference between the wild type (Col-0) and a mutant (P = 0.0001–0.004). D, Expression of CHS in particular end mutants after an increase in fluence rate. Analysis of CHS expression was as described in A. * Statistically significant difference between the wild type (Col-0) and a mutant (P = 0.0001–0.0046).
Figure 10.

Lhcb1.4, RbcS1A, PsbS, and CHS expression in particular end mutants in continuous 60 μmol m−2 s−1 BR light. A, Expression of Lhcb1.4 in particular end mutants. The wild type (ecotype Columbia-0 [Col-0]) and the indicated mutants were grown without lincomycin for 6 d in continuous 60 μmol m−2 s−1 BR light. We used qRT-PCR to quantify transcript levels. Three biological replicates were analyzed for the wild type (Col-0) and each mutant in each condition. Error bars indicate sd. * Statistically significant differences between the wild type (Col-0) and a mutant (P = 0.01–0.04). B, Expression of RbcS1A in particular end mutants. Analysis of RbcS1A expression was as described in A. * Statistically significant differences between the wild type (Col-0) and a mutant (P = 0.0002–0.03). C, Expression of PsbS in particular end mutants. Analysis of PsbS expression was as described in A. * Statistically significant differences between the wild type (Col-0) and a mutant (P = 0.02–0.03). D, Expression of CHS in the indicated end mutants. Analysis of CHS expression was as described in A. * Statistically significant differences between the wild type (Col-0) and a mutant (P = 0.04).
Mutants 19-29 and 25-G09 accumulated 2- to 5-fold lower levels of Lhcb1.4 mRNA than the wild type in all four conditions tested (Figs. 8A and 9A). When chloroplast biogenesis was blocked with lincomycin, 19-29 and 25-G09 accumulated significantly less Lhcb1.4 mRNA in three of the four light conditions tested (Supplemental Figs. S12A and S13A). Six of the end mutants expressed significantly different levels of Lhcb1.4 than the wild type in at least one condition (Figs. 9A and 10A). When treated with lincomycin, all seven of these end mutants accumulated significantly less Lhcb1.4 mRNA in one to three of the different light conditions tested (Supplemental Figs. S12A and S13A). Although these end alleles down-regulate Lhcb1.4 expression to various degrees, these data are not inconsistent with the end mutants accumulating chlorophyll more quickly than the wild type during deetiolation (Figs. 7 and 8), because regulation of Lhcb1.4 expression appears to differ from the regulation of other Lhcb1 genes. For example, the expression of Lhcb1.4 is down-regulated by the BR fluence-rate shift in the wild type (Fig. 9A), but RNA blots that were hybridized with an Lhcb1*1 probe (Ruckle et al., 2007) indicate that this fluence-rate shift induces the expression of other Lhcb1 genes (Fig. 1A; Supplemental Fig. S1B).
No end mutant expressed significantly different levels of RbcS1A or CHS than the wild type in all four of the conditions that we tested. Five to seven of these end mutants accumulated significantly less RbcSA1 mRNA than the wild type at 0, 4, or 8 h relative to the fluence-rate shift (Fig. 9B). When treated with lincomycin, these seven end mutants accumulated significantly less RbcS1A mRNA in at least one of the light conditions tested (Supplemental Figs. S12B and S13B). These seven end mutants expressed essentially the same level of RbcS1A as the wild type when seedlings were grown in 60 μmol m−2 s−1 BR light for 6 d (Fig. 9B). Five of the end mutants accumulated significantly different levels of CHS mRNA than the wild type in at least one condition (Figs. 9D and 10D). 3-F12 and 6-48 accumulated significantly lower levels of CHS mRNA than the wild type in three of the four conditions tested (Figs. 9D and 10D).
The gene expression phenotypes of these end mutants are different from the gene expression phenotypes of gun1-101 and hy5. GUN1 contributes to light-independent plastid-to-nucleus signaling. HY5 contributes to light signaling and the integration of light and plastid signaling (Jiao et al., 2007; Ruckle et al., 2007). gun1-101 accumulated significantly different levels of only Lhcb1.4 mRNA relative to the wild type and at 0, 4, and 8 h relative to the fluence-rate shift (Figs. 9 and 10). gun1 mutants were previously shown to accumulate more Lhcb mRNA than the wild type when seedlings were treated with inhibitors of chloroplast biogenesis (Susek et al., 1993; Koussevitzky et al., 2007) and when chloroplasts were not experiencing stress (Cottage et al., 2010; Voigt et al., 2010). hy5 accumulated significantly different levels of Lhcb1.4, RbcS1A, PsbS, and CHS mRNA than the wild type in 11 of these 16 experiments (Figs. 9 and 10). Consistent with these findings, HY5 was previously reported to promote the expression of Lhcb1, RbcS1A, and CHS (Lee et al., 2007). HY5 was not previously reported to contribute to the expression of PsbS. Additionally, we found that none of the end mutants are gun mutants (M.E. Ruckle, unpublished data). Thus, the END genes contribute to different processes than the GUN genes (Koussevitzky et al., 2007; Ruckle et al., 2007; Sun et al., 2011; Woodson et al., 2011). Consistent with this interpretation, end alleles promote chloroplast biogenesis and gun alleles attenuate chloroplast biogenesis (Mochizuki et al., 1996; Ruckle et al., 2007).
We conclude that deetiolation assays and gene expression assays can detect chloroplast-related defects when plants are grown in continuous light and only single END genes are knocked out, because the END genes probably contribute to a complex network. We conclude that the integration of light and plastid signaling induces the expression of these END genes, the END genes down-regulate chloroplast biogenesis, and some of the END genes contribute to the regulation of gene expression, especially PsbS expression.
PsbS is coexpressed with other members of the Lhc supergene family (Klimmek et al., 2006). Blue, red, and far-red light can induce PsbS expression (Adamska et al., 1996; Iwasaki et al., 1997; Yang et al., 2003; Hong et al., 2008). This light-induced expression depends on phytochromes and cry1 (Iwasaki et al., 1997; Hong et al., 2008). In far-red light, PsbS expression depends on FIN5 (Cho et al., 2003). In blue light, PsbS expression is induced by BIT1, which acts downstream of cry1 (Hong et al., 2008). FIN5 is similarly important for PsbS and CHS expression (Cho et al., 2003). BIT1 is more important for PsbS expression than for CHS expression (Hong et al., 2008). The seven end mutants that we tested for gene expression phenotypes were more deficient in PsbS expression than in CHS expression. We conclude that these seven END genes are similar to BIT in that they are more important for PsbS expression than for CHS expression.
The END Proteins Perform Diverse Functions
The enhanced light-induced expression of the END genes in lincomycin seedlings supports a main conclusion from our transcriptome analyses: the integration of light and plastid signaling attenuates particular chloroplast functions. The expression of the END genes is regulated by a variety of signals besides light and plastid signals (Supplemental Table S5). These diverse expression patterns are consistent with the END genes contributing to a network rather than to a linear pathway and with a variety of signals down-regulating chloroplast biogenesis and function.
The overaccumulation of chlorophyll is not a commonly reported phenotype. The Arabidopsis ged1 and coi1 mutants accumulate more chlorophyll than the wild type during deetiolation (Choy et al., 2008; Robson et al., 2010). The ged1 allele has not been cloned. None of the end mutants are allelic to coi1. The end phenotype of the JA signaling mutant coi1 (Robson et al., 2010) further supports an interpretation of our transcriptome data: interactions among JA, light, and plastid signaling might affect chloroplast biogenesis. In Chlamydomonas reinhardtii and Arabidopsis, nab1 and AtMYC2 mutants accumulate more chlorophyll than the wild type (Mussgnug et al., 2005; Yadav et al., 2005). None of the proteins encoded by the END genes exhibit a striking sequence similarity to NAB1 or AtMYC2.
For four of the END genes reported here, expression was previously reported to rapidly increase in response to light, and T-DNA insertion alleles of these END genes were reported to cause developmental defects in hypocotyls and cotyledons during deetiolation (Khanna et al., 2006). Khanna et al. (2006) did not report whether these alleles cause chloroplast phenotypes. The genes that were also identified by Khanna et al. (2006) are SIG5, a gene that encodes a putative protein kinase (At2g30040), COL2, and SPA1. sig5 alleles attenuate tolerance to salt, osmotic, and high-intensity-light stress (Nagashima et al., 2004). Although spa1 alleles were reported to cause various developmental and chloroplast-related phenotypes (Hoecker et al., 1998; Hoecker and Quail, 2001; Baumgardt et al., 2002; McCormac and Terry, 2002; Zhou et al., 2002; Khanna et al., 2006), spa1 mutants were not previously reported to accumulate higher levels of chlorophyll than the wild type during deetiolation. Ectopic expression of COL2 was reported to cause no striking phenotype (Ledger et al., 2001).
Among the remaining 14 END genes that were not identified by Khanna et al. (2006), several have experimentally verified functions. Three of these END genes either encode or may encode signaling-related proteins: HAI1, an F-box family protein (At2g16365), and RUP2/EFO2. HAI1 is a protein phosphatase 2C that contributes to abscisic acid signaling (Fujita et al., 2009; Guo et al., 2010; Antoni et al., 2012). RUP2/EFO2 is a WD-40 repeat family protein that contributes to UV-B signaling (Gruber et al., 2010) and to the regulation of vegetative growth and flowering (Wang et al., 2011a). Three of these END genes encode transcription factors: SMZ, CDF1, and RAP2.6. SMZ encodes an AP2 domain-containing protein that potently represses flowering (Schmid et al., 2003; Mathieu et al., 2009). CDF1 encodes a Dof transcription factor that affects flowering time (Imaizumi et al., 2005). If, as we suggest based on our transcriptome analyses, plastid signaling contributes to natural stress responses by rewiring light signaling, some of theses END genes should contribute to stress responses. Indeed, RUP2/EFO contributes to UV-B signaling (Gruber et al., 2010), and RAP2.6 contributes to abscisic acid and abiotic stress responses (He et al., 2004; Zhu et al., 2010). Relatives of RAP2.6 such as ABI4 (Zhu et al., 2010), RAP2.2, and RAP2.4 contribute to chloroplast function (Acevedo-Hernández et al., 2005; Koussevitzky et al., 2007; Welsch et al., 2007; Shaikhali et al., 2008). The remaining eight END genes have no known function. Consistent with the end phenotypes, At4g28740, At5g08050, and At5g13770 encode proteins that are predicted to reside in the chloroplast, and At5g08050 is coexpressed with phytoene synthase (Meier et al., 2011).
CONCLUSION
Based on our analysis of Arabidopsis transcriptomes, we conclude that the integration of light and plastid signaling (1) down-regulates photosynthesis and induces both repair and stress tolerance in dysfunctional chloroplasts and (2) helps coordinate processes such as growth, the circadian rhythm, and stress responses with the degree of chloroplast function by regulating gene expression. Based on the phenotypic characterization of the mutants yielded by our reverse genetic screen, we conclude that the integration of light and plastid signaling regulates a network of genes that optimize chloroplast function during chloroplast biogenesis and probably during periods of chloroplast dysfunction.
MATERIALS AND METHODS
Plant Materials and Growth Conditions
Arabidopsis (Arabidopsis thaliana) seeds were surface sterilized and stratified on Linsmaier and Skoog medium (Caisson Laboratories) that contained 2% Suc as described by Ruckle et al. (2007). Seeds were then exposed to 100 μmol m−2 s−1 red light for 1 h and placed in the dark for 23 h. Seedlings were then grown in controlled-environment chambers containing light-emitting diodes or broad-spectrum fluorescent tube lamps (Percival Scientific) at the indicated fluence rates in the presence or absence of 0.5 mm lincomycin as described by Ruckle et al. (2007). Light was filtered though one or more neutral-density filters to obtain different fluence rates as described previously by Ruckle et al. (2007). Isolation and analysis of RNA by northern blotting was as described by Ruckle et al. (2007). T-DNA insertion mutants (Sessions et al., 2002; Alonso et al., 2003) obtained from the Arabidopsis Biological Resource Center at Ohio State University were propagated and homozygous lines were isolated. Homozygous lines were found to breed true in at least one subsequent generation using PCR-based genotyping, as recommended by the Salk Institute Genomic Analysis Laboratory (http://signal.salk.edu/). We determined the gene expression phenotype caused by each T-DNA insertion allele by comparing the levels of mRNA transcribed from each T-DNA allele with the corresponding wild-type gene using RT-PCR as described by Ruckle et al. (2007).
Transcriptome Analyses
To establish conditions that are useful for studying the impact of plastid signaling on the light-regulated transcriptome, total RNA was extracted from seedlings that were grown in various qualities and quantities of light, and the levels of Lhcb1 and RbcS mRNA were quantified using RNA-blot hybridizations as described by Ruckle et al. (2007). All experiments were performed with four biological replicates, with one exception. Only three biological replicates were used for the lincomycin-treated seedlings collected 1 h after the fluence-rate shift. Each biological replicate contained 50 to 100 seedlings. To minimize variability among independent preparations of RNA, three independent RNA extractions were performed for each biological replicate using the RNeasy Plant Miniprep Kit (Qiagen) with the on-column DNase I treatment. The three independent RNA extractions from each biological replicate were subsequently combined to generate one RNA preparation for each biological replicate. RNA samples from biological replicates were independently extracted, processed, and analyzed. Biotinylated target RNA was prepared from 5 μg of total RNA for each sample using GeneChip One-Cycle Target Labeling (Affymetrix). For each sample, 15 μg of labeled target complementary RNA was purified, fragmented, and hybridized to the GeneChip Arabidopsis ATH1 Genome Array (Affymetrix) as recommended by the manufacturer. The GeneChip arrays were then washed and stained using the GeneChip Fluidics Station 450 (Affymetrix) and analyzed using the GeneChip Scanner 3000 7G (Affymetrix).
All data used in this study passed previously described quality assurance protocols (Burgoon et al., 2005). Microarray data were normalized using Gene Chip Robust Multi-array Averaging in R/Bioconductor (http://www.bioconductor.org/packages/2.6/bioc/html/gcrma.html). Posterior probabilities were calculated using an empirical Bayes analysis on a per gene, per time point, and per treatment basis (Smyth, 2004). Both the unprocessed and normalized microarray data discussed in this publication were deposited in the National Center for Biotechnology Information Gene Expression Omnibus (Edgar et al., 2002) and are accessible through GEO Series accession number GSE24517 (http://www.ncbi.nlm.nih.gov/geo/query/acc.cgi?acc=GSE24517). Significant differences in gene expression are defined as those causing a 2-fold change (P ≤ 0.01). Trajectory analysis of differentially expressed genes was performed in R using singular value decomposition.
Agglomerative hierarchical clustering (Euclidean distance) of differentially expressed genes was performed in R using a complete linkage method. To create gene lists for each cluster, the heat maps were reconstructed in Microsoft Excel 2007 using the “rowInd” function of R and the conditional formatting function from Microsoft Excel 2007. In addition to agglomerative hierarchical clustering, manual filtering of expression patterns was performed to identify genes that fit user-defined terms such as “genes induced early,” “genes induced late,” or “genes repressed by chloroplast dysfunction.” Microsoft Excel 2007 was used to sort the genes that fit each model of expression to create gene lists for each model of expression.
GO terms were tested for enrichment in the expression clusters and user-defined expression patterns using the GO terms from the GO Consortium (Ashburner et al., 2000) and Ontologizer 2.0 (Bauer et al., 2008). The gene association file was downloaded from the GO Web site (http://www.geneontology.org/) Concurrent Versions System (CVS) version 1.1260, Gene Ontology Consortium validation from July 21, 2009. The gene association file and the gene lists for both expression clusters and user-defined expression patterns were uploaded into Ontologizer 2.0. Ontologizer 2.0 identifies GO terms that are significantly enriched in a data set using a one-tailed Fisher’s exact test (Grossmann et al., 2007; Bauer et al., 2008). GO terms were considered significantly enriched by Ontologizer 2.0 at P ≤ 0.01 after Westfall-Young multiple comparison correcting (Bauer et al., 2008). Ontologizer 2.0 was not used to correct for redundancies between parent-GO terms and the child-GO terms, which contain a subset of genes found in a particular parent-GO term. Only a term-for-term enrichment that separately tests for the enrichment of parent-GO and child-GO terms was used to test for the enrichment of GO terms, as recommended previously (Grossmann et al., 2007). Results from this analysis yielded a list of GO terms that were enriched for at least one expression cluster or pattern. In this list, GO terms are represented by the −log10 of uncorrected P values. Next, a matrix that compares the −log10 of uncorrected P values and enriched expression patterns was created in Microsoft Excel 2007. Agglomerative hierarchical clustering was performed on this matrix as described above for differentially expressed genes. When parent-GO and child-GO terms clustered together, the parent term was used. Parent-GO and child-GO terms that did not cluster together were considered separate terms. The child term was used as the GO-enriched term only in these instances. From this analysis, 55 GO terms were classified as distinct and enriched terms. We found the genes that made up these 55 enriched terms at the GO Web site using the advanced search function in AmiGO (Carbon et al., 2009) version 1.7, release date October 7, 2009. To remove potential artifacts of computational annotation of the GO, only genes that had the following evidence codes were considered: inferred from direct assay (IDA), inferred from experiment (EXP), inferred from expression pattern (IEP), inferred from genetic interaction (IGI), inferred from mutant phenotype (IMP), inferred from physical interaction (IPI), traceable author statement (TAS), and nontraceable author statement (NAS; http://www.geneontology.org; Rhee et al., 2008). Agglomerative hierarchical clustering was performed on significantly regulated genes from the enriched GO terms as described above for differentially expressed genes.
Genes that are significantly regulated by particular types of ROS in particular subcellular locations were described previously by Gadjev et al. (2006). These ROS-regulated genes were tested for significant regulation by the BR fluence-rate shift and lincomycin treatment as described for BR terms. Significant regulation was established by calculating a hypergeometric distribution as described for estimating term-for-term overrepresentation of a BR term (Grossmann et al., 2007).
Analysis of Chlorophyll Levels in Arabidopsis Seedlings
Chlorophyll was extracted using N,N′-dimethylformamide and quantified as described previously (Porra et al., 1989), except that we homogenized 10 to 20 mg of seedlings in 1.5-mL microfuge tubes that contained a single 3-mm very-high-density zirconium oxide bead (Glen Mills) using a TissueLyser (Qiagen).
Analysis of Gene Expression by qRT-PCR
We extracted total RNA from Arabidopsis seedlings using the RNeasy Plant Mini Kit (Qiagen) and synthesized cDNA using oligo(dT)12-18 and SuperScript III (Invitrogen). Real-time qPCR was performed with the Fast SYBR Green Master Mix and the ABI 7500 Fast Real-Time PCR system (Applied Biosystems). The oligonucleotides used for qPCR analysis of RbcSA1, PsbS, CHS, and AOS expression were 5′-AATTTCCGGACTTAACGTTTGTTT-3′ and 5′-CATCAGACAGTTGAGAATCCGATAGA-3′, 5′-CGGCAAAAACGTCCGATCCTG-3′ and 5′-GTGAACCCAAACAATGGACCTTG-3′, 5′-TCGGACCAGGTCTCACTGTTG-3′ and 5′-AGGCAAGCGTTCTGTTTAGAGAG-3′, and 5′-GGAGAACTCACGATGGGAGCGATT-3′ and 5′-GCGTCGTGGCTTTCGATAACCAGA-3′, respectively. The oligonucleotides used for qPCR analysis of AAA, BAP1, CCA1, CDKB2.2, FER1, Lhcb1.4, LOX2, MCM5, NodL, PRR5, and ZAT12 expression were described previously (Mockler et al., 2004; Li et al., 2006; Baruah et al., 2009a, 2009b; Shultz et al., 2009; Rodríguez et al., 2010; Adhikari et al., 2011; Wang et al., 2011b). We calculated relative mRNA levels using the comparative cycle threshold method (Pfaffl, 2001) or the relative standard curve method according to the manufacturer’s recommendations (Applied Biosystems). The expression of each gene was normalized to the expression of UBQ10. The statistical significance of the differences in expression levels was calculated with an unpaired t test.
Sequence data from this article can be found in the Arabidopsis Genome Initiative database and the GenBank/EMBL data libraries under the following accession numbers: AAA, At3g28580, NM_113778; BAP1, At3g61190, NM_115983; CHS, At5g13930, 831241; Lhcb1.4, At2g34430, 818006; NodL, At5g64870, NM_125885; RbcSA1, At1g67090, 843029. The accession numbers for other sequence data are listed in Table I, Supplemental Figures S6 to S9, and Supplemental Tables S3 to S5. T-DNA insertion mutants and other mutants used in this study are listed in Table I and Supplemental Figures S7 to S10. gun1-101 and hy5 are described by Ruckle et al. (2007).
Supplemental Data
The following materials are available in the online version of this article.
Supplemental Figure S1. Expression of Lhcb1 and RbcS following a fluence shift.
Supplemental Figure S2. Agglomerative clustering of early time points (i.e. 0.5 and 1 h) and late time points (i.e. 4 and 24 h).
Supplemental Figure S3. Distribution of user-defined expression patterns among light- and plastid-regulated genes.
Supplemental Figure S4. Agglomerative hierarchical clustering of significantly enriched GO terms with expression clusters.
Supplemental Figure S5. Clustering of significantly enriched GO terms with user-defined expression patterns.
Supplemental Figure S6. Agglomerative hierarchical clustering of significantly regulated genes.
Supplemental Figure S7. FER1 and ZAT12 expression in lincomycin-treated and untreated seedlings.
Supplemental Figure S8. T-DNA insertion alleles of genes whose expression is more highly induced in lincomycin-treated than in untreated seedlings by 1 h following the BR fluence-rate shift.
Supplemental Figure S9. T-DNA insertion alleles of genes whose expression is similarly induced in lincomycin-treated and untreated seedlings by 1 h following the BR fluence-rate shift.
Supplemental Figure S10. Characterization of T-DNA insertion alleles of genes that encode light signaling factors.
Supplemental Figure S11. Chlorophyll phenotypes of light signaling mutants.
Supplemental Figure S12. Lhcb1.4, RbcS1A, PsbS, and CHS expression in lincomycin-treated end mutants after an increase in fluence rate.
Supplemental Figure S13. Lhcb1.4, RbcS1A, PsbS, and CHS expression in particular lincomycin-treated end mutants in continuous 60 μmol m−2 s−1 BR light.
Supplemental Figure S14. gun1-101, 1-83, 1-H11, 2-31, 3-F12, 5-74, and 6-48 treated with various concentrations of lincomycin.
Supplemental Figure S15. 8-D01, 15-F11, 15-H05, 17-12, 17-43, 19-29, and 21-35 treated with various concentrations of lincomycin.
Supplemental Figure S16. 21-76, 22-B11, 23-F03, 25-G09, 29-18, 36-40, and 38-44 treated with various concentrations of lincomycin.
Supplemental Figure S17. Chlorophyll levels in end mutants and light signaling mutants grown in continuous white light.
Supplemental Table S1. Significance of enriched biological process and cellular component GO terms in particular expression patterns.
Supplemental Table S2. Significance of enriched biological process and response to stimulus GO terms in particular expression patterns.
Supplemental Table S3. Genes that exhibit enhanced light-induced expression in lincomycin-treated seedlings and that lack publicly available T-DNA alleles.
Supplemental Table S4. Alleles of genes that exhibit similar light-induced expression in lincomycin-treated and untreated seedlings that cause end phenotypes.
Supplemental Table S5. The diverse regulators of genes that exhibit enhanced light-induced expression in lincomycin-treated seedlings.
Supplementary Material
Acknowledgments
We thank Stephanie M. DeMarco (Michigan State University) for technical assistance. We thank Ian Major and Gregg Howe (Michigan State University) for the oligonucleotides used for qPCR analysis of AOS expression.
Glossary
- ROS
reactive oxygen species
- GO
Gene Ontology
- BR
40% blue light and 60% red light
- JA
jasmonic acid
- qRT
quantitative reverse transcription
- RT
reverse transcription
References
- Acevedo-Hernández GJ, León P, Herrera-Estrella LR. (2005) Sugar and ABA responsiveness of a minimal RBCS light-responsive unit is mediated by direct binding of ABI4. Plant J 43: 506–519 [DOI] [PubMed] [Google Scholar]
- Adamska I, Funk C, Renger G, Andersson B. (1996) Developmental regulation of the PsbS gene expression in spinach seedlings: the role of phytochrome. Plant Mol Biol 31: 793–802 [DOI] [PubMed] [Google Scholar]
- Adhikari ND, Froehlich JE, Strand DD, Buck SM, Kramer DM, Larkin RM. (2011) GUN4-porphyrin complexes bind the ChlH/GUN5 subunit of Mg-chelatase and promote chlorophyll biosynthesis in Arabidopsis. Plant Cell 23: 1449–1467 [DOI] [PMC free article] [PubMed] [Google Scholar]
- Allahverdiyeva Y, Mamedov F, Holmström M, Nurmi M, Lundin B, Styring S, Spetea C, Aro EM. (2009) Comparison of the electron transport properties of the psbo1 and psbo2 mutants of Arabidopsis thaliana. Biochim Biophys Acta 1787: 1230–1237 [DOI] [PubMed] [Google Scholar]
- Alonso JM, Stepanova AN, Leisse TJ, Kim CJ, Chen H, Shinn P, Stevenson DK, Zimmerman J, Barajas P, Cheuk R, et al. (2003) Genome-wide insertional mutagenesis of Arabidopsis thaliana. Science 301: 653–657 [DOI] [PubMed] [Google Scholar]
- Aluru MR, Zola J, Foudree A, Rodermel SR. (2009) Chloroplast photooxidation-induced transcriptome reprogramming in Arabidopsis immutans white leaf sectors. Plant Physiol 150: 904–923 [DOI] [PMC free article] [PubMed] [Google Scholar]
- Amano Y, Tsubouchi H, Shinohara H, Ogawa M, Matsubayashi Y. (2007) Tyrosine-sulfated glycopeptide involved in cellular proliferation and expansion in Arabidopsis. Proc Natl Acad Sci USA 104: 18333–18338 [DOI] [PMC free article] [PubMed] [Google Scholar]
- Andersson U, Heddad M, Adamska I. (2003) Light stress-induced one-helix protein of the chlorophyll a/b-binding family associated with photosystem I. Plant Physiol 132: 811–820 [DOI] [PMC free article] [PubMed] [Google Scholar]
- Ang LH, Deng XW. (1994) Regulatory hierarchy of photomorphogenic loci: allele-specific and light-dependent interaction between the HY5 and COP1 loci. Plant Cell 6: 613–628 [DOI] [PMC free article] [PubMed] [Google Scholar]
- Antoni R, Gonzalez-Guzman M, Rodriguez L, Rodrigues A, Pizzio GA, Rodriguez PL. (2012) Selective inhibition of clade A phosphatases type 2C by PYR/PYL/RCAR abscisic acid receptors. Plant Physiol 158: 970–980 [DOI] [PMC free article] [PubMed] [Google Scholar]
- Ashburner M, Ball CA, Blake JA, Botstein D, Butler H, Cherry JM, Davis AP, Dolinski K, Dwight SS, Eppig JT, et al. (2000) Gene Ontology: tool for the unification of biology. Nat Genet 25: 25–29 [DOI] [PMC free article] [PubMed] [Google Scholar]
- Ballaré CL. (2009) Illuminated behaviour: phytochrome as a key regulator of light foraging and plant anti-herbivore defence. Plant Cell Environ 32: 713–725 [DOI] [PubMed] [Google Scholar]
- Barry CS, McQuinn RP, Chung MY, Besuden A, Giovannoni JJ. (2008) Amino acid substitutions in homologs of the STAY-GREEN protein are responsible for the green-flesh and chlorophyll retainer mutations of tomato and pepper. Plant Physiol 147: 179–187 [DOI] [PMC free article] [PubMed] [Google Scholar]
- Baruah A, Simková K, Apel K, Laloi C. (2009a) Arabidopsis mutants reveal multiple singlet oxygen signaling pathways involved in stress response and development. Plant Mol Biol 70: 547–563 [DOI] [PubMed] [Google Scholar]
- Baruah A, Simková K, Hincha DK, Apel K, Laloi C. (2009b) Modulation of O-mediated retrograde signaling by the PLEIOTROPIC RESPONSE LOCUS 1 (PRL1) protein, a central integrator of stress and energy signaling. Plant J 60: 22–32 [DOI] [PubMed] [Google Scholar]
- Bauer S, Grossmann S, Vingron M, Robinson PN. (2008) Ontologizer 2.0: a multifunctional tool for GO term enrichment analysis and data exploration. Bioinformatics 24: 1650–1651 [DOI] [PubMed] [Google Scholar]
- Baumgardt RL, Oliverio KA, Casal JJ, Hoecker U. (2002) SPA1, a component of phytochrome A signal transduction, regulates the light signaling current. Planta 215: 745–753 [DOI] [PubMed] [Google Scholar]
- Bieniawska Z, Espinoza C, Schlereth A, Sulpice R, Hincha DK, Hannah MA. (2008) Disruption of the Arabidopsis circadian clock is responsible for extensive variation in the cold-responsive transcriptome. Plant Physiol 147: 263–279 [DOI] [PMC free article] [PubMed] [Google Scholar]
- Bilgin DD, Zavala JA, Zhu J, Clough SJ, Ort DR, DeLucia EH. (2010) Biotic stress globally downregulates photosynthesis genes. Plant Cell Environ 33: 1597–1613 [DOI] [PubMed] [Google Scholar]
- Bowler C, Yamagata H, Neuhaus G, Chua NH. (1994) Phytochrome signal transduction pathways are regulated by reciprocal control mechanisms. Genes Dev 8: 2188–2202 [DOI] [PubMed] [Google Scholar]
- Burgoon LD, Eckel-Passow JE, Gennings C, Boverhof DR, Burt JW, Fong CJ, Zacharewski TR. (2005) Protocols for the assurance of microarray data quality and process control. Nucleic Acids Res 33: e172. [DOI] [PMC free article] [PubMed] [Google Scholar]
- Carbon S, Ireland A, Mungall CJ, Shu S, Marshall B, Lewis SAmiGO Hub, Web Presence Working Group (2009) AmiGO: online access to ontology and annotation data. Bioinformatics 25: 288–289 [DOI] [PMC free article] [PubMed] [Google Scholar]
- Chen J, Burke JJ, Velten J, Xin Z. (2006) FtsH11 protease plays a critical role in Arabidopsis thermotolerance. Plant J 48: 73–84 [DOI] [PubMed] [Google Scholar]
- Chen M, Choi Y, Voytas DF, Rodermel S. (2000) Mutations in the Arabidopsis VAR2 locus cause leaf variegation due to the loss of a chloroplast FtsH protease. Plant J 22: 303–313 [DOI] [PubMed] [Google Scholar]
- Cho DS, Hong SH, Nam HG, Soh MS. (2003) FIN5 positively regulates far-red light responses in Arabidopsis thaliana. Plant Cell Physiol 44: 565–572 [DOI] [PubMed] [Google Scholar]
- Chory J. (2010) Light signal transduction: an infinite spectrum of possibilities. Plant J 61: 982–991 [DOI] [PMC free article] [PubMed] [Google Scholar]
- Chory J, Peto C, Feinbaum R, Pratt L, Ausubel FM. (1989) Arabidopsis thaliana mutant that develops as a light-grown plant in the absence of light. Cell 58: 991–999 [DOI] [PubMed] [Google Scholar]
- Choy MK, Sullivan JA, Theobald JC, Davies WJ, Gray JC. (2008) An Arabidopsis mutant able to green after extended dark periods shows decreased transcripts of seed protein genes and altered sensitivity to abscisic acid. J Exp Bot 59: 3869–3884 [DOI] [PMC free article] [PubMed] [Google Scholar]
- Clifton R, Lister R, Parker KL, Sappl PG, Elhafez D, Millar AH, Day DA, Whelan J. (2005) Stress-induced co-expression of alternative respiratory chain components in Arabidopsis thaliana. Plant Mol Biol 58: 193–212 [DOI] [PubMed] [Google Scholar]
- Cottage A, Mott EK, Kempster JA, Gray JC. (2010) The Arabidopsis plastid-signalling mutant gun1 (genomes uncoupled1) shows altered sensitivity to sucrose and abscisic acid and alterations in early seedling development. J Exp Bot 61: 3773–3786 [DOI] [PMC free article] [PubMed] [Google Scholar]
- Cottage AJ, Mott EK, Wang J-H, Sullivan JA, MacLean D, Tran L, Choy M-K, Newell C, Kavanagh TA, Aspinall S, et al. (2008) GUN1 (GENOMES UNCOUPLED1) encodes a pentatricopeptide repeat (PPR) protein involved in plastid protein synthesis-responsive retrograde signaling to the nucleus. In JF Allen, E Gnatt, JH Golbeck, B Osmond, eds, Photosynthesis: Energy from the Sun. 14th International Congress on Photosynthesis. Springer, Dordrecht, The Netherlands, pp 1201–1205 [Google Scholar]
- Danon A, Coll NS, Apel K. (2006) Cryptochrome-1-dependent execution of programmed cell death induced by singlet oxygen in Arabidopsis thaliana. Proc Natl Acad Sci USA 103: 17036–17041 [DOI] [PMC free article] [PubMed] [Google Scholar]
- Doyle SM, Diamond M, McCabe PF. (2010) Chloroplast and reactive oxygen species involvement in apoptotic-like programmed cell death in Arabidopsis suspension cultures. J Exp Bot 61: 473–482 [DOI] [PMC free article] [PubMed] [Google Scholar]
- Edgar R, Domrachev M, Lash AE. (2002) Gene Expression Omnibus: NCBI gene expression and hybridization array data repository. Nucleic Acids Res 30: 207–210 [DOI] [PMC free article] [PubMed] [Google Scholar]
- Enami K, Ozawa T, Motohashi N, Nakamura M, Tanaka K, Hanaoka M. (2011) Plastid-to-nucleus retrograde signals are essential for the expression of nuclear starch biosynthesis genes during amyloplast differentiation in tobacco BY-2 cultured cells. Plant Physiol 157: 518–530 [DOI] [PMC free article] [PubMed] [Google Scholar]
- Estavillo GM, Crisp PA, Pornsiriwong W, Wirtz M, Collinge D, Carrie C, Giraud E, Whelan J, David P, Javot H, et al. (2011) Evidence for a SAL1-PAP chloroplast retrograde pathway that functions in drought and high light signaling in Arabidopsis. Plant Cell 23: 3992–4012 [DOI] [PMC free article] [PubMed] [Google Scholar]
- Fankhauser C, Yeh KC, Lagarias JC, Zhang H, Elich TD, Chory J. (1999) PKS1, a substrate phosphorylated by phytochrome that modulates light signaling in Arabidopsis. Science 284: 1539–1541 [DOI] [PubMed] [Google Scholar]
- Felder S, Meierhoff K, Sane AP, Meurer J, Driemel C, Plücken H, Klaff P, Stein B, Bechtold N, Westhoff P. (2001) The nucleus-encoded HCF107 gene of Arabidopsis provides a link between intercistronic RNA processing and the accumulation of translation-competent psbH transcripts in chloroplasts. Plant Cell 13: 2127–2141 [DOI] [PMC free article] [PubMed] [Google Scholar]
- Ferrer JL, Austin MB, Stewart CJ, Jr, Noel JP. (2008) Structure and function of enzymes involved in the biosynthesis of phenylpropanoids. Plant Physiol Biochem 46: 356–370 [DOI] [PMC free article] [PubMed] [Google Scholar]
- Friso G, Giacomelli L, Ytterberg AJ, Peltier JB, Rudella A, Sun Q, Wijk KJ. (2004) In-depth analysis of the thylakoid membrane proteome of Arabidopsis thaliana chloroplasts: new proteins, new functions, and a plastid proteome database. Plant Cell 16: 478–499 [DOI] [PMC free article] [PubMed] [Google Scholar]
- Fujita Y, Nakashima K, Yoshida T, Katagiri T, Kidokoro S, Kanamori N, Umezawa T, Fujita M, Maruyama K, Ishiyama K, et al. (2009) Three SnRK2 protein kinases are the main positive regulators of abscisic acid signaling in response to water stress in Arabidopsis. Plant Cell Physiol 50: 2123–2132 [DOI] [PubMed] [Google Scholar]
- Gadjev I, Vanderauwera S, Gechev TS, Laloi C, Minkov IN, Shulaev V, Apel K, Inzé D, Mittler R, Van Breusegem F. (2006) Transcriptomic footprints disclose specificity of reactive oxygen species signaling in Arabidopsis. Plant Physiol 141: 436–445 [DOI] [PMC free article] [PubMed] [Google Scholar]
- Galvez-Valdivieso G, Mullineaux PM. (2010) The role of reactive oxygen species in signalling from chloroplasts to the nucleus. Physiol Plant 138: 430–439 [DOI] [PubMed] [Google Scholar]
- Gao J, Kaufman LS. (1994) Blue-light regulation of the Arabidopsis thaliana Cab1 gene. Plant Physiol 104: 1251–1257 [DOI] [PMC free article] [PubMed] [Google Scholar]
- Goral TK, Johnson MP, Brain AP, Kirchhoff H, Ruban AV, Mullineaux CW. (2010) Visualizing the mobility and distribution of chlorophyll proteins in higher plant thylakoid membranes: effects of photoinhibition and protein phosphorylation. Plant J 62: 948–959 [DOI] [PubMed] [Google Scholar]
- Gould KS. (2004) Nature’s Swiss Army knife: the diverse protective roles of anthocyanins in leaves. J Biomed Biotechnol 2004: 314–320 [DOI] [PMC free article] [PubMed] [Google Scholar]
- Gray JC, Sullivan JA, Wang JH, Jerome CA, MacLean D. (2003) Coordination of plastid and nuclear gene expression. Philos Trans R Soc Lond B Biol Sci 358: 135–144, discussion 144–145 [DOI] [PMC free article] [PubMed] [Google Scholar]
- Grossmann S, Bauer S, Robinson PN, Vingron M. (2007) Improved detection of overrepresentation of Gene Ontology annotations with parent child analysis. Bioinformatics 23: 3024–3031 [DOI] [PubMed] [Google Scholar]
- Gruber H, Heijde M, Heller W, Albert A, Seidlitz HK, Ulm R. (2010) Negative feedback regulation of UV-B-induced photomorphogenesis and stress acclimation in Arabidopsis. Proc Natl Acad Sci USA 107: 20132–20137 [DOI] [PMC free article] [PubMed] [Google Scholar]
- Guo XH, Deng KQ, Wang J, Yu DS, Zhao Q, Liu XM. (2010) Mutational analysis of Arabidopsis PP2CA2 involved in abscisic acid signal transduction. Mol Biol Rep 37: 763–769 [DOI] [PubMed] [Google Scholar]
- Harmon FG, Kay SA. (2003) The F box protein AFR is a positive regulator of phytochrome A-mediated light signaling. Curr Biol 13: 2091–2096 [DOI] [PubMed] [Google Scholar]
- Hassidim M, Yakir E, Fradkin D, Hilman D, Kron I, Keren N, Harir Y, Yerushalmi S, Green RM. (2007) Mutations in CHLOROPLAST RNA BINDING provide evidence for the involvement of the chloroplast in the regulation of the circadian clock in Arabidopsis. Plant J 51: 551–562 [DOI] [PubMed] [Google Scholar]
- He P, Chintamanani S, Chen Z, Zhu L, Kunkel BN, Alfano JR, Tang X, Zhou JM. (2004) Activation of a COI1-dependent pathway in Arabidopsis by Pseudomonas syringae type III effectors and coronatine. Plant J 37: 589–602 [DOI] [PubMed] [Google Scholar]
- Heddad M, Adamska I. (2000) Light stress-regulated two-helix proteins in Arabidopsis thaliana related to the chlorophyll a/b-binding gene family. Proc Natl Acad Sci USA 97: 3741–3746 [DOI] [PMC free article] [PubMed] [Google Scholar]
- Herms DA, Mattson WJ. (1992) The dilemma of plants: to grow or defend. Q Rev Biol 67: 283–335 [Google Scholar]
- Hoecker U, Quail PH. (2001) The phytochrome A-specific signaling intermediate SPA1 interacts directly with COP1, a constitutive repressor of light signaling in Arabidopsis. J Biol Chem 276: 38173–38178 [DOI] [PubMed] [Google Scholar]
- Hoecker U, Xu Y, Quail PH. (1998) SPA1: a new genetic locus involved in phytochrome A-specific signal transduction. Plant Cell 10: 19–33 [DOI] [PMC free article] [PubMed] [Google Scholar]
- Hong SH, Kim HJ, Ryu JS, Choi H, Jeong S, Shin J, Choi G, Nam HG. (2008) CRY1 inhibits COP1-mediated degradation of BIT1, a MYB transcription factor, to activate blue light-dependent gene expression in Arabidopsis. Plant J 55: 361–371 [DOI] [PubMed] [Google Scholar]
- Imaizumi T, Schultz TF, Harmon FG, Ho LA, Kay SA. (2005) FKF1 F-box protein mediates cyclic degradation of a repressor of CONSTANS in Arabidopsis. Science 309: 293–297 [DOI] [PubMed] [Google Scholar]
- Iwasaki T, Saito Y, Harada E, Kasai M, Shoji K, Miyao M, Yamamoto N. (1997) Cloning of cDNA encoding the rice 22 kDa protein of photosystem II (PSII-S) and analysis of light-induced expression of the gene. Gene 185: 223–229 [DOI] [PubMed] [Google Scholar]
- Jaillais Y, Chory J. (2010) Unraveling the paradoxes of plant hormone signaling integration. Nat Struct Mol Biol 17: 642–645 [DOI] [PMC free article] [PubMed] [Google Scholar]
- Jiao Y, Lau OS, Deng XW. (2007) Light-regulated transcriptional networks in higher plants. Nat Rev Genet 8: 217–230 [DOI] [PubMed] [Google Scholar]
- Jiao Y, Yang H, Ma L, Sun N, Yu H, Liu T, Gao Y, Gu H, Chen Z, Wada M, et al. (2003) A genome-wide analysis of blue-light regulation of Arabidopsis transcription factor gene expression during seedling development. Plant Physiol 133: 1480–1493 [DOI] [PMC free article] [PubMed] [Google Scholar]
- Kakizaki T, Matsumura H, Nakayama K, Che FS, Terauchi R, Inaba T. (2009) Coordination of plastid protein import and nuclear gene expression by plastid-to-nucleus retrograde signaling. Plant Physiol 151: 1339–1353 [DOI] [PMC free article] [PubMed] [Google Scholar]
- Kakizaki T, Yazu F, Nakayama K, Ito-Inaba Y, Inaba T. (2012) Plastid signalling under multiple conditions is accompanied by a common defect in RNA editing in plastids. J Exp Bot 63: 251–260 [DOI] [PMC free article] [PubMed] [Google Scholar]
- Kanamaru K, Tanaka K. (2004) Roles of chloroplast RNA polymerase sigma factors in chloroplast development and stress response in higher plants. Biosci Biotechnol Biochem 68: 2215–2223 [DOI] [PubMed] [Google Scholar]
- Kato Y, Miura E, Ido K, Ifuku K, Sakamoto W. (2009) The variegated mutants lacking chloroplastic FtsHs are defective in D1 degradation and accumulate reactive oxygen species. Plant Physiol 151: 1790–1801 [DOI] [PMC free article] [PubMed] [Google Scholar]
- Khanna R, Shen Y, Toledo-Ortiz G, Kikis EA, Johannesson H, Hwang YS, Quail PH. (2006) Functional profiling reveals that only a small number of phytochrome-regulated early-response genes in Arabidopsis are necessary for optimal deetiolation. Plant Cell 18: 2157–2171 [DOI] [PMC free article] [PubMed] [Google Scholar]
- Kindgren P, Norén L, Barajas López JD, Shaikhali J, Strand Å. (2011) Interplay between HEAT SHOCK PROTEIN 90 and HY5 controls PhANG expression in response to the GUN5 plastid signal. Mol Plant (in press) [DOI] [PubMed] [Google Scholar]
- Kleffmann T, Russenberger D, von Zychlinski A, Christopher W, Sjölander K, Gruissem W, Baginsky S. (2004) The Arabidopsis thaliana chloroplast proteome reveals pathway abundance and novel protein functions. Curr Biol 14: 354–362 [DOI] [PubMed] [Google Scholar]
- Klimmek F, Sjödin A, Noutsos C, Leister D, Jansson S. (2006) Abundantly and rarely expressed Lhc protein genes exhibit distinct regulation patterns in plants. Plant Physiol 140: 793–804 [DOI] [PMC free article] [PubMed] [Google Scholar]
- Kobayashi Y, Imamura S, Hanaoka M, Tanaka K. (2011) A tetrapyrrole-regulated ubiquitin ligase controls algal nuclear DNA replication. Nat Cell Biol 13: 483–487 [DOI] [PubMed] [Google Scholar]
- Kobayashi Y, Kanesaki Y, Tanaka A, Kuroiwa H, Kuroiwa T, Tanaka K. (2009) Tetrapyrrole signal as a cell-cycle coordinator from organelle to nuclear DNA replication in plant cells. Proc Natl Acad Sci USA 106: 803–807 [DOI] [PMC free article] [PubMed] [Google Scholar]
- Kobayashi A, Takahashi A, Kakimoto Y, Miyazawa Y, Fujii N, Higashitani A, Takahashi H. (2007) A gene essential for hydrotropism in roots. Proc Natl Acad Sci USA 104: 4724–4729 [DOI] [PMC free article] [PubMed] [Google Scholar]
- Koussevitzky S, Nott A, Mockler TC, Hong F, Sachetto-Martins G, Surpin M, Lim J, Mittler R, Chory J. (2007) Signals from chloroplasts converge to regulate nuclear gene expression. Science 316: 715–719 [PubMed] [Google Scholar]
- Lariguet P, Schepens I, Hodgson D, Pedmale UV, Trevisan M, Kami C, de Carbonnel M, Alonso JM, Ecker JR, Liscum E, et al. (2006) PHYTOCHROME KINASE SUBSTRATE 1 is a phototropin 1 binding protein required for phototropism. Proc Natl Acad Sci USA 103: 10134–10139 [DOI] [PMC free article] [PubMed] [Google Scholar]
- Larkin RM, Alonso JM, Ecker JR, Chory J. (2003) GUN4, a regulator of chlorophyll synthesis and intracellular signaling. Science 299: 902–906 [DOI] [PubMed] [Google Scholar]
- Larkin RM, Ruckle ME. (2008) Integration of light and plastid signals. Curr Opin Plant Biol 11: 593–599 [DOI] [PubMed] [Google Scholar]
- Ledger S, Strayer C, Ashton F, Kay SA, Putterill J. (2001) Analysis of the function of two circadian-regulated CONSTANS-LIKE genes. Plant J 26: 15–22 [DOI] [PubMed] [Google Scholar]
- Lee J, He K, Stolc V, Lee H, Figueroa P, Gao Y, Tongprasit W, Zhao H, Lee I, Deng XW. (2007) Analysis of transcription factor HY5 genomic binding sites revealed its hierarchical role in light regulation of development. Plant Cell 19: 731–749 [DOI] [PMC free article] [PubMed] [Google Scholar]
- Leivar P, Tepperman JM, Monte E, Calderon RH, Liu TL, Quail PH. (2009) Definition of early transcriptional circuitry involved in light-induced reversal of PIF-imposed repression of photomorphogenesis in young Arabidopsis seedlings. Plant Cell 21: 3535–3553 [DOI] [PMC free article] [PubMed] [Google Scholar]
- Lemeille S, Rochaix JD. (2010) State transitions at the crossroad of thylakoid signalling pathways. Photosynth Res 106: 33–46 [DOI] [PubMed] [Google Scholar]
- Li X, Mo X, Shou H, Wu P. (2006) Cytokinin-mediated cell cycling arrest of pericycle founder cells in lateral root initiation of Arabidopsis. Plant Cell Physiol 47: 1112–1123 [DOI] [PubMed] [Google Scholar]
- Lindahl M, Spetea C, Hundal T, Oppenheim AB, Adam Z, Andersson B. (2000) The thylakoid FtsH protease plays a role in the light-induced turnover of the photosystem II D1 protein. Plant Cell 12: 419–431 [DOI] [PMC free article] [PubMed] [Google Scholar]
- Liu D, Gong Q, Ma Y, Li P, Li J, Yang S, Yuan L, Yu Y, Pan D, Xu F, Wang NN. (2010) cpSecA, a thylakoid protein translocase subunit, is essential for photosynthetic development in Arabidopsis. J Exp Bot 61: 1655–1669 [DOI] [PubMed] [Google Scholar]
- Liu Z, Butow RA. (2006) Mitochondrial retrograde signaling. Annu Rev Genet 40: 159–185 [DOI] [PubMed] [Google Scholar]
- López-Juez E, Dillon E, Magyar Z, Khan S, Hazeldine S, de Jager SM, Murray JA, Beemster GT, Bögre L, Shanahan H. (2008) Distinct light-initiated gene expression and cell cycle programs in the shoot apex and cotyledons of Arabidopsis. Plant Cell 20: 947–968 [DOI] [PMC free article] [PubMed] [Google Scholar]
- Ma L, Zhao H, Deng XW. (2003) Analysis of the mutational effects of the COP/DET/FUS loci on genome expression profiles reveals their overlapping yet not identical roles in regulating Arabidopsis seedling development. Development 130: 969–981 [DOI] [PubMed] [Google Scholar]
- Martínez-Hernández A, López-Ochoa L, Argüello-Astorga G, Herrera-Estrella L. (2002) Functional properties and regulatory complexity of a minimal RBCS light-responsive unit activated by phytochrome, cryptochrome, and plastid signals. Plant Physiol 128: 1223–1233 [DOI] [PMC free article] [PubMed] [Google Scholar]
- Masuda T, Fujita Y. (2008) Regulation and evolution of chlorophyll metabolism. Photochem Photobiol Sci 7: 1131–1149 [DOI] [PubMed] [Google Scholar]
- Mathieu J, Yant LJ, Mürdter F, Küttner F, Schmid M. (2009) Repression of flowering by the miR172 target SMZ. PLoS Biol 7: e1000148. [DOI] [PMC free article] [PubMed] [Google Scholar]
- Mazzella MA, Cerdán PD, Staneloni RJ, Casal JJ. (2001) Hierarchical coupling of phytochromes and cryptochromes reconciles stability and light modulation of Arabidopsis development. Development 128: 2291–2299 [DOI] [PubMed] [Google Scholar]
- McCormac AC, Terry MJ. (2002) Light-signalling pathways leading to the co-ordinated expression of HEMA1 and Lhcb during chloroplast development in Arabidopsis thaliana. Plant J 32: 549–559 [DOI] [PubMed] [Google Scholar]
- Meier S, Tzfadia O, Vallabhaneni R, Gehring C, Wurtzel ET. (2011) A transcriptional analysis of carotenoid, chlorophyll and plastidial isoprenoid biosynthesis genes during development and osmotic stress responses in Arabidopsis thaliana. BMC Syst Biol 5: 77. [DOI] [PMC free article] [PubMed] [Google Scholar]
- Mochizuki N, Brusslan JA, Larkin R, Nagatani A, Chory J. (2001) Arabidopsis genomes uncoupled 5 (GUN5) mutant reveals the involvement of Mg-chelatase H subunit in plastid-to-nucleus signal transduction. Proc Natl Acad Sci USA 98: 2053–2058 [DOI] [PMC free article] [PubMed] [Google Scholar]
- Mochizuki N, Susek R, Chory J. (1996) An intracellular signal transduction pathway between the chloroplast and nucleus is involved in de-etiolation. Plant Physiol 112: 1465–1469 [DOI] [PMC free article] [PubMed] [Google Scholar]
- Mockler TC, Yu X, Shalitin D, Parikh D, Michael TP, Liou J, Huang J, Smith Z, Alonso JM, Ecker JR, et al. (2004) Regulation of flowering time in Arabidopsis by K homology domain proteins. Proc Natl Acad Sci USA 101: 12759–12764 [DOI] [PMC free article] [PubMed] [Google Scholar]
- Moreno JE, Tao Y, Chory J, Ballaré CL. (2009) Ecological modulation of plant defense via phytochrome control of jasmonate sensitivity. Proc Natl Acad Sci USA 106: 4935–4940 [DOI] [PMC free article] [PubMed] [Google Scholar]
- Mulo P, Pursiheimo S, Huou C-X, Tyystjärvi T, Aro E-M. (2003) Multiple effects of antibiotics on chloroplast and nuclear gene expression. Funct Plant Biol 30: 1097–1103 [DOI] [PubMed] [Google Scholar]
- Murchie EH, Niyogi KK. (2011) Manipulation of photoprotection to improve plant photosynthesis. Plant Physiol 155: 86–92 [DOI] [PMC free article] [PubMed] [Google Scholar]
- Mussgnug JH, Wobbe L, Elles I, Claus C, Hamilton M, Fink A, Kahmann U, Kapazoglou A, Mullineaux CW, Hippler M, et al. (2005) NAB1 is an RNA binding protein involved in the light-regulated differential expression of the light-harvesting antenna of Chlamydomonas reinhardtii. Plant Cell 17: 3409–3421 [DOI] [PMC free article] [PubMed] [Google Scholar]
- Nagashima A, Hanaoka M, Shikanai T, Fujiwara M, Kanamaru K, Takahashi H, Tanaka K. (2004) The multiple-stress responsive plastid sigma factor, SIG5, directs activation of the psbD blue light-responsive promoter (BLRP) in Arabidopsis thaliana. Plant Cell Physiol 45: 357–368 [DOI] [PubMed] [Google Scholar]
- Neff MM, Chory J. (1998) Genetic interactions between phytochrome A, phytochrome B, and cryptochrome 1 during Arabidopsis development. Plant Physiol 118: 27–35 [DOI] [PMC free article] [PubMed] [Google Scholar]
- Noctor G, De Paepe R, Foyer CH. (2007) Mitochondrial redox biology and homeostasis in plants. Trends Plant Sci 12: 125–134 [DOI] [PubMed] [Google Scholar]
- Noguchi K, Yoshida K. (2008) Interaction between photosynthesis and respiration in illuminated leaves. Mitochondrion 8: 87–99 [DOI] [PubMed] [Google Scholar]
- Oelmüller R. (1989) Photooxidative destruction of chloroplasts and its effect on nuclear gene expression and extraplastidic enzyme levels. Photochem Photobiol Sci 49: 229–239 [Google Scholar]
- op den Camp RG, Przybyla D, Ochsenbein C, Laloi C, Kim C, Danon A, Wagner D, Hideg E, Göbel C, Feussner I, et al. (2003) Rapid induction of distinct stress responses after the release of singlet oxygen in Arabidopsis. Plant Cell 15: 2320–2332 [DOI] [PMC free article] [PubMed] [Google Scholar]
- Padmanabhan MS, Dinesh-Kumar SP. (2010) All hands on deck: the role of chloroplasts, endoplasmic reticulum, and the nucleus in driving plant innate immunity. Mol Plant Microbe Interact 23: 1368–1380 [DOI] [PubMed] [Google Scholar]
- Peltier JB, Ytterberg AJ, Sun Q, van Wijk KJ. (2004) New functions of the thylakoid membrane proteome of Arabidopsis thaliana revealed by a simple, fast, and versatile fractionation strategy. J Biol Chem 279: 49367–49383 [DOI] [PubMed] [Google Scholar]
- Peng L, Ma J, Chi W, Guo J, Zhu S, Lu Q, Lu C, Zhang L. (2006) LOW PSII ACCUMULATION1 is involved in efficient assembly of photosystem II in Arabidopsis thaliana. Plant Cell 18: 955–969 [DOI] [PMC free article] [PubMed] [Google Scholar]
- Petit JM, Briat JF, Lobréaux S. (2001) Structure and differential expression of the four members of the Arabidopsis thaliana ferritin gene family. Biochem J 359: 575–582 [DOI] [PMC free article] [PubMed] [Google Scholar]
- Pfaffl MW. (2001) A new mathematical model for relative quantification in real-time RT-PCR. Nucleic Acids Res 29: e45. [DOI] [PMC free article] [PubMed] [Google Scholar]
- Pogson BJ, Albrecht V. (2011) Genetic dissection of chloroplast biogenesis and development: an overview. Plant Physiol 155: 1545–1551 [DOI] [PMC free article] [PubMed] [Google Scholar]
- Pogson BJ, Woo NS, Förster B, Small ID. (2008) Plastid signalling to the nucleus and beyond. Trends Plant Sci 13: 602–609 [DOI] [PubMed] [Google Scholar]
- Porra RJ, Thompson WA, Kriedemann PE. (1989) Determination of accurate extinction coefficients and simultaneous equations for assaying chlorophylls a and b extracted with four different solvents: verification of the concentration of chlorophyll standards by atomic absorption spectroscopy. Biochim Biophys Acta 957: 384–394 [Google Scholar]
- Pruneda-Paz JL, Kay SA. (2010) An expanding universe of circadian networks in higher plants. Trends Plant Sci 15: 259–265 [DOI] [PMC free article] [PubMed] [Google Scholar]
- Reed JW, Nagatani A, Elich TD, Fagan M, Chory J. (1994) Phytochrome A and phytochrome B have overlapping but distinct functions in Arabidopsis development. Plant Physiol 104: 1139–1149 [DOI] [PMC free article] [PubMed] [Google Scholar]
- Rhee SY, Wood V, Dolinski K, Draghici S. (2008) Use and misuse of the Gene Ontology annotations. Nat Rev Genet 9: 509–515 [DOI] [PubMed] [Google Scholar]
- Robson F, Okamoto H, Patrick E, Harris SR, Wasternack C, Brearley C, Turner JG. (2010) Jasmonate and phytochrome A signaling in Arabidopsis wound and shade responses are integrated through JAZ1 stability. Plant Cell 22: 1143–1160 [DOI] [PMC free article] [PubMed] [Google Scholar]
- Rodríguez VM, Chételat A, Majcherczyk P, Farmer EE. (2010) Chloroplastic phosphoadenosine phosphosulfate metabolism regulates basal levels of the prohormone jasmonic acid in Arabidopsis leaves. Plant Physiol 152: 1335–1345 [DOI] [PMC free article] [PubMed] [Google Scholar]
- Ron D, Walter P. (2007) Signal integration in the endoplasmic reticulum unfolded protein response. Nat Rev Mol Cell Biol 8: 519–529 [DOI] [PubMed] [Google Scholar]
- Rook F, Hadingham SA, Li Y, Bevan MW. (2006) Sugar and ABA response pathways and the control of gene expression. Plant Cell Environ 29: 426–434 [DOI] [PubMed] [Google Scholar]
- Ruckle ME, DeMarco SM, Larkin RM. (2007) Plastid signals remodel light signaling networks and are essential for efficient chloroplast biogenesis in Arabidopsis. Plant Cell 19: 3944–3960 [DOI] [PMC free article] [PubMed] [Google Scholar]
- Ruckle ME, Larkin RM. (2009) Plastid signals that affect photomorphogenesis in Arabidopsis thaliana are dependent on GENOMES UNCOUPLED 1 and cryptochrome 1. New Phytol 182: 367–379 [DOI] [PubMed] [Google Scholar]
- Saibo NJ, Lourenço T, Oliveira MM. (2009) Transcription factors and regulation of photosynthetic and related metabolism under environmental stresses. Ann Bot (Lond) 103: 609–623 [DOI] [PMC free article] [PubMed] [Google Scholar]
- Saini G, Meskauskiene R, Pijacka W, Roszak P, Sjögren LL, Clarke AK, Straus M, Apel K. (2011) ‘happy on norflurazon’ (hon) mutations implicate perturbance of plastid homeostasis with activating stress acclimatization and changing nuclear gene expression in norflurazon-treated seedlings. Plant J 65: 690–702 [DOI] [PubMed] [Google Scholar]
- Sane AP, Stein B, Westhoff P. (2005) The nuclear gene HCF107 encodes a membrane-associated R-TPR (RNA tetratricopeptide repeat)-containing protein involved in expression of the plastidial psbH gene in Arabidopsis. Plant J 42: 720–730 [DOI] [PubMed] [Google Scholar]
- Schmid M, Uhlenhaut NH, Godard F, Demar M, Bressan R, Weigel D, Lohmann JU. (2003) Dissection of floral induction pathways using global expression analysis. Development 130: 6001–6012 [DOI] [PubMed] [Google Scholar]
- Sessions A, Burke E, Presting G, Aux G, McElver J, Patton D, Dietrich B, Ho P, Bacwaden J, Ko C, et al. (2002) A high-throughput Arabidopsis reverse genetics system. Plant Cell 14: 2985–2994 [DOI] [PMC free article] [PubMed] [Google Scholar]
- Shaikhali J, Heiber I, Seidel T, Ströher E, Hiltscher H, Birkmann S, Dietz KJ, Baier M. (2008) The redox-sensitive transcription factor Rap2.4a controls nuclear expression of 2-Cys peroxiredoxin A and other chloroplast antioxidant enzymes. BMC Plant Biol 8: 48. [DOI] [PMC free article] [PubMed] [Google Scholar]
- Shin J, Kim K, Kang H, Zulfugarov IS, Bae G, Lee CH, Lee D, Choi G. (2009) Phytochromes promote seedling light responses by inhibiting four negatively-acting phytochrome-interacting factors. Proc Natl Acad Sci USA 106: 7660–7665 [DOI] [PMC free article] [PubMed] [Google Scholar]
- Shultz RW, Lee TJ, Allen GC, Thompson WF, Hanley-Bowdoin L. (2009) Dynamic localization of the DNA replication proteins MCM5 and MCM7 in plants. Plant Physiol 150: 658–669 [DOI] [PMC free article] [PubMed] [Google Scholar]
- Smyth GK. (2004) Linear models and empirical Bayes methods for assessing differential expression in microarray experiments. Stat Appl Genet Mol Biol 3: Article 3 [DOI] [PubMed] [Google Scholar]
- Stephenson PG, Fankhauser C, Terry MJ. (2009) PIF3 is a repressor of chloroplast development. Proc Natl Acad Sci USA 106: 7654–7659 [DOI] [PMC free article] [PubMed] [Google Scholar]
- Stettler M, Eicke S, Mettler T, Messerli G, Hörtensteiner S, Zeeman SC. (2009) Blocking the metabolism of starch breakdown products in Arabidopsis leaves triggers chloroplast degradation. Mol Plant 2: 1233–1246 [DOI] [PMC free article] [PubMed] [Google Scholar]
- Stone SL, Hauksdóttir H, Troy A, Herschleb J, Kraft E, Callis J. (2005) Functional analysis of the RING-type ubiquitin ligase family of Arabidopsis. Plant Physiol 137: 13–30 [DOI] [PMC free article] [PubMed] [Google Scholar]
- Strand Å, Asami T, Alonso J, Ecker JR, Chory J. (2003) Chloroplast to nucleus communication triggered by accumulation of Mg-protoporphyrinIX. Nature 421: 79–83 [DOI] [PubMed] [Google Scholar]
- Sullivan JA, Gray JC. (1999) Plastid translation is required for the expression of nuclear photosynthesis genes in the dark and in roots of the pea lip1 mutant. Plant Cell 11: 901–910 [DOI] [PMC free article] [PubMed] [Google Scholar]
- Sun X, Feng P, Xu X, Guo H, Ma J, Chi W, Lin R, Lu C, Zhang L. (2011) A chloroplast envelope-bound PHD transcription factor mediates chloroplast signals to the nucleus. Nat Commun 2: 477. [DOI] [PubMed] [Google Scholar]
- Susek RE, Ausubel FM, Chory J. (1993) Signal transduction mutants of Arabidopsis uncouple nuclear CAB and RBCS gene expression from chloroplast development. Cell 74: 787–799 [DOI] [PubMed] [Google Scholar]
- Takahashi S, Murata N. (2008) How do environmental stresses accelerate photoinhibition? Trends Plant Sci 13: 178–182 [DOI] [PubMed] [Google Scholar]
- Takechi K, Sodmergen , Murata M, Motoyoshi F, Sakamoto W. (2000) The YELLOW VARIEGATED (VAR2) locus encodes a homologue of FtsH, an ATP-dependent protease in Arabidopsis. Plant Cell Physiol 41: 1334–1346 [DOI] [PubMed] [Google Scholar]
- Tepperman JM, Hudson ME, Khanna R, Zhu T, Chang SH, Wang X, Quail PH. (2004) Expression profiling of phyB mutant demonstrates substantial contribution of other phytochromes to red-light-regulated gene expression during seedling de-etiolation. Plant J 38: 725–739 [DOI] [PubMed] [Google Scholar]
- Tepperman JM, Hwang YS, Quail PH. (2006) phyA dominates in transduction of red-light signals to rapidly responding genes at the initiation of Arabidopsis seedling de-etiolation. Plant J 48: 728–742 [DOI] [PubMed] [Google Scholar]
- Tepperman JM, Zhu T, Chang HS, Wang X, Quail PH. (2001) Multiple transcription-factor genes are early targets of phytochrome A signaling. Proc Natl Acad Sci USA 98: 9437–9442 [DOI] [PMC free article] [PubMed] [Google Scholar]
- Terzaghi WB, Cashmore AR. (1995) Light-regulated transcription. Annu Rev Plant Physiol Plant Mol Biol 46: 445–474 [Google Scholar]
- Thimm O, Bläsing O, Gibon Y, Nagel A, Meyer S, Krüger P, Selbig J, Müller LA, Rhee SY, Stitt M. (2004) MAPMAN: a user-driven tool to display genomics data sets onto diagrams of metabolic pathways and other biological processes. Plant J 37: 914–939 [DOI] [PubMed] [Google Scholar]
- Thines B, Katsir L, Melotto M, Niu Y, Mandaokar A, Liu G, Nomura K, He SY, Howe GA, Browse J. (2007) JAZ repressor proteins are targets of the SCF(COI1) complex during jasmonate signalling. Nature 448: 661–665 [DOI] [PubMed] [Google Scholar]
- Thirkettle-Watts D, McCabe TC, Clifton R, Moore C, Finnegan PM, Day DA, Whelan J. (2003) Analysis of the alternative oxidase promoters from soybean. Plant Physiol 133: 1158–1169 [DOI] [PMC free article] [PubMed] [Google Scholar]
- To JPC, Reiter W-D, Gibson SI. (2003) Chloroplast biogenesis by Arabidopsis seedlings is impaired in the presence of exogenous glucose. Physiol Plant 118: 456–463 [Google Scholar]
- Tyagi AK, Gaur T. (2003) Light regulation of nuclear photosynthetic genes in higher plants. Crit Rev Plant Sci 22: 417–452 [Google Scholar]
- Van Aken O, Giraud E, Clifton R, Whelan J. (2009) Alternative oxidase: a target and regulator of stress responses. Physiol Plant 137: 354–361 [DOI] [PubMed] [Google Scholar]
- Vanlerberghe GC, Cvetkovska M, Wang J. (2009) Is the maintenance of homeostatic mitochondrial signaling during stress a physiological role for alternative oxidase? Physiol Plant 137: 392–406 [DOI] [PubMed] [Google Scholar]
- Voigt C, Oster U, Börnke F, Jahns P, Dietz KJ, Leister D, Kleine T. (2010) In-depth analysis of the distinctive effects of norflurazon implies that tetrapyrrole biosynthesis, organellar gene expression and ABA cooperate in the GUN-type of plastid signalling. Physiol Plant 138: 503–519 [DOI] [PubMed] [Google Scholar]
- Wang W, Yang D, Feldmann KA. (2011a) EFO1 and EFO2, encoding putative WD-domain proteins, have overlapping and distinct roles in the regulation of vegetative development and flowering of Arabidopsis. J Exp Bot 62: 1077–1088 [DOI] [PubMed] [Google Scholar]
- Wang Y, Wu JF, Nakamichi N, Sakakibara H, Nam HG, Wu SH. (2011b) LIGHT-REGULATED WD1 and PSEUDO-RESPONSE REGULATOR9 form a positive feedback regulatory loop in the Arabidopsis circadian clock. Plant Cell 23: 486–498 [DOI] [PMC free article] [PubMed] [Google Scholar]
- Waters MT, Langdale JA. (2009) The making of a chloroplast. EMBO J 28: 2861–2873 [DOI] [PMC free article] [PubMed] [Google Scholar]
- Welsch R, Maass D, Voegel T, Dellapenna D, Beyer P. (2007) Transcription factor RAP2.2 and its interacting partner SINAT2: stable elements in the carotenogenesis of Arabidopsis leaves. Plant Physiol 145: 1073–1085 [DOI] [PMC free article] [PubMed] [Google Scholar]
- Wise RR. (2007) The diversity of plastid form and function. In RR Wise, JK Hoober, eds, The Structure and Function of Plastids, Vol 23. Springer, Dordrecht, The Netherlands, pp 3–26 [Google Scholar]
- Woodson JD, Chory J. (2008) Coordination of gene expression between organellar and nuclear genomes. Nat Rev Genet 9: 383–395 [DOI] [PMC free article] [PubMed] [Google Scholar]
- Woodson JD, Perez-Ruiz JM, Chory J. (2011) Heme synthesis by plastid ferrochelatase I regulates nuclear gene expression in plants. Curr Biol 21: 897–903 [DOI] [PMC free article] [PubMed] [Google Scholar]
- Yadav V, Mallappa C, Gangappa SN, Bhatia S, Chattopadhyay S. (2005) A basic helix-loop-helix transcription factor in Arabidopsis, MYC2, acts as a repressor of blue light-mediated photomorphogenic growth. Plant Cell 17: 1953–1966 [DOI] [PMC free article] [PubMed] [Google Scholar]
- Yang KY, Kim YM, Lee S, Song PS, Soh MS. (2003) Overexpression of a mutant basic helix-loop-helix protein HFR1, HFR1-deltaN105, activates a branch pathway of light signaling in Arabidopsis. Plant Physiol 133: 1630–1642 [DOI] [PMC free article] [PubMed] [Google Scholar]
- Yu F, Fu A, Aluru M, Park S, Xu Y, Liu H, Liu X, Foudree A, Nambogga M, Rodermel S. (2007) Variegation mutants and mechanisms of chloroplast biogenesis. Plant Cell Environ 30: 350–365 [DOI] [PubMed] [Google Scholar]
- Zaltsman A, Ori N, Adam Z. (2005) Two types of FtsH protease subunits are required for chloroplast biogenesis and photosystem II repair in Arabidopsis. Plant Cell 17: 2782–2790 [DOI] [PMC free article] [PubMed] [Google Scholar]
- Zhai Q, Li CB, Zheng W, Wu X, Zhao J, Zhou G, Jiang H, Sun J, Lou Y, Li C. (2007) Phytochrome chromophore deficiency leads to overproduction of jasmonic acid and elevated expression of jasmonate-responsive genes in Arabidopsis. Plant Cell Physiol 48: 1061–1071 [DOI] [PubMed] [Google Scholar]
- Zhang DW, Xu F, Zhang ZW, Chen YE, Du JB, Jia SD, Yuan S, Lin HH. (2010) Effects of light on cyanide-resistant respiration and alternative oxidase function in Arabidopsis seedlings. Plant Cell Environ 33: 2121–2131 [DOI] [PubMed] [Google Scholar]
- Zhang ZW, Yuan S, Feng H, Xu F, Cheng J, Shang J, Zhang DW, Lin HH. (2011) Transient accumulation of Mg-protoporphyrin IX regulates expression of PhANGs: new evidence for the signaling role of tetrapyrroles in mature Arabidopsis plants. J Plant Physiol 168: 714–721 [DOI] [PubMed] [Google Scholar]
- Zhou YC, Dieterle M, Büche C, Kretsch T. (2002) The negatively acting factors EID1 and SPA1 have distinct functions in phytochrome A-specific light signaling. Plant Physiol 128: 1098–1108 [DOI] [PMC free article] [PubMed] [Google Scholar]
- Zhu Q, Zhang J, Gao X, Tong J, Xiao L, Li W, Zhang H. (2010) The Arabidopsis AP2/ERF transcription factor RAP2.6 participates in ABA, salt and osmotic stress responses. Gene 457: 1–12 [DOI] [PubMed] [Google Scholar]
- Zybailov B, Rutschow H, Friso G, Rudella A, Emanuelsson O, Sun Q, van Wijk KJ. (2008) Sorting signals, N-terminal modifications and abundance of the chloroplast proteome. PLoS One 3: e1994. [DOI] [PMC free article] [PubMed] [Google Scholar]
Associated Data
This section collects any data citations, data availability statements, or supplementary materials included in this article.