Abstract
Epigenetic processes govern prostate cancer (PCa) biology, as evidenced by the PCa cell’s dependence on the androgen receptor (AR), a prostate master transcription factor (TF). We generated 268 epigenomic datasets spanning two state transitions—from normal prostate epithelium to localized PCa to metastases—in specimens derived from human tissue. We discovered that reprogrammed AR sites in metastatic PCa are not created de novo; rather they are pre-populated by the TFs FOXA1 and HOXB13 in normal prostate epithelium. Reprogrammed regulatory elements commissioned in metastatic disease hijack latent developmental programs, accessing sites implicated in prostate organogenesis. Analysis of reactivated regulatory elements enabled identification and functional validation of novel metastasis-specific enhancers at HOXB13, FOXA1 and NKX3–1. Finally, we observed that prostate lineage-specific regulatory elements were strongly associated with PCa risk heritability and somatic mutation density. Examining prostate biology through an epigenomic lens is foundational for understanding the mechanisms underlying tumor progression.
Measuring genetic and transcriptomic differences across states (i.e., normal tissue, primary tumors and metastatic disease) has provided critical insights into the genes and pathways associated with cellular transformation and cancer progression1-3. Characterizing the epigenetic determinants driving gene expression programs between state transitions can similarly lead to new and complementary insights into cancer pathogenesis and progression4-9. Recently, tools and methods have matured, allowing a comprehensive inventory of epigenomic landscapes in human tissue.
Prostate cancer (PCa) is an exemplar of epigenetic disease. The vast majority of cases are driven by the androgen receptor (AR), a prostatic master transcription factor (TF). Upon androgen binding, AR enters the nucleus and binds to DNA at specific motifs10. Most of the AR binding sites (ARBS) are located in intronic and intergenic regions of the genome, where they function as enhancers—regulatory sites that are able to modulate the transcription of distal genes11,12. During malignant transformation, the AR cistrome—the universe of AR binding sites—undergoes substantial reprogramming, leading to recurrently gained and lost AR sites6,13. The epigenetic landscape of PCa can also be influenced by structural variants such as the TMPRSS2-ERG translocation14 or by AR splice variants such as AR-V715,16.
To date, a paucity of cell line models has impeded our ability to describe PCa epigenetic dynamics across each phase in the natural history of the disease. Recently, we have established the ability to generate high-quality epigenomic data from clinical specimens, expanding our capacity to interrogate the PCa epigenome across state transitions6,13,17.
In this study, we annotated and characterized the prostate epigenome across clinical states in cohorts derived from human tissue. The resulting dataset illuminates several concepts regarding PCa biology. First, we demonstrate that reprogrammed AR sites do not arise de novo. Second, the PCa cell—specifically in the transition to metastatic disease—reactivates latent regulatory elements active during fetal prostate organogenesis. Next, we show that integrated epigenetic and genetic analysis of reprogrammed regulatory loci in PCa metastasis enables discovery of functionally relevant state-specific enhancers. Finally, annotation of the PCa epigenome revealed novel associations between epigenetic states and genetic variation. The comprehensive results of our epigenomic analysis provide a foundation for further investigation into the mechanisms underlying tumorigenesis and cancer progression.
RESULTS
The AR cistrome and H3K27ac are systematically reprogrammed across clinical states.
We generated and analyzed 268 epigenomes in specimens derived from human tissue. The dataset included histologically normal human prostate epithelial tissue, primary prostate tumor tissue derived from human radical prostatectomies (RPs), LuCaP xenografts (PDXs) derived from human AR-positive castration-resistant metastatic PCa (mCRPC) samples18, fresh-frozen mCRPC biopsy samples, fetal tissue specimens from the Roadmap Epigenetics Project19, and established cell lines derived from human urogenital sinus (UGS)20—the fetal structure that gives rise to the prostate (Table 1, with additional details on statistical parameters for all ChIP-seq data in Supplementary Table 1). Immunohistochemistry was performed for the three TFs assessed in the study—AR, FOXA1 and HOXB13—in paired normal prostate/primary tumors from eight RP samples, confirming high expression in both malignant and normal prostate epithelium (Supplementary Table 2).
Table 1 |.
Specimens included in the study by tissue and epigenetic mark
| AR | FOXA1 | HOXB13 | H3K27ac | H3K4me2 | H3K4me3 | H3K27me3 | ATAC | All marks | |
|---|---|---|---|---|---|---|---|---|---|
| Total | 59 | 42 | 42 | 86 | 8 | 10 | 11 | 10 | 268 |
| Normal prostate epithelium | 13* | 14 | 14 | 37+ | 4 | 3 | 4 | 4 | 93 |
| Primary prostate tumor | 31* | 13 | 13 | 32 | 4 | 7 | 7 | 6 | 113 |
| mCRPC† | 15 | 15 | 15 | 17 | 0 | 0 | 0 | 0 | 62 |
| Median no. peaks (range) | 20,619 (1,577–73,723) | 37,691 (3,174 – 99,041) | 47,338 (1,709 – 90,075) | 34,609 (2,337 – 127,042) | 69,558 (41,095 – 83,869) | 33,215 (28,952 – 38,447) | 254,148 (112,809 – 316,413) | 48,139 (25,324 – 60,232) |
Includes seven normal prostate and 13 primary tumor AR ChIP libraries published previously6.
Includes H3K27ac ChIP-seq performed in a specimen derived from human fetal urogenital sinus20.
ChIP-seq experiments performed using PDXs derived from human mCRPC with the exception of two H3K27ac ChIP-seq specimens derived from patient mCRPC liver biopsies.
We evaluated AR binding in the transition from normal prostate epithelium to localized hormone-sensitive PCa to metastatic castration-resistant disease. Comparison of the normal prostate, localized hormone-sensitive tumor and mCRPC cistromes demonstrated distinct reprogramming of the AR cistrome (Fig. 1a). Principal components analysis across all three of the tissue states revealed that AR binding patterns were more correlated within a state than between states (Fig. 1a). Using a stringent threshold (Methods), we identified 17,655 ARBS consistently enriched in the transition from localized PCa to mCRPC (met-ARBS; listed in Supplementary Table 3).
Fig. 1 |. The AR cistrome and genome-wide H3K27ac are systematically reprogrammed during prostate cancer progression and AR relocates to epigenetically pre-marked, “sentinel” sites.
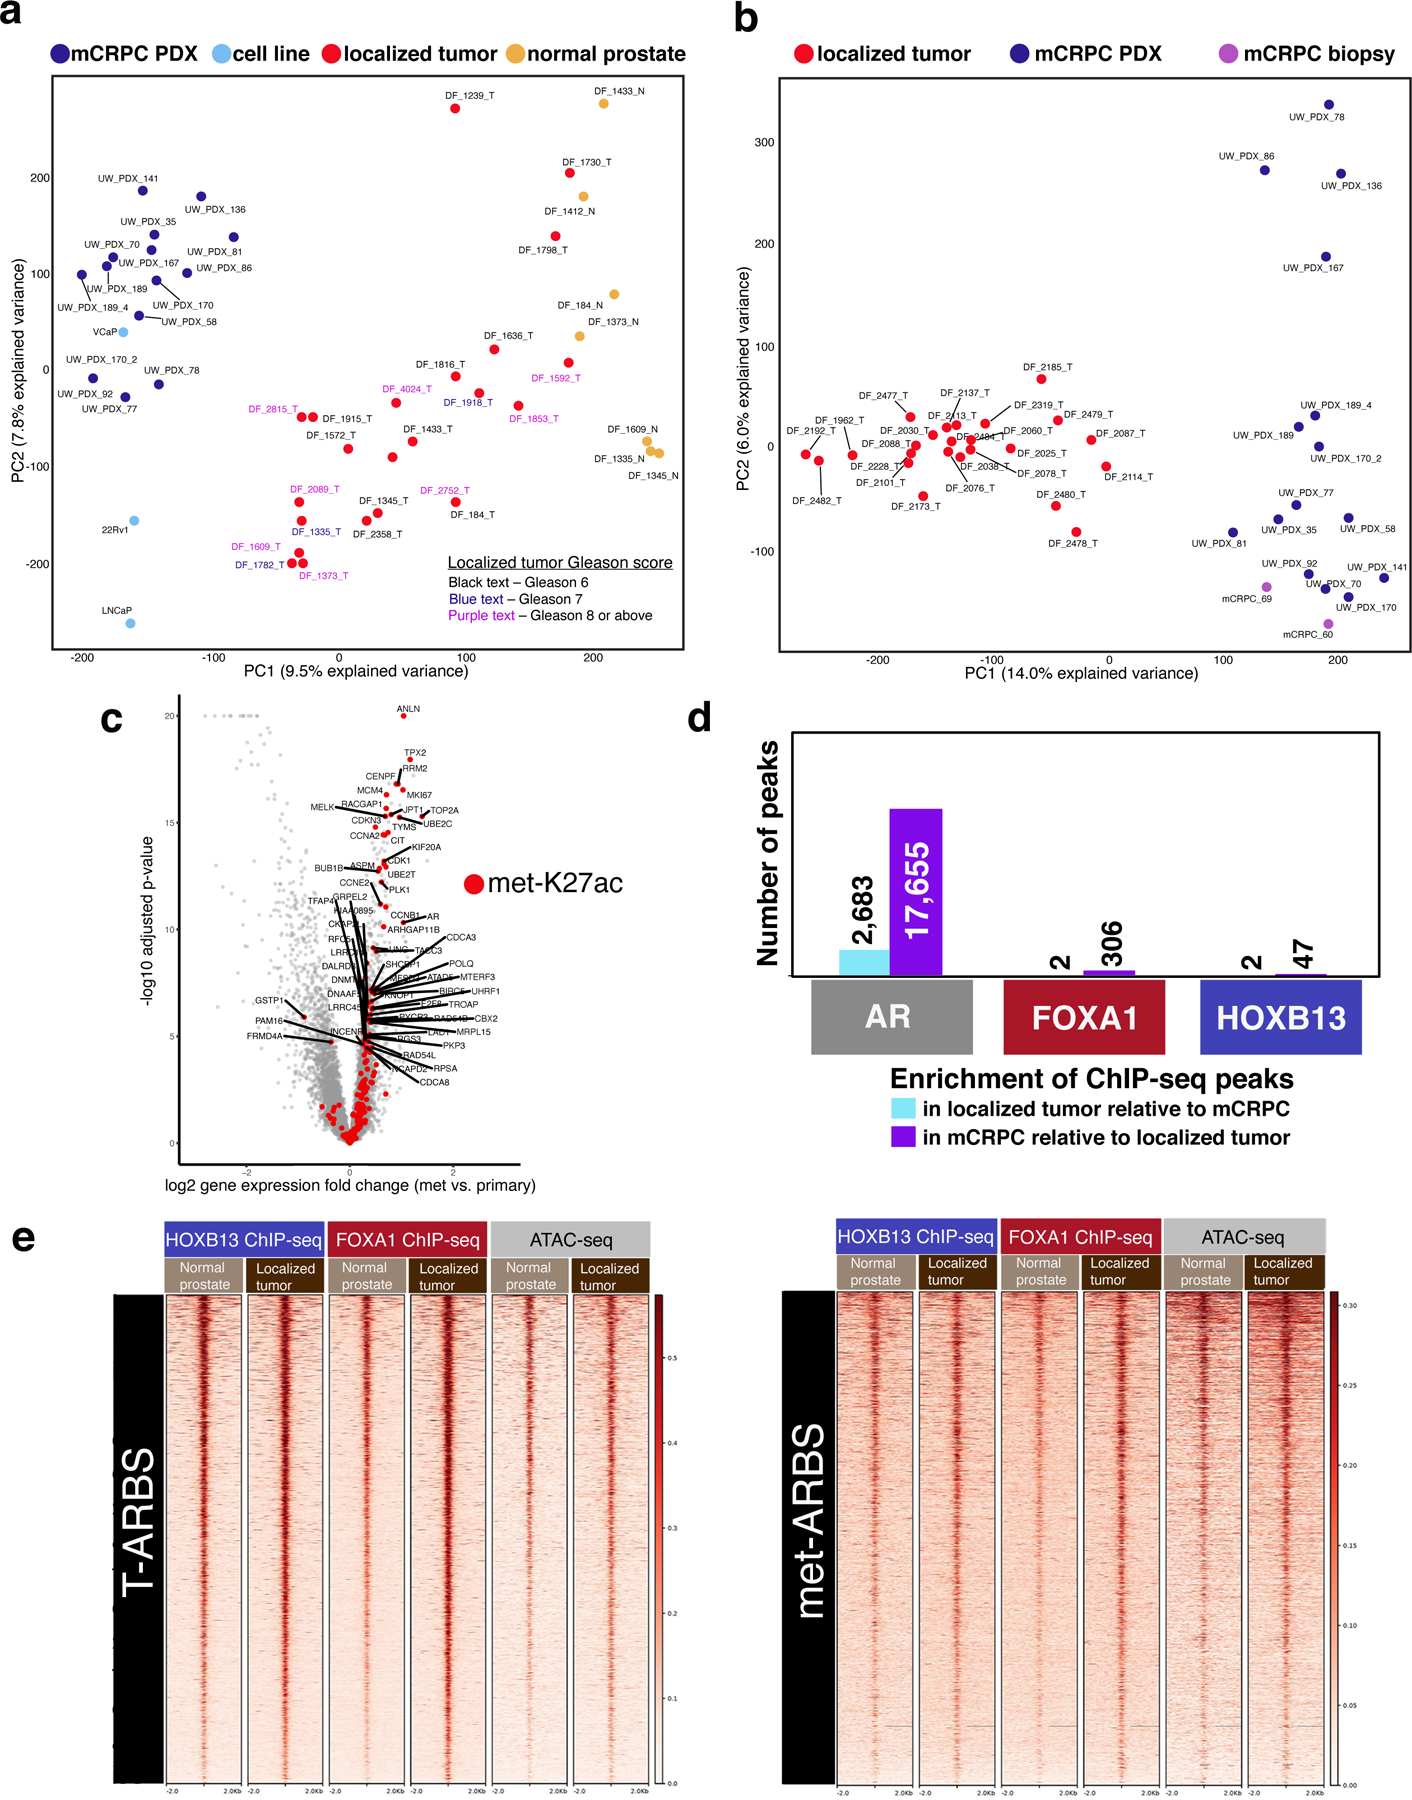
a, Principal component analysis (PCA) reveals distinct AR binding patterns across prostate states. Each dot represents the genome-wide AR cistrome in an individual specimen (seven normal prostate epithelium, 23 primary PCa tumors, 15 PDX tumors derived from patient mCRPC, three PCa cell lines derived from metastatic tissue). b, PCA reveals distinct H3K27ac binding patterns between primary tumors and mCRPC. Each dot represents genome-wide H3K27ac signal in an individual subject (24 primary PCa tumors, 15 PDX tumors derived from patient mCRPC, two metastasis specimens biopsied directly from patients with mCRPC). c, Genes whose expression is upregulated in metastasis compared to primary tumor21 are enriched for met-K27ac peaks (P < 0.00001). Each dot represents a gene. Red dots are genes with a met-K27ac in the TSS. d, The number of re-programmed AR sites in the transition from primary tumor to mCRPC is substantially greater than the number of re-programmed FOXA1 or HOXB13 sites (P < 0.00001). e, Heat map indicating transcription factor and ATAC-seq signal intensity in normal prostate epithelium and primary prostate tumor. At left, the 9,179 AR T-ARBS. At right, the 17,655 met-ARBS. Each horizontal line represents a 4-kb locus. Shade of red reflects average binding intensity at that site across all subjects in the cohort.
We similarly performed H3K27ac ChIP-seq—a mark of active enhancers and promoters—in normal prostate, primary prostate tumor, mCRPC PDX, and fresh-frozen mCRPC patient biopsy specimens (Table 1 and Supplementary Table 1). We identified 16,047 H3K27ac sites enriched in mCRPC compared to hormone-sensitive localized tumor (met-K27ac; Fig. 1b, Supplementary Figs. 1 and 2, and Supplementary Table 3). Unsupervised principal components analysis of primary tumor versus mCRPC showed clear separation between clinical subtypes (Fig. 1b). Importantly, genome-wide H3K27ac in biopsies taken directly from patient mCRPC tumors clustered with the mCRPC PDXs (Fig. 1b and Supplementary Fig. 2). The majority of met-K27ac peaks overlapped with the met-ARBS peaks (64.9% peak overlap; P < 2.2 × 10⁻¹⁶; Extended Data Fig. 1).
To evaluate how well these differential regulatory sites correlate with transcriptional differences, we accessed a publicly available transcriptomic dataset of metastatic prostate versus localized prostate tumor tissue21. We rank-ordered differentially expressed genes and then projected onto this distribution the set of transcriptional start sites (TSSs) that contain a met-K27ac site (Methods). Transcripts overexpressed in metastases were highly enriched for met-K27ac TSS (P < 0.00001; Fig. 1c). Similarly, genes down-regulated in metastatic PCa were enriched for H3K27ac sites specific to primary tumors compared to mCRPC (Extended Data Fig. 2).
AR is reprogrammed to epigenetically pre-marked ‘sentinel’ sites during transformation and progression.
To test whether other prostate relevant TFs also underwent reprogramming, we performed FOXA1 and HOXB13 ChIP-seq in 14 normal prostate, 13 localized PCa and 15 mCRPC PDX specimens. In stark contrast to AR, the FOXA1 and HOXB13 cistromes demonstrated dramatically less reprogramming during disease progression (Fig. 1d and Supplementary Fig. 3). Notably, only 306 FOXA1 and 47 HOXB13 peaks were enriched in mCRPC relative to primary disease compared with 17,655 AR sites (Fig. 1d).
We next focused on the sets of AR sites reprogrammed from normal to primary tumor (n = 9,179, as previously described6) and met-ARBS (n = 17,655). Specifically, we evaluated FOXA1 and HOXB13 binding, ATAC-seq, and DNA methylation22 at these sites. Strikingly, in both normal and primary tumor specimens, FOXA1 and HOXB13 are already present at these ‘sentinel’ sites where AR is destined to bind (Fig. 1e and Extended Data Fig. 3). Chromatin was accessible and the DNA was relatively hypomethylated at these loci as well (Extended Data Fig. 3). The data demonstrate that reprogrammed AR sites during transformation and metastasis are not formed de novo, but rather that AR binds to pre-marked, sentinel sites.
Regulatory elements commissioned during prostate cancer progression reactivate prostate-specific fetal tissue developmental programs.
We characterized the TF DNA binding motifs present within met-ARBS, comparing the gained sites to shared AR sites (Methods, Supplementary Tables 4 and 5). The most significantly enriched motif associated with met-ARBS was ZEB1 (Zinc Finger E-Box Binding Homeobox 1), a well-described TF involved in mediating epithelial to mesenchymal transition (EMT) in PCa (P = 1 × 10−155, Supplementary Tables 4 and 5)23,24.
To ascribe putative biological functions to the met-ARBS, the 17,655 met-ARBS were subjected to the Genomic Regions Enrichment of Annotations Tool (GREAT)25. Strikingly, the gene ontology (GO) biological processes included “somatic sex determination” (P = 1.4 × 10−49), “activation of prostate induction” (P = 2.5 × 10−45) and “epithelial cell differentiation involved in prostate gland development” (P = 5.0 × 10⁻²⁰) (Extended Data Fig. 4a,b) suggesting that the met-ARBS cistrome is reactivating prostate developmental programs. By contrast, analysis of the 2,683 AR binding sites with decreased intensity in mCRPC contained no terms involving prostate development or sex determination, with the top terms associated with extracellular matrix assembly (Extended Data Fig. 4c). For met-ARBS, the “WNT Signaling Pathway”, an important pathway in prostate development26-30, was the most significant association for the MSigDB output from GREAT (P = 3.1 × 10⁻¹⁷) (Extended Data Fig. 4c). Similarly, GREAT analysis of met-K27ac revealed multiple GO terms associated with prostate gland organogenesis, such as “epithelial cell maturation involved in prostate gland development” (P = 4.9 × 10−38) (Fig. 2a).
Fig. 2 |. Regulatory sites activated in mCRPC coincide with prostate developmental programs.
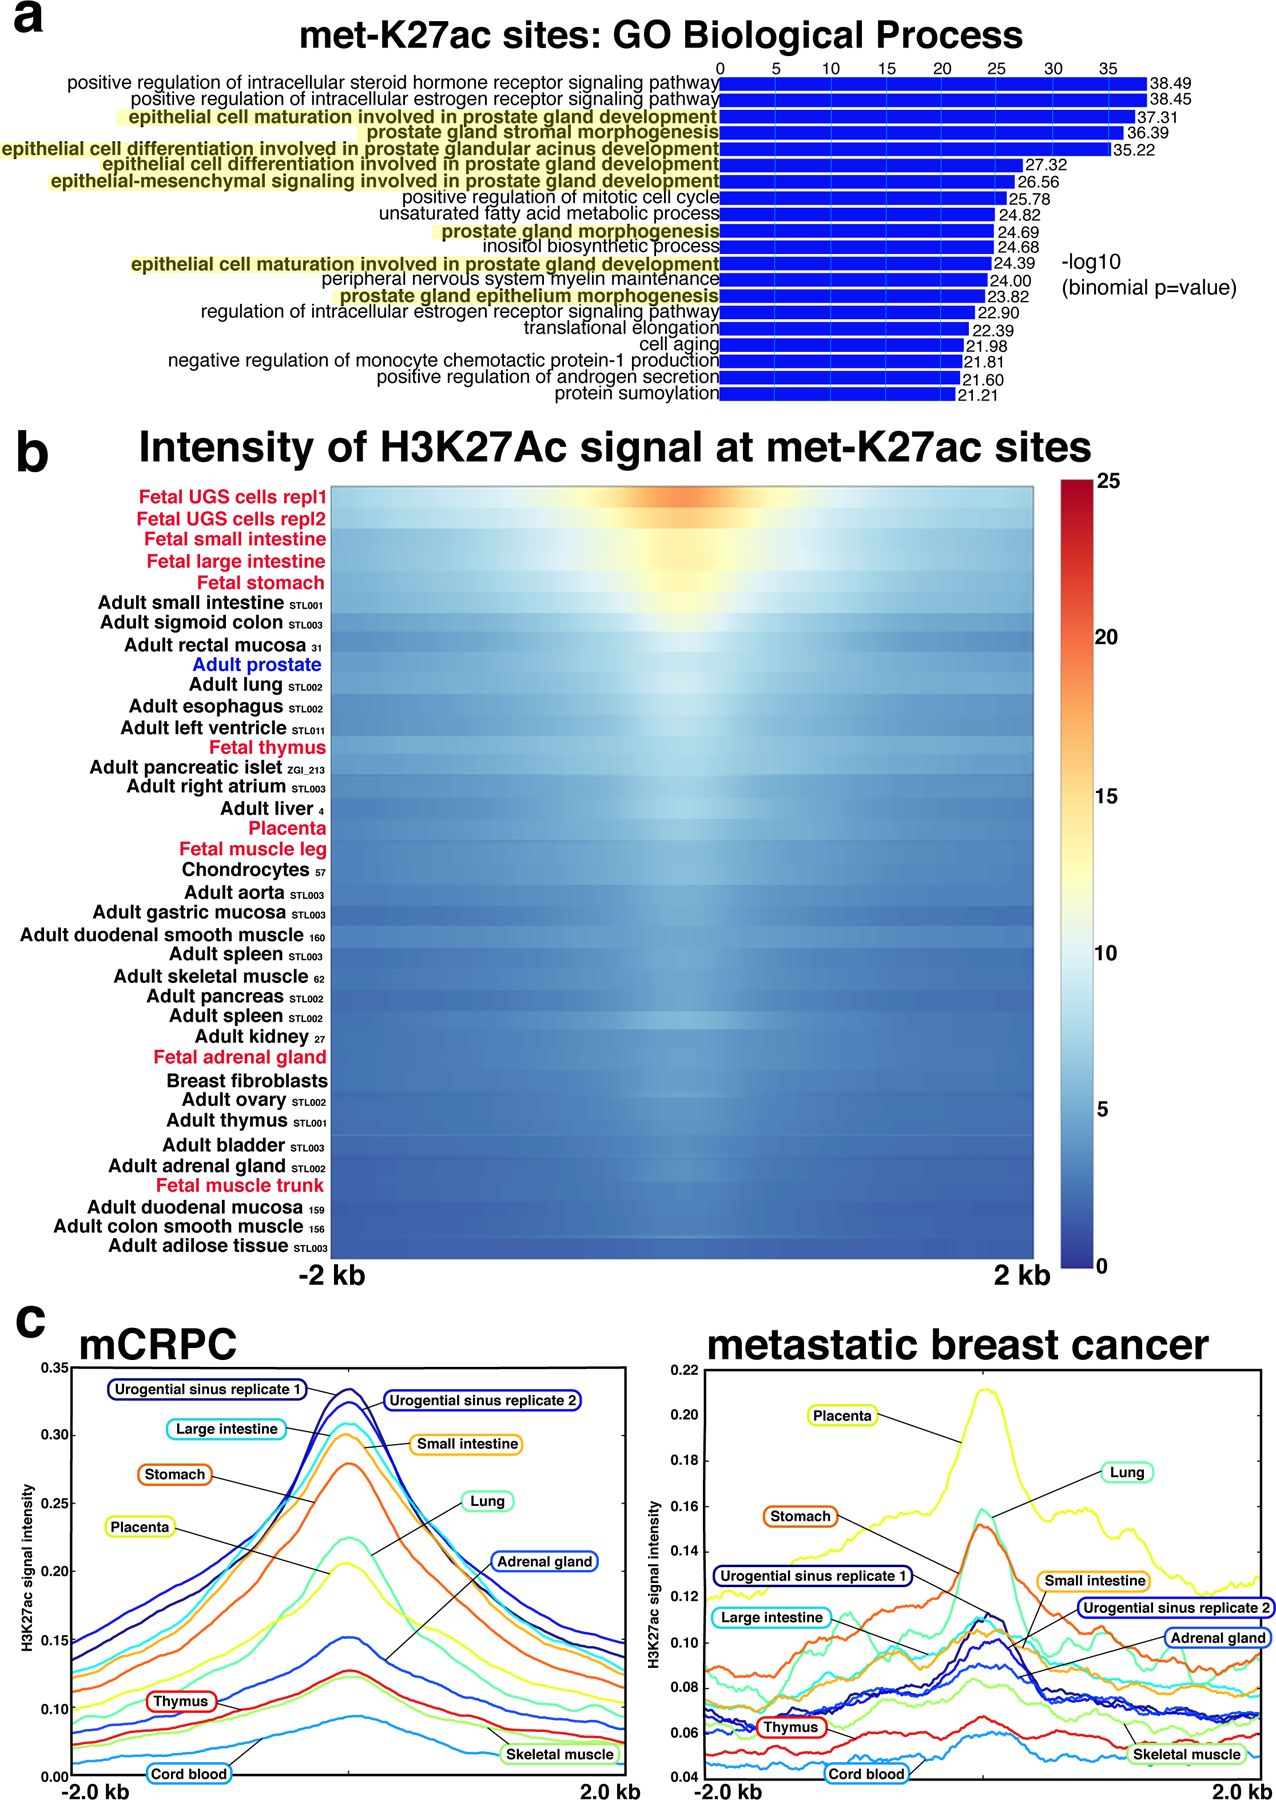
a, GREAT analysis characterizing the Gene Ontology biological terms most significantly associated with genes proximal to the 16,047 met-K27ac sites. Terms associated with genitourinary development are highlighted in yellow. b, Across 37 human adult and fetal cell types, met-K27ac is most strongly associated with fetal urogenital sinus. Cell type listed at left (adult tissues are followed by Roadmap Epigenomics Project identification codes). Urogenital sinus sample was performed in replicate. Heat map indicates H3K27ac binding intensity met-K27ac sites across a 4-kb interval. c, met-K27ac is associated with a set of fetal programs distinct from the fetal programs associated with the metastatic breast cancer-specific genome-wide H3K27ac signal. Each curve represents H3K27ac intensity in human fetal cells across the 16,047 met-K27ac sites (left) and the metastatic breast cancer-specific H3K27Ac sites (right).
Next, we investigated similarities between the prostate metastatic epigenome and a large panel of fetal and adult epigenomes. To this end, we assessed the correlation between the set of met-K27ac sites and a series of K27ac epigenomes generated in fetal (n = 10 tissue types)19,20 and adult tissue types (n = 27)19 (Methods). The tissues that were most similar to the met-K27ac sites were fetal urogenital sinus (UGS, represented by established cell lines) followed by the fetal tissues most developmentally related to the prostate (Fig. 2b and Extended Data Fig. 5)31. Adult tissues were not correlated with met-K27ac sites. These data indicate that the prostate metastatic epigenomic program is active during development, becomes quiescent in normal prostate and localized prostate tumors, and is reactivated in advanced disease. Moreover, the results show that this epigenomic program is highly specific to the fetal prostate cell state and to mCRPC.
To determine whether the met-K27ac sites were specific to mCRPC and not a generic metastatic program activated in other tumor types, we accessed published H3K27ac cistromic data available from primary and metastatic breast cancer specimens32. We identified 1,695 H3K27ac sites enriched in breast metastases compared to primary breast tumors. As with mCRPC, we compared the breast metastasis-enriched H3K27ac sites with genome-wide H3K27ac from fetal tissues. Interestingly and unlike mCRPC, genome-wide H3K27ac in metastatic breast cancer had the strongest correlation with placenta (Fig. 2c), consistent with a developmental pathway that is distinct from prostate31,33.
To evaluate the embryonic transcriptional program at met-K27ac sites, we interrogated gene expression data derived from embryonic and post-natal mouse prostates34. Genes with met-K27ac sites at TSSs in mCRPC showed significantly higher expression in embryonic mouse prostate relative to post-natal prostate (P < 2.2 × 10⁻¹⁶; Extended Data Fig. 6), consistent with the notion that met-K27ac sites are reactivating embryonic transcriptional programs.
Gain of H3K27 acetylation coinciding with somatic DNA amplification identifies metastasis-specific regulatory elements.
Recently, we35,36 and others37 discovered somatic activation of a distal, functionally relevant enhancer that regulates the AR gene. The enhancer region contains recurrent tandem duplications in a whole-genome sequencing (WGS) mCRPC dataset and an H3K27ac signal that was substantially stronger in mCRPC compared with primary PCa. To similarly discover other somatically acquired enhancers in advanced PCa, we first sought to reduce the number of candidates from the aggregation of 16,047 met-K27ac sites in an unbiased fashion. We intersected the mCRPC-specific H3K27ac loci with regions containing recurrent structural variants in the WGS dataset from Viswanathan et al.36, reasoning that recurrent somatic copy number alterations provide a biologically accepted framework for regions under selective pressure. We rank ordered the genomic segments by frequency of overlap between structural variation and met-K27ac sites (Methods). Among the top ranked regions were genomic segments containing the genes AR, MYC, FOXA1, HOXB13, and NKX3–1 (Fig. 3a and Supplementary Table 6).
Fig. 3 |. Functionally relevant mCRPC enhancers are identified by integrating genetic and epigenetic datasets.
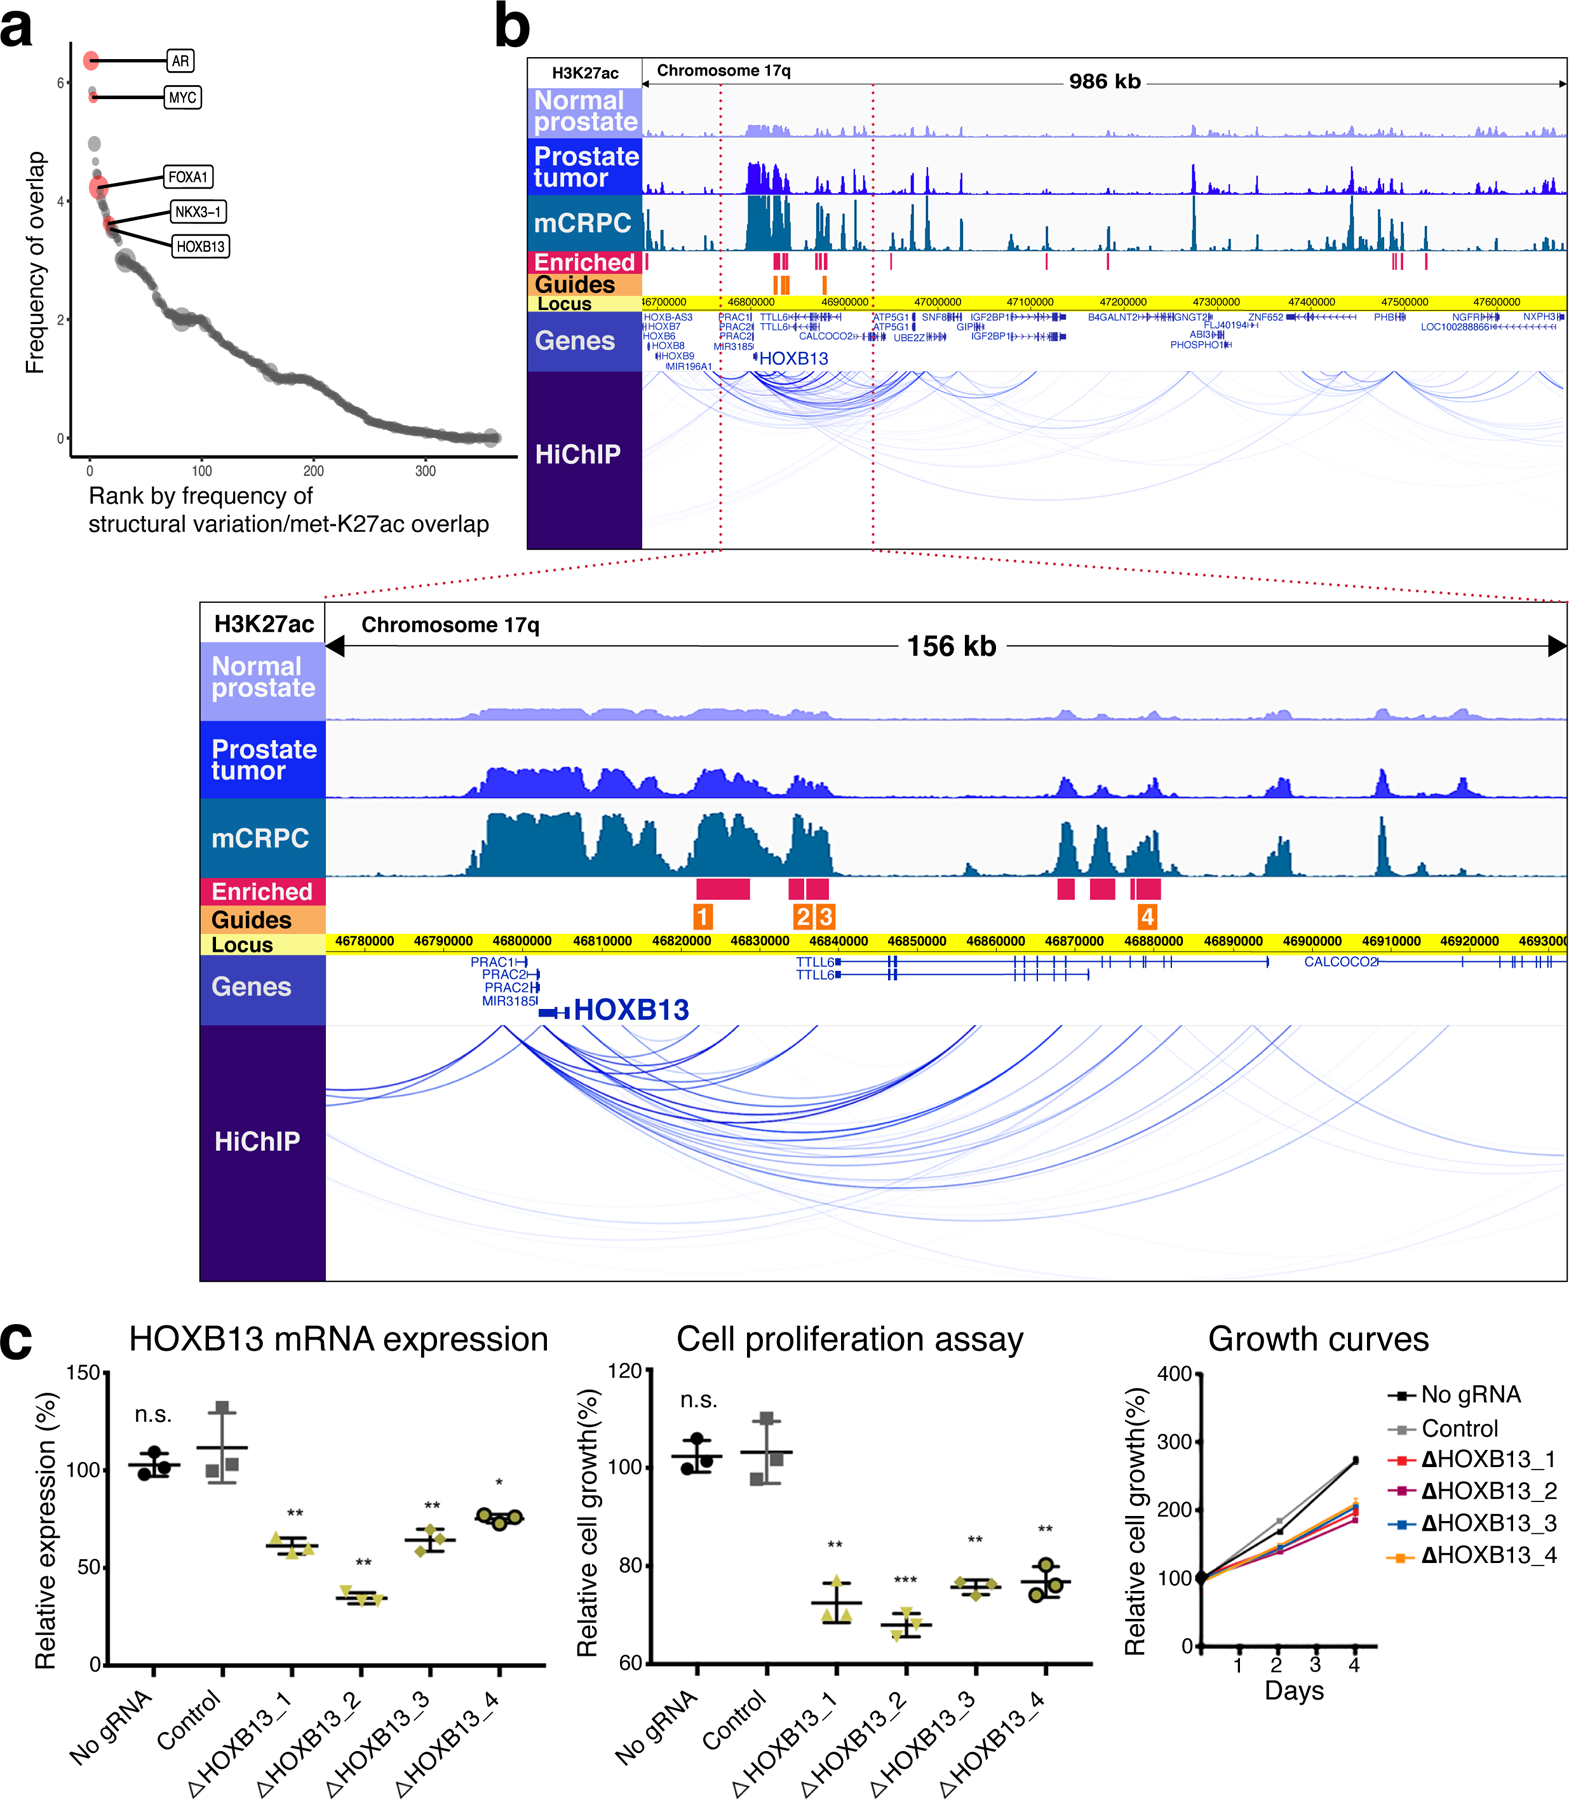
a, Regions of overlap between structural variation in prostate tumors and mCRPC-enriched H3K27ac sites. The size of each circular data point reflects density of mCRPC-enriched H3K27ac signal within the region. Genes of interest falling within specific overlap sites are shown. b, At top, H3K27ac tracks in 986-kb region identified in a containing HOXB13. Intensity of ChIP-seq signal was averaged across all DFCI normal prostate, primary prostate tumor and mCRPC specimens, respectively. HiChIP track depicts chromatin looping in the LNCaP cell line. Blue bars show H3K27ac sites meeting criteria for mCRPC enrichment (met-K27ac). Orange bars depict the locus against which guide RNAs (gRNAs) were designed (Methods). Below, magnification of a 156-kb region (bound by red-dotted lines in the upper picture) where met-K27ac and HiChIP signals were strongest. c, Functional interrogation of candidate metastasis-specific enhancers. Left, LNCaP HOXB13 expression in controls (no gRNA and gRNA targeting unrelated gene HPRT1) and after transduction with each gRNA depicted in b. Middle and right, LNCaP cell proliferation over the course of four days. Each shape represents an independent experiment, center line indicates mean, error bars indicate ± s.d. Using Student’s t-test, two-sided: n.s., not significant; *P < 0.05; **P < 0.01, ***P < 0.001.
The analysis recapitulated the discovery of the mCRPC-specific AR enhancer described previously35. To annotate new candidates and to demonstrate the potential in overlapping genetic/epigenetic datasets, we focused on the segments arising from the study containing genes that encode the well known PCa-related TFs HOXB13, FOXA1, and NKX3–138-44 (Fig. 3, Extended Data Figs. 7 and 8, and Supplementary Fig. 4). The genetic regions tended to be large and contained multiple genes. The HOXB13 segment, for example, was 986 kb and contained over 20 genes. To identify enhancer-promoter interactions, we performed H3K27ac and H3K4me3 HiChIP in LNCaP cells (Methods). Based on looping interaction, co-localization with met-K27ac sites, and recurrence of H3K27ac signal across a majority of specimens, we prioritized specific candidate enhancers for functional evaluation (Fig. 3 and Extended Data Figs. 7 and 8).
Candidate enhancers were functionally evaluated using CRISPR interference (CRISPRi). Site-specific suppression of each putative regulatory element resulted in significantly decreased expression of NKX3–1, HOXB13 and FOXA1 (Fig. 3 and Extended Data Figs. 7 and 8). Furthermore, CRISPRi-targeting of each individual enhancer for FOXA1 and HOXB13 decreased LNCaP cell proliferation (Fig. 3, Extended Data Fig. 7 and Methods).
Prostate lineage-specific enhancers and promoters are enriched for germline and somatic genetic variation.
Studies over the past decade have characterized the germline and somatic genetic variation associated with PCa45-47. We sought to determine how the epigenetic landscape of prostate tumors reflects and informs genetic variation. We applied chromHMM, an unsupervised approach that models combinations of epigenetic marks, to ascribe chromatin “states” for each segment of the prostate tumor genome48 (Methods). Using eight epigenetic features (four histone modifications, genome-wide binding of three TFs, and chromatin accessibility), the analysis identified ten epigenetic states with distinct signatures across the primary prostate tumor genome (Fig. 4a). Inclusion of AR, FOXA1 and HOXB13 ChIP-seq data in the chromHMM enabled a refined stratification of regulatory elements that we termed ‘prostate lineage-specific enhancers and promoters’ (Fig. 4a and Supplementary Fig. 5). Prostate lineage-specific enhancers and promoters were significantly more conserved than non-lineage elements, with prostate-specific promoters being the most highly conserved state (Methods, Supplementary Fig. 6).
Fig. 4 |. Genetic variation in prostate cancer is enriched in prostate lineage specific chromatin states.
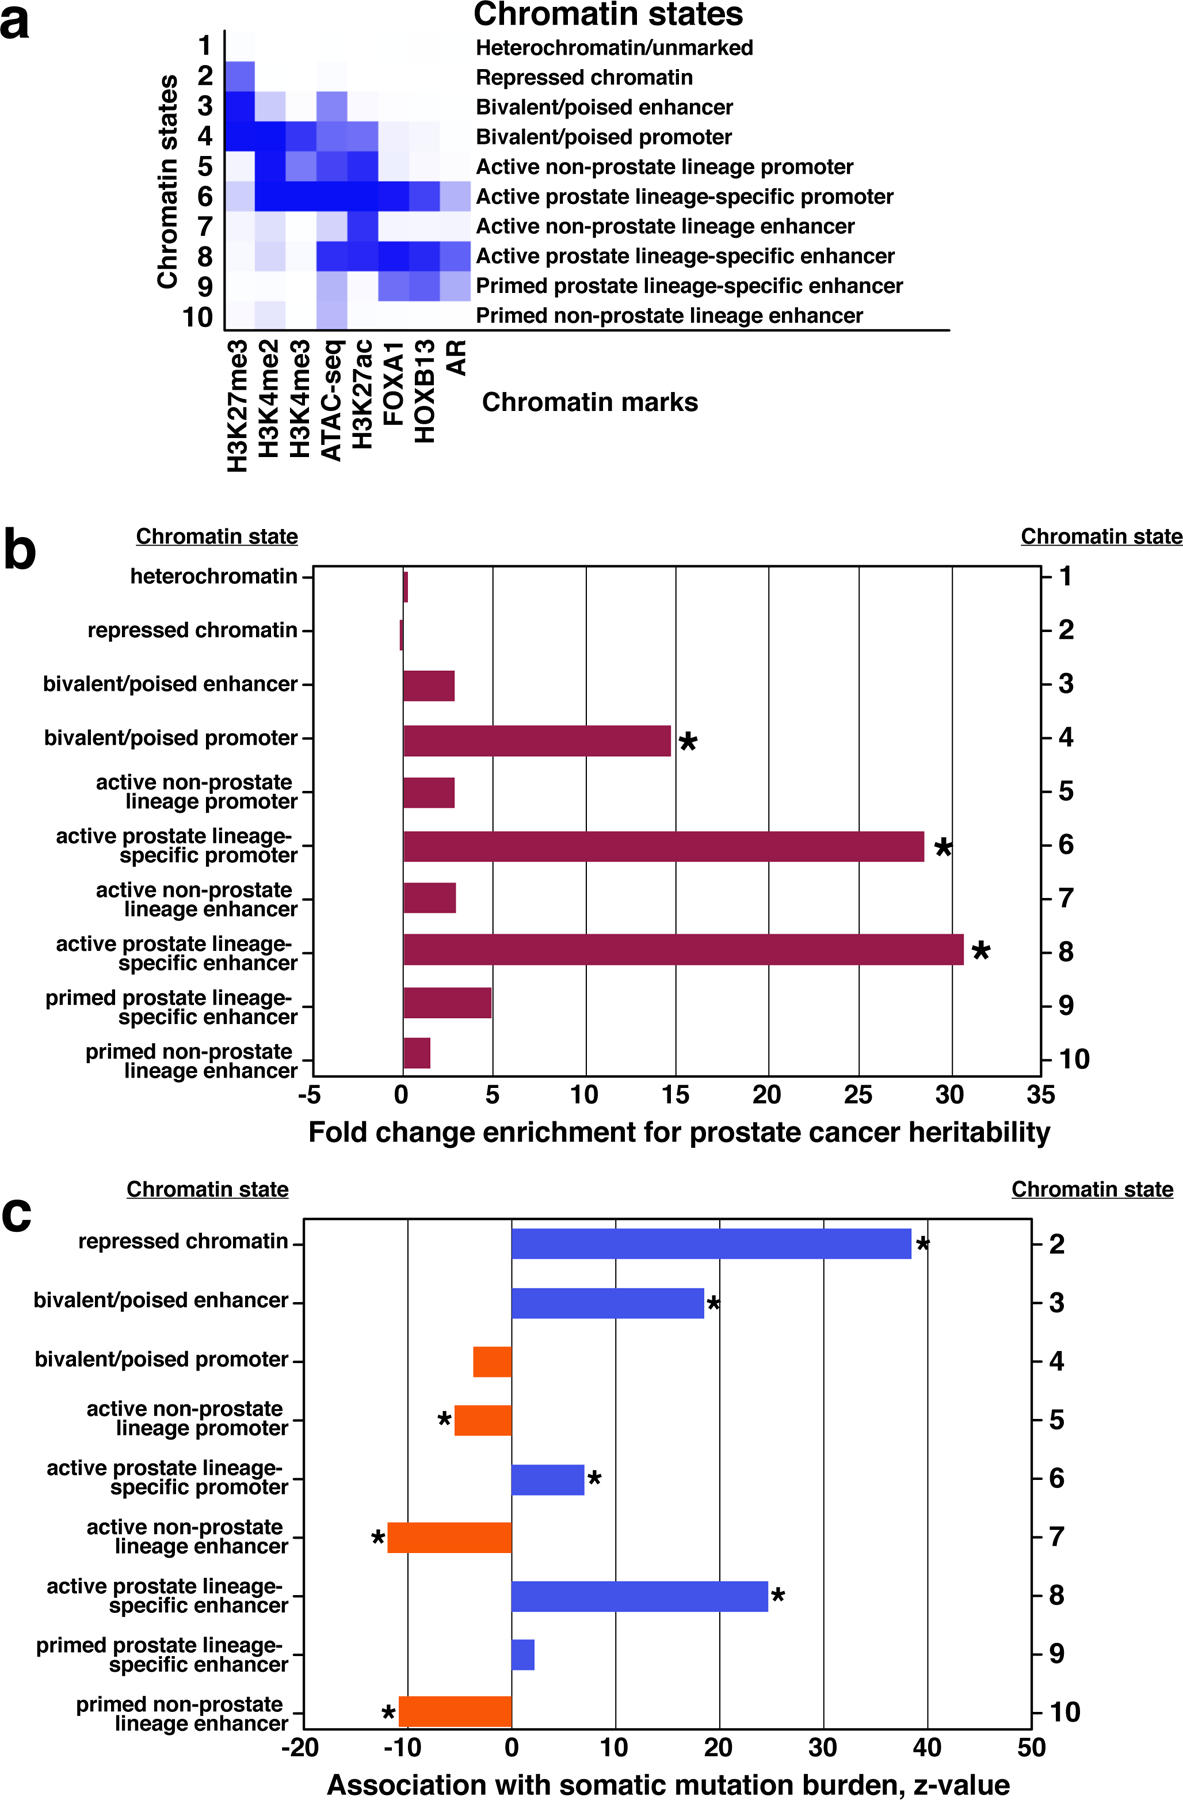
a, An unsupervised analysis synthesized eight epigenetic marks from four primary prostate tumor specimens (see Methods) and identified ten chromatin states, listed at right. Blue shading depicts average intensity of a particular mark across each chromatin state. b, PCa risk heritability attributable to the ten PCa epigenetic states. Fold enrichment is determined by computing the fraction of heritability accounted for by SNPs within each state, divided by the fraction of SNPs contained within the state genome-wide (Methods). *P < 0.001. c, Somatic mutation density within the ten PCa epigenetic states relative to chromatin state 1 (“Heterochromatin/unmarked”) using 210 PCa whole genome sequences (Methods). *P < 1 × 10⁻⁵.
We leveraged large-scale PCa genome-wide association study (GWAS) data45 to estimate the fraction of PCa risk heritability49 attributable to the ten epigenetic states defined by the primary prostate tumor chromHMM analysis. GWAS heritability was significantly enriched in the epigenetic states marking active prostate specific enhancers (30.6-fold enrichment, P = 8.1 × 10⁻⁵) and active prostate specific promoters (28.5-fold enrichment, P = 8.0 × 10⁻⁴), with these two states together explaining 48.1% of the overall heritability while containing only 1.6% of SNPs (Fig. 4b and Extended Data Fig. 9). This enrichment in heritability was not driven by a specific locus and was observable across the full distribution of test statistics (Extended Data Fig. 9 and Supplementary Table 7). Prostate specific states were not significantly enriched for breast cancer heritability, reflecting tissue specificity of these epigenetic state enrichments (Extended Data Fig. 9).
Chromatin state was a significant predictor of somatic mutational burden (Fig. 4c and Extended Data Fig. 10). The non-prostate lineage specific active enhancer annotation (state 7, defined by H3K27ac) predicted a decreased mutational burden (z-score −16.6; P < 2 × 10⁻¹⁶), consistent with a recent report of mutational depletion at active enhancers4. In contrast, the prostate lineage-specific enhancer annotation (state 8) predicted an increased mutational burden (z-score 22.3; P < 2 × 10⁻¹⁶). Increased mutational burden at FOXA1 and AR sites is consistent with recent findings50-52. We additionally observe that mutational density was greater at AR and FOXA1 co-binding sites than at sites containing only one of these factors (P < 2.2 × 10⁻¹⁶, Pearson’s chi-square test; Extended Data Fig. 10c). Mutational density was also enriched at met-ARBS (Extended Data Fig. 10d).
DISCUSSION
In normal cellular differentiation, as envisioned by C.H. Waddington, the contours of a cell’s epigenetic landscape determine the options available in establishing its fate53,54. Cancer has been described as being a de-differentiated counterpart of normal cellular derivation. A long-held hypothesis is that tumor cells travel along alternative developmental paths to acquire traits that are important in embryogenesis, such as motility and invasion55-57. In the context of Waddington’s landscape and tumor de-differentiation, three different mechanisms can be conceived by which tumors move away from their stable adult identity: (i) they re-activate the developmental paths their particular lineage formerly traversed; (ii) they co-opt paths used in the development of other lineages; or (iii) they re-shape the landscape to create their own novel pathways.
Our data indicate that PCa adopts the first of these possible mechanisms. We observed that AR is reprogrammed specifically to sentinel sites and that the mCRPC cell appears to commandeer the regulatory programs of its embryonic ancestors. Consistent with these findings, it was recently shown in a genetically engineered mouse model of pancreatic cancer that reprogrammed metastatic enhancers activated a transcriptional program of embryonic foregut endoderm7. Previous studies of transcriptional patterns in embryonic and mature mouse prostates suggested that the prostate evokes embryonic prostate programs in malignancy34,58.
Stergachis et al. addressed the mechanisms of tumor de-differentiation by evaluating DNaseI hypersensitivity sites (DHS) across state transitions59. In contrast to the present analysis, Stergachis et al. concluded that the most likely mechanism for loss of normal adult differentiation in cancer cells involved co-opting the paths of other normal adult or fetal cell lineages. The present study differed from Stergachis et al. in that the prior study relied predominantly on cell lines of multiple tumor types whereas we investigated a larger set of clinical specimens related to a single tumor type. In addition, technical aspects such as peak calling parameters differed between the studies.
Our findings are consistent with previously published studies showing that the transcriptional and epigenetic states of a tumor’s cell of origin are strong determinants of tumor aggressiveness. Using a melanoma model system, Gupta et al. concluded that latent “lineage-specific factors” associated with the normal melanocyte differentiation program underlie melanocytes’ unique ability to metastasize when compared to isogenic controls60. Latil et al. drew similar conclusions when they induced squamous cell carcinomas from interfollicular epidermis and hair follicle stem cells61. They demonstrated that the cell-type-specific chromatin landscape and transcriptional network determined propensity for EMT and metastases. Using clinical specimens, we observed that PCa cells revive lineage-specific programs during metastatic progression.
The cellular processes driving these programmatic changes require further investigation. Our observation that reprogrammed AR sites in mCRPC reside at loci bearing the DNA binding motif for ZEB1, an EMT-TF, is noteworthy. In EMT, the cancer cell suppresses traits associated with differentiated epithelial cells, such as tight intercellular junctions that constrain motility, and adopts mesenchymal traits, such as invasiveness and motility9. This transition is crucial for metastatic progression and echoes specific steps in embryogenesis55. ZEB1 is one of a handful of EMT-TFs whose up-regulation activates EMT in cancer9,62. ZEB1 has been shown to mediate EMT in PCa cell line models63-65, and in clinical PCa specimens, its expression correlated with tumor grade and disease aggressiveness66.
Through genomic and epigenomic integration, the data highlight that TFs playing relevant roles in PCa development and biology acquire both metastasis-specific amplification and metastasis-specific H3K27 acetylation at proximal enhancers67. These include the previously reported AR enhancer35, as well as enhancers proximal to NKX3–1, FOXA1, and HOXB13. More broadly, identification of state-specific, ‘resurrected’ enhancers as described here may serve as a foundation for investigation into the other key genes and pathways underlying cancer progression.
We identified a strong association between prostate-specific regulatory elements and genetic variation in PCa. We observed that a substantial proportion of inherited PCa genetic risk resides within lineage-specific enhancer loci. These levels of enrichment were much greater than previous analyses of PCa heritability that investigated annotations from prostate cell lines68. Moreover, these two states were more enriched than any other genetic functional annotations considered in the model, including evolutionarily conserved regions (18.2-fold)69 and coding regions (13.1-fold) that typically exhibit high enrichments across diseases. In the somatic genome, previous tumor sequencing studies demonstrated a relative depletion of mutations at enhancers4. We similarly observed this depletion in the enhancers we classified as non-prostate lineage specific. However, we observed the opposite—enrichment of somatic mutations —in a newly defined set of prostate lineage-specific regulatory elements. This finding is consistent with previous reports that steroid receptors can themselves be mutagenic70,71. TF binding may perturb DNA structure, disrupt chromatin looping or inhibit DNA repair machinery72.
Multiple lines of investigation support the notion that the functional contribution of somatic mutations in lineage-specific TF binding sites is minimal. Mazroeei et al. showed that a very small proportion of somatic mutations in PCa impact transcription factor binding of FOXA1, AR, and HOXB13, and similarly, only a small number influence the transactivation potential as assessed by a massively parallel reporter assay50. Recent work showed that binding of certain TFs can promote the accumulation of mutations71. In light of these studies, we suspect that the mutation enrichment we observe is due primarily to bound TFs and other local chromatin features, rather than positive selection for these mutations. In line with this, our analysis and prior analyses of primary prostate cancers52,73 did not identify recurrent mutations in regulatory elements. In addition, we find no T-ARBS or met-ARBS that are mutated in more than 5% of samples (data not shown). This finding holds true when analyzing an independent dataset of somatic CRPC mutations36.
Over 40 years ago, in describing the nature of biologic processes, François Jacob wrote, “It is this net historical opportunity that mainly controls the direction and pace of adaptive evolution…It is always a matter of tinkering”74. Our findings are consistent with this principle in that the prostate adenocarcinoma cell does not invent new programs, but rather ‘tinkers’ with previously decommissioned programs. Mapping these epigenomic changes across clinical states presents potential opportunities for clinical translation. For example, the trans-acting factors essential for mCRPC-specific enhancer function may be targeted75,76, or mCRPC-specific enhancers themselves may be targets for therapy7,77. More fundamentally, as the mechanisms responsible for epigenetic plasticity are better understood, blocking access to latent embryonic programs or “re-reprogramming” the cell to a more differentiated state (e.g., differentiation therapy) may be possible78,79.
METHODS
Tissue specimens and ChIP-seq.
Fresh-frozen RP specimens were selected from the Dana-Farber Cancer Institute (DFCI) Gelb Center biobank and database, as part of DFCI Protocols 01–045 and 09–171, approved by the Dana-Farber Cancer Institute/Harvard Cancer Center IRB (Supplementary Table 1). Hematoxylin and eosin stained slides from each case were reviewed by a genitourinary pathologist. Areas estimated to be enriched >70% for prostate tumor tissue or normal prostate epithelium were isolated for analysis (assessed by genitourinary pathologist R.L.). Fresh frozen liver biopsies were obtained from two patients with mCRPC. The core needle biopsy specimens were sectioned and stained for AR (by pathologist R.L.) to assure PCa purity. Collection human mCRPC tissue for construction of xenograft tumors (Supplementary Table 1 and described in Nguyen et al.18) was approved for research by the University of Washington Human Subjects Division IRB, which approved all Informed Consents (IRB #39053). The fetal UGS cells were obtained via a research protocol that was approved by the Office for the Protection of Research Subjects at UCLA and the Greater Los Angeles VA Medical Center and established as a cell line (FPBZ13) as previously described20. Cells were expanded and maintained in RPMI 1640 supplemented with 10% fetal bovine serum, 100 μg/ml penicillin/streptomycin, and 10–8M R1881. All experiments and analyses using these specimens were performed at DFCI. Additional fresh frozen RP specimens were collected at the Netherlands Cancer Institute (NKI). Areas of tumor and normal tissue were isolated by a pathologist (J.S.) and ChIP-seq was performed at NKI. Tumor purity varied by sample and is outlined in Supplementary Table 2. This aspect of the study was performed in accordance with the Code of Conduct of the Federation of Medical Scientific Societies in the Netherlands and was approved by the local medical ethics committees.
ChIP-seq using the Gelb Center fresh-frozen RP specimens and the mCRPC PDX specimens was performed at DFCI using the protocol previously described6 with antibodies to AR (N-20, Santa Cruz Biotechnology), HOXB13 (H-80, Santa Cruz Biotechnology), FOXA1 (ab23738, Abcam), H3K27ac (C15410196, Diagenode), H3K4me2 (07030, Millipore) and H3K4me3 (9733S, Cell Signaling). Libraries were sequenced using 75-bp reads on the Illumina platform at DFCI. ChIP-seq using the NKI RP specimens was performed for AR, HOXB13, FOXA1 and H3K27ac as previously described80.
The ATAC-seq assay was performed at Active Motif using fresh-frozen Gelb Center RP tumor and normal epithelium specimens. The tissue was manually disassociated, isolated nuclei were quantified using a hemocytometer, and 100,000 nuclei were tagmented as previously described81, with some modifications82 based on enzyme and buffer provided in the Nextera Library Prep Kit (Illumina). Tagmented DNA was then purified using the MinElute PCR purification kit (Qiagen), amplified with 10 cycles of PCR, and purified using Agencourt AMPure SPRI beads (Beckman Coulter).
ChIP-seq peak calling and data analysis.
All samples were processed through the computational pipeline developed at the DFCI Center for Functional Cancer Epigenetics (CFCE) using primarily open source programs. Sequence tags were aligned with Burrows-Wheeler Aligner (BWA) to build hg19 of the human genome, and uniquely mapped, non-redundant reads were retained83. These reads were used to generate binding sites with Model-Based Analysis of ChIP-seq 2 (MACS v2.1.1.20160309), with a q-value (FDR) threshold of 0.0184. We evaluated multiple quality control criteria based on alignment information and peak quality: (i) sequence quality score; (ii) uniquely mappable reads (reads that can only map to one location in the genome); (iii) uniquely mappable locations (locations that can only be mapped by at least one read); (iv) peak overlap with Velcro regions, a comprehensive set of locations—also called consensus signal artifact regions—in the human genome that have anomalous, unstructured high signal or read counts in next-generation sequencing experiments independent of cell line and of type of experiment; (v) number of total peaks (the minimum required was 1,000); (vi) high-confidence peaks (the number of peaks that are tenfold enriched over background); (vii) percentage overlap with known DHS sites derived from the ENCODE Project (the minimum required to meet the threshold was 80%); and (viii) peak conservation (a measure of sequence similarity across species based on the hypothesis that conserved sequences are more likely to be functional). Typically, if a sample fails one of these criteria, it will fail many (locations with low mappability will likely have low peak numbers, many of which will likely be in high-mappability regions, etc.).
Differential peak analysis and DNA binding motif analyses.
Peaks from all study samples were merged to create a union set of sites for each TF and histone mark. Read densities were calculated for each peak for each sample, which were used for comparison of ChIP-seq signals across samples. Sample similarity was determined by hierarchical clustering using the Spearman correlation between samples. Tissue-specific peaks were identified by DEseq2 with adjusted P ≤ 0.0001, |log2fold change| ≥ 1.5. Total number of reads in each sample was applied to size factor in DEseq2, which can normalize the sequencing depth between samples. Differential peaks from each group were used for motif analysis by the motif search HOMER (v3.0.0), with cutoff q-value ≤ 1 × 10⁻¹⁰.
Whole-genome bisulfite sequencing (WGBS) analysis.
Paired end WGBS data from the prostate tissue of four healthy donors and five PCa patients were obtained from the authors22.
Quality control of the sequencing reads, including trimming for quality (bases below Phred score threshold of 20 were trimmed) and adapters (Nextera adapter sequences were discarded), was carried out using Trim Galore! (version 0.4.4_dev). Reads were discarded if either mate pair was trimmed to below 20 bases. Trimmed reads were mapped to the hg19 genome reference (ftp://ftp.ensembl.org/pub/grch37/current/fasta/homo_sapiens/dna/Homo_sapiens.GRCh37.dna.chromosome.*.fa.gz) using Bowtie285 and Bismark v0.19.086 in non-directional mode. Counts of methylated reads and total coverage for each cytosine in CpG context were extracted using the bismark_methylation_extractor command. Methylation proportions for each CpG collapsed over strand were computed using the bsseq Bioconductor package in R87. The body site samples were lifted over to hg19 coordinates using the rtracklayer Bioconductor package88. Data was visualized in the enhancer region using the dmrseq Bioconductor package89.
Determining H3K27ac status at transcripts up- and down-regulated in metastatic prostate cancer.
The “volcano plot” was constructed as a scatter plot based on differential gene expression in prostate metastasis relative to primary prostate tumor (GSE21034)21. Log2 fold change for each gene was plotted on the x-axis and the negative log10 (FDR) (P-value) was plotted on the y-axis. The red dots depicted genes with met-K27ac within their TSS. The top 200 H3K27ac sites in terms of signal intensity difference between metastasis and localized disease are displayed in Figure 1 and Extended Data Figure 2.
Profiling UGS cell line and Roadmap Epigenomics H3K27ac data at mCRPC-enriched sites.
UGS cells underwent H3K27ac ChIP-seq as described above. All fetal tissue H3K27ac sample data was download from the NIH Roadmap Epigenomics Mapping Consortium19. The Chilin pipeline90 was applied to all Roadmap samples, including adult specimens. Data were converted to bigwig files by deeptools bamCoverage. Given varying alignment of reads or fragments across samples, coverage track bigWig files were calculated for each sample that reflected the coverage signal and sequencing depth. Deeptools multiBigwigSummary further computed the average scores for each of the files in met-K27ac sites91. Finally, a profile heatmap was created based on the scores at genomic positions within 2 kb upstream and downstream of the enhancer. All samples were ranked by the average score. Fetal genome-wide H3K27ac was similarly analyzed in relation to breast cancer H3K27ac, downloaded from Patten et al.32
Gene expression across temporal stages of prostate development.
Intensity of signal for each of the 16,047 mCRPC-enriched H3K27ac loci was ranked by adjusted P-value and fold change. The top 100 sites that had overlap with a TSS was selected. All human genes with a homologous mouse gene were converted and used in the analysis.
Raw FHCRC Mouse Prostate MPEDB cDNA Array data was downloaded from GEO (GSE19225), expression values for the genes described above were evaluated. Levels were measured relative to expression at embryonic day 14 as described34.
Box-and-whisker plots depicting the median, 25th–75th percentile interval and extremes in expression across the temporal stages of prostate development were calculated. P-value was determined by Wilcoxon signed-rank test92, comparing embryonic and post-natal samples.
Identifying the major combinatorial and spatial patterns of chromatin states.
We used the chromatin state segmentation software ChromHMM to compute genome-wide chromatin state predictions in each condition based on relative enrichment levels of histone modifications, transcription factors and chromatin accessibilities48. Four epigenetic marks (H3K27ac, H3K27me3, H4Kme2, H4Kme3), three transcription factors (AR, FOXA1, HOB13), and chromatic accessibility (ATAC) from four primary prostate tumor patients were used to construct the ChromHMM model. We used default parameters of 200 bp for partitioning the genome into ChromHMM categories. A ten-state model was chosen based on levels of enrichment of each histone modification, transcription factor and chromatin accessibility. Conservation of each state was determined using phastCons conservation scores93,94 and comparing across samples via Wilcoxon rank sum and Kruskal-Wallis tests.
Analyzing epigenetic states and prostate cancer heritability.
We used stratified LD-score regression (S-LDSC) to quantify the enrichment of GWAS heritability in epigenetically active regions (annotations)95. Briefly, S-LDSC evaluates the full distribution of GWAS associations (not restricting to significant SNPs) and infers heritability parameters from the relationship between the effect-size and the linkage equilibrium (LD) of each SNP. Annotations that are in LD with higher effect-size SNPs will be assigned higher heritability and vice versa.
GWAS summary statistics were downloaded from recent studies of breast (n = 228,951) and prostate (n = 72,729) cancer risk45,49. Each study was restricted to ~1M HapMap3 SNPs that are typically well imputed across all GWAS platforms and have been shown to perform well in heritability analyses95. We then included all ten ChromHMM state annotations in the S-LDSC model together with the standard “baseline model” which captures potential confounding from genetic features such as coding regions, promoters, and introns. Enrichment for each annotation was computed as the % of heritability accounted for by the annotation, divided by the % of SNPs contained in the annotation, where an enrichment of 1.0 is expected under the null. Statistical significance was assessed by the block jackknife as implemented in S-LDSC.
Analyzing epigenetic states and somatic variation.
Somatic single nucleotide variants from 210 PCa samples in the International Cancer Genome Consortium data repository were downloaded. Only variants identified by the PCAWG consensus caller were included in this analysis. Five samples with the highest burden of mutations (>18,000) were excluded. To quantify mutational density genome-wide, the number of samples with one or more mutation per each 200-bp window was calculated. Using the “glm” function in R, the mutational density at a given 200-bp window was modeled as a Poisson distribution determined by a linear combination of the following factors: % G or C nucleotide content, % CpG dinucleotide content, median expression level in a TCGA PCa RNA-seq dataset, overlap with a DNAse hypersensitivity peak in prostate epithelial cells, overlap with a protein-coding exon, overlap with a CCDS-annotated gene, and overlap with primary PCa ChromHMM state annotations 2 through 10. Beta coefficients for each term were calculated and are reported as standardized Z-scores to allow comparison.
All data were aggregated in identical 200-bp windows tiling the hg19 human reference genome. For binary data (e.g., presence or absence of overlap with a CCDS transcript), the 200-bp windows were assigned 1 if one or more base pair overlapped with a given feature. Overall % G/C content and CpG dinucleotide content were extracted from the reference genome fasta file using BEDTools “nuc” command. Consensus Coding Sequence (CCDS) gene coordinates, with a 200-bp buffer on either end, were downloaded from the UCSC genome browser (https://genome.ucsc.edu/cgi-bin/hgTables). The median expression level (calculated as log2(fpkm + 1), where fpkm is the number of fragments per kb of transcript per million mapped reads), was tabulated for each gene across an RNA-seq dataset of 551 TCGA prostate cancers. Replication timing data from Repli-Seq experiments in the LNCaP cell line (ENCSR089VDE and ENCSR385QAX) were obtained from ENCODE (https://www.encodeproject.org) and processed as described96. DNAse hypersensitivity peaks from prostate epithelial cells (PrEC; ENCSR000EPU) were obtained in bed format from ENCODE. The intersection of peaks from two isogenic replicates was determined using BEDTools. Overlap with annotated CpG islands (http://hgdownload.cse.ucsc.edu/goldenpath/hg19/database/) was determined. Sequencing coverage depth from a panel of 57 PCa whole genomes1 was used as an estimate for sequencing coverage for the ICGC WGS dataset used in this study. Overlap with protein-coding exons was annotated using data from UCSC genome browser (https://genome.ucsc.edu/cgi-bin/hgTables). Mutational signatures by trinucleotide context at T-ARBS and N-ARBS was determined using the SomaticSignatures R package97.
Analysis of genetic duplications overlapping mCRPC-specific H3K27ac ChIP-seq peaks.
We used structural alteration events previously published36 (Supplementary Table 6) and focused on alteration classes associated with duplications, including tandem duplications and high-level amplifications. First, for each ChIP-seq peak, we computed the frequency of samples that harbor a duplication that completely spans the peak region. Second, we performed a recursive regression tree analysis (rpart R package) to join adjacent peaks in a piecewise-constant manner for similar frequency values, resulting in segments defined by the summary frequency value (regression fit). For each segment, overlapping and nearby (up to +/− 1 Mb) genes were annotated.
Characterizing putative enhancers.
LNCaP cells were originally purchased from ATCC and grown in RPMI with 10% fetal calf serum. Cell lines were authenticated by short tandem repeat profiling and tested negative for mycoplasma (DDC Medical). LNCaP cells were transduced with pLenti-KRAB-dCas9 followed by selection with blasticidin.
gRNAs were cloned as previous described (detailed protocol available at http://www.broadinstitute.org/rnai/public/resources/protocols). The gRNA sequences were synthesized as complementary single stranded oligonucleotides as listed in Supplementary Table 8. Following annealing, oligonucleotides were cloned into pXPR_BRD003.
Lentivirus was generated by transfecting 293T cells with plasmid expressing gRNA with the packaging plasmids pVsVG and pdelta8.9 using TransIT-LT1 transfection reagent (Mirus). Supernatant containing virus was harvested 48 hours after transfection and used to transduce LNCaP cell lines stably expressing KRAB-dCas9 in the presence of 4 μg/ml polybrene. Medium was changed 24 hours after infection and replaced with medium containing 2 μg/ml puromycin for 3 days.
RNA was isolated using QIAGEN RNeasy Plus Kit and cDNA synthesized using Clontech RT Advantage Kit. Quantitative PCR was performed on a Quantstudio 6 using SYBR green. Primers used for qRT-PCR are listed in Supplementary Table 8.
HiChIP.
Fixation and digestion.
10 million LNCaP cells after trypsinization were fixed with 1% formaldehyde in culture media at room temperature for 10 min, quenched with glycine (final 125 mM), and rinsed with ice-cold PBS. Cells were incubated with HiC lysis buffer (10 mM Tris-HCl pH 8.0, 10 mM NaCl, 0.2 % NP-40 and protease inhibitor) for 30 min at 4 °C. After treatment with 100 μl of 0.5 % SDS for 10 min at 65 °C, samples were mixed with 292 μl water and 50 μl of 10 % TritonX-100, and incubated for 15 min at 37 °C. After 4 h digestion with Mbo I (375 U) in NEB buffer #2 at 37 °C with rotation, Mbo I was inactivated by heating at 62 °C for 20min.
Biotin labeling, ligation and ChIP.
The cohesive ends of fragmented DNA were filled with 15 nmol biotin labeled dATP with same amount of dCTP, dGTP and dTTP by Klenow (10 U) at 37 °C for 1 h. After adding 945 μl of ligation mix containing 1x T4 DNA ligation buffer, 1 % Triton X-100, 0.1 mg/ml BSA and 4,000 U T4 DNA ligase, samples were incubated at room temperature for 4 h with rotation. Chromatin was sonicated using Covaris E220 (conditions: 140 PIP, 5% DF, 200 CB) to 300–800 bp in ChIP lysis buffer (1% NP-40, 0.5% sodium deoxycholate, 0.1% SDS and protease inhibitor in PBS) and centrifuged at 13,000 r.p.m. for 10 min at 4 °C. Preclearing 30 μl of Dynabeads protein A/G for 1 h at 4 °C was followed by incubation with 1 μg H3K27ac antibody at 4 °C overnight with rotation. 40 μl of Dynabeads protein A/G were added to the samples and incubated for 2 h at 4 °C with rotation. Chromatin was washed with low salt (0.1% SDS, 1% Triton X-100, 2 mM EDTA, 20 mM Tris-HCl, 150 mM NaCl) high salt (0.1% SDS, 1% Triton X-100, 2 mM EDTA, 20 mM Tris-HCl, 500 mM NaCl) and LiCl wash buffer (100 mM Tris pH 7.5, 500 mM LiCl, 1% NP-40, 1% sodium deoxycholate) three times, respectively. Samples were re-suspended with 100 μl of DNA elution buffer (1% SDS, 0.05 M NaHCO3) and incubated at room temperature for 11 min and at 37 °C for 3 min twice. Chromatin was decrosslinked by incubation at 55 °C for 45 min and at 67 °C for 90 min with proteinase K. DNA was purified using Qiagen Qiaquick column. The same steps were taken for H3K4me3 ChIP.
Biotin pulldown, Transposase treatment and library preparation.
Biotin incorporated DNA was pull down by incubation with 5 μl Streptavidin C1 beads resuspended in 2x Biotin binding buffer (10 mM Tris-HCl pH 7.5, 1 mM EDTA, 2 M NaCl) at room temperature for 15 min. After washing with Tween washing buffer (5 mM Tris-HCl pH 7.5, 0.5 mM EDTA, 1 M NaCl, 0.05 % Tween-20) twice at 55 °C for 2 min, beads were mixed with Transposase (0.05 μl/ng DNA amount) in TD buffer (20 mM Tris-HCl pH 7.5, 10 mM MgCl2, 20% Dimethylformamide) and incubated at 55 °C for 10 min with interval shaking. After washing with 50 mM EDTA at 50 °C for 30 min and Tween washing buffer at 55 °C for 10 min, the beads were rinsed with 10 mM Tris buffer pH 8.0, mixed with 50 μl PCR master mix (5 μl of 12.5 μM Nextera index primer pairs, 25 μl Phusion HF 2X, 10 μl water) and amplified for 5 cycles. 5 μl of aliquot from samples was used for qPCR to determine the cycle number of amplifications. After amplification, the library was purified using Agencourt AMPure XP X beads, and sequenced using 150-bp end reads on the Illumina platform.
Additional detailed information regarding experimental design and reagents can be found in the accompanying Life Sciences Reporting Summary.
Extended Data
Extended Data Fig. 1: Co-occupancy of AR and H3K27Ac at met-ARBS.
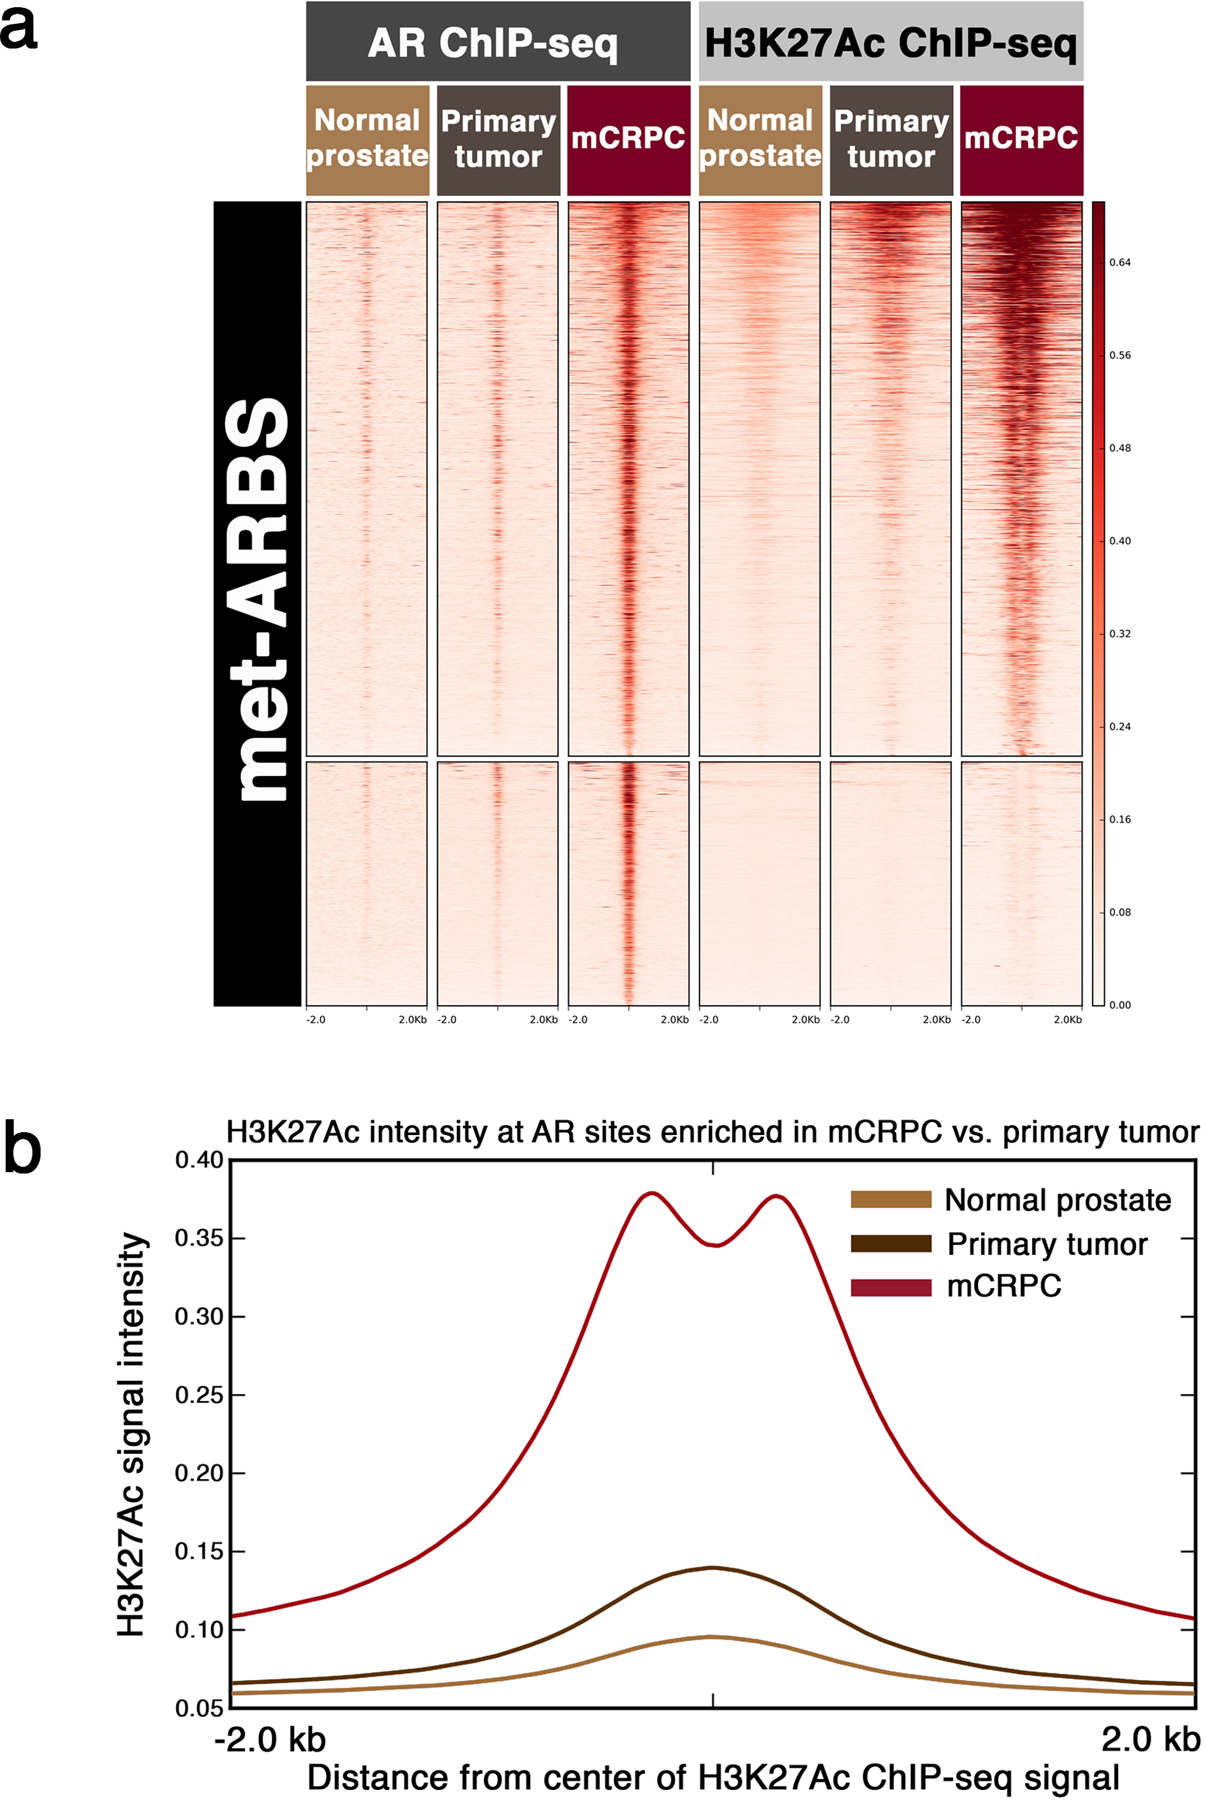
(a) Heatmaps for AR and H3K27Ac ChIP-seq signal intensity at met-ARBS. Each horizontal line represents a four kilobase (kb) locus. Shade of red reflects average binding intensity at that site across all subjects in the normal prostate, primary tumor and mCRPC cohorts. (b) H3K27Ac ChIP-seq signal intensity across tissue types at the 17,655 met-ARBS. The curves depict overall signal in each of the three tissue types. Signal significantly higher in mCRPC compared with primary prostate tumor and normal prostate tissue (Kolmogorov-Smirnov test, D^- = 0.74, p-value < 2.2e-16).
Extended Data Fig. 2: Genes that are down-regulated in metastasis compared to primary tumor are enriched for primary tumor-specific H3K27Ac ChIP-seq peaks.
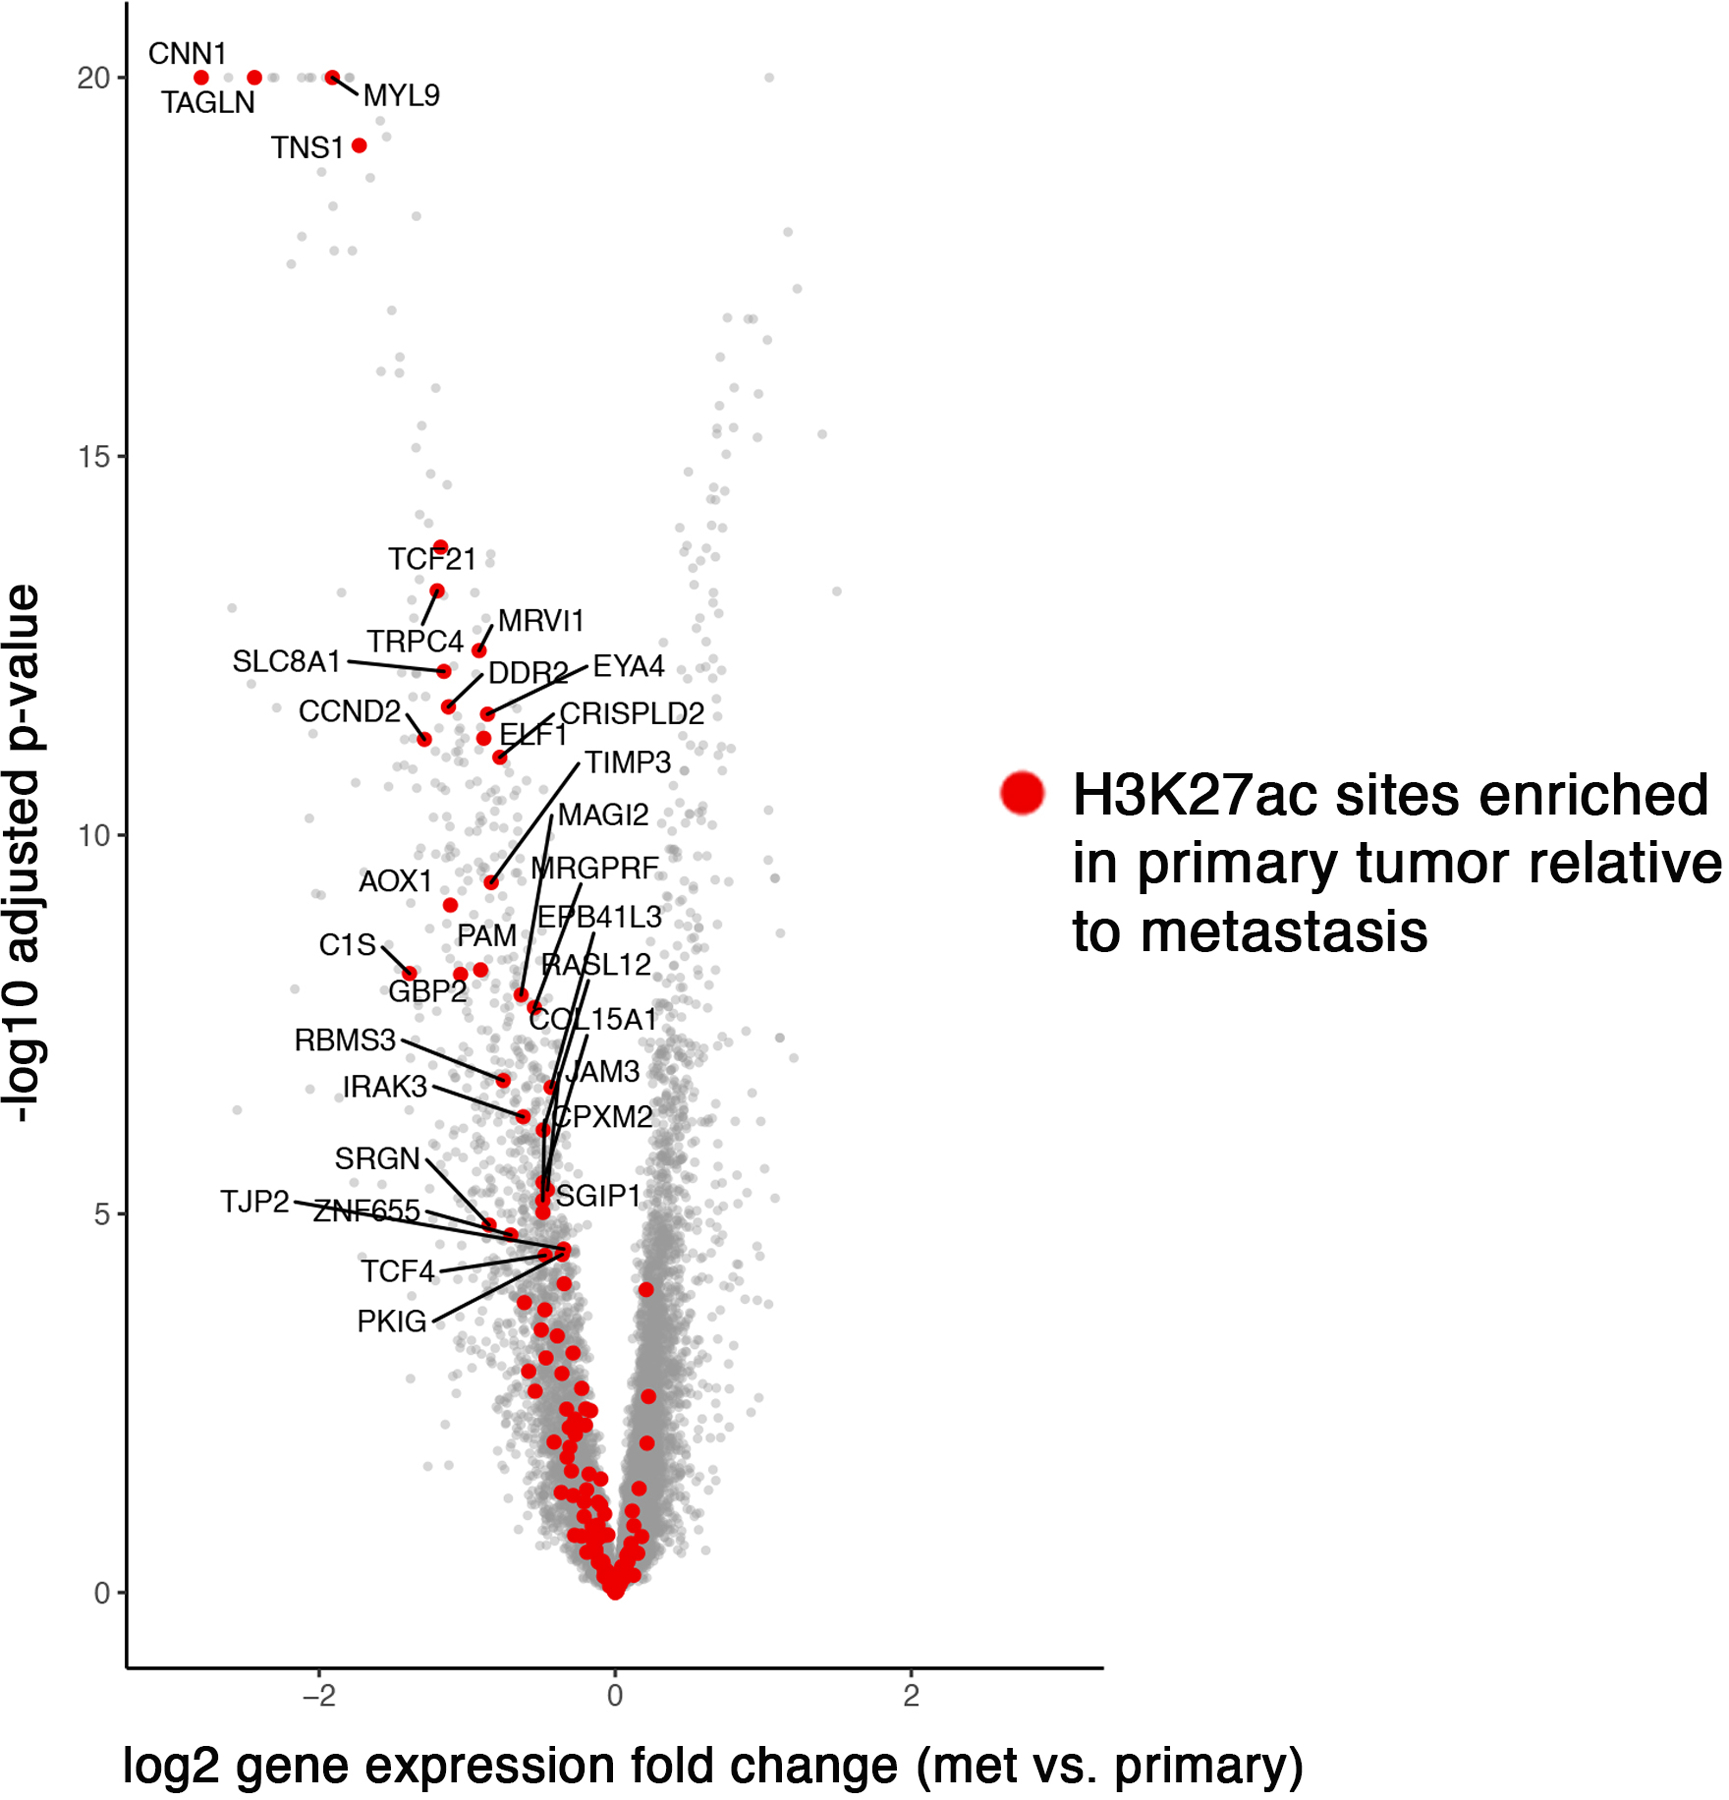
Each dot represents a gene. Red dots are genes with a primary tumor-specific H3K27Ac peak (i.e., sites with H3K27Ac signal in primary tumor and absent in mCRPC) in the transition start site (p-value <0.00001 for association between primary tumor-specific H3K27Ac and transcriptional down-regulation in mCRPC).
Extended Data Fig. 3: Reprogrammed AR binding sites in primary prostate tumors and in mCRPC are epigenetically pre-marked in earlier states.
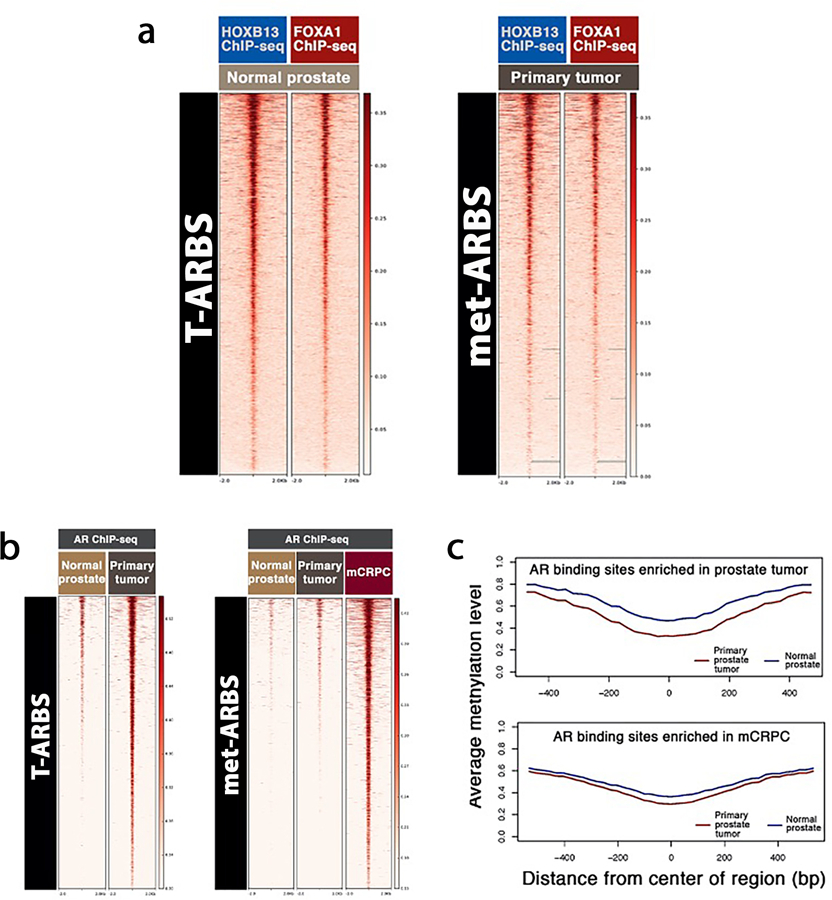
(a) Heat map indicating HOXB13 and FOXA1 ChIP-seq signal intensity in normal prostate epithelium and primary prostate tumor in the NKI dataset. At left, the 9,179 AR sites enriched in primary tumor relative to normal prostate epithelium (T-ARBS). At right, the 17,655 AR sites enriched in mCRPC relative to primary tumor tissue (met-ARBS). Each horizontal line represents a four kilobase (kb) locus. Shade of red reflects binding intensity. (b) AR ChIP-seq binding intensity across clinical tissue subtypes in T-ARBS and met-ARBS. (c) Average DNA methylation signal at T-ARBS across prostate tumor (red curve) and normal prostate (blue curve) at T-ARBS (top) and met-ARBS (bottom).
Extended Data Fig. 4: GREAT analysis characterizing mCRPC-enriched epigenetic sites.
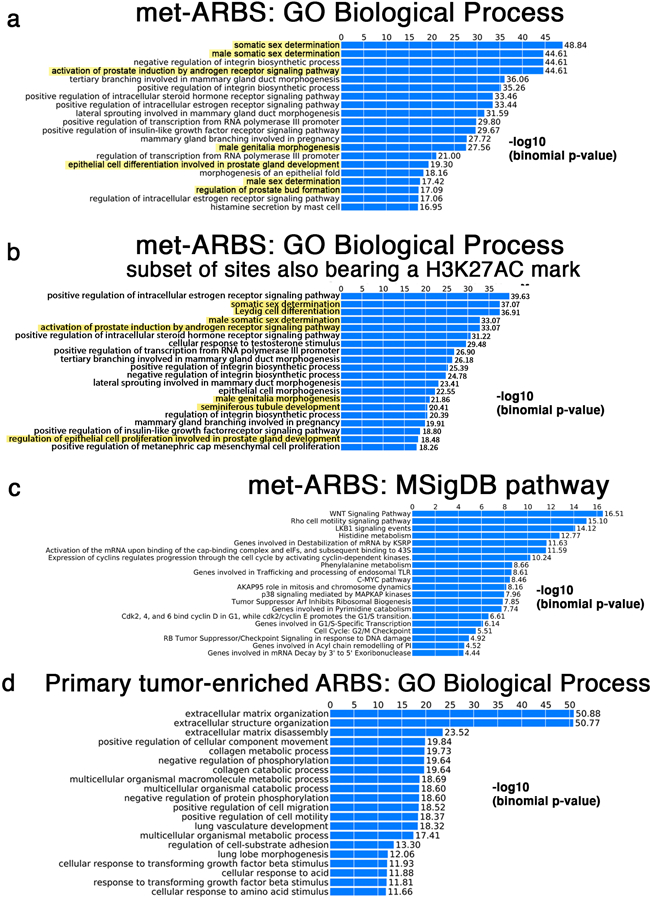
(a) GREAT analysis characterizing the gene ontology biological terms most significantly associated with genes proximal to the 17,655 met-ARBS. (b) GREAT analysis characterizing the gene ontology biological terms most significantly associated with genes proximal to the subset 17,655 met-ARBS that are co-occupied by H3K27Ac. Terms associated with genitourinary development are highlighted in yellow. (c) The biological terms most significantly associated with genes proximal to the 2,683 AR sites enriched in primary tumor compared to mCRPC. (d) GREAT analysis of the MSigDB pathway terms most significantly associated with genes proximal to met-ARBS.
Extended Data Fig. 5: Across 27 human adult tissues and 10 fetal tissues, the met-K27ac cistrome is most strongly associated with fetal urogenital sinus.
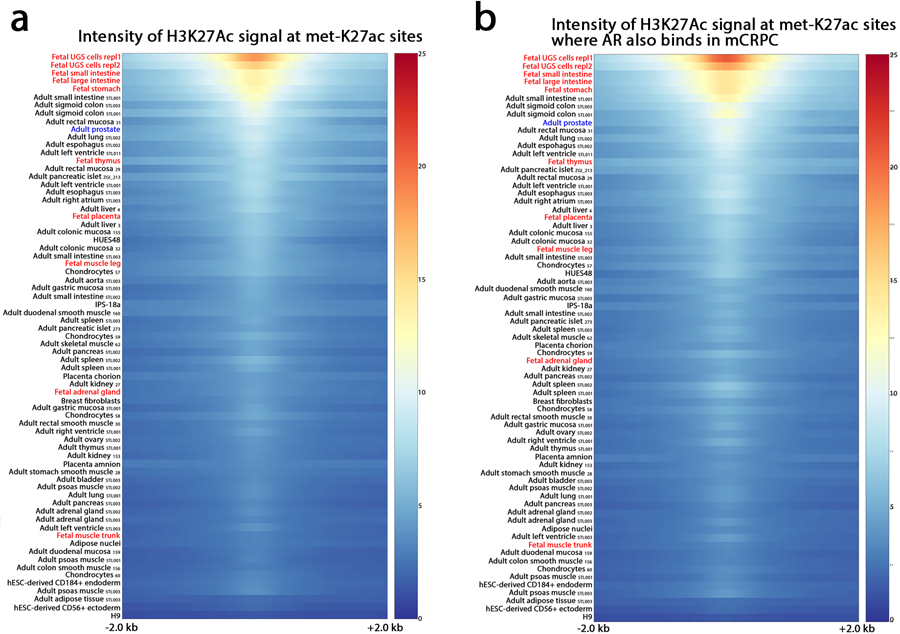
(a) Tissue type listed at left (adult tissues are followed by their Roadmap Epigenomics Project identification codes). Multiple biologic replicates were performed and included here. Urogenital sinus sample was performed in replicate. Heat map indicates H3K27Ac binding intensity at the 16,047 met-K27ac sites across a 4 kilobase (kb) interval. (b) Heat map for subset of met-K27ac sites that are co-occupied by AR.
Extended Data Fig. 6: Association between fetal and mature prostate murine gene expression and met-K27ac sites.
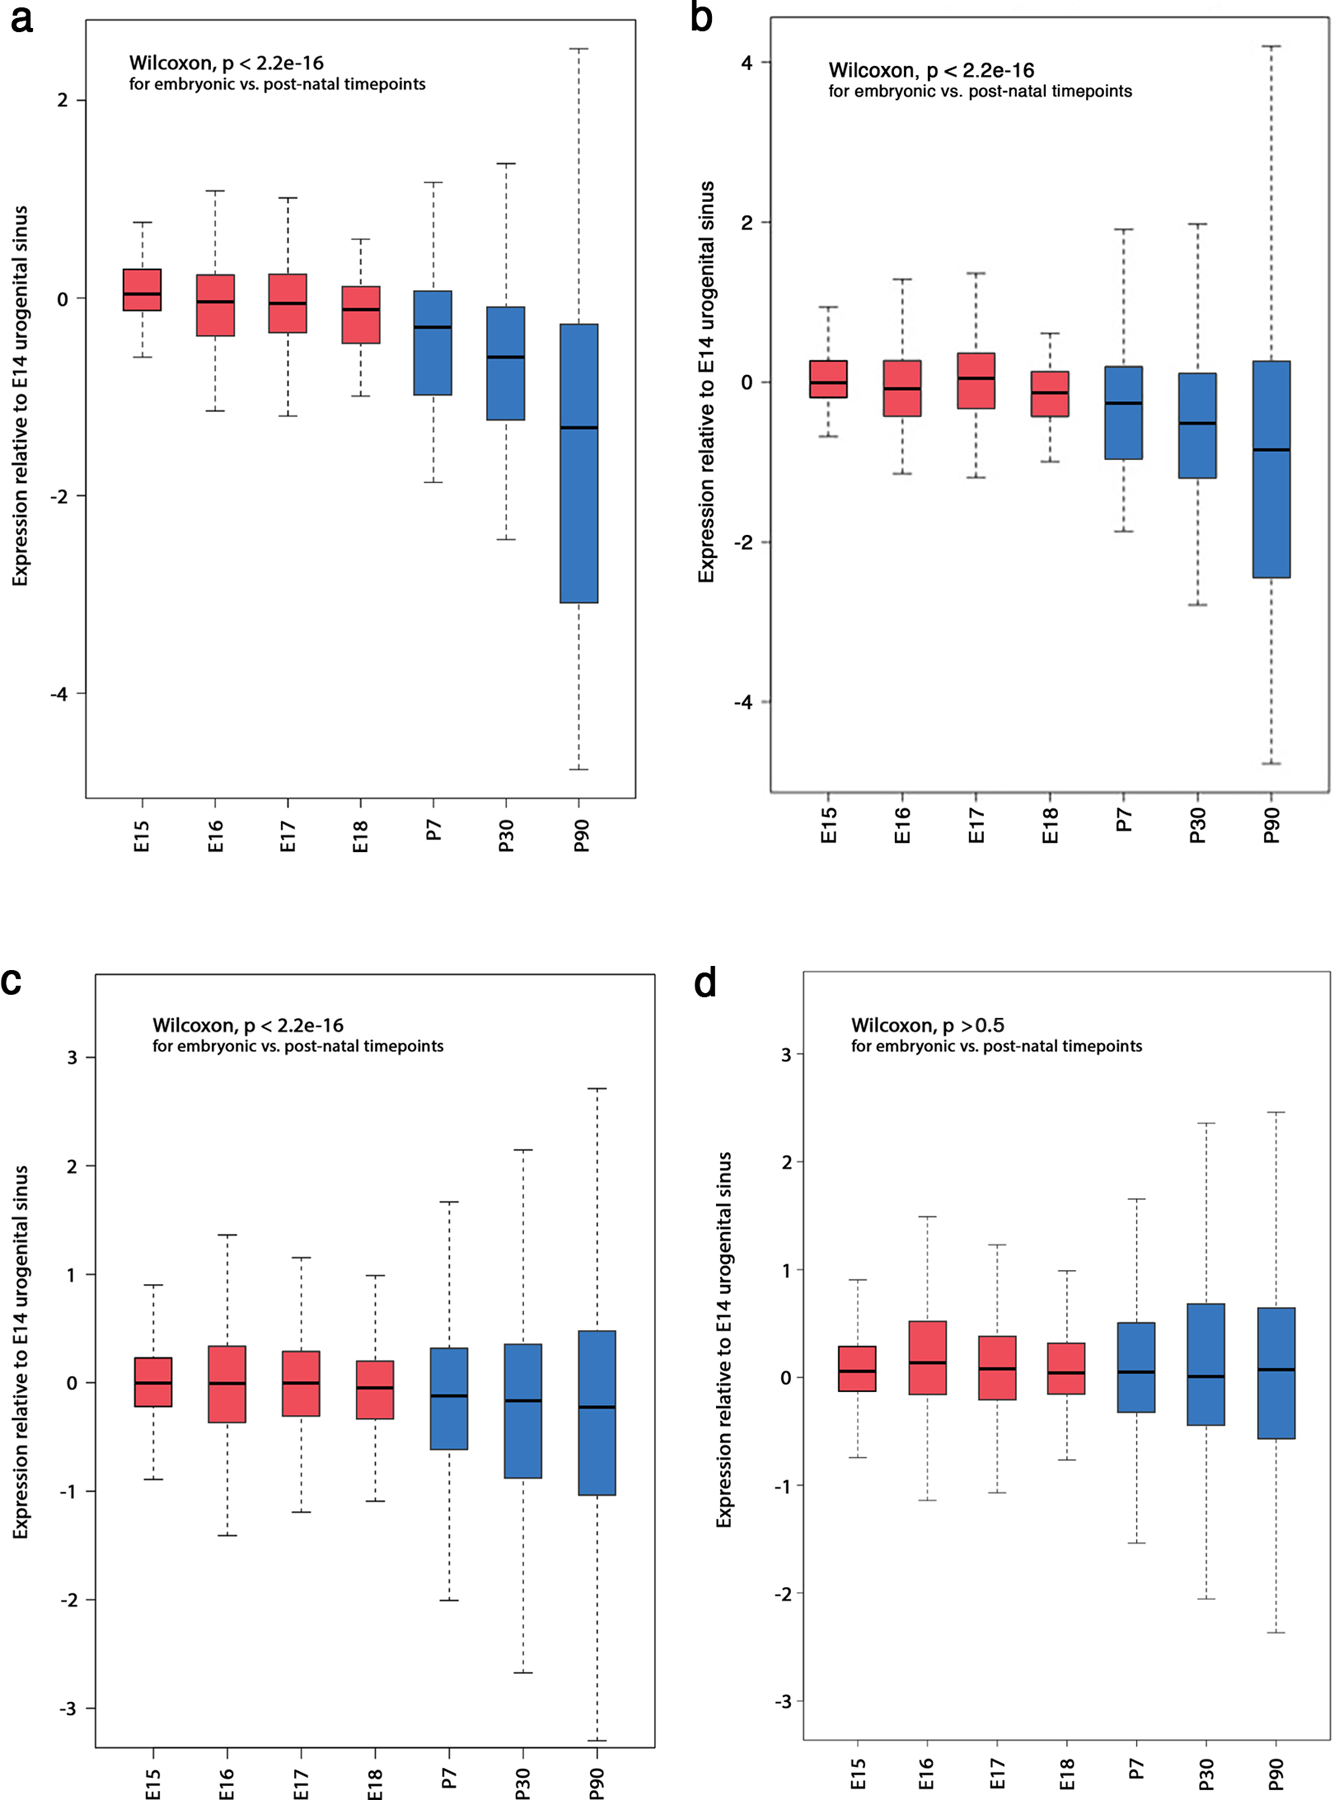
Gene expression in mouse prostate embryonic (red) and post-natal (blue) tissue34 at (a) the 50 most differential H3K27Ac sites between mCRPC and localized PCa in humans that reside within transcriptional start sites; (b) the 100 most differential H3K27Ac sites; (c) the 500 most differential H3K27Ac sites; and (d) at a randomly selected set of 500 genes that do not overlap with met-K27ac sites. Expression levels were performed in three replicates and measured relative to embryonic day 14 (y-axis). The x-axis shows embryonic days 15, 16 and 17 then post-natal days 7, 30 and 90. Box plots depict median, 25th–75th percentile interval and extremes in gene expression.
Extended Data Fig. 7: Enhancers of FOXA1 in mCRPC are identified by integrating genetic and epigenetic datasets.
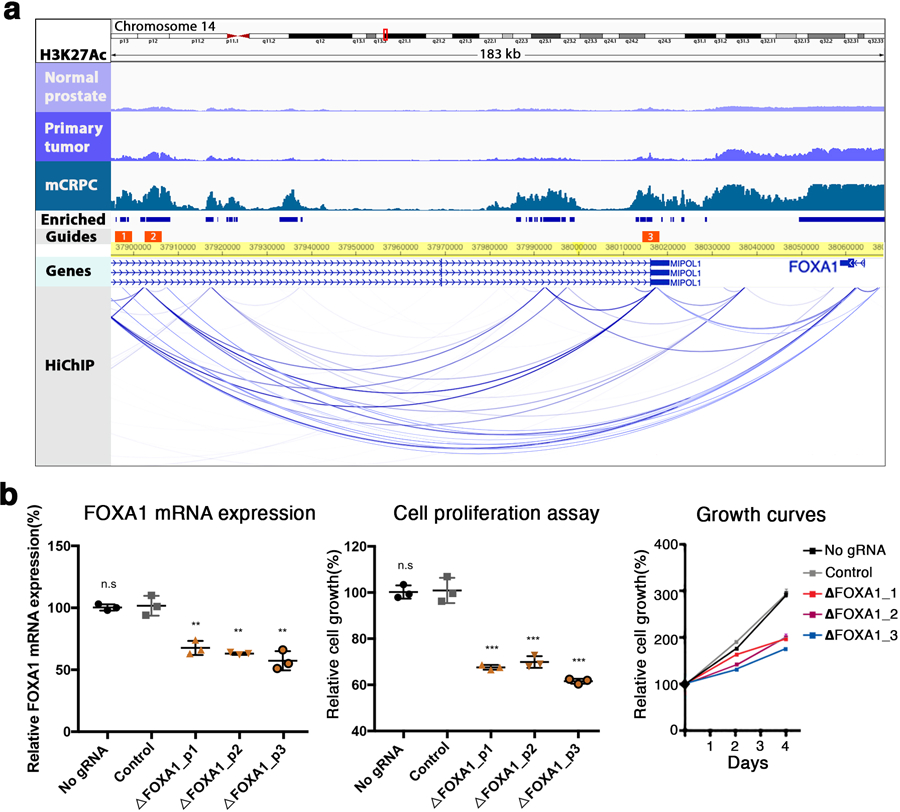
(a) At top, color-coded tracks in a 183 kilobase (kb) region derived from the segments ranked in Fig. 3. Tracks depict the intensity of ChIP-seq signal averaged across all DFCI normal prostate, primary prostate tumor and mCRPC specimens, respectively. FOXA1 is visualized in the Genes track. HiChIP track depicts chromatin looping in the LNCaP cell line. Blue bars show H3K27Ac sites meeting criteria for mCRPC enrichment (met-K27ac). Orange bars depict the locus against which guide RNAs (gRNAs) were designed (Methods). (b) Functional interrogation of candidate metastasis-specific enhancers. Left, LNCaP FOXA1 expression in two controls (no gRNA and gRNA targeting unrelated gene HPRT1) and after transduction with each individual gRNA depicted in (a). Middle and right, LNCaP cell proliferation over the course of four days after control conditions of transduction with one of the three FOXA1 region gRNAs. Each shape represents an independent experiment, center line indicates mean, error bars indicate ± s.d. Using student’s t-test – n.s not significant, *p < 0.05, **p < 0.01, ***p < 0.001.
Extended Data Fig. 8: Enhancer of NKX3–1 in mCRPC is identified by integrating genetic and epigenetic datasets.
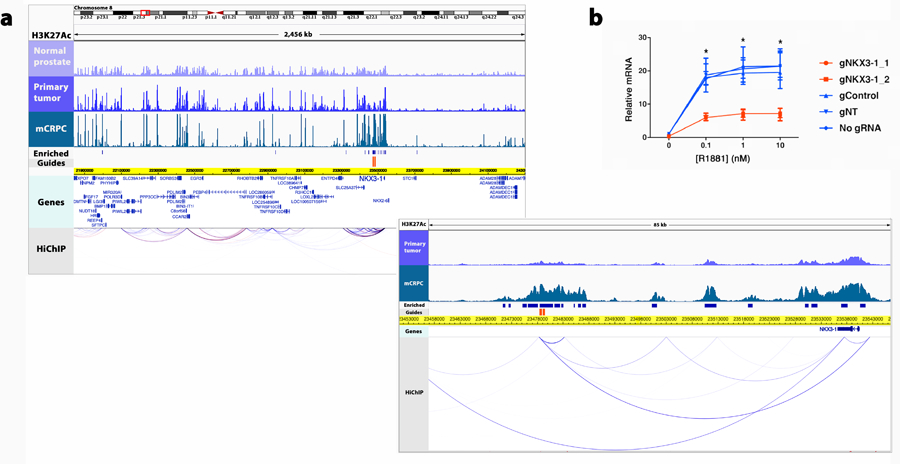
(a) At top, color-coded tracks in the 2,456 kb region depict the intensity of ChIP-seq signal averaged across all DFCI normal prostate, primary prostate tumor and mCRPC specimens, respectively. NKX3–1 is visualized in the Genes track. HiChIP track depicts chromatin looping in the LNCaP cell line. Blue bars show H3K27Ac sites meeting criteria for mCRPC enrichment (met-K27ac). Orange bars depict the locus against which guide RNAs (gRNAs) were designed (Methods). Below, magnification of an 85 kb region where met-K27ac and HiChIP signal were strongest. (b) Functional interrogation of the candidate metastasis-specific enhancer. LNCaP NKX3–1 expression in two controls (no gRNA and gRNA targeting unrelated gene HPRT1) and after transduction with gRNAs depicted in (a). Data represent the average and standard deviation of three biological replicates and significance determined by unpaired Student’s t test. * p < 0.001.
Extended Data Fig. 9: Prostate cancer and breast cancer risk heritability attributable to germline variation within prostate tumor chromatin states.
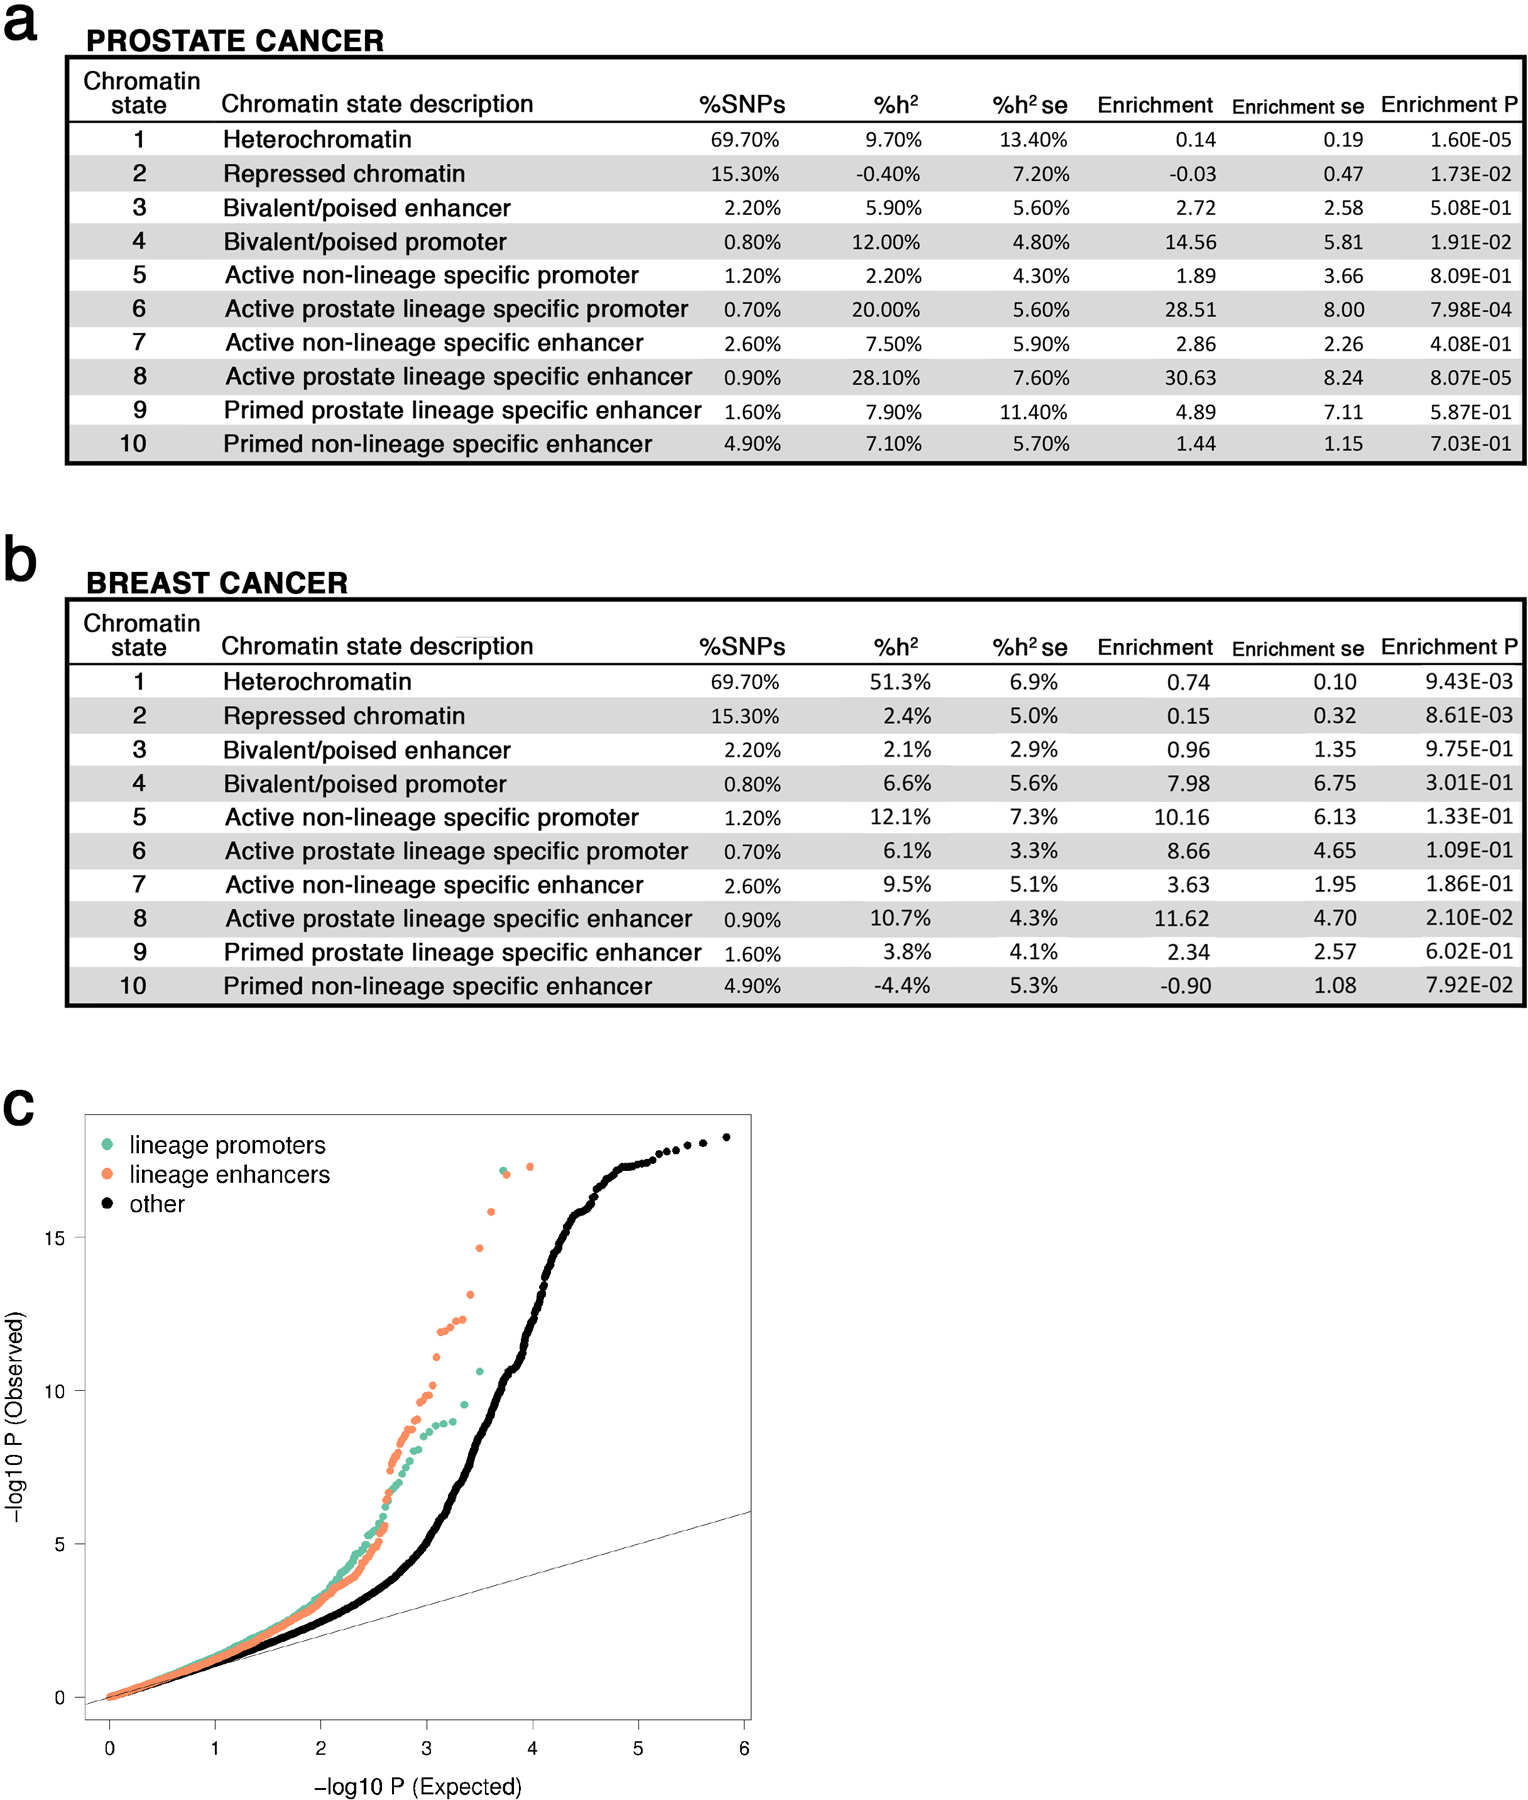
(a) Prostate cancer heritability attributable to each prostate cancer chromHMM state. (b) Breast cancer heritability attributable to each prostate cancer chromHMM state. %SNPs: percentage of single nucleotide polymorphisms residing within a chromatin state; %h2: proportion of prostate cancer risk heritability; se: standard error; Enrichment: heritability based on overall proportion of SNPs within the chromatin state. ( c) Q-Q Plot of PCa risk GWAS statistics in lineage specific and non-specific features. Lineage specific promoters, enhancers, and all other variants shown in green, orange, and black respectively. Variants with Chi-squared statistic > 80 were removed, as recommend by LD-score regression to mitigate outliers. Across all variants, mean Chi-squared statistic was 1.6 (s.e. 0.04), 1.7 (s.e. 0.07), and 1.2 (s.e. 0.003) for variants in promoters, enhancers, and all variants.
Extended Data Fig. 10: Prostate cancer somatic mutations are enriched at prostate lineage specific sites.
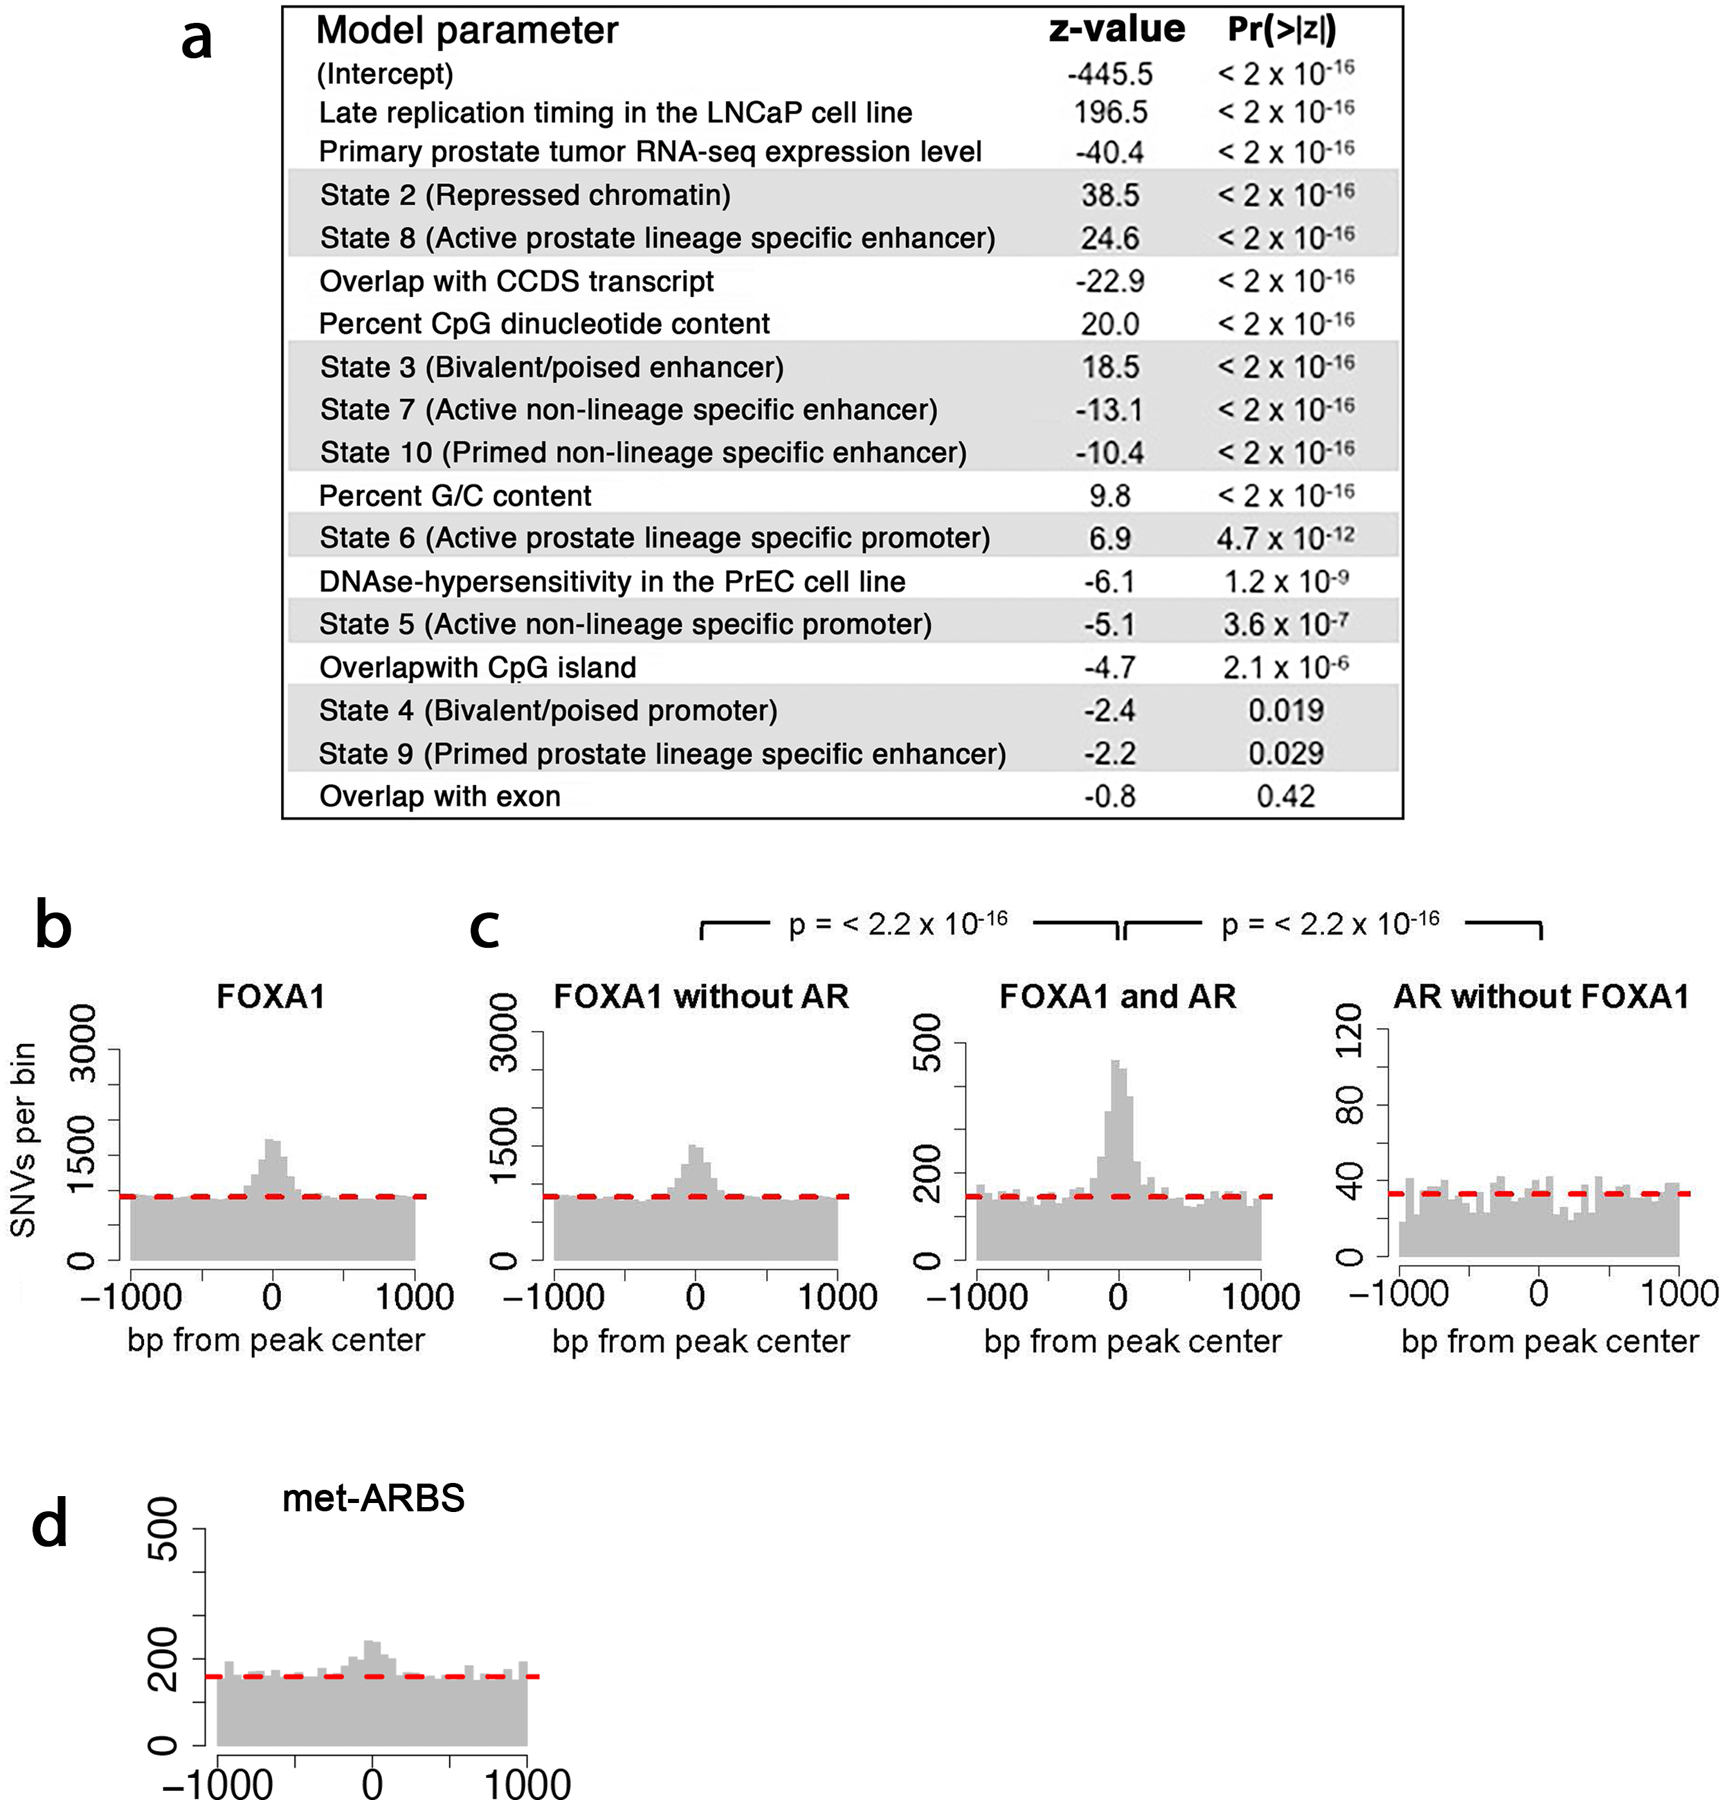
(a) Rank-ordered terms in a linear model of somatic mutation density in prostate cancer. Using 210 prostate cancer whole genome sequences from the International Cancer Genome Consortium, the number of donors with one or more mutations per 200bp window was modeled as a poisson distribution determined by a linear combination of the listed factors. Beta coefficients for each term were calculated and are reported as standardized Z-scores to allow comparison. ChromHMM states are highlighted in gray. See methods for details and a listing of datasets used in the model. (b) SNV distribution at FOXA1 binding sites in prostate tumor tissue. (C) SNV distribution at FOXA1 binding sites with no overlapping AR peak in prostate tumors (left), at intersection of FOXA1 and AR tumor peaks (center), and at AR tumor binding sites without overlapping FOXA1 peaks. P-values compare differential enrichment by Pearson’s chi-square test of mutation counts at the peak (±250bp) and shoulder regions (-1000 to -250 and 250 to 1000) of the TF binding sites. (d) SNV distribution at met-ARBS.
Supplementary Material
Acknowledgements
We thank M. Brown (DFCI) and members of the Center for Functional Cancer Epigenetics at DFCI for useful discussions and technical assistance. We also thank the NKI Core Facility Molecular Pathology and Biobanking for technical assistance and tissue processing, as well as the NKI Genomics Core Facility for Illumina sequencing analyses. We thank K. Schuurman, D. Sondheim and J. Conner for technical support. We also thank P. Nelson and C. Pritchard for their contributions to the data set.
This work was supported by Rebecca and Nathan Milikowsky (to M.M.P.), Prostate Cancer Foundation Challenge Award (to M.M.P. and M.L.F.), NIH grants R01GM107427 and R01CA193910 (to M.L.F.). VIDI grant from the Netherlands Organisation for Scientific Research (to W.Z.), the Dutch Cancer Society/ Alpe d’HuZes (10084) and Oncode Institute (to W.Z.), and NIH grant K08 13 CA218530 (to D.Y.T.). Jean Perkins Foundation, Prostate Cancer Foundation, STOP Cancer Foundation, DOD W81XWH-14-1-0273, NCI/NIH P50CA092131 (to I.P.G.).
The PNW Prostate Cancer SPORE P50 CA097186, DOD W81XWH-17-1-0415, P01 CA163227, and the IPCR supported establishment and generation of the LuCaP PDXs models. We thank the patients who generously donated tissue that made this research possible.
Footnotes
Declaration of Interests
The authors declare no competing interests.
Data availability.
Further information and requests for resources and reagents should be directed to and will be fulfilled by the Lead Contact, Matthew Freedman (mfreedman@partners.org).
We incorporated all of the epigenomic data generated in this study into a publicly accessible resource for investigators: http://genome.ucsc.edu/cgi-bin/hgTracks?db=hg19&hubUrl=https://de.cyverse.org/anon-files/iplant/home/dfcipc/trackhub/hub.txt
All sequencing data generated for the study has been deposited in GEO (GSE130408).
REFERENCES
- 1.Baca SC et al. Punctuated evolution of prostate cancer genomes. Cell 153, 666–677 (2013). [DOI] [PMC free article] [PubMed] [Google Scholar]
- 2.Banerji S et al. Sequence analysis of mutations and translocations across breast cancer subtypes. Nature 486, 405–409 (2012). [DOI] [PMC free article] [PubMed] [Google Scholar]
- 3.Kunz M et al. RNA-seq analysis identifies different transcriptomic types and developmental trajectories of primary melanomas. Oncogene 37, 6136–6151 (2018). [DOI] [PubMed] [Google Scholar]
- 4.Chen H et al. A pan-cancer analysis of enhancer expression in nearly 9000 patient samples. Cell 173, 386–399 e12 (2018). [DOI] [PMC free article] [PubMed] [Google Scholar]
- 5.Mohammed H et al. Progesterone receptor modulates ERalpha action in breast cancer. Nature 523, 313–317 (2015). [DOI] [PMC free article] [PubMed] [Google Scholar]
- 6.Pomerantz MM et al. The androgen receptor cistrome is extensively reprogrammed in human prostate tumorigenesis. Nat. Genet 47, 1346–1351 (2015). [DOI] [PMC free article] [PubMed] [Google Scholar]
- 7.Roe JS et al. Enhancer reprogramming promotes pancreatic cancer metastasis. Cell 170, 875–888 e20 (2017). [DOI] [PMC free article] [PubMed] [Google Scholar]
- 8.Jones PA & Baylin SB The epigenomics of cancer. Cell 128, 683–692 (2007). [DOI] [PMC free article] [PubMed] [Google Scholar]
- 9.Dongre A & Weinberg RA New insights into the mechanisms of epithelial-mesenchymal transition and implications for cancer. Nat. Rev. Mol. Cell. Biol 20, 69–84 (2019). [DOI] [PubMed] [Google Scholar]
- 10.Feldman BJ & Feldman D The development of androgen-independent prostate cancer. Nat. Rev. Cancer 1, 34–45 (2001). [DOI] [PubMed] [Google Scholar]
- 11.Wang Q et al. Androgen receptor regulates a distinct transcription program in androgen-independent prostate cancer. Cell 138, 245–256 (2009). [DOI] [PMC free article] [PubMed] [Google Scholar]
- 12.Stelloo S, Bergman AM & Zwart W Androgen receptor enhancer usage and the chromatin regulatory landscape in human prostate cancers. Endocr. Relat. Cancer 26, R267–R285 (2019). [DOI] [PubMed] [Google Scholar]
- 13.Stelloo S et al. Androgen receptor profiling predicts prostate cancer outcome. EMBO Mol. Med 7, 1450–1464 (2015). [DOI] [PMC free article] [PubMed] [Google Scholar]
- 14.Kron KJ et al. TMPRSS2-ERG fusion co-opts master transcription factors and activates NOTCH signaling in primary prostate cancer. Nat. Genet 49, 1336–1345 (2017). [DOI] [PubMed] [Google Scholar]
- 15.Chen Z et al. Diverse AR-V7 cistromes in castration-resistant prostate cancer are governed by HoxB13. Proc. Natl. Acad. Sci. USA 115, 6810–6815 (2018). [DOI] [PMC free article] [PubMed] [Google Scholar]
- 16.Cato L et al. ARv7 represses tumor-suppressor genes in castration-resistant prostate cancer. Cancer Cell 35, 401–413 e6 (2019). [DOI] [PMC free article] [PubMed] [Google Scholar]
- 17.Stelloo S et al. Integrative epigenetic taxonomy of primary prostate cancer. Nat. Commun 9, 4900 (2018). [DOI] [PMC free article] [PubMed] [Google Scholar]
- 18.Nguyen HM et al. LuCaP prostate cancer patient-derived xenografts reflect the molecular heterogeneity of advanced disease and serve as models for evaluating cancer therapeutics. Prostate 77, 654–671 (2017). [DOI] [PMC free article] [PubMed] [Google Scholar]
- 19.Roadmap Epigenomics Consortium et al. Integrative analysis of 111 reference human epigenomes. Nature 518, 317–330 (2015). [DOI] [PMC free article] [PubMed] [Google Scholar]
- 20.Guo C et al. Epcam, CD44, and CD49f distinguish sphere-forming human prostate basal cells from a subpopulation with predominant tubule initiation capability. PLoS One 7, e34219 (2012). [DOI] [PMC free article] [PubMed] [Google Scholar]
- 21.Taylor BS et al. Integrative genomic profiling of human prostate cancer. Cancer Cell 18, 11–22 (2010). [DOI] [PMC free article] [PubMed] [Google Scholar]
- 22.Yu YP et al. Whole-genome methylation sequencing reveals distinct impact of differential methylations on gene transcription in prostate cancer. Am. J. Pathol 183, 1960–1970 (2013). [DOI] [PMC free article] [PubMed] [Google Scholar]
- 23.Hanrahan K et al. The role of epithelial-mesenchymal transition drivers ZEB1 and ZEB2 in mediating docetaxel-resistant prostate cancer. Mol. Oncol 11, 251–265 (2017). [DOI] [PMC free article] [PubMed] [Google Scholar]
- 24.Dai Y et al. Copy number gain of ZEB1 mediates a double-negative feedback loop with miR-33a-5p that regulates EMT and bone metastasis of prostate cancer dependent on TGF-beta signaling. Theranostics 9, 6063–6079 (2019). [DOI] [PMC free article] [PubMed] [Google Scholar]
- 25.McLean CY et al. GREAT improves functional interpretation of cis-regulatory regions. Nat. Biotechnol 28, 495–501 (2010). [DOI] [PMC free article] [PubMed] [Google Scholar]
- 26.Simons BW et al. Wnt signaling though beta-catenin is required for prostate lineage specification. Dev. Biol 371, 246–255 (2012). [DOI] [PMC free article] [PubMed] [Google Scholar]
- 27.Lee SH et al. Wnt/beta-catenin-responsive cells in prostatic development and regeneration. Stem Cells 33, 3356–3367 (2015). [DOI] [PMC free article] [PubMed] [Google Scholar]
- 28.Kruithof-de Julio M et al. Canonical Wnt signaling regulates Nkx3.1 expression and luminal epithelial differentiation during prostate organogenesis. Dev. Dyn 242, 1160–1171 (2013). [DOI] [PMC free article] [PubMed] [Google Scholar]
- 29.Branam AM et al. TCDD inhibition of canonical Wnt signaling disrupts prostatic bud formation in mouse urogenital sinus. Toxicol. Sci 133, 42–53 (2013). [DOI] [PMC free article] [PubMed] [Google Scholar]
- 30.Huang L et al. The role of Wnt5a in prostate gland development. Dev. Biol 328, 188–199 (2009). [DOI] [PMC free article] [PubMed] [Google Scholar]
- 31.Toivanen R & Shen MM Prostate organogenesis: tissue induction, hormonal regulation and cell type specification. Development 144, 1382–1398 (2017). [DOI] [PMC free article] [PubMed] [Google Scholar]
- 32.Patten DK et al. Enhancer mapping uncovers phenotypic heterogeneity and evolution in patients with luminal breast cancer. Nat. Med 24, 1469–1480 (2018). [DOI] [PMC free article] [PubMed] [Google Scholar]
- 33.Watson CJ & Khaled WT Mammary development in the embryo and adult: a journey of morphogenesis and commitment. Development 135, 995–1003 (2008). [DOI] [PubMed] [Google Scholar]
- 34.Pritchard C et al. Conserved gene expression programs integrate mammalian prostate development and tumorigenesis. Cancer Res 69, 1739–1747 (2009). [DOI] [PubMed] [Google Scholar]
- 35.Takeda DY et al. A somatically acquired enhancer of the androgen receptor is a noncoding driver in advanced prostate cancer. Cell 174, 422–432 e13 (2018). [DOI] [PMC free article] [PubMed] [Google Scholar]
- 36.Viswanathan SR et al. Structural alterations driving castration-resistant prostate cancer revealed by linked-read genome sequencing. Cell 174, 433–447 e19 (2018). [DOI] [PMC free article] [PubMed] [Google Scholar]
- 37.Quigley DA et al. Genomic hallmarks and structural variation in metastatic prostate cancer. Cell 174, 758–769 e9 (2018). [DOI] [PMC free article] [PubMed] [Google Scholar]
- 38.Bhatia-Gaur R et al. Roles for Nkx3.1 in prostate development and cancer. Genes Dev 13, 966–977 (1999). [DOI] [PMC free article] [PubMed] [Google Scholar]
- 39.Dutta A et al. Identification of an NKX3.1-G9a-UTY transcriptional regulatory network that controls prostate differentiation. Science 352, 1576–1580 (2016). [DOI] [PMC free article] [PubMed] [Google Scholar]
- 40.Tsherniak A et al. Defining a cancer dependency map. Cell 170, 564–576 e16 (2017). [DOI] [PMC free article] [PubMed] [Google Scholar]
- 41.Horoszewicz JS et al. LNCaP model of human prostatic carcinoma. Cancer Res 43, 1809–1818 (1983). [PubMed] [Google Scholar]
- 42.Economides KD & Capecchi MR Hoxb13 is required for normal differentiation and secretory function of the ventral prostate. Development 130, 2061–2069 (2003). [DOI] [PubMed] [Google Scholar]
- 43.Gao N et al. The role of hepatocyte nuclear factor-3 alpha (Forkhead Box A1) and androgen receptor in transcriptional regulation of prostatic genes. Mol. Endocrinol 17, 1484–1507 (2003). [DOI] [PubMed] [Google Scholar]
- 44.Hankey W, Chen Z & Wang Q Shaping chromatin states in prostate cancer by pioneer transcription factors. Cancer Res doi: 10.1158/0008-5472.CAN-19-3447 (2020). [DOI] [PMC free article] [PubMed]
- 45.Schumacher FR et al. Association analyses of more than 140,000 men identify 63 new prostate cancer susceptibility loci. Nat. Genet 50, 928–936 (2018). [DOI] [PMC free article] [PubMed] [Google Scholar]
- 46.Cancer Genome Atlas Research Network. The molecular taxonomy of primary prostate cancer. Cell 163, 1011–1025 (2015). [DOI] [PMC free article] [PubMed] [Google Scholar]
- 47.Robinson D et al. Integrative clinical genomics of advanced prostate cancer. Cell 161, 1215–1228 (2015). [DOI] [PMC free article] [PubMed] [Google Scholar]
- 48.Ernst J & Kellis M Chromatin-state discovery and genome annotation with ChromHMM. Nat. Protoc 12, 2478–2492 (2017). [DOI] [PMC free article] [PubMed] [Google Scholar]
- 49.Michailidou K et al. Association analysis identifies 65 new breast cancer risk loci. Nature 551, 92–94 (2017). [DOI] [PMC free article] [PubMed] [Google Scholar]
- 50.Mazrooei P et al. Cistrome partitioning reveals convergence of somatic mutations and risk variants on master transcription regulators in primary prostate tumors. Cancer Cell 36, 674–689 e6 (2019). [DOI] [PubMed] [Google Scholar]
- 51.Morova T et al. Androgen receptor-binding sites are highly mutated in prostate cancer. Nat. Commun 11, 832 (2020). [DOI] [PMC free article] [PubMed] [Google Scholar]
- 52.Zhou S et al. Noncoding mutations target cis-regulatory elements of the FOXA1 plexus in prostate cancer. Nat. Commun 11, 441 (2020). [DOI] [PMC free article] [PubMed] [Google Scholar]
- 53.Waddington CH The strategy of the genes; a discussion of some aspects of theoretical biology, ix, 262 p. (Allen & Unwin, London, 1957). [Google Scholar]
- 54.Goldberg AD, Allis CD & Bernstein E Epigenetics: a landscape takes shape. Cell 128, 635–638 (2007). [DOI] [PubMed] [Google Scholar]
- 55.Tam WL & Weinberg RA The epigenetics of epithelial-mesenchymal plasticity in cancer. Nat. Med 19, 1438–1449 (2013). [DOI] [PMC free article] [PubMed] [Google Scholar]
- 56.Beard J Embryological aspects and etiology of carcinoma. Lancet 159, 1758–1761 (1902). [Google Scholar]
- 57.Markert CL Neoplasia: a disease of cell differentiation. Cancer Res 28, 1908–1914 (1968). [PubMed] [Google Scholar]
- 58.Schaeffer EM et al. Androgen-induced programs for prostate epithelial growth and invasion arise in embryogenesis and are reactivated in cancer. Oncogene 27, 7180–7191 (2008). [DOI] [PMC free article] [PubMed] [Google Scholar]
- 59.Stergachis AB et al. Developmental fate and cellular maturity encoded in human regulatory DNA landscapes. Cell 154, 888–903 (2013). [DOI] [PMC free article] [PubMed] [Google Scholar]
- 60.Gupta PB et al. The melanocyte differentiation program predisposes to metastasis after neoplastic transformation. Nat. Genet 37, 1047–1054 (2005). [DOI] [PMC free article] [PubMed] [Google Scholar]
- 61.Latil M et al. Cell-type-specific chromatin states differentially prime squamous cell carcinoma tumor-initiating cells for epithelial to mesenchymal transition. Cell Stem Cell 20, 191–204 e5 (2017). [DOI] [PMC free article] [PubMed] [Google Scholar]
- 62.Krebs AM et al. The EMT-activator Zeb1 is a key factor for cell plasticity and promotes metastasis in pancreatic cancer. Nat. Cell Biol 19, 518–529 (2017). [DOI] [PubMed] [Google Scholar]
- 63.Sun Y et al. Androgen deprivation causes epithelial-mesenchymal transition in the prostate: implications for androgen-deprivation therapy. Cancer Res 72, 527–536 (2012). [DOI] [PubMed] [Google Scholar]
- 64.Montanari M et al. Epithelial-mesenchymal transition in prostate cancer: an overview. Oncotarget 8, 35376–35389 (2017). [DOI] [PMC free article] [PubMed] [Google Scholar]
- 65.Graham TR et al. Insulin-like growth factor-I-dependent up-regulation of ZEB1 drives epithelial-to-mesenchymal transition in human prostate cancer cells. Cancer Res 68, 2479–2488 (2008). [DOI] [PubMed] [Google Scholar]
- 66.Figiel S et al. Clinical significance of epithelial-mesenchymal transition markers in prostate cancer. Hum. Pathol 61, 26–32 (2017). [DOI] [PubMed] [Google Scholar]
- 67.Morton AR et al. Functional enhancers shape extrachromosomal oncogene amplifications. Cell 179, 1330–1341 e13 (2019). [DOI] [PMC free article] [PubMed] [Google Scholar]
- 68.Gusev A et al. Atlas of prostate cancer heritability in European and African-American men pinpoints tissue-specific regulation. Nat. Commun 7, 10979 (2016). [DOI] [PMC free article] [PubMed] [Google Scholar]
- 69.Lindblad-Toh K et al. A high-resolution map of human evolutionary constraint using 29 mammals. Nature 478, 476–482 (2011). [DOI] [PMC free article] [PubMed] [Google Scholar]
- 70.Yang J et al. Recurrent mutations at estrogen receptor binding sites alter chromatin topology and distal gene expression in breast cancer. Genome Biol 19, 190 (2018). [DOI] [PMC free article] [PubMed] [Google Scholar]
- 71.Mao P et al. ETS transcription factors induce a unique UV damage signature that drives recurrent mutagenesis in melanoma. Nat. Commun 9, 2626 (2018). [DOI] [PMC free article] [PubMed] [Google Scholar]
- 72.Gonzalez-Perez A, Sabarinathan R & Lopez-Bigas N Local determinants of the mutational landscape of the human genome. Cell 177, 101–114 (2019). [DOI] [PubMed] [Google Scholar]
- 73.Fraser M et al. Genomic hallmarks of localized, non-indolent prostate cancer. Nature 541, 359–364 (2017). [DOI] [PubMed] [Google Scholar]
- 74.Jacob F Evolution and tinkering. Science 196, 1161–1166 (1977). [DOI] [PubMed] [Google Scholar]
- 75.Dang CV, Reddy EP, Shokat KM & Soucek L Drugging the ‘undruggable’ cancer targets. Nat. Rev. Cancer 17, 502–508 (2017). [DOI] [PMC free article] [PubMed] [Google Scholar]
- 76.Chen A & Koehler AN Drug discovery. Tying up a transcription factor. Science 347, 713–714 (2015). [DOI] [PubMed] [Google Scholar]
- 77.Morrow JJ et al. Positively selected enhancer elements endow osteosarcoma cells with metastatic competence. Nat. Med 24, 176–185 (2018). [DOI] [PMC free article] [PubMed] [Google Scholar]
- 78.Suva ML, Riggi N & Bernstein BE Epigenetic reprogramming in cancer. Science 339, 1567–1570 (2013). [DOI] [PMC free article] [PubMed] [Google Scholar]
- 79.de The H Differentiation therapy revisited. Nat. Rev. Cancer 18, 117–127 (2018). [DOI] [PubMed] [Google Scholar]
Methods-only References
- 80.Singh AA et al. Optimized ChIP-seq method facilitates transcription factor profiling in human tumors. Life Sci. Alliance 2, e201800115 (2019). [DOI] [PMC free article] [PubMed] [Google Scholar]
- 81.Buenrostro JD, Giresi PG, Zaba LC, Chang HY & Greenleaf WJ Transposition of native chromatin for fast and sensitive epigenomic profiling of open chromatin, DNA-binding proteins and nucleosome position. Nat. Methods 10, 1213–1218 (2013). [DOI] [PMC free article] [PubMed] [Google Scholar]
- 82.Corces MR et al. An improved ATAC-seq protocol reduces background and enables interrogation of frozen tissues. Nat. Methods 14, 959–962 (2017). [DOI] [PMC free article] [PubMed] [Google Scholar]
- 83.Langmead B, Trapnell C, Pop M & Salzberg SL Ultrafast and memory-efficient alignment of short DNA sequences to the human genome. Genome Biol 10, R25 (2009). [DOI] [PMC free article] [PubMed] [Google Scholar]
- 84.Zhang Y et al. Model-based analysis of ChIP-Seq (MACS). Genome Biol 9, R137 (2008). [DOI] [PMC free article] [PubMed] [Google Scholar]
- 85.Langmead B & Salzberg SL Fast gapped-read alignment with Bowtie 2. Nat. Methods 9, 357–9 (2012). [DOI] [PMC free article] [PubMed] [Google Scholar]
- 86.Krueger F & Andrews SR Bismark: a flexible aligner and methylation caller for Bisulfite-Seq applications. Bioinformatics 27, 1571–1572 (2011). [DOI] [PMC free article] [PubMed] [Google Scholar]
- 87.Hansen KD, Langmead B & Irizarry RA BSmooth: from whole genome bisulfite sequencing reads to differentially methylated regions. Genome Biol 13, R83 (2012). [DOI] [PMC free article] [PubMed] [Google Scholar]
- 88.Lawrence M, Gentleman R & Carey V rtracklayer: an R package for interfacing with genome browsers. Bioinformatics 25, 1841–1842 (2009). [DOI] [PMC free article] [PubMed] [Google Scholar]
- 89.Korthauer K, Chakraborty S, Benjamini Y & Irizarry RA Detection and accurate false discovery rate control of differentially methylated regions from whole genome bisulfite sequencing. Biostatistics 20, 367–383 (2019). [DOI] [PMC free article] [PubMed] [Google Scholar]
- 90.Qin Q et al. ChiLin: a comprehensive ChIP-seq and DNase-seq quality control and analysis pipeline. BMC Bioinformatics 17, 404 (2016). [DOI] [PMC free article] [PubMed] [Google Scholar]
- 91.Ramirez F et al. deepTools2: a next generation web server for deep-sequencing data analysis. Nucleic Acids Res 44, W160–W165 (2016). [DOI] [PMC free article] [PubMed] [Google Scholar]
- 92.Hollander M & Wolfe DA Nonparametric statistical methods, xviii, 503 p. (Wiley, New York, 1973). [Google Scholar]
- 93.Siepel A et al. Evolutionarily conserved elements in vertebrate, insect, worm, and yeast genomes. Genome Res 15, 1034–1050 (2005). [DOI] [PMC free article] [PubMed] [Google Scholar]
- 94.Siepel A & Haussler D Combining phylogenetic and hidden Markov models in biosequence analysis. J. Comput. Biol 11, 413–428 (2004). [DOI] [PubMed] [Google Scholar]
- 95.Finucane HK et al. Partitioning heritability by functional annotation using genome-wide association summary statistics. Nat. Genet 47, 1228–1235 (2015). [DOI] [PMC free article] [PubMed] [Google Scholar]
- 96.Marchal C et al. Genome-wide analysis of replication timing by next-generation sequencing with E/L Repli-seq. Nat. Protoc 13, 819–839 (2018). [DOI] [PMC free article] [PubMed] [Google Scholar]
- 97.Gehring JS, Fischer B, Lawrence M & Huber W SomaticSignatures: inferring mutational signatures from single-nucleotide variants. Bioinformatics 31, 3673–3675 (2015). [DOI] [PMC free article] [PubMed] [Google Scholar]
Associated Data
This section collects any data citations, data availability statements, or supplementary materials included in this article.
Supplementary Materials
Data Availability Statement
Further information and requests for resources and reagents should be directed to and will be fulfilled by the Lead Contact, Matthew Freedman (mfreedman@partners.org).
We incorporated all of the epigenomic data generated in this study into a publicly accessible resource for investigators: http://genome.ucsc.edu/cgi-bin/hgTracks?db=hg19&hubUrl=https://de.cyverse.org/anon-files/iplant/home/dfcipc/trackhub/hub.txt
All sequencing data generated for the study has been deposited in GEO (GSE130408).


