Abstract
DNA microarrays enable users to obtain information on differences in transcript abundance on a massively parallel scale. Recently, however, data analyses have revealed potential pitfalls related to image acquisition, variability and misclassifications in replicate measurements, cross-hybridization and sensitivity limitations. We have generated a series of analytical tools to address the manufacturing, detection and data analysis components of a microarray experiment. Together, we have used these tools to optimize performance in an expression profiling study. We demonstrate three significant advantages of the Motorola CodeLink™ platform: sensitivity of one copy per cell, coefficients of variation of 10% in the hybridization signals across slides and across target preparations, and specificity in distinguishing highly homologous sequences. Slides where oligonucleotide probes are spotted in 6-fold redundancy were used to demonstrate the effect of replication on data quality. Lastly, the differential expression ratios obtained with the CodeLink™ expression platform were validated against those obtained with quantitative reverse transcription–PCR assays for 54 genes.
INTRODUCTION
DNA microarrays provide a powerful means to query the relative transcript abundance of many genes in parallel (1–3). Array fabrication can be accomplished using in situ synthesis (4–7) or deposition methods (8,9) and nucleic acids on the array can be either oligonucleotides (10–12) or amplified cDNAs (1,8). Coupled with informatics tools (13,14) the microarray approach provides valuable insights in the areas of target discovery (15), mechanisms of drug action (16,17), genes and pathways involved in various cellular responses and pathophysiologies (18–20), exon mapping (21) and tumor classification (22,23).
When gene sequence information is available, oligonucleotides can be synthesized to hybridize specifically to each gene in the sample, rendering the need for large clone libraries unnecessary. Furthermore, the use of oligonucleotides enables the study and analysis of splice variants (24) and the ability to distinguish between closely related members of gene families. This approach is particularly suited to analyzing the expression profiles of organisms with completely sequenced genomes (25,26) as all predicted genes could be analyzed.
Synthesis of oligonucleotides by in situ methods offers the advantage of having the oligonucleotide synthesized on the support that will be used in the hybridization, obviating the need to hydrolyze the oligonucleotide from its synthetic support and reattach it to the microarray. However, this approach does not allow an independent confirmation of the fidelity of synthesis, nor does it allow purification of the oligonucleotide prior to attachment to the microarray. Covalent attachment of prefabricated oligodeoxyribonucleotides circumvents these restrictions and allows new elements to be added without redesigning the entire microarray. Furthermore, the manufacturability (reproducibility of the synthesis and well-to-well normalization) and ability to QC oligonucleotides by capillary electrophoresis or mass spectroscopy underscores this approach for array fabrication. For these and other reasons, the Motorola platform is based on a cross-linked polyacrylamide substrate which is photocross-linked to a glass slide and which has specific functional groups to which the 5′ end of an oligonucleotide is attached via a hexylamine linker.
During the development of this platform, it became apparent that to better understand each of the processes involved in a typical microarray experiment, it was necessary to design analytical tools for the fabrication, assay and computational aspects of the microarray paradigm. Concurrent with our work, other studies have recently detailed the problems in dealing with microarray data due to such issues as non-uniform spot morphologies, high levels of variance and outliers in microarray data, potential cross-hybridization issues and sensitivity (27–31). Towards addressing some of these issues, our work started by asking several fundamental questions. The first question was whether we were in probe (the nucleic acid on the array) excess? The next question was whether the detection method we employed was a source of variability and whether it demonstrated good linearity, variability and sensitivity. We also wanted to determine the type of hybridization controls that could be developed to define lower limits of detection and non-specific binding. Finally, we wanted to determine the effect of replication on data quality. We have designed novel tools to address these questions and generate process controls for the various steps in a microarray experiment. These tools have been used to optimize performance in an expression profiling study. These development efforts are manifested in the excellent sensitivity, coefficients of variation (CVs) and specificity inherent in our platform. In order to verify that the differential expression ratios obtained from our platform are accurate as well as precise, we have validated 54 of the measurements using real-time quantitative reverse transcription–PCR (RT–PCR).
MATERIALS AND METHODS
Target preparation
Five micrograms of total RNA (BioChain, Hayward, CA) were added to a reaction mix in a final volume of 12 µl, containing bacterial control mRNAs (2.5 pg/µl araB/entF, 8.33 pg/µl fixB/gnd and 25 pg/µl hisB/leuB) and 1.0 µl of 0.5 pmol/µl T7-(dT)24 oligonucleotide primer. The mixture was incubated for 10 min at 70°C and chilled on ice. With the mixture remaining on ice, 4 µl of 5× first-strand buffer, 2 µl 0.1 M DTT, 1 µl of 10 mM dNTP mix and 1 µl Superscript™ II RNase H– reverse transcriptase (200 U/µl) was added to make a final volume of 20 µl, and the mixture incubated for 1 h in a 42°C water bath. Second-strand cDNA was synthesized in a final volume of 150 µl, in a mixture containing 30 µl of 5× second-strand buffer, 3 µl of 10 mM dNTP mix, 4 µl of Escherichia coli DNA polymerase I (10 U/µl) and 1 µl of RNase H (2 U/µl) for 2 h at 16°C. The cDNA was purified using a Qiagen QIAquick purification kit, dried down, and resuspended in IVT reaction mix, containing 3.0 µl nuclease-free water, 4.0 µl 10× reaction buffer, 4.0 µl 75 mM ATP, 4.0 µl 75 mM GTP, 3.0 µl 75 mM CTP, 3.0 µl 75 mM UTP, 7.5 µl 10 mM Biotin 11-CTP, 7.5 µl 10 mM Biotin 11-UTP and 4.0 µl enzyme mix. The reaction mix was incubated for 14 h at 37°C and cRNA target purified using an RNeasy® kit (Qiagen). cRNA yield was quantified by measuring the UV absorbance at 260 nm, and fragmented in 40 mM Tris–acetate (TrisOAc) pH 7.9, 100 mM KOAc and 31.5 mM MgOAc, at 94°C for 20 min. This resulted typically in a fragmented target with a size range between 100 and 200 bases.
Array hybridization
Ten micrograms of fragmented target cRNA was used for hybridization of each UniSet Human I Expression Bioarray chip (Motorola Life Sciences), in 260 µl of hybridization solution containing 78 µl Motorola Hyb buffer component A and 130 µl Motorola Hyb buffer component B. The hybridization solution was heated at 90°C for 5 min to denature the cRNA and chilled on ice. The sample was vortexed for 5 s at maximum speed, and 250 µl injected into the inlet port of the hybridization chamber, placed previously in a Motorola 12-slide shaker tray. The hybridization chamber ports were sealed with 1 cm sealing strips (Motorola Life Sciences), and the shaker tray(s) containing the slides was loaded into a New Brunswick Innova™ 4080 shaking incubator, with the hybridization chambers facing up. Slides were incubated for 18 h at 37°C, while shaking at 300 r.p.m.
Post-hybridization processing using streptavidin-Alexa 647
The 12-slide holder was removed from the Innova™ 4080 shaker, and the hybridization chamber removed off each slide. Each slide was briefly rinsed in TNT buffer (0.1 M Tris–HCl pH 7.6, 0.15 M NaCl, 0.05% Tween-20) at room temperature, and then washed in TNT buffer at 42°C for 60 min. The signal was developed using a 1:500 dilution of streptavidin-Alexa 647 (Molecular Probes), for 30 min at room temperature. Excess dye was removed by washing four times with TNT buffer, for 5 min each, at room temperature. Slides were rinsed in deionized water and dried using a nitrogen gun. Processed slides were scanned using an Axon GenePix Scanner with the laser set to 635 nm, the photomultiplier tube (PMT) voltage to 600 and the scan resolution to 10 µ. Slides were scanned using CodeLink™ Expression Scanning Software (Motorola Life Sciences), and images for each slide analyzed using the CodeLink™ Expression Analysis Software (Motorola Life Sciences).
Post-hybridization processing using the tyramide signal amplification technique
After hybridization, slides were rinsed briefly in TNT buffer as described previously, and washed in TNT buffer at 42°C for 60 min. Slides were blocked in TNB buffer (PE/NEN) for 30 min at room temperature. Each slide was then treated with 400 µl of streptavidin-HRP, diluted 1:200 in TNB, at room temperature for 30 min. Slides were washed three times, for 5 min each, in TNT buffer. Signal was amplified using a 1:200 dilution of tyramide-cy3 (PE/NEN) in amplification diluent buffer (PE/NEN), for 5 min at room temperature. The reaction was stopped and the slides washed three times in TNT buffer for 5 min each at room temperature. Slides were rinsed in deionized water, dried, scanned and analyzed as before.
Motorola CodeLink™ Uniset (10K) streptavidin-Alexa 647 validation using quantitative RT–PCR
The expression levels of 54 human genes were compared within three human poly(A)+ RNA samples (heart lot#A403084, brain lot#A311144 and kidney lot#A404013 from BioChain) using the Motorola CodeLink™ UniSet Human 1 expression bioarrays and the ABI TaqMan® products. cRNA hybridized to 10K expression chips was manually produced from 1 µg of poly(A)+ RNA as described above. All cRNA preparations contained bacterial spikes (entF, leuB, gnd, araB, hisB and fixB) at 1:100K dilutions. The TaqMan® One-Step RT–PCR Master Mix Reagent kit (Perkin Elmer, Boston, MA) was used together with each custom designed primer/probe set to amplify specific regions from each gene (surrounding microarray oligonucleotide regions). TaqMan® primer/probe sets were designed using Primer Express software version 1.0 B6 (Perkin Elmer). Twenty-five microliters of TaqMan® reactions contained 80 pg/µl poly(A)+ RNA, 300 nM forward and reverse primers and 200 nM TaqMan® probe, 12.5 µl of 2× Master Mix without UNG, 0.625 ml MultiScribe and RNase Inhibitor Mix and 6.875 µl RNase-free water. RT–PCR amplification and detection were performed using an ABI Prism 7700 Sequence Detection System for 30 min at 48°C (reverse transcription), 10 min at 95°C (AmpliTaq Gold activation), 40 cycles of denaturation (15 s at 95°C) and anneal/extension (60 s at 60°C). TaqMan® data were analyzed using ABI Prism Sequence detection software version 1.6.3. The resulting amplicons were resolved on an Agilent BioAnalyzer (Agilent Technologies, Palo Alto, CA).
Microarrays
The CodeLink™ platform consists of a glass slide which has been silanized to generate coverage with long-chain alkyl groups. A prepolymer of acrylamide is photo-coupled to the prepared slide, yielding a lightly cross-linked polymer film. An activated ester, which was introduced into the prepolymer, provides the attachment site for C6-amino-oligonucleotides. 5′-Amine-terminated oligonucleotides are deposited onto the polymer using piezoelectric dispensing robots. Oligonucleotides are co-dispensed with a fluorescein-derivative dye, which enables scanning and inspection of every feature element on every slide after the dispensing. To enable the attachment of the oligonucleotide to the polymer to occur, slides are placed in a humidified environment. Non-specific binding or attachment due to the exocyclic amine groups has been found to be negligible when 5′-hydroxyl-terminated oligonucleotides are used. Additional sites are then blocked and slides are washed, rinsed and dried prior to attachment of an integrated, proprietary, polypropylene hybridization chamber.
The UniSet Human I Expression Bioarray (Motorola Life Sciences) used in these experiments contains an array of 9589 probes within a single reaction chamber on a single slide. All oligonucleotide probes are 30 bases long. The 9589 probes represent 9203 unique accession numbers (genes), corresponding to approximately 8935 unique clusters and 386 control probes, selected initially from GenBank Unigene build #125.
RESULTS
Varying probe and target concentrations demonstrate that the CodeLink™ Expression Bioarray platform is operating in probe (nucleic acid on the array) excess
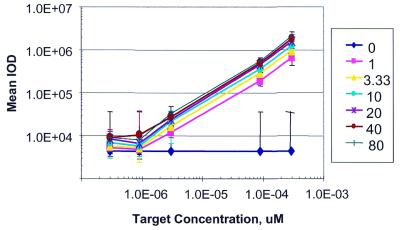
To understand the impact of probe concentration on assay performance, a concentration series of bacterial probes, ranging from 0 to 80 µM, was dispensed on each of several chips. On these ‘probe concentration’ chips, each concentration was printed 20 times per slide. The chips were then used to assay the amounts of a specific cRNA sequence in a complex rat liver cRNA mixture. Specifically, rat liver mRNA was spiked to different mass ratios with different mRNA transcripts, and the biotinylated cRNA target generated. The target was used to hybridize the slides containing a range of probe attachment densities. Following hybridization and washing, the target was detected with streptavidin-Alexa 647. Figure 1 shows the resulting mean integrated optical density (IOD) as a function of the probe concentration present in the microtiter plate well (lines on the graph) and of the target concentration present in solution (x-axis). These data represent a typical example of the set of probes that were examined. For any given concentration of probe, the target-dependent increase in signal is linear for over two orders of magnitude. There was no observed saturation of the probe even at 1 µM concentration of probe and 0.3 nM concentration of target. For our typical manufacturing (20 µM probe concentration) and assay conditions (where a high expresser—100 copies per cell—is equivalent to a solution concentration of ∼0.1 nM), the data demonstrate that the assay is conducted under conditions of probe excess.
Figure 1.
The probe concentration chip: dependence of hybridization intensities on probe and target concentration. The mean IOD is plotted as a function of the target RNA concentration at seven different probe dispense concentrations. Error bars indicate one standard deviation.
The streptavidin-Alexa 647 detection method exhibits excellent sensitivity, linearity and variability
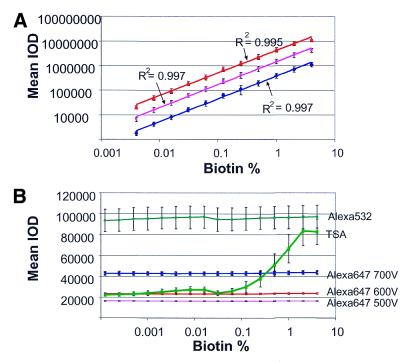
The Motorola CodeLink™ platform is based on the detection of hybridized, biotinylated cRNA to oligonucleotide probes using streptavidin-Alexa 647. We have developed an analytical tool, called a biotinylated probe chip, to monitor the linearity, variability and sensitivity of the detection process. This chip contains unlabeled oligonucleotide probes mixed with their biotinylated counterparts in increasing molar ratios, with the final probe concentration per spot kept constant at 20 µM. Thus, the biotin concentration series is comprised of a set of 16 2-fold dilutions of biotinylated probe mixed with the unlabeled counterpart, generating biotinylated subpopulations ranging from 4 to 0.000122%. Use of this chip enabled us to assess the performance of our assay in a target- and hybridization-independent fashion, as the detection of biotinylated probe could simply be monitored using the streptavidin-Alexa 647 detection assay. The results are shown in Figure 2A, and demonstrate that the streptavidin-Alexa 647 assay is linear across the entire range examined. When the mean IOD is plotted as a function of the percent biotin, excellent linearity (R2 > 0.99) is observed for three logs of signal range from 0.004 to 4% biotin. Saturation was never observed at any of the PMT voltages used. The variability was also quite low, as determined by the standard deviation for each of the data points. Furthermore, the ability to detect even the lowest concentration of biotinylated probe suggests that this detection method will be sensitive to detection of low expressers. This biotinylated probe chip can also be used to monitor the uniformity of the local background as a function of increasing fluorescence to determine whether any pluming or bleed-over of the fluorescence occurs with high expressers. As shown in Figure 2B, the streptavidin-Alexa 647 and 532 conjugates demonstrated a uniform local background while the tyramide signal amplification (TSA) demonstrated an increase in local background where high fluorescence would be obtained. Additionally, we have used this tool to examine other streptavidin-based detection systems and found that some, such as TSA which has been described by the manufacturer as a semi-quantitative assay (32), do not perform as well with respect to linearity while others, such as streptavidin-Alexa 532, do not perform as well with respect to sensitivity (data not shown).
Figure 2.
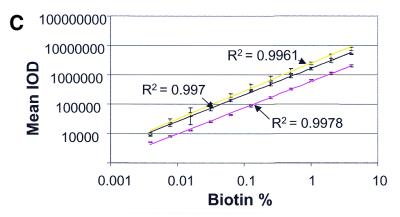
The biotinylated probe chip: linearity, variability, sensitivity and local background uniformity of the detection process. (A) Slides were processed with streptavidin-Alexa 647 and scanned at PMT voltages of 500 (blue line), 600 (pink line) and 700 (red line). Each data point represents the average of 16 replicates per slide. (B) Slides were processed with streptavidin-Alexa 532 (light green line), TSA (dark green line) or streptavidin-Alexa 647 scanned at PMT voltages of 500 (pink line), 600 (red line) and 700 (blue line). The local background was represented by the two-pixel median of each spot on the slide. (C) Slides were processed with streptavidin-Alexa 647 (yellow line), streptavidin-cy3 (black line) or streptavidin-phycoerythrin (pink line) and scanned at a PMT voltage of 600.
As other detection methods are used by alternative array providers (3,10), we examined, in a side-by-side comparison, the performance of streptavidin-Alexa 647, streptavidin-cy3 and streptavidin-phycoerythrin on the biotin chips. We found (Fig. 2C) excellent linearity among all these methods. However, the signal intensities were greater with the former two methods compared with streptavidin-phycoerythrin using these slides and our protocols.
Development of a negative control threshold to define lower limits of detection and non-specific binding
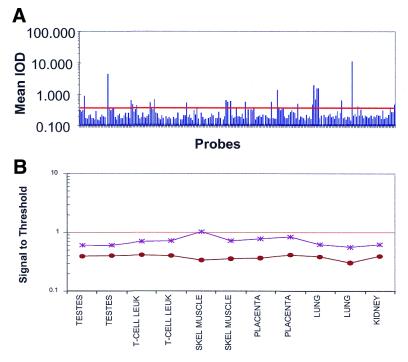
A negative control threshold has been developed in order to assign confidence to what we can call a true signal and what may be considered noise. This threshold consists of approximately 55 bacterial probes (spotted in 4-fold redundancy) that have been designed, FASTA verified and empirically shown not to cross-hybridize to human transcripts. The threshold is determined by calculating the mean negative control value and adding three standard deviations (99.7% confidence). A typical example, using a slide which was hybridized with human liver cRNA, is shown in Figure 3A. High mean IODs could be due to weak cross-hybridization to high expressers or to true hybridization to transcripts not present in the database. A 10% trim of the signals at the high end is generally performed in order to safeguard against these possibilities prior to calculation of the threshold. We have verified that these high intensities are not due to background variance as the background for the untrimmed and trimmed probes is almost identical (a difference of <1%). We have also determined that, over multiple hybridizations, the same set of probes is trimmed each time (data not shown). We explored the universality of such a threshold by examining the typical negative control values from six different sources. Figure 3B shows the mean and median signal-to-threshold ratios of the negative controls in a diverse panel of tissues and cell lines. Because the mean and median do not change significantly, as would be expected if the negative controls are functioning properly and not hybridizing to endogenous human transcripts, we conclude that the use of this set of bacterial probes can be universally applied to indicate a cut-off in a variety of tissues.
Figure 3.
The negative control threshold can be used to define the lower limits of detection. (A) Graph showing mean IOD for negative control probes used to calculate the threshold. Each slide has 216 negative control probes (54 probes in 4× redundancy). Threshold was calculated using 20% trim mean for each slide (10% of the highest signals and 10% of the lowest signals were removed from the probes population) and the remaining probes were used to calculate the threshold. Of the untrimmed population, 9.44% of the negative control probes is above the threshold. The line indicates the threshold as calculated by the mean and three standard deviations. (B) The negative control values are constant in six different samples. The mean (asterisks) and median (circles) negative control values were calculated in six tissues (each tissue was hybridized in duplicate).
Assessment of the performance of the CodeLink™ Expression Bioarray platform
The sensitivity of the Motorola platform has been evaluated using spiking experiments with exogenous bacterial transcripts that are complementary to a set of positive control probes on the array. These elements are different from those that serve as the negative control elements and which are used to generate the negative control threshold. Therefore, the array is comprised of positive controls (which may or may not show signal intensities depending on the presence and level of the exogenous spike) and negative controls.
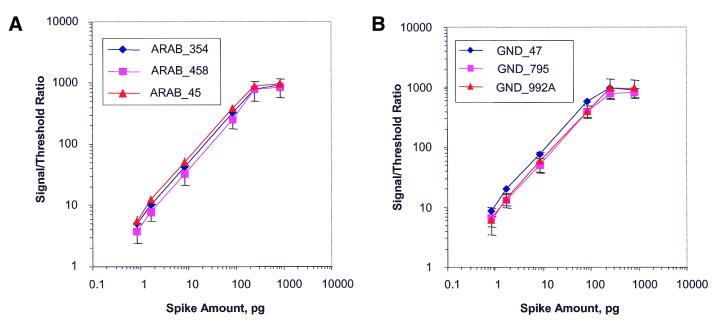
Using this method, the fluorescence after hybridization for each probe when its cognate transcript is spiked into the complex message at a known mass ratio is determined. This value is represented across arrays as a normalized value: the signal intensity divided by the negative control threshold described previously. By spiking at increasing mass ratios, it is possible to determine not only sensitivity but also dynamic range. Each of six different transcripts was spiked into the complex total RNA at mass ratios from 1:6 000 000 [equivalent to 1:300 000 mass ratio to the poly(A)+ RNA assuming that 5% of the population is poly(A)+ RNA] (12) to 1:6000 [equivalent to 1:300 mass ratio to the poly(A)+ RNA]. Each array contains multiple probes designed to detect each bacterial transcript and the data can be examined on an individual probe level. Figure 4A and B show examples of these data for two of the six transcripts, araB and gnd. In this experiment, 24 Uniset Human I slides (four slides per concentration group) were hybridized with human liver cRNA spiked with bacterial transcripts as described above. Each slide has three different probes per bacterial gene, and each probe is represented four times across the slide. As expected, different probes show different signal-to-threshold ratios (due to different affinities) at the same spike level. However, all probes displayed a signal above threshold at the 1:300 000 spike level equivalent (one copy per cell). It should be noted that the mass ratio to copies per cell conversion factor used in this paper is the same as the one used in conducting other oligonucleotide array analyses (3,25) and various serial analysis of gene expression analyses (33) and is more rigorous than the conversion factor of 1:100 000 being equal to one copy per cell used by others (11). This conversion factor is based on early work using nucleic acid renaturation curves (Rot curves) (34). We titrated the sensitivity further using mass ratios of 1:15 000 000, 1:9 000 000, 1:6 000 000 and 1:3 000 000 corresponding to the amount of transcript spiked into 5 µg of total RNA (Fig. 4C and D). Even at these dilutions, the signal-to-threshold ratio of the araB and gnd probes was found to be greater than that of the negative control threshold (0.5).
Figure 4.
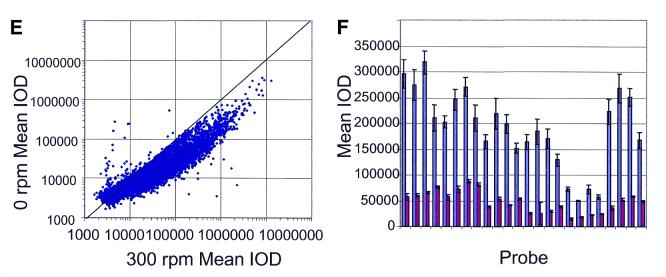
(A–D) Sensitivity and dynamic range. Nine exogenous bacterial transcripts were spiked into the complex mRNA from human liver, each at increasing concentrations [bacterial RNA:total human liver RNA as 1:6000, 1:20 000, 1:60 000, 1:600 000, 1:3 000 000, 1:6 000 000 in (A) and (B) and 1:3 000 000, 1:6 000 000, 1:9 000 000 and 1:15 000 000 in (C) and (D)]. The signal:threshold ratio was determined by dividing the fluorescence for each bacterial positive control probe by the negative control threshold. The data for the araB (A) and gnd (B) transcripts are shown. In each case, there were three bacterial control probes designed to hybridize to each transcript. (E and F) The effect of mixing during hybridization. (E) The average signal intensities with (x-axis) and without (y-axis) mixing were plotted for all probes (approximately 9300). The bowing shows the enhanced signal intensities with mixing. (F) Signal intensities from 24 positive bacterial control probes (x axis) when their complementary transcripts were spiked into the total RNA at a mass ratio of 1:2 000 000. The first bar in each pair represents the signal intensity obtained with mixing and the second bar in each pair represents the signal intensity obtained without mixing.
The dynamic range is linear for over two orders of magnitude, although the signal intensity appears to saturate near the highest spike concentration (equivalent to a 1:300 mass ratio). Finally, there is a transcript concentration-dependent increase in the signal intensity, (i.e. a 10-fold increase in concentration results in approximately 10 times more signal). Similar data have been generated with the other bacterial probes and transcripts (data not shown). We believe that this robust and reproducible sensitivity and good dynamic range are the result of the optimization of the platform and assay that has occurred through the use of the analytical tools developed and described earlier.
We also believe that these achievements have come about because two additional issues in microarray performance, two-dimensional and three-dimensional diffusion (35), have been addressed through the use of cRNA fragmentation and mixing during the course of the hybridization reaction, respectively. To demonstrate the effect of the vigorous shaking and mixing during the hybridization, we performed an experiment to demonstrate the increased fluorescence intensities and sensitivity of the array hybridization with and without mixing. Figure 4E shows the significant enhancement of signal intensity along the entire signal range (approximately 9500 probes) when mixing is employed (the average increase was 3.1 ± 5.6). Figure 4F shows the increase in signal intensity reported by the positive bacterial control probes when their complementary transcripts are spiked into the total RNA at a mass ratio of 1:2 000 000 (the average increase was 4.2 ± 1.4).
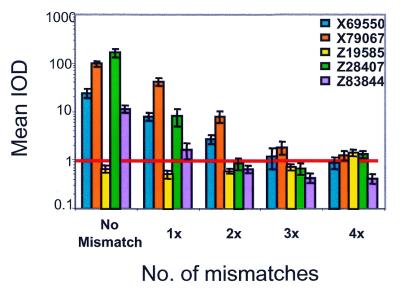
The specificity (ability to distinguish sequences up to a certain homology) of the platform has been examined by introducing one or more mismatches in the center of each of five oligonucleotide probes. The reduction in the signal intensity for that particular transcript is then determined after hybridization as each probe is designed to hybridize to a separate human transcript in the cRNA. Figure 5 shows the hybridization data obtained after hybridization with human liver cRNA. The perfect match (no mismatch to the endogenous transcript) probes showed varying mean IODs in this and other tissues. The single mismatch probe (1×) showed variable decreases relative to its parent sequence with effects varying from ∼2–20-fold. This variation is due presumably to the effect of flanking sequences. In most cases, the triple mismatch versions of these probes showed intensities which were either at or below the negative control threshold. In one instance (probe X70967) the signal intensity of the triple mismatch was marginally greater than the negative control threshold, but was still <5% of the total signal displayed by the perfect match, possibly because of cross-hybridization with human target. We therefore are able to distinguish sequences with up to 90% homology in sequence. Similar results have been obtained with cRNA targets generated from other tissues like human skeletal muscle and placenta (data not shown). This specificity compares favorably with published data using ink jet-fabricated arrays (11) where the number of mismatches required to reduce hybridization intensities to near background levels was found to be 12–18 for a 60mer oligonucleotide array. The ability to distinguish a small number of mismatches between highly homologous genes or exons has implications on probe design, experimental design and data output, and provides an important advantage over cDNA and 60mer oligonucleotide arrays.
Figure 5.
Specificity of the CodeLink™ Expression Bioarray platform. Specificity was determined by introducing one (1×), two (2×), three (3×) or four (4×) adjacent mismatches into the middle of a probe and determining fluorescence associated with the perfect match (no mismatch) and each of its mismatch probes. This analysis was performed for five probe sets after hybridization with cRNA generated from human liver total RNA. Each mismatch probe has four repeats across the slide. The line represents threshold.
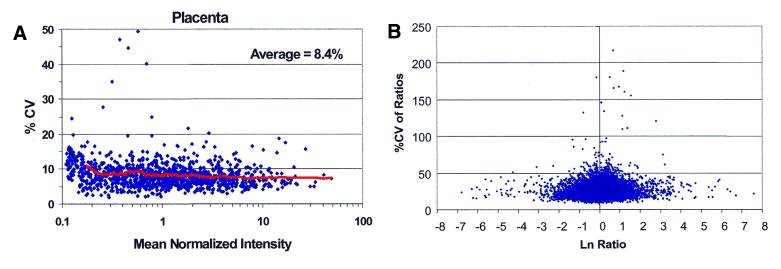
Variability in array data can be assessed in a number of ways. CVs, correlation coefficients and percent of data points within 2-fold when two replicates are compared (minimal detectable fold change) are methods currently employed in our laboratory. When hybridizations are performed across separate arrays, a CV for each probe across the replicates can be calculated. Furthermore, to measure and include the variability from the target preparation, different cRNA preparations from the same starting total RNA can be hybridized across arrays. Figure 6A shows an example of such an experiment. This experiment was performed as follows. The same sample of total RNA was divided into three aliquots of 5 µg each. Each aliquot was then used to generate a cRNA target. Each cRNA target was then hybridized in duplicate for a total of six hybridizations (three cRNA targets times two replicates each). We have graphed the percent CV of all data points and plotted as a function of the mean normalized intensity. Of note, the majority of the CVs are <20% and the average CV was 8.4%. Significantly, the variance observed at the low signal intensities was not increased compared with that seen at the high signal intensities, suggesting that the cDNA and amplification steps do not increase the variance for low and rare expressors. The data are consistent with other data we have obtained from many other tissues where multiple cRNA preparations were generated from the same total RNA sample and hybridized across arrays. In every case, the variance was low and constant throughout the entire signal range (data not shown). We have examined, in more detail, the target preparation process with respect to its linearity and variability separately (D.Dorris, R.Ramakrishnan, D.Trakas, F.Dudzik, R.Belval, C.Zhao, A.Nguyen, M.Domanus and A.Mazumder, submitted for publication). The data for every single probe are included in Figure 6A and B, with no data culling. Average CVs in the hybridization signals are typically observed in the 7–12% range. The data also compare favorably with data generated using the 60mer oligonucleotide platform where, using the in situ system, CVs in the intensities were observed to be in the 30–100% range with a mode of ∼70% (11).
Figure 6.
Variability of the CodeLink™ Expression Bioarray platform. (A) Variability (CV) in the normalized hybridization signals across three target preps generated from placenta and six slides was plotted as a function of the mean normalized intensity. A trend line that represents the moving average of 50 probes is shown. (B) Variability in the differential expression ratios. CV of the differential expression ratio is plotted as a function of the natural logarithm of the ratio for an experiment examining heart and placenta.
Having demonstrated that the target preparation process contributes negligible variance to the overall reproducibility of the platform, we chose to analyze the assay variability in more detail. As the ultimate output from an expression profiling experiment is the ratios, the variability in the ratios was also examined. The percent CVs in the differential expression ratios were plotted as a function of the natural logarithm of the ratio as shown in Figure 6B. In this particular experiment, only one cRNA preparation was generated from each tissue (in contrast to the experiment presented in Fig. 6A). The data in Figure 6B were generated in an experiment where cRNA was generated from placenta and from heart tissue and differential expression ratios were calculated. Figure 6B shows low CVs in the ratios throughout the entire signal range. Significantly, the range observed in the ratios is primarily from –2.5 to +2.5 on the natural log scale. This range is much larger than that observed when the similar experiment was performed using a cDNA array by the Incyte group (36) where the range extended from primarily –1.5 to +1.5 on the natural log scale. Therefore, there appears to be compression in the range of the ratios with the cDNA arrays. This compression was also observed when comparing our data to those generated using filter-based, cDNA arrays where radioactive detection was employed (data not shown). Once again, we believe that this low variability results from the optimization of the assay that has occurred through the use of the analytical tools developed and described earlier (e.g. the biotin probe chips which were used to choose a detection system with inherently low variability) as well as other analytical tools used in the target preparation process (D.Dorris, R.Ramakrishnan, D.Trakas, F.Dudzik, R.Belval, C.Zhao, A.Nguyen, M.Domanus and A.Mazumder, submitted for publication).
Replication increases data quality
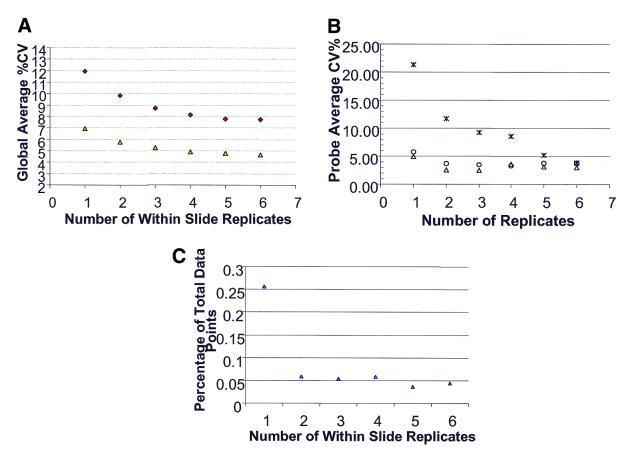
In order to examine how significantly replication increases data quality, an additional analytical tool was developed: the ‘high redundancy’ chip where each of the 1146 probes is spotted in 6-fold redundancy. This chip allowed us to investigate the effect of replication on the CVs in the hybridization signals. For example, if the same cRNA was hybridized to three separate slides and only one of the six replicates (on each slide) for each probe was used for each of three slides, the CV across three slides could be calculated using three data points. This process could be repeated an additional five times with a different data point on each slide to obtain a total of six CVs. However, if two replicates (chosen randomly) on each slide were first averaged and then a CV across three slides was calculated, the effect of replication using a value of n = 2 per slide could be examined. This process could be repeated using three or more replicates (chosen randomly) on each slide and averaging the replicates prior to calculating the CV (across the three slides) of the mean values. Again, each process could be repeated using a different set of two or more data points per slide to obtain a total of six CVs. For all of the probes or for a particular probe, the change in CV as a function of the number of replicates averaged (or not) prior to the CV calculation could be queried. A typical example is shown in Figure 7. Clearly, the global average percent CV for all 1146 probes improves when three replicates per slide are present and averaged prior to calculating the CV across slides (Fig. 7A). Although the CV shows modest improvement upon averaging four or more replicates, the majority of the improvement occurs with just three replicates. For two different experiments, representing the use of different slide batches and different target preps, the trend is the same. However, the two lines do not converge at the same low CV level when five or six replicates are used, implying some experiments have inherently higher variability. This global trend of replication enhancing data quality appears to be true when individual probes representing a low, medium and high expresser are examined (Fig. 7B). However, Figure 7B also shows the differential effect on low versus medium and high expressers. The number of replicates needed to enhance data quality is higher for the low expressers than for the medium and high expressers. The data suggest that replication may be even more essential when small changes in low expressers will be examined. Lastly, the effect of replication on outliers (false positives and false negatives) is shown in Figure 7C. The data show that spotting and averaging two or three replicates per slide can also decrease the number of outliers in a microarray experiment. As is evident from the data, replication can enhance data quality by minimizing the effect of outlier data and reducing CVs.
Figure 7.
The effect of replication on data quality. (A) Using the high redundancy chip, a CV in the hybridization signal for each probe was calculated by taking one data point per slide across three slides or by first averaging two or more data points within a slide and then calculating the CV across three slides. This calculation was then repeated five times using a different data point or set of data points within each slide to obtain a total of six CVs, which were then averaged to obtain one CV value for each probe. Note that this iterative process is not possible with the six replicates within a slide. The global average CV was calculated by determining the CV for each of the 1146 probes and averaging all of these numbers to generate one number. Thus, for the one to five replicates within a slide, the global average CV is the average of six combinations/probe × 1146 probes = 7876 CVs. The global average CV was then plotted as a function of the number of within slide probe replicates. (B) The same analysis presented in (A) was performed with the exception that only three probes were used in the calculations. One probe represented a low expresser (asterisks), one probe represented a medium expresser (circles) and one probe represented a high expresser (triangles). The individual probe average CV (average of six CVs) was then plotted as a function of the number of within slide probe replicates. (C) The number of misclassifications (false positives and false negatives) was plotted as a function of the number of within slide replicates. Again, hybridization signals across three slides were examined. The term misclassification was used if a hybridization signal on a particular slide was >2-fold from the median value for that probe. As in (A), the total number of data points for the one to five within slide replicates was 7876. The total number of outliers generated in the six different comparisons (taking six different data points or sets of data points within each slide) was divided by 7876 to generate the y-axis values.
Validation of relative transcript levels with real-time quantitative RT–PCR assays
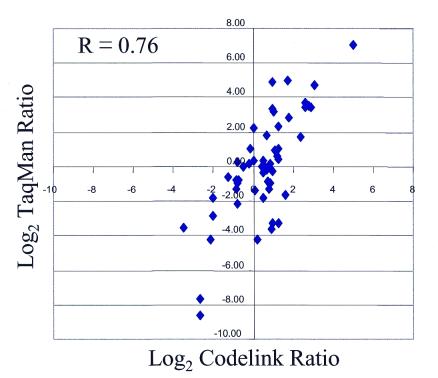
As a preliminary validation that our platform generates not only precise but also accurate answers, differential expression ratios from our platform were compared with those obtained using quantitative RT–PCR (TaqMan® assay). This comparison was performed for a set of 54 genes. The same sample of RNA was used for both the arrays and for the TaqMan®. However, the actual sequence of the oligonucleotide on the array was not identical to that of the TaqMan® probe although, in the majority of cases, the probes did overlap. There were a few cases where no change could be assigned to the gene expression level in one of the systems. For the entire data set of 54 genes, there was a good correlation (correlation coefficient of 0.76) in the change reported by both systems (Fig. 8). In this particular experiment, the slope of the regression line is 1.4, suggesting ratio compression on the CodeLink™ platform compared with TaqMan®. Therefore, depending on the genes being examined, the CodeLink™ platform may generate ratios which do not have the same magnitude as those of TaqMan® although the trends (up- or down-regulation) are usually in good agreement.
Figure 8.
Correlation of differential expression ratios with TaqMan®. The log2 of the differential expression ratio obtained with TaqMan® when heart and brain were compared was plotted on the y-axis versus the log2 of the ratio obtained with the CodeLink™ Expression Bioarray platform using the same RNAs on the x-axis. The correlation coefficient (R = 0.76) was based on all 54 genes.
DISCUSSION
Analytical tools can be used to optimize a microarray platform
In this study, the issue of reliability in microarray measurements has been approached by designing new tools with which one can address questions such as probe excess, detection methods, hybridization controls and specificity, and replication. In order to generate linearity in the dynamic range, it is essential to perform the expression assays in probe (nucleic acid on the array) excess. Using the probe concentration chip as an analytical tool, it was verified that, over a large probe concentration range, our platform generated a linear, target concentration-dependent increase in the hybridization signal. The ability to operate in probe excess is also a testament to the robust attachment chemistry in the Motorola CodeLink™ platform. A recent study that compared six different covalent attachment schemes found the attachment chemistry used in the Motorola CodeLink™ platform to be the best (37). Therefore, a combination of chemistry and array fabrication, using the probe dispense concentrations determined by the analytical tool shown in Figure 1, has contributed to achieving a broad dynamic range in the Motorola expression assay. The design of this analytical chip has also enabled the investigation of oligonucleotide hybridization kinetics and thermodynamics on a more fundamental level. The value of such studies and their inevitable impact on microarray performance has been recognized recently by several groups (34,38,39).
Various detection schemes are available for use with microarrays. The incorporation of biotin, followed by a streptavidin-based detection scheme, has several advantages. First, biotin-labeled nucleotides are efficient substrates for many DNA and RNA polymerases. Secondly, cDNAs or cRNAs containing biotinylated nucleotides have denaturation, re-association and hybridization parameters similar to those of unlabeled counterparts (40). Thirdly, the effect on yield of cDNA and cRNA can be less than that seen when cyanine dyes are incorporated into nucleic acids (data not shown). The choice of the streptavidin-fluorophore should then be based upon linearity, reproducibility, local background and sensitivity. A second analytical tool, the biotin probe chip, was therefore designed and constructed with these measurements in mind. This tool is able to measure each of these characteristics and quantitatively determines the optimal detection method in a target- and hybridization-independent manner. The use of this tool has contributed to achieving a sensitivity of one copy per cell and CVs in the hybridization signals in the 7–12% range.
The design of a set of negative controls was used to optimize stringency in the hybridization and washing as well as to define a cut-off to be used in deciding which values may need to be annotated in ratio calculations. As a result of the low variance in the microarray data observed even with low expressers (Fig. 6A), the use of such a computational threshold generates a level of confidence that even low signals are sufficiently distinct from background noise or non-specific binding. The use of a negative control threshold has also been reported in another oligonucleotide array platform (41). That study also advocated the use of such a tool to discern specific hybridization from other events, which may generate signals on an array. The data presented in this manuscript demonstrate the utility of a negative control threshold in eukaryotic gene expression profiling.
The specificity of oligonucleotide arrays, coupled with probe concentration, generates a larger range in the differential expression ratios
Our data (Fig. 6B), as well as that of others (11), have demonstrated that oligonucleotide arrays show a greater dynamic range in the reported differential expression ratios, both in general as well as in the case of members of gene families. One possibility for this difference is the lack of cross-hybridization with oligonucleotide arrays. Data from our platform (Fig. 5) indicate 30mer probes have the ability to distinguish up to 90% sequence homology. Data from another oligonucleotide platform have demonstrated the ability to distinguish up to 93% sequence homology (10). In contrast to cDNAs, which can distinguish up to ∼80% sequence homology (42), cross-hybridization occurrences with oligonucleotide probes are less frequent. Therefore, if only one member of the gene family is significantly differentially regulated under certain conditions, the ratio reported by oligonucleotides designed toward that particular gene may more accurately reflect the change in expression whereas the cDNA element may reflect a weighted average of changes in differential expression for that gene and others to which it cross-hybridizes (which may or may not demonstrate changes in expression). A second possible explanation for the larger range in expression ratios found with oligonucleotide arrays was presented by the Incyte group (36). Their study showed that the amount of PCR product arrayed can affect the differential expression ratios. Concentrations of >100 ng/µl (∼160 nM assuming a 1 kb amplicon) were found to result in a compression of the observed differential expression ratio. Thus, the ability to dispense (and have accessible for hybridization) a larger concentration on oligonucleotide arrays may also contribute to the larger range observed in differential expression ratios. Comparison studies are currently in progress to examine the dynamic range generated among various oligonucleotide array platforms. Preliminary data show good correlations and a slope of one (data not shown).
Replication is essential to increase data quality
Recently, a multitude of studies have emerged in the literature detailing the effect of poor spot quality, image acquisition issues and replication on microarray data quality (27–31). A fourth analytical tool we have developed, the high redundancy chip, was designed to examine the effect of having probes spotted in redundancy on both CVs and outliers. We have found (Fig. 7) that a 3-fold redundancy can greatly improve data quality by providing most of the maximal possible benefit of replication. We note, however, that there is clearly a stronger effect of replication on low expressers. The former conclusion is in agreement with earlier studies, which demonstrated the effect of replication (27,28). Those studies found that using three replicates (across three slides) or a 4-fold redundancy on each slide was desirable for enhancing data quality. However, unlike those studies, we have demonstrated the value of up to six probe replicates, have demonstrated the effect on both CVs and outliers, have demonstrated the effect at various expression levels and have examined a larger set of genes than was examined in both previous studies. The averaging scheme and analysis presented in this manuscript are not meant to serve as alternative, statistically rigorous methods for variance analysis. They do, however, demonstrate that, given the choice between higher gene density and probe (gene) spotting redundancy, the latter method may enhance data quality. Additionally, when a particular gene is present at multiple feature elements, the ability to perform an outlier analysis, excluding data from elements which are not in agreement with the other replicate spots for that gene, can be a powerful method to reduce variance. For example, we have found that including data from missing signals can increase the percent CV by 2–10-fold, depending on the number of replicates being examined and on the signal intensities (data not shown). The data underscore the necessity of monitoring the dispensing process to ensure that every location on the array indeed receives the probe which was intended for that location. We feel the examination of replication with the current analytical tool will be a fruitful area of research and will improve microarray performance from both the design and analysis perspectives in the future. Significantly, the CodeLink™ Expression Bioarray platform offers the ability to customize chips by introducing varying numbers of probe replicates per slide in order to maximize data quality, depending on the outcome of these and other studies.
Features of the Motorola platform
There are several features of the Motorola CodeLink™ arrays which distinguish it from other commercial platforms. First, a three-dimensional surface, in our case the polyacrylamide matrix, has a larger number of potential attachment sites than modified glass (43–45). In fact, Stillman and Tonkinson (43) have shown higher specific hybridization signals on a three-dimensional surface compared with glass. The covalent attachment chemistry used in conjunction with our polymeric surface has also been found to be superior compared with other attachment chemistries (37). Lastly, we have found that the lower cross-linking currently used to generate our matrix generates higher hybridization signals than higher cross-linked matrices (data not shown), presumably due to more favorable hybridization conditions (i.e. larger pores for probe–target interactions, more conformational flexibility and better probe accessibility). We believe this combination of factors is important in achieving a high sensitivity platform. Does our three-dimensional surface offer solution phase hybridization kinetics and thermodynamics? As expected, we have found that a mismatch in the middle of our oligonucleotide probes can have a dramatic impact on the hybridization intensity (Fig. 5). Because the oligonucleotides are 30mers, the mismatch is approximately 15 bases from the attachment site (to the surface). In contrast, recent data from in situ synthesized 60mer oligonucleotide arrays (11) have shown that the presence of five mismatches does not have an appreciable effect until they are present approximately 30 bases away from the site of surface attachment. The data suggest that part of the 60mer may be acting solely as a linker to remove the ‘target binding domain’ away from the solid support. We are currently evaluating how close the mismatch can be moved to the site of attachment on our platform and correlating thermodynamic data on our surface to that obtained in solution to determine whether our surface may mimic solution hybridization better than solid supports currently do.
A second distinguishing feature of our platform is the use of presynthesized oligonucleotides. Because these oligonucleotides are synthesized using standard phosphoramidite chemistry, average stepwise couplings and overall yields are quite high. Incorporation of amine groups at the 5′ end of oligonucleotides can serve as a pseudo-purification step because (i) only full-length oligonucleotides will receive the 5′-amino group and (ii) non-specific adsorption of oligonucleotides without terminal amines is negligible. Therefore, the only oligonucleotides that attach to the matrix efficiently are those which are attached via their 5′ ends. This scenario generates full-length oligonucleotides at each feature element in contrast to in situ synthesis protocols, which can generate large amounts of failure sequences depending upon the stepwise coupling efficiency and the length of the oligonucleotide. Furthermore, because the oligonucleotides are synthesized prior to attachment to the solid support, they can be analytically interrogated by capillary electrophoresis and mass spectroscopy for purity and sequence confirmation.
A third distinguishing feature of our platform is the probe prototyping. Our final chip design employs one oligonucleotide per gene. This scenario is successful because we prototype three oligonucleotides per gene and screen them against a panel of tissues for hybridization signal intensity and ability to report transcript changes. Therefore, the probe present on the final commercial chip has been empirically tested prior to its attachment on the array.
A fourth distinguishing feature of our platform is the use of single-color detection rather than dual-color, ratio-based reporting of expression changes. The two-color approach offers several advantages. Using this approach, hybridization of two samples is performed on the same slide, eliminating the possibility that different spot morphologies, probe amounts or inconsistencies in the hybridization could alter the ratio. Secondly, the PMT voltages can be adjusted in different channels to equalize intensity values on each slide. Thirdly, CVs in ratios are typically lower than CVs of raw hybridization signals (11). However, the two-color approach also has disadvantages. For example, different fluorescently labeled nucleotides may be incorporated with different frequencies (46), altering the ratio due to enzymatic parameter rather than transcript abundance. Secondly, multiple experiment comparisons are not possible without replicating the reference sample (which, in some cases, may be difficult to obtain). Thirdly, spectral overlap between dyes can complicate instrumentation or algorithms used in analysis. Fourthly, executing signal amplification schemes in two colors is more complex than in single-color because multiple haptens are required.
In summary, we have developed a series of analytical tools to address the fabrication, detection and data analysis components of a microarray experiment. Together, we have used these tools to query and optimize performance in an expression profiling study. These tools have enabled the Motorola platform to generate a sensitivity of one copy per cell, a broad linear dynamic range, CVs of 10% in the hybridization signals across slides and across target preparations, specificity in distinguishing highly homologous sequences and good correlations with independent profiling methods. We believe the design of future analytical tools to address variability in the target preparation and in the hybridization process will further enhance data quality and performance in a microarray experiment. Lastly, we have demonstrated the value of probe replication in the fabrication of microarrays and will continue to investigate advantages and implications of replication in the experimental design and data analysis.
NOTE ADDED IN PROOF
Subsequent assays from our laboratory, involving spiking in six different bacterial transcripts into human poly(A)+ RNA at different mass ratios, have shown that the sensitivity of our platform is actually 1:900 000. This is actually higher than the implied sensitivity of 1:750 000 mass ratio to the poly(A)+ RNA demonstrated in this paper, calculated by spiking into complex total RNA.
Acknowledgments
ACKNOWLEDGEMENTS
We would like to thank Drs Bill Coty, Luis Allegri and Travis Johnson for their helpful insight and advice during the course of this work.
REFERENCES
- 1.Brown P.O. and Botstein,D. (1999) Exploring the new world of the genome with DNA microarrays. Nature Genet., 21 (Suppl. 1), 33–37. [DOI] [PubMed] [Google Scholar]
- 2.Young R.A. (2000) Biomedical discovery with DNA arrays. Cell, 102, 9–15. [DOI] [PubMed] [Google Scholar]
- 3.Lockhart D.J. and Winzeler,E.A. (2000) Genomics, gene expression and DNA arrays. Nature, 405, 827–836. [DOI] [PubMed] [Google Scholar]
- 4.Fodor S.P.A., Read,J.L., Pirrung,M.C., Stryer,L., Lu,A.T. and Solas,D. (1991) Light-directed, spatially addressable parallel chemical synthesis. Science, 251, 767–773. [DOI] [PubMed] [Google Scholar]
- 5.Maskos U. and Southern,E.M. (1992) Oligonucleotide hybridizations on glass supports: a novel linker for oligonucleotide synthesis and hybridization properties of oligonucleotides synthesized in situ. Nucleic Acids Res., 20, 1679–1684. [DOI] [PMC free article] [PubMed] [Google Scholar]
- 6.Singh-Gasson S., Green,R.D., Yue,Y., Nelson,C., Blattner,F., Sussman,M.R. and Cerrina,F. (1999) Maskless fabrication of light-directed oligonucleotide microarrays using a digital micromirror array. Nat. Biotechnol., 17, 974–978. [DOI] [PubMed] [Google Scholar]
- 7.LeProust E., Zhang,H., Yu,P., Zhou,X. and Gao,X. (2001) Characterization of oligonucleotide synthesis on glass plates. Nucleic Acids Res., 29, 2171–2180. [DOI] [PMC free article] [PubMed] [Google Scholar]
- 8.Schena M., Shalon,D., Davis,R.W. and Brown,P.O. (1995) Quantitative monitoring of gene expression patterns with a complementary DNA microarray. Science, 270, 467–470. [DOI] [PubMed] [Google Scholar]
- 9.O’Donnell-Maloney M.J., Smith,C.L. and Cantor,C.R. (1996) The development of microfabricated arrays for DNA sequencing and analysis. Trends Biotechnol., 14, 401–407. [DOI] [PubMed] [Google Scholar]
- 10.Lipshutz R.J., Fodor,S.P.A., Gingeras,T.R. and Lockhart,D.J. (1999) High density synthetic oligonucleotide arrays. Nature Genet., 21 (Suppl. 1), 20–24. [DOI] [PubMed] [Google Scholar]
- 11.Hughes T.R., Mao,M., Jones,A.R., Burchard,J., Marton,M.J., Shannon,K.W., Lefkowitz,S.M., Ziman,M., Schelter,J.M., Meyer,M.R., Kobayashi,S., Davis,C., Dai,H., He,Y.D., Stephaniants,S.B., Cavet,G., Walker,W.L., West,A., Coffey,E., Shoemaker,D.D., Stoughton,R., Blanchard,A.P., Friend,S.H. and Linsley,P.S. (2001) Expression profiling using microarrays fabricated by an ink-jet oligonucleotide synthesizer. Nat. Biotechnol., 19, 342–347. [DOI] [PubMed] [Google Scholar]
- 12.Kane M.D., Jatkoe,T.A., Stumpf,C.R., Lu,J., Thomas,J.D. and Madore,S.J. (2000) Assessment of the sensitivity and specificity of oligonucleotide (50mer) microarrays. Nucleic Acids Res., 28, 4552–4557. [DOI] [PMC free article] [PubMed] [Google Scholar]
- 13.Bassett D.E. Jr, Eisen,M.B. and Boguski,M.S. (1999) Gene expression infomatics—it’s all in your mine. Nature Genet., 21 (Suppl. 1), 51–55. [DOI] [PubMed] [Google Scholar]
- 14.Quackenbush J. (2001) Computational analysis of microarray data. Nature Rev. Genet., 2, 418–427. [DOI] [PubMed] [Google Scholar]
- 15.Heller R., Schena,M., Chai,A., Shalon,D., Bedilion,T., Gilmore,J., Woolley,D.E. and Davis,R.W. (1997) Discovery and analysis of inflammatory disease-related genes using cDNA microarrays. Proc. Natl Acad. Sci. USA, 94, 2150–2155. [DOI] [PMC free article] [PubMed] [Google Scholar]
- 16.Marton M.J., DeRisi,J.L., Bennett,H.A., Iyer,V.R., Meyer,M.R., Roberts,C., Stoughton,R., Burchard,J., Slade,D., Dai,H., Bassett,D.E.,Jr, Hartwell,L.H., Brown,P.O. and Friend,S.H. (1998) Drug target validation and identification of secondary drug target effects using DNA microarrays. Nature Med., 4, 1293–1301. [DOI] [PubMed] [Google Scholar]
- 17.Huang P., Feng,L., Oldham,E.A., Keating,M.J. and Plunkett,W. (2000) Superoxide dismutase as a target for the selective killing of cancer cells. Nature, 407, 390–395. [DOI] [PubMed] [Google Scholar]
- 18.Iyer V.R., Eisen,M.B., Ross,D.T., Schuler,G., Moore,T., Lee,J.C.F., Trent,J.M., Staudt,L.M., Hudson,J.,Jr, Boguski,M.S., Lashkari,D., Shalon,D., Botstein,D. and Brown,P.O. (1999) The transcriptional program in the response of human fibroblasts to serum. Science, 283, 83–87. [DOI] [PubMed] [Google Scholar]
- 19.Perou C.M., Sorlie,T., Eisen,M.B., van de Rijn,M., Jeffrey,S.S., Rees,C.A., Pollack,J.R., Ross,D.T., Johnsen,H., Akslen,L.A., Fluge,O., Pergamenschikov,A., Williams,C., Zhu,S.X., Lonning,P.E., Borresen-Dale,A.-L., Brown,P.O. and Botstein,D. (2000) Molecular portraits of human breast tumors. Nature, 406, 747–752. [DOI] [PubMed] [Google Scholar]
- 20.Bittner M., Meltzer,P., Chen,Y., Jiang,Y., Seftor,E., Hendrix,M., Radmacher,M., Simon,R., Yakhini,Z., Ben-Dor,A., Sampas,N., Dougherty,E., Wang,E., Marincola,F., Gooden,C., Lueders,J., Glatfelter,A., Pollock,P., Carpten,J., Gillanders,E., Leja,D., Dietrich,K., Beaudry,C., Berens,M., Alberts,D., Sondak,V., Hayward,N. and Trent,J. (2000) Molecular classification of cutaneous malignant melanoma by gene expression profiling. Nature, 406, 536–540. [DOI] [PubMed] [Google Scholar]
- 21.Shoemaker D.D., Schadt,E.E., Armour,C.D., He,Y.D., Garrett-Engele,P., McDonagh,P.D., Loerch,P.M., Leonardson,A., Lum,P.Y., Cavet,G., Wu,L.F., Altschuler,S.J., Edwards,S., King,J., Tsang,J.S., Schimmack,G., Schelter,J.M., Koch,J., Ziman,M., Marton,M.J., Li.,B., Cundiff,P., Ward,T., Castle,J., Krolewski,M., Meyer,M.R., Mao,M., Burchard,J., Kidd,M.J., Dai,H., Phillips,J.W., Linsley,P.S., Stoughton,R., Scherer,S. and Boguski,M.S. (2001) Experimental annotation of the human genome using microarray technology. Nature, 409, 922–927. [DOI] [PubMed] [Google Scholar]
- 22.Alizedah A.A., Eisen,M.B., Davis,R.E., Ma,C., Lossos,I.S., Rosenwald,A., Boldrick,J.C., Sabet,H., Tran,T., Yu,X., Powell,J.I., Yang,L., Marti,G.E., Moore,T., Hudson,J.,Jr, Lu,L., Lewis,D.B., Tibshirani,R., Sherlock,G., Chan,W.C., Greiner,T.C., Weisenburger,D.D., Armitage,J.O., Warnke,R., Levy,R., Wilson,W., Grever,M.R., Byrd,J.C., Botstein,D., Brown,P.O. and Staudt,L.M. (2000) Distinct types of B-cell lymphoma identified by gene expression profiling. Nature, 403, 503–511. [DOI] [PubMed] [Google Scholar]
- 23.Golub T.R., Slonim,D.K., Tamayo,P., Huard,C., Gaasenbeek,M., Mesirov,J.P., Coller,H., Loh,M.L., Downing,J.R., Caligiuri,M.A., Bloomfield,C.D. and Lander,E.S. (1999) Molecular classification of cancer: class discovery and class prediction by gene expression monitoring. Science, 286, 531–537. [DOI] [PubMed] [Google Scholar]
- 24.Hu G.K., Madore,S.J., Moldover,B., Jatkoe,T., Balaban,D., Thomas,J. and Wang,Y. (2001) Predicting splice variant from DNA chip expression data. Genome Res., 11, 1237–1245. [DOI] [PMC free article] [PubMed] [Google Scholar]
- 25.Wodicka L., Dong,H., Mittmann,M., Ho,M.-H. and Lockhart,D.J. (1997) Genome-wide expression monitoring in Saccharomyces cerevisiae. Nat. Biotechnol., 15, 1359–1367. [DOI] [PubMed] [Google Scholar]
- 26.Hill A.A., Hunter,C.P., Tsung,B.T., Tucker-Kellogg,G. and Brown,E.L. (2000) Genomic analysis of gene expression in C. elegans. Science 290, 809–812. [DOI] [PubMed] [Google Scholar]
- 27.Lee M.-L.T., Kuo,F.C., Whitmore,G.A. and Sklar,J. (2000) Importance of replication in microarray gene expression studies: statistical methods and evidence from repetitive cDNA hybridizations. Proc. Natl Acad. Sci. USA, 97, 9834–9839. [DOI] [PMC free article] [PubMed] [Google Scholar]
- 28.Tseng G.C., Oh,M.-K., Rohlin,L., Liao,J.C. and Wong,W.H. (2001) Issues in cDNA microarray analysis: quality filtering, channel normalization, models of variations and assessment of gene effects. Nucleic Acids Res., 29, 2549–2557. [DOI] [PMC free article] [PubMed] [Google Scholar]
- 29.Brown C.S., Goodwin,P.C. and Sorger,P.K. (2001) Image metrics in the statistical analysis of DNA microarray data. Proc. Natl Acad. Sci. USA, 98, 8944–8949. [DOI] [PMC free article] [PubMed] [Google Scholar]
- 30.Mills J.C. and Gordon,J.I. (2001) A new approach for filtering noise from high-density oligonucleotide microarray datasets. Nucleic Acids Res., 29, e72. [DOI] [PMC free article] [PubMed] [Google Scholar]
- 31.Wang X., Ghosh,S. and Guo,S.-W. (2001) Quantitative quality control in microarray image processing and data acquisition. Nucleic Acids Res., 29, e75. [DOI] [PMC free article] [PubMed] [Google Scholar]
- 32. MICROMAX ™ TSA ™ Labeling and Detection Kit User Manual (2001) PerkinElmer Life Sciences, Inc., Boston, MA, 02118NEN Life Sciences, p. 10.
- 33.Zhang L., Zhou,W., Velculescu,V.E., Kern,S.E., Hruban,R.H., Hamilton,S.R., Vogelstein,B. and Kinzler,K.W. (1997) Gene expression profiles in normal and cancer cells. Science, 276, 1268–1272. [DOI] [PubMed] [Google Scholar]
- 34.Hastie N.D. and Bishop,J.O. (1976) The expression of three abundance classes of messenger RNA in mouse tissues. Cell, 9, 761–774. [DOI] [PubMed] [Google Scholar]
- 35.Chan V., Graves,D.J. and McKenzie,S.E. (1995) The biophysics of DNA hybridization with immobilized oligonucleotide probes. Biophys. J., 69, 2243–2255. [DOI] [PMC free article] [PubMed] [Google Scholar]
- 36.Yue H., Eastman,P.S., Wang,B.B., Minor,J., Doctolero,M.H., Nuttall,R.L., Stack,R., Becker,J.W., Montgomery,J.R., Vainer,M. and Johnston,R. (2001) An evaluation of the performance of cDNA microarrays for detecting changes in global gene expression. Nucleic Acids Res., 29, e41. [DOI] [PMC free article] [PubMed] [Google Scholar]
- 37.Lindroos K., Liljedahl,U., Raitio,M. and Syvanen,A.-C. (2001) Minisequencing on oligonucleotide microarrays: comparison of immobilization chemistries. Nucleic Acids Res., 29, e69. [DOI] [PMC free article] [PubMed] [Google Scholar]
- 38.Graves D.J. (1999) Powerful tools for genetic analysis come of age. Trends Biotech., 17, 127–134. [DOI] [PubMed] [Google Scholar]
- 39.Southern E., Mir,K. and Shchepinov,M. (1999) Molecular interactions on microarrays. Nature Genet., 21 (Suppl. 1), 5–9. [DOI] [PubMed] [Google Scholar]
- 40.Langer P.R., Waldrop,A.A. and Ward,D.C. (1981) Enzymatic synthesis of biotin-labeled polynucleotides: novel nucleic acid affinity probes. Proc. Natl Acad. Sci. USA, 78, 6633–6637. [DOI] [PMC free article] [PubMed] [Google Scholar]
- 41.Selinger D.W., Cheung,K.J., Mei,R., Johansson,E.M., Richmond,C.S., Blattner,F.R., Lockhart,D.J. and Church,G.M. (2000) RNA expression analysis using a 30 base pair resolution Escherichia coli genome array. Nat. Biotechnol., 18, 1262–1268. [DOI] [PubMed] [Google Scholar]
- 42.DeRisi J.L., Iyer,V.R. and Brown,P.O. (1997) Exploring the metabolic and genetic control of gene expression on a genomic scale. Science, 278, 680–686. [DOI] [PubMed] [Google Scholar]
- 43.Stillman B.A. and Tonkinson,J.L. (2001) Expression microarray hybridization kinetics depend on length of the immobilized DNA but are independent of immobilization substrate. Anal. Biochem., 295, 149–157. [DOI] [PubMed] [Google Scholar]
- 44.Livshits M.A. and Mirzabekov,A.D. (1996) Theoretical analysis of the kinetics of DNA hybridization with gel-immobilized oligonucleotides. Biophys. J., 71, 2795–2801. [DOI] [PMC free article] [PubMed] [Google Scholar]
- 45.Afanassiev V., Hanemann,V. and Wolfl,S. (2000) Preparation of DNA and protein microarrays on glass slides coated with agarose film. Nucleic Acids Res., 28, e66. [DOI] [PMC free article] [PubMed] [Google Scholar]
- 46.Jia M.H., LaRossa,R.A., Lee,J.-M., Rafalski,A., DeRose,E., Gonye,G. and Xue,Z. (2000) Global expression profiling of yeast treated with an inhibitor of amino acid biosynthesis, sulfometuron methyl. Physiol. Genomics, 3, 83–92. [DOI] [PubMed] [Google Scholar]


