

Abstract
Iron metabolism is pivotal for cell fitness in the mammalian host; however, its role in group 3 innate lymphoid cells (ILC3s) is unknown. Here we show that transferrin receptor CD71 (encoded by Tfrc)-mediated iron metabolism cell-intrinsically controls ILC3 proliferation and host protection against Citrobacter rodentium infection and metabolically affects mitochondrial respiration by switching of oxidative phosphorylation toward glycolysis. Iron deprivation or Tfrc ablation in ILC3s reduces the expression and/or activity of the aryl hydrocarbon receptor (Ahr), a key ILC3 regulator. Genetic ablation or activation of Ahr in ILC3s leads to CD71 upregulation or downregulation, respectively, suggesting Ahr-mediated suppression of CD71. Mechanistically, Ahr directly binds to the Tfrc promoter to inhibit transcription. Iron overload partially restores the defective ILC3 compartment in the small intestine of Ahr-deficient mice, consistent with the compensatory upregulation of CD71. These data collectively demonstrate an under-appreciated role of the Ahr-CD71–iron axis in the regulation of ILC3 maintenance and function.
Iron is a critical micronutrient for fundamental metabolic processes in cells of different living organisms1,2. Dietary iron is mainly absorbed in the small intestine. It is either utilized and stored in ferritin by enterocytes or exported into the plasma and then delivered to target organs and cells in the body3–5. Iron in plasma is almost all bound to the glycoprotein transferrin (Tf), to maintain iron in a soluble form and to avoid the generation of toxic radicals from unbound free iron. Tf-bound iron is distributed into target cells via interaction with transferrin receptor (CD71 or TfR1, encoded by Tfrc), the primary receptor responsible for iron uptake2,6. Some alternative transporters can also uptake non-Tf-bound iron (NTBI) under specific conditions such as iron overload, among which, DMT1, ZIP8 and ZIP14 (encode by Slc39a14) are the well-studied NTBI transporters7,8. CD71 expression reflects the cellular iron status and is regulated mainly at the post-transcriptional level by iron regulatory proteins (IRPs)9. Transcriptional regulation of CD71 expression is less-well understood.
In the eukaryote cytoplasm, iron is reduced to ferrous iron Fe2+ and mostly traffics into the mitochondria, where it is incorporated into heme and iron–sulfur10, critical cofactors for electron transport chain complexes. The defective heme and iron–sulfur biogenesis due to iron deficiency causes mitochondrial dysfunction and oxidative stress11,12 and switches cellular metabolic pathways from oxidative phosphorylation (OXPHOS) to aerobic glycolysis13–15.
ILC3s are innate counterpart lymphocytes of type 17 helper T (TH17) cells expressing transcription factor RORγt and producing interleukin (IL)-17 and/or IL-22 (ref. 16). Several subsets of mouse ILC3s are distinguished by the expression of cell surface markers CD4, CCR6 and NKp46 as well as the transcription factor T-bet17. ILC3s are abundant in the intestinal mucosa and play important roles in tissue homeostasis and host–microbiota interactions under steady state and also contribute to the immune defense against infections16,18–21. Perturbation of ILC3 can result in susceptibility to gut infection, such as that by C. rodentium, a mouse pathogen that models human pathogenic Escherichia coli infection22. ILC3s rely on a metabolic program that integrates glycolysis with mitochondrial metabolism to fulfill activation demands and their proper maintenance is dependent on mitochondrial transcription factor A (Tfam)23,24; however, the role of iron metabolism in ILC3s is unknown.
Ahr, an environmental sensor, detects xenobiotic ligands (for example, environmental toxins) and endogenous ligands generated from host cells, microbiota and diet (for example, tryptophan metabolites)25–27. Ahr is important for ILC3 maintenance and function28–30. In this study, we examined the impact of iron on ILC3s and revealed a crucial role of iron metabolism involving the Ahr–CD71–iron axis in ILC3s for their maintenance, metabolic fitness and function.
Results
Iron-depleted diet impairs gut ILC3 maintenance and function
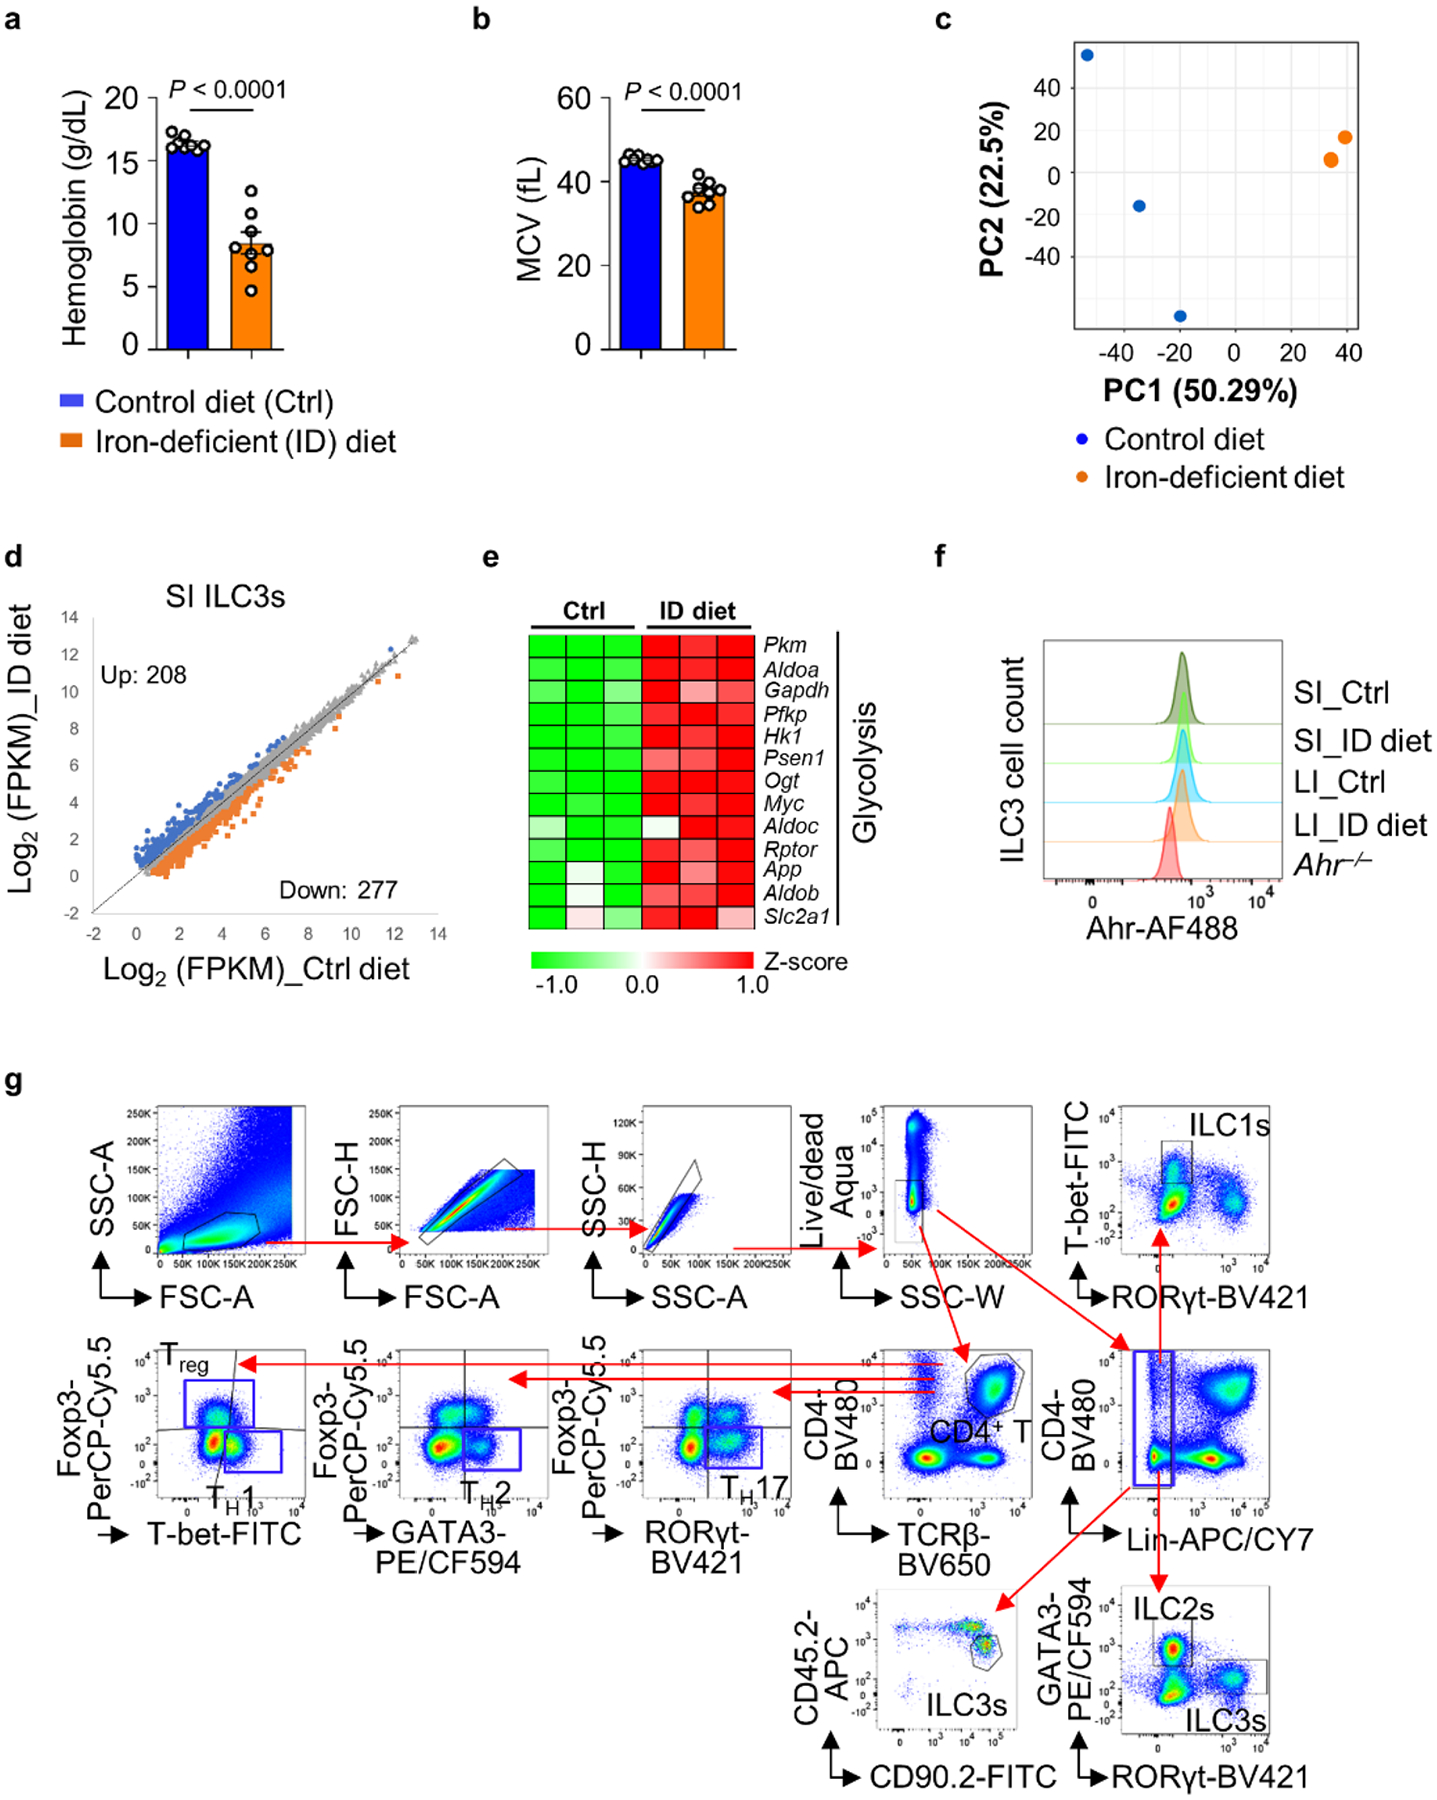
To determine the role of iron in ILC3s in vivo, 3-week-old C57BL/6 wild-type (WT) mice were fed an iron-deficient or control diet for 3 weeks and blood hemoglobin and mean corpuscular volume (MCV) were monitored for anemia (Extended Data Fig. 1a,b). As CD71 can be internalized by receptor-mediated endocytosis31, we performed cell surface staining followed by intracellular staining throughout the study. Iron depletion markedly upregulated CD71 expression in various subsets of ILC3s in both the small intestine (SI) and large intestine (LI) (Fig. 1a,b). Consistently, Tfrc messenger RNA (mRNA) was increased by iron-depleted diet in fluorescence-activated cell sorting (FACS)-sorted ILC3s (Fig. 1c). Notably, dietary iron depletion modestly but significantly reduced ILC3s in the intestine (Fig. 1d–f) and the expression of ILC3 effector cytokines, especially IL-22 in SI (Fig. 1g–i), suggesting that dietary iron depletion affects ILC3 maintenance and function.
Fig. 1 |. Iron-depleted diet impairs gut ILC3 maintenance and function.
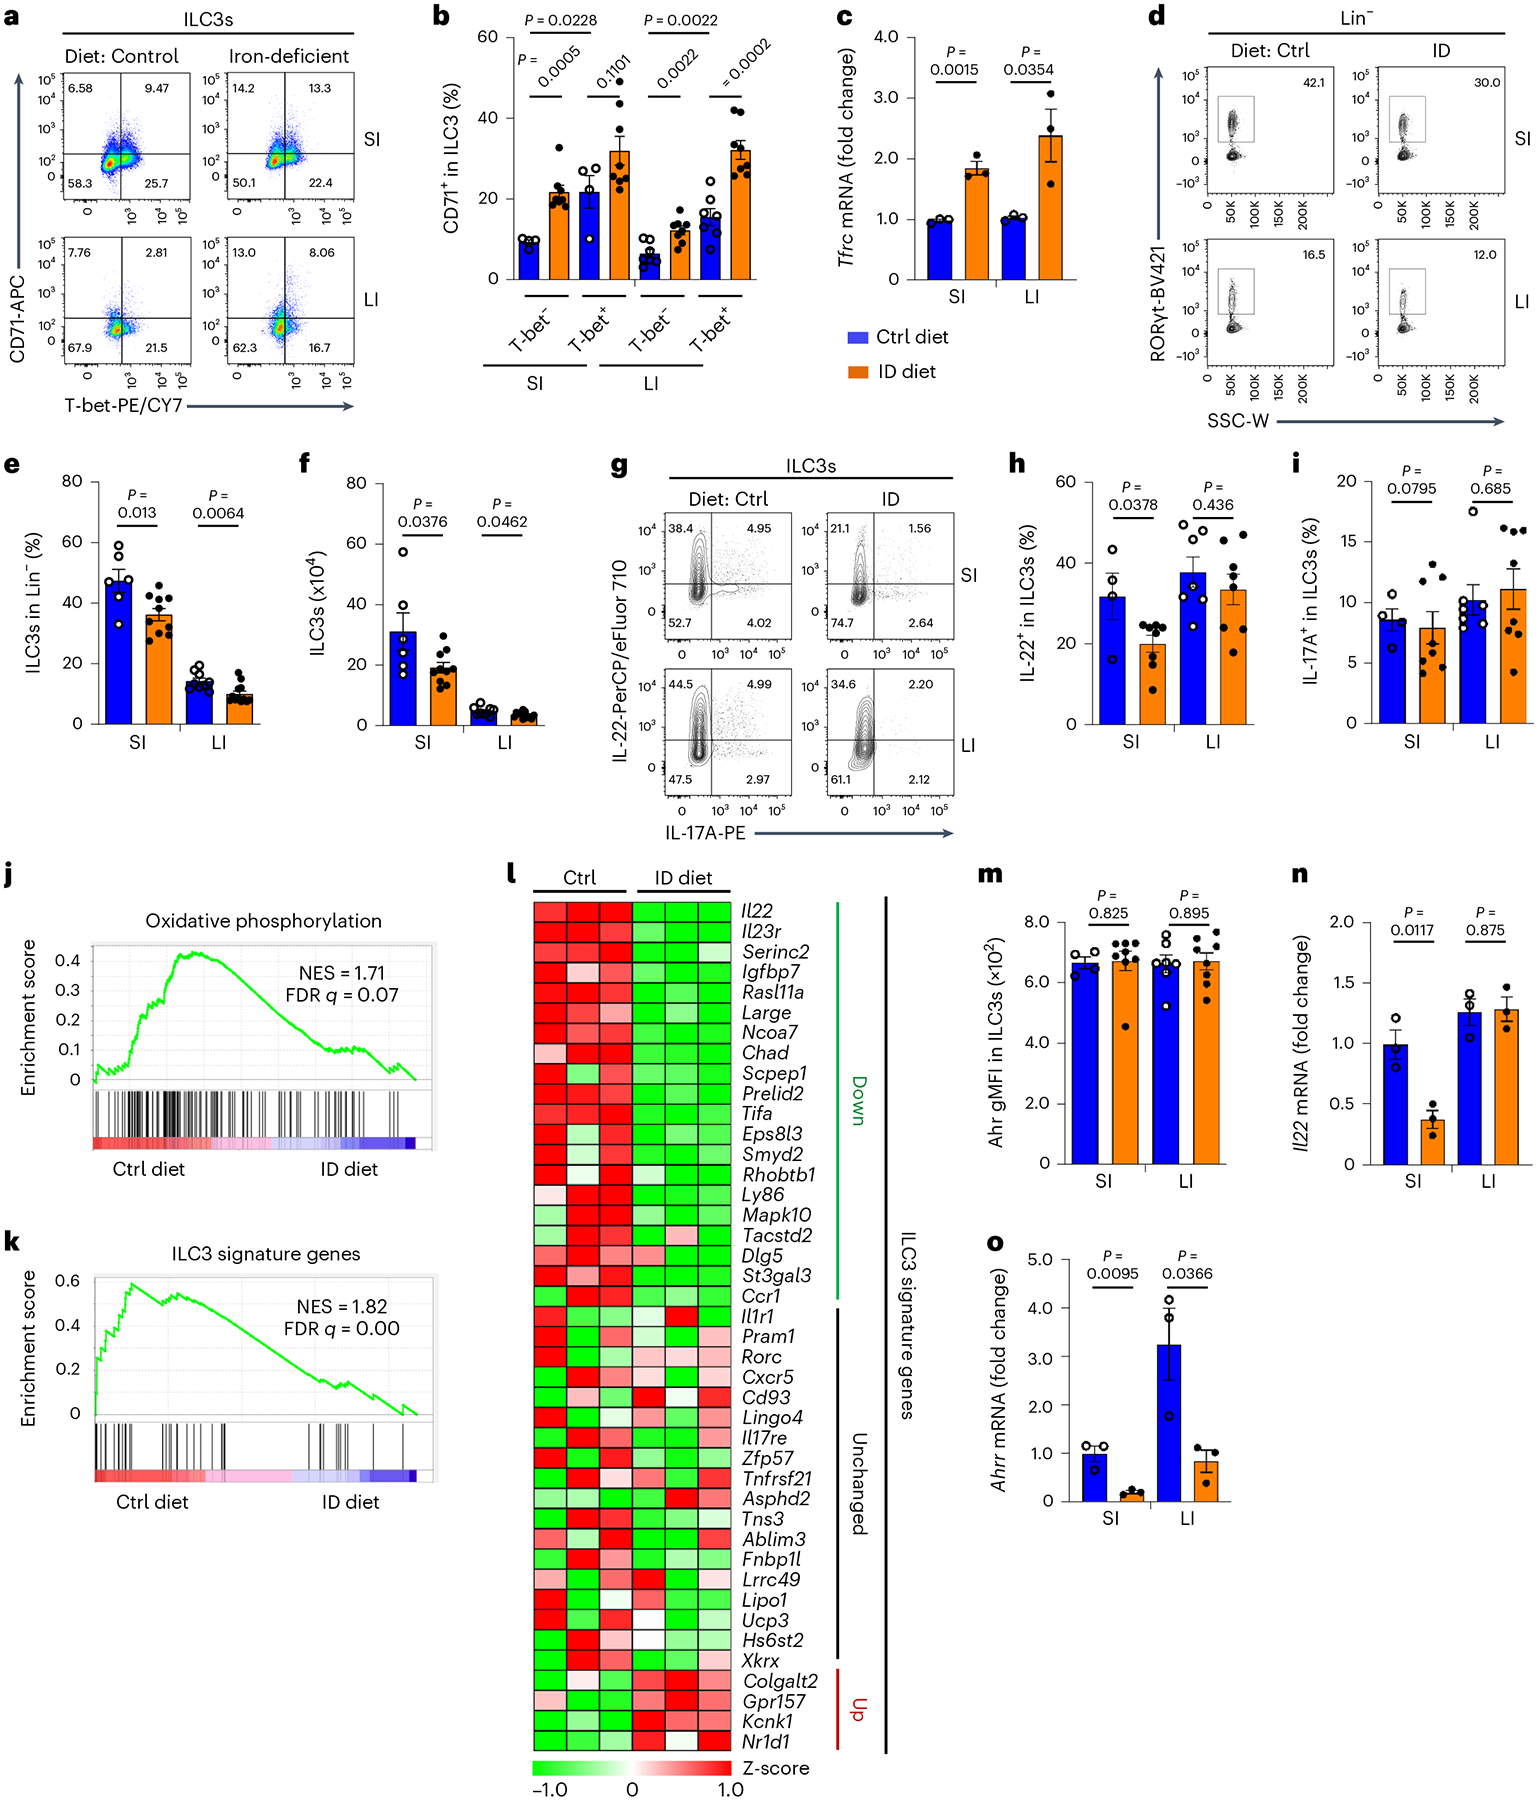
The 3-week-old WT mice were fed an iron-deficient (ID) or control (Ctrl) diet for 3 weeks before analysis. a,b, FACS analysis of CD71 and T-bet expression in ILC3s of the indicated mice. Representative FACS plot (a) and percentages of CD71+ cells in ILC3s compiled from three independent experiments (control diet, n = 4 and 7 mice for SI and LI; ID diet, n = 8 mice for SI and LI) are shown (b). c, Expression of Tfrc mRNA determined by RT–qPCR in SI ILC3s. Data are compiled from three independent experiments (n = 3 mice per group). d–f, FACS analysis of RORγt expression in Lin− LPLs of the indicated mice. Representative FACS plot (d) and percentages of ILC3s in Lin− LPLs (e) and absolute numbers of ILC3s (f) compiled from four independent experiments (control diet, n = 6 and 9 for SI and LI; ID diet, n = 10 and 12 for SI and LI) are shown. g–i, FACS analysis of IL-22 and IL-17A expression in ILC3s of the indicated mice. Representative FACS plot (g) and percentages of IL-22+ (h) and IL-17A+ (i) cells in ILC3s compiled from three independent experiments (control diet, n = 7 and 4 for SI and LI; ID diet, n = 8) are shown. j,k, GSEA showing enrichment of genes of OXPHOS pathway (j) and ILC3 signature genes (k) in RNA-seq analysis (n = 3 mice per group). l, Heat map of the ILC3 signature gene expression revealed by RNA-seq analysis. m, Geometric mean fluorescence intensity (gMFI) of the Ahr expression in ILC3s of the indicated mice. Data are compiled from three independent experiments (control diet, n = 4 and 7 for SI and LI; ID diet, n = 8 for SI and LI). n,o, Expression of Il22 (n) and Ahrr (o) mRNA determined by RT–qPCR in ILC3s from the indicated mice. Data are compiled from three independent experiments (n = 3 mice per group). See also Extended Data Fig. 1.
Gene profiling analysis by RNA-sequencing (RNA-seq), performed on the FACS-sorted SI ILC3s of the mice fed an iron-deficient or control diet, identified 208 upregulated and 277 downregulated significantly differentially expressed genes (DEGs) (q value ≤ 0.05, fold change ≥ 1.5) out of 10,462 expressed genes (fragments per kilo-base of transcript per million mapped reads (FPKM) ≥ 1) (Extended Data Fig. 1c,d). Gene set enrichment analysis (GSEA) revealed the downregulation of oxidative phosphorylation (OXPHOS) in ILC3s from the mice fed an iron-deficient diet (Fig. 1j). In contrast, various genes involved in glycolysis were upregulated, including Slc2a1 (encoding solute carrier family 2 member 1, Glut1) (Extended Data Fig. 1e). By cross-referencing to the previously published 42 ILC3 signature genes in SI32, GSEA also revealed the downregulation of ILC3 signature transcriptional program (Fig. 1k), with more downregulated genes (n = 20) than upregulated genes (n = 4) in ILC3s of mice fed an iron-deficient diet (Fig. 1l). Although Ahr expression itself was unchanged in ILC3s upon iron depletion, Ahr transcriptional activity was markedly reduced as evidenced by mRNA of Ahr direct target genes, Il22 and Ahrr (Fig. 1m–o and Extended Data Fig. 1f). Together, these data suggest that the iron-deficient diet suppresses ILC3 function by inhibiting Ahr activity.
Iron chelation represses gut ILC3 function ex vivo
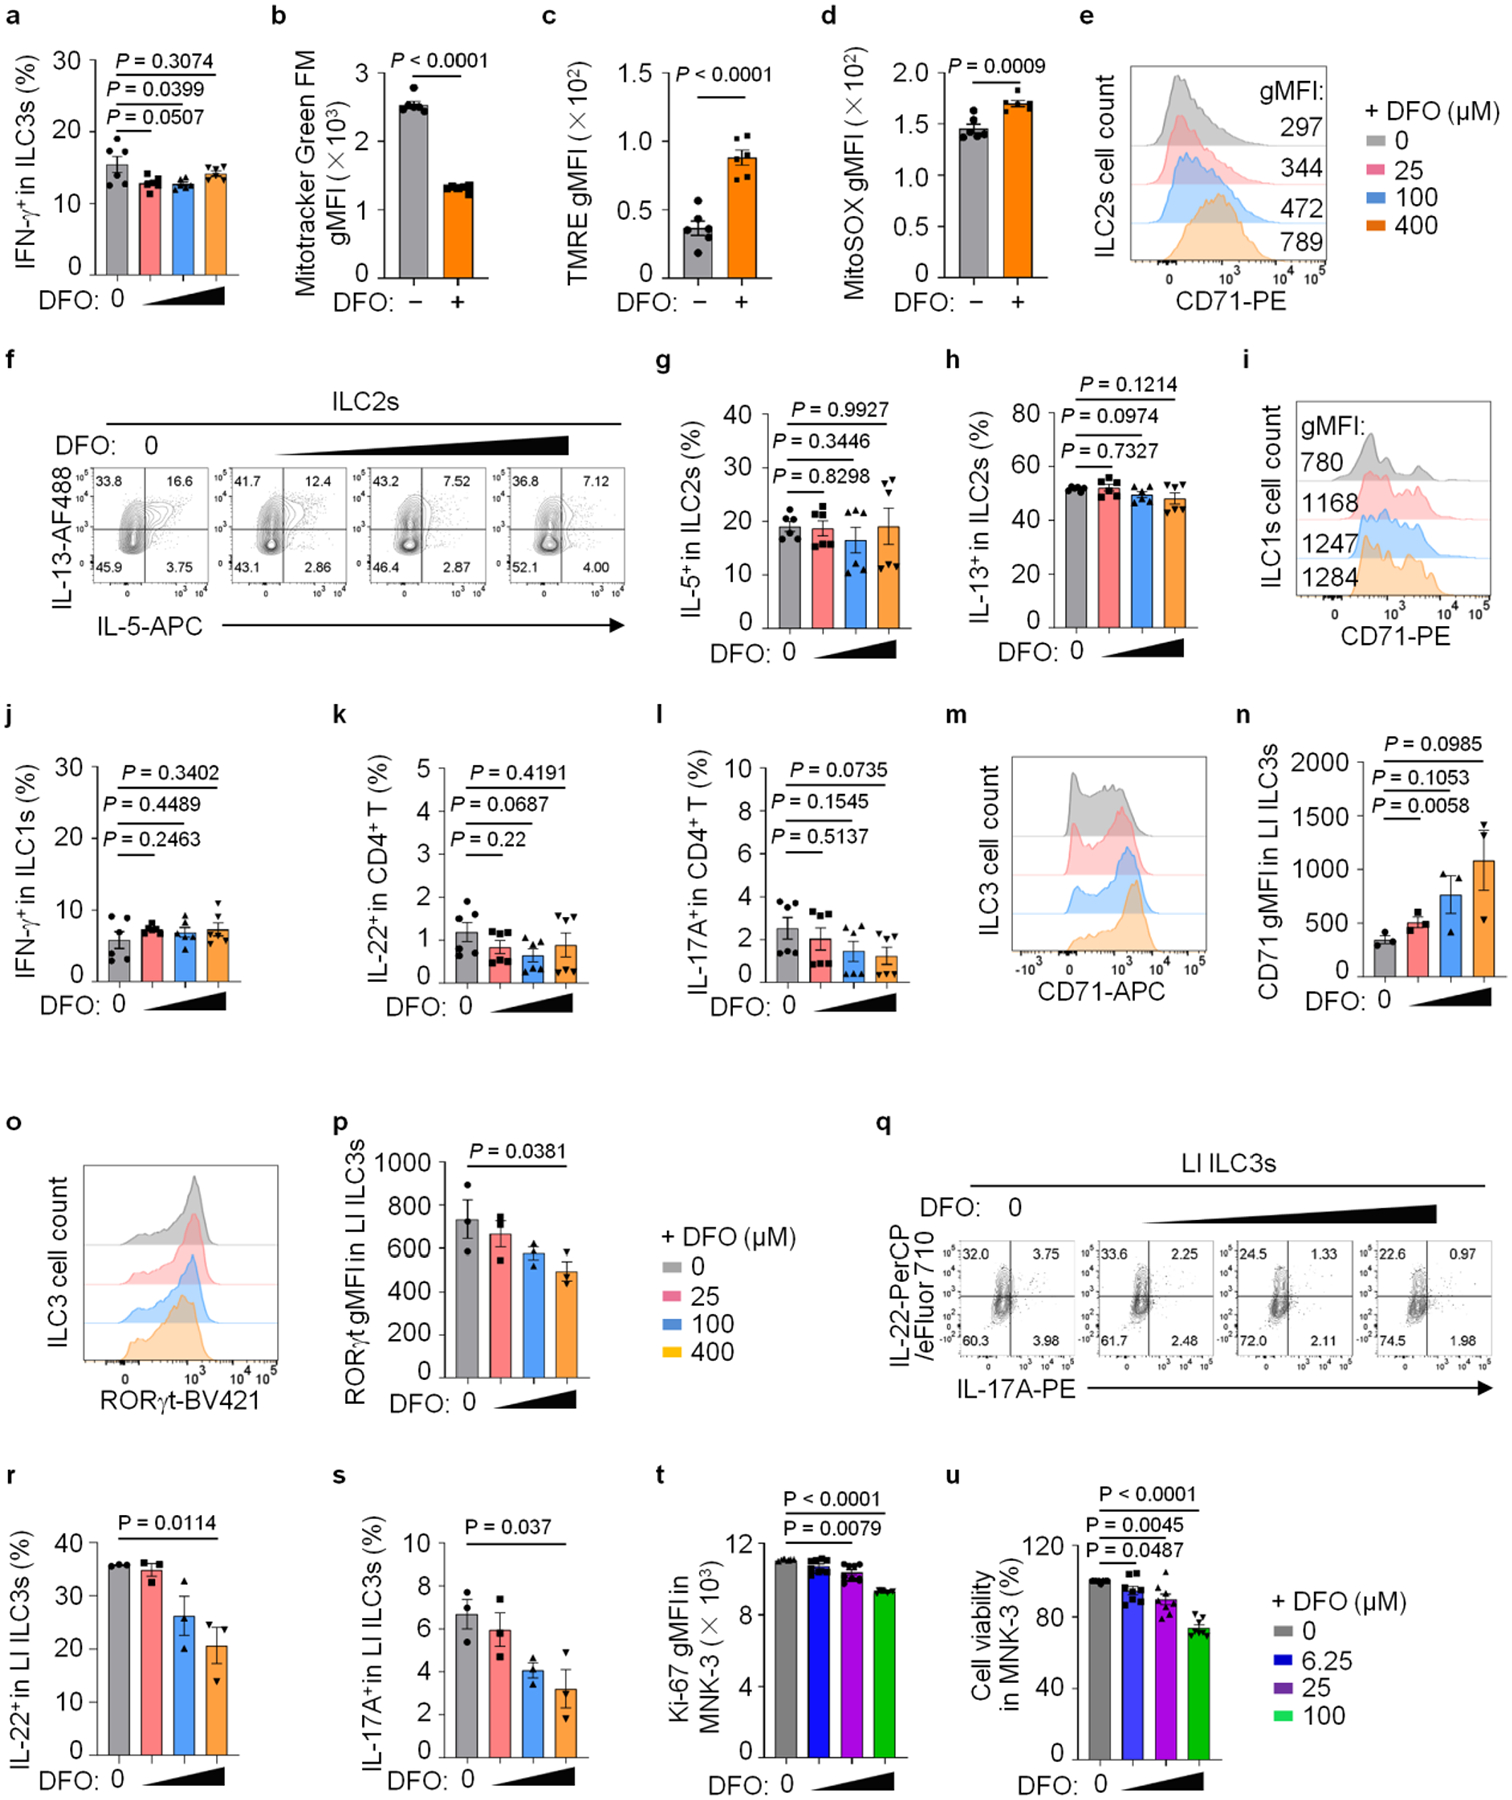
Next, we isolated lamina propria lymphocytes (LPLs) from SI of WT mice and incubated them ex vivo with iron chelator deferoxamine (DFO)33,34. The expression of CD71 in ILC3s was increased upon DFO treatment (Fig. 2a,b), consistent with the reported upregulation of CD71 during iron deficit in other cell types9,35. The expression of RORγt and cytokines IL-22 and IL-17A, but not interferon (IFN)-γ in ILC3s, were repressed by DFO treatment in a dose-dependent manner (Fig. 2c–g and Extended Data Fig. 2a). Moreover, ex vivo iron deprivation by DFO led to ILC3 mitochondrial dysfunction (Extended Data Fig. 2b–d). Notably, iron chelation also enhanced CD71 expression in gut ILC2s, ILC1s and CD4+ T cells; however, their respective cytokine production (IL-5, IL-13, IFN-γ, IL-17A and IL-22) were unaltered (Extended Data Fig. 2e–l). Likewise, the effect of DFO treatment on ILC3s was observed in LI LPLs (Extended Data Fig. 2m–s). Together, these data suggest a crucial role of iron metabolism in ILC3 regulation.
Fig. 2 |. Iron chelation represses ILC3 functions ex vivo and in vitro.
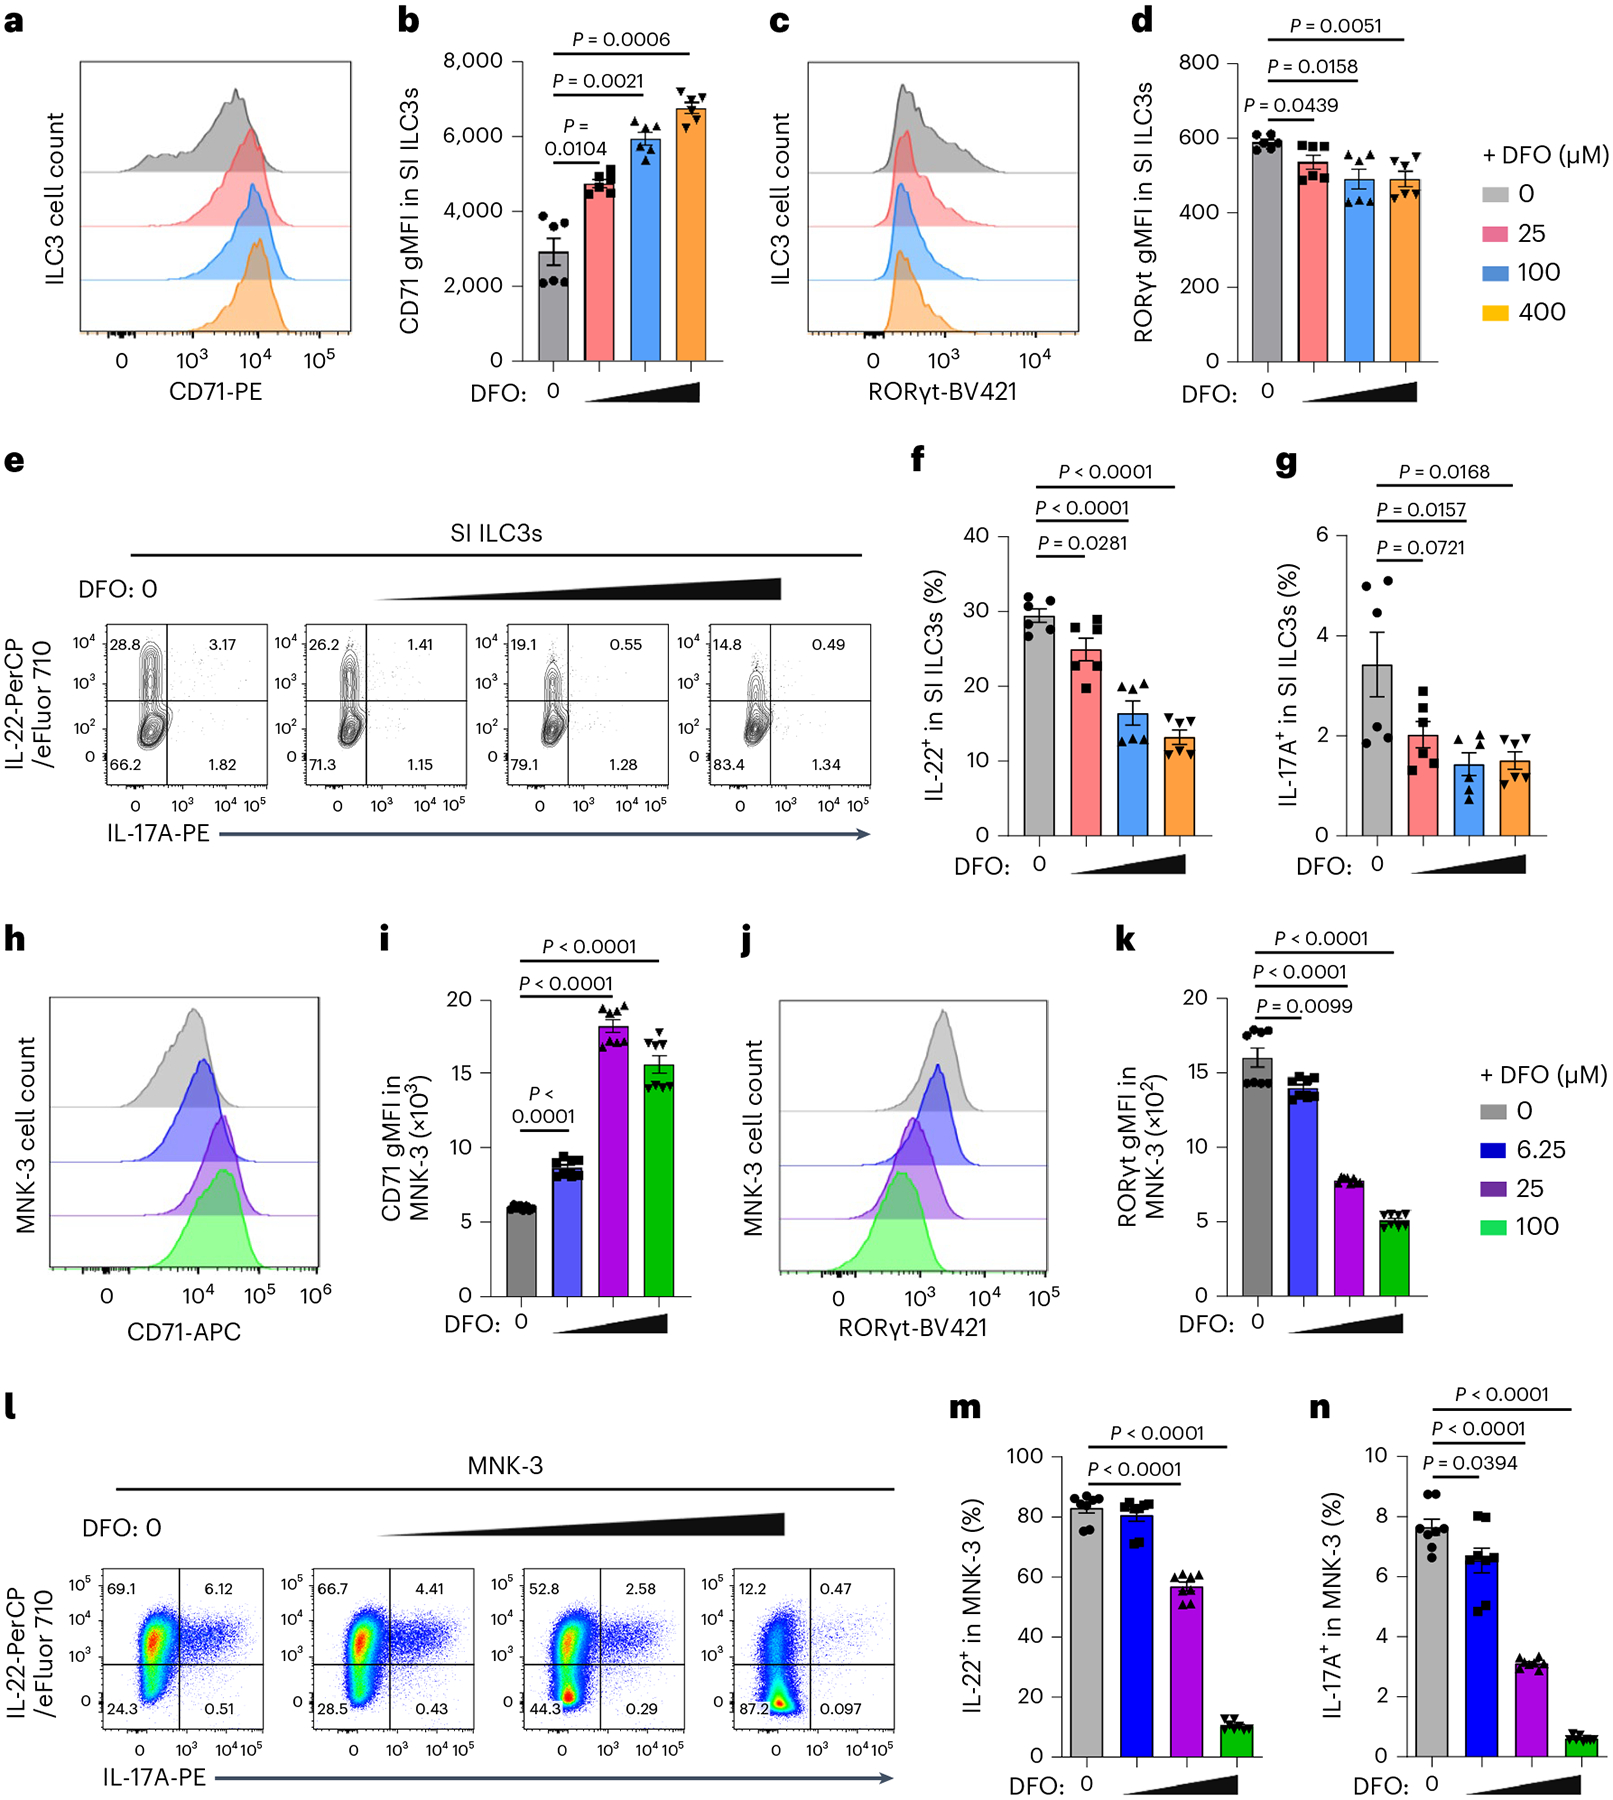
a–g, SI LPLs from WT mice were treated ex vivo with or without DFO for 16 h. FACS analysis of CD71 and RORγt expression in ILC3s (a–d). Representative FACS plots of three independent experiments (a,c) and gMFI of CD71 (b) and RORγt (d) expression in ILC3s (n = 6 mice per group compiled from three independent experiments) are shown. e–g, FACS analysis of IL-22 and IL-17A expression in ILC3s. Representative FACS plot of three independent experiments (e) and percentages of IL-22+ (f) and IL-17A+ (g) cells in ILC3s (n = 6 mice per group compiled from three independent experiments) are shown. h–n, MNK-3 cells were treated with or without DFO for 16 h in vitro (n = 8 biologically independent replicates per group compiled from three independent experiments). FACS analysis of CD71 and RORγt expression in MNK-3 cells (h–k). Representative FACS plot of three independent experiments (h,j) and gMFI of the CD71 (i) and RORγt (k) expression in MNK-3 cells are shown. l–n, FACS analysis of IL-22 and IL-17A expression in MNK-3 cells. Representative FACS plot of three independent experiments (l) and percentages of IL-22+ (m) and IL-17A+ cells (n) in MNK-3 cells compiled from three independent experiments are shown. See also Extended Data Fig. 2.
Iron chelation impairs MNK-3 cell fitness in vitro
We further employed the ILC3-like MNK-3 cell line, which mirrors the phenotype and effector features of murine primary intestinal ILC3s36. Similar to the phenotypes observed in ILC3s, in vitro DFO treatment augmented CD71 expression, reduced RORγt and cytokine expression in a dose-dependent manner in MNK-3 cells (Fig. 2h–n). Moreover, iron depletion also suppressed MNK-3 cell proliferation and survival as indicated by the Ki-67 and Aqua staining, respectively (Extended Data Fig. 2t,u). Together, these data showed that iron chelation by DFO in vitro perturbs MNK-3 cell fitness with compromised maintenance and function.
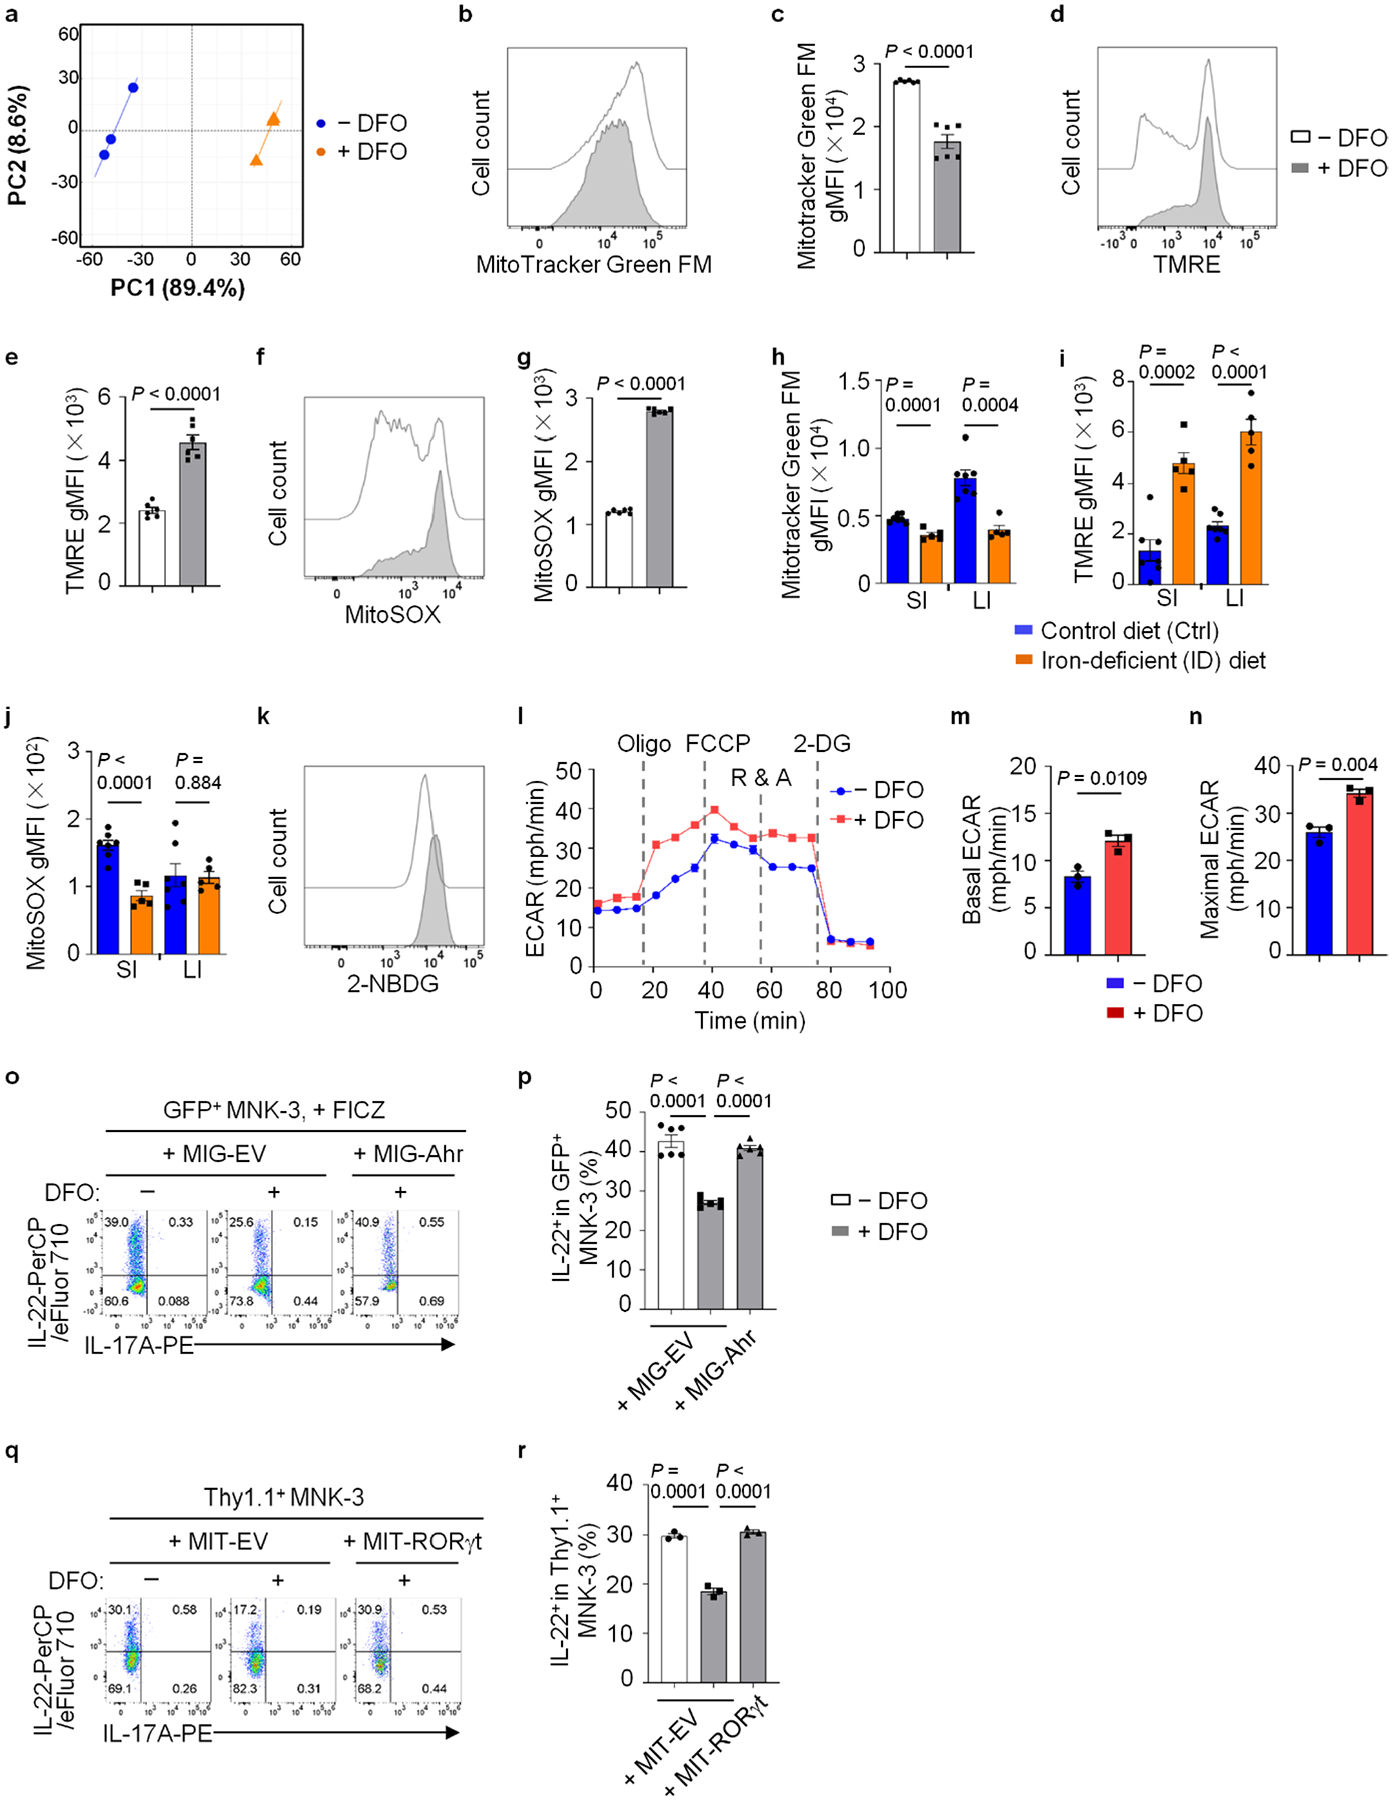
RNA-seq analysis of MNK-3 cells treated with or without DFO identified 2,311 upregulated and 3,090 downregulated DEGs (q value ≤ 0.05, fold change ≥ 1.5) out of 11,075 expressed genes (FPKM ≥ 1) (Fig. 3a and Extended Data Fig. 3a). Gene Ontology (GO) analysis and GSEA revealed the enrichment of OXPHOS in the downregulated genes in DFO-treated MNK-3 cells (Fig. 3b,c), a pathway shared by primary SI ILC3s from mice fed an iron-deficient diet (Fig. 1j). All the 13 mitochondrial genes were collectively downregulated (Fig. 3d) and the majority of ILC3 signature genes (26 out of 42) were downregulated by iron depletion in MNK-3 cells, including Il22, Il23r and Rorc (Fig. 3e,f). In contrast, genes involved in glycolysis were upregulated in DFO-treated MNK-3 cells, including Slc2a1 and Hif1a (Fig. 3a) and so were genes involved in the mTOR pathway (Fig. 3b). Collectively, these data suggest that iron depletion alters MNK-3 transcriptome, specifically affecting the metabolic pathway gene expression.
Fig. 3 |. Iron depletion impairs mitochondrial function and switches OXPHOS to glycolysis in MNK-3 cells.
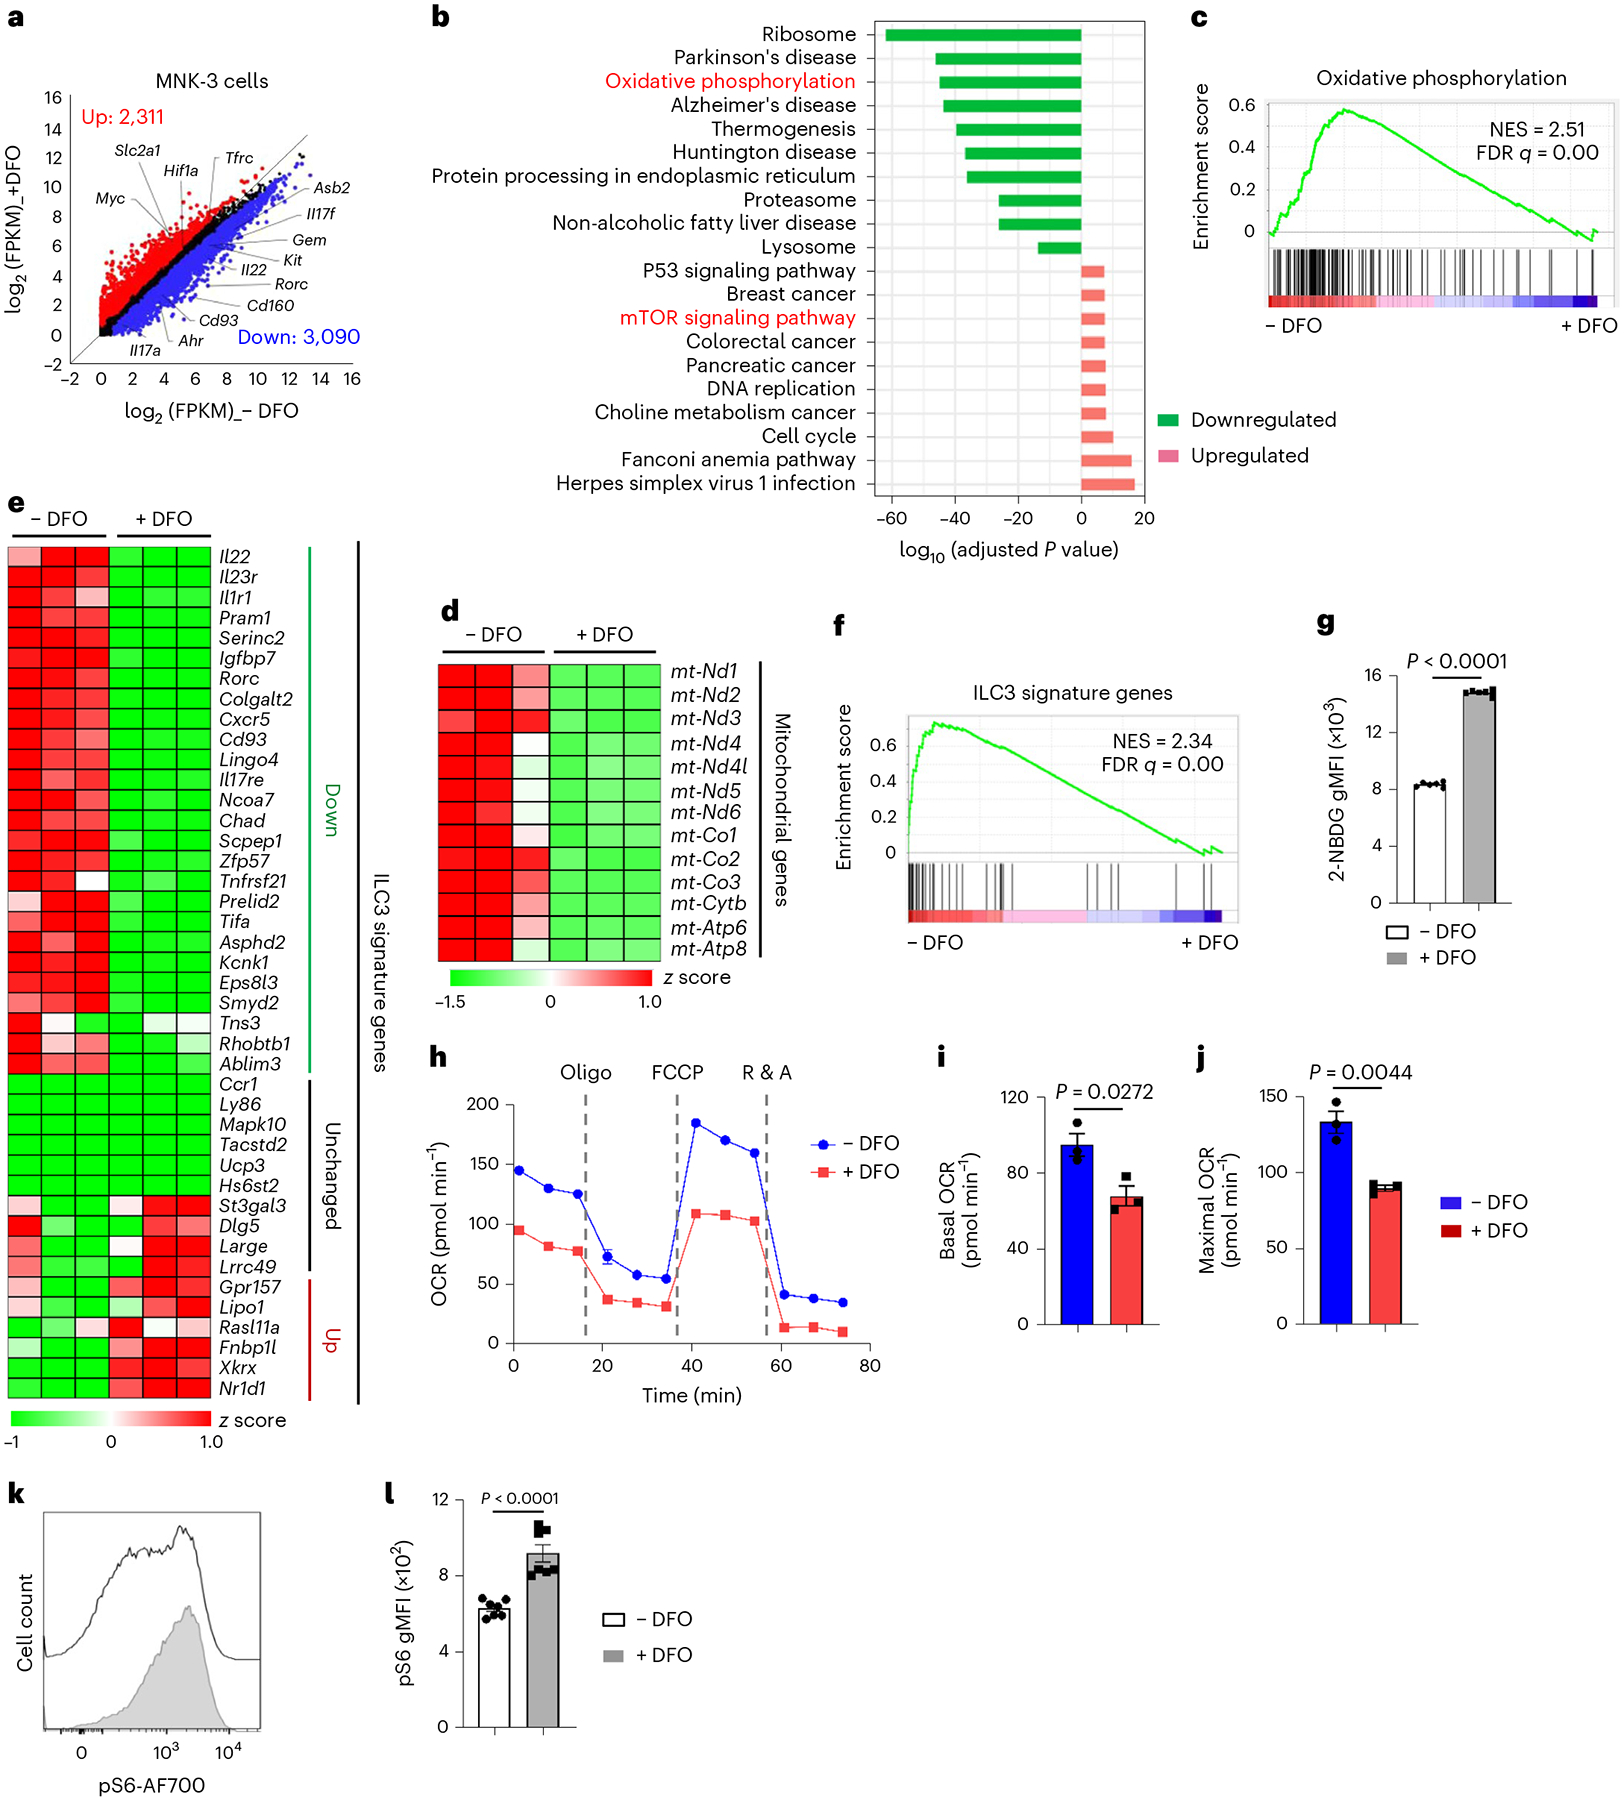
a–f, RNA-seq analysis of MNK-3 cells treated with or without DFO (100 μM) for 16 h in vitro (n = 3 biologically independent replicates per group). Scatter-plot of log2 (FPKM) gene expression of the RNA-seq analysis. DEGs (fold change ≥ 1.5, q value ≤ 0.05) are highlighted in red (upregulated) and blue (downregulated), respectively (a). GO analysis showing the top ten up- and downregulated pathways of the DEGs identified by RNA-seq in MNK-3 cells (b). GSEA showing enrichment of genes of OXPHOS pathway in MNK-3 cells without DFO treatment (c). Heat maps of the indicated mitochondria-encoding gene expression (d) and ILC3 signature gene expression (e) in RNA-seq analysis of MNK-3 cells. GSEA showing enrichment of ILC3 signature genes in MNK-3 cells without DFO treatment (f). g, FACS analysis of 2-NBDG uptake in MNK-3 cells (n = 6 biologically independent replicates per group compiled from three independent experiments). h–j, Seahorse metabolic flux analysis. Real-time OCR (h) are representative of two independent experiments and compiled data on quantification of basal (i) and maximal (j) OCR of one experiment are shown (n = 3 biologically independent replicates per group). k,l, FACS analysis of mTORC1-associated marker S6 phosphorylation (pS6) in MNK-3 cells. Representative FACS plot of three independent experiments (k) and gMFI of pS6 in MNK-3 cells compiled from three independent experiments (n = 7 biologically independent replicates per group) (l) are shown. See also Extended Data Fig. 3.
Consistent with OXPHOS enrichment in the downregulated DEGs, DFO treatment significantly reduced mitochondrial mass but enhanced mitochondrial membrane potential and reactive oxygen species (ROS) as revealed by MitoTracker Green FM, TMRE and Mito-SOX Red staining, respectively (Extended Data Fig. 3b–g). Altered mitochondrial content and activity were also observed in ILC3s from the mice fed an iron-deficient diet (Extended Data Fig. 3h–j). Moreover, extracellular glucose uptake by MNK-3 cells was increased upon DFO treatment, as revealed by 2-(N-(7-nitrobenz-2-oxa-1,3-diazol-4-yl)amino)-2-deoxyglucose (2-NBDG) staining (Fig. 3g and Extended Data Fig. 3k), consistent with the impaired mitochondrial respiration and the enhanced aerobic glycolysis by iron depletion11,37. Furthermore, DFO-treated MNK-3 cells had reduced oxygen consumption rate (OCR; an indicator of OXPHOS) but enhanced extracellular acidification rate (ECAR; an indicator of glycolytic activity) (Fig. 3h–j and Extended Data Fig. 3l–n). Consistent with the enrichment of mTOR signaling pathway in the upregulated DEGs (Fig. 3b), mTORC1 activity was enhanced by iron depletion as measured by phosphorylation of S6 (pS6) (Fig. 3k,l). Together, these data suggest that iron depletion impairs mitochondrial fitness and metabolically switches OXPHOS to glycolysis in MNK-3 cells.
Notably, Ahr expression was significantly decreased in DFO-treated MNK-3 cells and a group of genes (including Asb2, Cd93, Cd160, Gem, Il17a, Il22 and Kit) identified as Ahr direct targets24,38, were also reduced (Fig. 3a). Forced expression of Ahr by retroviral transduction in MNK-3 cells restored cytokine production repressed otherwise by DFO and so did RORγt transduction (Extended Data Fig. 3o–r). Together, these data suggest that iron depletion, at least partially, modulates ILC3 maintenance and function via the Ahr pathway.
CD71 plays a cell-intrinsic role in ILC3 maintenance
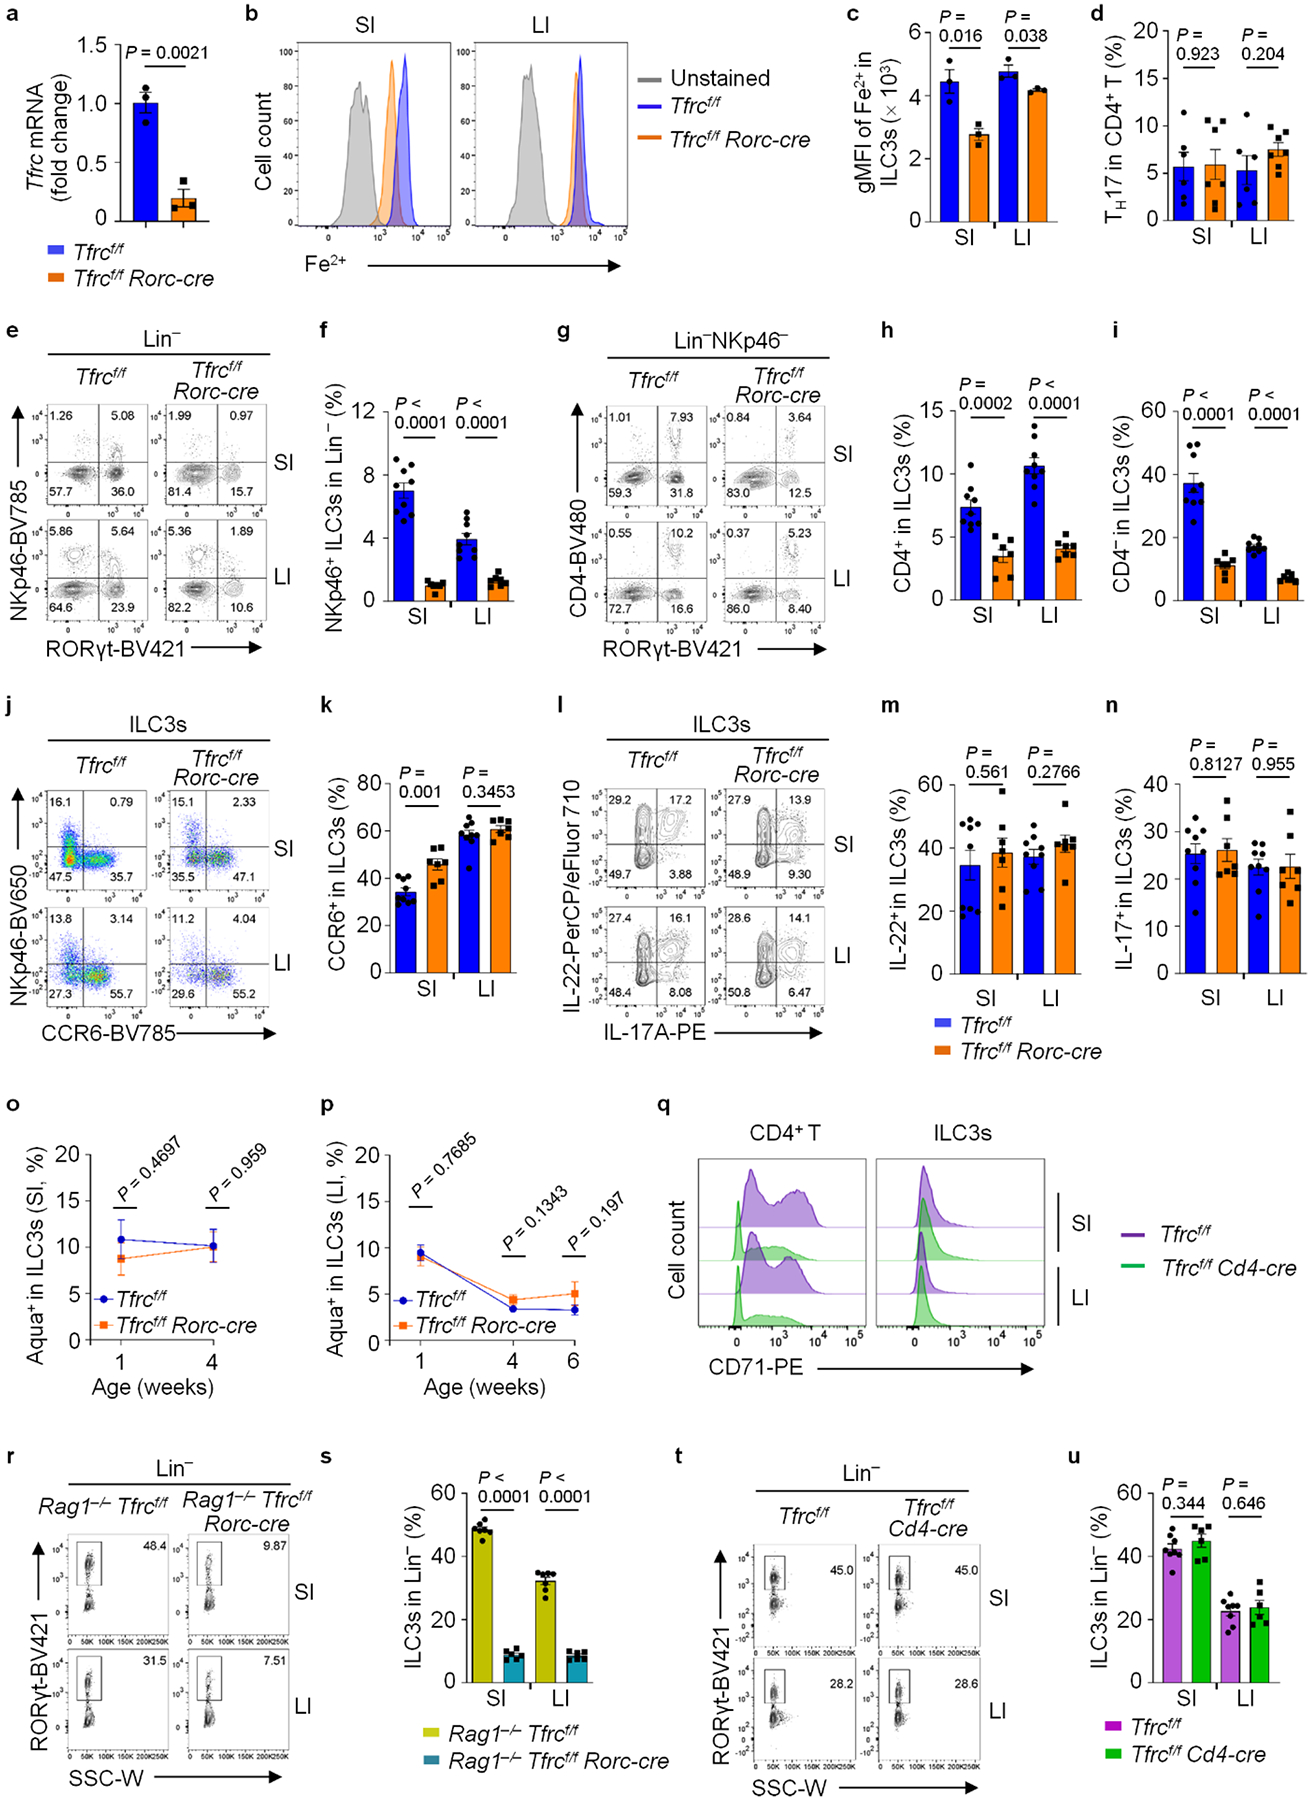
To understand the CD71–iron pathway in ILC3s, we generated Tfrcf/f Rorc-cre mice to specifically delete Tfrc in RORγt-expressing cells (ILC3s and T cells). As expected, ILC3s from Tfrcf/f Rorc-cre mice showed efficient deletion of Tfrc (Extended Data Fig. 4a). Tfrc ablation in ILC3s reduced the intracellular Fe2+ contents, especially in SI (Extended Data Fig. 4b,c). Percentages and absolute numbers of ILC3s, but not TH17 cells, were reduced by Tfrc ablation. The reduction was observed in SI and LI, but not in other peripheral lymphoid organs (for example, peripheral lymph nodes (pLNs) and mesenteric lymph nodes (mLNs); Fig. 4a,b and Extended Data Fig. 4d), indicating a specific requirement for CD71 in gut ILC3 maintenance. Compared to their littermate controls, ILC3 numbers were unchanged in 1-week-old Tfrcf/f Rorc-cre mice, but a progressive ILC3 loss was observed in the gut of mutant mice during development (Fig. 4c–f). Various ILC3 subsets were reduced in the intestines of Tfrcf/f Rorc-cre mice compared to their littermate controls (Fig. 4g–j and Extended Data Fig. 4e–k). Accordingly, the cytokine-producing ILC3s were reduced (Fig. 4k,l and Extended Data Fig. 4l–n). Although ILC3 survival was unchanged (Extended Data Fig. 4o,p), its proliferation was markedly decreased in Tfrcf/f Rorc-cre mice (Fig. 4m–p). We further generated Rag1−/−Tfrcf/f Rorc-cre that lack adaptive immunity and Tfrcf/f Cd4-cre mice that Tfrc was deleted in T cells but not ILC3s (Extended Data Fig. 4q). The reduction of ILC3s was observed in the gut of Rag1−/−Tfrcf/f Rorc-cre but not Tfrcf/f Cd4-cre mice (Extended Data Fig. 4r–u). Together, these data demonstrate that CD71 plays a crucial role in ILC3 maintenance in a cell-intrinsic manner.
Fig. 4 |. CD71 deficiency impairs ILC3 maintenance in a cell-intrinsic manner.
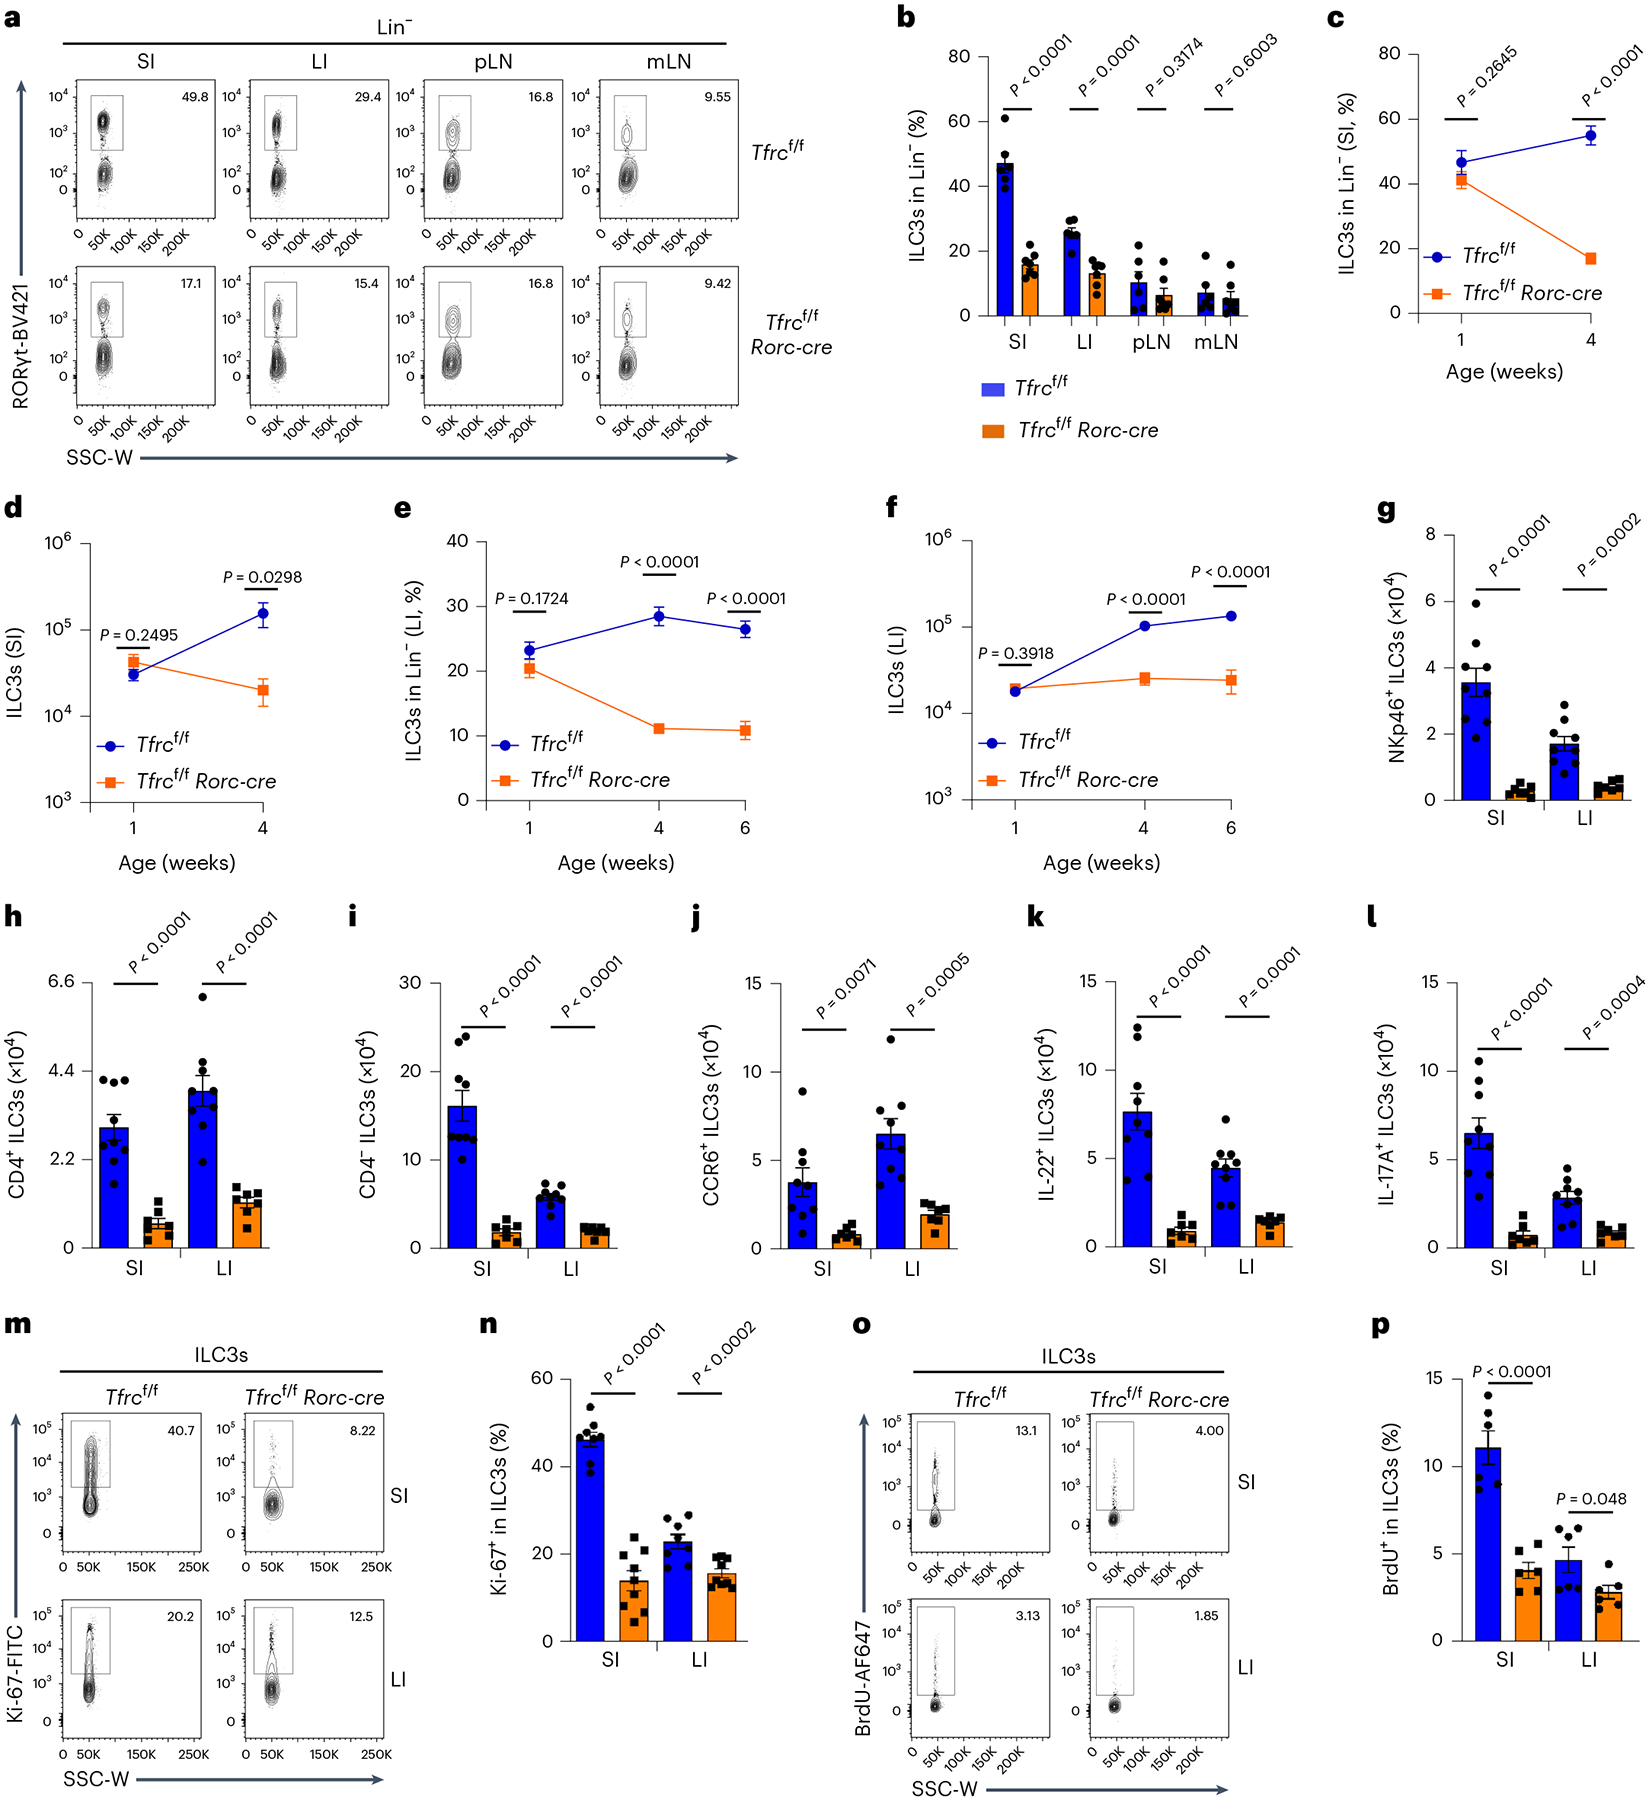
a,b, FACS analysis of RORγt expression in Lin− LPLs isolated from various organs (SI, LI, pLNs and mLNs) of Tfrcf/f and Tfrcf/f Rorc-cre littermate mice. Representative FACS plot of three independent experiments (a) and percentages of ILC3s in Lin− LPLs compiled from three independent experiments (Tfrcf/f, n = 6 mice; Tfrcf/f Rorc-cre, n = 7 mice) are shown (b). c–f, Percentages and absolute numbers of SI (c,d) and LI (e,f) ILC3s in Lin− LPLs at different ages of mice of indicated genotypes. Data are compiled from four independent experiments (Tfrcf/f, n = 7 per age group; Tfrcf/f Rorc-cre, n = 6 (1-week-old and 4-week-old) or 5 (6-week-old) mice)). g–l, Absolute numbers of NKp46+ ILC3s (g), CD4+ ILC3s (h), CD4− ILC3s (i), CCR6+ ILC3s (j), IL-22+ ILC3s (k) and IL-17A+ ILC3s (l) in SI and LI LPLs of Tfrcf/f and Tfrcf/f Rorc-cre littermate mice. Data are compiled from three independent experiments (Tfrcf/f, n = 9 mice; Tfrcf/f Rorc-cre, n = 7 mice). m,n, FACS analysis of Ki-67 expression in ILC3s. Representative FACS plot of three independent experiments (m) and percentages of Ki-67+ cells in ILC3s compiled from three independent experiments (Tfrcf/f, n = 8 mice; Tfrcf/f Rorc-cre, n = 9 mice) are shown (n). o,p, FACS analysis of 5-bromo-2ʹ-deoxyuridine (BrdU) expression in ILC3s. Representative FACS plot of two independent experiments (o) and percentages of BrdU+ cells in ILC3s compiled from two independent experiments (n = 6 mice per group) are shown (p). See also Extended Data Fig. 4.
CD71 ablation in ILC3s impairs gut immunity to C. rodentium
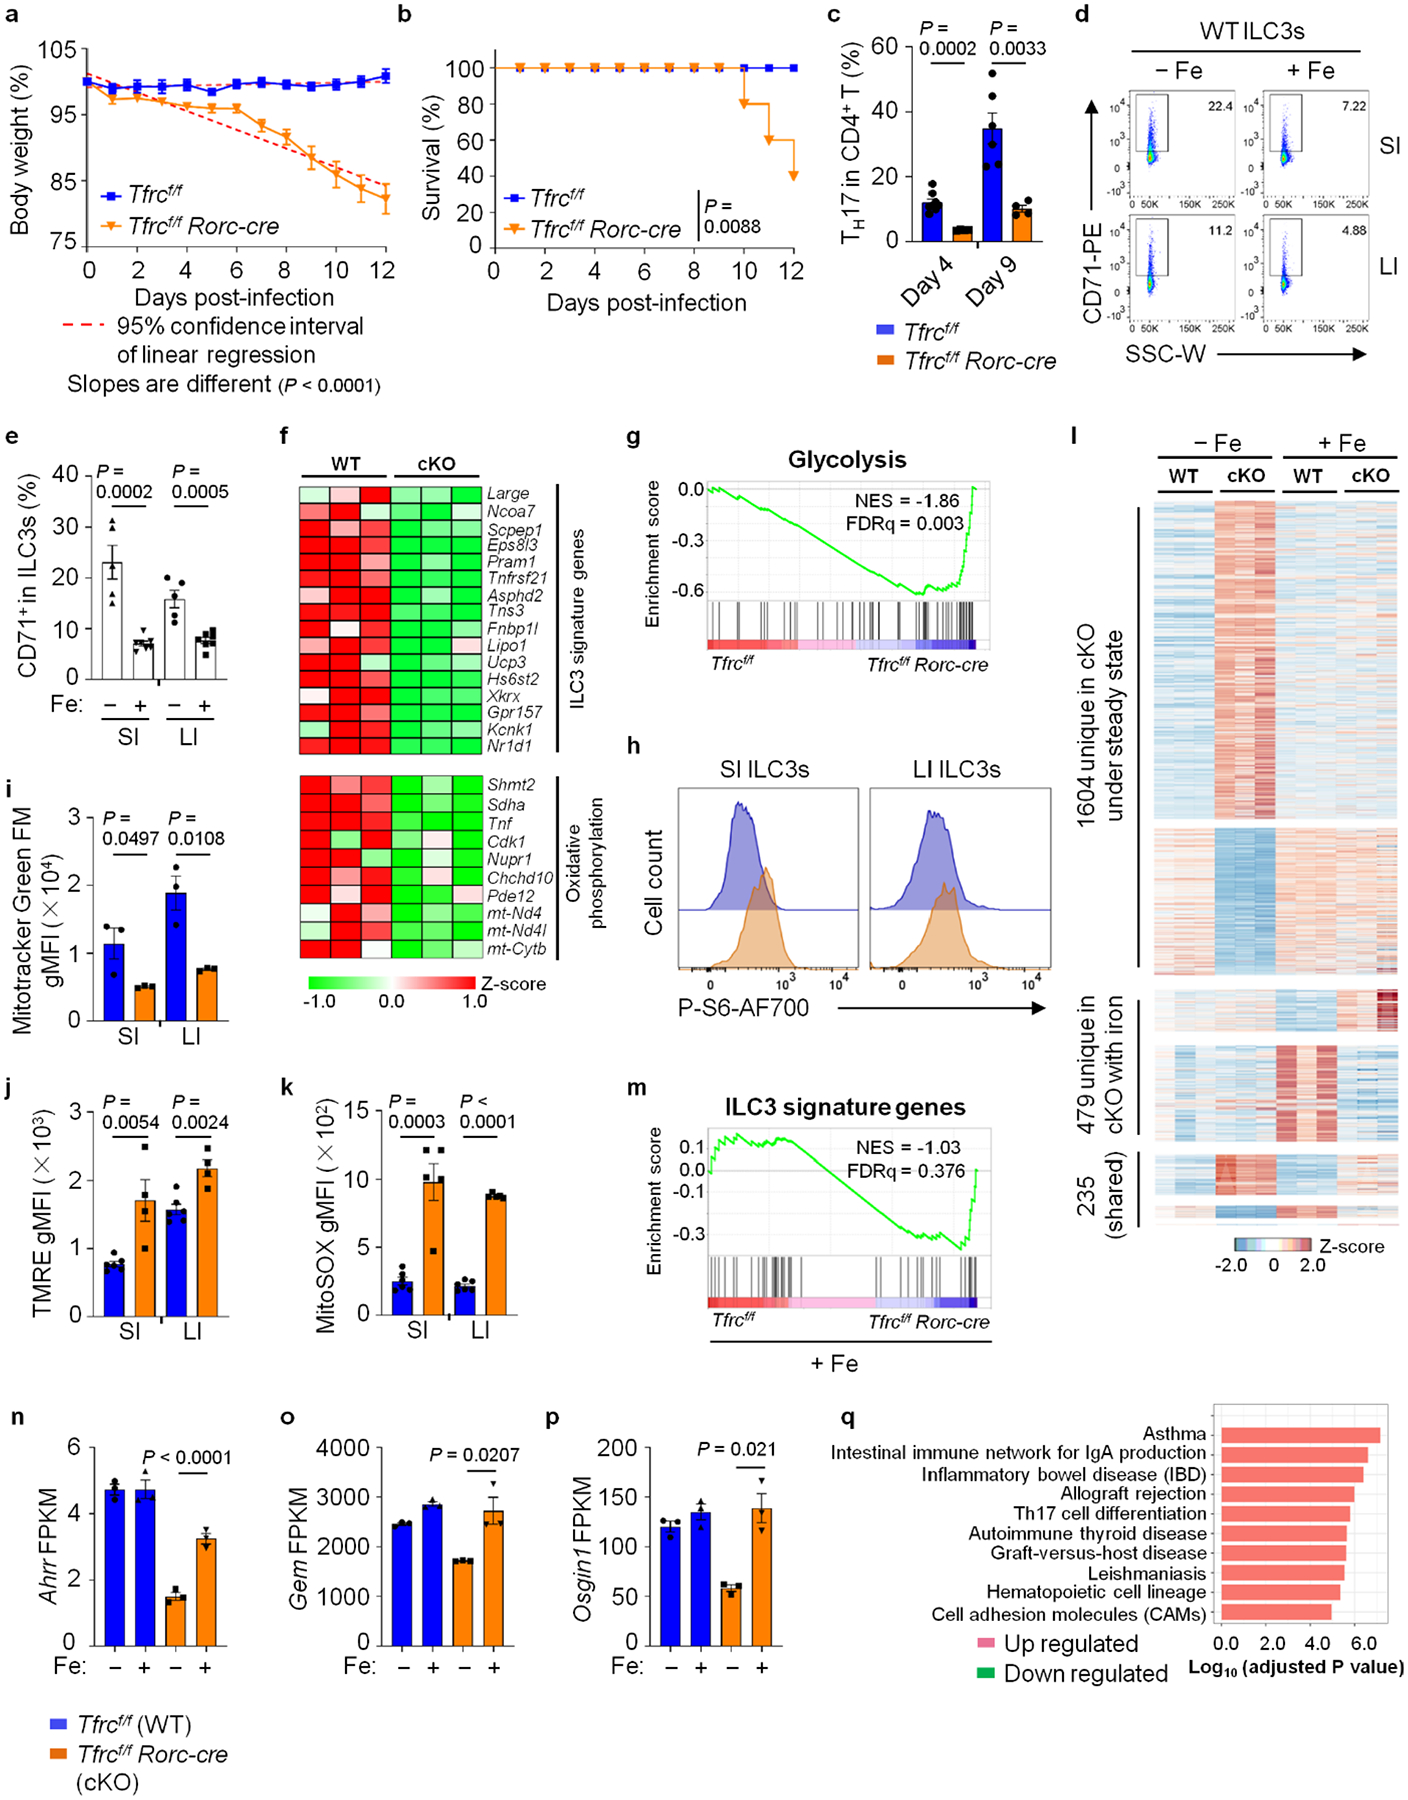
We next determined the role of CD71 in ILC3s during C. rodentium infection. Upon infection, Tfrcf/f Rorc-cre mice rapidly lost body weight and had increased mortality compared to the littermate control cohort (Extended Data Fig. 5a,b). Accordingly, Tfrcf/f Rorc-cre mice had shorter colon length and higher C. rodentium colony-forming unit (c.f.u.) counts in their feces than littermate control mice on 4 and 9 days post infection (d.p.i.) (Fig. 5a,b). On 4 d.p.i. when innate ILC3s are major source of IL-22 (ref. 39), IL-22+ ILC3s were marked reduced in Tfrcf/f Rorc-cre mice compared to the littermate controls (Fig. 5c). Notably, on 9 d.p.i. when TH17-produced IL-22 was markedly induced, compared to the littermate controls, Tfrcf/f Rorc-cre mice also had substantial reduction of TH17 cells, in contrast to the dispensable role of CD71 for steady-state TH17 cells (Extended Data Fig. 5c versus 4d). Together, the data support the notion that the CD71–iron axis is critical for ILC3 and TH17-mediated gut immunity during infection.
Fig. 5 |. CD71 ablation in ILC3s impairs gut immunity to C. rodentium.
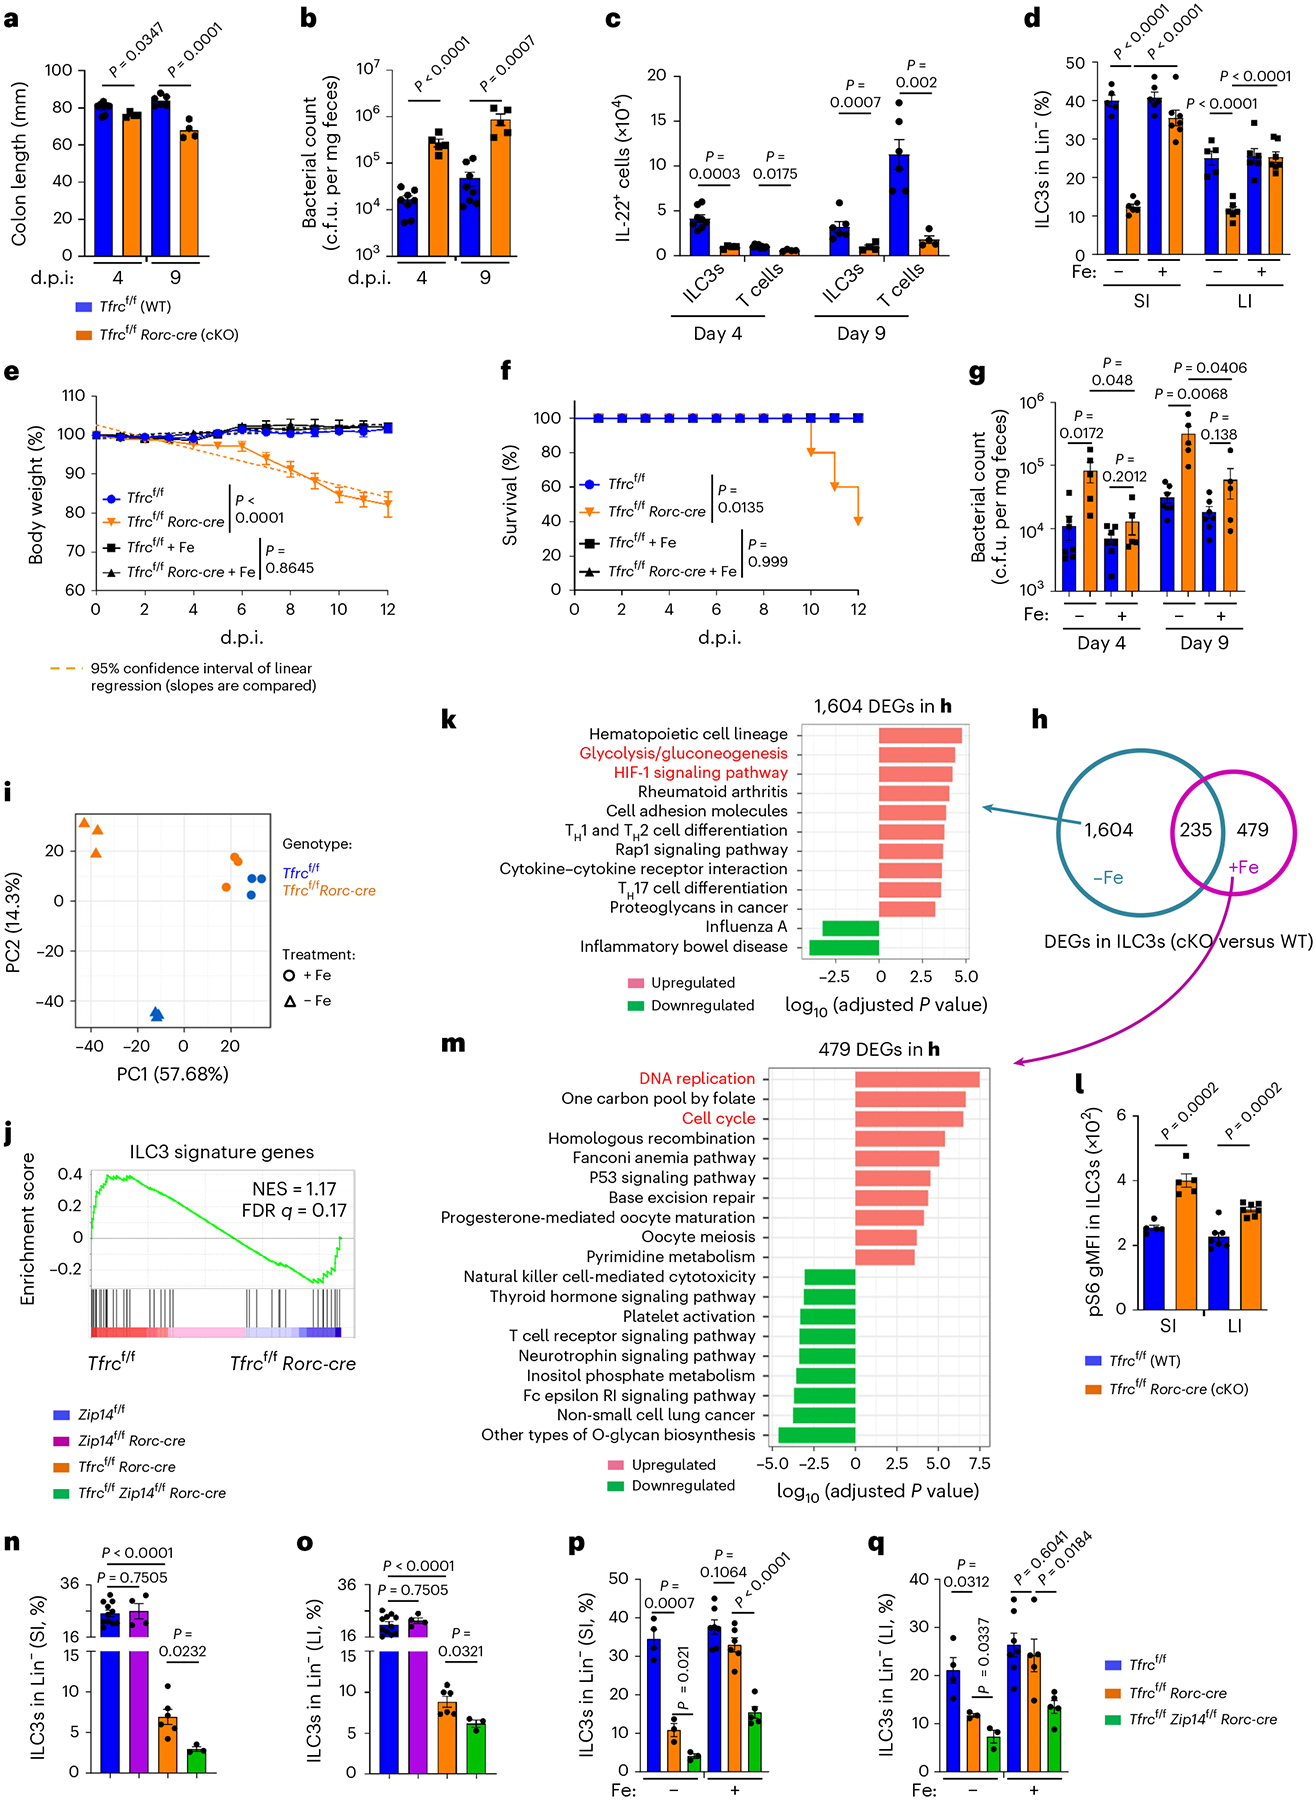
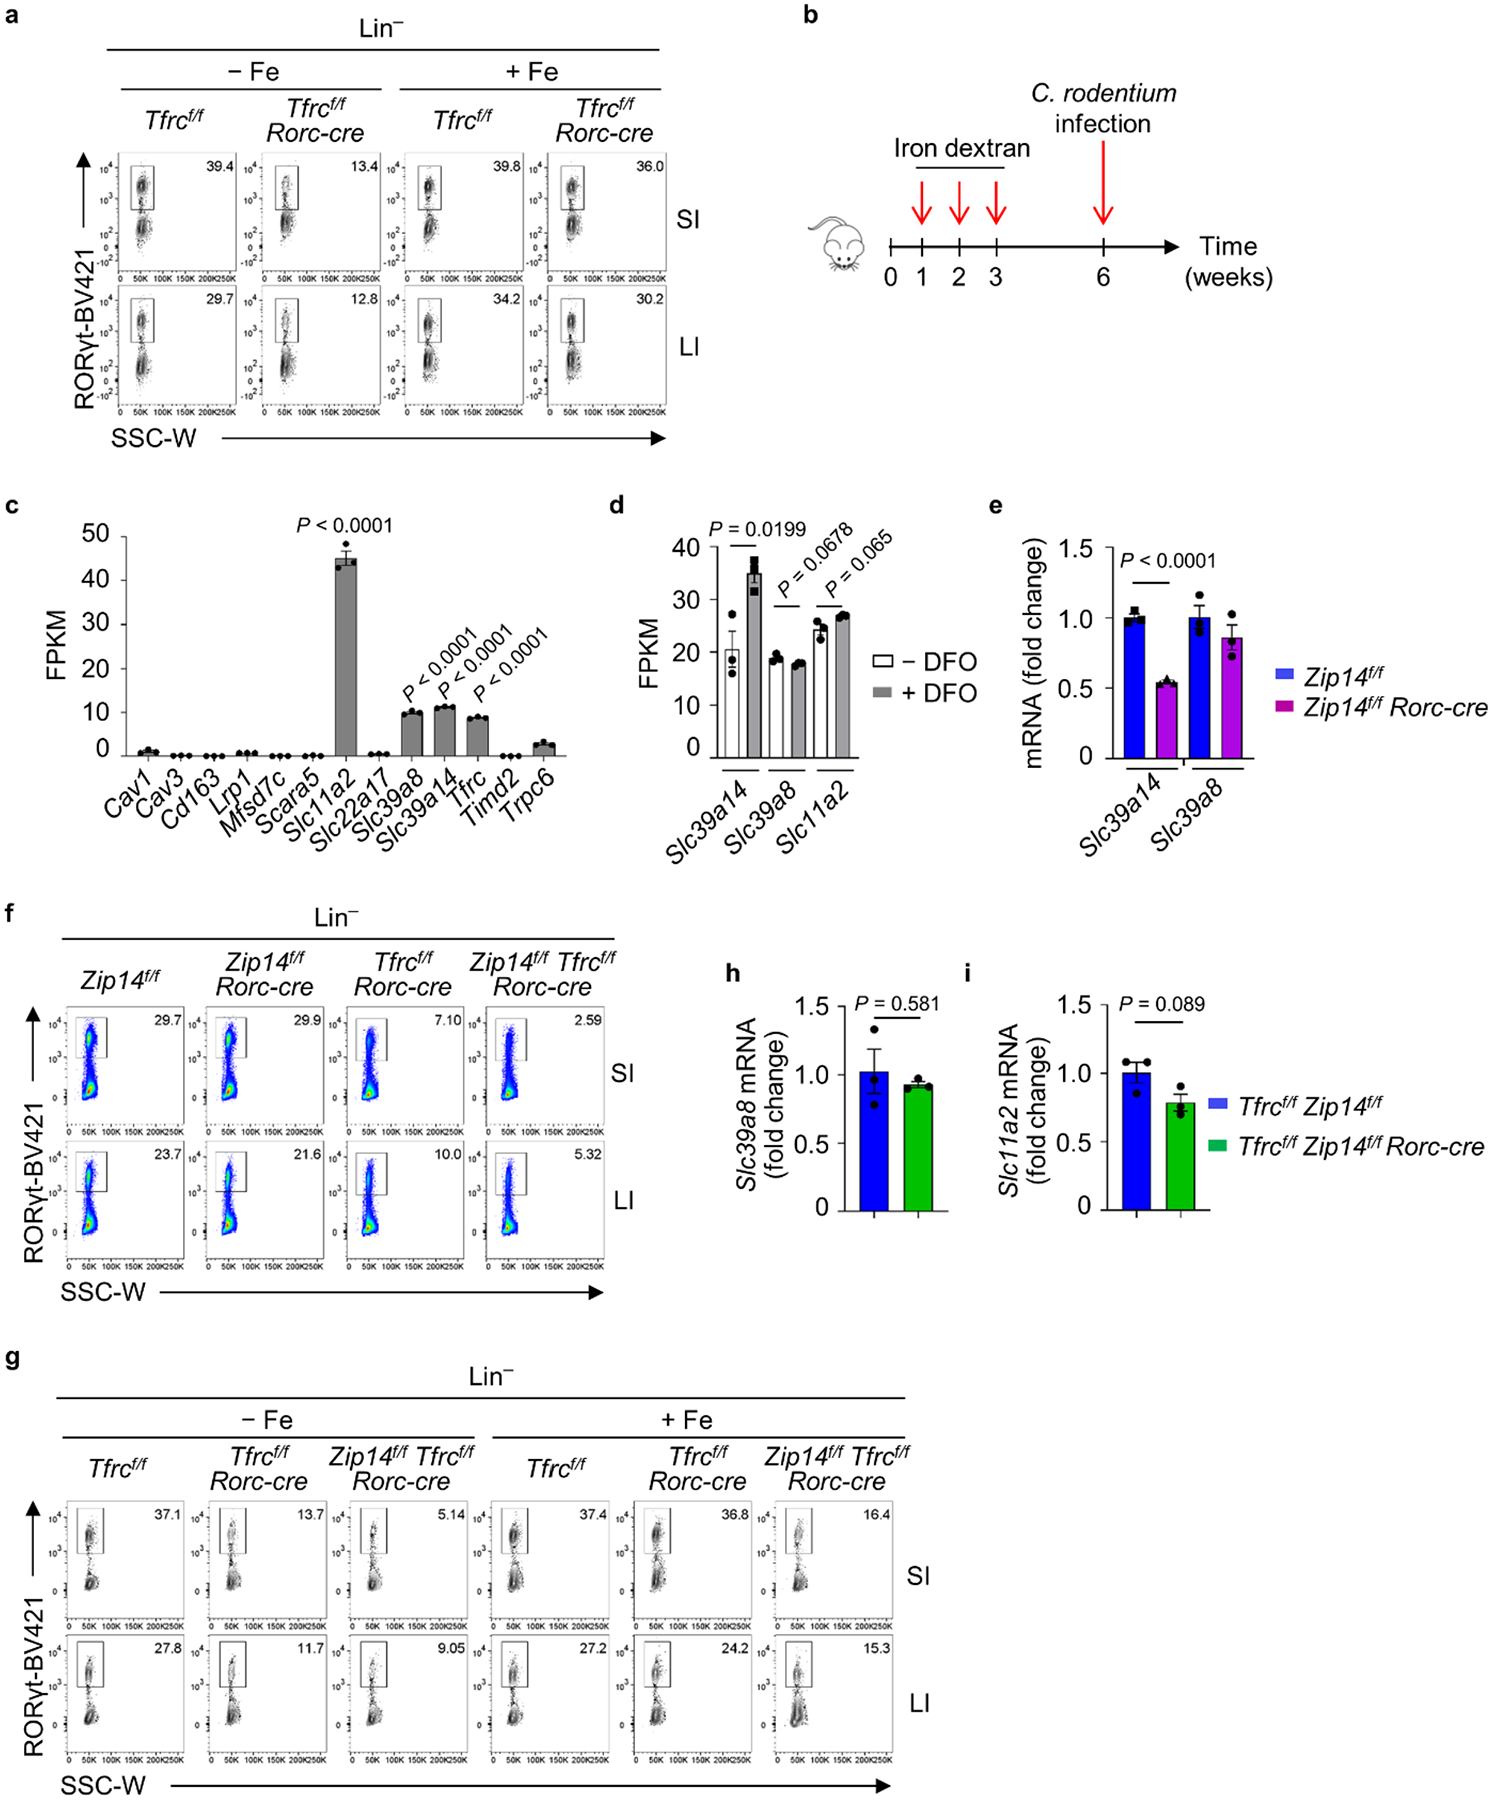
a–c, C. rodentium infection in mice. Colon length (a) and absolute numbers of IL-22+ cells (c) were compiled from two independent experiments (Tfrcf/f, n = 8 and 6 for day 4 and day 9 d.p.i.; Tfrcf/f Rorc-cre, n = 4). Bacterial counts in the feces (b) were compiled from three independent experiments (Tfrcf/f, n = 8; Tfrcf/f Rorc-cre, n = 5). d, Percentages of ILC3s in Lin− LPLs of the indicated mice with or without iron dextran treatment compiled from three independent experiments (Tfrcf/f, n = 5 and 6 for untreated and treated; Tfrcf/f Rorc-cre, n = 6 and 7 for untreated and treated). e–g, C. rodentium infection in the indicated mice with or without iron dextran pre-treatment of two independent experiments (Tfrcf/f, n = 7 per treatment group; Tfrcf/f Rorc-cre, n = 5 per treatment group). Body weight (e), survival (f), fecal bacterial counts of the indicated mice (g). Survival was assessed with the log-rank test. h–m, RNA-seq analysis of SI ILC3s from the indicated mice, with or without iron dextran treatment (n = 3 mice per group). Venn diagrams of DEGs (h) and principal-component analysis (PCA) plot (i). GSEA showing ILC3 signature gene enrichment (j). GO analysis showing the top pathways of 1,604 DEGs (k) and 479 DEGs (m). l, gMFI of pS6 in ILC3s from three independent experiments (SI, n = 5; LI, n = 7). n,o, Percentages of ILC3s in Lin− LPLs of SI (n) and LI (o) from the indicated mice of three independent experiments (Zip14f/f, n = 11; Zip14f/f Rorc-cre, n = 4; Tfrcf/f Rorc-cre, n = 7; Tfrcf/f Zip14f/f Rorc-cre, n = 4). p,q, Percentages of ILC3s in Lin− LPLs of SI (p) and LI (q) from the indicated mice of three independent experiments (Tfrcf/f, n = 4 and 7 for untreated and treated; Tfrcf/f Rorc-cre, n = 3 and 6 for untreated and treated; Tfrcf/f Zip14f/f Rorc-cre, n = 3 and 5 for untreated and treated). See also Extended Data Figs. 5 and 6.
Iron repletion rescues ILC3 defects in Tfrcf/f Rorc-cre mice
Administration of a large dose of iron dextran would result in iron loading of most tissues, including the gut14. To test whether iron repletion could rescue ILC3 defects in Tfrcf/f Rorc-cre mice, we administered iron dextran at postnatal (P)7, P14 and P21 day. As expected, iron administration repressed CD71 expression significantly in ILC3s of littermate control mice (Extended Data Fig. 5d,e). Iron repletion not only restored ILC3 numbers in the gut of Tfrcf/f Rorc-cre mice to comparable level of control littermates under steady-state (Fig. 5d and Extended Data Fig. 6a), but also protective mucosal immunity of ILC3s during C. rodentium infection (Fig. 5e–g and Extended Data Fig. 6b). These data support a cell-intrinsic role of CD71 to promote ILC3s and suggest that iron-dependent rescue of ILC3s in Tfrcf/f Rorc-cre mice is presumably due to increased circulating NTBI uptake caused by iron overloading15.
We further performed RNA-seq analysis of SI ILC3s of Tfrcf/f or Tfrcf/f Rorc-cre mice, without (steady state) or with iron dextran treatment. Under steady state, 1,839 DEGs (q value ≤ 0.05, fold change ≥ 1.5) out of 10,870 expressed genes (FPKM ≥ 1) (Fig. 5h,i) caused by Tfrc deficiency were identified. Specifically, GSEA showed that Tfrc deficiency downregulated the ILC3 signature transcriptional program (Fig. 5j). Furthermore, genes involved in OXPHOS pathway were downregulated (Extended Data Fig. 5f), whereas the genes involved in glycolysis/gluconeogenesis and HIF-1 signaling pathways were enriched in the upregulated genes (Fig. 5k and Extended Data Fig. 5g). mTORC1 activity was upregulated in ILC3s by Tfrc ablation (Fig. 5l and Extended Data Fig. 5h). Furthermore, mitochondrial dysfunction was observed in Tfrc-ablated ILC3s (Extended Data Fig. 5i–k). Together, these data showed that the metabolic switch and oxidative stress caused by Tfrc deficiency in ILC3s may compromise cell fitness.
Notably, after iron dextran treatment, the majority of steady-state DEGs (1,604 out of 1,839) caused by Tfrc deficiency in SI ILC3s disappeared, whereas a small fraction of DEGs (235 out of 1,839) that were dependent on Tfrc could not be rescued (Fig. 5h,i and Extended Data Fig. 5l). These data suggest that iron repletion largely reversed the gene expression alteration caused by Tfrc deficiency in ILC3s. Indeed, GSEA of genes expressed in WT and Tfrc-deficient ILC3s of mice upon iron administration showed that iron repletion rescued the ILC3 signature gene pathway defect that was otherwise evident at steady state (compare Extended Data Fig. 5m and Fig. 5j; false discovery rate (FDR) q ≤ 0.25 significant40). We further noted that Ahr activity as indicated by Ahrr, Gem and Osgin1 expression was also largely restored by iron treatment in Tfrc-deficient ILC3s (Extended Data Fig. 5n–p). Notably, a distinct set of 479 DEGs caused by Tfrc deficiency were revealed after iron treatment, among which DNA replication and cell-cycle gene pathways were upregulated (Fig. 5h,m and Extended Data Fig. 5l,q), in agreement with ILC3 restoration by iron repletion in Tfrcf/f Rorc-cre mice. Together, these data suggest that the CD71–iron axis plays a key role in shaping ILC3 transcriptional program that regulates ILC3 maintenance and function.
Zip14 is a NTBI transporter in ILC3s
Iron dextran-mediated ILC3 rescue in Tfrcf/f Rorc-cre mice suggested a potential role for alternative NTBI transporters in ILC3s. Using ILC3 RNA-seq analysis we examined various iron transporters that have been reported to be expressed in different cell types6 and observed that in addition to Tfrc (CD71), there was notable expression of another three NTBI transporters with FPKM ≥ 1, namely Slc11a2 (encoding DMT1), Slc39a14 (encoding Zip14) and Slc39a8 (encoding Zip8) (Extended Data Fig. 6c) in ILC3s. Zip14 was a previously known NTBI transporter required for iron overload effect in mice8. In addition, selective upregulation of Slc39a14 (Zip14) but not Slc11a2 or Slc39a8 was observed by iron depletion in MNK-3 cells (Extended Data Fig. 6d). Thus, we developed Zip14f/f Rorc-cre mice in which Slc39a14 mRNA was markedly reduced in ILC3s (Extended Data Fig. 6e). Contrary to CD71 deficiency (Tfrcf/f Rorc-cre mice), Zip14f/f Rorc-cre mice had unaltered ILC3 numbers (Fig. 5n,o and Extended Data Fig. 6f), consistent with the notion that CD71 is the primary iron transporter in ILC3s, while other NTBI receptors such as Zip14 did not play a major role in iron transport at least in the presence of CD71. Of note, combined deletion of Zip14 and CD71 (Zip14f/f Tfrcf/f Rorc-cre) led to further ILC3 reduction (Fig. 5n,o and Extended Data Fig. 6f), suggesting that Zip14, presumably as an alternative iron transporter in the absence of CD71, plays an important role in ILC3s.
Furthermore, in contrast to the full restoration of ILC3s in Tfrcf/f Rorc-cre mice, ILC3 numbers in the gut of Zip14f/fTfrcf/f Rorc-cre mice were still greatly reduced after iron repletion (Fig. 5p,q and Extended Data Fig. 6g). Of note, the expression of other NTBI transporters (Zip8 and DMT1) did not change significantly by iron dextran treatment (Extended Data Fig. 6h,i). Together, these data suggest that Zip14 is an important alternative NTBI transporter in ILC3s, especially in the absence of CD71.
Microbiota inhibit CD71 expression in an Ahr-dependent manner
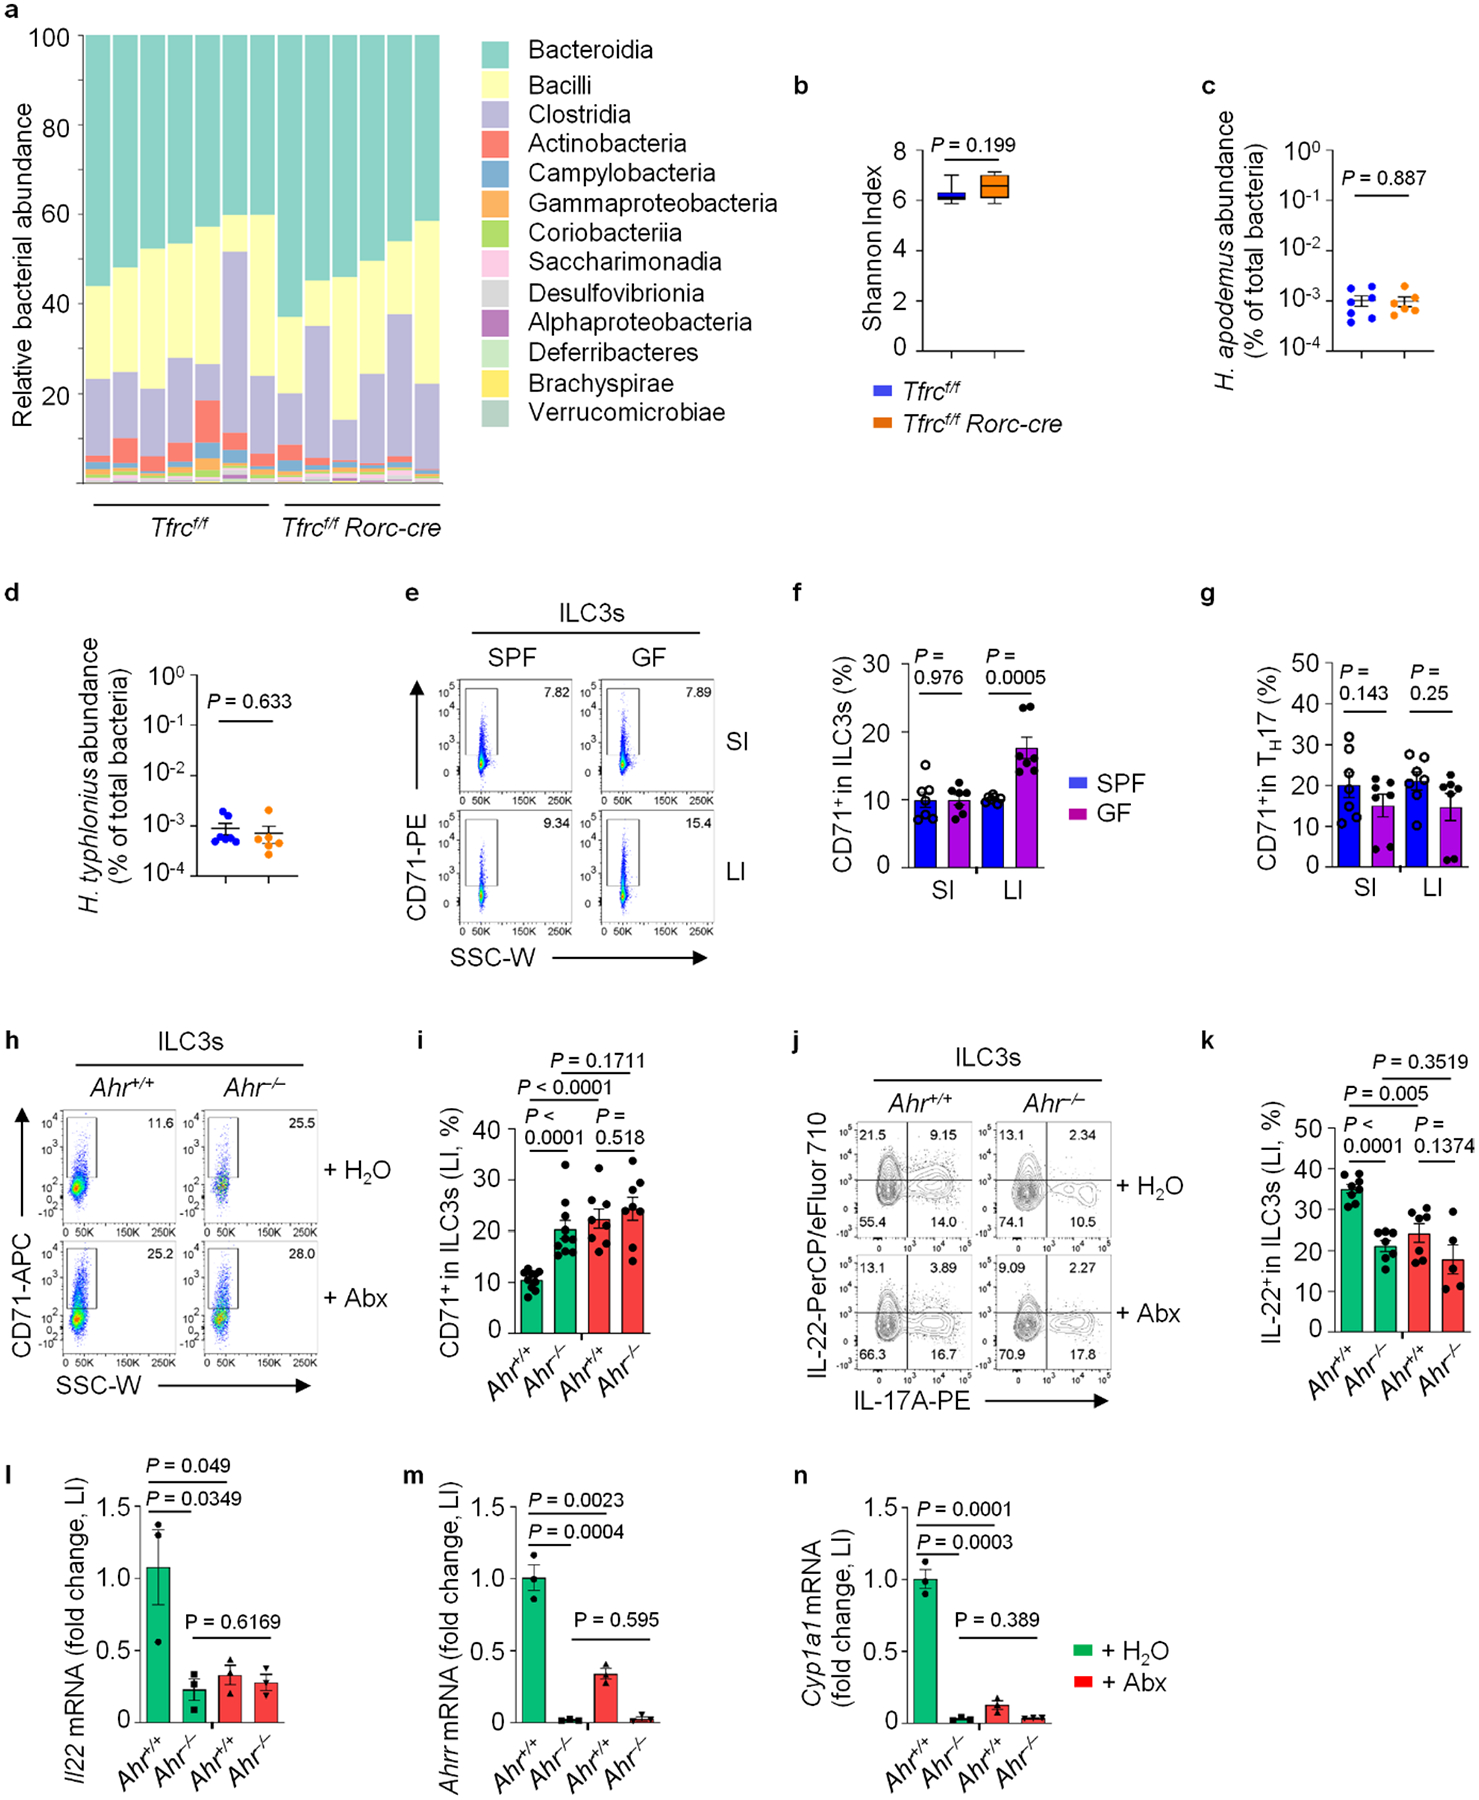
To further determine whether the intestinal ILC3 reduction in Tfrcf/f Rorc-cre mice resulted from potential dysbiosis, we analyzed the fecal microbiome composition in Tfrcf/f Rorc-cre or littermate control Tfrcf/f mice using 16S rRNA gene sequencing. No evident alteration was observed in microbiota composition or diversity (Shannon index) in Tfrcf/f Rorc-cre mice (Extended Data Fig. 7a,b). Furthermore, the abundance of two Helicobacter species, Helicobacter apodemus and Helicobacter typhlonius, which are known to decrease ILC3 numbers41, did not show significant difference between Tfrcf/f Rorc-cre and Tfrcf/f mice (Extended Data Fig. 7c,d), supporting a model that ILC3 reduction in Tfrcf/f Rorc-cre mice is caused by Tfrc gene deficiency but less likely due to stochastic event of dysbiosis.
Compared to the specific-pathogen-free (SPF) controls, germ-free (GF) mice had markedly higher CD71 expression in LI ILC3s, but not in TH17 cells (Extended Data Fig. 7e–g), indicating microbiome-mediated inhibition of CD71 in ILC3s. Consistently, antibiotic cocktail (abx) treatment significantly enhanced CD71 expression in LI ILC3s of WT SPF mice (Extended Data Fig. 7h,i). Commensal bacteria by producing ligands could activate Ahr in the gut42,43 and Ahr activity was indeed reduced by abx treatment as indicated by the decreased IL-22 expression in ILC3s (Extended Data Fig. 7j,k) and mRNA of Ahr target genes (Il22, Ahrr and Cyp1a1) (Extended Data Fig. 7l–n). Notably, there was no further increase of CD71 expression in Ahr-deficient LI ILC3s upon abx treatment (Extended Data Fig. 7h,i), suggesting the Ahr-dependent inhibition of CD71 expression by microbiota.
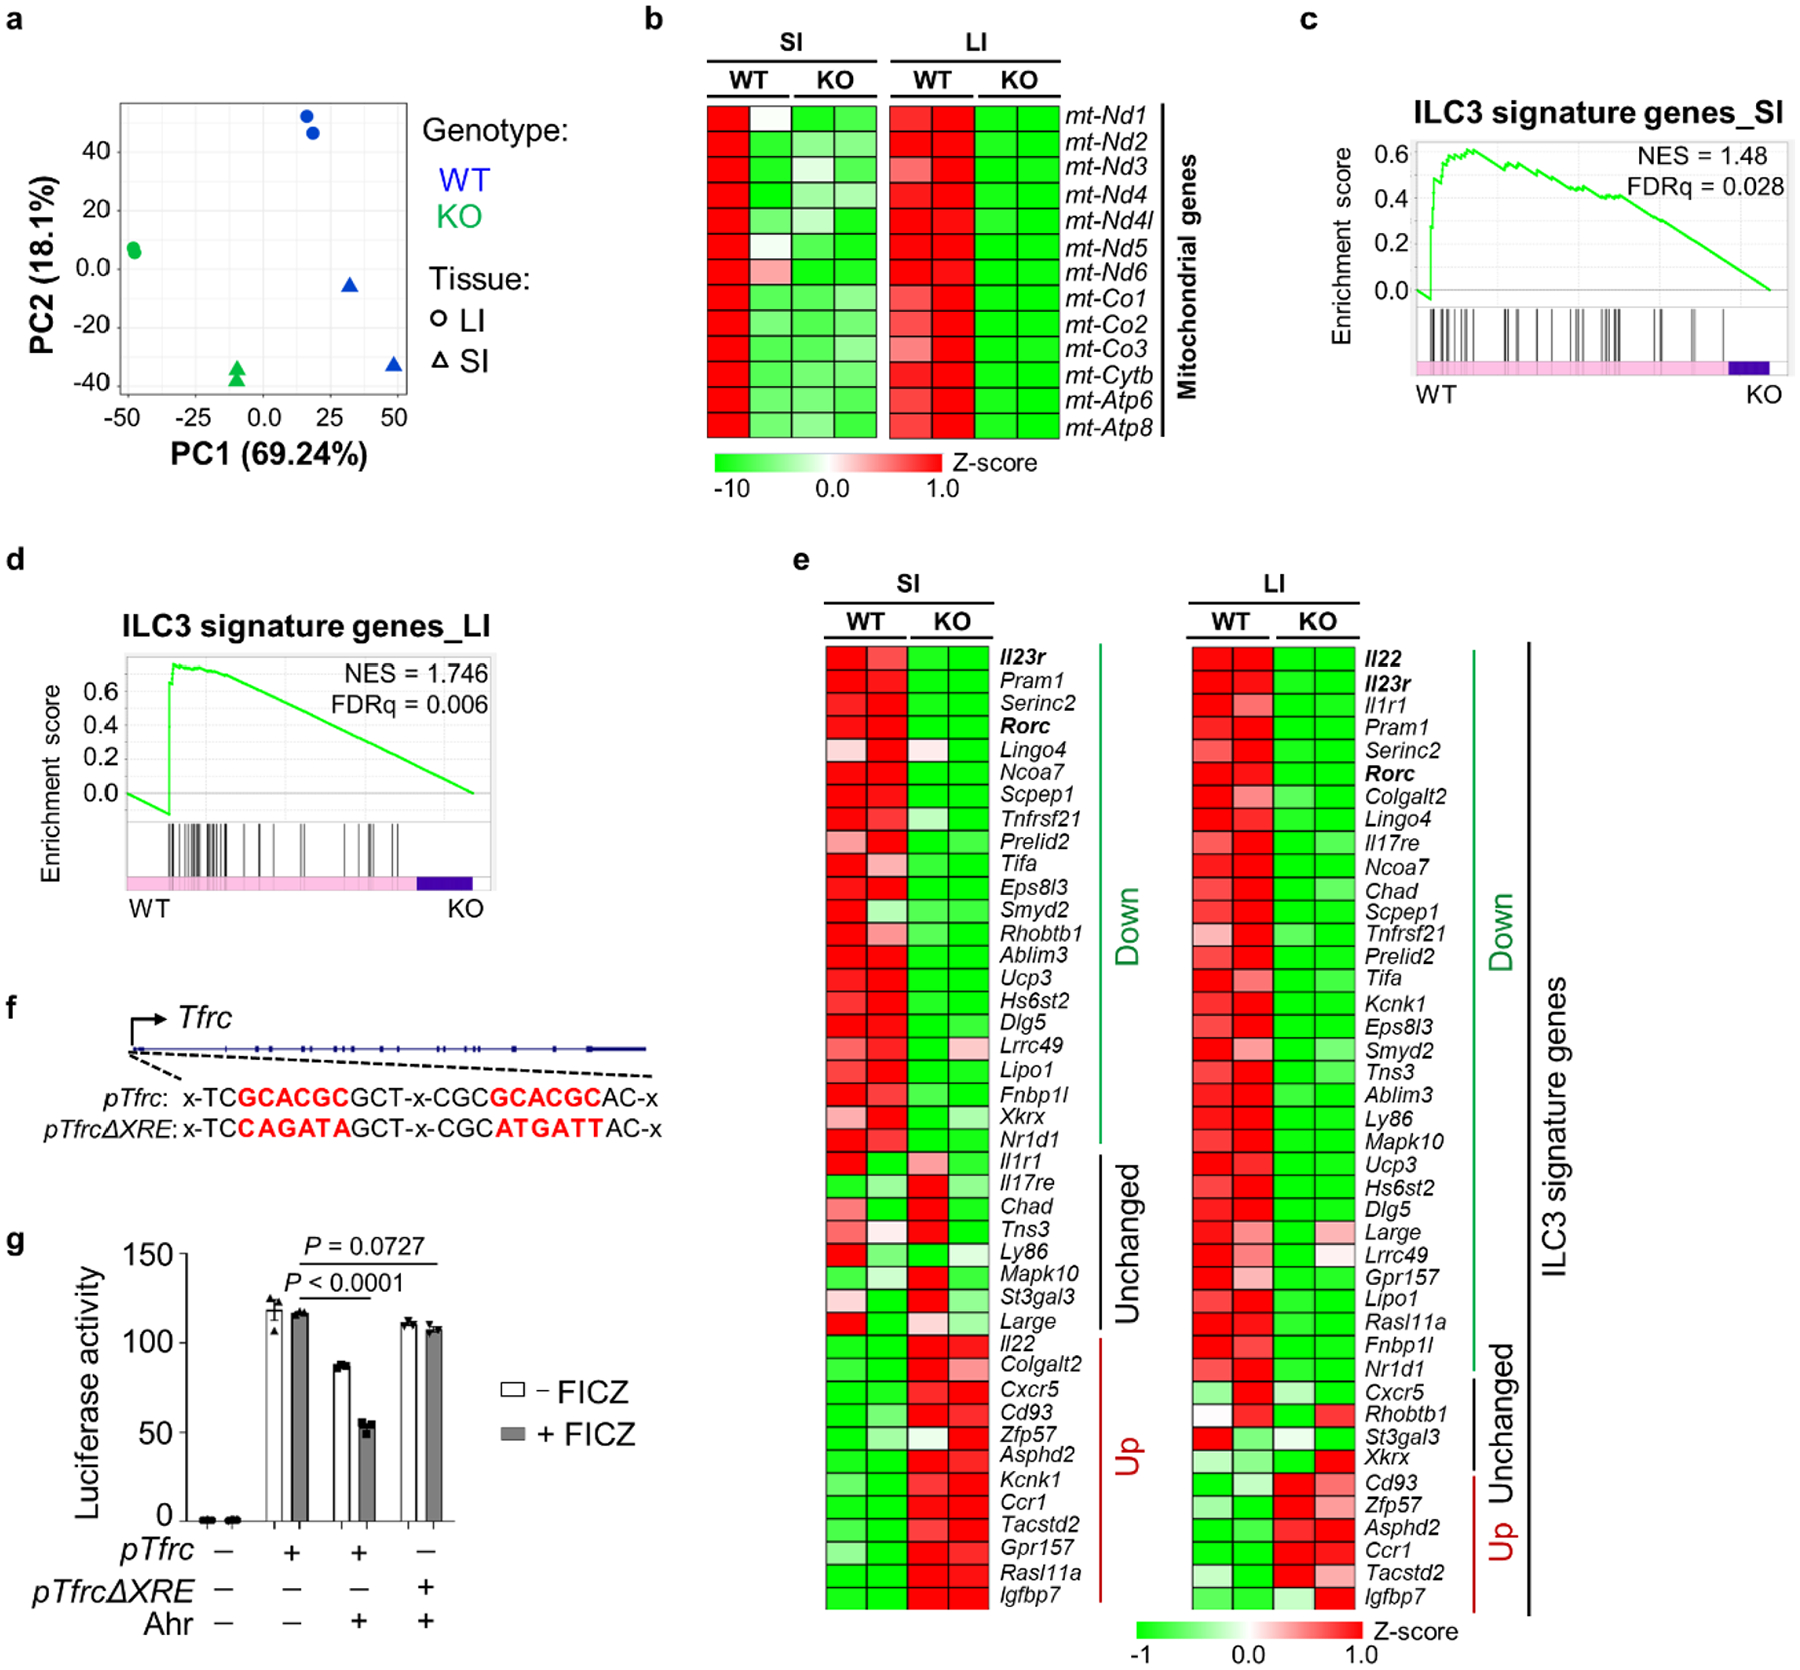
Fig. 7 |. Ahr regulates CD71 transcription by directly binding to the Tfrc locus.
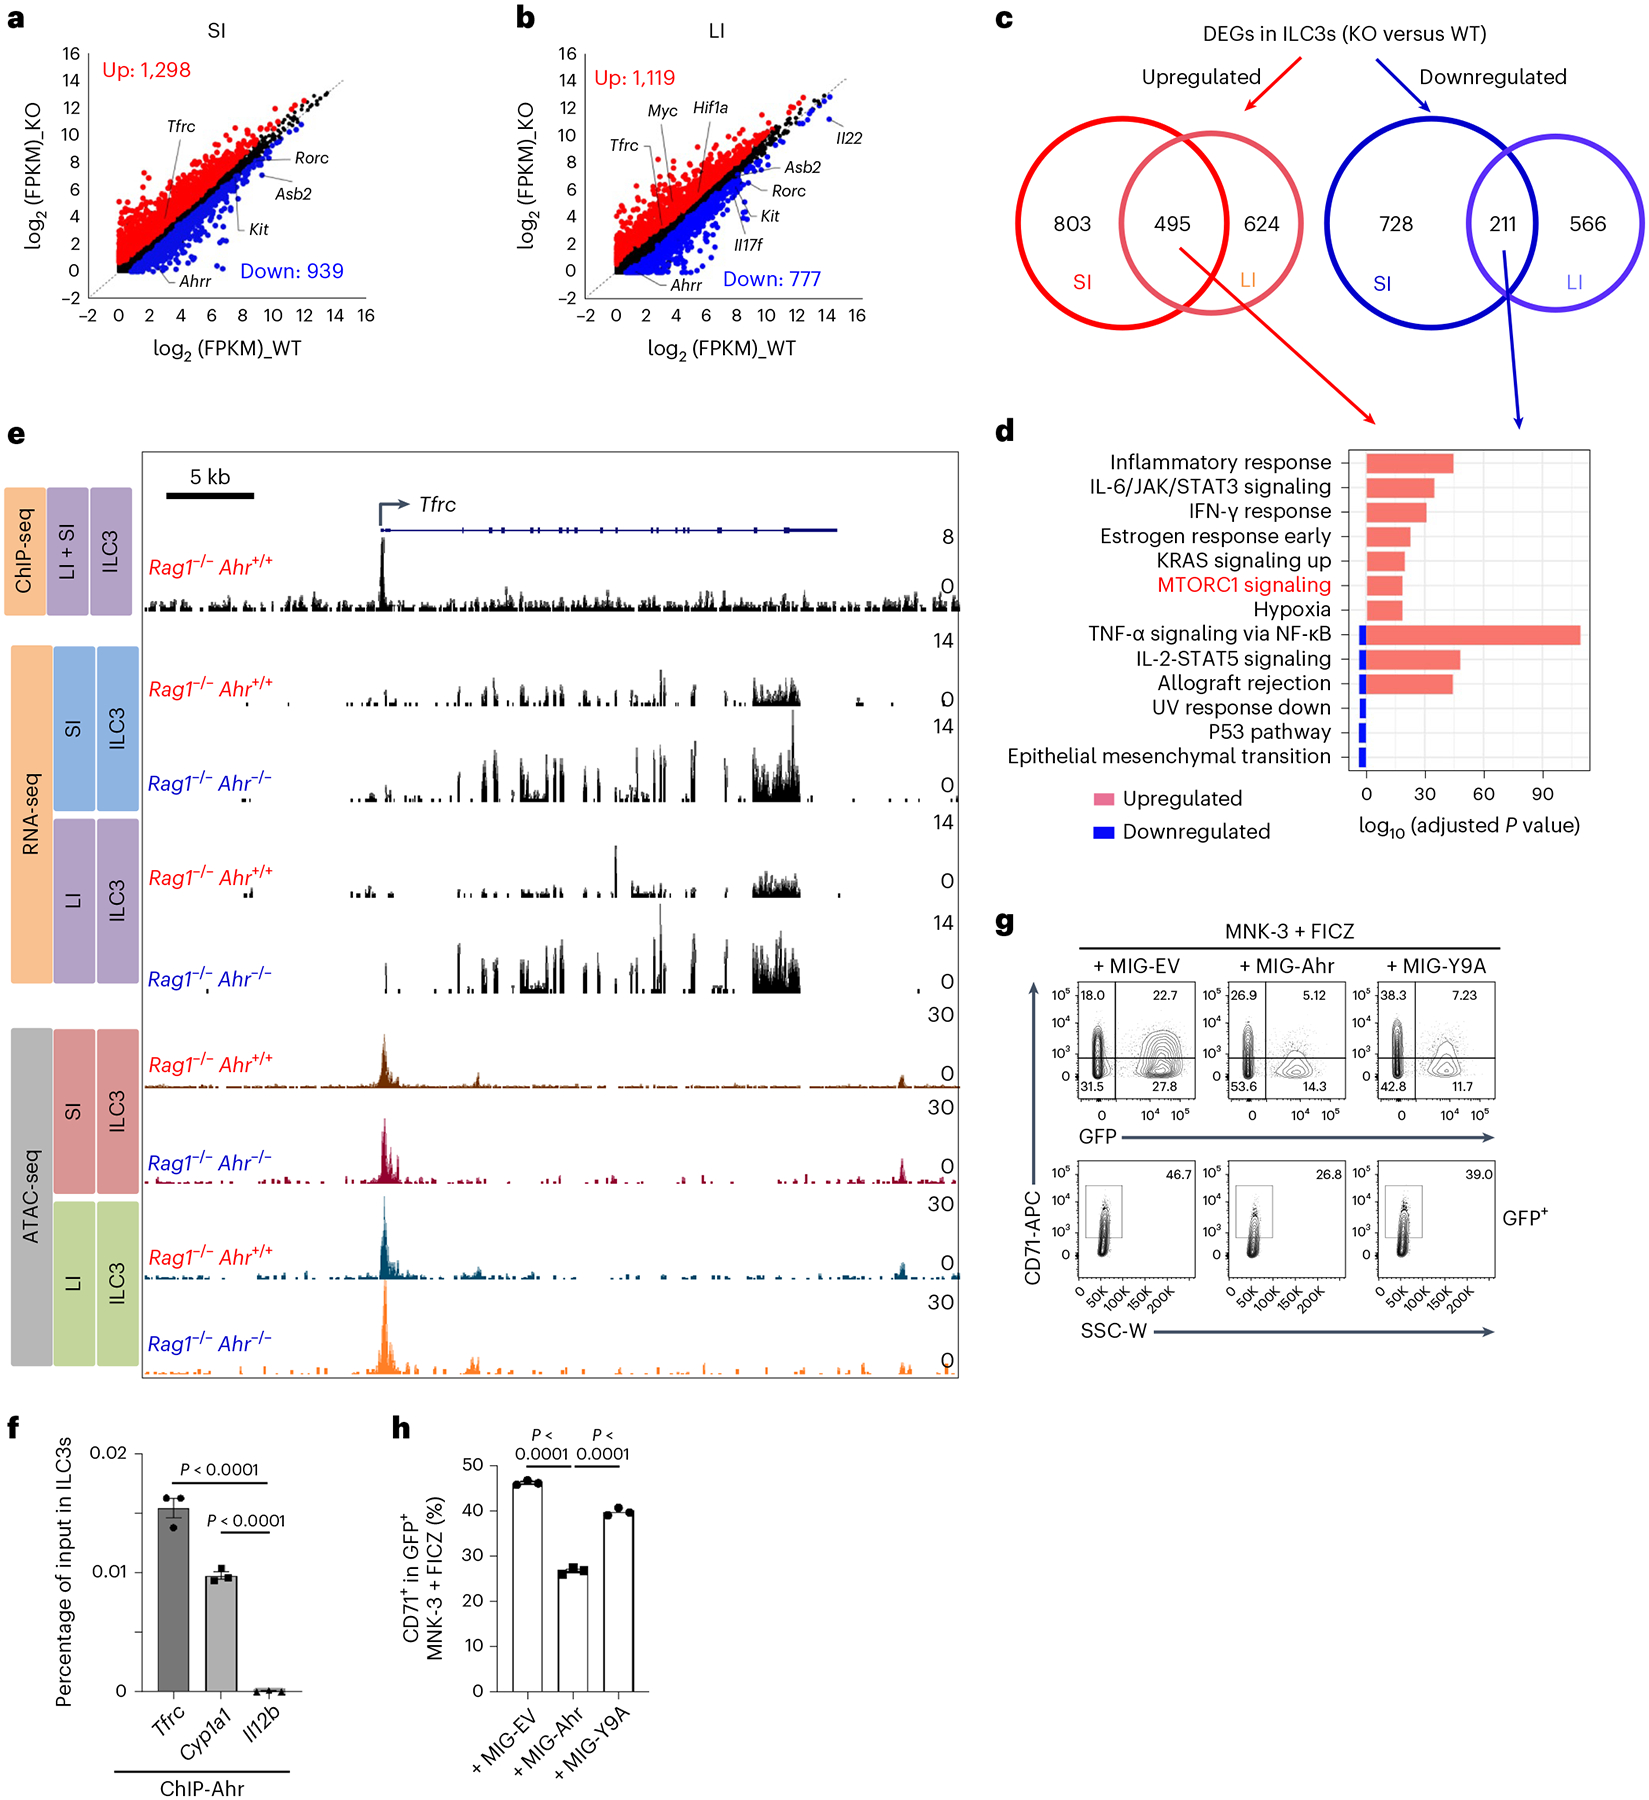
a–d, RNA-seq analysis of FACS-sorted ILC3s from SI and LI LPLs of Rag1−/−Ahr+/+ (WT) and Rag1−/−Ahr−/− (KO) littermate mice (n = 2 mice per group). Scatter-plot of log2 (FPKM) gene expression in SI (a) and LI (b) ILC3s of RNA-seq analysis. DEGs (KO versus WT, fold change ≥ 1.5, q value ≤ 0.05) are highlighted in red (upregulated) and blue (downregulated), respectively. Venn diagrams of DEGs identified by RNA-seq indicate the shared DEGs regulated by Ahr between SI and LI ILC3s (c). GO analysis showing the top pathways of the shared DEGs between SI and LI (cKO versus WT) (d). e, ChIP-seq (this study), recruitment of Ahr to the Tfrc locus in FACS-sorted gut ILC3s (SI + LI) as measured by ChIP-seq. RNA-seq (this study), representative RNA-seq tracks at the Tfrc locus in FACS-sorted ILC3s from SI and LI LPLs of Rag1−/−Ahr+/+ and Rag1−/−Ahr−/− littermate mice. ATAC-seq45: Representative ATAC-seq tracks at the Tfrc locus in FACS-sorted ILC3s from SI and LI LPLs of Rag1−/−Ahr+/+ and Rag1−/−Ahr−/− littermate mice. f, ChIP assay of ILC3s FACS-sorted from gut LPLs of Rag1−/−Ahr+/+ mice. Enrichment of Ahr at the promoter region of Tfrc locus was determined by real-time qPCR and data are representative of two independent experiments (n = 3 reactions per group compiled from one experiment). Cyp1a1 and Il12b loci were used as positive and negative controls, respectively. g,h, FACS analysis of CD71 expression in MNK-3 cells transduced with retroviral constructs encoding MIG-Ahr or control (MIG-EV). The cells were treated with FICZ on day 2 following transduction. Representative FACS plot of two independent experiments (g) and percentages of CD71+ cells in GFP+ MNK-3 cells. Data are representative of two independent experiments (n = 3 biologically independent replicates per group compiled from one experiment) are shown (h). See also Extended Data Fig. 10.
Ahr cell-intrinsically inhibits CD71 transcription in ILC3s
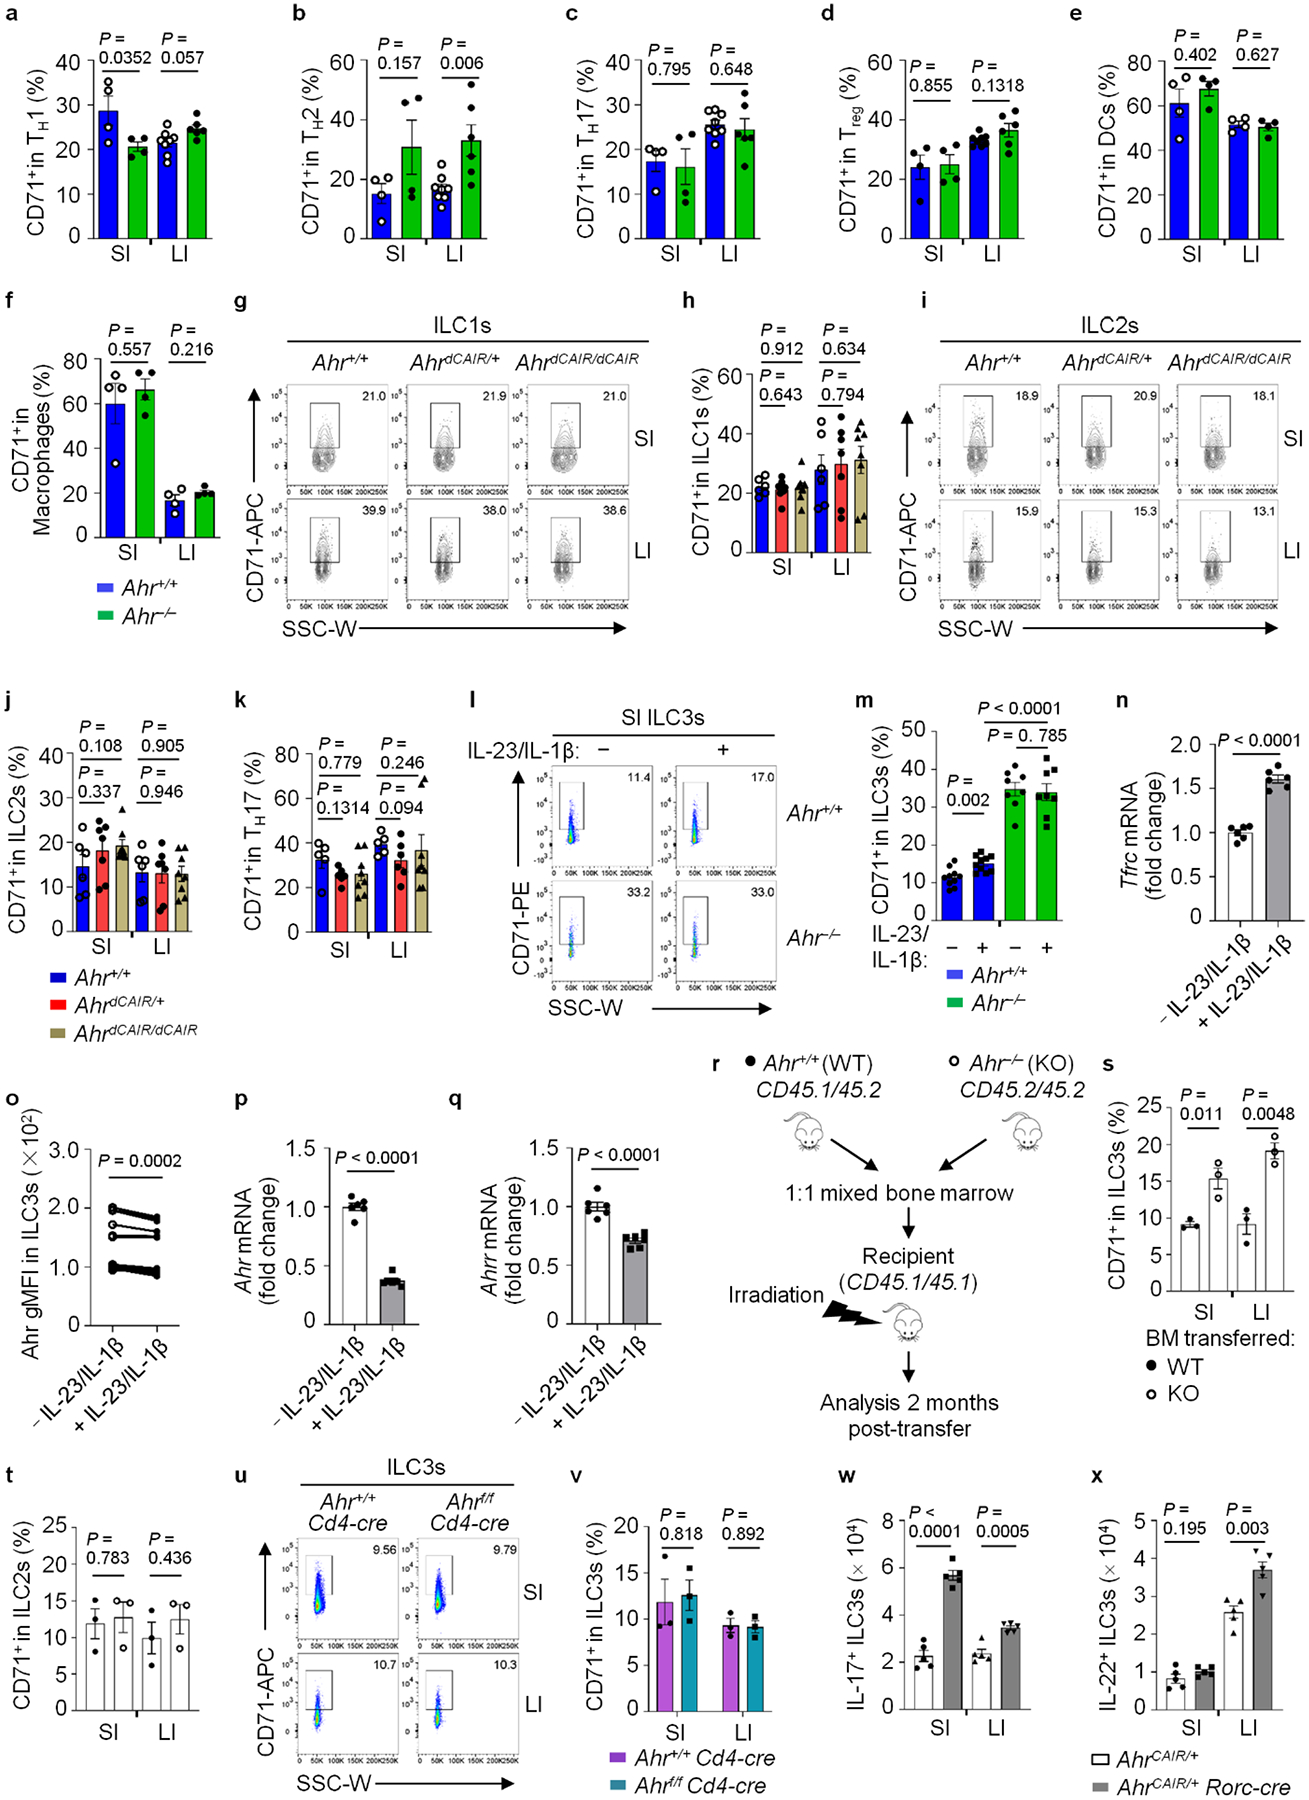
Next, we employed both loss-of-function and gain-of-function genetic models of Ahr to determine whether Ahr regulates iron homeostasis via modulating CD71 expression. Despite unchanged expression in other cell types, CD71 expression was increased in SI and LI ILC3s of Ahr−/− mice compared to littermate controls (Fig. 6a–d and Extended Data Fig. 8a–f). On the contrary, activation of Ahr in AhrdCAIR mice, in which constitutively active (CA-Ahr) is expressed from the endogenous Ahr locus in all cells44, repressed CD71 expression in ILC3s but not in other innate lymphoid cells or TH17 cells (Fig. 6e,f and Extended Data Fig. 8g–k). Together, these data suggest that Ahr specifically suppresses CD71 expression in ILC3s.
Fig. 6 |. Ahr cell-intrinsically inhibits CD71 transcription in ILC3s.
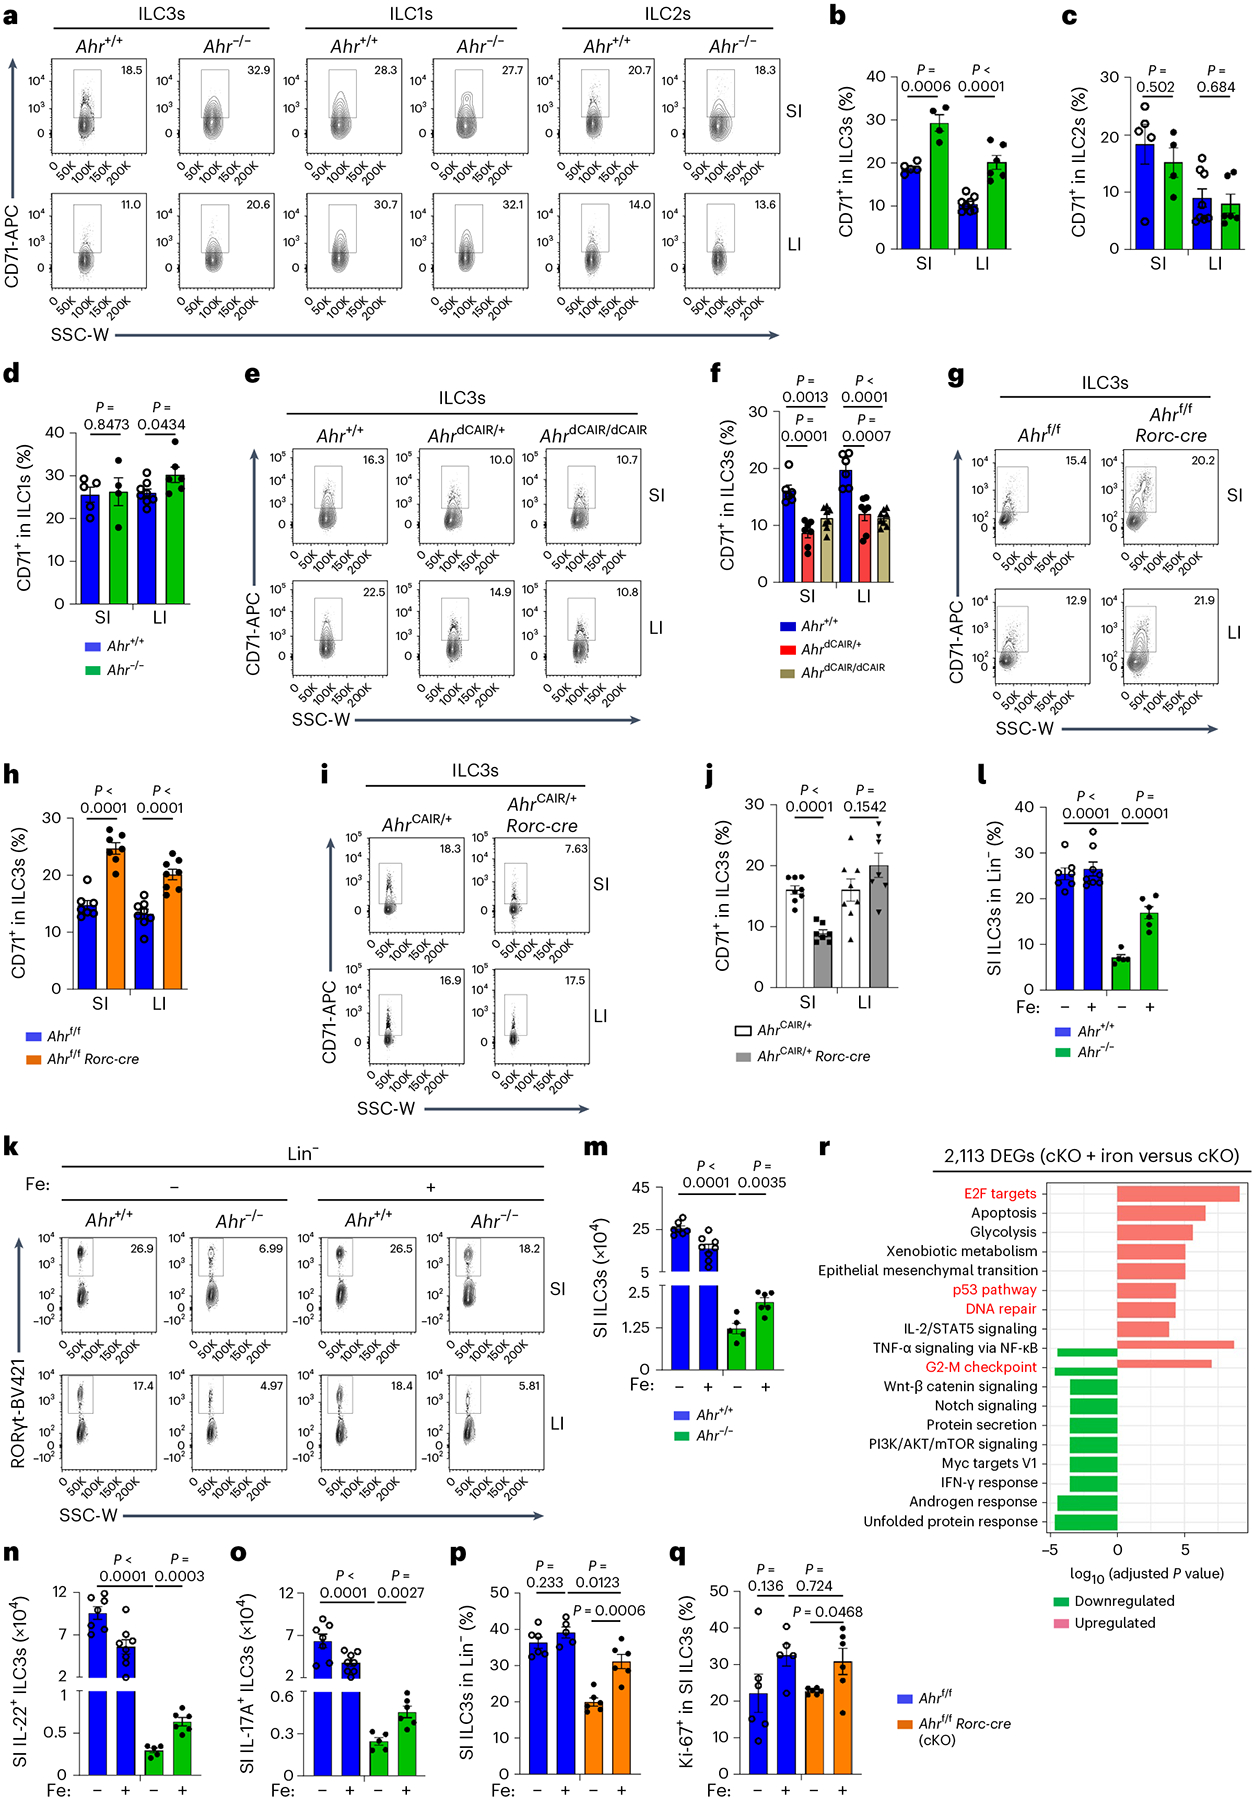
a–d, FACS analysis of CD71 expression in ILC3s, ILC1s and ILC2s of the indicated mice. Representative FACS plot (a) and percentages of CD71+ cells in ILC3s (b), ILC2s (c) and ILC1s (d) from three independent experiments (Ahr+/+, n = 5 and 8 for SI and LI; Ahr−/−, n = 4 and 6 for SI and LI). e,f, FACS analysis of CD71 expression in ILC3s of the indicated mice. Representative FACS plot (e) and percentages of CD71+ cells in ILC3s compiled from three independent experiments (Ahr+/+, n = 6; AhrdCAIR/+, n = 7; AhrdCAIR/dCAIR, n = 8) (f). g,h, FACS analysis of CD71 expression in ILC3s of the indicated mice. Representative FACS plot (g) and percentages of CD71+ cells in ILC3s compiled from four independent experiments (Ahrf/f, n = 7 and 9 for SI and LI; Ahrf/f Rorc-cre, n = 7 and 8 for SI and LI) (h). i,j, FACS analysis of CD71 expression in ILC3s of the indicated mice. Representative FACS plot (i) and percentages of CD71+ cells in ILC3s compiled from three independent experiments (AhrCAIR/+, n = 8; AhrCAIR/+ Rorc-cre, n = 7) (j). k–o, FACS analysis of RORγt expression in Lin− LPLs and IL-22+ and IL-17A+ ILC3s of the indicated mice from three independent experiments (Ahr+/+, n = 7 and 8 for untreated and treated; Ahr−/−, n = 5 and 6 for untreated and treated). Representative FACS plot (k), percentages of SI ILC3s in Lin− LPLs (l) and absolute numbers of SI ILC3s (m). n,o, Absolute numbers of SI IL-22+ (n) and IL-17A+ ILC3s (o). p,q, Percentages of SI ILC3s in Lin− LPLs (p) and percentages of Ki-67+ cells in SI ILC3s of the indicated mice compiled from three independent experiments (q) (Ahrf/f, n = 6 and 5 for untreated and iron-treated; Ahrf/f Rorc-cre, n = 6). r, GO analysis showing the top ten pathways of the 2,113 DEGs identified in RNA-seq (cKO + iron versus cKO) (cKO, Ahrf/f Rorc-cre). See also Extended Data Figs. 7–9.
Furthermore, Ahr ablation led to enhanced CD71 expression in ILC3s stimulated with proinflammatory cytokines IL-1β and IL-23 ex vivo (Extended Data Fig. 8l,m), suggesting that Ahr inhibits CD71 expression during inflammation. Ahr expression and Ahr activity as indicated with Ahrr were reduced in sorted WT ILC3s treated with IL-1β and IL-23 (Extended Data Fig. 8n–q). Accordingly, IL-1β and IL-23 stimulation enhanced CD71 expression in WT ILC3s but not in Ahr-deficient ILC3s (Extended Data Fig. 8l,m).
We next performed a mixed bone-marrow (BM) transfer experiment. Specifically, BM from Ahr−/− (CD45.2/CD45.2) and WT (CD45.1/CD45.2) mice were transferred into lethally irradiated CD45.1/CD45.1 recipient mice (Extended Data Fig. 8r). ILC3s, but not other innate lymphoid cells such as ILC2s, derived from Ahr−/− BM expressed more CD71 than those from WT BM in chimeric mice (Extended Data Fig. 8s,t), indicating that Ahr acts in a cell-autonomous manner to regulate CD71 expression in ILC3s. Additionally, compared to littermate control mice, CD71 expression in ILC3s from Ahrf/f Rorc-cre mice but not Ahrf/f Cd4-cre mice was significantly increased (Fig. 6g,h and Extended Data Fig. 8u,v). On the other hand, AhrCAIR/+ Rorc-cre mice, in which CA-Ahr is expressed specifically in RORγt+ cells, exhibited significantly lower CD71 expression in SI ILC3s compared to littermate control mice (Fig. 6i,j). Of note, IL-17A+ and IL-22+ ILC3 numbers were increased in AhrCAIR/+ Rorc-cre mice (ref. 45; Extended Data Fig. 8w,x) and constitutive activation of Ahr in RORγt+ lymphocytes, including ILC3s, was known to confer sufficient protective immunity in mice against C. rodentium45, suggesting that Ahr activation in AhrCAIR/+ Rorc-cre mice enhances ILC3 function despite reduction of CD71. Collectively, these data demonstrate that Ahr cell-intrinsically downregulates CD71 expression in ILC3s.
Iron treatment alleviates ILC3 defects in Ahr-deficient mice
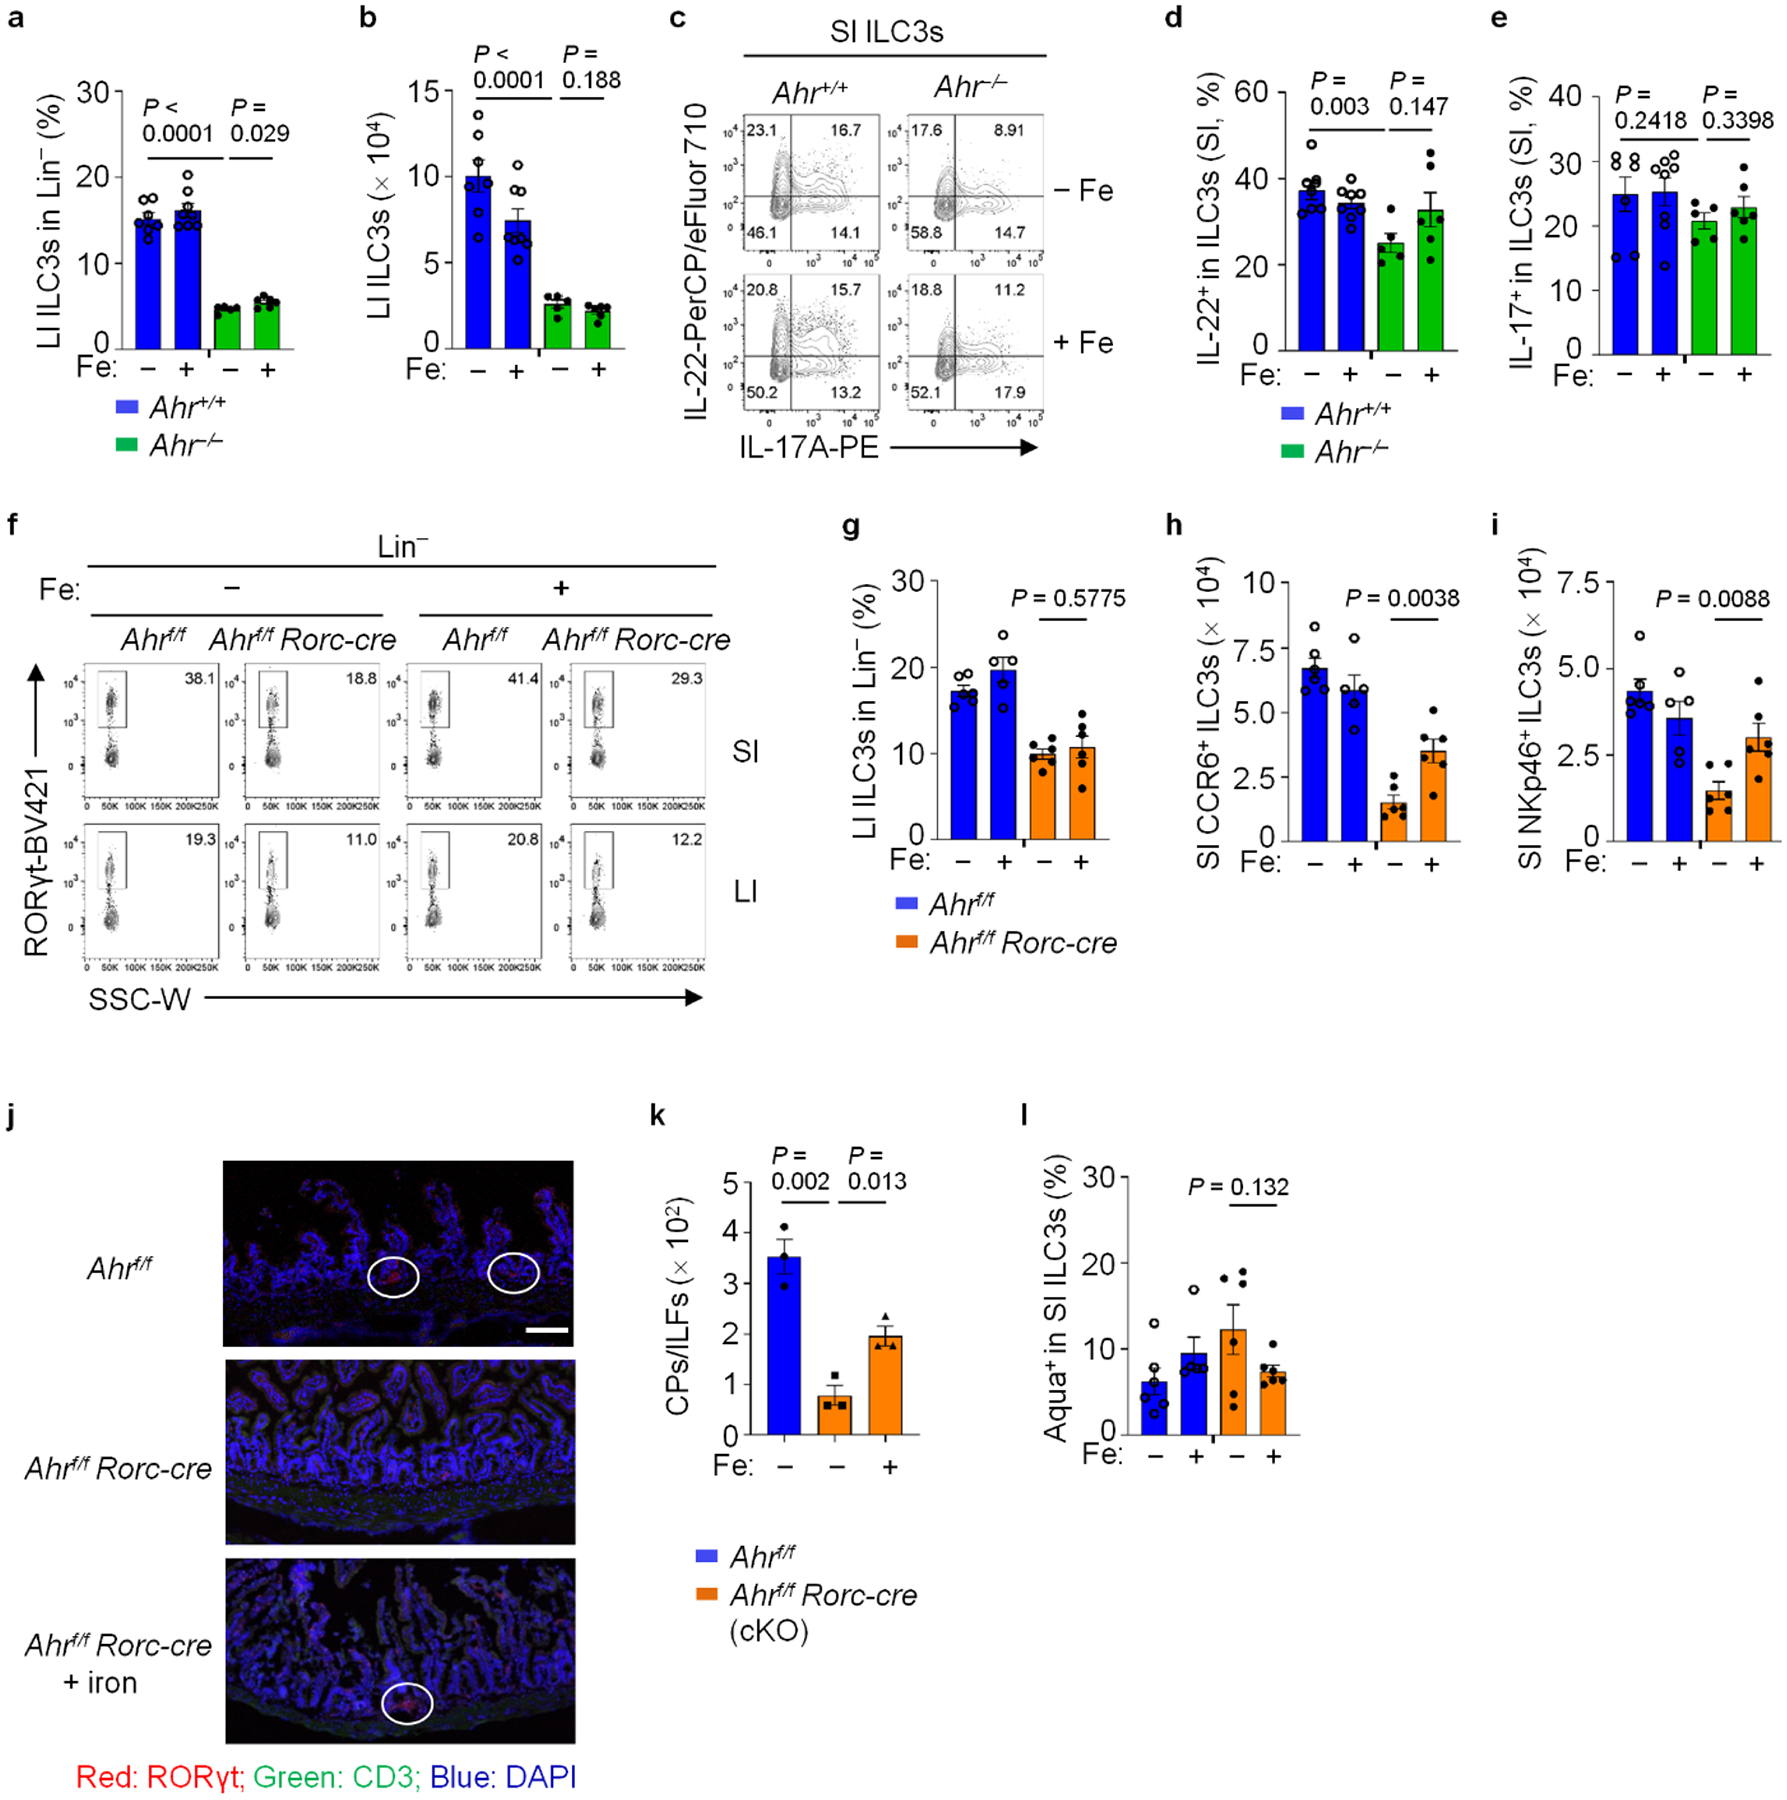
To determine the role of CD71–iron axis in Ahr-directed ILC3 regulation, we administered iron dextran to Ahr−/− mice at P7, P14 and P21. Iron administration partially restored SI but not LI ILC3s in Ahr−/− mice and no further increase of ILC3s was observed in control groups (Fig. 6k–m and Extended Data Fig. 9a,b). Although iron administration had no significant impact on the expression of IL-17A and IL-22 on a per-cell basis or the percentages of IL-17+ and IL-22+ ILC3s (Extended Data Fig. 9c–e), it increased IL-22+ and IL-17A+ SI ILC3 numbers in Ahr−/− mice (Fig. 6n,o). Of note, both NKp46+ ILC3s and CCR6+ ILC3s were increased in Ahr-deficient mice upon iron treatment (Fig. 6p and Extended Data Fig. 9f–i). Iron administration also increased cryptopatches (CPs) and intestinal lymphoid follicles (ILFs) in SI of Ahr-deficient mice (Extended Data Fig. 9j,k). Iron-mediated ILC3 partial rescue in SI of Ahrf/f Rorc-cre mice was through a mechanism involving increased ILC3 proliferation rather than survival (Fig. 6q and Extended Data Fig. 9l).
To further determine the molecular mechanisms by which iron increased ILC3s in Ahr-deficient mice, we performed RNA-seq analysis on SI ILC3s of Ahrf/f Rorc-cre mice, with or without iron dextran treatment. Overall, 2,113 DEGs (q value ≤ 0.05, fold change ≥ 1.5) out of 11,443 expressed genes (FPKM ≥ 1) were identified. GO analysis on the 2,113 DEGs showed that iron administration upregulated certain pathways related to cell proliferation, including E2F targets, G2-M checkpoint, DNA repair and p53 pathways (Fig. 6r), consistent with iron dextran-enhanced proliferation of SI ILC3s, especially in Ahrf/f Rorc-cre mice (Fig. 6q). Together, these data show that CD71 compensatory upregulation in Ahr-deficient ILC3s allows partial rescue of ILC3 numbers but not their function by iron supplement, consistent with the extensive ILC3 gene program regulated by Ahr.
Ahr regulates CD71 by directly binding to the Tfrc locus
RNA-seq analysis to compare the global transcriptome between Ahr-deficient and Ahr-sufficient gut ILC3s, identified 2,237 and 1,896 DEGs (q value ≤ 0.05, fold change ≥ 1.5) out of 12,638 expressed genes from SI and LI, respectively (FPKM ≥ 1) (Fig. 7a,b). Among these genes, 1,298 were upregulated and 939 were downregulated in SI and 1,119 were upregulated and 777 were downregulated in LI (Fig. 7a–c and Extended Data Fig. 10a). Pathway analysis of the overlapping set of DEGs in SI and LI showed the enrichment of mTORC1 pathway in the upregulated genes (Fig. 7c,d) and all of the 13 mitochondrial genes and majority of ILC3 signature genes were downregulated in Ahr-deficient SI and LI ILC3s (Extended Data Fig. 10b–e), phenocopying the mitochondrial dysfunction and concomitant enhancement of glycolysis observed in ILC3s upon iron depletion or with Tfrc deficiency and DFO-treated MNK-3 cells (Figs. 1, 3 and 5). Collectively, these data indicate that iron depletion impairs mitochondrial function and switches cellular metabolic pathways, thereby controlling ILC3 maintenance presumably through the Ahr pathway.
We further performed chromatin immunoprecipitation sequencing (ChIP-seq) of Ahr in gut ILC3s and assessed the Ahr binding at the Tfrc locus (about −100 kb to +50 kb from the transcription start site). Of note, only one substantial binding peak was detected at the Tfrc promoter (Fig. 7e). The recruitment of Ahr to this site was further corroborated by Ahr ChIP–qPCR (Fig. 7f). Notably, this Ahr binding peak coincided with the transposase-accessible chromatin sequencing (ATAC-seq) peak identified in gut ILC3s (Fig. 7e and ref. 45), suggesting a relationship between Ahr DNA-binding and chromatin remodeling; however, chromatin accessibility at the Tfrc promoter was largely unchanged in Ahr-deficient ILC3s (Fig. 7e), indicating that chromatin opening at the promoter is a molecular event independent of Ahr.
To determine whether Ahr directly suppressed Tfrc transcription by DNA binding, we transduced MNK-3 cells with a retroviral construct encoding WT Ahr or its DNA-binding mutant (Ahr Y9A, Tyr-to-Ala point mutation at ninth amino acid)38. While WT Ahr transduction decreased CD71 expression, Ahr Y9A blunted its ability to repress CD71 expression (Fig. 7g,h). Two canonical binding motifs of Ahr were identified at the Ahr ChIP-seq peak located at the Tfrc promoter (Extended Data Fig. 10f). Transfection of Ahr suppressed the luciferase reporter activity driven by the WT Tfrc promoter (pTfrc, 1,100 bp) but not the mutant without the Ahr binding motifs (pTfrcΔXRE) (Extended Data Fig. 10g). The regulatory effect of Ahr was also most evident in the presence of Ahr ligand 6-formylindolo[3,2-b]carbazole (FICZ) (Extended Data Fig. 10g). Collectively, our data demonstrate that Ahr suppresses CD71 transcription via direct binding to the Tfrc promoter.
Discussion
Iron homeostasis is regulated by transferrin receptor CD71, the primary receptor responsible for iron uptake. Although CD71 upregulation marks T cell activation and correlates with its proliferative activity46, the functional significance of CD71 expression in lymphocytes is largely unknown. Here, we showed that CD71 plays a cell-intrinsic role to regulate ILC3 fitness in the gut, specifically by promoting ILC3 proliferation and function.
Deletion of CD71 in RORγt-expressing lymphocytes by Rorc-cre in mice reduced ILC3s but not TH17 cells in the gut under steady state; however, Tfrcf/f Rorc-cre mice had a marked reduction in TH17 cells during C. rodentium infection, especially at the later stage of infection when adaptive immunity becomes prominent. Although the precise mechanism remains to be determined, these data suggest a differential requirement for CD71 in maintaining and/or mounting TH17 cell responses under steady state or during infection. Iron homeostasis in the host environment is constantly influenced by actions of the host cells and microbes (both commensal and pathogenic bacteria), a process known as nutritional immunity47,48. Indeed, low dietary iron intake increases host resistance against C. rodentium infection in mice49. Iron could become a limiting nutrition element, especially when the demand is higher. TH17 cell expansion during the later phase of infection probably requires CD71 for its proliferative activity and functional activation. Outgrowth of C. rodentium in Tfrcf/f Rorc-cre mice could further exacerbates the iron limitation due to the competition of the bacteria for iron to propagate.
The pivotal role of iron in ILC3s is mediated through mitochondrial metabolism. Consistently, it has been shown that ablation of a key mitochondrial transcription factor (Tfam) in RORγt+ lymphocytes leads to downregulation of ILC3s but not TH17 cells at least under steady state24. In common, iron deprivation mediated by DFO treatment in vitro and ex vivo, iron-deficient diet in vivo, or genetic ablation of Tfrc in mice disrupted mitochondrial respiration as indicated by the downregulation of OXPHOS. The phenomenon is in accordance with the critical role of iron for mitochondrial function in other cell types14,15; however, there were also differences in impacts on ILC3s by those aforementioned treatments. For example, ILC3s of mice fed an iron-deficient diet and MNK-3 cells treated with DFO in vitro shared phenotypes such as the reduction of cytokines IL-22 and IL-17A; however, ablation of Tfrc in ILC3s decreased gut ILC3s numbers but not cytokine production on a per-cell basis. These differential outcomes may be a result of iron ablation efficiency of various treatments but may also suggest that other non-transferrin receptor could mediate iron uptake and compensate for the loss of CD71. Notably, ablation of an alternative NTBI receptor Zip14 together with CD71 in ILC3s led to more notable reduction of ILC3s even upon iron treatment.
In ILC3s, we identified a new mode of transcriptional regulation of CD71 by Ahr. Our data showed that iron depletion reduced Ahr expression and/or function, which otherwise suppressed the Tfrc transcription. Thus, we favor a model that low iron acts in two ways to enhance CD71 expression through a well-known post-transcriptional stabilization of Tfrc mRNA through IRP50,51 and through relief of Ahr-mediated transcriptional suppression. Ahr binding at the Tfrc promoter suggests a direct inhibition of Tfrc transcription by Ahr in ILC3s; however, recruitment of Ahr to the Tfrc promoter was also detected in other immune cell types, for example, induced regulatory T cells and TH17 cells38, in which CD71 expression did not change after Ahr ablation. These data indicate that the specificity of the Ahr regulatory effect may involve some, yet to be identified, mechanisms in ILC3s.
Tissue microenvironment/imprinting may differentially regulate the CD71–iron axis in ILC3s. Overall, more substantial phenotypes in SI compared to LI were observed in our study. Notably, iron overloading partially rescued ILC3 defects in SI but not LI of Ahr-deficient mice. Indeed, dietary iron is mainly absorbed in SI, highlighting its important impact on ILC3s in this tissue environment. Furthermore, compared to SPF mice, LI but not SI ILC3s of GF mice had significantly higher expression of CD71. The negative correlation of microbiota with CD71 expression seemed to be Ahr dependent, as abx depletion of microbiota in Ahr−/− mice cannot further upregulate CD71 expression. These data support the working model that Ahr, a well-known receptor for microbial metabolites42, inhibits CD71 expression. Precise mechanisms of microbiota regulation of CD71 expression warrant further investigation.
Our finding that Ahr suppresses CD71 expression in ILC3s creates a conundrum, as Ahr and CD71 both play a positive role in ILC3 maintenance (refs. 28–30 and current study). We hypothesize that CD71 upregulation is predominantly a compensatory mechanism caused by Ahr deficiency. In contrast to full restoration of ILC3s in Tfrc-deficient mice, iron administration only partially rescued ILC3 numbers but not their function in Ahr-deficient mice despite the upregulation of CD71 in ILC3s. Tfrc mutation in human causes the primary immunodeficiency and anemia52. Questions such as whether Tfrc mutation in humans could lead to ILC3 dysfunction, whether the microbiota–Ahr–CD71 axis functions in human ILC3s and whether this axis could be targeted therapeutically, such as by iron and/or microbiome manipulation need to be further addressed.
Methods
Mice
All the mice in this study were maintained in SPF or GF facilities at the University of Florida, with a 14:10 h light–dark cycle, temperature of 68–79 °F and humidity of 30–70%. Mice (both sexes) were littermates and were 6–8 weeks old, unless otherwise indicated in the text. Ahr−/−, AhrCAIR, Zip14f/f and Rorc-cre were previously described44,53–55. C57BL/6, Tfrcf/f, Ahrf/f, C57BL/6-SJL (CD45.1), Rag1−/− and Cd4-cre mice were purchased from Jackson Laboratory. All studies with mice were approved by the Animal Care and Use Committee of the University of Florida. For experiments related to mice and cells that were FACS-sorted from mice, age- and sex-matched littermate mice were randomized and used for experiments.
Isolation of intestinal LPLs and flow cytometry
Isolation of intestinal LPLs and flow cytometry were conducted as described previously38. Antibodies were purchased from Invitrogen/eBioscience, BD Pharmingen, BioLegend, TONBO, Abcam, Cell Signaling Tech or Sigma-Aldrich. CD16/32 antibody was used to block nonspecific binding to Fc receptors before all surface staining. For transcription factor staining, cells were fixed and permeabilized with the Foxp3 Staining Buffer Set (eBioscience). For cytokine staining used for flow cytometry analysis, cells were stimulated with 50 ng ml−1 phorbol-12-myristate-13-acetate (PMA) and 500 ng ml−1 ionomycin for 4 h unless indicated otherwise and Brefeldin A (2 μg ml−1) was added 2 h before cell collection. The live and dead cells were discriminated by the Live and Dead Violet Viability kit (Invitrogen) or Zombie Aqua Fixable Viability kit (BioLegend). Lineage marker mix (Lin) contained CD3, CD5, CD19, B220, Ly6G, FcεR1, CD11b, CD11c and Ter119. For staining in ILC1s and natural killer cells, Lin contained CD3, CD5, CD19 and B220. For Fe2+ detection, cells were incubated with Labile Fe2+ Live Cell Dye (5 μM, Sigma-Aldrich, SCT037) at 37 °C for 60 min. Sample acquisition was performed on a FACSCanto II (BD Biosciences) or Aurora (Cytek) and analyzed with FlowJo (v.10.6, Tree Star). FACS-gating strategies for different immune cell populations are shown in Extended Data Fig. 1g.
5-Bromo-2ʹ-deoxyuridine incorporation
BrdU (2 mg per mouse) was intraperitoneally (i.p.) injected into mice twice with a 12-h interval. Mice were killed 12 h after the second BrdU injection. BrdU staining in lymphocytes were performed with Phase-Flow Alexa Fluor 647 BrdU kit (BioLegend, cat. no. 370706).
RNA-seq analyses
ILC3 cells (Lin–CD90hiCD45lo) (ref. 56) were FACS-sorted from the gut of indicated mice (Sony Cell Sorter 800S) and MNK-3 cells were collected after in vitro treatment. RNA was extracted using the RNAeasy Micro kit (TaKaRa), followed by complementary DNA (cDNA) generation with the SMART-Seq HT kit (TaKaRa). Sequencing libraries were generated with the Nextera XT DNA Library Preparation kit (Illumina) and sequenced on the Illumina HiSeq 2500 instrument. FastQC (v.0.11.5) was used to ensure high per-base-sequence quality of reads. Sequenced reads were mapped and raw count values quantified with STAR57 to the Mus musculus genome (GRCm38/mm10 assembly) and filtered for uniquely mapped reads. Quantitated mRNA expression levels, FPKM aligned reads, were calculated based on exon regions using RSEM (v.1.2.25) (ref. 58). DEGs (max FPKM ≥ 1, fold change ≥ 1.5, q value ≤ 0.05) were identified by DESeq2 (v.1.26.0) analysis59. GSEA was performed for GO analysis. Log2-transformed FPKM values were used for PCA in R (v.3.6.2) with the prcomp function and then visualized using the factoextra package (v.1.0.7) and rgl v.0.100.30). Heat maps were created using the R package pheatmap (v.1.0.12). For GO analysis, statistical significance was determined using the two-sided Fisher exact test and P values were adjusted for multiple comparisons using the Benjamini–Hochberg method.
Chromatin immunoprecipitation assay and ChIP-seq
Approximately 10 million ILC3s (Lin–CD90hiCD45lo) were FACS-sorted from the gut LPLs (combined LI and SI) of Rag1−/− mice. For ChIP of Ahr, cells were treated with FICZ (200 nM) for 4 h before collection. Cells were crosslinked with 1% formaldehyde for 15 min. Chromatin was sheared by sonication with Bioruptor Pico (30 s on and 30 s off for 25 cycles) and immunoprecipitated with anti-Ahr (Enzo Life Science, BML-SA210–0100, 2 μg) using iDeal ChIP-seq kit for transcription factors (Diagenode). Eluted DNA was used for qPCR analyses using specific primers (Supplementary Table 1). Samples were sequenced as 50-bp single-end reads on the Illumina HiSeq 2500 instrument.
ChIP-seq analysis
For Ahr ChIP-seq, 39–50 million raw reads were sequenced. FASTQC was used to ensure maximum per-base-sequence quality of sequenced data. For all ChIP-seq datasets, reads were mapped to the mouse genome (mm10) with bowtie2 (v.2.3.3) (ref. 60) and further filtered using SAMtools (v.1.7) (ref. 61). The uniquely aligned reads were used to generate bedgraph files (scaled to 10 million reads) using bedtools (v.2.25.0) (ref. 62). Genome visualization tracks (bedgraph files) were uploaded to UCSC Genome Browser for visual comparison of expression levels63,64. To identify peaks and calculate tag counts from ChIP-seq reads, HOMER (v.4.9.1) (ref. 65) was used with default parameters. Briefly, to cater to transcription factor binding -style factor was used with peak calling parameters: fold enrichment over KO = 4, Poisson P value over local region = 0.0001 and FDR ≤ 0.05. The Normalized Tag Count defined as ‘the number of tags found at the peak, normalized to 10 million total mapped tags’ was acquired from the HOMER peak file, then sorted and visualized using Microsoft Excel (v.1808).
Iron-deficient diet treatment
Littermate pups were weaned at 3 weeks old into two separate cages randomly and fed an ID diet (about 2 ppm iron; TD.99397) or control diet (about 50 ppm iron; TD.99398) (Harlan, irradiated)66 for 3 weeks before analysis.
Iron dextran administration
For iron rescue experiments, mice were i.p. injected with 2.5 mg of iron dextran (25 μl, Uniferon 100) at postnatal day 7 (P7), P14 and P21. Mice were killed at week 4 for steady-state analysis or used for C. rodentium infection at week 6.
Hematological studies
Approximately 20 μl blood was collected from mice using MPA Micropipette (Boule Medical). Complete blood counts were obtained with a HemaTrue Veterinary Hematology Analyzer (HESKA).
Antibiotics treatment
Mice were gavaged daily with 200 μl per day of broad-spectrum abx, including 1 g l−1 ampicillin, 1 g l−1 neomycin, 1 g l−1 metronidazole, 500 mg l−1 vancomycin and 1 g l−1 gentamycin) dissolved in water for 2–3 weeks.
Luciferase reporter assay
The mouse Tfrc promoter (−1,000 bp to +100 bp) was PCR-amplified and cloned upstream of the luciferase gene in the pGL2-Basic vector (Promega), resulting in the pTfrc-pGL2b construct. Luciferase assays were performed in HEK293T cells. Briefly, HEK293T cells were transfected using polyethylenimine (PEI) with an Ahr-expressing plasmid, together with the pTfrc-pGL2b construct and pRL-TK Renilla construct. At 24 h after transfection, cells were treated with or without FICZ (200 nM) for 18 h. Cell extracts were collected for luciferase activity measurement in the luminometer (Turner BioSystems) with the Dual-Luciferase Reporter Assay System (Promega). The signals were normalized as the ratio of firefly luciferase activity to Renilla luciferase activity and presented as fold change relative to the empty vector control.
Quantitative PCR with reverse transcription (RT-qPCR)
RNA of the indicated cells was isolated with Trizol (Invitrogen). cDNA was synthesized using the GoScript Reverse Transcription System (Promega). qPCR was performed using SYBR Green (Bio-Rad) and various primer sets (Supplementary Table 1). Reactions were run using the CFX Connect Real-Time PCR Detection System (v.3.1) (Bio-Rad). The mRNA levels of target genes were calculated by the comparative cycle threshold (Ct) (2−ΔΔCt) method and normalized to β-actin.
MNK-3 cell line culture and DFO treatment
The MNK-3 cells were maintained in Roswell Park Memorial Institute (RPMI) complete medium with 10% fetal bovine serum (FBS), 2 mM GlutaMAX, 1 mM sodium pyruvate, 55 μM 2-mercaptoethanol, 10 mM HEPES, 50 μg ml−1 gentamicin, 100 U ml−1 penicillin and 100 μg ml−1 streptomycin (Gibco, Life Technologies), as previously described36. For cytokine staining used for flow cytometry analysis, MNK-3 cells were stimulated with IL-23 (20 ng ml−1) and IL-1β (10 ng ml−1) for 6 h before collection.
For DFO treatment, MNK-3 cells (8 × 10⁵ cells per well) or freshly isolated intestinal LPLs were cultured in the RPMI complete medium with different concentrations of DFO as indicated in the text in a 24-well plate for 16 h and then collected for the following analysis. Cells without DFO treatment (negative control, –DFO) were treated with vehicle only (water).
Retroviral transduction
The cDNAs of target genes were cloned into MSCV–IRES–GFP (MIG) or MSCV–IRES–Thy1.1 (MIT) retroviral vectors. HEK293T cells were transfected with retroviral plasmids and the packaging plasmid 10A1 using PEI. Viral supernatant was collected after transfection. MNK-3 cells were seeded in a 24-well plate with the RPMI complete medium as described above. After 24 h of culture, 0.45-μm filtered retrovirus-containing supernatants supplemented with polybrene (8 μg ml−1, Sigma) were added to the cells followed by centrifugation at 1,250g for 2 h at 30 °C on day 1 and 2. The cells were cultured for another 2–3 d before collection for analysis.
Bone-marrow transfer
Bone marrow from Ahr−/− (CD45.2/45.2) and Ahr+/+ (CD45.1/45.2) mice was mixed at a 1:1 ratio and a total of 4 × 10⁶ cells in 200 μl PBS were intravenously injected into lethally irradiated (11 Gy gamma ray) CD45.1/CD45.1 mice. Recipient mice were treated with ampicillin (1 g l−1) for 2 weeks after BM transfer. At the time of 8 weeks after transfer, reconstituted mice were killed for data analysis.
Glucose (2-NBDG) uptake and mitochondria staining
For uptake of 2-NBDG (Cayman Chemical, 11046), cells were incubated in glucose-free RPMI medium containing 100 μg ml−1 2-NBDG for 30 min at 37 °C and measured by flow cytometry. Mitochondrial mass and mitochondrial membrane potential staining were performed with MitoTracker Green FM (150 nM, Sigma, M7514) and TMRE (625 nM, Thermo Fisher, T669), respectively, at 37 °C for 30 min. Cells were analyzed by flow cytometry. Detection of mitochondrial ROS using MitoSOX Red (5 μM; Sigma, M36008) was performed by incubating cells in HBSS for 15 min at 37 °C and then measured by flow cytometry.
Seahorse metabolic analysis
OCR and ECAR were measured using the XFe96 Analyzer (Seahorse Bioscience) as instructed by the manufacturer. Briefly, 1 × 10⁵ MNK-3 cells were seeded on a pretreated poly-d-lysine-coated 96-well Seahorse plate in the complete RPMI as indicated above for 16 h, with or without DFO addition, followed by washing and culturing in Seahorse Assay Medium containing 1 mM pyruvate, 2 mM glutamine and 10 mM glucose for 1 h at 37 °C without CO2. Oligomycin (1.5 μM), carbonyl cyanide-4 (trifluoromethoxy) phenylhydrazone (FCCP, 1 μM), rotenone (0.5 μM) and antimycin A (0.5 μM) were injected where indicated and the OCR (pmol O2 min−1) and ECAR (mpH min−1) were determined in real time. The 2-deoxy-glucose (2DG) (100 mM) was added at the end for ECAR measurements.
16S rRNA gene sequencing and analysis
For microbiome analyses, fecal DNA was isolated using the Quick-DNA Fecal/Soil Microbe Miniprep kit (ZYMO, 11–322), followed by amplification and library generation with the Quick-16S NGS Library Prep kit (ZYMO, D6410) according to the manufacturer’s instructions. Sequencing was performed on the Illumina MiSeq (Illumina). Raw FASTQ sequences were filtered and analyzed using QIIME2 (v.2022.2.0) and Dada2. Operational taxonomic units were defined based on sequence similarity threshold of 97%. Taxonomy was assigned based on the Silva 138 reference database31.
Citrobacter rodentium infection and colony-forming units
C. rodentium (DBS100, ATCC51459) was cultured overnight in LB medium and the cell density was determined on the basis of the bacterial suspension at the optical density of 600 nm. Mice were infected by oral gavage (1010 c.f.u. of bacteria in 200 μl PBS per mouse). The survival rates and body weight were monitored at the indicated time points. Fecal c.f.u. were counted by plating homogenized fecal contents on MacConkey plates with serial dilution.
Immunofluorescence staining and confocal microscopy analysis
SI of the indicated mice was dissected, washed with PBS and fixed in 4% paraformaldehyde at 4 °C overnight. The fixed tissues were washed with ice-cold PBS three times, Swiss rolled and then saturated in a 30% sucrose gradient in phosphate buffer at 4 °C overnight. Then the samples were embedded in optimal cutting temperature compound (Tissue-Tek). Tissue blocks were snap frozen in a bath of dry ice and ethanol and cut into 5-μm sections. The tissue section slides were stained with anti-human/mouse RORγt antibody (eBioscience, 14–6988-82, 1:100 dilution) and anti-CD3 (Abcam, ab16669, 1:50 dilution) at 4 °C overnight, followed by secondary antibody staining with goat anti-rat IgG Alexa Fluor 594 (Invitrogen A-11007, 1:500 dilution) and goat anti-rabbit IgG Alexa Fluor 488 (Invitrogen A-11034, 1:500 dilution) at room temperature for 1 h, followed by 4′,6-diamidino-2-phenylindole (DAPI) staining. Data were collected using a confocal microscope (Zeiss 710 confocal microscope). ZEN 2011 (v.14.0.10.201) was used to collect confocal images.
Calculation of cryptopatch/intestinal lymphoid follicle number
The number of CPs/ILFs (RORγt+CD3– cell clusters) were counted at ×10 magnification and calculated as previously described39. Briefly, it is assumed that each section would be representative of the distribution of CPs/ILFs throughout the SI. The SI, when cut open, has an average width of 5 mm and thus for each sample, a total of 1,000 sections can be cut at 5 μm. The absolute numbers of clusters counted were multiplied by 1,000. CPs/ILFs have an average size that spans 86 μm67. The same CPs/ILFs would be counted 17 times and thus the calculated number was divided by 17. The resulting calculation was (numbers of CPs/ILFs) × 1,000/17.
Statistical methods
Unless otherwise noted, statistical analysis was performed with an unpaired two-tailed Student’s t-test on individual biological samples with GraphPad Prism 9. All compiled data with error bars are expressed as mean ± s.e.m.
Extended Data
Extended Data Fig. 1 |. Iron-depleted diet impairs gut ILC3 maintenance and function (Related to Fig. 1).
3-week-old C57BL/6 wild-type (WT) mice were fed an iron-deficient (ID) or control (Ctrl) diet for 3 weeks before analysis. a and b, Hemoglobin concentrations (a) and MCV (b) in the indicated mice. Data are compiled from three independent experiments (n = 8 mice per group). c, Principal component analysis (PCA) plot of the RNA-seq for SI ILC3s in the indicated mice. d, Scatter-plot of log2 (FPKM) gene expression of FACS-sorted SI ILC3s from the indicated mice in RNA-seq analysis. DEGs (ID diet vs Ctrl diet, fold change ≥ 1.5, q value ≤ 0.05) are highlighted in blue (upregulated) and orange (downregulated), respectively (n = 3 mice per group). e, Heat map of the indicated gene expression in glycolysis pathway revealed by RNA-seq analysis. f, FACS analysis of Ahr expression in ILC3s of the mice with indicated treatments. Ahr–/– ILC3s were used as a negative control. Representative FACS plot of three independent experiments. g, Representative FACS gating/sorting strategies used for identification of different immune cell populations in this study.
Extended Data Fig. 2 |. Iron chelation represses ILC3 functions ex vivo and in vitro (Related to Fig. 2).
a–l, SI LPLs from WT mice were treated ex vivo with or without DFO for 16 h. Percentages of IFN-γ+ in ILC3s compiled from two independent experiments (n = 6 mice per group) (a), gMFI of MitoTracker Green FM (b), TMRE (c) and MitoSox (d) in ILC3s (n = 6 mice per group from two independent experiments). FACS analysis of CD71 expression in ILC2s and representative FACS plot of three independent experiments (e). Representative FACS plots (f), percentages of IL-5+ (g) and IL-13+ (h) cells in ILC2s compiled from two independent experiments (n = 6 mice per group) are shown. FACS analysis of CD71 expression in ILC1s and representative FACS plot of three independent experiments (i). Percentages of IFN-γ+ cells in ILC1s (j), IL-22+ (k) and IL-17A+ (l) cells in CD4+ T cells compiled from three independent experiments (n = 6 mice per group). m–s, LI LPLs from WT mice were treated ex vivo with or without DFO for 16 h. FACS analysis of CD71 (m) and RORγt (o) expression in ILC3s and representative FACS plots of three independent experiments are shown. gMFI of CD71 (n) and RORγt (p) expression in ILC3s from three independent experiments (n = 3 mice per group) are shown. FACS analysis of IL-22 and IL-17A expression in ILC3s and representative FACS plot of three independent experiments (q). Percentages of IL-22+ (r) and IL-17A+ (s) in ILC3s from three independent experiments (n = 3 mice per group). t and u, MNK-3 cells were treated with or without DFO for 16 h in vitro. gMFI of Ki-67 expression in MNK-3 cells (t) and percentages of MNK-3 cell viability (u) (n = 8 biologically independent replicates per group from three independent experiments).
Extended Data Fig. 3 |. Iron depletion impairs mitochondrial function and switches OXPHOS to glycolysis in ILC3s (Related to Fig. 3).
a, PCA of RNA-seq analysis of MNK-3 cells treated with or without DFO for 16 h in vitro (n = 3 biologically independent replicates per group). b–g, Mitochondrial mass and activity in MNK-3 cells. MitoTracker Green FM (b), TMRE (d) and MitoSox (f) intensity. Representative FACS plots of three independent experiments. gMFI of MitoTracker Green FM (c), TMRE (e) and MitoSox (g) (n = 6 biologically independent replicates per group). Data are compiled from three independent experiments. h–j, Mitochondrial mass and activity of ILC3s from WT mice fed an ID or Ctrl diet. gMFI of MitoTracker Green FM (h), TMRE (i) and MitoSox (j) in ILC3s (control diet: n = 7; ID diet: n = 5). Data are compiled from three independent experiments. k, FACS analysis of 2-NBDG uptake in MNK-3 cells. Representative FACS plot of three independent experiments. l–n, Seahorse metabolic flux analysis. Real-time ECAR (l) are representative of two independent experiments, and compiled data on quantification of basal (m) and maximal (n) ECAR of one experiment are shown (n = 3 biologically independent replicates per group). o and p, FACS analysis of IL-22 and IL-17A expression in MNK-3 cells transduced with the indicated retroviral constructs. The cells were treated with FICZ on day 2. Representative FACS plot (o) and percentages of IL-22+ cells in MNK-3 cells from two independent experiments (n = 6 biologically independent replicates per group) (p). q and r, FACS analysis of IL-22 and IL-17A expression in MNK-3 cells transduced with the indicated retroviral constructs. Representative FACS plot (q) and percentages of IL-22+ cells in MNK-3 cells compiled from two independent experiments (n = 3 biologically independent replicates per group) (r).
Extended Data Fig. 4 |. CD71 deficiency impairs ILC3 maintenance in a cell-intrinsic manner (Related to Fig. 4).
a, Tfrc mRNA determined by RT-qPCR in SI ILC3s. Data are compiled from three independent experiments (n = 3 mice per group). b and c, FACS analysis of intracellular Fe2+ in ILC3s. Representative FACS plot (b) and gMFI of Fe2+ in ILC3s (n = 3 mice per group) (c). d, Percentages of TH17 cells (CD4+TCRβ+Foxp3−GATA3−RORγt+) in CD4+ T cells from three independent experiments (Tfrcf/f: n = 6; Tfrcf/f Rorc-cre: n = 7). e–k, FACS analysis of ILC3 subsets. NKp46 and RORγt expression in Lin− (e), CD4 and RORγt expression in Lin−NKp46− (g), NKp46 and CCR6 expression in Lin−RORγt+ (j) LPLs. Percentages of NKp46+ ILC3s (f), CD4+ ILC3s (h) and CD4− ILC3s in Lin− (i), and CCR6+ in ILC3s (k) from three independent experiments (Tfrcf/f: n = 9; Tfrcf/f Rorc-cre: n = 7). l–n, FACS analysis of ILC3 cytokines. Representative FACS plot (l), percentages of IL-22+ (m) and IL-17A+ (n) cells in ILC3s from three independent experiments (Tfrcf/f: n = 9; Tfrcf/f Rorc-cre: n = 7). o and p, Percentages of Aqua+ in ILC3s from three independent experiments (Tfrcf/f: n = 7 per age; Tfrcf/f Rorc-cre: n = 6 (1-week-old and 4-week-old) or 5 (6-week-old)). q, FACS analysis of CD71 expression in CD4+ T cells and ILC3s. Representative FACS plots of three independent experiments. r and s, FACS analysis of RORγt expression in Lin− LPLs. Representative FACS plot (r) and percentages of ILC3s from three independent experiments (Rag1−/− Tfrcf/f: n = 7; Rag1−/− Tfrcf/f Rorc-cre: n = 6) (s). t and u, FACS analysis of RORγt expression in Lin− LPLs. Representative FACS plot (t) and percentages of ILC3s from three independent experiments (Tfrcf/f: n = 8; Tfrcf/f Cd4-cre: n = 6) (u).
Extended Data Fig. 5 |. CD71 ablation in ILC3s impairs gut immunity to C. rodentium infection (Related to Fig. 5).
Body weight (a) and survival (b) of C. rodentium-infected mice (Tfrcf/f: n = 8; Tfrcf/f Rorc-cre: n = 5). Statistical analysis by the log-rank test. Data are compiled from three independent experiments. c, TH17 percentages in CD4+ T cells in C. rodentium-infected mice from two independent experiments (for each time point: Tfrcf/f: n = 8 and 6; Tfrcf/f Rorc-cre: n = 4). d and e, FACS analysis of CD71 in ILC3s of WT (Tfrcf/f) mice treated with or without iron dextran. Representative FACS plot (d) and percentages of CD71+ cells in ILC3s from three independent experiments (n = 5 for untreated; n = 7 for treated) (e). f, Heat map of OXPHOS pathway and ILC3 signature genes by RNA-seq analysis of SI ILC3s (n = 3 mice per group). g, GSEA showing glycolysis gene pathway enrichment in the indicated ILC3s. h, Representative FACS plot of pS6 in ILC3s of three independent experiments. i–k, FACS analysis of mitochondrial mass and activity. gMFI of MitoTracker Green FM (i) (n = 3 mice per group), TMRE (j) (Tfrcf/f: n = 6; Tfrcf/f Rorc-cre: n = 4), MitoSox (k) (Tfrcf/f: n = 6; Tfrcf/f Rorc-cre: n = 5) in ILC3s from three independent experiments. l–q, RNA-seq analysis of SI ILC3s from mice with or without iron dextran treatment (n = 3 mice per group). Heat map of the DEGs by RNA-seq analysis in the indicated ILC3s shown in Fig. 5h (l). GSEA showing ILC3 signature gene enrichment (m). FPKM of Ahrr, Gem and Osgin1 in the indicated ILC3s (n–p) (n = 3 mice per group). GO analysis showing enriched top 10 pathways of the shared 235 DEGs (cKO vs WT, with or without iron dextran) shown in Fig. 5h (q).
Extended Data Fig. 6 |. Zip14 is a NTBI transporter in ILC3s (Related to Fig. 5).
a, FACS analysis of RORγt expression in Lin− LPLs of the indicated mice, with or without iron dextran treatment. Representative FACS plot of three independent experiments are shown. b, Schematic depiction of experimental design for iron dextran pre-treatment, followed by C. rodentium infection. c, FPKM of literature-reported iron-related potential transporters in RNA-seq of SI ILC3s from WT mice (n = 3 mice per group). d, FPKM of RNA-seq of MNK-3 cells treated with or without DFO (100 μM) for 16 h in vitro (n = 3 biologically independent replicates per group). e, Expression of Slc39a14 and Slc39a8 mRNA determined by RT-qPCR in ILC3s from SI LPLs of Zipf/f and Zip14f/f Rorc-cre littermate mice. Data are representative of two independent experiments (n = 3 mice per group). f, FACS analysis of RORγt expression in Lin− LPLs of the indicated mice. Representative FACS plot of three independent experiments. g, FACS analysis of RORγt expression in Lin− LPLs of the indicated mice with or without iron dextran treatment. Representative FACS plot of three independent experiments. h and i, Expression of Slc39a8 and Slc11a2 mRNA determined by RT-qPCR in ILC3s from the indicated mice treated with iron dextran (n = 3 mice per group). Data are compiled from two independent experiments.
Extended Data Fig. 7 |. Microbiota inhibit CD71 expression in an Ahr-dependent manner (Related to Fig. 6).
a–d, Fecal microbiome analysis of the indicated mice. Bacterial (Class) abundance (a) and Shannon Index measuring bacterial diversity (b) revealed by 16 S rRNA gene sequencing in the indicated cohoused mice (Tfrcf/f: n = 7; Tfrcf/f Rorc-cre: n = 6). Data are displayed as box and whisker plots showing the median and the 25th and 75th percentiles and two whiskers at the minimum and maximum Shannon Entropy Index. Statistical significance was determined using the Kruskal-Wallis test. H. apodemus (c) and H. typhlonius (d) bacterial abundance measured by qPCR in the indicated cohoused mice (Tfrcf/f: n = 7; Tfrcf/f Rorc-cre: n = 6). e–g, FACS analysis of CD71 expression in ILC3s and TH17 cells in WT SPF and GF mice. Representative FACS plot (e) and percentages of CD71+ cells in ILC3s from three independent experiments (n = 7 mice per group) are shown (f). Percentages of CD71+ cells in TH17 cells from three independent experiments (n = 7 mice per group) are shown (g). Representative FACS plot of CD71 (h) and percentages of CD71+ cells in ILC3s from LI LPLs of the indicated mice treated with broad-spectrum antibiotics (abx) or control water. Data are compiled from five independent experiments (n = 10 for controls; n = 8 for abx-treated) (i). Representative FACS plot (j) and percentages of IL-22+ cells in ILC3s from four independent experiments (Ahr+/+: n = 8 and 7 for control and abx-treated groups; Ahr−/−: n = 7 and 5 for control and abx-treated groups) (k). l–n, Il22 (l), Ahrr (m) and Cyp1a1 (n) mRNA determined by RT-qPCR in LI tissues of the indicated mice treated with abx or control water (n = 3 mice per group compiled from two independent experiments).
Extended Data Fig. 8 |. Ahr cell-intrinsically inhibits CD71 transcription in ILC3s (Related to Fig. 6).
a–f, CD71+ percentages in the indicated cells. Data are compiled from three independent experiments (a–d: Ahr+/+: n = 4 and 8 for SI and LI; Ahr−/−: n = 4 and 6 for SI and LI); (e and f: n = 4 mice per group). g–k, FACS analysis of CD71 in the indicated cells. Representative FACS plots (g and i), and CD71+ percentages in ILC1s (h), ILC2s (j), TH17 cells (k) from three independent experiments (Ahr+/+: n = 6; AhrdCAIR/+: n = 7; AhrdCAIR/dCAIR: n = 8). l–q, FACS analysis of CD71 in the indicated ILC3s with or without IL-23 and IL-1β treatment for 6 hours ex vivo. Representative FACS plot (l) and CD71+ percentages in ILC3s compiled from three independent experiments (Ahr+/+: n = 10 per group; Ahr−/−: n = 8 per group) (m). Tfrc mRNA (n), gMFI of the Ahr (o), Ahr (p) and Ahrr (q) mRNAs determined by RT-qPCR in the indicated SI ILC3s (n = 6 mice per group from three independent experiments). r–t, Mixed bone marrow (BM) experiment. Data are compiled from two independent experiments (n = 3 mice per group). A schematic depiction of experimental design (note: donor cells were age and sex matched; recipients and donors were sex matched) (r), and CD71+ percentages in the indicated ILC3s (s) and ILC2s (t). u and v, FACS analysis of CD71 in ILC3s. Representative FACS plot (u) and CD71+ percentages in ILC3s from two independent experiments (n = 3 mice per group) (v). w and x, FACS analysis of IL-17A and IL-22 in ILC3s. Absolute numbers of IL-17A+ (w) and IL-22+ (x) ILC3s in the indicated mice (n = 5 mice per group from two independent experiments).
Extended Data Fig. 9 |. Iron treatment alleviates ILC3 defects in Ahr-deficient mice (Related to Fig. 6).
a and b, LI-ILC3 percentages in Lin− LPLs (a) and absolute numbers (b) in the indicated mice with or without iron dextran treatment. Data are compiled from three independent experiments (Ahr+/+: n = 7 and 8 for untreated and treated; Ahr−/−: n = 5 and 6 for untreated and treated). c–e, FACS analysis of IL-22 and IL-17A expression in SI ILC3s of the indicated mice. Representative FACS plot (c), IL-22+ (d) and IL-17A+ (e) percentages in the indicated ILC3s from three independent experiments (Ahr+/+: n = 7 and 8 for untreated and treated; Ahr−/−: n = 5 and 6 for untreated and treated). f and g, FACS analysis of RORγt in Lin− LPLs of the mice with indicated treatment. Representative FACS plot (f) and LI-ILC3 percentages in Lin− LPLs from three independent experiments (g) (Ahrf/f: n = 6 and 5 for untreated and treated; Ahrf/f Rorc-cre: n = 6 mice per group). h and i, Numbers of CCR6+ ILC3s (h) and NKp46+ ILC3s (i) in SI LPLs of the indicated mice from three independent experiments (Ahrf/f: n = 6 and 5 for untreated and treated; Ahrf/f Rorc-cre: n = 6 mice per group). j, Cryptopatches (CPs)/intestinal lymphoid follicles (ILFs) in representative SI sections of the indicated mice were stained with RORγt (red), CD3 (green), and DAPI (blue) and analyzed by fluorescence microscopy. Scale bar, 100 μm. Data are representative of two independent experiments. k, Numbers of CPs/ILFs in the SI of the indicated mice (n = 3 mice per group compiled from two independent experiments). l, Percentages of Aqua+ in SI ILC3s from three independent experiments (Ahrf/f: n = 6 and 5 for untreated and treated; Ahrf/f Rorc-cre: n = 6 mice per group).
Extended Data Fig. 10 |. Ahr regulates CD71 transcription by directly binding to the Tfrc locus (Related to Fig. 7).
a–e, RNA-seq analysis of ILC3s from SI and LI LPLs of Rag1−/−Ahr+/+ (WT) and Rag1−/−Ahr−/− (KO) littermate mice (n = 2 mice per group). PCA plot revealed by RNA-seq analysis of ILC3s from the indicated mice (a). Heat maps of the indicated mitochondria-encoding gene expression revealed by RNA-seq analysis (b). GSEA showing enrichment of ILC3 signature genes in SI (c) and LI (d) ILC3s in RNA-seq analysis. Heat maps of the ILC3 signature gene expression revealed by RNA-seq analysis (e). f, Schematic depiction of the Ahr motifs (highlighted in red) in the Ahr ChIP-seq peak at the Tfrc promoter. g, The firefly luciferase pTfrc-pGL2B or pTfrcΔXRE-pGL2B constructs and pRL-TK-Renilla luciferase construct were co-transfected into HEK293T cells, together with Ahr-expression or control plasmids. Cells were stimulated with or without FICZ and the firefly luciferase activity was normalized to Renilla luciferase activity. Representative data of two independent experiments (n = 3 biologically independent replicates per group from one experiment) are shown.
Supplementary Material
Acknowledgements
We thank the Zhou laboratory for help and suggestions; R. Merkel and J. Kyu for mice genotyping; S. G. Swarts from the Department of Radiation Oncology of the University of Florida for assistance of HESKA; and Y. Sun from the Molecular Pathology Core, Department of Pathology of the University of Florida for tissue section and immunofluorescence staining support. Confocal microscopy was performed at the Center for Immunology & Transplantation. The Genomics Facility (University of Chicago) provided sequencing services and assistance. L.Z. is an Investigator in the Pathogenesis of Infectious Disease and is supported by the Burroughs Wellcome Fund. This work was supported by the National Institutes of Health grants AI132391 and AI157109 (to L.Z.).
Footnotes
Online content
Any methods, additional references, Nature Portfolio reporting summaries, source data, extended data, supplementary information, acknowledgements, peer review information; details of author contributions and competing interests; and statements of data and code availability are available at https://doi.org/10.1038/s41590-023-01612-z.
Reporting summary
Further information on research design is available in the Nature Portfolio Reporting Summary linked to this article.
Competing interests
The authors declare no competing interests.
Extended data is available for this paper at https://doi.org/10.1038/s41590-023-01612-z.
Supplementary information The online version contains supplementary material available at https://doi.org/10.1038/s41590-023-01612-z.
Data availability
All data supporting the findings of this study are available within the article and its supplementary materials. The M. musculus reference genome (GRCm38/mm10 assembly) https://www.ncbi.nlm.nih.gov/assembly/GCF_000001635.20/ was used for RNA-seq and ChIP-seq read alignment. The Gene Expression Omnibus accession code for the sequencing data in this paper is GSE222621. Source data are provided with this paper.
References
- 1.Lieu PT, Heiskala M, Peterson PA & Yang Y The roles of iron in health and disease. Mol. Asp. Med 22, 1–87 (2001). [DOI] [PubMed] [Google Scholar]
- 2.Hentze MW, Muckenthaler MU, Galy B & Camaschella C Two to tango: regulation of mammalian iron metabolism. Cell 142, 24–38 (2010). [DOI] [PubMed] [Google Scholar]
- 3.Donovan A et al. Positional cloning of zebrafish ferroportin1 identifies a conserved vertebrate iron exporter. Nature 403, 776–781 (2000). [DOI] [PubMed] [Google Scholar]
- 4.Abboud S & Haile DJ A novel mammalian iron-regulated protein involved in intracellular iron metabolism. J. Biol. Chem 275, 19906–19912 (2000). [DOI] [PubMed] [Google Scholar]
- 5.McKie AT et al. A novel duodenal iron-regulated transporter, ireg1, implicated in the basolateral transfer of iron to the circulation. Mol. Cell 5, 299–309 (2000). [DOI] [PubMed] [Google Scholar]
- 6.Dev S & Babitt JL Overview of iron metabolism in health and disease. Hemodial. Int 21, S6–S20 (2017). [DOI] [PMC free article] [PubMed] [Google Scholar]
- 7.Aydemir TB & Cousins RJ The multiple faces of the metal transporter zip14 (slc39a14). J. Nutr 148, 174–184 (2018). [DOI] [PMC free article] [PubMed] [Google Scholar]
- 8.Jenkitkasemwong S et al. Slc39a14 is required for the development of hepatocellular iron overload in murine models of hereditary hemochromatosis. Cell Metab. 22, 138–150 (2015). [DOI] [PMC free article] [PubMed] [Google Scholar]
- 9.Gammella E, Buratti P, Cairo G & Recalcati S The transferrin receptor: the cellular iron gate. Metallomics 9, 1367–1375 (2017). [DOI] [PubMed] [Google Scholar]
- 10.Lill R Function and biogenesis of iron-sulphur proteins. Nature 460, 831–838 (2009). [DOI] [PubMed] [Google Scholar]
- 11.Li H et al. Iron regulatory protein 2 modulates the switch from aerobic glycolysis to oxidative phosphorylation in mouse embryonic fibroblasts. Proc. Natl Acad. Sci. USA 116, 9871–9876 (2019). [DOI] [PMC free article] [PubMed] [Google Scholar]
- 12.Ye H et al. Glutaredoxin 5 deficiency causes sideroblastic anemia by specifically impairing heme biosynthesis and depleting cytosolic iron in human erythroblasts. J. Clin. Invest 120, 1749–1761 (2010). [DOI] [PMC free article] [PubMed] [Google Scholar]
- 13.Cronin SJF, Woolf CJ, Weiss G & Penninger JM The role of iron regulation in immunometabolism and immune-related disease. Front. Mol. Biosci 6, 116 (2019). [DOI] [PMC free article] [PubMed] [Google Scholar]
- 14.Chen AC, Donovan A, Ned-Sykes R & Andrews NC Noncanonical role of transferrin receptor 1 is essential for intestinal homeostasis. Proc. Natl Acad. Sci. USA 112, 11714–11719 (2015). [DOI] [PMC free article] [PubMed] [Google Scholar]
- 15.Barrientos T et al. Metabolic catastrophe in mice lacking transferrin receptor in muscle. eBioMedicine 2, 1705–1717 (2015). [DOI] [PMC free article] [PubMed] [Google Scholar]
- 16.Artis D & Spits H The biology of innate lymphoid cells. Nature 517, 293–301 (2015). [DOI] [PubMed] [Google Scholar]
- 17.Diefenbach A, Colonna M & Koyasu S Development, differentiation, and diversity of innate lymphoid cells. Immunity 41, 354–365 (2014). [DOI] [PMC free article] [PubMed] [Google Scholar]
- 18.Abt MC et al. Innate immune defenses mediated by two ilc subsets are critical for protection against acute Clostridium difficile infection. Cell Host Microbe 18, 27–37 (2015). [DOI] [PMC free article] [PubMed] [Google Scholar]
- 19.Song C et al. Unique and redundant functions of nkp46+ ilc3s in models of intestinal inflammation. J. Exp. Med 212, 1869–1882 (2015). [DOI] [PMC free article] [PubMed] [Google Scholar]
- 20.Xiong L et al. Group 3 innate lymphoid cell pyroptosis represents a host defence mechanism against salmonella infection. Nat. Microbiol 7, 1087–1099 (2022). [DOI] [PMC free article] [PubMed] [Google Scholar]
- 21.McKenzie ANJ, Spits H & Eberl G Innate lymphoid cells in inflammation and immunity. Immunity 41, 366–374 (2014). [DOI] [PubMed] [Google Scholar]
- 22.Silberger DJ, Zindl CL & Weaver CT Citrobacter rodentium: a model enteropathogen for understanding the interplay of innate and adaptive components of type 3 immunity. Mucosal Immunol. 10, 1108–1117 (2017). [DOI] [PMC free article] [PubMed] [Google Scholar]
- 23.Di Luccia B, Gilfillan S, Cella M, Colonna M & Huang SC Ilc3s integrate glycolysis and mitochondrial production of reactive oxygen species to fulfill activation demands. J. Exp. Med 216, 2231–2241 (2019). [DOI] [PMC free article] [PubMed] [Google Scholar]
- 24.Fu Z et al. Mitochondrial transcription factor a in rorγt(+) lymphocytes regulate small intestine homeostasis and metabolism. Nat. Commun 12, 4462 (2021). [DOI] [PMC free article] [PubMed] [Google Scholar]
- 25.Rothhammer V & Quintana FJ The aryl hydrocarbon receptor: an environmental sensor integrating immune responses in health and disease. Nat. Rev. Immunol 19, 184–197 (2019). [DOI] [PubMed] [Google Scholar]
- 26.Zhou L Ahr function in lymphocytes: emerging concepts. Trends Immunol. 37, 17–31 (2016). [DOI] [PMC free article] [PubMed] [Google Scholar]
- 27.Stockinger B, Di Meglio P, Gialitakis M & Duarte JH The aryl hydrocarbon receptor: multitasking in the immune system. Annu. Rev. Immunol 32, 403–432 (2014). [DOI] [PubMed] [Google Scholar]
- 28.Qiu J et al. The aryl hydrocarbon receptor regulates gut immunity through modulation of innate lymphoid cells. Immunity 36, 92–104 (2012). [DOI] [PMC free article] [PubMed] [Google Scholar]
- 29.Lee JS et al. Ahr drives the development of gut ilc22 cells and postnatal lymphoid tissues via pathways dependent on and independent of notch. Nat. Immunol 13, 144–151 (2011). [DOI] [PMC free article] [PubMed] [Google Scholar]
- 30.Kiss EA et al. Natural aryl hydrocarbon receptor ligands control organogenesis of intestinal lymphoid follicles. Science 334, 1561–1565 (2011). [DOI] [PubMed] [Google Scholar]
- 31.Quast C et al. The silva ribosomal RNA gene database project: Improved data processing and web-based tools. Nucleic Acids Res. 41, D590–D596 (2013). [DOI] [PMC free article] [PubMed] [Google Scholar]
- 32.Robinette ML et al. Transcriptional programs define molecular characteristics of innate lymphoid cell classes and subsets. Nat. Immunol 16, 306–317 (2015). [DOI] [PMC free article] [PubMed] [Google Scholar]
- 33.Wang Z et al. Iron drives T helper cell pathogenicity by promoting rna-binding protein pcbp1-mediated proinflammatory cytokine production. Immunity 49, 80–92 (2018). [DOI] [PubMed] [Google Scholar]
- 34.Wang W et al. Cd8(+) T cells regulate tumour ferroptosis during cancer immunotherapy. Nature 569, 270–274 (2019). [DOI] [PMC free article] [PubMed] [Google Scholar]
- 35.Muckenthaler MU, Galy B & Hentze MW Systemic iron homeostasis and the iron-responsive element/iron-regulatory protein (ire/irp) regulatory network. Annu. Rev. Nutr 28, 197–213 (2008). [DOI] [PubMed] [Google Scholar]
- 36.Allan DS et al. An in vitro model of innate lymphoid cell function and differentiation. Mucosal Immunol. 8, 340–351 (2015). [DOI] [PubMed] [Google Scholar]
- 37.Xu W et al. Lethal cardiomyopathy in mice lacking transferrin receptor in the heart. Cell Rep. 13, 533–545 (2015). [DOI] [PMC free article] [PubMed] [Google Scholar]
- 38.Xiong L et al. Ahr-foxp3-rorγt axis controls gut homing of cd4(+) T cells by regulating gpr15. Sci. Immunol 5, eaaz7277 (2020). [DOI] [PMC free article] [PubMed] [Google Scholar]
- 39.Li S et al. Ikaros inhibits group 3 innate lymphoid cell development and function by suppressing the aryl hydrocarbon receptor pathway. Immunity 45, 185–197 (2016). [DOI] [PMC free article] [PubMed] [Google Scholar]
- 40.Subramanian A et al. Gene set enrichment analysis: a knowledge-based approach for interpreting genome-wide expression profiles. Proc. Natl Acad. Sci. USA 102, 15545–15550 (2005). [DOI] [PMC free article] [PubMed] [Google Scholar]
- 41.Bostick JW et al. Dichotomous regulation of group 3 innate lymphoid cells by nongastric helicobacter species. Proc. Natl Acad. Sci. USA 116, 24760–24769 (2019). [DOI] [PMC free article] [PubMed] [Google Scholar]
- 42.Zelante T et al. Tryptophan catabolites from microbiota engage aryl hydrocarbon receptor and balance mucosal reactivity via interleukin-22. Immunity 39, 372–385 (2013). [DOI] [PubMed] [Google Scholar]
- 43.Cervantes-Barragan L et al. Lactobacillus reuteri induces gut intraepithelial cd4(+)cd8αα(+) t cells. Science 357, 806–810 (2017). [DOI] [PMC free article] [PubMed] [Google Scholar]
- 44.Ye J et al. The aryl hydrocarbon receptor preferentially marks and promotes gut regulatory T cells. Cell Rep. 21, 2277–2290 (2017). [DOI] [PMC free article] [PubMed] [Google Scholar]
- 45.Li S et al. Aryl hydrocarbon receptor signaling cell intrinsically inhibits intestinal group 2 innate lymphoid cell function. Immunity 49, 915–928 (2018). [DOI] [PMC free article] [PubMed] [Google Scholar]
- 46.Motamedi M, Xu L & Elahi S Correlation of transferrin receptor (CD71) with ki67 expression on stimulated human and mouse T cells: the kinetics of expression of T cell activation markers. J. Immunol. Methods 437, 43–52 (2016). [DOI] [PubMed] [Google Scholar]
- 47.Weinberg ED Nutritional immunity. Host’s attempt to withold iron from microbial invaders. JAMA 231, 39–41 (1975). [DOI] [PubMed] [Google Scholar]
- 48.Sakamoto K et al. IL-22 controls iron-dependent nutritional immunity against systemic bacterial infections. Sci. Immunol 2, eaai8371 (2017). [DOI] [PMC free article] [PubMed] [Google Scholar]
- 49.Kortman GA et al. Low dietary iron intake restrains the intestinal inflammatory response and pathology of enteric infection by food-borne bacterial pathogens. Eur. J. Immunol 45, 2553–2567 (2015). [DOI] [PMC free article] [PubMed] [Google Scholar]
- 50.Müllner EW, Neupert B & Kühn LC A specific mRNA binding factor regulates the iron-dependent stability of cytoplasmic transferrin receptor mRNA. Cell 58, 373–382 (1989). [DOI] [PubMed] [Google Scholar]
- 51.Koeller DM et al. A cytosolic protein binds to structural elements within the iron regulatory region of the transferrin receptor mrna. Proc. Natl Acad. Sci. USA 86, 3574–3578 (1989). [DOI] [PMC free article] [PubMed] [Google Scholar]
- 52.Jabara HH et al. A missense mutation in tfrc, encoding transferrin receptor 1, causes combined immunodeficiency. Nat. Genet 48, 74–78 (2016). [DOI] [PMC free article] [PubMed] [Google Scholar]
- 53.Fernandez-Salguero P et al. Immune system impairment and hepatic fibrosis in mice lacking the dioxin-binding ah receptor. Science 268, 722–726 (1995). [DOI] [PubMed] [Google Scholar]
- 54.Eberl G et al. An essential function for the nuclear receptor rorgamma(t) in the generation of fetal lymphoid tissue inducer cells. Nat. Immunol 5, 64–73 (2004). [DOI] [PubMed] [Google Scholar]
- 55.Aydemir TB et al. Intestine-specific deletion of metal transporter zip14 (slc39a14) causes brain manganese overload and locomotor defects of manganism. Am. J. Physiol. Gastrointest. Liver Physiol 318, G673–G681 (2020). [DOI] [PMC free article] [PubMed] [Google Scholar]
- 56.Guo X et al. Induction of innate lymphoid cell-derived interleukin-22 by the transcription factor stat3 mediates protection against intestinal infection. Immunity 40, 25–39 (2014). [DOI] [PMC free article] [PubMed] [Google Scholar]
- 57.Dobin A et al. Star: ultrafast universal RNA-seq aligner. Bioinformatics 29, 15–21 (2013). [DOI] [PMC free article] [PubMed] [Google Scholar]
- 58.Li B & Dewey CN Rsem: accurate transcript quantification from RNA-seq data with or without a reference genome. BMC Bioinform. 12, 323 (2011). [DOI] [PMC free article] [PubMed] [Google Scholar]
- 59.Love MI, Huber W & Anders S Moderated estimation of fold change and dispersion for RNA-seq data with deseq2. Genome Biol. 15, 550 (2014). [DOI] [PMC free article] [PubMed] [Google Scholar]
- 60.Langmead B & Salzberg SL Fast gapped-read alignment with bowtie 2. Nat. Methods 9, 357–359 (2012). [DOI] [PMC free article] [PubMed] [Google Scholar]
- 61.Li H et al. The sequence alignment/map format and samtools. Bioinformatics 25, 2078–2079 (2009). [DOI] [PMC free article] [PubMed] [Google Scholar]
- 62.Quinlan AR & Hall IM Bedtools: a flexible suite of utilities for comparing genomic features. Bioinformatics 26, 841–842 (2010). [DOI] [PMC free article] [PubMed] [Google Scholar]
- 63.Meyer LR et al. The UCSC genome browser database: extensions and updates 2013. Nucleic Acids Res. 41, D64–D69 (2013). [DOI] [PMC free article] [PubMed] [Google Scholar]
- 64.Patel RK & Jain M NGS QC toolkit: a toolkit for quality control of next generation sequencing data. PLoS ONE 7, e30619 (2012). [DOI] [PMC free article] [PubMed] [Google Scholar]
- 65.Heinz S et al. Simple combinations of lineage-determining transcription factors prime cis-regulatory elements required for macrophage and B cell identities. Mol. Cell 38, 576–589 (2010). [DOI] [PMC free article] [PubMed] [Google Scholar]
- 66.Lakhal-Littleton S et al. Cardiac ferroportin regulates cellular iron homeostasis and is important for cardiac function. Proc. Natl Acad. Sci. USA 112, 3164–3169 (2015). [DOI] [PMC free article] [PubMed] [Google Scholar]
- 67.Kanamori Y et al. Identification of novel lymphoid tissues in murine intestinal mucosa where clusters of c-kit+ il-7r+ thy1+ lympho-hemopoietic progenitors develop. J. Exp. Med 184, 1449–1459 (1996). [DOI] [PMC free article] [PubMed] [Google Scholar]
Associated Data
This section collects any data citations, data availability statements, or supplementary materials included in this article.
Supplementary Materials
Data Availability Statement
All data supporting the findings of this study are available within the article and its supplementary materials. The M. musculus reference genome (GRCm38/mm10 assembly) https://www.ncbi.nlm.nih.gov/assembly/GCF_000001635.20/ was used for RNA-seq and ChIP-seq read alignment. The Gene Expression Omnibus accession code for the sequencing data in this paper is GSE222621. Source data are provided with this paper.