

Abstract
The partitioning of polypeptides into nanoscale transmembrane pores is of fundamental importance in biology. Examples include protein translocation in the endoplasmic reticulum and the passage of proteins through the nuclear pore complex. Here we examine the exchange of cationic α-helical peptides between the bulk aqueous phase and the transmembrane β-barrel of the α-hemolysin (αHL) protein pore at the single-molecule level. The experimental kinetic data suggest a two-barrier, single-well free energy profile for peptide transit through the αHL pore. This free energy profile is strongly voltage- and peptide-length-dependent. We used the Woodhull-Eyring formalism to rationalize the values measured for the association and dissociation rate constants kon and koff, and to separate koff into individual rate constants for exit through each of the openings of the protein pore. The rate constants kon,  and
and  decreased with the length of the peptide. At high transmembrane potentials, the alanine-based peptides, which include bulky lysine side chains, bind more strongly (formation constants Kf ∼ tens of M−1) than highly flexible polyethylene glycols (Kf ∼ M−1) to the lumen of the αHL protein pore. In contrast, at zero transmembrane potential, the peptides bind weakly to the lumen of the pore, and the affinity decreases with the peptide length, similar to the case of the polyethylene glycols. The binding is enhanced at increased transmembrane potentials, because the free energy contribution ΔG = −ζδFV/RT predominates with the peptides. We suggest that the αHL protein may serve as a robust and versatile model for examining the interactions between positively charged signal peptides and a β-barrel pore.
INTRODUCTION
The interaction of polypeptides with transmembrane protein pores is of fundamental importance in biology. Examples include protein translocation in the endoplasmic reticulum (1,2), from the cytoplasm into mitochondria (3,4) or across the chloroplast membrane (5).
In particular, the translocation of proteins into mitochondria and chloroplasts occurs through protein channels located in the outer membranes of these organelles (6). Circular dichroism studies demonstrate that these proteins are probably transmembrane β-barrel pores (7,8). These findings set the outer membrane translocases apart from others such as the α-helical translocation pores. A question to be addressed is: how does a signal peptide interact with a β-barrel protein, and cross the channel? There is also considerable interest in examining the transport of polypeptides through β-barrel pores in other circumstances. For example, a β-barrel pore may also serve as a passageway for enzymes to enter the cytosol. Lethal factor (LF) and edema factor (EF) are believed to unfold, at least partially, and translocate through a 14-stranded β-barrel of protective antigen channel PA7 of anthrax toxin (9–11). The 263-residue N-terminal fragment of LF (LFN) is translocated across the PA7 channel even in the absence of cellular proteins, including ATP-driven factors (11). Very recently, the crystal structure of NaIP, a bacterial autotransporter, revealed a 12-stranded β-barrel domain that is filled by an N-terminal α-helix (12). Removal of the N-terminal α-helical domain enhanced the activity of the NaIP autotransporter, indicating that the helix functions in blocking the β-barrel pore.
There is a distinct class of β-barrel proteins that insert spontaneously into membranes without assistance of other proteins. These β-barrels, secreted from bacterial cells, are called pore-forming toxins (β-PFT). In particular, α-Hemolysin (αHL) is a self-assembling, β-PFT secreted by Staphylococcal aureus as a water-soluble monomer of 33.2 kDa (13). The monomer oligomerizes upon binding to the membranes of susceptible cells to form a transmembrane heptamer (14,15). The toxin is an important virulence factor due to its activity against a wide variety of mammalian cells, such as erythrocytes, keratinocytes, granulocytes, monocytes, and endothelial cells (16). The primary mechanisms of cell damage and death are (1) the leakage of water, ions, and other small molecules out of and into the cell, and (2) cell lysis. The αHL forms a relatively large, water-filled pore of known structure (17). The protein contains a roughly spherical vestibule, which measures ∼46 Å in internal diameter, and is located in the extramembranous part (17). In the transmembrane domain, the channel narrows to form a 14-stranded β-barrel with an average diameter of ∼20 Å and a length of ∼52 Å (17).
The knowledge of the crystal structure of the fully assembled αHL heptamer in detergent (17), combined with the wealth of options for membrane protein engineering (13,18,19), has led to approaches for examining single polymer dynamics (20–22), and designing unusual polymer-based nanostructures (20,23–25).
We have recently studied the partitioning of highly flexible neutral polyethylene glycols (PEGs) into the αHL pore. In the dilute regime, the dependence of partitioning on polymer length obeys a simple scaling law (26–28). The polymer moves into the pore by overcoming a free energy barrier of 1.2 kBT/kDa PEG (28). This barrier presumably arises from a reduction in the number of chain segment configurations (29,30). In the semidilute regime, increased polymer concentration induces an increase in the polymer partition coefficient (31,32). The difference between the results of the equilibrium partitioning experiments in the dilute and the semidilute regime has been attributed to the nonideality of the high concentration polymer solutions (28,33). In contrast to neutral PEGs, the dynamics of the entry and exit of charged polymers with respect to the pore can be substantially altered by applying an external electric field, thus changing the balance between the forces driving polymers into the pore and the forces driving them out (34). How these competing forces act when a charged peptide is transported through a β-barrel protein pore is not yet clarified.
Here, we examine the partitioning of synthetic peptides into the αHL protein pore. Specifically, we probe the exchange of cationic alanine-based peptides between the aqueous phase and the β-barrel, at the single-molecule level. By designing the peptides with a central lysine residue within the repeat unit (Ac-(AAKAA)mY-NH2, m = 2–7), the contributions of peptide charge and peptide length to the free energy barrier for the transport of these α-helical peptides across the αHL protein pore are explored.
In this work, we find that the association and dissociation rate constants, and the partitioning data, derived from single-channel electrical recordings of the αHL pore in the presence of micromolar concentrations of peptide, are strongly dependent on transmembrane voltage and peptide-length. We show that the kinetics of partitioning into the αHL protein pore is affected by two contributions: an increase in event frequency due to a more intense transmembrane electric field, and a reduction in event frequency for longer peptides as a result of an entropic penalty for the translocation across the nanometer-scale pore. We propose a semiquantitative model to account for the substantial change in peptide partitioning with transmembrane potential and peptide length.
MATERIALS AND METHODS
Peptide synthesis and purification
The peptides used in this work were Ac-(AAKAA)mY-NH2, where m = 2–7. Peptide 1 (m = 1, HPLC purity = 99.1%, Mw = 640 Da), Peptide 2 (m = 2, 99.5%, Mw = 1050 Da), Peptide 3 (m = 3, 98.2%, Mw = 1460 Da), Peptide 4 (m = 4, 99.5%, Mw = 1870 Da), Peptide 5 (m = 5, 95.3%, Mw = 2290 Da), Peptide 6 (m = 6, 95.1%, Mw = 2700 Da), and Peptide 7 (m = 7, 95.0%, Mw = 3110 Da) were synthesized by SynPep Corporation (Dublin, CA). The peptides were purified by HPLC and analyzed by mass spectroscopy (SynPep) and capillary electrophoresis (SynPep). To further confirm the peptide homogeneity, the peptides were analyzed by Tris-Tricine polyacrylamide gel electrophoresis (35) in a 16.5% resolving gel, with a 4% stacking gel (Bio-Rad Laboratories, Hercules, CA). The peptides appeared as discrete narrow bands with only slightly increased broadening with increasing molecular mass.
Circular dichroism of the peptides
CD spectra were recorded on an Aviv 62DS circular dichroism spectropolarimeter (Lakewood, NJ) equipped with a temperature control unit. Quartz cuvettes with a 10-mm-path length were employed. To correlate the CD results with the planar bilayer recordings, the peptides were diluted into 2 M KCl, 10 mM potassium phosphate, pH 7.5, at an amide bond concentration of 0.25 mM. The spectra were corrected by subtracting the spectrum of the buffer alone. The mean molar residue ellipticity, at 222 nm ([θ]222), was recorded in the range 0–95 °C, with steps of 2°C. Stock peptide concentrations were determined by measuring tyrosine absorbance in 10 mM potassium phosphate-buffered water (pH 7.5) (36). The observed mean residue ellipticity, [θ]obs, was converted to fractional helicity fH for each of the peptides:
 |
(1) |
In Eq. 1, the symbols [θ]H and [θ]C are the [θ] values, in deg cm2 dmol−1, for the complete helix and the complete coil, respectively (37). They are defined by the relations (37)
 |
(2) |
and
 |
(3) |
where T is the temperature in °C.
Wild-type α-hemolysin pore
Heptameric wild-type αHL was obtained by treating the monomer, purified from Staphylococcus aureus, with deoxycholate. The heptamer was then isolated from SDS-polyacrylamide gels as previously described (38,39).
Molecular modeling
The β-barrel structure of the αHL pore was generated with SPOCK 6.3 software (40), with coordinates (17) from the Brookhaven Protein Data Bank (PDB ID code 7ahl). The models for the structures of the peptides Ac-(AAKAA)mY-NH2, m = 2–7, were generated by INSIGHT II (Molecular Simulations, San Diego, CA), via the BioPolymer Builder module. The SPOCK software was also used to calculate the solvent-accessible volume of peptides and to measure distances between atoms inside the β-barrel domain of the pore.
Single-channel recordings with planar lipid bilayers
Planar lipid bilayers were used for single-channel recordings as described previously (21,41). Both the cis and trans chambers of the apparatus contained 2 M KCl, 10 mM Tris·HCl, pH 7.5, with 100 μM EDTA, unless otherwise stated. A planar lipid bilayer membrane of 1,2-diphytanoyl-sn-glycerophosphocholine (Avanti Polar Lipids, Alabaster, AL) was formed across a 70 μm orifice. The transmembrane potential was applied through Ag/AgCl electrodes connected to the bath with 1.5% agar bridges (Ultra Pure DNA Grade, Bio-Rad Laboratories, Hercules, CA) containing 3 M KCl (Sigma, St. Louis, MO). Measurements were performed at room temperature (24 ± 0.5°C). Protein was added to the cis chamber, which was at ground. Single-channel currents were recorded by using a patch-clamp amplifier (Axopatch 200B, Axon Instruments, Foster City, CA) in the whole-cell mode (β = 1) with a CV-203BU headstage. The signals were lowpass-filtered at 40 kHz with an eight-pole Bessel filter (Model 900, Frequency Devices, Haverhill, MA). A Pentium PC equipped with a DigiData 1322A (Axon Instruments) was used for data acquisition with Clampex 9.2 software (Axon Instruments) at a sampling rate of 200 kHz. The distributions of closed (occupied states) and open (unoccupied states) durations were fitted with sums of exponentials using the maximum likelihood method (42) to estimate the most probable values of the time constants. To determine the number of exponentials for the best fit, we applied the log likelihood ratio (LLR) test, with a confidence level of 0.95, to compare different fitting models (28,42,43). For display and further manipulation of the single-channel currents and histograms, we used pCLAMP 9.2 (Axon Instruments) and Origin 7.0 (Microcal Software, Northampton, MA).
Binding affinities derived from single-channel recordings
We found that the reciprocal of τon (the mean inter-event interval) is linearly dependent on the peptide concentration, whereas τoff (dwell time from the histogram of the occupied states) is independent of the peptide concentration. Thus, a simple bimolecular interaction between peptide and pore can be assumed. The rate constants for association (kon) were derived from the slopes of plots of 1/τon versus [pept], where [pept] is the peptide concentration in the aqueous phase. The rate constants for dissociation (koff) were determined by averaging the 1/τoff values recorded over an 80–400-μM concentration range. The equilibrium association constants were then calculated by using Kf = kon/koff. The partition coefficients (Π) for the peptides between the aqueous phase and the pore lumen were determined from the equilibrium association constants (Kf) (28). At low occupancies of the pore by the peptide (28)
 |
(4) |
where [pept]* is the effective molar concentration of a single peptide inside the αHL pore, and has the value
 |
(5) |
The values NAV and Vbarrel are Avogadro's number and the internal volume of the β-barrel, respectively.
RESULTS AND DISCUSSION
Temperature-dependence of peptide structure in solution
Circular dichroism was used to obtain the helix content of the alanine-rich peptides as a function of temperature. Lysines were included because they are positively charged residues and solubilize the peptides. Alanine has a strong helix propensity (44). The CD spectra of Ac-(AAKAA)mY-NH2 exhibit two minima (at 208 and 222 nm) and a single maximum (at 190 nm), which is typical for α-helical peptides. The thermally induced helix-to-coil transition for each peptide was followed by monitoring the CD signal at 222 nm (Fig. 1 A). Identical [θ]222 curves were obtained for heating (0–95°C) and cooling (95–0°C). This demonstrates that the thermally induced helix-coil transition is reversible. The weak CD signals for the shortest peptides (P1 and P2) indicate that these molecules are in a random coil conformation. By contrast, the longest peptides (P6 and P7) have a high value of [θ]222, confirming extensive helix formation.
FIGURE 1.
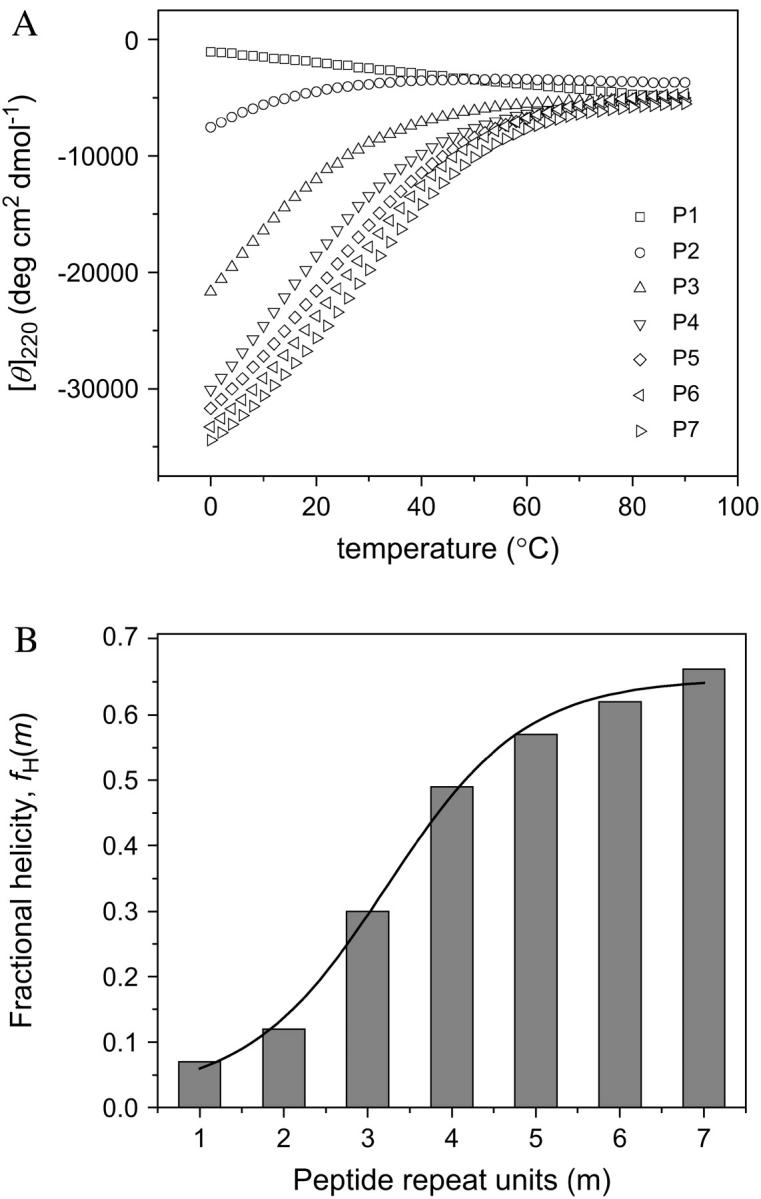
Thermally induced unfolding curves for the α-helical alanine-based peptides Ac-(AAKAA)mY-NH2, m = 1–7, determined by circular dichroism. (A) Circular dichroism data collected at 222 nm over a temperature range of 0–95°C; (B) Fractional helicity versus the number of peptide repeat units calculated for 24°C with the data from A. The fractional helicity was calculated by a procedure developed previously (37) for α-helical alanine-rich peptides of varying lengths in water. The buffer was 2 M KCl, 10 mM potassium phosphate, pH 7.5.
The CD spectra were used to calculate the fractional helicity (fH) according to Eq. 1. The conversion of [θ]222 to fH requires knowledge of the ellipticity of both the complete coil ([θ]C) and the complete helix ([θ]H). Both values are slightly temperature-dependent (Eqs. 2 and 3) (37,44). The fractional helicity (fH) computed at 24°C increases progressively with the peptide length (Fig. 1 B). For the longest peptide that we have used in this work (P7), we found a fractional helicity of 0.67. This result indicates that P7 has a helical core of ∼24 amino acids (44).
Molecular model of a folded peptide in a protein nanopore
The narrowest region of the αHL pore, a β-barrel structure which forms the transmembrane domain, is almost 50 Å long and ∼25 Å wide (based on Cα–Cα dimensions; Fig. 2 A). Because of the amino acid side chains, the actual diameter of the pore is ∼20 Å. The physical properties of the peptides used in this work are listed in Table 1. The widest cross-sectional diameter of the peptides (19 Å), which includes side chains of the lysine residues, is similar to the average diameter of the β-barrel (∼20 Å; Fig. 2, A and B). The average diameter of the peptides including their side chains is ∼13.5 Å, close to the diameter of the most constricted area of the αHL lumen (amino acids Met113 and Lys147, Fig. 2 B) near position Glu111 (∼15 Å).
FIGURE 2.
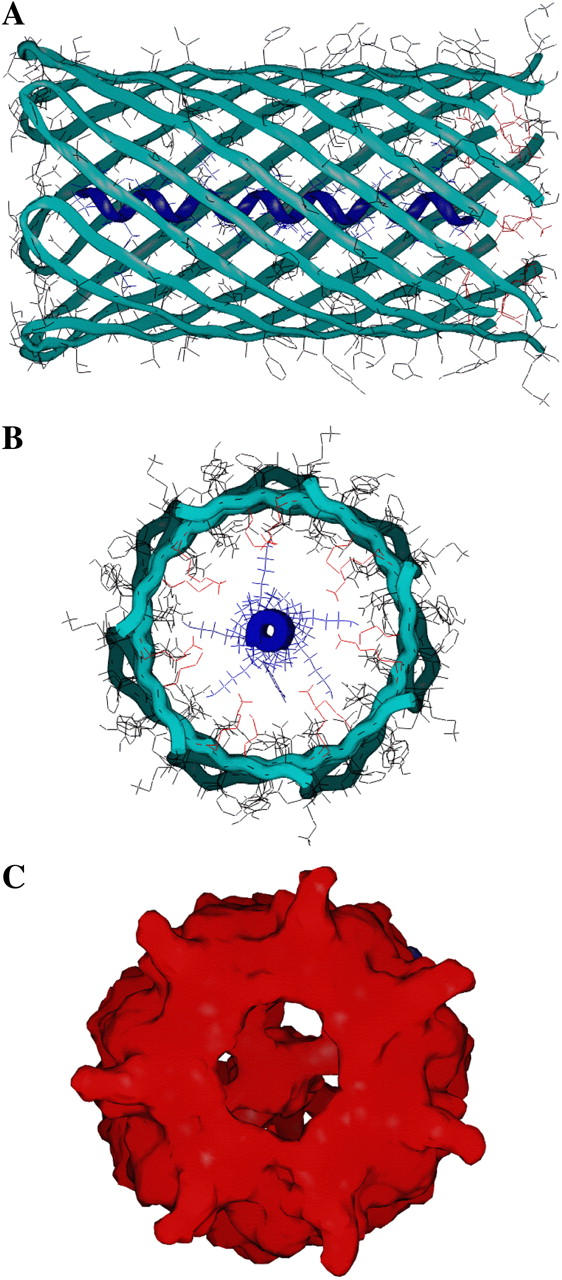
Model of an alanine-based α-helical peptide located in the β-barrel of the αHL pore. (A) A representation of Ac-(AAKAA)5Y-NH2 (the backbone is in dark blue) within the β-barrel (green); (B) Cross-sectional view of A in a backbone-bonds graphic representation. The α-helical peptide bonds are colored in blue. (C) Cross-sectional view of accessible surface of B. The large vestibule located within the aqueous phase, in the cis side of the lipid bilayer, is excluded from this figure.
TABLE 1.
Properties of the peptides used in this work
| Peptide* | Net charge | Number of residues | Mw†(D) | α-helix length‡ (Å) | van der Waals volume‡ (Å3) × 10−3 | Accessible volume‡(Å3) × 10−3 |
|---|---|---|---|---|---|---|
| P2 | +2 | 11 | 1050 | 16 | 0.78 | 2.4 |
| P3 | +3 | 16 | 1460 | 23 | 1.1 | 3.3 |
| P4 | +4 | 21 | 1870 | 31 | 1.5 | 4.2 |
| P5 | +5 | 26 | 2290 | 38 | 1.8 | 5.1 |
| P6 | +6 | 31 | 2700 | 46 | 2.1 | 6.0 |
| P7 | +7 | 36 | 3110 | 54 | 2.4 | 7.0 |
Pm is the peptide with the sequence Ac-(AAKAA)mY-NH2. The PDB format files of all peptides, forced to be α-helix, were generated in INSIGHT II, Ver. 98.0 (computer simulations, Accelrys, San Diego, CA).
The molecular masses of the peptides were determined by mass spectroscopy. The differences between the theoretical molecular masses and the actual molecular masses found by mass spectroscopy were <0.1% of the theoretical values.
The α-helix length, van der Waals volume, and solvent-accessible volume were calculated with SPOCK software (40). The solvent-accessible volume is the volume calculated from the solvent-accessible surface area, which is traced out by the center of a water molecule as it rolls over the surface of the peptide (55). The van der Waals volume is the sum of all van der Waals spheres associated with all atoms in the peptide.
The peptides, as helices, vary in length from 16 Å (P2) to 54 Å (P7) (Table 1); the latter is comparable with the length of the β-barrel. For all peptides, the solvent-accessible volume (Table 1, last column) is smaller than the total solvent-accessible internal volume of the β-barrel. For example, P7 exhibits a solvent-accessible molecular volume of 7 × 10³ Å3 (Table 1), whereas the total internal volume of the β-barrel is ∼104 Å3 (28). In general, the solvent-accessible volume overestimates the volume of a protein (in this case, the alanine-based peptide), but it underestimates the volume of a cavity within a protein (in this case, the β-barrel part of the lumen. (45). Therefore, there is a volume, between the peptide and the β-barrel wall, which enables the presence of solvated ions. Thus, the peptides do not produce a full single-channel blockade (see below). It is also true that the peptide may adopt a distorted helical structure when partitioning into the β-barrel region of the lumen. It is more likely that the peptide is loosely packed within the β-barrel.
Transient current blockades of the αHL pore by the alanine-based peptides
The addition of peptides of various lengths to the trans side of the bilayer, at low micromolar concentrations, produces reversible partial channel blockades of the αHL pore (Fig. 3 A, peptide P2 and Fig. 3 B, peptide P5), at a transmembrane potential of +100 mV.
FIGURE 3.

A typical single-channel recording from the αHL pore in the presence of 80-μM peptide applied to the trans side of the bilayer, at a holding potential of +100 mV. (A) Single channel recording in the presence of P2; (B) scatter plot of current block amplitudes versus dwell time for P2; (C) dwell-time histogram for P2 (τoff−1 = 216 μs, P < 0.05); (D) semilogarithmic histogram of inter-event intervals for P2 (τon = 19.9 ms); (E) single channel recording in the presence of P5; (F) scatter plot of current block amplitudes versus dwell time for P5; and (G) dwell-time histogram for P5 (τoff−0 = 83 μs and τoff−1 = 779 μs). The two-exponential fit was statistically significant, as judged by a maximum likelihood ratio test (P < 0.05). (H) Semilogarithmic histogram of inter-event intervals for P5 (τon = 64.5 ms).
The partial channel blockades made by the peptides are greater in amplitude and duration for a long peptide than for a short peptide, as illustrated in the scatter plots of Fig. 3, B and F. Interestingly, a second current block peak could be detected for medium-length peptides (peak denoted by 0, Fig. 3 F). Both the amplitude of the current blockade and the dwell time associated with the latter peak are substantially smaller than the corresponding values of the highly populated peak (denoted by 1, Fig. 3 F). The dwell time histogram (τoff) for P5 could be fitted by a two-exponential function (τoff−0 = 78 ± 8 μs and τoff−1 = 790 ± 35 μs, P0/(P0 + P1) = 0.11 ± 0.01, n = 4, Fig. 3 G), which is in contrast with the one-exponential function for short peptides (for P2, τoff−1 = 220 ± 14 μs, n = 4, Fig. 3 C). The value τoff−0 corresponds to the low-amplitude blocks, and τoff−1 to the more substantial blocks. The fits are judged by an LLR test (28,43) to compare the statistical significance of different models. The presence of two population peaks in the electrical recordings is also illustrated by the event amplitude histograms (Fig. 4). The peaks represent the amplitudes of the transient current blockades produced by the peptides when added to the trans side of the bilayer.
FIGURE 4.

Typical amplitude histograms that document transient single-channel current blocks of the αHL pore produced by cationic alanine-based peptides. (A) Peptide P2. (Left) Two distinct peaks are identified at a transmembrane potential of +40 mV, with current block amplitudes of A0 = −20.1 pA and A1 = −41.7 pA; (Middle) +100 mV, with A0 = −42.5 pA and A1 = −102.5 pA; and (Right) +160 mV, with A0 = −75.2 pA and A1 = −157.5 pA. (B) Peptide P5. (Left) +40 mV, with A0 = −29.8 pA and A1 = −55.0 pA; (Middle) +100 mV, with A0 = −80.5 pA and A1 = −141.5 pA; and (Right) +160 mV, with A0 = −117.5 pA and A1 = −227.5 pA. (C) Peptide P7. (Left) +40 mV, with A0 = −32.5 pA and A1 = −57.5 pA; (Middle) +100 mV, with A0 = −83.5 pA and A1 = −145.5 pA; and (Right) +160 mV, with A0 = −130.5 pA and A1 = −240 pA. In all cases, the bin size was 5 pA and the peptide concentration was 80 μM.
The probability of the events corresponding to peak 0 is strongly voltage- and peptide-length dependent (Fig. 4). For all peptides, excepting P7, we have found that this probability decreases with the transmembrane potential. The probability of the events corresponding to peak 0, P0/(P0 + P1), increases with the peptide length. Taking into consideration the substantially lower current block amplitude (<50% of the current block amplitude of peak 1, Figs. 3 and 4) and the shorter duration of the 0 events, peak 0 can be attributed to peptides that partially enter the αHL pore, but fail to traverse it. The amplitude of the short events is “true” (i.e., not limited by filtering) because their mean duration is well above the risetime Tr, which is ∼33 μs (42).
The semilogarithmic τon histograms were fitted by a single-exponential function for all the cases examined in this work, as judged by an LLR test. For example, at +100 mV, for peptide P2, τon = 20.1 ± 0.7 ms, n = 4 (Fig. 3 D), whereas for peptide P5, τon = 65.3 ± 2.1 ms, n = 4 (Fig. 3 H). Separate τon values for the two classes of events (τon−0 = τon/f0 and τon−1 = τon/f1) were determined by using the relative event frequencies f0 and f1 (f1 = 1–f0), as determined from the τoff histograms (28). For short peptides (m = 2,3) and high transmembrane potentials (≥140 mV), we were occasionally able to detect a second peptide within the αHL pore (data not shown here), also noticed with cyclic peptides (46).
Longer peptides are excluded by the αHL pore at low transmembrane potentials
The event frequency from the most populated peak (1, Fig. 3 F) is voltage- and peptide-length dependent (Fig. 5 A), and was normalized to the corresponding value for a transmembrane potential of +40 mV (Fig. 5 B). For long peptides, the event frequency is substantially reduced at low transmembrane potentials, indicating that the association rate constant kon is low. Strikingly, the normalized event frequency of the longest peptide (P7) undergoes a substantial increase with the transmembrane potential (3015 ± 157% change between +40 and +180 mV, n = 4, Fig. 5 B). In contrast, the normalized frequency of the short peptide (P2) undergoes a smaller change (320 ± 12% change between +40 and +180 mV, n = 4, Fig. 5 B). Below, this is explained in terms of the Eyring-Woodhull formalism applied to the binding of a charged polymer to a protein pore.
FIGURE 5.
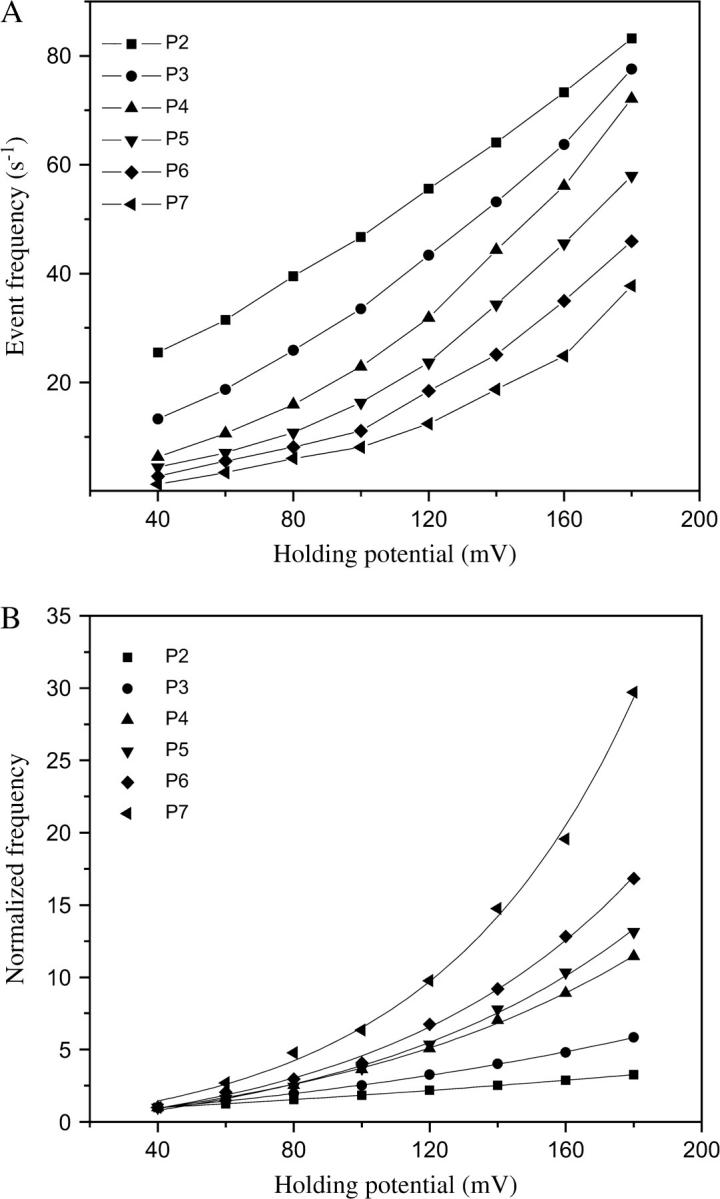
Event frequencies derived from the series of alanine-based peptides interacting with the αHL protein pore. The quantity of 80-μM peptide was added to the trans chamber. (A) Event frequency of the major peak 1; (B) normalized event frequency. The normalization was with respect to the event frequency for each peptide recorded at +40 mV.
Biphasic voltage-dependence of the residence time
For a 1.5-kDa peptide (P3, Table 1), the dwell-time (τoff) corresponding to the most populated peak (1) is in the range of a few hundreds of microseconds, much longer than the interaction time determined for a neutral and highly flexible polymer such as PEG-1.5 kDa (∼50 μs) (28). In identical experimental conditions, a 1.5-kDa single-stranded oligonucleotide (carrying five negative phosphate charges) traverses the αHL pore in a time interval between several tens of microseconds to one-hundred microseconds (47). We found that the dwell time of the peptides has a biphasic voltage-dependence (Fig. 6). At lower transmembrane potentials, τoff increases with potential, whereas at higher transmembrane potentials, τoff decreases with potential. This result suggests a binding interaction between the αHL protein pore and cationic alanine-rich peptides. The value τoff would be a monotonically decreasing function of the transmembrane potential in the absence of a peptide-pore interaction.
FIGURE 6.
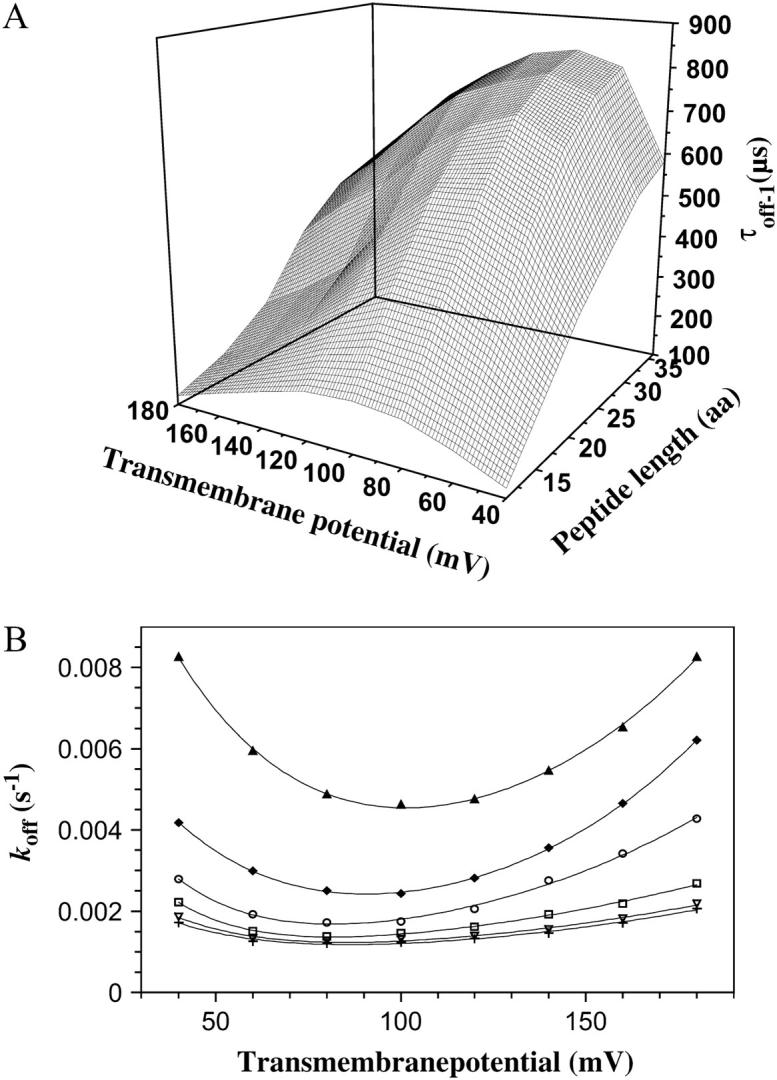
Voltage- and peptide-length-dependence of the dwell time. (A) Three-dimensional plot of the dependence of the peptide residence time τoff−1 on the transmembrane potential and peptide length. (B) The kinetic constant koff versus the transmembrane potential. The experimentally determined points for P2 (▴), P3 (♦), P4 (○), P5 (□), P6 (∇), and P7 (+) were fitted by a double-exponential function (see Eq. 10). The standard deviations are not included for the clarity of the plot.
Kinetic rate constants for the interaction between the peptide and the αHL pore
As shown in Table 2 (last two columns), the highly flexible polyethylene glycols (PEGs) bind almost 100-fold more weakly than the cationic alanine-rich peptides, in the dilute concentration regime.
TABLE 2.
Dependence of kinetic constants on peptide molecular mass
| Peptide | kon−1 (M−1 s−1) × 10−5 | koff−1 (s−1) × 10−3 |
 * (M−1) * (M−1) |
 † (M−1) † (M−1) |
|---|---|---|---|---|
| P2 | 5.5 ± 0.6 | 7.5 ± 0.5 | 75 ± 7 | 1.8 |
| P3 | 4.0 ± 0.5 | 4.4 ± 0.4 | 94 ± 6 | 1.2 |
| P4 | 2.7 ± 0.7 | 3.3 ± 0.4 | 81 ± 5 | 0.78 |
| P5 | 1.9 ± 0.3 | 3.2 ± 0.3 | 62 ± 5 | 0.52 |
| P6 | 1.5 ± 0.3 | 2.9 ± 0.5 | 48 ± 5 | 0.34 |
| P7 | 0.9 ± 0.2 | 2.8 ± 0.4 | 31 ± 3 | 0.23 |
The data were recorded at a holding potential of +100 mV in 1 M KCl, 10 mM Tris·HCl, 100 μM EDTA, pH 7.5, with 80 μM peptide in the trans chamber. Values are the mean ± SD from at least four single-channel experiments.
The dependences of the association and dissociation rate constants on peptide molecular mass, derived from single-channel recordings at +100 mV and 1 M KCl, are listed in Table 2. The single-channel data have been fit to a simple model for the interaction of the peptides with the αHL pore (Fig. 7). As mentioned above, the events that correspond to the state i0 have a low-amplitude current blockade and a very short duration. This duration is much shorter than the translocation time for a polymer with identical molecular mass and charge (see above). These characteristics of state i0, and its voltage- and peptide length-dependence (Figs. 3 and 4) suggest that the peptide, in this particular state, fails to traverse the αHL protein pore through to the cis side. The state i1 (that corresponds to peak 1) is characterized by a high-amplitude current blockade, a long duration and a high frequency of occurrence (Fig. 7). In contrast, the extent of the current block amplitude associated with state i1 suggests a full partitioning of the peptide into the αHL protein pore. Experiments with other polymers, such as DNA and RNA, carried out in similar conditions, show a substantial current blockade when they partition into the αHL protein pore (47,48).
FIGURE 7.

Kinetic model for the interaction of an alanine-based peptide with the lumen of the αHL pore. The two states i0 and i1 indicate the two classes of events, 0 and 1 (Fig. 3 F).
Voltage- and peptide-length-dependence of the kinetic rate constants for entry and exit at each of the openings of the pore
It is very instructive to analyze the voltage- and peptide length-dependence of state i1. By using the Woodhull formalism (48,49), we can calculate the voltage (V)- and peptide length (L)-dependence of the individual rate constants for entry and exit at the cis and trans entrances associated with the most frequent state (i1). Here, we define δ as the fraction of the transmembrane electrical potential between the trans side of the bilayer and the binding site (49,50). Sometimes this parameter is called the electrical distance to the binding site. However, δ should not be confused with a physical distance, which is harder to calculate because the voltage drop is not linearly dependent on the physical distance. The values of the electrical distance δ are listed in Table 3. The electrical distance is sensitive to the peptide length. Therefore, the binding site is dependent on the peptide length. For example, for the short peptide P2, the electrical distance is 0.39 ± 0.03, whereas for the long peptide P7, the electrical distance is only 0.18 ± 0.03 (Table 3). These values were determined by the assumption that the effective charge of a lysine side chain is reduced to 0.5 due to the screening effect of the high ionic strength of the buffer. This result suggests that the long peptides bind nearer the trans entrance than the short peptides. For the short peptides, we can assume that the central part binds to the β-barrel part of the lumen. However, for the long peptides that bind nearer the trans entrance, it is likely that the binding part is not located centrally.
TABLE 3.
The electrical distance (δ) and the distances from the binding site to the transition states for dissociation to the cis (δc) and trans (δt) sides, as measured from the trans entrance
| Peptide | Net charge* |
 † †
|
δ2 |  |
|---|---|---|---|---|
| P2 | +2 | 0.08 ± 0.01 | 0.39 ± 0.03 | 0.97 ± 0.03 |
| P3 | +3 | 0.07 ± 0.02 | 0.37 ± 0.03 | 0.83 ± 0.03 |
| P4 | +4 | 0.09 ± 0.01 | 0.32 ± 0.02 | 0.78 ± 0.04 |
| P5 | +5 | 0.09 ± 0.02 | 0.21 ± 0.02 | 0.66 ± 0.02 |
| P6 | +6 | 0.09 ± 0.01 | 0.19 ± 0.02 | 0.48 ± 0.03 |
| P7 | +7 | 0.10 ± 0.02 | 0.18 ± 0.02 | 0.42 ± 0.02 |
This is the net charge of the peptide in aqueous solution, and in the absence of a screening effect (pH 7.5).
The values are obtained with the assumption that the effective charge of a single lysine side chain within the pore is reduced to 0.5 due to the screening effect of the high ionic strength of the buffer. Values of the effective charge of a lysine residue higher than 0.6 would give unrealistic δ-values. Values are the mean ±SD from at least four single-channel experiments.
When the peptides bind to the αHL pore from the trans side, the association rate constant kon−1 is given by (51)
 |
(6) |
where F, R, and T denote the Faraday's constant, the gas constant, and the absolute temperature, respectively. The values ζ(L) and δt(L) are, respectively, the effective charge of the peptide in the pore and the distance from the transition state for dissociation to the trans exit, as measured from the trans side of the bilayer. The values of δt(L) are also listed in Table 3. The low values of δt(L) indicates that the transition state for dissociation to the trans exit occurs near the trans entrance.
At room temperature,
 |
(7) |
Therefore, Eq. 6 can be written
 |
(8) |
Fitting the curves from Fig. 5 A with single exponentials, we can obtain the values for kon−1(L,0). These values were also used for the calculation of partition coefficients at 0 mV, Π(L,0) (see below in Fig. 11). The U-shaped dependence of the rate constant koff−1 on the transmembrane potential (Fig. 6 B) indicates that the peptides in state i1 bind to the αHL pore and exit through either the trans or cis opening (Fig. 7). If the peptides exit through only the trans side, then koff−1(V) would be a single-decay exponential (Eq. 10). Alternatively, if the peptides exit through only the cis side, then koff−1(V) would be a single-growth exponential (Eq. 11). All these considerations are made by the assumption that the transit time is much shorter than the binding (residence) time.
FIGURE 11.
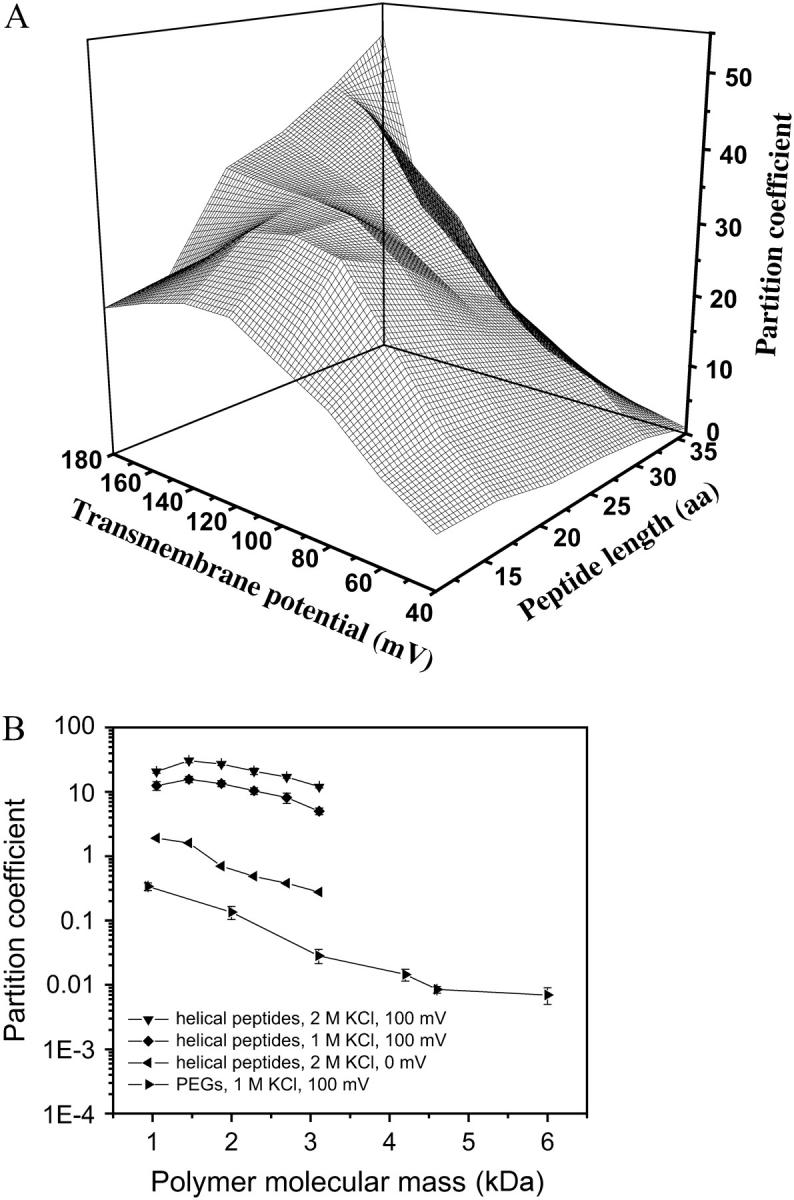
Partition coefficients of the alanine-based peptides between the αHL pore and bulk solution. (A) A three-dimensional plot of the partition coefficients versus transmembrane potential and peptide length calculated from data recorded in 2 M KCl. (B) Comparison of the partition coefficients between peptides in 2 M KCl (▾) and 1 M KCl (♦) and PEGs in 1 M KCl (▸), at +100 mV. The partition coefficients for the peptides in 2 M KCl, at 0 mV (◂) are also shown. The expression aa is the number of amino acids.
The dissociation rate constant associated with peak 1 (see the model in Fig. 7) is given by (51)
 |
(9) |
with
 |
(10) |
and
 |
(11) |
Here  and
and  are the dissociation rates of the peptides through the trans and cis entrances, respectively, at 0 mV. The values δ(L) and δc(L) are the distances from the binding site and the transition state for dissociation to the cis side, respectively, as measured from the trans entrance. For each peptide length L, and a transmembrane potential V, we can determine the dissociation rate constant koff−1 (L,V) (see Materials and Methods). From the fit of the family of curves koff−1(L,V) (Eqs. 9–11, and Fig. 6 B) that correspond to individual peptides, we can obtain the dissociation rate constants to the cis and trans sides
  and
and  respectively, at 0 mV. In addition, we can obtain the exponential coefficients of ζ(L)[δ (L) − δt(L)] and ζ(L)[δc(L) − δ (L)]. The goodness of all fits was satisfactory (R = 0.97 ± 0.02). These fitting parameters can be used to calculate the dissociation rate constants
  and
and 
Finally, we can examine the relative exit frequency through the trans and cis sides, respectively, as
 |
(12) |
and
 |
(13) |
where  and
and  are the probabilities that the peptides dissociate through the trans and cis sides, respectively. By using the relations in Eqs. 10–13, the relative exit frequencies through the trans and cis sides are plotted as two-dimensional surfaces (Fig. 8, A and B). A two-dimensional plot in Fig. 8 was obtained from a series of one-dimensional plots for each value of L, joined to make a surface.
FIGURE 8.
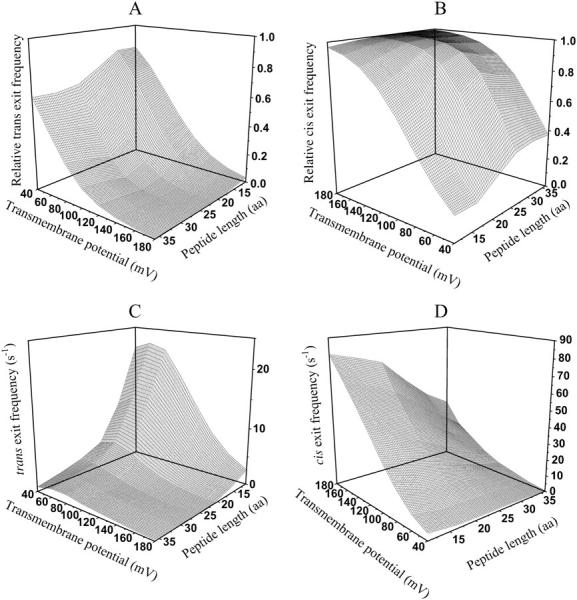
Three-dimensional plots of the relative and absolute frequencies (from peak 1) for the exit of the peptides through either the cis or trans entrance of the αHL pore as functions of transmembrane potential and polymer length. (A) Relative trans exit frequency; (B) relative cis exit frequency; (C) trans exit frequency; and (D) cis exit frequency. The expression aa is the number of amino acids. The other conditions are the same as those in Fig. 5.
Therefore, the exit frequencies through the trans and cis entrances are given by
 |
(14) |
 |
(15) |
where fon−1(L,V) is the frequency of on−1 events, and Cpept is the peptide concentration at the trans side of the bilayer. For all peptides, at voltages higher than +80 mV, the cis exit frequency is greater than the trans exit frequency (Fig. 8, C and D). A strong voltage-dependence was observed for the trans exit frequency in the case of the shorter peptides, but not for the longer peptides (Fig. 8 C). A simple interpretation is that the trans exit frequency is very low for long peptides, as a result of a large transition state free energy. In contrast, for short peptides, the trans exit frequency is large, as a result of a small transition state free energy (Fig. 8 C). The cis exit frequency is voltage-dependent for all the peptides examined in this work (Fig. 8 D). The exit frequency through the cis side is substantially enhanced at very high transmembrane potentials (Fig. 8 D). The dissociation rate constants  and
and  are plotted in Fig. 9. For short peptides, both
  and
and  are large, as a result of small transition state free energies for the trans and cis exits, respectively. In contrast, for long peptides, the dissociation rate constants are small.
FIGURE 9.
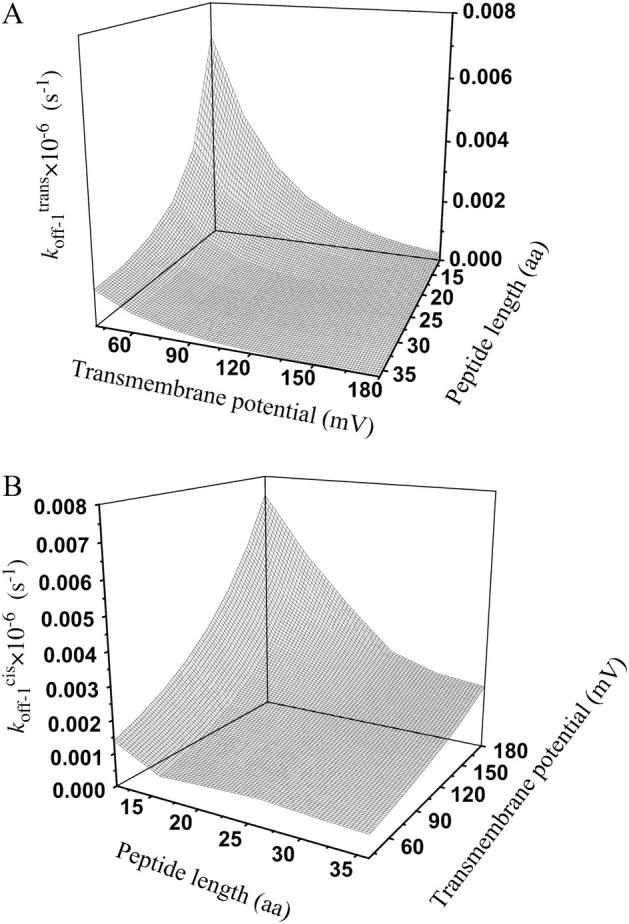
Three-dimensional plots of the off−1 rate constants associated with exit of the peptides through either the cis or trans entrance of the αHL pore as functions of transmembrane potential and polymer length. (A)  ; (B)
; (B)  The expression aa is the number of amino acids. The other conditions are the same as those in Fig. 5.
The free energy barriers and free energy increments for the transitions of the peptide in the αHL pore
Using Eyring's transition state theory (52, 53), the rate constants that correspond to 0 mV (Eqs. 8–11) can be written (49) as
 |
(16) |
 |
(17) |
 |
(18) |
Here, h, kB, and T are the Planck constant, the Boltzmann constant, and the absolute temperature, respectively. The value κ is the transmission coefficient. We can obtain the increment in activation free energy per peptide repeat for each of the transitions, at 0 mV,
 |
(19) |
Here, m is the number of peptide repeats, and
 |
(20) |
 |
(21) |
In Eqs. 20 and 21, C is a constant.
Therefore,
 |
(22) |
Similarly,
 |
(23) |
 |
(24) |
From Eqs. 8–11 and 16–18, the transition state free energies are given by the relations
 |
(25) |
 |
(26) |
 |
(27) |
If we consider the Eyring frequency factor,
 |
(28) |
then we can calculate ΔGon−1 (L,0),  and
and 
However, ff from Eq. 29 is only valid for elementary transitions over a distance less than the mean free path of 0.1 Å (52). Therefore, we chose the more suitable value of 109 s−1, which corresponds to diffusional transitions over a distance of 1 nm (52). The activation free energies (Eqs. 26–28), as well as the corresponding rate constants at 0 mV, are plotted in Fig. 10. The kinetic data obtained in this work are consistent with a two-barrier, single-well free energy profile, which has been previously proposed for the voltage-dependent current block of anthrax protective antigen channels by tetraalkylammonium ions (54).
FIGURE 10.
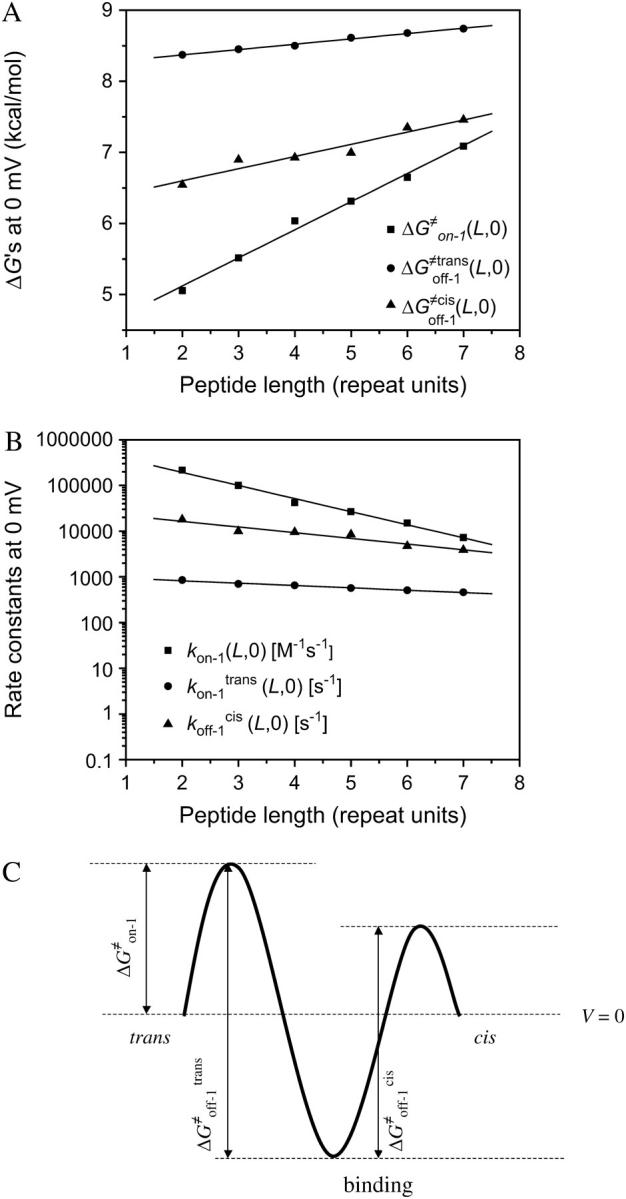
The free energies  and
and  at 0 mV, and their corresponding kinetic rate constants kon−1,
  and
and  as a function of peptide length. (A) The free energies at 0 mV; (B) the kinetic rate constants at 0 mV; and (C) free energy barrier model for the αHL protein pore with a single binding site for alanine-rich peptides at zero transmembrane potential.
Fig. 10 C shows a free energy diagram for three positions of the peptide, in the absence of an applied transmembrane potential (V = 0). The three positions are the trans side, the binding site located in the β-barrel part of the αHL pore, and the cis side. In passing from free aqueous solution on the outside of the membrane (the trans side) to the binding site within the channel, the peptide has to cross a trans energy barrier. Importantly, the location of the energy well that corresponds to the binding site (Fig. 10 C) is dependent on the peptide length (see details in Table 3). The peptide has to overcome a cis energy barrier, when passing from the binding site to the cis aqueous solution, or a trans energy barrier, when returning from the binding site to the trans side of the bilayer. The transition state free energy data shown in Fig. 10 A indicate that the trans barrier is higher than the cis barrier. This is closely similar to the free energy profile corresponding to the voltage-dependent block of anthrax channels by tetraalkylammonium ions (54).
From the relations in Eqs. 16–18, the free energies at 0 mV are given by
 |
(29) |
 |
(30) |
 |
(31) |
The plots of the kinetic rate constants and the corresponding transition state free energies, at zero transmembrane potential, are shown in Fig. 10. In the absence of a transmembrane potential, a relatively greater change in the kon value than in both koff values, versus the length of the peptide, was calculated.
Using the relations in Eqs. 25–27, we can express the final forms for the voltage- and length-dependence of the activation free energies of on, off−1 trans, and off−1 cis events.
 |
(32) |
 |
(33) |
 |
(34) |
where the parameters kon−1(L,0),  ζδt(L), ζ[δ(L) − δt(L)], and ζ[δc(L) − δ(L)] are obtained by direct fitting of kon−1(L,V) and koff−1(L,V) (Eqs. 8–11, and Figs. 5 and 6).
Partition coefficients
The equilibrium association constant that corresponds to the state i1 is given by
 |
(35) |
where kon−1 and koff−1 are given above (Eqs. 8–11). Therefore, the partition coefficient is a voltage- and peptide-length-dependent function (28):
 |
(36) |
The two-dimensional plot of Π(L,V), obtained from experimentally determined values of kon and koff (not from fittings; Eq. 35), is shown in Fig. 11 A. The partition coefficients of the peptides into the αHL pore are larger than unity in all cases (Fig. 11 A). Furthermore, the value of the partition coefficient varies substantially with both transmembrane potential and peptide molecular mass. At low transmembrane potentials (e.g., +40 mV), the partition coefficient decreases with the length of the peptide (Fig. 11 A). This effect is dominated by a reduction in kon−1 (Figs. 5 A and 10 B). This situation is similar to the case of the neutral and flexible PEGs, which undergo a partitioning decrease as the molecular mass increases (see also the discussion below) (27,28,32).
Conversely, at high transmembrane potentials, the partition coefficient increases substantially with the length of the peptide (Fig. 11 A). In this latter case, both kon−1 and koff−1 are peptide-length-dependent: there is a reduction in kon−1 with the peptide length (Fig. 5 A), but there is also a relatively greater decrease in koff−1 (Fig. 6 B). Overall, high partition coefficients at increased transmembrane potentials are observed, because ΔG(V) = −ζ(L) δ(L)FV predominates with the peptides. For short peptides, the biphasic behavior of the partition coefficient is due to the strong voltage-dependence of koff−1 (Fig. 6 B), and also because of a relatively greater change in kon−1 (Fig. 5 B).
The partition coefficient Π(L,0) was calculated using Eqs. 16–18, 35, and 36 (Fig. 11 B). Interestingly, the alanine-based peptides partition into the lumen of the pore according to a simple linear scaling law at zero transmembrane potential, given by lnΠ(L,0) ∼ −0.98 Mw (Fig. 11 B).
Comparison with other polymers
A comparison of the partitioning data for α-helical cationic peptides and neutral PEGs is presented in Fig. 11 B. The alanine-based peptides exhibit at least a 10-fold higher partition coefficient compared with the neutral and highly flexible PEGs, at +100 mV (Fig. 11 B, the second and fourth curves from the top). For PEGs with a molecular mass <4 kDa, the increment in the Gibbs standard free energy with the polymer length is ΔΔG ≅ 1.2 kBT/kDa (28). In this work, we calculated an average value for ΔΔG ≅ 0.79 kBT, which is the Gibbs standard free energy increment that corresponds to an increase in peptide length by one repeat unit. The peptide unit is AAKAA, with a molecular mass of 0.41 kDa. Therefore, the standard free energy for the peptide P7 is 4.0-kBT greater than that corresponding to the peptide P2. If ΔΔG ≅ 0.79 kBT, the Gibbs standard free energy increment of ΔΔG ≅ 2.0 kBT/kDa. This value is greater than the corresponding value for the PEGs, i.e., the partition coefficients for the alanine-based peptides at 0 mV are slightly higher than the partition coefficients for PEGs at 100 mV (Fig. 11 B).
Similar biphasic voltage-dependent behavior of koff has been observed during the single-channel recordings of the αHL pore in the presence of micromolar concentration of cyclic peptides (46). By contrast, the dwell times of cyclic peptides were quite long, certainly much longer than one would expect for a weakly interacting polymer (e.g., a PEG) with a protein pore (28).
Since the αHL pore maintains an open state for long periods even in extreme conditions (e.g., pH, salt, temperature, etc.) (55), it should be possible to examine the interaction between unfolded peptides and the lumen of the αHL pore. In the present work, we cannot say whether the peptides undergo conformational transitions when they enter the lumen of the αHL pore, but the uniform current blockades do suggest that single conformations are adopted within the pore. Chemical denaturants or temperature ramps could be used to determine the associated enthalpy and entropy changes. A fundamental issue that will be addressed in future experiments is whether the peptides bind to the αHL pore in folded, partially folded, or unfolded conformations. Of course, more computation and theory is required to determine the limits of existing electrical recording instrumentation for probing subtle conformational changes of the translocating peptide. The single-channel current resolution (signal/noise ratio) is important in addressing this issue. First, the rate constant for folding-unfolding transitions might have values in the submicrosecond range (56), which is too fast for the single-channel recording capability. Second, some conformational changes of the confined polypeptide chain might be electrically silent, or simply not detectable, as previously noticed in experiments with single PEGs (21) and elastinlike peptides (Y. Jung, L. Movileanu, and H. Bayley, unpublished) anchored within the large vestibule of the αHL pore. Furthermore, the relationship between confinement and stability of the folded state of the peptide is not simple, because water structure may change under nanometer-scale confinement (57), thus altering the interactions stabilizing the native state.
In this work, we examined the exchange between cationic α-helical alanine-based peptides between the bulk aqueous phase and the transmembrane β-barrel of the αHL protein pore, at the single-molecule level. The peptides, which include bulky lysine side chains, bind more strongly to the pore (formation constant Kf ∼ tens of M−1) than the highly flexible PEGs (Kf ∼ M−1). We think that the binding is enhanced at increased transmembrane potentials, because ΔG(V) = −ζ(L)δ(L)FV dominates with the peptides. We also used the Woodhull-Eyring formalism to rationalize the values measured for the association and dissociation rate constants, kon and koff, and to separate the values of koff into individual rate constants for entry and exit through each of the openings of the protein pore. Therefore, we were able to design a semiquantitative model for the peptide permeation through a β-barrel pore.
Comparison with other peptide translocation systems
Little has been accomplished to clarify the energetic balance that must be overcome for protein translocation through a β-barrel pore in a membrane. The experiments presented in this article have relevance for more complex biological processes such as the translocation of cationic amphiphilic polypeptides across TOM channels located in mitochondrial outer and inner membranes (3,7) and the interaction of transit peptides with the chloroplast protein import channel TOC75 (5). For example, the protein translocases of mitochondrial and chloroplast membranes appear to be β-barrel-type channels (6). In addition, the targeting region of a translocating protein, which is located at the amino-terminus, folds as a cationic amphiphilic α-helix (58,59). In our molecular model, the lysine side chains in the peptide chain (average diameter is 19 Å) and the side chains on the β-barrel wall (average internal diameter is 20 Å) seem to be in intimate contact. Such interactions may occur frequently in nature, as the N-terminus α-helical region of the precursor proteins is rich in positively charged side chains (lysine and arginine residues) (58,59), and the diameter of the translocases is ∼20 Å (3,5,7).
The αHL pore may represent a suitable model to examine polypeptide translocation through a β-barrel pore. The protein translocation channels in mitochondrial and chloroplast membranes are β-barrels that exhibit a moderate cation selectivity (PK/PCl ∼ 5 and ∼7.7 for TOM20 and TOM40, respectively) (3,7), or a stronger cation selectivity (e.g., PK/PCl ∼ 14.3 and 16.0 for TOC75 in outer chloroplast membrane and TIM in inner mitochondrial membrane, respectively) (4,60). By contrast, the αHL protein is a slightly anion selective channel with PK/PCl ∼ 0.65 (61). However, previous mutagenesis work with the αHL protein demonstrated that several additional charges, that change the ionic selectivity of the pore, can be tolerated throughout the β-barrel part without significant alteration in channel activity and stability (62,63). We suggest that the αHL protein may be employed as a robust and versatile β-barrel protein pore for examining peptide translocation in the absence of ATP-driven cellular factors, but with tunable driving forces (e.g., electrochemical, pH gradients), binding interactions between the polypeptide and the lumen (e.g., designed acidic binding sites), unfolding triggers (temperature, urea, guanidinium chloride), and geometric and steric constraints (e.g., a modifiable constricted region).
Acknowledgments
Stimulating discussions with Professors Murugappan Muthukumar (University of Massachusetts at Amherst) and Stephen Cheley (Texas A&M University) are greatly acknowledged. The authors thank Sean Conlan for his advice regarding INSIGHT II software.
This work was supported by grants from the United States Department of Energy, the National Institutes of Health, the Office of Naval Research (MURI-1999), and the Texas Advanced Technology Program. H.B. is the holder of a Royal Society-Wolfson Research Merit Award. L.M. thanks Syracuse University for start-up funds.
APPENDIX: SYMBOLS AND ABBREVIATIONS
| αHL | α-Hemolysin |
| β-PFT | β-Barrel pore-forming toxins |
| CD | Circular dichroism |
| [pept] | Peptide concentration in bulk solution |
| dsDNA | Double-stranded DNA |
| δ | Distance from the binding site, as measured from the trans side of the bilayer |
| δc | Distance from the transition state for dissociation to the cis exit, as measured from the trans side of the bilayer |
| δt | Distance from the transition state for dissociation to the trans exit, as measured from the trans side of the bilayer |
 |
Transition state free energy that corresponds to kon−1 |
 |
Transition state free energy that corresponds to 
|
 |
Transition state free energy that corresponds to 
|
| ΔΔG(m+1) | Increment in activation free energy due to increase of the peptide length from m to m+1 repeat units |
| f0 | Event frequency that corresponds to peak 0 (minor peak) |
| f1 | Event frequency that corresponds to peak 1 (major peak) |
| ff | Eyring frequency factor |
 |
Exit frequency to the trans side of the bilayer |
 |
Exit frequency to the cis side of the bilayer |
| fH | Fractional helicity of the peptide |
| F | Faraday constant |
| h | Planck's constant |
| κ | Transmission coefficient |
| kB | Boltzmann's constant |
| kon−1 | Association rate constant |
 |
Dissociation rate constant through the trans entrance |
 |
Dissociation rate constant through the cis entrance |
| Kf | Equilibrium association constant |
| l | Path length |
| L | Peptide length |
| LLR | Log likelihood ratio test |
| m | Number of repeat units in the polypeptide chain |
| m° | Measured ellipticity |
| Mw | Peptide molecular mass |
| n | Number of amino acids in the polypeptide chain |
 |
Relative exit frequency through the cis side of the bilayer |
 |
Relative exit frequency through the trans side of the bilayer |
| NAV | Avogadro's number |
| OmpF | Outer membrane protein F |
 |
Probability that the peptides dissociate through the trans side of the bilayer |
 |
Probability that the peptides dissociate through the cis side of the bilayer |
| PEG | Polyethylene glycol |
| [pept]* | Effective molar concentration of a single peptide inside the β-barrel |
| Π | Partition coefficient |
| R | Gas constant |
| ssDNA | Single-stranded DNA |
| SDS-PAGE | Sodium dodecyl sulphate polyacrylamide gel electrophoresis |
| [θ]222 | Mean molar residue ellipticity at 222 nm |
| [θ]H | Mean molar residue ellipticity for the complete helix |
| [θ]C | Mean molar residue ellipticity for the complete coil |
| T | Absolute temperature |
| Tr | Risetime of the Bessel filter |
| TIM | Preprotein translocase of the inner mitochondrial membrane |
| TOM | Preprotein translocase of the outer mitochondrial membrane |
| TOC | Preprotein translocase of the outer chloroplast membrane |
| τ | Dwell time |
| τon | Inter-event interval (unoccupied state) |
| τoff | Event duration (of occupied state) |
| V | Transmembrane potential |
| Vbarrel | Internal volume of the β-barrel |
| ζ | Effective charge of the peptide in the pore |
References
- 1.Wirth, A., M. Jung, C. Bies, M. Frien, J. Tyedmers, R. Zimmermann, and R. Wagner. 2003. The Sec61p complex is a dynamic precursor activated channel. Mol. Cell. 12:261–268. [DOI] [PubMed] [Google Scholar]
- 2.Hessa, T., H. Kim, K. Bihlmaier, C. Lundin, J. Boekel, H. Andersson, I. Nilsson, S. H. White, and G. von Heijne. 2005. Recognition of transmembrane helices by the endoplasmic reticulum translocon. Nature. 433:377–381. [DOI] [PubMed] [Google Scholar]
- 3.Muro, C., S. M. Grigoriev, D. Pietkiewicz, K. W. Kinnally, and M. L. Campo. 2003. Comparison of the TIM and TOM channel activities of the mitochondrial protein import complexes. Biophys. J. 84:2981–2989. [DOI] [PMC free article] [PubMed] [Google Scholar]
- 4.Rehling, P., K. Model, K. Brandner, P. Kovermann, A. Sickmann, H. E. Meyer, W. Kuhlbrandt, R. Wagner, K. N. Truscott, and N. Pfanner. 2003. Protein insertion into the mitochondrial inner membrane by a twin-pore translocase. Science. 299:1747–1751. [DOI] [PubMed] [Google Scholar]
- 5.Hinnah, S. C., R. Wagner, N. Sveshnikova, R. Harrer, and J. Soll. 2002. The chloroplast protein import channel TOC75: pore properties and interaction with transit peptides. Biophys. J. 83:899–911. [DOI] [PMC free article] [PubMed] [Google Scholar]
- 6.Gabriel, K., S. K. Buchanan, and T. Lithgow. 2001. The alpha and the beta: protein translocation across mitochondrial and plastid outer membranes. Trends Biochem. Sci. 26:36–40. [DOI] [PubMed] [Google Scholar]
- 7.Hill, K., K. Model, M. T. Ryan, K. Dietmeier, F. Martin, R. Wagner, and N. Pfanner. 1998. TOM40 forms the hydrophilic channel of the mitochondrial import pore for preproteins. Nature. 395:516–521. [DOI] [PubMed] [Google Scholar]
- 8.Hinnah, S. C., K. Hill, R. Wagner, T. Schlicher, and J. Soll. 1997. Reconstitution of a chloroplast protein import channel. EMBO J. 16:7351–7360. [DOI] [PMC free article] [PubMed] [Google Scholar]
- 9.Krantz, B. A., A. D. Trivedi, K. Cunningham, K. A. Christensen, and R. J. Collier. 2004. Acid-induced unfolding of the amino-terminal domains of the lethal and edema factors of anthrax toxin. J. Mol. Biol. 344:739–756. [DOI] [PubMed] [Google Scholar]
- 10.Zhang, S., A. Finkelstein, and R. J. Collier. 2004. Evidence that translocation of anthrax toxin's lethal factor is initiated by entry of its N-terminus into the protective antigen channel. Proc. Natl. Acad. Sci. USA. 101:16756–16761. [DOI] [PMC free article] [PubMed] [Google Scholar]
- 11.Zhang, S., E. Udho, Z. Wu, R. J. Collier, and A. Finkelstein. 2004. Protein translocation through anthrax toxin channels formed in planar lipid bilayers. Biophys. J. 87:3842–3849. [DOI] [PMC free article] [PubMed] [Google Scholar]
- 12.Oomen, C. J., P. Van Ulsen, P. Van Gelder, M. Feijen, J. Tommassen, and P. Gros. 2004. Structure of the translocator domain of a bacterial autotransporter. EMBO J. 23:1257–1266. [DOI] [PMC free article] [PubMed] [Google Scholar]
- 13.Bayley, H. 1995. Pore-forming proteins with built-in triggers and switches. Bioorg. Chem. 23:340–354. [Google Scholar]
- 14.Gouaux, J. E., O. Braha, M. R. Hobaugh, L. Z. Song, S. Cheley, C. Shustak, and H. Bayley. 1994. Subunit stoichiometry of staphylococcal α-hemolysin in crystals and on membranes—a heptameric transmembrane pore. Proc. Natl. Acad. Sci. USA. 91:12828–12831. [DOI] [PMC free article] [PubMed] [Google Scholar]
- 15.Montoya, M., and E. Gouaux. 2003. Beta-barrel membrane protein folding and structure viewed through the lens of α-hemolysin. Biochim. Biophys. Acta. 1609:19–27. [DOI] [PubMed] [Google Scholar]
- 16.Menestrina, G., M. Dalla Serra, and G. Prevost. 2001. Mode of action of β-barrel pore-forming toxins of the staphylococcal α-hemolysin family. Toxicon. 39:1661–1672. [DOI] [PubMed] [Google Scholar]
- 17.Song, L. Z., M. R. Hobaugh, C. Shustak, S. Cheley, H. Bayley, and J. E. Gouaux. 1996. Structure of staphylococcal α-hemolysin, a heptameric transmembrane pore. Science. 274:1859–1866. [DOI] [PubMed] [Google Scholar]
- 18.Bayley, H., and P. S. Cremer. 2001. Stochastic sensors inspired by biology. Nature. 413:226–230. [DOI] [PubMed] [Google Scholar]
- 19.Bayley, H., and L. Jayasinghe. 2004. Functional engineered channels and pores. Mol. Membr. Biol. 21:209–220. [DOI] [PubMed] [Google Scholar]
- 20.Howorka, S., L. Movileanu, X. F. Lu, M. Magnon, S. Cheley, O. Braha, and H. Bayley. 2000. A protein pore with a single polymer chain tethered within the lumen. J. Am. Chem. Soc. 122:2411–2416. [Google Scholar]
- 21.Movileanu, L., S. Howorka, O. Braha, and H. Bayley. 2000. Detecting protein analytes that modulate transmembrane movement of a polymer chain within a single protein pore. Nat. Biotechnol. 18:1091–1095. [DOI] [PubMed] [Google Scholar]
- 22.Howorka, S., L. Movileanu, O. Braha, and H. Bayley. 2001. Kinetics of duplex formation for individual DNA strands within a single protein nanopore. Proc. Natl. Acad. Sci. USA. 98:12996–13001. [DOI] [PMC free article] [PubMed] [Google Scholar]
- 23.Bayley, H., O. Braha, S. Cheley, and L. Gu. 2004. Engineered nanopores. In NanoBiotechnology. C. M. Niemeyer and C. A. Mirkin, editors. Wiley-VCH, Weinheim, Germany. 93–112.
- 24.Howorka, S., S. Cheley, and H. Bayley. 2001. Sequence-specific detection of individual DNA strands using engineered nanopores. Nat. Biotechnol. 19:636–639. [DOI] [PubMed] [Google Scholar]
- 25.Xie, H., O. Braha, L. Q. Gu, S. Cheley, and H. Bayley. 2005. Single-molecule observation of the catalytic subunit of cAMP-dependent protein kinase binding to an inhibitor peptide. Chem. Biol. 12:109–120. [DOI] [PubMed] [Google Scholar]
- 26.De Gennes, P.-G. 1979. Scaling Concepts in Polymer Physics. Cornell University, Ithaca and London.
- 27.Movileanu, L., and H. Bayley. 2001. Partitioning of a polymer into a nanoscopic protein pore obeys a simple scaling law. Proc. Natl. Acad. Sci. USA. 98:10137–10141. [DOI] [PMC free article] [PubMed] [Google Scholar]
- 28.Movileanu, L., S. Cheley, and H. Bayley. 2003. Partitioning of individual flexible polymers into a nanoscopic protein pore. Biophys. J. 85:897–910. [DOI] [PMC free article] [PubMed] [Google Scholar]
- 29.Kirmizialtin, S., V. Ganesan, and D. E. Makarov. 2004. Translocation of a β-hairpin-forming peptide through a cylindrical tunnel. J. Chem. Phys. 121:10268–10277. [DOI] [PubMed] [Google Scholar]
- 30.Muthukumar, M. 2003. Polymer escape through a nanopore. J. Chem. Phys. 118:5174–5184. [Google Scholar]
- 31.Bezrukov, S. M., I. Vodyanoy, R. A. Brutyan, and J. J. Kasianowicz. 1996. Dynamics and free energy of polymers partitioning into a nanoscale pore. Macromolecules. 29:8517–8522. [Google Scholar]
- 32.Merzlyak, P. G., L. N. Yuldasheva, C. G. Rodrigues, C. M. M. Carneiro, O. V. Krasilnikov, and S. M. Bezrukov. 1999. Polymeric nonelectrolytes to probe pore geometry: application to the α-toxin transmembrane channel. Biophys. J. 77:3023–3033. [DOI] [PMC free article] [PubMed] [Google Scholar]
- 33.Krasilnikov, O. V., and S. M. Bezrukov. 2004. Polymer partitioning from nonideal solutions into protein voids. Macromolecules. 37:2650–2657. [Google Scholar]
- 34.Lubensky, D. K., and D. R. Nelson. 1999. Driven polymer translocation through a narrow pore. Biophys. J. 77:1824–1838. [DOI] [PMC free article] [PubMed] [Google Scholar]
- 35.Schagger, H., and G. Vonjagow. 1987. Tricine sodium dodecyl-sulfate polyacrylamide-gel electrophoresis for the separation of proteins in the range from 1-KDa to 100-KDa. Anal. Biochem. 166:368–379. [DOI] [PubMed] [Google Scholar]
- 36.Pace, C. N., F. Vajdos, L. Fee, G. Grimsley, and T. Gray. 1995. How to measure and predict the molar absorption-coefficient of a protein. Protein Sci. 4:2411–2423. [DOI] [PMC free article] [PubMed] [Google Scholar]
- 37.Scholtz, J. M., Q. Hong, E. J. York, J. M. Stewart, and R. L. Baldwin. 1991. Parameters of helix-coil transition theory for alanine-based peptides of varying chain lengths in water. Biopolymers. 31:1463–1470. [DOI] [PubMed] [Google Scholar]
- 38.Braha, O., B. Walker, S. Cheley, J. J. Kasianowicz, L. Z. Song, J. E. Gouaux, and H. Bayley. 1997. Designed protein pores as components for biosensors. Chem. Biol. 4:497–505. [DOI] [PubMed] [Google Scholar]
- 39.Cheley, S., G. Braha, X. F. Lu, S. Conlan, and H. Bayley. 1999. A functional protein pore with a “retro” transmembrane domain. Protein Sci. 8:1257–1267. [DOI] [PMC free article] [PubMed] [Google Scholar]
- 40.Christopher, J. A. 1998. SPOCK: the structural properties observation and calculation kit. Center for Macromolecular Design, Texas A&M University, College Station, TX.
- 41.Montal, M., and P. Mueller. 1972. Formation of bimolecular membranes from lipid monolayers and a study of their electrical properties. Proc. Natl. Acad. Sci. USA. 69:3561–3566. [DOI] [PMC free article] [PubMed] [Google Scholar]
- 42.Colquhoun, D., and F. J. Sigworth. 1995. Fitting and statistical analysis of single-channel records. In Single-Channel Recording. B.N.E. Sackmann, editor. Plenum Press, New York. 483–587
- 43.McManus, O. B., and K. L. Magleby. 1988. Kinetic states and modes of single large-conductance calcium-activated potassium channels in cultured rat skeletal-muscle. J. Physiol. 402:79–120. [DOI] [PMC free article] [PubMed] [Google Scholar]
- 44.Rohl, C. A., and R. L. Baldwin. 1998. Deciphering Rules of Helix Stability in Peptides. Academic Press, San Diego, CA. [DOI] [PubMed]
- 45.Richards, F. M. 1977. Areas, volumes, packing and protein structure. Annu. Rev. Biophys. Bioeng. 6:151–176. [DOI] [PubMed] [Google Scholar]
- 46.Sanchez-Quesada, J., M. R. Ghadiri, H. Bayley, and O. Braha. 2000. Cyclic peptides as molecular adapters for a pore-forming protein. J. Am. Chem. Soc. 122:11757–11766. [Google Scholar]
- 47.Akeson, M., D. Branton, J. J. Kasianowicz, E. Brandin, and D. W. Deamer. 1999. Microsecond timescale discrimination among polycytidylic acid, polyadenylic acid, and polyuridylic acid as homopolymers or as segments within single RNA molecules. Biophys. J. 77:3227–3233. [DOI] [PMC free article] [PubMed] [Google Scholar]
- 48.Kasianowicz, J. J., E. Brandin, D. Branton, and D. W. Deamer. 1996. Characterization of individual polynucleotide molecules using a membrane channel. Proc. Natl. Acad. Sci. USA. 93:13770–13773. [DOI] [PMC free article] [PubMed] [Google Scholar]
- 49.Hille, B. 2001. Ion Channels of Excitable Membranes. Sinauer Associates, Sunderland, MA.
- 50.Woodhull, A. M. 1973. Ionic blockage of sodium channels in nerve. J. Gen. Physiol. 61:687–708. [DOI] [PMC free article] [PubMed] [Google Scholar]
- 51.Cheley, S., L. Q. Gu, and H. Bayley. 2002. Stochastic sensing of nanomolar inositol 1,4,5-trisphosphate with an engineered pore. Chem. Biol. 9:829–838. [DOI] [PubMed] [Google Scholar]
- 52.Andersen, O. S. 1999. Graphic representation of the results of kinetic analyses. J. Gen. Physiol. 114:589–590. [DOI] [PMC free article] [PubMed] [Google Scholar]
- 53.Jordan, P. C. 1999. Ion permeation and chemical kinetics. J. Gen. Physiol. 114:601–603. [DOI] [PMC free article] [PubMed] [Google Scholar]
- 54.Blaustein, R. O., E. J. Lea, and A. Finkelstein. 1990. Voltage-dependent block of anthrax toxin channels in planar phospholipid bilayer membranes by symmetric tetraalkylammonium ions. Single-channel analysis. J. Gen. Physiol. 96:921–942. [DOI] [PMC free article] [PubMed] [Google Scholar]
- 55.Kang, X. F., L. Q. Gu, S. Cheley, and H. Bayley. 2005. Single protein pores containing molecular adapters at high temperatures. Angew. Chem. Int. Ed. Engl. 44:1495–1499. [DOI] [PubMed] [Google Scholar]
- 56.Lapidus, L. J., W. A. Eaton, and J. Hofrichter. 2002. Measuring dynamic flexibility of the coil state of a helix-forming peptide. J. Mol. Biol. 319:19–25. [DOI] [PubMed] [Google Scholar]
- 57.Raviv, U., P. Laurat, and J. Klein. 2001. Fluidity of water confined to subnanometre films. Nature. 413:51–54. [DOI] [PubMed] [Google Scholar]
- 58.Schatz, G. 1993. The protein import machinery of mitochondria. Protein Sci. 2:141–146. [DOI] [PMC free article] [PubMed] [Google Scholar]
- 59.Schatz, G., and B. Dobberstein. 1996. Common principles of protein translocation across membranes. Science. 271:1519–1526. [DOI] [PubMed] [Google Scholar]
- 60.Truscott, K. N., P. Kovermann, A. Geissler, A. Merlin, M. Meijer, A. J. M. Driessen, J. Rassow, N. Pfanner, and R. Wagner. 2001. A presequence- and voltage-sensitive channel of the mitochondrial preprotein translocase formed by Tim23. Nat. Struct. Biol. 8:1074–1082. [DOI] [PubMed] [Google Scholar]
- 61.Menestrina, G. 1986. Ionic channels formed by Staphylococcus aureus α-toxin voltage-dependent inhibition by divalent and trivalent cations. J. Membr. Biol. 90:177–190. [DOI] [PubMed] [Google Scholar]
- 62.Gu, L. Q., S. Cheley, and H. Bayley. 2001. Prolonged residence time of a noncovalent molecular adapter, β-cyclodextrin, within the lumen of mutant α-hemolysin pores. J. Gen. Physiol. 118:481–493. [DOI] [PMC free article] [PubMed] [Google Scholar]
- 63.Gu, L. Q., M. Dalla Serra, J. B. Vincent, G. Vigh, S. Cheley, O. Braha, and H. Bayley. 2000. Reversal of charge selectivity in transmembrane protein pores by using noncovalent molecular adapters. Proc. Natl. Acad. Sci. USA. 97:3959–3964. [DOI] [PMC free article] [PubMed] [Google Scholar]