

Abstract
To date, most biochemical approaches to unravel protein function have focused on purified proteins in vitro. Whereas they analyze enzyme performance under assay conditions, they do not necessarily tell us what is relevant within a living cell. Ideally, cellular functions should be examined in situ. In particular, association/dissociation reactions are ubiquitous, but so far there is no standard technique permitting online analysis of these processes in vivo. Featuring single-molecule sensitivity combined with intrinsic averaging, fluorescence correlation spectroscopy is a minimally invasive technique ideally suited to monitor proteins. Moreover, endogenous fluorescence-based assays can be established by genetically encoding fusions of autofluorescent proteins and cellular proteins, thus avoiding the disadvantages of in vitro protein labeling and subsequent delivery to cells. Here, we present an in vivo protease assay as a model system: Green and red autofluorescent proteins were connected by Caspase-3- sensitive and insensitive protein linkers to create double-labeled protease substrates. Then, dual-color fluorescence cross-correlation spectroscopy was employed to study the protease reaction in situ. Allowing assessment of multiple dynamic parameters simultaneously, this method provided internal calibration and improved experimental resolution for quantifying protein stability. This approach, which is easily extended to reversible protein-protein interactions, seems very promising for elucidating intracellular protein functions.
INTRODUCTION
Having finished sequencing the human genome two years ago, scientists have come to realize that this can only be the first step toward actually deciphering the genetic code. To really understand the biological meaning, the structure and function of the encoded proteins need to be known, not to mention their mutual interactions. However, although in vitro studies provide well-defined environmental conditions, they can only give an idea of what might really be relevant in the living organism. Monitoring protein action under truly physiological conditions has emerged as one of the primary goals for protein characterization, and novel technologies have been developed for both in vivo applications and high-throughput screening.
In addition to traditional biochemical techniques, fluorescence applications are becoming increasingly popular. Fluorescence can be detected with outstanding sensitivity, enabling researchers not only to identify individual components of complex biomolecular assemblies, e.g., live cells, but also to follow their dynamics and temporal evolution in real time. Fluctuation-based fluorescence techniques give access to a variety of parameters, including concentration, diffusion coefficient, molecular interactions, and dynamics (1–3). Working in thermodynamic equilibrium, these minimally invasive methods are raising even greater expectations for in vivo studies.
Based on the minute signal fluctuations caused by single fluorescent molecules diffusing through an Escherichia coli-sized laser focus, fluorescence correlation spectroscopy (FCS) has been established as one of the most promising fluorescence-based approaches. Numerous in vitro and in vivo applications have benefited from its versatility and high temporal and spatial resolution, even allowing the resolution of particle dynamics within individual cellular compartments (4–9). Moreover, FCS analysis provides intrinsic calibration parameters like particle concentrations and dynamic particle properties that make experimental artifacts less likely to remain unnoticed. With typical chromophore concentrations in the low nanomolar range and below, this technique is well suited to collect quantitative data under physiological conditions and monitor dynamic equilibria in vivo (10). Thus, FCS may help to elucidate subtle regulatory processes or even unravel so far overlooked background activities.
Additionally, this technique allows for an efficient online comparison of two distinct fluorescence signals at extremely high temporal resolution (cf. Fig. 1). Dual-color fluorescence cross-correlation spectroscopy (dcFCCS) determines the degree of concomitant movement of spectrally distinct chromophores (Fig. 1 A) and thus provides a highly precise measure for the amount of double-labeled molecules. As illustrated in Fig. 1, both reversible interactions of fluorescently labeled binding partners and irreversible degradations of bichromophoric particles can be monitored in this way (Fig. 1, B–D). In principle, these reactions can also be monitored by FRET (fluorescence resonance energy transfer). However, this method is limited to interchromophore distances of 20–80 Å, depending on the actual chromophore pair (11), and in vivo quantification especially is often difficult. By exclusively focusing on dynamic particle behavior dual-color fluorescence cross-correlation spectroscopy evades these fundamental limitations.
FIGURE 1.

Monitoring dissociation/association reactions by dcFCCS. The basic concept of dual-color fluorescence cross-correlation analysis (dcFCCS) is outlined. (A) The fluorescence signals from two spectrally distinct chromophores are correlated, i.e., analyzed with respect to (hidden) similarities. Thus, the concomitant movements of different fluorophores through the confocal volume element are revealed, which are only seen for dual-color particles. Both reversible interactions of fluorescently labeled binding partners (B) and irreversible degradations of bichromophoric particles (C) can be monitored by dcFCCS. The amplitude of the resulting cross-correlation function is directly proportional to the number of double-labeled particles (D) and hence decreases during a digest reaction.
Recent progress in the application of FCS to intracellular systems has benefited particularly from autofluorescent proteins like green fluorescent protein (GFP) and DsRed variants and their genetically encoded fusions to cellular proteins (8,12–14). Obviously, expressing fluorescent fusion proteins intracellularly avoids the disadvantages of in vitro protein labeling as well as the hazards of subsequent delivery to cells. One of the first cross-correlation studies in vivo addressed the reversible binding of kinase II (CaMKII) with calmodulin. Although kinase II was expressed intracellularly in fusion with enhanced green fluorescent protein (EGFP), purified calmodulin was labeled with red fluorescent Alexa-633 and added by external uptake (8). Simultaneously an in vitro protease assay was established using exclusively green and red autofluorescent proteins (rsGFP and DsRed) as labels for dcFCCS analysis (7). Thus, combining state-of-the-art dcFCCS with the entirely intracellular expression of fluorescent fusion proteins promises a powerful novel approach for monitoring intracellular association/dissociation reactions.
Here we present an intracellular protease assay exclusively relying on fluorescent proteins to demonstrate the scope of dcFCCS analysis in vivo. The model system presented here is a key reaction in apoptosis, i.e., programmed cell death. Apoptosis is based upon tight regulation of caspases, cellular proteases that can trigger cell death upon activation. Two major signaling pathways converge in activating “effector” caspases, particularly caspase-3 and caspase-7, both sharing the optimal recognition motif DEVD (15). Regarding the intense efforts demonstrated in literature for assaying and analyzing in vivo caspase activities, dcFCCS represents a uniquely sensitive alternative approach (16–20).
For this aim, green (rsGFP or EGFP) and red autofluorescent proteins (mRFP1 or tdimer2(12)) were connected by Caspase-3- sensitive and insensitive protein linkers to create dual-color protease substrates (21,22). After fusion protein expression, dcFCCS was employed for noninvasive online analysis of intracellular protein stability and protease reactions. As a prerequisite for apoptosis assays we initially focused on monitoring intracellular fusion protein persistence at low nanomolar substrate concentrations without inducing apoptosis. Intracellular protein persistence was quantified by determining the percentage of double-labeled particles. Different fusion constructs were compared with respect to their intracellular stability. We present online monitoring of protein persistence and proteolysis inside individual cells within 5–23 h of observation, suggesting also potential interpretations of data from high-resolution single-cell measurements. For the first time, to our knowledge, we analyzed the stability of dual-color fusion proteins at low nanomolar concentrations within living cells. The low number of intracellular reporter molecules successfully increased the detection sensitivity for cellular processes and also mimicked native cellular physiological conditions more closely.
MATERIAL AND METHODS
Autocorrelation analysis
For a detailed introduction to FCS (auto- and cross-correlation) analysis, the interested reader is referred to recent reviews and articles (23–25).
In brief, FCS analyzes the minute signal fluctuations arising from a low number of fluorescent molecules diffusing in and out of a focused laser beam in thermodynamic equilibrium. On a confocal setup, the observable region is restricted to the effective volume Veff of the laser focus, which is typically ∼1 fL. Mathematically, the normalized correlation function of the time-resolved fluorescence fluctuations δF(t), i.e., the deviation of the signal F(t) from the mean value 〈F(t)〉, is given by
 |
(1) |
for two channels, i and j. If only one molecular species is present, i = j and Eq. 1 is thus characterizing the (self-)similarity of the signal after the lag time τ, which yields the autocorrelation curve of the given signal. This curve decays with the characteristic time τ. The shape of the curve and the characteristic decay times reflect the different processes and the corresponding rates giving rise to the fluorescence fluctuations. For the simple case of free chromophores undergoing free Brownian motion in solution, Eq. 2 serves as a good fit-model for autocorrelation curves:
 , ,
|
(2) |
with the particle concentration  Equation 2 describes both the diffusion and the photophysics of the chromophores. This dye-specific on-off blinking may be due to transitions to the triplet state or protonation-deprotonation reactions. The average number of particles in the focal volume, N, corresponds to the inverse autocorrelation amplitude G(0)−1 for τ = 0, τdiff is the diffusion time, τdark is the dark-state relaxation time, and D is the fraction of dark molecules. The radial and axial dimensions of the ellipsoidal Veff, r0 and z0, are determined from calibration measurements.
If a dye simultaneously shows two (or more) distinct photophysical transitions on different timescales, an extra exponential decay term has to be included into G(τ) for each transition.
DsRed, for instance, shows extensive intensity-dependent blinking that has to be fitted with one or two blinking decay terms (26). In analogy to DsRed, blinking decay times obtained for the DsRed mutants mRFP1 and tdimer2(12) range from 60 μs to 240 μs for 35–68% of all detected molecules. For EGFP, blinking can only be observed for high intensities and ranges from 21–30 μs for 10–14% of all detected molecules (27). The actual fit functions used for intracellular measurements of fluorescent proteins are indicated in Table 1.
TABLE 1.
Fit models applied for in vivo dcFCCS
| Number of diffusing components | Number of dark-state decay terms (triplet; blinking) | Combinations applied for fluorophores: |
|---|---|---|
| 1 | — | GFPs |
| 1 | 1 | GFPs, RFPs |
| 1 | 2 | RFPs |
| 2 | 2 | RFPs |
The fit models used to interpret the correlation curves in this study varied in the number of diffusing components and dark-state decay terms. The combinations applied for red and green fluorophores are shown here.
The average molecular brightness η is a direct measure of the signal/noise ratio of the experiment:
 |
(3) |
where N is the average number of particles and 〈F(t)〉 the mean fluorescence intensity.
Frequently, molecules display subpopulations of different mobility, for example, upon binding to a large and slowly moving partner or for unspecific binding to cellular components. Consequently, an additional mobility term describing this slower component must be introduced in Eq. 2. However, the diffusion time τdiff scales with the cubic root of the molecular weight M for globular particles,  Ideally, doubling the molecular weight results, therefore, in a 1.26-fold increase in diffusion time. Considering the limited signal/noise ratio of the curves plotted on a logarithmic timescale, the changes involved are far too subtle to efficiently study protein association or dissociation in vivo.
Cross-correlation analysis
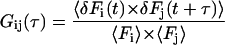
For this aim, dcFCCS has been established as an extremely powerful tool to probe interactions between different molecular species (4). Starting with the analysis of DNA hybridization, the technique was soon extended to monitor real-time enzyme kinetics and was even applied in vivo (4,6,8,9). Two spectrally different dyes are excited within the same detection element using two overlapping laser beams or two-photon excitation and separate detection pathways (4,7,28,29). Equation 1 is thus generalized for two distinct channels, i ≠ j. dcFCCS highlights events synchronized in both channels, whereas phenomena characteristic to only one channel are eliminated. This means also that processes reflecting the photophysics of only one chromophore species do not contribute to the cross-correlation curve.
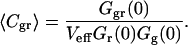
There is, however, one additional advantage of this technique in comparison to the autocorrelation mode: In the absence of reaction-induced quenching or particle exchange in the sample, the amplitude of the cross-correlation function for green (g) and red (r) fluorophores, Ggr(0), is directly proportional to the concentration of double-labeled particles 〈Cgr〉. Knowing the amplitudes of the red and green autocorrelation curves Gr(0) and Gg(0)—and thus the total concentrations of both species—the concentration 〈Cgr〉 can be determined from Eq. 4 as follows:
 |
(4) |
To facilitate comparisons of cross-correlation curves recorded in different cells, for different constructs, and at different times, absolute concentrations of dual-color molecules were normalized by the concentration of the less abundant chromophore species. The ratio of the corresponding cross-correlation amplitudes was termed “relative cross correlation”, CCrel. Assuming (without loss of generality) more fluorophores of species i are present and using Eqs. 2 and 4, this reads
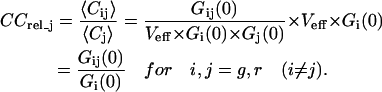 |
(5) |
Giving directly the fraction of double-labeled particles relative to the less abundant species j, the parameter CCrel_j is ideally suited to assess the intracellular stability of a specific fusion protein. In practice, CCrel_j is calculated simply by normalizing the cross-correlation amplitude by the lower of both autocorrelation amplitudes, Gi(0) (cf. Eq. 5).
Dual-color cross-correlation setup with two lasers
The experimental setup is schematically depicted in Fig. 2. The individual parts are numbered, and will be referred to in the text by their numbers (1–11).
FIGURE 2.

Dual-color fluorescence cross-correlation setup. To excite spectrally distinct fluorophores simultaneously, two laser lines (488 nm and 543 nm) were superimposed with a dichroic mirror (2) and directed with mirrors (1, 3, and 4) onto the back aperture of the objective (5) via a dual-band dichroic mirror (6, D488/543). The objective (5) focused the excitation light into the object plane (6) and recollected fluorescence emission of the red and green dyes from the effective volume element Veff. After traversing the dichroic mirror (6), the fluorescence is split into a red and green channel by the dichroic D565 (10) and cleared from residual excitation light by the respective detection filters (11a (HQ515/30) and 11b (HQ 625/50)). The light was imaged onto the entrance aperture of two optical fibers that were adjustable in three dimensions and coupled to Avalanche photodiodes. The detected fluorescence fluctuations in both detection channels were auto- and cross correlated in the universal serial bus-based hardware correlator connected to a personal computer.
For simultaneous fluorescence excitation of green and red autofluorescent proteins two laser lines were superimposed using an LP535 dichroic mirror (Fig. 2, 2) (AHF, Tübingen, Germany). For the blue-green excitation, the 488-nm line of an argon ion (Ar+) laser (Lasos, Jena, Germany) running in multiline mode was used in combination with a special 488-nm cleanup filter (AHF). The 543-nm line was provided by a helium neon (HeNe) laser (JDS Uniphase, San Jose, CA). Both beams were coupled into an inverted microscope (IX 71, Olympus, Hamburg, Germany) via the dual-band dichroic mirror D488/543 (AHF; Fig. 2, 6) positioned within the microscope filter wheel and directed onto the objective (Fig. 2, 5) (UplanApo 60×1.2W (Olympus)). This focused the excitation light into the object plane (10). The back aperture was underfilled to avoid strong deviations from a Gaussian beam profile (30). Calibration measurements showed that the resulting light cone has a beam waist of r0 ≈ 350 nm.
The fluorescence light originating from the illuminated region is collected by the objective and traverses the dichroic mirror (AHF; Fig. 2, 6). A dichroic mirror (D565, AHF; Fig. 2, 10) splits the emitted fluorescence into green and red light, which passes the emission filters (HQ515/30 and HQ 625/50, AHF; Fig. 2, 11a and 11b). Photons were imaged onto optical fibers (Fig. 2, 9) with a diameter of 100 μm that were connected to single-photon-sensitive detectors, avalanche photodiodes (SPCM-CD 3017, PerkinElmer Optoelectronics, Shelton, CT). The entrance aperture of the optical fibers acts as a pinhole (i.e., field aperture), guaranteeing axial resolution for the confocal setup. The signal of the detectors was processed by a universal serial bus-based hardware correlator (Flex01/3ch, Correlator.com, Bridgewater, NJ).
Laser intensities were adjusted by neutral density filters positioned in front of LP535 (488 nm) and the microscope (488 nm and 543 nm) and the excitation intensity was measured in front of the objective. Standard filter sets for EGFP and DsRed (AHF) were applied for fluorescence microscopy and cell imaging with a CCD camera mounted on top of the microscope (Apogee Instruments, Auburn, CA).
The experimental setup was readjusted and recalibrated before each measurement session (4). The laser foci were positioned relative to cross-hairs within the ocular that were projected into the object plane and also served to position the focal volume within cells. Typically, ratios of axial to lateral dimensions of Veff, z0/r0, between 5 and 6 were obtained from calibration measurements and kept fixed for further analysis. Hence, the size of the oblong detection volumes was calculated using both the measured diffusion times and the known diffusion coefficients of the synthetic dyes TMR and Alexa 488 ( ). The results were always ∼1.3–1.4 fL. Due to chromatic effects, the red detection volume was larger than the green detection volume by a factor of 1.1–1.4, which leads to an underestimation of relative cross correlation by ∼0.7–0.9 (31). Since only relative effects were investigated in this study, the actual maximum value was not considered to be crucial, provided it was always the same. Therefore, this underestimation was not considered further.
Two different reference samples were employed to assess system performance both after readjustment and during long-term measurements: An ssDNA-oligomer (30-mer) labeled with the synthetic fluorophores Alexa 488 and Cy3 (IBA, Göttingen, Germany) at its 5′ and 3′ ends, and a purified GFP-24aa linker-DsRed fusion protein were analyzed as dual-color reference controls for dcFCCS (7). For the fusion protein, relative cross-correlation values CCrel ranged between 65% and 75%, whereas the chemically labeled oligomer only achieved 45–55%. The bandwidth of these values reflects both setup performance and probe stability. The weakly fluorescent detergent Triton-X 100 (0.05% w/v) was added to protein samples to reduce aggregation and surface adhesion. Aliquots of 20–30 μl of the “ready-to-measure” dilutions were stored at −20°C.
Cell culture
ER293 cells were obtained from Stratagene (Heidelberg, Germany) and grown in an 8.5% CO2-humidified atmosphere at 37°C in 88% (v/v) phenol-red free Dulbecco's modified Eagle's medium (GibcoBRL, Karlsruhe, Germany) containing 10% (v/v) Mycoplex Fetal Calf Serum (PAA Laboratories GmbH, Cölbe, Germany), 1 mM glutamine, 1% v/v 100× Penstrep (GibcoBRL, Karlsruhe, Germany) and 0.3 mg/ml G418 (GibcoBRL).
Cells to be used for FCS analysis were seeded in Nunc coverglass chambers (Nunc, Wiesbaden, Germany) with four separate chambers on one glass plate or Ø35 mm MatTek chambers with glass bottoms (MatTek, Ashland, MA).
Generation of fusion proteins
The proteins presented in this work are part of a family of consecutively evolved fusion proteins. Dual-color fusion proteins consisting of GFP and DsRed mutants and a protein linker were designed and generated in a modular approach as described previously (7). For more details, please refer to Table 6 (Supplementary Material). The names of fusion proteins “f” indicate both their proteolytic sensitivity and the length of the protein linker (f[Casp-3 or inert],[short or long]). Table 2 lists the composition of the different fusion proteins along with a characterization of the protein linkers.
TABLE 2.
Composition of fusion proteins
| Fusion name | Composition (fluorophore-linker-fluorophore) | Linker length (aa) | Protease sensitivity | Linker type (aa motifs) |
|---|---|---|---|---|
| fCasp3,s | EGFP-linker23-mRFP1 | 23 | Casp-3 | S-G |
| fCasp3,l | RsGFP-linker48-tdimer2(12) | 48 | Casp-3 | A-G/S-G |
| finert,s | EGFP-inert23-tdimer2(12) | 23 | inert | A-G/S-G |
The names of fusion constructs indicate the design of their protein linkers according to proteolytic sensitivity (inert; Casp-3) and linker length (short, 23 aa; long, 48 aa).
Fluorophore sequences were amplified from pQBI63 (encoding rsGFP; Q-BIOgene, San Diego, CA), pEGFP-N1 (encoding EGFP; Clontech, Palo Alto, CA), pPRSETB-tdimer2(12) and pPRSETB-mRFP1 (encoding tdimer2(12) and mRFP1, respectively) (22). The fusion constructs were cloned into the cellular expression vector pEGSH (Stratagene, Heidelberg; Germany) and the resulting plasmids applied for transient protein expression.
Transient protein expression
Intracellular protein expression was performed as transient expression. Plasmids for intracellular expression of fusion proteins and singular red fluorescent proteins (RFPs) were derived from pEGSH, the expression plasmid of the Complete Control Inducible Mammalian Expression System (Stratagene, Heidelberg; Germany). Singular EGFP was expressed from pEGFP-N1 (Clontech, Palo Alto).
Cells were transfected with the Effectene transfection reagent (Qiagen, Hilden; Germany). The basic protocol was scaled depending on the surface area of the culture dishes used: For transfection within a Ø35-mm dish, 0.5 μg of plasmid DNA were diluted in 100 μl of buffer EC. Subsequently, 4 μl of the DNA binding reagent “enhancer” were added, incubating the mixture for 4 min after briefly vortexing the sample. Having added 5 μl Effectene reagent, the mixture was vortexed for 10 s and then incubated for 10 min at room temperature. Finally, the reaction was stopped with 500 μl growth medium. The resulting solution (609 μl) was pipetted in single droplets onto cells already covered by 1.6 ml of fresh growth medium. The transfection was allowed to proceed for 3–5 h before the transfection reagent was replaced by growth medium. Protein expression from pEGSH-constructs was induced overnight (10–16 h) applying PonA (Stratagen, Heidelberg, Germany) at final concentrations of 0.5–5 μg/ml. Caspase inhibitor z-VAD-fmk (CalBiochem, La Jolla, CA) was added to the transfection reaction at a final concentration of 60 μM (18) to prevent the induction of cellular apoptosis by these transfection procedures.
For dcFCCS analysis, the growth medium was removed by aspiration and replaced with HPPS buffer (HEPES buffered physiological saline solution; KCl 5.4 mM, MgSO4 0.8 mM, CaCl2 1.8 mM, HEPES 20 mM, glucose 10 mM, NaCl 116 mM, filtered sterile (32)).
Delivery of proteins to cells
Purified proteins (cf. Kohl et al. (7)) were exogenously delivered to ER293 cells by applying the influx pinocytic cell-loading reagent (Molecular Probes; Leiden, The Netherlands) according to the instructions provided by the manufacturer. Cultured cells were exposed to Influx hypertonic loading medium containing the material to be loaded at 10–15 μM concentration for 12–14 min. The solution was imported into the cells via pinocytic vesicles. When the cells were placed in hypotonic lysis medium, the pinocytic vesicles burst, releasing their contents into the cytosol.
RESULTS
Composition of fusion constructs
Only three representative constructs out of a whole family of generated protein fusions are presented in this study. As shown in Table 2, these fusion proteins feature different fluorophores and either Casp-3- sensitive or insensitive linkers of different length. The green autofluorescent proteins rsGFP or EGFP were combined with the red DsRed mutants mRFP1 or tdimer2(12) (21,22). DsRed exhibits slow and incomplete chromophore maturation combined with strong tendencies to form tetramers or even higher aggregates. In contrast, the DsRed mutants mRFP1 and the tandem fusion tdimer2(12) have been reported as truly monomeric and more rapidly maturing devoid of the above mentioned obligate tetramerization and aggregation propensities. Therefore these mutants were preferred to DsRed and its early mutants. The sequence of protein linkers and fluorophore-linker joints along with the encoding DNA sequences are presented in Fig. 9 (Supplementary Material). Regarding the design of protein linkers, alterations in linker length and composition have been found to affect the stability, oligomeric state, proteolytic resistance, and solubility of single-chain proteins (33). Hence, all Casp-3-sensitive and inert linkers included the sequence patterns AL11 (A-G linker) and SL7 (G-S linker) presented by Robinson and Sauer (33).
Emission filters and particle brightness
Residual spectral cross talk of green signal into the red detection channel due to imperfect filters may lead to an overestimation of cross correlation. This effect could be minimized by choosing proper filter sets that reduce signal bleed-through into the red channel to ∼5% for Alexa 488 and <3% for EGFP. These effects could then safely be neglected for further analysis. The emission spectra of the various fluorophores (Fig. 3), which were recorded with a fluorescence spectrometer (LS-50, PE Biosystems, Weiterstadt, Germany), confirm the good spectral separation for the GFP and DsRed mutants. Whereas tdimer2(12) exhibits a significantly higher molecular brightness than mRFP1, the emission spectrum of the latter is more red-shifted (22). Therefore, the red emission filter HQ625/50 nm was selected to favor mRFP1 emission, thus leading to a comparable particle brightness of mRFP1 and tdimer2(12) for similar excitation intensities. At the same time, we aimed at similar molecular particle brightnesses η of green and red fluorophores for intracellular analysis of fusion proteins. For ∼95% of all evaluated intracellular measurements, the molecular brightness η ranged between 0.5 and 4.0 kHz/molecule for red and green dyes. No reliable data analysis was possible for η < 0.5 kHz/molecule.
FIGURE 3.

Emission spectra of applied fluorescent proteins. Normalized emission spectra of all fluorescent proteins used in fusion proteins and of DsRed2 are shown for comparison. The transmission spectra of the applied emission filters HQ515/30 and HQ625/50 are also shown (shaded dash-dotted lines). A good spectral separation for all pairs of red (tdimer2(12) or mRFP1) and green (EGFP or rsGFP) fluorophores can be achieved. Spectral crosstalk of GFPs into the red channel was reduced to a minimum by the emission filter HQ625/50 for the red channel.
In this study, η was mainly limited by the photostability of the red protein fluorophores: due to the low quantum yield and absorption coefficient combined with the compromise in filter choice for tdimer2(12), higher excitation intensities had to be applied for the red compared to the green dyes (2–6 μW for 488 nm and 8–49 μW for 543 nm). The maximum molecular brightnesses obtained for the red chromophores in vivo close to photobleaching were ηmax_mRFP1 = 3–4 kHz/molecule and ηmax_tdimer2(12) = 6–8 kHz/molecule for excitation intensities of ∼27 μW and 58 μW, respectively. Significantly lower excitation intensities were chosen for intracellular dcFCCS analysis.
Despite the rather low molecular particle brightness, fluorescence background could be neglected at these low excitation powers. Background contributions by Raman scattering and cellular autofluorescence were assayed within untreated cells and typically contributed <5% to fluorescence signals obtained from cells expressing fluorescent fusion proteins. Background levels ranging within 5–10% of the expected fluorescence intensity were measured only in a minority of cells. Again, these contributions were not corrected for. On the one hand, the actual background intensity varies slightly from cell to cell, which made exact quantification difficult. The thus already error-prone correction would probably introduce even larger errors, which is also consistent with the argumentation by Schwille et al. (5), who recommend neglecting background levels <10%. On the other hand, this proof-of-principle study focused mainly on yes-or-no answers, rather than subtle distinctions, so that the tiny error in the absolute values could be accepted. All the more so, since this was significantly less than the error already introduced by the incompletely overlapping focal volumes (cf. above).
Resolution
To estimate the accuracy of this cross-correlation analysis, the analysis procedure needs to be explained in more detail. Cells were examined with fluorescence microscopy before FCS measurements. Only cells of low to intermediate brightness as judged by eye for both the green and red spectral ranges were analyzed. Typically, these exhibited particle concentrations of 30–500 nM GFP and 14–320 nM RFP. Individual curves obtained from multiple short intervals (10–15 s) were averaged, hereby covering a total of 30–50 s of integration time. The corresponding parameters, e.g., the relative cross-correlation amplitudes CCrel, the molecular brightness η, and intracellular particle concentrations, were obtained from the nonlinear least-squares fit to the experimental data and are summarized in Table 3. However, intracellular FCS curves tend to be rather noisy and may reflect also the microenvironment at the location of the focal spot. Thus, they often can be interpreted about equally well by more than one fit model. Whereas more complex fit functions involving more free parameters may result in smaller residuals, they also require more a priori assumptions and it may be that not all components are physically relevant. Therefore, fit quality is not judged merely by χ2, but also by the residuals, i.e., the difference between the fit curve and the experimental data, and the stability upon including or removing additional components from the fit model. Depending on the number of diffusing components and also blinking decay terms included in the fit model (refer to Materials and Methods for details), the fit results varied slightly. In addition to the actual fit errors, these deviations served to determine the accuracy of the data evaluations, which ranged within ±1% to ±5% CCrel. Thus, even for low molecular brightness values (0.5 < η < 1 kHz/molecule), the FCS curves permitted reasonably reliable fits.
TABLE 3.
Measurement parameters of intracellular dcFCCS analysis
| Fusion | Time/figure | CCrel (%) | Molecular brightness η of GFP (kHz) | Molecular brightness η of RFP (kHz) | c(GFP) (nM) | c(RFP) (nM) | c(fusion) (nM) |
|---|---|---|---|---|---|---|---|
| EGFP and tdimer2(12) | Fig. 4 A | 11 (±2) | 1.7 ± 0.1 | 1.4 ± 0.1 | 12 | 18 | (neg. control) |
| finert,s | Fig. 4 B | 50 (±3) | 1.0 ± 0.01 | 1.8 ± 0.02 | 137 | 20 | 10 ± 2 |
| finert,s | Fig. 7, cell 1 | ||||||
| 0 h | 47 (±1) | 1.5 ± 0.02 | 1.3 ± 0.04 | 353 | 41 | 19 ± 2 | |
| 5 h | 46.5 (±1.5) | 0.8 ± 0.01 | 1.1 ± 0.05 | 185 | 58 | 27 ± 3 | |
| 23h | 43 (±5) | 0.8 ± 0.02 | 1.3 ± 0.02 | 112 | 105 | 46 ± 9 | |
| fCasp3,s | Fig. 7, cell 2 | ||||||
| 0 h | 44 (±1) | 1.2 ± 0.02 | 2.0 ± 0.05 | 129 | 31 | 13 ± 2 | |
| 5 h | 30 (±2) | 0.6 ± 0.01 | 0.7 ± 0.1 | 85 | 29 | 9 ± 2 | |
| fCasp3,l | Fig. 7, cell 3 | ||||||
| 0 h | 34 (±1) | 0.8 ± 0.02 | 0.8 ± 0.01 | 291 | 157 | 53 ± 2 | |
| 21 h | 18 (±5) | 0.7 ± 0.01 | 0.5 ± 0.01 | 88 | 56 | 10 ± 3 |
All measurements presented in this study are summarized and characterized in this table. The figures and cells corresponding to each row of data are indicated in column 2. Relative cross correlation is presented along with molecular brightness values. The molecular brightness η corresponds to the average photon count per molecule and was obtained according to Eq. 3, whereas fit errors were considered for error estimates. Moreover, intracellular concentrations of all fluorescent specimens have been calculated. The concentration of fluorophores was determined with an estimated maximum error of ±10%, including fit errors of calibration and intracellular measurements, deviations among different fit models, and chromatic effects within cells.
Experimental range
To gauge the sensitivity and dynamic range of the experimental system, the minimum and maximum values obtainable for intracellular cross-correlation analysis of both the fluorescent proteins and their fusions were determined. The normalized cross-correlation amplitudes, CCrel (cf. Materials and Methods), were used to assess and—more important—quantify fusion protein stability and degradation. CCrel gives the percentage of double-labeled fusion proteins relative to the less abundant species, namely the red fluorescent proteins in ∼95% of all analyzed cells (CCrel_r).
To determine the maximum CCrel values achievable under nonideal measurement conditions, the fusion construct finert;s (cf. Table 2) was expressed overnight, i.e., for 14–16 h, and subsequently analyzed with dcFCCS. Analogously, coexpressed (unlinked) EGFP and tdimer2(12) served as a negative control to characterize the minimum intracellular CCrel values possible. Hence, the experimental range for this in vivo study extends from 11% CCrel for the negative control up to 50% CCrel for the most stable fusion protein, finert,s (Fig. 4).
FIGURE 4.

Experimental range of intracellular dcFCCS analysis. The minimum and maximum values possible for intracellular cross-correlation amplitudes of autofluorescent proteins and their fusions were determined. (A) Cells coexpressing EGFP and tdimer2(12) served as negative controls to measure the lowest possible value for the relative cross-correlation amplitude CCrel. (B) On the contrary, cells containing the fusion protein finert,s with the Caspase-3-insensitive linker were examined to quantify the upper limit for CCrel. Symbols depict the experimental data whereas the fit curves are shown as shaded solid lines. All curves, including the red and green autocorrelation (GEGFP and Gtdimer2(12)) and the cross-correlation curves (Grg), are normalized by the respective lower autocorrelation amplitude. Thus, the amplitude of the cross-correlation function directly gives the percentage of double-labeled fusion proteins, CCrel. Potential values for the relative cross-correlation amplitudes CCrel for intracellular measurements range consequently from 11% for the negative control (A) to 50% for the positive control (B).
Whereas in vitro systems with their known components are well defined, FCS analysis in vivo faces a very heterogeneous environment. Therefore, further reference measurements were performed to compare the conditions for dcFCCS analysis in vivo and in vitro: Purified fusion proteins (7) typically showed 70% (±5%) CCrel in vitro but only a maximum of 60% CCrel after delivery to cells. In contrast to this, a mixture of EGFP and tdimer2(12) in buffer resulted in 3–4% CCrel in vitro.
Comparing the CCrel values for the in vitro and in vivo negative controls showed an apparent offset of +6–9% CCrel for in vivo measurements. Inside cells, the relative cross correlation never dropped to values below 10%. Delivery of fusion protein to cells, on the contrary, resulted in a wide range of relative cross-correlation amplitudes, but only a maximum of 80–90% of the corresponding in vitro values could be obtained inside cells.
Fusion protein stability after overnight expression
Next, the influence of the different linker types on the stability of fusion proteins in cells and accordingly on CCrel was investigated. For this purpose, the fusions presented in Table 2 were expressed in separate cell populations for 14–16 h before analyzing the cells by dcFCCS. Since transient expression procedures have been reported to partly activate Casp-3 in some cells, transfection reactions were performed both in the presence and absence of the caspase inhibitor z-VAD-fmk (18). Fig. 5 shows the distribution of CCrel values among different cells for each fusion. Measurements of the fusion constructs with the short linker, fCasp3,s and finert,s, showed high relative cross-correlation amplitudes of up to ∼50%. These values were also highly reproducible provided transfection was performed in the presence of the caspase inhibitor z-VAD-fmk. In contrast to this, fusion fCasp3,l showed lower average values for CCrel and hence only intermediate stability. For the linkers “inert23” (finert,s) and “linker23” (fCasp3,s), the increase of CCrel values upon z-VAD-fmk treatment was most obvious and also the standard deviations for the average CCrel values decreased significantly.
FIGURE 5.

Protein stability after overnight expression. The proteolytic persistence of different fusion protein linkers within cells was compared by means of dcFCCS analysis after overnight expression. For each fusion construct, the distribution of normalized cross-correlation amplitudes (CCrel) among different cells is summarized in histograms (black and gray bars) along with the average values and standard deviations (values in parentheses). Cells have been grouped in bins of 4% CCrel (x ≤ CCrel < x + 3.9). Upon addition of the Casp-3 inhibitor z-VAD-fmk to the transient protein expression procedures, an increase in fusion protein stability, in particular for the fusion proteins fCasp3,s and finert,s, could be observed (gray bars and labels). However, the stability of the constructs with the short protein linker fCasp3,s and finert,s proved in general superior to that of fCasp3,l.
The variations observed in CCrel for each fusion protein point to a partial degradation of fusion proteins by proteolytic background activities, regardless of the presence or absence of a Casp-3 cleavage site and z-VAD-fmk treatment.
Prerequisites to intracellular online analysis
To monitor individual cells for longer times, these organisms had to be relocated and later reanalyzed for a second and third time. As discussed for the measurements in the previous section, the cells were first investigated after ∼14–16 h of protein expression. Since we were primarily interested in long-term protein stability, incubation times of 5–23 h followed the first measurement. This is also consistent with the fact that intracellular protease activity is normally monitored on timescales of hours.
Individual cells were revisited based on a relative coordinate system. Bubbles enclosed in the glue of the cell chambers served as the center of a coordinate system to relocate particular cells after incubation with an accuracy of ±2 μm. After each FCS measurement, a digital image of the analyzed cell was recorded with a CCD camera to facilitate relocation later on.
Unfortunately, only 40–50% of initially selected cells could be safely identified for another measurement. Frequently, retrieving a particular cell turned out to be impossible due to cell detachment, cell division, or changes in relative position and shape.
Online analysis and intramolecular dynamics of fusion proteins
Based on this approach, an ensemble of cells was investigated online. The resulting data were analyzed with regard to the proteolytic stability of the fusion proteins in terms of the percentage of cross-correlating molecules, CCrel. Moreover, the intramolecular dynamics of the fluorophore fusions were examined in detail. To get the complete picture, the temporal evolution of the intracellular concentrations of the red and green autofluorescent proteins was followed in individual cells. For simplicity, the average particle number N within the detection volume Veff served as a measure for these concentrations.
As expected, the numbers of red and green fluorophores changed dramatically over time. Fig. 6 presents the results obtained for four cells expressing the protein finert,s. For eight cells expressing finert,s for 14–16 h, the initial number of green fluorescent proteins was found to be three- to fourfold higher than for red fluorescent proteins in the same cell. After this first measurement, the number of red particles increased by a factor of at least ∼1.5 within the next 5–6 h, combined with a simultaneous decrease in the number of green fluorophores by ∼0.5 on average. With regard to these effects, the development of intracellular concentrations of intact fusion protein was also analyzed and the values are listed in Table 4. Not surprisingly, cells showing a decrease in fusion protein concentration also exhibited a significant decrease in CCrel. Nevertheless, for some of the specimens, the opposite trend was observed (cf. Table 4). In Table 4, different online measurements have been classified according to selected parameters. For each of these subgroups, the number of cells being included, the range of decreases in CCrel, and the development of fusion protein concentration are given.
FIGURE 6.

Time course of fluorophore numbers within cells expressing finert,s. The intracellular behavior and stability of the autofluorescent proteins themselves were analyzed over time in individual cells expressing finert,s. In this case, however, the main emphasis was put on the temporal changes in chromophore concentration, regardless of the actual linker sequence. Based on repeated dcFCCS measurements in selected cells, the average number of protein fluorophores within the detection volume Veff, which is directly related to the local fluorophore concentrations, was determined. Starting at a three- to fourfold surplus of GFP molecules in the first measurement after overnight protein expression (0 h), the red and green particle numbers converged during the after 5–23 h of observation. This shift was explained by delayed fluorophore maturation of red fluorescent proteins, which includes a green fluorescent intermediate state.
TABLE 4.
CCrel and total concentrations of fusion proteins analyzed over time
| Fusion | Number of cells analyzed | Decrease in CCrel (%) | cend (fusion)/cstart (fusion) (%) |
|---|---|---|---|
| finert,s | 4 | 1–6 | 130–170 |
| 1 | 10 | 160 | |
| 3 | 11–20 | 50–80 | |
| fCasp3,s | 1 | 4 | 111 |
| 3 | 16–23 | 60–90 |
The online analysis of single cells resulted in time courses for CCrel and the intracellular concentration of fusion proteins. Each row of data represents an indicated number of cells with similar behavior. The temporal development of fusion protein concentration is given as a ratio of final to initial protein concentration.
Most interestingly, fusion protein concentrations increased for cells displaying only little decrease in the percentage of cross-correlating molecules, CCrel. This indicates that another process is acting upon the applied fusion proteins, apart from proteolytic separation of protein fluorophores.
Online analysis of fusion protein stability
The temporal stability of the different types of fusion proteins listed in Table 2 was monitored within individual cells, again visualizing trends for the long-term stability of fusion proteins in terms of relative cross correlation. For each fusion construct employed in this study, a representative online measurement is shown in Fig. 7. Complete sets of FCS data including fluorescent traces and correlation functions are presented, including images of the analyzed cells. No significant bleaching occurred during these dcFCCS measurements. Since the measurements were normalized, the cross-correlation amplitudes directly correspond to CCrel. The graphs were aligned for easier comparison.
FIGURE 7.

Monitoring of temporal changes in fusion protein stability inside individual cells. The intracellular stability of fusion proteins expressed at low nanomolar concentrations was monitored over time by repeated dcFCCS analysis within selected cells. Both Casp-3-insensitive (finert,s, cell 1) and sensitive (fCasp3,s and fCasp3.l, cells 2 and 3) fusion proteins were observed for up to 23 h. The graphs show complete sets of normalized measurements. Images of the cells belonging to these measurements are placed in the top right corner of the plot. The white arrow marks the location of the laser focus. The normalized cross-correlation amplitude Grg(0) directly corresponds to the percentage of red fluorophores that are part of fusion proteins (CCrel). The fluorescent traces of three to four single measurement intervals (of 10–15 s each) were plotted below the correlation curves. They demonstrate that the fluorescence signal was temporally stable, thus excluding both larger protein aggregates and significant photobleaching. In cell 1, the fraction of dual-labeled substrate CCrel for finert,s was nearly steady during 23 h of observation, as demonstrated by three independent measurements. In contrast to this, a significant decrease in CCrel was observed within cells 2 and 3, where the Caspase-3-sensitive fusions fCasp3,s and fCasp3,l were extensively digested into single fluorophores.
Fig. 8 shows the protein persistence within the cells featured in Fig. 7. The presented CCrel values were corrected for changes in setup performance, as determined with the cross-correlation control samples. No decrease in CCrel exceeding 20% was observed in any cell. Small changes like a decrease of 2% normally were considered below the resolution limit.
FIGURE 8.

Temporal evolution of CCrel. For better visualization, the relative cross-correlation values observed in Fig. 7 for cells 1–3 have been plotted over time, including error bars. Whereas for finert,s the fraction of intact substrate molecules remains constant within the accuracy of this experiment, the decrease for the other two constructs is unmistakable. Based on the cross-correlation positive controls analyzed before cellular analysis, the intracellular CCrel values were corrected for differences in setup performance.
The data for all measurements performed in single cells expressing the double-labeled fusion protein are summarized in Table 5, pointing out trends for the temporal stability of fusion proteins within the different populations. Moreover, among the two species the fractions of cells which show a particular decrease in cross correlation during a defined period of time are also determined. These may give an idea of the distribution.
TABLE 5.
Trends in protein persistence as observed in different cells
| Fusion protein | Number of cells/total number of analyzed cells | Decrease in relative cross correlation (%) | Time range (h) |
|---|---|---|---|
| finert,s | 2/9 | ≥10% | 6 |
| 4/4 | 9–15% | 18–23 | |
| fCasp3,s | 4/5 | ≥13% | 6 |
| fCasp3,l | 2/2 | 7% and 17% | 6 |
Time courses of CCrel from single cells are summarized for each fusion construct applied. Each row of data indicates the percentage of analyzed cells showing a particular decrease in CCrel within the indicated time window.
Obviously, the sample numbers shown here are too small to allow for biologically significant conclusions. Instead, Table 5 intends to show how general conclusions can be drawn from single-cell measurements: On the single-cell level, the protein finert,s performed with superior stability compared to the other constructs tested, since it showed the largest cell fraction with only small decreases in CCrel. In contrast, fCasp3,s and fCasp3,l showed significant degradation.
DISCUSSION
Experimental resolution
Regarding the maximum accuracy that could be obtained for CCrel in vivo, intracellular fusion protein degradation may principally be observed in steps of 2% CCrel. For example, given a total GFP concentration of ∼100 nM, this would correspond to an ∼5-nM decrease in the fusion protein concentration. Based on the accuracy of the relative cross-correlation amplitude CCrel determined above and a thorough analysis of our most successful measurements, we concluded that relative cross correlation can principally be determined at a resolution of as low as ±1% CCrel.
However, to achieve this resolution, smooth FCS curves are essential, thus also minimizing potential ambiguities in the choice of the correct fit model. Of course such ambiguities also depend on the actual location of the detection volume Veff within the cell. The proximity of membranes in the form of cellular organelles cannot always be completely excluded during the measurement. To improve signal/noise ratios and avoid atypical correlation curves a measurement should feature a sufficiently high particle brightness (at least 1 kHz/molecule) combined with steady fluorescence traces devoid of bleaching, bursts, or long-term fluctuations and data averaged from at least three distinct measurement intervals of 10 s each.
Nevertheless, larger errors of up to ±5% CCrel have to be taken into account in the case of noisy FCS data, which result in higher uncertainties regarding curve fitting. Moreover, only slightly inconsistent calibration measurements of the protein and DNA cross-correlation controls in vitro can easily multiply the estimated error. Considering the experimental range of ∼40% CCrel presented in Fig. 4 for this study, this method principally maintains its quantitative character even for larger errors in CCrel.
Consideration of intramolecular dynamics of fusion proteins
Despite expressing fusion proteins, which should result in equimolar ratios of red and green fluorophores, after 14–16 h of protein expression the initial concentrations of green fluorophores were typically three to four times higher than those of the red chromophores. Within 5–6 h after the first measurement, this ratio shifted significantly toward the red fluorophores (cf. Fig. 6). Different effects may have contributed simultaneously to this effect. On the one hand, photobleaching of the red chromophores cannot be generally excluded, even though the observed shift in relative chromophore abundance rather contradicts this assumption. Although the RFPs were excited at higher intensities than the GFPs, the number of red particles increased, whereas those of the green fluorophores decreased. Photobleaching would cause a more consistent deficiency in red chromophores. On the other hand, significant background expression of fusion protein due to remaining mRNAs and inductor PonA would have resulted in an immediate increase of green particle numbers in particular, and can be excluded for this reason.
The observed shifts in particle numbers can be readily explained by the phenomenon of delayed fluorophore maturation of RFPs that has been described in detail for DsRed. Nonmature (“green”) protein with 475-nm excitation/500-nm emission maxima transforms into mature protein with 558-nm excitation/585-nm emission maxima. This protein requires >48 h to reach 90% of its maximum red fluorescence intensity (34). Significantly faster chromophore maturation was determined for the mutants mRFP1 and tdimer2(12), with characteristic maturation times, t0.5, of 2 h for timer2(12) and <1 h for mRFP1 (22). Nevertheless, delayed maturation apparently played a significant role even after 14–16 h of protein expression. To our knowledge, for DsRed there has so far been no indication of accelerated chromophore maturation upon exposure to excitation light. Thus, the idea of light-induced chromophore maturation during the first measurement is not supported.
However, in >95% of all cells examined the concentration of green chromophores exceeded that of the red ones: Cgreen > Cred . In this case, the percentage of cross-correlating molecules is determined by normalizing the cross-correlation amplitude by that of the green autocorrelation curve. Thus, no change in relative cross correlation is induced due to delayed maturation: Immature tdimer2(12) fluorophores should be evenly distributed among fusion proteins and free tdimer2(12) fluorophores resulting from protein degradation. Consequently, the ratio between fused and free tdimer2(12) fluorophores remains constant while their absolute number increases during delayed maturation. Because green fluorophores bound to an immature red partner will be treated as free, this effect merely leads to an underestimation of the overall percentage of cross-correlating molecules. The kinetics will be reflected correctly. Remarkably, dcFCCS can resolve such intramolecular dynamics by accessing multiple sample parameters simultaneously. Alternative strategies like FRET studies would be seriously hampered by the effects discussed here.
More critical to CCrel is whether or not degradation of GFP occurs. For Cgreen > Cred, GFP degradation would result in a decrease of relative cross-correlation values. Apparently, intracellular longevity of fluorescent proteins seems to be related to cytotoxic effects, and there is ample evidence that EGFP may become cytotoxic when overexpressed in cells, e.g., via oxidative stress (35–38). Yet, studies concerned with these toxic effects of protein fluorophores were primarily based on analyzing cell morphology and physiology. There are practically no alternative techniques capable of quantifying changes in particle numbers and ratios in a manner as precise as that demonstrated here. The experimental data obtained for finert,s contradict the hypothesis of significant EGFP degradation, since a comparatively stable CCrel could be observed despite changing particle numbers (cf. Table 5, top row). Much more experimental data and specifically suited experiments will be necessary to address this question systematically, which was not intended here and is beyond the scope of this work. Obviously, dual-color FCS also offers a uniquely precise tool to study the intracellular behavior of protein fluorophores themselves.
Analyzing protein stability based on single-cell measurements
As a prerequisite for a highly sensitive apoptosis assay, we monitored intracellular fusion protein persistence at low nanomolar concentrations and consequently achieved a high sensitivity for cellular processes. Many individual cells were characterized by dcFCCS (Fig. 5); for some of them even an online time series was recorded to monitor the degradation of fusion proteins with time (Fig. 7). Obviously, fusion constructs both with and without Casp-3 target sites were degraded by cellular proteases (Fig. 5 and Table 5), pointing to specific (Casp-3) and/or yet unspecified proteolytic activities inside cells. These processes were detected without consciously inducing apoptosis and despite treating cells with the caspase and apoptosis inhibitor z-VAD-fmk. In similar assays, small basal proteolytic activities were detected that were attributed to the induction of Casp-3 background activities upon transient protein expression These were also suppressed by z-VAD-fmk (18,39). Indeed, dcFCCS measurements performed after overnight protein expression revealed a significant effect of z-VAD-fmk on the distribution of CCrel for the fusions fCasp3,s and finert,s (Fig. 5). Different concentrations of z-VAD-fmk have still to be tested to ensure a more complete suppression of Casp-3 activation. This could help to stabilize fCasp3,l, which displayed the highest proteolytic susceptibility. Actually, the relative stabilities seemed to correlate with linker length when comparing the constructs fCasp3,s and fCasp3,l, which could indicate a better accessibility of the protease target site due to the longer linker. But two protein types cannot be regarded as sufficient to allow more than justified speculations on this topic. Remarkably, the broad specificity protease inhibitor z-VAD-fmk also affected the stability of fusion finert,s endowed with a Casp-3-insensitive linker. This hints at the inhibition of cellular processes different from Casp-3 activity but nonetheless capable of digesting these fusion proteins. Despite this, finert,s still showed the highest average and maximum CCrel values of all tested fusion proteins.
The online measurements of intracellular fusion protein behavior, as shown in Fig. 7 and summarized in Table 5, confirmed this hierarchy in protein stability: The Casp-3-sensitive constructs fCasp3,s and fCasp3,l showed significant decreases in CCrel within 5–6 h in most cells tested, in contrast to fusion construct finert,s. The superior stability of finert,s directly points to the presence of a specific, possibly Casp-3-dependent, background activity. Interestingly, the maximum CCrel values did not surpass ∼50% for intracellular fusion protein expression. We consider incomplete/delayed fluorophore maturation, immediate proteolytic degradation, and translational abrogation to be the major reasons for this limit.
In accordance with other authors, we observed a remarkable heterogeneity of cellular behavior within cell cultures, as illustrated in Fig. 5 (17). Consequently, large datasets of single-cell measurements need to be amassed, involving elaborate statistics, to identify a reliable trend in cell and protein behavior. The observed degradation of fusion proteins might on the one hand result from the applied experimental conditions, such as transient protein expression, or require further improvement of protease inhibitor protocols and fusion protein sequences. On the other hand, we deem it likely that these processes might have to be taken into account at least partially for a highly quantitative analysis of cellular reporter molecules at physiologically relevant low concentrations.
SUMMARY
A protein-based model system for intracellular dcFCCS analysis has been presented and characterized. Protein persistence and protease activities on dual-labeled fusion constructs were monitored online at low concentrations in single live cells and quantified at high resolution. Protein degradation within cells is most adequately described in terms of relative measures like relative cross correlation, CCrel, that capture processes separating fluorophores from fusion proteins. dcFCCS also tolerated the delayed maturation observed for the red fluorophores, which would present a nearly insurmountable obstacle for FRET studies. Future experiments need to show whether the so far undefined proteolytic background activities can be minimized further or if they must be taken into account for highly quantitative measurements. Especially with substrate concentrations in the lower nanomolar range, subtle processes can be revealed that might easily be obscured by stronger protein expression. The observed heterogeneity of cellular behavior renders the evaluation of large datasets mandatory when studying processes inside individual cells, particularly on timescales of hours. This experimental approach could even allow for the analogous study of reversible intracellular protein-protein interactions which would be facilitated by the more favorable shorter timescales for these reactions—all the more so, as cells expressing the proteins in question can be measured directly at later times without the need for additional manipulation. For stably transfected cells, the experimental “dead times” would be reduced even further so that even fast reactions can be assessed during the complete cell cycle.
SUPPLEMENTARY MATERIAL
An online supplement to this article can be found by visiting BJ Online at http://www.biophysj.org.
Supplementary Material
Acknowledgments
This study was carried out in the Experimental Biophysics Group, Max-Planck Institute for Biophysical Chemistry, Göttingen, Germany. We thank Karin Birkenfeld for assistance with sample preparation and Petra Dittrich for assistance with setup maintenance. We are indebted to Robert E. Campbell for providing us with the plasmids encoding the fluorophores tdimer2(12) and mRFP1.
Financial support from the German Ministry for Education and Research (Biofuture grants 0311845 and 16SV1257), Evotec BioSystems AG (Hamburg, Germany), and EFRE (4-0123.55-20-0370-03/3) is gratefully acknowledged.
References
- 1.Eigen, M., and R. Rigler. 1994. Sorting single molecules: application to diagnostics and evolutionary biotechnology. Proc. Natl. Acad. Sci. USA. 91:5740–5747. [DOI] [PMC free article] [PubMed] [Google Scholar]
- 2.Weiss, S. 1999. Fluorescence spectroscopy of single biomolecules. Science. 283:1676–1683. [DOI] [PubMed] [Google Scholar]
- 3.Schwille, P., and U. Kettling. 2001. Analyzing single protein molecules using optical methods. Curr. Opin. Biotechnol. 12:382–386. [DOI] [PubMed] [Google Scholar]
- 4.Schwille, P., F. J. Meyeralmes, and R. Rigler. 1997. Dual-color fluorescence cross-correlation spectroscopy for multicomponent diffusional analysis in solution. Biophys. J. 72:1878–1886. [DOI] [PMC free article] [PubMed] [Google Scholar]
- 5.Schwille, P., U. Haupts, S. Maiti, and W. W. Webb. 1999. Molecular dynamics in living cells observed by fluorescence correlation spectroscopy with one- and two-photon excitation. Biophys. J. 77:2251–2265. [DOI] [PMC free article] [PubMed] [Google Scholar]
- 6.Kettling, U., A. Koltermann, P. Schwille, and M. Eigen. 1998. Real-time enzyme kinetics monitored by dual-color fluorescence cross-correlation spectroscopy. Proc. Natl. Acad. Sci. USA. 95:1416–1420. [DOI] [PMC free article] [PubMed] [Google Scholar]
- 7.Kohl, T., K. G. Heinze, R. Kuhlemann, A. Koltermann, and P. Schwille. 2002. A protease assay for two-photon crosscorrelation and FRET analysis based solely on fluorescent proteins. Proc. Natl. Acad. Sci. USA. 99:12161–12166. [DOI] [PMC free article] [PubMed] [Google Scholar]
- 8.Kim, S. A., K. G. Heinze, M. N. Waxham, and P. Schwille. 2004. Intracellular calmodulin availability accessed with two-photon cross-correlation. Proc. Natl. Acad. Sci. USA. 101:105–110. [DOI] [PMC free article] [PubMed] [Google Scholar]
- 9.Bacia, K., I. V. Majoul, and P. Schwille. 2002. Probing the endocytic pathway in live cells using dual-color fluorescence cross-correlation analysis. Biophys. J. 83:1184–1193. [DOI] [PMC free article] [PubMed] [Google Scholar]
- 10.Schwille, P. 2001. Fluorescence correlation spectroscopy and its potential for intracellular applications. Cell Biochem. Biophys. 34:383–408. [DOI] [PubMed] [Google Scholar]
- 11.Deniz, A. A., M. Dahan, J. R. Grunwell, T. J. Ha, A. E. Faulhaber, D. S. Chemla, S. Weiss, and P. G. Schultz. 1999. Single-pair fluorescence resonance energy transfer on freely diffusing molecules: observation of Forster distance dependence and subpopulations. Proc. Natl. Acad. Sci. USA. 96:3670–3675. [DOI] [PMC free article] [PubMed] [Google Scholar]
- 12.Saito, K., W. Ikuo, T. Mamoru, and K. Mastaka. 2004. Direct detection of caspase-3 activation in single live cells by cross-correlation analysis. Biochem. Biophys. Res. Commun. 324:849–854. [DOI] [PubMed] [Google Scholar]
- 13.Ruan, Q. Q., Y. Chen, E. Gratton, M. Glaser, and W. W. Mantulin. 2002. Cellular characterization of adenylate kinase and its isoform: Two-photon excitation fluorescence imaging and fluorescence correlation spectroscopy. Biophys. J. 83:3177–3187. [DOI] [PMC free article] [PubMed] [Google Scholar]
- 14.Rietdorf, J. 2005. Microscopy Techniques. Advances in Biochemical Engineering/Biotechnology, Vol. 95. Springer, Berlin.
- 15.Garcia-Calvo, M., E. P. Peterson, B. Leiting, R. Ruel, D. W. Nicholson, and N. A. Thornberry. 1998. Inhibition of human caspases by peptide-based and macromolecular inhibitors. J. Biol. Chem. 273:32608–32613. [DOI] [PubMed] [Google Scholar]
- 16.Belmokhtar, C. A., J. Hillion, and E. Segal-Bendirdjian. 2001. Staurosporine induces apoptosis through both caspase-dependent and caspase-independent mechanisms. Oncogene. 20:3354–3362. [DOI] [PubMed] [Google Scholar]
- 17.Morgan, M. J., and A. Thorburn. 2001. Measurement of caspase activity in individual cells reveals differences in the kinetics of caspase activation between cells. Cell Death Differ. 8:38–43. [DOI] [PubMed] [Google Scholar]
- 18.Tawa, P., J. Tam, R. Cassady, D. W. Nicholson, and S. Xanthoudakis. 2001. Quantitative analysis of fluorescent caspase substrate cleavage in intact cells and identification of novel inhibitors of apoptosis. Cell Death Differ. 8:30–37. [DOI] [PubMed] [Google Scholar]
- 19.Bedner, E., P. Smolewski, P. Amstad, and Z. Darzynkiewicz. 2000. Activation of caspases measured in situ by binding of fluorochrome-labeled inhibitors of caspases (FLICA): Correlation with DNA fragmentation. Exp. Cell Res. 259:308–313. [DOI] [PubMed] [Google Scholar]
- 20.Packard, B. Z., D. D. Toptygin, A. Komoriya, and L. Brand. 1998. Intramolecular resonance dipole-dipole interactions in a profluorescent protease substrate. J. Phys. Chem. B. 102:752–758. [Google Scholar]
- 21.Delagrave, S., R. E. Hawtin, C. M. Silva, M. M. Yang, and D. C. Youvan. 1995. Red-shifted excitation mutants of the green fluorescent protein. Biotechnology. 13:151–154. [DOI] [PubMed] [Google Scholar]
- 22.Campbell, R. E., O. Tour, A. E. Palmer, P. A. Steinbach, G. S. Baird, D. A. Zacharias, and R. Y. Tsien. 2002. A monomeric red fluorescent protein. Proc. Natl. Acad. Sci. USA. 99:7877–7882. [DOI] [PMC free article] [PubMed] [Google Scholar]
- 23.Schwille, P. 2000. Cross-correlation analysis in FCS. In Fluorescence Correlation Spectroscopy: Theory and Applications. R. Rigler and E. Elson, editors. Springer-Verlag, Heidelberg. 360–378.
- 24.Krichevsky, O., and G. Bonnet. 2002. Fluorescence correlation spectroscopy: the technique and its applications. Rep. Prog. Phys. 65:251–297. [Google Scholar]
- 25.Bacia, K., and P. Schwille. 2003. A dynamic view of cellular processes by in vivo fluorescence auto- and cross-correlation spectroscopy. Methods (Duluth). 29:74–85. [DOI] [PubMed] [Google Scholar]
- 26.Malvezzi-Campeggi, F., M. Jahnz, K. G. Heinze, P. Dittrich, and P. Schwille. 2001. Light-induced flickering of DsRed provides evidence for distinct and interconvertible fluorescent states. Biophys. J. 81:1776–1785. [DOI] [PMC free article] [PubMed] [Google Scholar]
- 27.Haupts, U., S. Maiti, P. Schwille, and W. W. Webb. 1998. Dynamics of fluorescence fluctuations in green fluorescent protein observed by fluorescence correlation spectroscopy. Proc. Natl. Acad. Sci. USA. 95:13573–13578. [DOI] [PMC free article] [PubMed] [Google Scholar]
- 28.Rarbach, M., U. Kettling, A. Koltermann, and M. Eigen. 2001. Dual-color fluorescence cross-correlation spectroscopy for monitoring the kinetics of enzyme-catalyzed reactions. Methods (Duluth). 24:104–116. [DOI] [PubMed] [Google Scholar]
- 29.Heinze, K. G., A. Koltermann, and P. Schwille. 2000. Simultaneous two-photon excitation of distinct labels for dual-color fluorescence cross-correlation analysis. Proc. Natl. Acad. Sci. USA. 97:10377–10382. [DOI] [PMC free article] [PubMed] [Google Scholar]
- 30.Hess, S. T., and W. W. Webb. 2002. Focal volume optics and experimental artifacts in confocal fluorescence correlation spectroscopy. Biophys. J. 83:2300–2317. [DOI] [PMC free article] [PubMed] [Google Scholar]
- 31.Schwille, P. 1996. Fluoreszenz-Korrelations-Spektroskopie: Analyse biochemischer Systeme auf Einzelmolekülebene. Technische Universität Braunschweig, Germany.
- 32.Ribeiro, C. M. P., R. R. McKay, E. Hosoki, G. S. Bird, and J. W. Putney. 2000. Effects of elevated cytoplasmic calcium and protein kinase C on endoplasmic reticulum structure and function in HEK293 cells*1. Cell Calcium. 27:175–185. [DOI] [PubMed] [Google Scholar]
- 33.Robinson, C. R., and R. T. Sauer. 1998. Optimizing the stability of single-chain proteins by linker length and composition mutagenesis. Proc. Natl. Acad. Sci. USA. 95:5929–5934. [DOI] [PMC free article] [PubMed] [Google Scholar]
- 34.Baird, G. S., D. A. Zacharias, and R. Y. Tsien. 2000. Biochemistry, mutagenesis, and oligomerization of DsRed, a red fluorescent protein from coral. Proc. Natl. Acad. Sci. USA. 97:11984–11989. [DOI] [PMC free article] [PubMed] [Google Scholar]
- 35.Hanazono, Y., J.-M. Yu, C. E. Dunbar, and R. V. B. Emmons. 1997. Green fluorescent protein retroviral vectors: low titer and high recombination frequency suggest a selective disadvantage. Hum. Gene Ther. 8:1313–1319. [DOI] [PubMed] [Google Scholar]
- 36.Goto, H., B. Yang, D. Petersen, K. A. Pepper, P. A. Alfaro, D. B. Kohn, and C. P. Reynolds. 2003. Transduction of green fluorescent protein increased oxidative stress and enhanced sensitivity to cytotoxic drugs in neuroblastoma cell lines. Mol. Cancer Ther. 2:911–917. [PubMed] [Google Scholar]
- 37.Liu, H. S., M. S. Jan, C. K. Chou, P. H. Chen, and N. J. Ke. 1999. Is green fluorescent protein toxic to the living cells? Biochem. Biophys. Res. Commun. 260:712–717. [DOI] [PubMed] [Google Scholar]
- 38.Kirsch, P., M. Hafner, H. Zentgraf, and L. Schilling. 2003. Time course of fluorescence intensity and protein expression in HeLa cells stably transfected with hrGFP. Mol. Cells. 15:341–348. [PubMed] [Google Scholar]
- 39.Harpur, A. G., F. S. Wouters, and P. I. H. Bastiaens. 2001. Imaging FRET between spectrally similar GFP molecules in single cells. Nat. Biotechnol. 19:167–169. [DOI] [PubMed] [Google Scholar]
Associated Data
This section collects any data citations, data availability statements, or supplementary materials included in this article.