

Abstract
We develop a Poisson random-field model of polymorphism and divergence that allows arbitrary dominance relations in a diploid context. This model provides a maximum-likelihood framework for estimating both selection and dominance parameters of new mutations using information on the frequency spectrum of sequence polymorphisms. This is the first DNA sequence-based estimator of the dominance parameter. Our model also leads to a likelihood-ratio test for distinguishing nongenic from genic selection; simulations indicate that this test is quite powerful when a large number of segregating sites are available. We also use simulations to explore the bias in selection parameter estimates caused by unacknowledged dominance relations. When inference is based on the frequency spectrum of polymorphisms, genic selection estimates of the selection parameter can be very strongly biased even for minor deviations from the genic selection model. Surprisingly, however, when inference is based on polymorphism and divergence (McDonald-Kreitman) data, genic selection estimates of the selection parameter are nearly unbiased, even for completely dominant or recessive mutations. Further, we find that weak overdominant selection can increase, rather than decrease, the substitution rate relative to levels of polymorphism. This nonintuitive result has major implications for the interpretation of several popular tests of neutrality.
CHARACTERIZING the various forces that shape patterns of genetic polymorphism within and between species is the central goal of population genetics (Lewontin 1974). To that end, statistical inference using Poisson random field (PRF) models (Sawyer and Hartl 1992; Hartl et al. 1994; Bustamante et al. 2001) provides powerful likelihood and Bayesian methods for quantifying some of these forces, such as mutation and directional selection. Because PRF models assume high levels of recombination between sites, they are particularly well suited to the analysis of polymorphism and divergence at multiple loci distributed across a genome. For example, using a set of sequences from 12 genes in Arabidopsis and 34 genes in Drosophila, Bustamante et al. (2002) demonstrated that amino acid substitutions in Drosophila tended to be more advantageous than amino acid substitutions in Arabidopsis, which they attributed to the very high rate of selfing in Arabidopsis. PRF models also provide extremely efficient methods for the simulation of polymorphism and divergence data under the assumption of free recombination, and it has been used in this respect to estimate the power of several statistical tests of neutrality (Akashi 1999).
In developing the original PRF model, Sawyer and Hartl (1992) made some fairly restrictive assumptions regarding population processes. They assumed equal mutational fitness effects, random mating, genic selection (i.e., no dominance), independence among sites (i.e., free recombination), and a stationary population size. Recently, an effort has been made to relax these assumptions one by one. Bustamante et al. (2003) relaxed the assumption of equal mutational effects by assuming that the fitness effects of different classes of new mutations are drawn from some underlying distribution. Using this method, it is possible to estimate the distribution of mutational effects using DNA sequence data; the exact form of this distribution is critical to a general understanding of microevolution. Wakeley (2003) relaxed the assumption of random mating by applying an island model of population structure (Wright 1931). He found that, depending on the sampling regime among demes, population structure can strongly bias estimates of mutation rates and divergence times obtained using the basic PRF model if sampling among demes is not accounted for. Surprisingly, however, he found that the estimate of the scaled selection parameter is largely unaffected by island-model population structure.
In this article, we relax the assumption of genic selection. We generalize the original PRF model to account for arbitrary diploid selection models. Our generalized model yields maximum-likelihood estimators (MLEs) for the scaled selection coefficient, γ, and the dominance parameter, h. This is the first DNA sequenced-based estimator of the dominance parameter, and simulations reveal that it performs very well when large numbers of segregating sites are available. We also use our generalized PRF model to investigate the impact of dominance on polymorphism and divergence data. Two surprising results emerge from this analysis. First, we find that dominance relations generally have very little impact on ratios of polymorphism to divergence. Therefore, statistical inferences based on these ratios (Sawyer and Hartl 1992) are robust to a violation of the assumption of genic selection. Second, we find that weak and moderate overdominant selection can sometimes decrease the ratio of polymorphism to divergence relative to a neutral standard. This result is contrary to intuition. One might expect that balancing selection (overdominance is a special case of balancing selection) would always increase, rather than decrease, the ratio of polymorphism to divergence because balancing selection actively maintains polymorphism.
A wealth of theory exists relating how different types of dominance relations affect patterns of polymorphism and divergence (e.g., Cherry 2003, 2004; Griffiths 2003; Roze and Rousset 2003; Whitlock 2003). Noticeably absent, however, are any methods of statistical inference for distinguishing nongenic from genic selection, so the role of dominance has been relatively understudied by empirical population geneticists. The dominance parameter has important implications for a number of evolutionary phenomena, such as inbreeding depression (Lynch and Walsh 1998, Chap. 10), the maintenance of genetic variation by mutation-selection-drift balance (Charlesworth and Hughes 2000), and genetic load (Crow 1993). The methods we present here open up the possibility of using large DNA sequence and single-nucleotide polymorphism (SNP) data sets to investigate how dominance affects variation at the molecular level.
THEORY
For a given site, consider the case of irreversible mutation from an ancestral nucleotide A1 to a derived nucleotide A2, occurring at rate μ. When this mutation process is applied across many sites, it corresponds to the infinite-sites mutation model (Kimura 1968, 1971; Watterson 1975). Let 1, 1 + 2sh, and 1 + 2s be the relative fitnesses of the genotypes A1A1, A1A2, and A2A2, respectively. With random mating, this model is formally equivalent to models of frequency-dependent selection where fitness is linearly related to allele frequency (e.g., Cherry 2004). Under the usual assumptions of the Wright-Fisher model (random mating, constant population size, nonoverlapping generations), Wright (1938) derived the quasi-stationary distribution of allele frequency for the above diploid selection scheme. Kimura (1964) later derived a more concise form,
 |
1 |
where q is the frequency of the derived nucleotide, and γ = 2Ns. Note that this expression is equivalent to Griffiths' (2003) expression (32) for the distribution of allele frequencies under stationarity, which was derived in a different manner. This can be demonstrated by substituting μ(x) = 4γ(h + (1 − 2h)x)x(1 − x) and σ2(x) = x(1 − x) into expressions (12), (13), (14), and (32) in Griffiths (2003).
Expanding to multiple sites, if each site is independent, then the mutant allele frequency at each site is a random draw from the above distribution, with the relative density of the distribution proportional to the mutation rate (Sawyer and Hartl 1992). To estimate the parameters of the above distribution, consider polymorphism data in the form of a site frequency spectrum. If outgroup sequence data are available so that ancestral and derived nucleotides can be distinguished, then the site frequency spectrum is a vector, x, where each entry, xi, is a count of the number of sites at which the derived nucleotide is represented i times in a sample of size n, for i = 1, 2, … , n − 1. For a given allele frequency, q, at a given site, the probability of choosing i derived nucleotides in a sample of n individuals is given by a binomial distribution with mean nq. Thus, the expectation of each of the xi is θF(n, i; γ, h), where
 |
2 |
θ = 4Nμ, and μ is the per-generation mutation rate in the entire region sampled. Further, if a Poisson number of mutations enter the population each generation, then each of the xi will be Poisson distributed (Ewens 1974; Sawyer and Hartl 1992). With the full probability distribution of each entry of the site frequency spectrum, the model parameters θ, h, and γ can be estimated using maximum-likelihood methods.
Kimura (1964) also derived the fixation rate under the dominance model. Measuring time in 2N generations, the instantaneous fixation rate at stationarity is
 |
3 |
Note that u(γ, h) is equal to the stationary distribution (1), evaluated at q = 1. PRF theory predicts that the number of fixations over an arbitrary length of time, τ, will be Poisson distributed with mean
 |
4 |
For example, if two species diverged tdiv generations ago, and both species have the same population size N, then the expected number of fixed differences observed in a sample from the two species is
 |
5 |
where n1 and n2 are the sample sizes in the two populations.
The effects of various types of nonadditive allelic interactions on the stationary distribution of allele frequency are shown in Figure 1. Also shown are the expected site frequency spectra for different combinations of the selection (γ) and dominance (h) parameters. Note that h = 0.5 corresponds to genic selection. For negative selection (γ < 0), the density of the stationary distribution, and hence the expected number of segregating sites in the site frequency spectrum, is negatively related to h. This result is straightforward: the more recessive the deleterious nucleotide is, the more likely it is to drift to observable frequencies. For positive selection (γ > 0), the effect of dominance on the stationary distribution is more subtle. For high allele frequencies, the density of the stationary distribution is positively related to h. This is due to the fact that, once a dominant, advantageous mutation has attained high frequency (e.g., q = 0.9), the sojourn time to fixation will be relatively long because the ancestral homozygote genotype will be rare. More surprisingly, at very low frequencies the dominance parameter does not strongly affect the density of the stationary distribution. One might expect to observe a relative excess of recessive, advantageous mutations at low frequencies because additive and dominant mutations attain high frequency much faster. However, this force is apparently counterbalanced by the greater probability of stochastic loss of the recessive mutations. In the case of heterozygote advantage (h > 1 for γ > 0, or h < 0 for γ < 0), there is sometimes an interior mode in the stationary distribution. This mode is centered on the deterministic prediction for the stable equilibrium allele frequency (Fisher 1922, 1930; Haldane 1926; Wright 1931), which, using our parameterization, occurs at q̃ = (h − 1)/(2h − 1).
Figure 1.—

The stationary distribution of allele frequencies (top row) and the expected site-frequency spectrum (bottom row) for various values of the dominance parameter, h, and the selection parameter, γ. The left-hand column depicts the case of negative selection (γ = −10), and the right-hand column depicts the case of positive selection (γ = 10). The expected site-frequency spectra were generated with n = 15 and the scaled mutation parameter was set at θ = 20.
Maximum-likelihood estimation conditioning on the number of segregating sites:
Because  , and because each of the xi are Poisson distributed, the joint probability of the xi conditional on S is given by the multinomial distribution with n − 1 frequency classes, and the probability of each class is
 |
6 |
The denominator of the expression (5) is the expectation of S. Also note that the mutation parameter will cancel. The log-likelihood of a given site frequency spectrum is then
 |
7 |
Maximum-likelihood estimates of γ and h can be obtained by finding the maximum of (7) using standard optimization techniques. We investigate the sampling properties of these MLEs using both asymptotic-likelihood theory and stochastic simulations.
Asymptotic-likelihood theory predicts that, for large sample sizes (in our case the number of segregating sites), the joint sampling distribution of our MLEs will be multinormally distributed (Kendall and Stuart 1973), with means given by the underlying true values of γ and h and a variance-covariance matrix given by the inverse of the Fisher information matrix I:
 |
8 |
Thus the direct way to predict the sampling variance and covariance is to calculate the second derivatives of the log-likelihood function and evaluate their expectations. Let Fi be shorthand for F(n, i; γ, h). The first derivatives of the log-likelihood function in γ and h are
 |
9a |
 |
9b |
exchanging the order of integration and the derivative, we have
 |
10a |
 |
10b |
where the first derivatives of f are given in the appendix. The second derivatives of the log-likelihood function are
 |
11a |
 |
11b |
 |
11c |
where
 |
12a |
 |
12b |
 |
12c |
and
 |
13a |
 |
13b |
 |
13c |
The expressions for the second derivatives of f are also given in the appendix. To arrive at the entries of the Fisher information matrix, we evaluate the expectations of second derivatives of ℓ, noting that the T terms do not depend on xi,
 |
14a |
 |
14b |
 |
14c |
where  . The inverse of I is
 |
15 |
Therefore, the sampling variances and covariances of the MLEs for the selection parameter, γ, and the dominance parameter, h, are
 |
16a |
 |
16b |
 |
16c |
When investigating the sampling properties of the MLEs, we utilize assumed underlying “true” values of γ and h in evaluating E[xi] and the various T- - terms. In practice, one may approximate the sampling variances and covariance of the parameter estimates by substituting the MLEs into expressions (16).
Sampling properties of γ̂ and ĥ:
The asymptotic joint sampling distribution of γ̂ and ĥ is shown in Figure 2 for a reasonable sample size (n = 25), a large number of segregating sites (S = 10,000), and several underlying true values of γ and h. Also shown are the simulated joint sampling distributions (see below for details of the simulations). In general, the estimation procedure seems to perform exceptionally well when data are gathered from a large number of segregating sites: The entries of the variance-covariance matrix are small, and simulated MLEs cluster tightly around true values. Also, the agreement between the asymptotic prediction for the joint sampling distribution of our MLEs and the simulated distribution is generally quite good. These results indicate that it is possible to estimate dominance parameters from DNA polymorphism data alone. The main exception to this result is the case of strongly deleterious (γ < −5) and at least partially dominant (h > 0.5) mutations. In this region of the parameter space, the sampling variances and covariance of γ̂ and ĥ become extremely large. For instance, for γ = −20 and h = 0.8, the asymptotic prediction for the 95% confidence interval on ĥ is 0.8 ± 4.11, and the 95% confidence interval on γ̂ is −10 ± 98.71. In this situation, one will have virtually no power to make inferences or to reject null hypotheses such as γ = 0 (neutrality) or h = 0.5 (genic selection). Fortunately, though, quantitative genetic analyses (e.g., Simmons and Crow 1977; Crow and Simmons 1983; Willis 1999; Kelly 2003) suggest that strongly deleterious mutations tend to be recessive. Also, biochemical models (Kacser and Burns 1981) suggest that mutations of large effect will tend to be recessive. To summarize, the one situation where our estimator performs poorly is thought to occur rarely in natural populations.
Figure 2.—
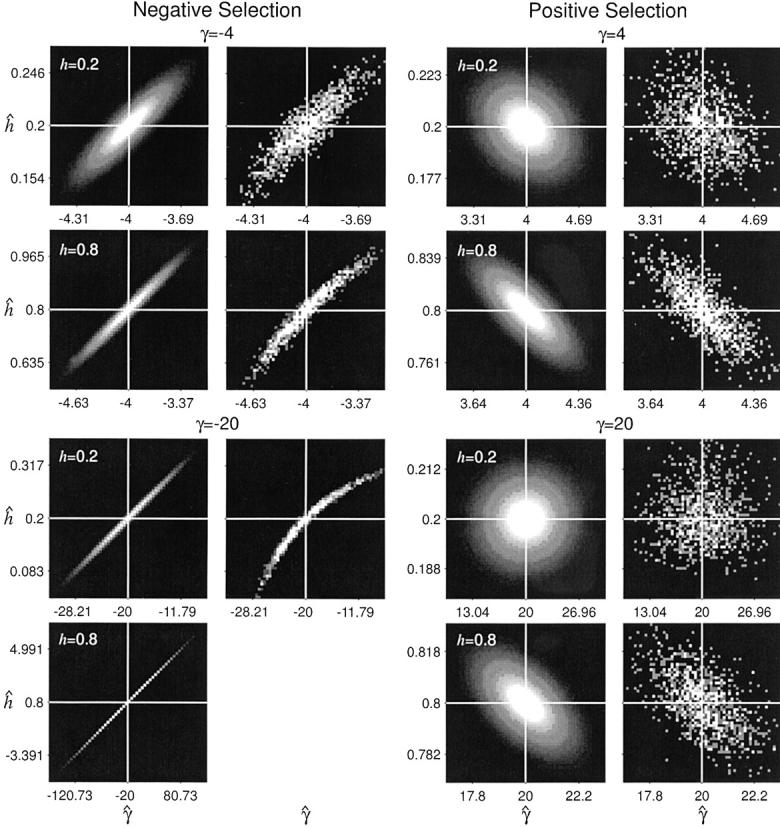
The asymptotic and simulated joint sampling distributions for maximum-likelihood estimates of the selection (γ̂) and dominance (ĥ) parameters. The white lines indicate the underlying true values. Each plot ranges ±3 asymptotic standard deviations from the true values in each axis (γ̂ and ĥ), and tick marks are drawn at ±2 asymptotic standard deviations from the means. The plots were generated with S = 10,000 and n = 25. Simulations for partially dominant, strongly deleterious mutations (γ = −20, h = 0.8) are not shown due to the computational difficulty of optimizing the likelihood function in this region of the parameter space.
Thus far we have reported results for a large number of segregating sites, with the presumption that the method would be applied at the genomic level to large SNP data sets, and we have found that the estimation procedure works surprisingly well in this situation for most parameter combinations. For smaller data sets (S < 100), our ability to simultaneously estimate the selection and dominance parameters is greatly diminished. Noting that E[xi] ∝ S, we see that the sampling variance and covariance terms in expressions (15) are inversely proportional to S. This hyperbolic dependence on S is reflected in Figure 3, which shows the standard deviation of the MLEs as a function of S.
Figure 3.—
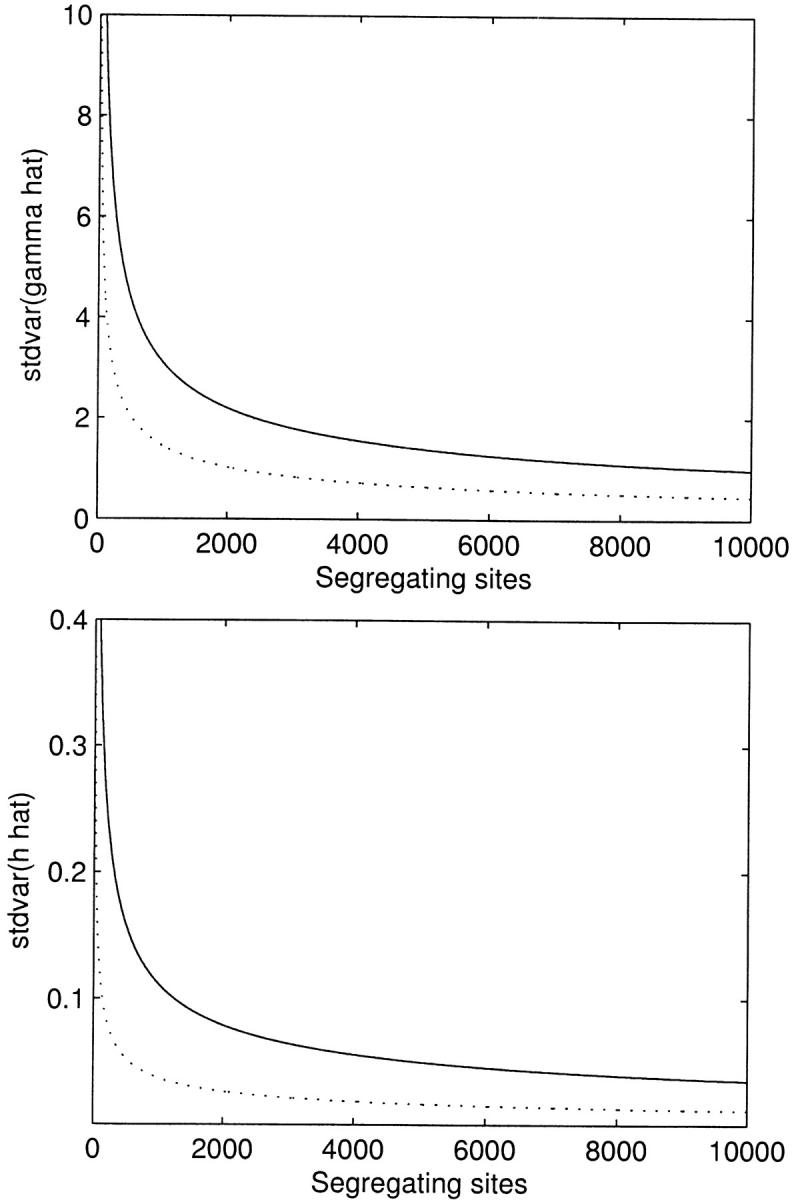
The asymptotic standard deviation of the maximum-likelihood estimates for the selection (γ̂) and dominance (ĥ) parameters as a function of the observed number of segregating sites. Solid lines represent underlying true values of γ = −10 and h = 0.2, and dotted lines represent the case of γ = 10 and h = 0.8. n = 25 for all curves.
Power to detect nonadditive allelic interactions:
The two-parameter model with selection and dominance can be compared to the one-parameter basic PRF model (Sawyer and Hartl 1992) by employing a likelihood-ratio test (LRT). Here, genic selection (h = 0.5) is the null hypothesis and the LRT statistic, 2(ℓ(γ̂, ĥ|x) − ℓ(γ̂o, 1/2|x)), is expected to be chi-square distributed with 1 d.f. under the asymptotic assumption (γ̂o denotes the maximum-likelihood estimate of the selection parameter under the assumption of genic selection). We conducted stochastic simulations to determine the statistical power (probability of rejecting genic selection) this test has in detecting deviations from strictly genic selection. The simulation procedure is straightforward. First, to simulate data, we conducted S pseudo-random draws from a multinomial distribution with n − 1 classes, where the probability of each class is given by expression (6). Using this simulated data, the likelihood function (7) was evaluated using the extended midpoint numerical integration algorithm (Press et al. 1988, Chap. 4) and then maximized using the Fletcher-Reeves-Polak-Ribiere optimization routine (Press et al. 1988, Chap. 10). The likelihoods from the two different models were then compared using the LRT statistic. This procedure was repeated 1000 times for each parameter combination, using the 190-node Computational Biology Service Unit cluster at the Cornell Theory Center (www.tc.cornell.edu).
Statistical power, i.e., the proportion of tests that reject the null hypothesis, is shown in Figure 4 as a function of the dominance parameter h. Results are not reported for dominant, strongly deleterious mutations (γ = 20 and h > 0.5) because the large sampling variances of the MLEs in this region of the parameter space made it difficult to optimize the likelihood function. In general, given enough segregating sites, the LRT is extremely powerful in detecting deviations from the genic selection model, even for very weak selection (|γ| < 5) and incomplete dominance (0 < h < 1, h ≠ 0.5). This indicates that the “signature” of nongenic selection is evident from patterns of DNA sequence polymorphism, and it is indeed possible to identify nongenic selection and estimate dominance parameters. Figure 4 also shows that, above n = 25, the sample size makes very little difference in one's ability to detect departures from genic selection. However, an increase in the observed number of segregating sites can make a substantial difference in statistical power. Despite the positive relationship between power and the number of segregating sites, we do observe appreciable power even for a small number of segregating sites in some situations. For example, if advantageous mutations are completely dominant or completely recessive, statistical power is high even for S = 100.
Figure 4.—

Statistical power (fraction of tests that reject the null hypothesis) of the likelihood-ratio test to reject genic selection, shown as a function of the dominance parameter, h. Power was evaluated by simulating 1000 independent data sets for each parameter combination and then applying the likelihood-ratio test for each data set.
In estimating statistical power, we have made the asymptotic assumption that our LRT statistic is chi-square distributed. To assess the validity of this assumption, we conducted several simulations under the null hypothesis of genic selection. If the asymptotic assumption is appropriate, then the 95% quantile of our simulated LRT statistics should closely approximate the 95% (P = 0.05) critical value of the chi-square distribution with 1 d.f. The 95% quantiles of our simulated LRTs are shown in Table 1 for several combinations of the selection parameter, sample size, and number of segregating sites. In general, the simulated critical values are very close to the chi-square critical value. Also, the simulated distribution of the LRT statistic closely conforms to the chi-square distribution with 1 d.f. Some example distributions are shown in Figure 5.
TABLE 1.
Simulated critical values for the likelihood-ratio test (LRT) of genic selection for different values of the selection parameter, sample size, and observed number of segregating sites
| γ | n | S | 95% critical value |
Fraction rejected assuming χ21 |
|---|---|---|---|---|
| −4 | 25 | 100 | 3.54 | 0.04 |
| 1,000 | 4.23 | 0.061 | ||
| 10,000 | 4.06 | 0.056 | ||
| 50 | 100 | 3.81 | 0.049 | |
| 1,000 | 4.04 | 0.054 | ||
| 10,000 | 3.78 | 0.048 | ||
| 4 | 25 | 100 | 3.64 | 0.045 |
| 1,000 | 3.89 | 0.052 | ||
| 10,000 | 3.86 | 0.051 | ||
| 50 | 100 | 3.78 | 0.048 | |
| 1,000 | 3.83 | 0.050 | ||
| 10,000 | 4.15 | 0.065 | ||
| 20 | 25 | 100 | 3.86 | 0.051 |
| 1,000 | 3.94 | 0.053 | ||
| 10,000 | 3.42 | 0.033 | ||
| 50 | 100 | 3.52 | 0.039 | |
| 1,000 | 3.91 | 0.051 | ||
| 10,000 | 3.65 | 0.044 |
Asymptotic likelihood theory predicts that the 95% critical value is 3.84. Also shown is the null rejection rate at P = 0.05 under the asymptotic assumption that the LRT statistic is chi-square distributed.
Figure 5.—
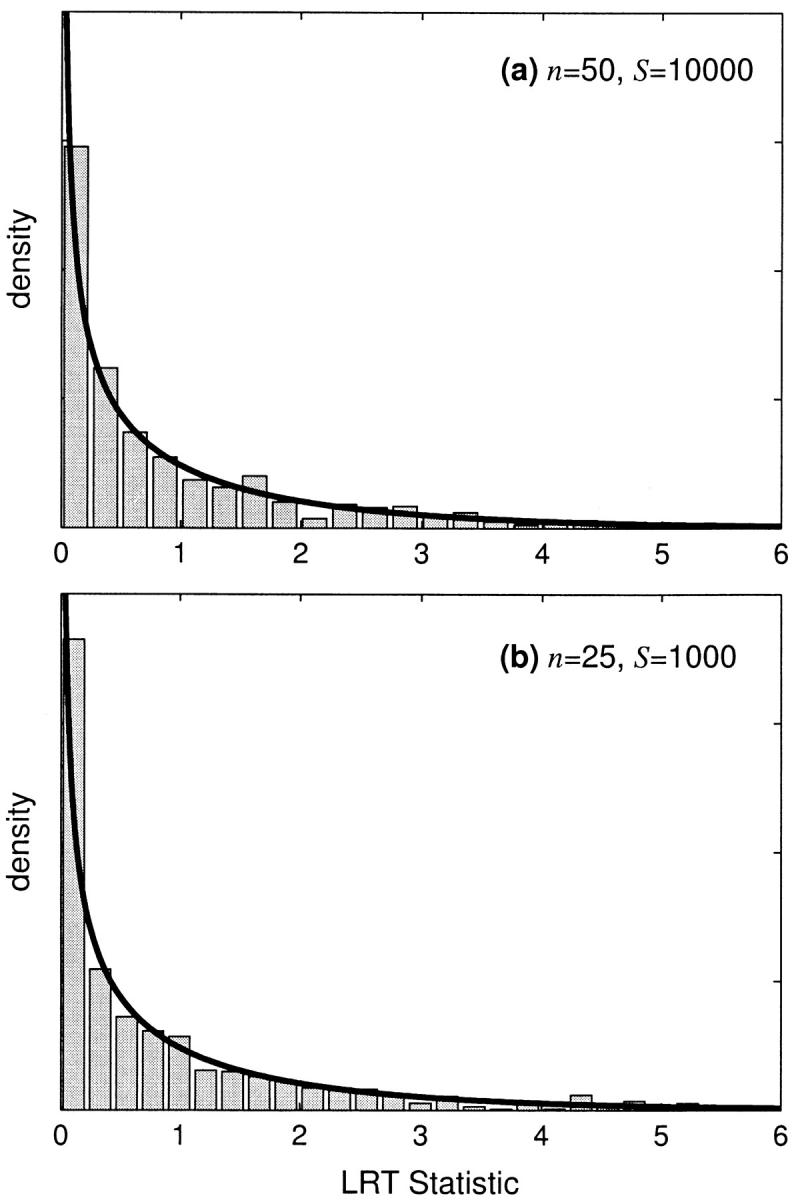
The simulated null distribution of the likelihood-ratio test statistic for nongenic selection. The null hypothesis is no dominance (h = 0.5). The solid line is the asymptotic prediction for the null distribution. Null distributions are shown for (a) weak negative selection with γ = −4 and (b) weak positive selection with γ = 4.
Bias in estimating selection parameters:
To assess the bias caused by estimating selection in the presence of unacknowledged dominance relations, we simulated data for various degrees of dominance and then estimated the selection parameter assuming the one-parameter genic-selection model. The relative bias due to unacknowledged dominance relations is shown in Figure 6. Dominance can have a major impact on the genic-selection estimate of the selection parameter, especially for the case of strong positive selection. If new mutations are advantageous but recessive, then the genic-selection model substantially underestimates the selection parameter, to the point that one sometimes incorrectly identifies negative, rather than positive, selection. If new mutations are advantageous and dominant, then the genic-selection model yields large to extreme overestimates of the selection parameter, even for slightly dominant mutations (0.5 < h < 0.7). Our genic-selection estimates of the selection parameter were sometimes pushed to the upper limit (γ = 100) of the range of possible selection parameters that we allowed in our simulations. In general, the genic-selection model for the site-frequency spectrum does not reliably characterize nongenic, positive selection. For the case of negative selection, the bias introduced by dominance relations is less extreme, but still substantial. In general, if new mutations are deleterious and at least partially recessive, then one tends to overestimate the selection parameter. The opposite pattern is observed if new mutations are deleterious and partially dominant; i.e., one tends to underestimate the selection parameter.
Figure 6.—

Genic selection estimates of the selection parameter, γ, obtained by simulating site-frequency spectra with varying degrees of dominance relations. Dashed lines indicate the true value of γ in the simulation; deviations from this line indicate bias. Error bars indicate 95% confidence limits on the maximum-likelihood estimate, and points marked with a star indicate that the mean maximum-likelihood estimate was >100, the maximum value allowed by our simulations. Simulations were performed with n = 25, conditional on the observed number of segregating sites at S = 10,000.
Given the sometimes extreme bias in the genic-selection estimate of the selection parameter, we require some criteria to determine when it is appropriate to apply the genic-selection model to data in the form of a site-frequency spectrum. A simple chi-square goodness-of-fit test is appropriate for this purpose. Under genic selection, the following statistic should be chi-square distributed with n − 3 d.f.,
 |
17 |
where
 |
18 |
In our simulations, this goodness-of-fit test leads us to convincingly reject the genic-selection model in cases where the genic-selection estimate of the selection parameter is strongly biased. For example, for γ = 20 and h = 0.7, the average MLE of γ under the genic-selection model is γ̂o = 66.9. In this case, the average goodness-of-fit statistic over 1000 simulations has a P-value <10−100.
McDonald-Kreitman polymorphism and divergence data:
The McDonald-Kreitman test of neutrality (McDonald and Kreitman 1991) contrasts the ratios of polymorphism to divergence across different classes of mutations. If one of the classes (e.g., synonymous sites) is thought to evolve neutrally for a priori reasons, this class can be used as a “neutral standard,” and the ratio of polymorphism to divergence from the potentially selected class (e.g., nonsynonymous sites) can be compared to this standard to detect the action of selection. Because the McDonald-Kreitman test is based on an observed standard for neutral evolution in the particular population in question, it is fairly robust to demographic deviations from the equilibrium neutral model, such as population subdivision or fluctuating population size (McDonald and Kreitman 1991; Akashi 1999; Nielsen 2001). Therefore, results of a McDonald-Kreitman test are often easier to interpret than those of many other neutrality tests, such as Tajima's (1989) D-test and Fu and Li's (1993) series of tests, which are sensitive to demographic, as well as selective, forces (e.g., Golding 1997).
The original McDonald-Kreitman test (McDonald and Kreitman 1991) was devised as a 2 × 2 contingency table analysis. As an alternative, Sawyer and Hartl (1992) developed a maximum-likelihood framework for analyzing polymorphism and divergence, which allows the estimation of selection, mutation, and divergence time parameters, as well as hypothesis testing. Let Sn, Ss, Dn, and Ds be the observed numbers of nonsynonymous polymorphisms, synonymous polymorphisms, nonsynonymous fixed differences, and synonymous fixed differences, respectively (hereafter referred to as McDonald-Kreitman data). With the usual assumptions of the PRF model (see above), one can obtain parameter estimates by setting the observed values to their expectations under the PRF model and then solving for the parameters. These estimates, derived using the method of moments, are equivalent to the maximum-likelihood estimates (Sawyer and Hartl 1992). Note that it is not possible to estimate additional parameters, such as the dominance parameter, from these types of data because, under genic selection, there are four equations and four unknown parameters: the nonsynonymous and synonymous nonlethal mutation rates, the divergence time, and the selection parameter. Therefore, without prior knowledge of some of the parameters, McDonald-Kreitman data contain no additional information regarding dominance.
Even though it is not possible to estimate dominance parameters from McDonald-Kreitman data, we can still investigate how dominance relations affect parameter estimates obtained using McDonald-Kreitman data under the assumption of genic selection. This is important because, even though the McDonald-Kreitman test and Sawyer and Hartl's parametric methods are thought to be robust to deviations from an ideal population model (e.g., nonrandom mating, nonstationary population size), it is not known how sensitive this approach is to deviations from the assumed form of selection. Using fixed values for the mutation rate and divergence time (the divergence time is usually estimated from synonymous sites, and the mutation rate does not need to be estimated to estimate the selection parameter), we simulated nonsynonymous polymorphism and divergence data for several values of the selection and dominance parameters and then estimated the selection parameter under genic selection. For each iteration, the number of nonsynonymous segregating sites was drawn from a Poisson distribution with mean
 |
19 |
and the number of nonsynonymous fixed differences was drawn from a Poisson distribution with mean
 |
20 |
Given these simulated data, we estimated the selection parameter, γ, under genic selection by numerically solving Equation 22 in Sawyer and Hartl (1992).
The bias in Sawyer and Hartl's (1992) estimate of the selection parameter is shown in Figure 7 as a function of the degree of dominance. Surprisingly, dominance relations, including the case of weak overdominance, have very little impact on estimates of γ obtained assuming genic selection. This is due to the fact that dominance has a similar effect on both polymorphism and divergence. Conditional on the scaled divergence time, τ, which is generally estimated from synonymous sites, Sawyer and Hartl's estimate of the selection parameter depends solely on the ratio of nonsynonymous polymorphism to divergence. Therefore, if dominance has a similar effect on polymorphism and divergence, then it will not appreciably affect estimates of the selection parameter. For instance, in the case of positive selection, an increase in the dominance parameter causes both an increase in the level of polymorphism and an increase in the fixation rate (Figure 8). If these effects roughly cancel out in a ratio of polymorphism to divergence, then Sawyer and Hartl's method would be insensitive to nongenic selection. The ratio of the expected number of polymorphisms to the expected number of fixed differences is shown in Figure 9 for several different values of dominance parameter, h. Dominance relations have very little impact on the ratio of polymorphism to divergence, which explains why we observe so little bias in the genic-selection estimate. Wakeley (2003) recently demonstrated that, when applied to McDonald-Kreitman data, Sawyer and Hartl's method is robust to the assumption of random mating by applying an island model of population structure. Using simulations, Weinreich and Rand (2000) demonstrated that McDonald-Kreitman ratios—and, consequently, Sawyer and Hartl's estimate of the selection parameter—are not sensitive to dominance relations for a limited range of the dominance parameter (0 ≤ h ≤ 1 in our notation, 0 ≤ h ≤ 2 in their notation). Our results indicate that this is also true of weakly overdominant and underdominant mutations.
Figure 7.—

Genic selection estimates of the selection parameter, γ, obtained by simulating polymorphism and divergence data with varying degrees of dominance relations. Dashed lines indicate the true value of γ in the simulation. Note that, for γ = −5, the estimate γ̂ is biased even in the case of genic selection because we conditioned on observing at least one segregating site and one fixed difference in the sample. For each simulation, the divergence time, τ, was fixed at τ = 10, n = 25, and θ = 50. Error bars indicate the 95% confidence limits of γ̂.
Figure 8.—

The substitution rate, u(γ, h), as a function of the strength of selection, γ = 2Ns, for different values of the dominance parameter, h. Because the neutral substitution rate is 1, this plot also predicts the ratio of nonsynonymous to synonymous fixed differences, i.e., the dN/dS ratio.
Figure 9.—

The log-transformed ratio of the expected number of polymorphisms to the expected number of fixed differences as a function of the selection parameter, γ, for several different values of the dominance parameter, h. The ratio is plotted relative to the ratio under neutrality (E[Sn]/E[Dn] = 1 at γ = 0).
The effect of heterozygote advantage (h > 1 for γ > 0, or h < 0 for γ < 0) on McDonald-Kreitman data deserves special attention. Heterozygote advantage is a special case of balancing selection, and its effect on polymorphism and divergence approximates the effect of several other types of balancing selection (Wright and Dobzhansky 1948; Denniston and Crow 1990; Takahata and Nei 1990). One might expect that balancing selection should cause an increase in the ratio of nonsynonymous polymorphism to divergence because balancing selection actively maintains polymorphisms. In our results from the case of heterozygote advantage, we have assumed the best-case scenario for detecting balancing selection: every new mutation is independent and subject to heterozygote advantage, yet we see that the ratio of polymorphism to divergence is actually sometimes less than the neutral standard. This occurs when the derived homozygote is more fit than the ancestral homozygote and the degree of heterozygote advantage is fairly weak (h = 1.3, γ > 0 in Figure 9). As the strength of heterozygote advantage increases (i.e., γ and h increase) and allele frequencies are more tightly maintained at intermediate frequencies, this trend reverses because the level of polymorphism increases faster than the fixation rate (h = 2, γ > 6 in Figure 9). However, we submit that McDonald-Kreitman tables provide information regarding balancing selection that is ambiguous at best—if heterozygote advantage is weak or moderate, then significant results could be interpreted as positive directional selection rather than balancing selection.
DISCUSSION
Dominance plays a very important role in a number of evolutionary phenomena at the heart of population genetics. For instance, a central controversy in evolutionary genetics has been the dispute over whether a balance between deleterious mutations and purifying selection can account for the bulk of genetic variation in fitness-related traits (e.g., Lewontin 1974). Alternative explanations suggest that selection actively maintains genetic variation via frequency-dependent selection, variation in selection intensity over time and space, heterozygote advantage, or other higher-order processes. Theoretical models of deleterious mutation/purifying selection balance depend primarily on the deleterious mutation rate and the product of the selection and dominance parameters (e.g., Charlesworth and Hughes 2000). Therefore, assessing the validity of the deleterious mutation hypothesis will require characterizing both selection and dominance at the level of the entire genome.
In the fields of molecular population genetics and molecular evolution, there has been a growing consensus that weak negative selection plays an important role in evolution (e.g., Ohta 1992). Virtually all of the arguments in support of this finding are based on the assumption of genic selection. However, if moderately or strongly deleterious mutations tend to be recessive, they could “appear” to be weakly selected on the basis of their frequency profile. For instance, we have shown that nongenic selection can strongly bias estimates of the selection parameter that are based on the site-frequency spectrum. To address whether the apparent signal of weak purifying selection is actually due to more deleterious, but recessive, mutations, it will be necessary to quantify both selection and dominance parameters. The analyses presented here are a first step toward that goal.
At the level of the phenotype, two independent lines of evidence suggest that dominance plays an important role in shaping polymorphism and divergence in fitness-related traits. The first line of evidence is the simple observation of inbreeding depression, i.e., the reduction in offspring fitness due to inbreeding. The two leading explanations of inbreeding depression are: (1) Fitness is reduced because inbreeding “unmasks” deleterious recessives, and (2) fitness is reduced because fewer overdominant loci occur in the heterozygous state (see Lynch and Walsh 1998, Chap. 10 for an overview of the two hypotheses). Both explanations are based on dominance relations among segregating, nonneutral alleles at many loci. The second line of evidence comes from speciation genetics: Growing consensus supports the dominance theory (Muller 1942; Turelli and Orr 1995) of Haldane's rule (Haldane 1922; Orr 1997). Haldane's rule is an observation from studies of postzygotic isolation between species with chromosomal sex determination. It states that, in hybrid crosses between species, if only one sex is inviable or infertile, it will be the heterogametic sex. Recent analyses (Turelli and Begun 1997; Presgraves and Orr 1998) strongly support the hypothesis that Haldane's rule is due to dominance relations in sex-chromosome-linked “speciation genes,” i.e., genes at which fixed differences between lineages contribute to postzygotic isolation. Given the importance of dominance in shaping both polymorphism and divergence at the phenotypic level, and given the implications of dominance for evolutionary theory, there is an urgent need to quantify patterns of nongenic selection at the molecular level.
In this article we have made the somewhat artificial assumption that all new mutations have the same fitness effect. An obvious extension to this method is to allow variable fitness and dominance effects by assuming that the effects of each new mutation are drawn from some bivariate distribution and then integrating over all possible fitness and dominance effects to arrive at predictions for the stationary distribution of allele frequency. This approach is computationally challenging because it requires numerically evaluating complicated four-dimensional integrals during each evaluation of the likelihood function. We have also assumed high levels of recombination between sites. This assumption may be appropriate for SNPs distributed across a genome, but it does not apply to small regions with limited or no recombination such as single protein-coding genes or animal mitochondrial genomes. It may be possible to address this problem using a composite-likelihood approach (Hudson 2001).
Acknowledgments
We thank J. F. Crow, J. K. Kelly, and R. Nielsen for very helpful discussions and suggestions. Two anonymous reviewers greatly improved the manuscript. This research was conducted using the resources of the Cornell Theory Center, which receives funding from Cornell University, New York State, federal agencies, foundations, and corporate partners. C.D.B. is supported by a U.S. Department of Agriculture-HATCH grant (NYC-151411) and National Science Foundation grant 0319553.
APPENDIX
To evaluate the first and second derivatives of the stationary distribution, f, we apply the product rule from calculus several times and exchange the order of integration and derivation when necessary. The first derivatives in γ and h are then
 |
A1a |
 |
A1b |
where
 |
A2a |
 |
A2b |
And the second derivatives are
 |
A3a |
 |
A3b |
 |
A3c |
References
- Akashi, H., 1999. Inferring the fitness effects of DNA mutations from polymorphism and divergence data: statistical power to detect directional selection under stationarity and free recombination. Genetics 151: 221–238. [DOI] [PMC free article] [PubMed] [Google Scholar]
- Bustamante, C. D., J. Wakeley, S. A. Sawyer and D. L. Hartl, 2001. Directional selection and the site-frequency spectrum. Genetics 159: 1779–1788. [DOI] [PMC free article] [PubMed] [Google Scholar]
- Bustamante, C. D., R. Nielsen, S. A. Sawyer, K. M. Olsen, M. D. Purugganan et al., 2002. The cost of inbreeding: fixation of deleterious genes in Arabidopsis. Nature 416: 531–534. [DOI] [PubMed] [Google Scholar]
- Bustamante, C. D., R. Nielsen and D. L. Hartl, 2003. Maximum likelihood and Bayesian methods for estimating the distribution of selective effects among classes of mutations using DNA polymorphism data. Theor. Popul. Biol. 63: 91–103. [DOI] [PubMed] [Google Scholar]
- Charlesworth, B., and K. A. Hughes, 2000 The maintenance of genetic variation in life-history traits, pp. 369–392 in Evolutionary Genetics: From Molecules to Morphology, edited by R. S. Singh and C. B. Krimbas. Cambridge University Press, Cambridge, UK.
- Cherry, J. L., 2003. Selection in a subdivided population with dominance or local frequency dependence. Genetics 163: 1511–1518. [DOI] [PMC free article] [PubMed] [Google Scholar]
- Cherry, J. L., 2004. Selection, subdivision and extinction and recolonization. Genetics 166: 1105–1114. [DOI] [PMC free article] [PubMed] [Google Scholar]
- Crow, J. F., 1993 Mutation, mean fitness, and genetic load, pp. 3–42 in Oxford Surveys in Evolutionary Biology, Vol. 9, edited by D. J. Futuyma and J. Antonovics. Oxford University Press, Oxford.
- Crow, J. F., and M. J. Simmons, 1983 The mutation load in Drosophila, pp. 1–35 in The Genetics and Biology of Drosophila, Vol. 3c, edited by M. Ashburner, H. L. Carson and J. N. Thompson. Academic Press, New York.
- Denniston, C., and J. F. Crow, 1990. Alternative fitness models with the same allele frequency dynamics. Genetics 125: 201–205. [DOI] [PMC free article] [PubMed] [Google Scholar]
- Ewens, W. J., 1974. A note on the sampling theory for infinite alleles and infinite sites models. Theor. Popul. Biol. 6: 143–148. [DOI] [PubMed] [Google Scholar]
- Fisher, R. A., 1922. On the dominance ratio. Proc. R. Soc. Edinb. 50: 205–220. [Google Scholar]
- Fisher, R. A., 1930 The Genetical Theory of Natural Selection. Clarendon Press, Oxford.
- Fu, Y.-X., and W.-H. Li, 1993. Statistical tests of neutrality of mutations. Genetics 133: 693–709. [DOI] [PMC free article] [PubMed] [Google Scholar]
- Golding, G. B., 1997 The effect of purifying selection on genealogies, pp. 271–285 in Progress in Population Genetics and Human Evolution (IMA Volumes in Mathematics and Its Applications, Vol. 87), edited by P. Donnelly and S. Tavare. Springer, New York.
- Griffiths, R. C., 2003. The frequency spectrum of a mutation, and its age, in a general diffusion model. Theor. Popul. Biol. 64: 241–251. [DOI] [PubMed] [Google Scholar]
- Haldane, J. B. S., 1922. Sex ratio and unisexual sterility in animal hybrids. J. Genet. 12: 101–109. [Google Scholar]
- Haldane, J. B. S., 1926. A mathematical theory of natural and artificial selection. Part III. Proc. Camb. Philos. Soc. 23: 363–372. [Google Scholar]
- Hartl, D. L., E. N. Moriyama and S. A. Sawyer, 1994. Selection intensity for codon bias. Genetics 138: 227–234. [DOI] [PMC free article] [PubMed] [Google Scholar]
- Hudson, R. R., 2001. Two-locus sampling distributions and their application. Genetics 159: 1805–1817. [DOI] [PMC free article] [PubMed] [Google Scholar]
- Kacser, H., and J. A. Burns, 1981. The molecular basis of dominance. Genetics 97: 639–666. [DOI] [PMC free article] [PubMed] [Google Scholar]
- Kelly, J. K., 2003. Deleterious mutations and the genetic variance of male fitness components in Mimulus guttatus. Genetics 164: 1071–1085. [DOI] [PMC free article] [PubMed] [Google Scholar]
- Kendall, M. G., and A. Stuart, 1973 The Advanced Theory of Statistics, Vol. 2: Inference and Relationship. Charles Griffin & Co., London.
- Kimura, M., 1964. Diffusion models in population genetics. J. Appl. Prob. 1: 177–232. [Google Scholar]
- Kimura, M., 1968. Evolutionary rate at the molecular level. Nature 217: 624–626. [DOI] [PubMed] [Google Scholar]
- Kimura, M., 1971. Theoretical foundation of population genetics at the molecular level. Theor. Popul. Biol. 2: 174–208. [DOI] [PubMed] [Google Scholar]
- Lewontin, R. C., 1974 The Genetic Basis of Evolutionary Change. Columbia University Press, New York.
- Lynch, M., and B. Walsh, 1998 Genetics and Analysis of Quantitative Traits. Sinauer Associates, Sunderland, MA.
- McDonald, J. H., and M. Kreitman, 1991. Adaptive protein evolution at the Adh locus in Drosophila. Nature 351: 652–654. [DOI] [PubMed] [Google Scholar]
- Muller, H. J., 1942. Isolating mechanisms, evolution, and temperature. Biol. Symp. 6: 71–125. [Google Scholar]
- Nielsen, R., 2001. Statistical tests of selective neutrality in the age of genomics. Heredity 86: 641–647. [DOI] [PubMed] [Google Scholar]
- Ohta, T., 1992. The nearly neutral theory of molecular evolution. Annu. Rev. Ecol. Syst. 23: 263–286. [Google Scholar]
- Orr, H. A., 1997. Haldane's rule. Annu. Rev. Ecol. Syst. 28: 195–218. [Google Scholar]
- Presgraves, D. C., and H. A. Orr, 1998. Haldane's rule in species lacking a hemizygous X. Science 282: 952–954. [DOI] [PubMed] [Google Scholar]
- Press, W. H., B. P. Flannery, S. A. Teukolsky and W. T. Vatterling, 1988 Numerical Recipes in C. Cambridge University Press, Cambridge, UK.
- Roze, D., and F. Rousset, 2003. Selection and drift in subdivided populations: a straightforward method for deriving diffusion approximations and applications involving dominance, selfing and local extinctions. Genetics 165: 2153–2166. [DOI] [PMC free article] [PubMed] [Google Scholar]
- Sawyer, S. A., and D. L. Hartl, 1992. Population genetics of polymorphism and divergence. Genetics 132: 1161–1176. [DOI] [PMC free article] [PubMed] [Google Scholar]
- Simmons, M. J., and J. F. Crow, 1977. Mutations affecting fitness in Drosophila populations. Annu. Rev. Genet. 11: 49–78. [DOI] [PubMed] [Google Scholar]
- Tajima, F., 1989. Statistical method for testing the neutral mutation hypothesis by DNA polymorphism. Genetics 123: 585–595. [DOI] [PMC free article] [PubMed] [Google Scholar]
- Takahata, N., and M. Nei, 1990. Allelic genealogy under overdominant and frequency-dependent selection and polymorphism of major histocompatibility complex loci. Genetics 124: 967–978. [DOI] [PMC free article] [PubMed] [Google Scholar]
- Turelli, M., and D. J. Begun, 1997. Haldane's rule and X-chromosome size in Drosophila. Genetics 147: 1799–1815. [DOI] [PMC free article] [PubMed] [Google Scholar]
- Turelli, M., and H. A. Orr, 1995. The dominance theory of Haldane's rule. Genetics 140: 389–402. [DOI] [PMC free article] [PubMed] [Google Scholar]
- Wakeley, J., 2003. Polymorphism and divergence for island-model species. Genetics 163: 411–420. [DOI] [PMC free article] [PubMed] [Google Scholar]
- Watterson, G. A., 1975. On the number of segregating sites in genetical models without recombination. Theor. Popul. Biol. 7: 256–276. [DOI] [PubMed] [Google Scholar]
- Weinreich, D. M., and D. M. Rand, 2000. Contrasting patterns of nonneutral evolution in proteins encoded in nuclear and mitochondrial genomes. Genetics 156: 385–399. [DOI] [PMC free article] [PubMed] [Google Scholar]
- Whitlock, M. C., 2003. Fixation probability and time in subdivided populations. Genetics 164: 767–779. [DOI] [PMC free article] [PubMed] [Google Scholar]
- Willis, J. H., 1999. Inbreeding load, average dominance, and the mutation rate for mildly deleterious alleles in Mimulus guttatus. Genetics 153: 1885–1898. [DOI] [PMC free article] [PubMed] [Google Scholar]
- Wright, S., 1931. Evolution in Mendelian populations. Genetics 16: 97–159. [DOI] [PMC free article] [PubMed] [Google Scholar]
- Wright, S., 1938. The distribution of gene frequencies under irreversible mutation. Proc. Natl. Acad. Sci. USA 24: 253–259. [DOI] [PMC free article] [PubMed] [Google Scholar]
- Wright, S., and T. Dobzhansky, 1948. Genetics of natural populations. XII. Experimental reproduction of some of the changes caused by natural selection in certain populations of Drosophila pseudoobscura. Genetics 31: 125–156. [DOI] [PMC free article] [PubMed] [Google Scholar]