

Abstract
Dominance is a form of phenotypic robustness to mutations. Understanding how such robustness can evolve provides a window into how the relation between genotype and phenotype can evolve. As such, the issue of dominance evolution is a question about the evolution of inheritance systems. Attempts at explaining the evolution of dominance have run into two problems. One is that selection for dominance is sensitive to the frequency of heterozygotes. Accordingly, dominance cannot evolve unless special conditions lead to the presence of a high frequency of mutant alleles in the population. Second, on the basis of theoretical results in metabolic control analysis, it has been proposed that metabolic systems possess inherent constraints. These hypothetical constraints imply the default manifestation of dominance of the wild type with respect to the effects of mutations at most loci. Hence, some biologists have maintained that an evolutionary explanation is not relevant to dominance. In this article, we put into question the hypothetical assumption of default metabolic constraints. We show that this assumption is based on an exclusion of important nonlinear interactions that can occur between enzymes in a pathway. With an a priori exclusion of such interactions, the possibility of epistasis and hence dominance modification is eliminated. We present a theoretical model that integrates enzyme kinetics and population genetics to address dominance evolution in metabolic pathways. In the case of mutations that decrease enzyme concentrations, and given the mechanistic constraints of Michaelis-Menten-type catalysis, it is shown that dominance of the wild type can be extensively modified in a two-enzyme pathway. Moreover, we discuss analytical results indicating that the conclusions from the two-enzyme case can be generalized to any number of enzymes. Dominance modification is achieved chiefly through changes in enzyme concentrations or kinetic parameters such as kcat, both of which can alter saturation levels. Low saturation translates into higher levels of dominance with respect to mutations that decrease enzyme concentrations. Furthermore, it is shown that in the two-enzyme example, dominance evolves as a by-product of selection in a manner that is insensitive to the frequency of heterozygotes. Using variation in kcat as an example of modifier mutations, it is shown that the latter can have direct fitness effects in addition to dominance modification effects. Dominance evolution can occur in a frequency-insensitive manner as a result of selection for such dual-effects alleles. This type of selection may prove to be a common pattern for the evolution of phenotypic robustness to mutations.
IN the early days of Mendelian genetics, it became apparent that the effects of mutant alleles on the phenotype can be modified by both the environmental and genetic backgrounds (Tower 1910; Bridges 1913; Jennings 1917; Lancefield 1918; Timofeeff-Ressovsky 1927). This led to a debate on whether the prevalence of selectively advantageous phenotypes that are dominant with respect to mutant phenotypes results from selection for genetic backgrounds that lead to dominance (Fisher 1928a, 1931; Wright 1929a,b; Haldane 1930, 1939). Present opinions on whether this debate has been resolved are mixed (Porteous 1996; Keightley 1996a; Mayo and Burger 1997; Bourguet 1999). In this article, we present theoretical results indicating that the question of dominance evolution has not been resolved and that it requires further scrutiny.
Cast in different terms, the original question being addressed was whether the robustness of a phenotype with respect to mutations is a result of selection for robustness. Subsequent to the original query on dominance, this question has been extended to include the robustness of developmental processes with respect to underlying perturbations and referred to as developmental canalization. Depending on the nature of the perturbations involved, canalization can be further divided into either genetic or environmental (Waddington 1942; Schmalhausen 1949; Dunn and Fraser 1958; Sondhi 1960; Rendel 1967; Scharloo 1991; Stearns and Kawecki 1994; Gavrilets and Hastings 1994; Stearns et al. 1995; Wagner 1996; Wagner et al. 1997; Eshel and Matessi 1998; Rice 1998; Hartman et al. 2001). Dominance is a simple form of genetic canalization (Rendel 1967).
For the evolution of genetic canalization, a conceptual problem exists. The selection dynamics for the evolution of robustness is sensitive to the frequency with which genetic perturbations occur. This means sensitivity to both the initial frequency of mutants and the mutation rate. Genetic perturbations are generally less frequent than environmental perturbations; hence one might expect genetic canalization to evolve under a very restricted set of conditions (Wagner et al. 1997; Gibson and Wagner 2000). However, the prevalence of genetic canalization prompts the question of whether there are other scenarios that can lead to its evolution (de Visser et al. 2003). One possibility is that canalization evolves as a correlated side effect of a different property that is under selection. For example, it has been argued that selection for robustness to environmental perturbations (which are more frequent) can lead to robustness to genetic perturbations (Muller 1932; Plunkett 1933; Wagner et al. 1997; Meiklejohn and Hartl 2002). Heat-shock proteins are a possible example (Forsdyke 1994; Rutheford and Lindquist 1998; Fares et al. 2002). Another example is models of RNA folding and stability, which indicate that there is an inverse correlation between phenotypic robustness to mutations and phenotypic plasticity with respect to microenvironmental variation (Ancel and Fontana 2000). In all these examples, given that environmental perturbations are more frequent, the higher selective pressure for robustness to environmental perturbations can account for the evolution of robustness to genetic perturbations (provided that both forms of robustness share similar mechanisms). Further support for the idea that genetic canalization can evolve as a side effect of selection can be found in models of gene regulation networks. Specifically, it has been proposed that canalization may evolve as a result of selection for networks that quickly reach a steady state (Siegal and Bergman 2002; Stearns 2002, 2003; Bergman and Siegal 2003; Niven 2004). In another example, Papp et al. (2003) propose that in the case of phenotypes affected by protein-protein complexes, dominance may result from selective constraints that require the concentration of proteins to be balanced in a cell.
Early in the debate on dominance, a scenario that Wright (1929a)(b, 1934a, 1977) and Haldane (1930) considered was whether modifier alleles could have fitness effects that could be manifested independently of their dominance modification effects. Such a scenario would eliminate the complications associated with the problem of dominance evolution. Despite having been proposed at an early stage in the debate, the possibility of dual-effect alleles has not been further pursued in relation to this topic. Part of the reason is the influence of results from metabolic control analysis (MCA; Kacser and Burns 1981). Given linearizing assumptions that exclude saturation, certain results in MCA indicate that dominance is an inherent property of metabolism and that there are system level constraints on its modification. As a consequence, it has been argued that dominance is an inevitable property of metabolism and that the role of evolution is not relevant (Kacser and Burns 1981). The latter assertion is commonly used as an explanation of the tendency of mutant phenotypes to be recessive. However, the Kacser and Burns (1981) theory on dominance does not fit all the available evidence. An example is the variability of dominance for insecticide resistance in the mosquito Culex pipiens (Bourguet 1999). In one study, Bourguet et al. (1996) found that dominance levels of insecticide resistance can vary with environmental conditions. Subsequently, Bourguet et al. (1997) found that dominance levels of insecticide resistance at a given locus can vary depending on the resistant allele. Attempts to apply the Kacser and Burns (1981) framework to this system have led to conflicting results (Bourguet and Raymond 1998). Accordingly, in a subsequent work Otto and Bourguet (1999) formulate a population genetic framework for the evolution of dominance due to balanced polymorphisms. The case of insecticide resistance in C. pipiens is a good example of a need within the biological community for biochemical frameworks that can account for the possibility of dominance modification and evolution.
In this article we examine the problem of dominance evolution for metabolic phenotypes. We use a simple two-enzyme model that combines principles of enzyme kinetics and population genetics to address dominance evolution in metabolic physiology. By including nonlinearities such as enzyme saturation, our results indicate that dominance in metabolism can be easily modified by tuning saturation levels. We discuss analytical results that indicate that this conclusion can be generalized to sequential pathways with any number of enzymes. Furthermore, in the case of the two-enzyme pathways, it is shown that due to generic properties of biochemical kinetics, dominance can evolve through the selection of alleles with dual effects.
In the remainder of this Introduction, we explore some of the key conceptual issues that are relevant to the questions we address in this article. How and why do dominant phenotypes arise in Mendelian systems? Fisher sought to explain the observation that in diploid organisms a great proportion of mutant phenotypes are recessive with respect to the wild type (Fisher 1928a,b, 1929, 1931, 1934, 1958). He was influenced by observations that he made with Ford on melanic moths (Fisher and Ford 1926; Fisher 1927) and the work of Morgan et al. (1925) on Drosophila. Fisher postulated the evolution of dominance via the selection of alleles at modifier loci, which would diminish the detrimental effects of mutant alleles at a primary locus. Fisher's conception was important in several respects. It was the first population genetic model involving epistatic interactions between loci. Hence it allowed the evolution of mutational effects to be posed as a neo-Darwinian research problem. At a more general level, it was the first attempt at addressing the evolution of a genetic system.
Wright (1929a)(b, 1934a,b) and Haldane (1930)(1939) quickly pointed to a problem with Fisher's conception. In populations where the allele for the wild-type phenotype is near fixation, the selection coefficient for the modifier alleles at other loci will be sensitive to the frequency with which the mutant heterozygote appears in the population. This happens because the modifiers can exhibit only their dominance modification effects (i.e., heterozygote rescue) when in the presence of the mutant heterozygote. Hence, if we assume that dominance modifier alleles have no pleiotropic effects, then selection for dominance modifiers would be proportional to the mutation rate. Such selection coefficients would not be high enough to overcome drift in most populations. Later work has confirmed this conclusion and the general consensus is that for populations where an allele at a primary locus is near fixation, selection for modifiers at other loci cannot be much more effective than drift, unless the mutation rates are inordinately high (Ewens 1966; Sved and Mayo 1970; Feldman and Karlin 1971; Charlesworth 1979). On the other hand, it can be shown that in situations where the wild-type allele at the primary locus is not near fixation, and there is a high frequency of mutant alleles in the population, then dominance can evolve (Haldane 1956; Parsons and Bodmer 1961; Bodmer and Parsons 1962; Feldman and Karlin 1971; O'Donald and Barrett 1973; Wagner 1981; Bürger 1983a,b,c; Wagner and Burger 1985; Otto and Bourguet 1999). One example in which the frequency of mutant heterozygotes can be maintained at a high level is when the mutant heterozygote is maintained by a balanced polymorphism. In such circumstances, it can be shown that dominance can evolve through selection for modifier alleles (Clarke and Sheppard 1960a,b; Clarke and O'Donald 1964; Sheppard and Ford 1966; Feldman and Karlin 1971; O'Donald and Barrett 1973; Charlesworth and Charlesworth 1975; Bürger 1983c; Otto and Bourguet 1999).
As we have discussed, the consensus from population genetic models is that the evolution of dominance is a frequency-sensitive problem. A difficulty arises from this assertion. Dominance seems to be too prevalent to be explained solely by frequency-sensitive dynamics, whose chance of success is highly dependent on a very specific set of starting conditions (Wagner and Burger 1985; Otto and Bourguet 1999). To address this problem, we may have to reexamine the mechanics of dominance modification.
The problems associated with frequency sensitivity arise in a context in which it is assumed that dominance modifiers have only a fitness effect in the presence of the mutant heterozygote. In other words they are considered to be pure modifiers that exhibit no independent effects in the wild-type homozygote. This leads us to the question of whether all dominance modifiers are pure modifiers. If they are not pure modifiers or they exhibit pleiotropic effects, then frequency dependence may cease to be a problem. Wright (1929a)(b, 1934a, 1977) and Haldane (1930), in addition to Muller (1932) and Plunkett (1933), had all proposed such a possibility. These scientists also realized that such a question could not be answered by population genetics alone. The answer depends on the mechanistic constraints pertaining to variation on a given phenotype. The latter was the question that Kacser and Burns (1981) tried to address. We reexamine this question in the context of metabolic physiology. If a dominance modifier exhibits independent fitness effects in the wild-type homozygote, then the modifier may be selected irrespective of its effects on dominance. In this article, we refer to this scenario as “dual-effect selection.” We avoid use of the term “pleiotropic selection,” given that technically the latter term refers to simultaneous effects on several phenotypic traits rather than to multiple effects (depending on genetic background) on a single trait (pathway flux).
The evolution of dominance in metabolic pathways has a controversial history. In the 1980s, Kacser and Burns (1981) made the argument that dominance in metabolic pathways was an inevitable property of multienzyme systems and could not be significantly modified. This argument was based on mathematical models of metabolic pathways. The Kacser and Burns (1981) model indicated that the flux in a metabolic pathway would be relatively insensitive to changes in the concentration of most enzymes involved in the pathway. Hence it was argued that in most cases flux would be insensitive to mutations that reduce (but do not eliminate) the dosage of a functional enzyme. It was further argued that such insensitivity was an inevitable property of multienzyme systems and hence dominance in metabolism did not require an evolutionary explanation. Since then, the possibility that dominance or robustness is an inevitable property of metabolic pathways has had a role in many discussions on evolution (Hartl et al. 1985; Dykhuizen et al. 1987; Clark 1991; Orr 1991; Szathmary 1993; Watt 1994; Kacser 1995; Kacser et al. 1995; Turelli and Orr 1995; Hartl and Taubes 1996; Keightley 1996a; Porteous 1996; Mayo and Burger 1997; Bourguet 1999; Sole and Goodwin 2000; Hartman et al. 2001; Meiklejohn and Hartl 2002; de Visser et al. 2003; Papp et al. 2003; True 2003; Hartwell 2004).
In the framework established by Kacser and Burns (1981), a phenotype is said to be dominant when flux is insensitive to reductions (e.g., by a factor of 1/2) in the underlying enzyme concentrations. For example, consider a locus x that codes for the expression of an enzyme X involved in a given metabolic pathway. Let A represent the wild-type allele and a be a null allele at the x locus. Furthermore, consider the case in which due to dosage effects the concentration of enzyme X in an Aa heterozygote is roughly half of that of an AA homozygote. Under these conditions, if the flux of an AA individual is similar to that of an Aa individual, then it is said that the wild-type flux given by AA is dominant with respect to mutations at the x locus. Of course this argument revolves around the simple scenario in which the reduction in gene dosage effects is not compensated by regulatory feedback. With the inclusion of regulatory feedback, other scenarios that lead to dominance and its modification can arise (Omholt et al. 2000). The argument that dominance effects could not be subject to evolution is based on the contention that mutations that affect the enzyme kinetics cannot significantly change the sensitivity of the flux surface for all enzymes (Kacser and Burns 1981).
The Kacser and Burns (1973)(1981) models depended on certain linearizing assumptions and the conclusions derived from them have not been accepted by all. Several scientists have argued that Kacser and Burns' conclusions hold only in cases where the nonlinearities in enzyme kinetics are ignored and that when nonlinearities are included, dominance can be modified (Cornish-Bowden 1987; Savageau and Sorribas 1989; Savageau 1992; Grossniklaus et al. 1996). More precisely, Cornish-Bowden (1987) argued that the conclusions of Kacser and Burns (1981) ignore the effects of saturation (although also see Cornish-Bowden 1989). Savageau and Sorribas (1989) and Savageau (1992) argued that for situations such as feedback loops, enzyme-enzyme interactions, cascades, or branched pathways, dominance is not a necessary property of the system. Grossniklaus et al. (1996) presented examples in which dominance was not the default expectation when enzyme cooperativity or oscillatory feedback loops were considered. Elsewhere, we have shown by mathematical proof that the conclusions of Kacser and Burns (1981) hold only in cases where nonlinearities in enzyme kinetics are excluded (Bagheri-Chaichian et al. 2003).
The possibility of dominance modification due to the existence of nonlinearities extends beyond the realm of metabolic physiology. It has been shown to hold in models of gene regulatory networks (Omholt et al. 2000), development (Nijhout and Paulsen 1997; Gilchrist and Nijhout 2001; Nijhout 2002), and macromolecular assembly (Veitia 2003). There is a clear explanation for why nonlinearity is required for dominance modification. For dominance modification to be possible epistasis is required. Epistasis refers to the phenomenon whereby an allele substitution at one locus alters the effect of substitutions at a different locus.
The existence of epistasis requires nonlinearities in the relation between genotype and phenotype (Omholt et al. 2000; Rice 2000, 2002; Gilchrist and Nijhout 2001; Hansen and Wagner 2001; Nijhout 2002; Bagheri-Chaichian et al. 2003). From a mathematical perspective, epistasis can be represented as a situation where-upon the second-order derivative of a phenotypic trait with respect to two underlying genetic variables is nonzero. For example, consider a metabolic pathway that yields a metabolic flux represented by the variable J. Furthermore, for a given set of kinetic parameters and a given environmental input, let us consider a vector of enzyme concentrations E and a function g such that
 |
1 |
Consider a situation in which the concentration of each enzyme is dependent on a unique genetic locus. For any two enzymes Ei and Ej in E, epistasis refers to the situation in which
 |
2 |
In the example given in Equation 2, the implication is that the value of concentration at one locus i can change the effects of changes in concentration at another locus j. Thus, dominance could be modified by changes in enzyme concentration. In a similar fashion, the possibility of dominance modification can be attributed to any underlying parameter that exhibits epistasis with respect to flux (e.g., kcat).
The assertion by Kacser and Burns (1981) that dominance is an inevitable property of metabolic pathways is based on a mathematical result referred to as the flux summation theorem (Kacser and Burns 1973; Heinrich and Rapoport 1974; Heinrich and Schuster 1996; Fell 1997). Central to the MCA approach is the flux control coefficient CJi, which measures the sensitivity of steady-state flux to changes in enzyme concentration. In its original formulation (Kacser and Burns 1973), the control coefficient was defined as
 |
3 |
where J is the steady-state flux of metabolites through the pathway, Ei is the concentration of enzyme i, δEi is a finite change in concentration of enzyme i, and δJi is the resultant change in flux. The flux summation theorem states that the sum of the control coefficients in a pathway with n enzymes equals one:
 |
4 |
Equation 4 implies that the mean of control coefficients will be on the order of 1/n. As n increases the control coefficient for most enzymes will get smaller on average. If Equation 4 were to be valid, most enzymes would have small effects on flux and the recessiveness of mutants would be an inevitable property of metabolic pathways. In their work on dominance, Kacser and Burns (1981) use a continuous version of Equations 3 and 4, in which they refer to CJi as the sensitivity coefficient Zi. There have been several other changes in the terminology and definitions of MCA, for which we direct the interested reader to the literature (Fell 1992, 1997; Schuster and Heinrich 1992; Kacser et al. 1995; Kholodenko et al. 1995; Heinrich and Schuster 1996).
As a contraposition to the conclusions derived from the summation theorem, we have used similar mathematical tools to show that dominance is not an inevitable property of metabolic pathways (Bagheri-Chaichian et al. 2003). Mutations necessarily involve finite changes in enzyme concentration. Furthermore, all experimental measurements of control coefficients are done in a finite setting. It can be shown that for finite changes in enzyme concentrations, the flux summation theorem can hold only in situations where the relation between J and E is linear and thus devoid of epistasis. Hence
 |
5 |
where ci is a constant for every i. Such an absence of epistasis is an unlikely expectation for metabolic systems. For example, even generic nonlinearities such as enzyme saturation can cause epistasis. Under such conditions, dominance can be modified by parameters that affect saturation levels. This suggests that changes in enzyme concentrations or kinetic rates such as the catalytic turnover rate kcati of individual enzymes can significantly modify dominance levels throughout the pathway. In fact, if one considers the limit at which all enzymes are approaching saturation, one can show that for n enzymes and any arbitrary magnitude m, the bounds on the system are given by
 |
6 |
where 0 < |δEi| < m. The range given by (6) pertains to simple Michaelis-Menten-type kinetics with no cooperativity. It is possible that this range could be larger with the inclusion of sigmoidal kinetics. In effect, in a series of simulation studies, Grossniklaus et al. (1996) have found that control coefficients can be high in pathways that include cooperativity or feedback. The latter result is also in accord with earlier critiques presented in Savageau and Sorribas (1989) and Savageau (1992).
The validity of the propositions in (5) and (6) does not depend on the magnitude of m, which defines the bounds for the absolute value of δEi. Nonetheless, as m becomes larger, the region on the flux surface upon which the summation theorem does not hold will become larger. Within MCA, finite changes are sometimes referred to as “large changes” (Hofer and Heinrich 1993; Kacser and Acarenza 1993; Small and Kacser 1993a,b; Kacser 1995; Heinrich and Schuster 1996; Thomas and Fell 1996; Acerenza 2000). There is a general recognition that large changes pose a problem from the perspective of metabolic engineering. However, there has been no explicit recognition that finite changes pose a problem for the Kacser and Burns, (1981) theory on dominance. Clearly, there is a need for considering this problem, given that the Kacser and Burns (1981) framework assumes a 50% reduction in gene dosage for mutant heterozygotes.
To build an intuition for the problems that we tackle later in this article, it may be helpful if we summarize what we deem to be the structural properties of the Kacser and Burns (1973)(1981) approach. The flux summation theorem is an analytical proposition that is derived independently of any particular derivation of flux. What is common between the summation theorem and the accompanied derivations of flux (Kacser and Burns 1973, 1981) is the assumption of no saturation. As a mathematical proposition, the inclusion of saturation renders the summation theorem invalid for finite changes of any magnitude, an assertion that holds for sequential pathways with any number of enzymes (Bagheri-Chaichian et al. 2003). The flux derivations are derived on the assumption of no saturation, but then they are conceptualized as flux surfaces that are a function of enzyme concentrations. The logical problem is that as enzyme concentrations are being decreased, there has to be a region where saturation occurs. However, the latter possibility is not built into the equations. Hence, equations that do not allow for saturation are used as an illustration for making general statements about the inherent properties of a system that can allow for saturation. Such an approach is problematic when it is used to make inferences about the evolution of metabolic systems: mainly, that a restricted end point of one possible evolutionary trajectory is being used to make general statements about the fixity of all systems throughout their evolutionary trajectories.
In this article we consider a model of a two-enzyme sequential pathway for which the steady state flux J can be obtained by a functional relationship of the form
 |
7 |
where E = 〈E1, E2〉 represents the vector of enzyme concentrations,  represents the vector of kinetic constants for enzyme catalysis, sin is the environmental input into the system, and q is a diffusion rate. We assume that due to mutations, the vector of enzyme concentrations E and the vector of kinetic constants K can change between generations. As an example of dominance modification, we show that if one assumes Michaelis-Menten-type enzyme kinetics, whereby saturation is possible, dominance can be modified by mutations that change the kcat values for individual enzymes. Furthermore we show that mutations that increase dominance levels can be selected. Our enzyme-kinetic model shows that dominance modifiers can be selected due to dual effects, whereby an allele that increases dominance levels also has the independent phenotypic effect of increasing flux in a wild-type homozygote. Consequently, in situations where there is selection for increased flux, dominance evolves as a side effect of selection for modifier alleles that increase flux. This allows for the evolution of dominance in a manner that is largely insensitive to the initial frequency of heterozygotes or the mutation rates. Our theoretical results are experimentally testable, since they follow from the expected properties of Michaelis-Menten-type enzyme kinetics.
MODEL
Modeling rationale:
We first use an enzyme-kinetic model of a two-enzyme pathway to investigate how changes in enzyme properties can be reflected in the physiological phenotype. In the second section, we link the enzyme-kinetic model to a simple genetic model, such that the underlying genetics could be reflected in the physiology. In the third section, we incorporate the enzyme-kinetic and the genetic models into a population genetic model to investigate how dominance can evolve.
Two-enzyme model of a metabolic phenotype:
Flux as phenotype:
We considered one of the simplest multienzyme pathways that can serve as a building block for larger pathways. An outside substrate sin diffuses into a reaction compartment that houses two successive enzyme-catalyzed reactions. A sink step is added to remove the product as sout:
 |
The kinetic model can be translated into a system of differential equations. The physiological phenotype we consider is the flux rate J through the pathway, given by J = dsout/dt (see Dykhuizen et al. 1987 for biological rationale). Under conditions where the input sin remains constant, the quantity J can reach a steady-state and be evaluated analytically. The system of equations governing changes in molecular concentrations is
 |
8 |
We also have the physical constraint that
 |
9 |
Given equation sets (8) and (9), the steady-state solution for the flux J is given by a system of simultaneous equations, which can be simplified to
 |
10 |
 |
11 |
 |
12 |
The solution for metabolic flux J from the system of equations given by Equations 10–12 can be analytically derived (see appendix A) and represented as a function g such that
 |
13 |
The kinetic model used here directly reflects a Michaelis-Menten/Briggs-Haldane conception of reversible enzyme catalysis, where the existence of an intermediate enzyme-substrate complex is assumed. For solving flux rates, we do not use the Michaelis-Menten or Briggs-Haldane approximations and instead use the exact solution of the differential equations. Both the Michaelis-Menten and Briggs-Haldane approximations diverge from the exact solution when substrate concentrations are decreased in comparison to enzyme concentrations. The Kacser and Burns approach to modeling flux uses the Briggs-Haldane approximation as its basis, but then adds an additional approximation. It assumes that all enzymes in a pathway are always unsaturated in both the forward and reverse directions. Accordingly, the Briggs-Haldane approximation is further simplified by eliminating the denominator of the rate equation for each reaction. This results in a system of linear differential equations, where the possibility of saturation is eliminated (Kacser and Burns 1973, 1981). For the model presented here, the linear assumption for the enzyme kinetics would hold in the limiting case when all enzymes are far from saturation. For example, this would occur if flux is limited by the diffusion step (e.g., low [sin]) and all enzymes are in high enough concentrations such that they are all in a linear phase of catalysis. Linear assumptions are nullified whenever one or more enzymes are near saturation.
Phenotypic effects of mutations affecting kcat:
To determine the effects that mutations can have on the catalytic turnover rate kcat, we have to take into consideration the thermodynamic constraints on a reaction. For any given temperature and pressure, a chemical reaction has a fixed equilibrium constant Keq. Accordingly, an enzyme can increase the rate at which equilibrium is achieved, but it cannot change the equilibrium constant, given by the expression
 |
14 |
Hence, mutations that change kcati by a factor α also have to change the denominator of Equation 14 by a factor α. We considered the simplifying case where mutations that affect kcati also affect krevi by the same factor. Hence for each enzyme i we made the following substitutions into Equations 10–12,
 |
15 |
where αi = 1 for the wild type. Henceforth, the effects of δkcati mutations on flux can be approximated by the derivative ∂αi J (using the convention  ). Furthermore we can determine whether a change in kcati can change the robustness of flux with respect to changes in the concentration of enzyme i by the derivative ∂αi∂Ei J (using the convention
  ). For any enzyme i, if ∂αi∂Ei J < 0 then a mutation that increases kcati will increase the robustness of the flux phenotype with respect to changes in Ei. Conversely if ∂αi∂Ei J > 0, then a mutation that increases kcati will increase the sensitivity of flux with respect to changes in Ei.
For mutations that decrease the concentration of wild-type enzymes, changes in robustness reflected by ∂αi∂Ei J have implications for dominance modification. Given an increase in kcati and a negative ∂αi∂Ei J, the wild-type phenotype will increase in dominance with respect to the phenotype of homozygote mutants that have lower concentrations of enzyme i. Conversely, an increase in kcati and a positive ∂αi∂Ei J indicate a decrease in dominance.
To determine the likelihood of dominance evolution for a given pathway, we need to know the values of ∂αi J and ∂αi∂Ei J. We consider a situation in which there is positive selection for increased flux. The expected effect on dominance is shown in Table 1.
TABLE 1.
Expectations on dominance evolution as a function of ∂αi J and ∂αi∂Ei J
| ∂αi∂EiJ < 0 |  |
∂αi∂EiJ > 0 | |
|---|---|---|---|
| ∂αiJ < 0 | Increase in kcati increases dominance but decreases fitness. Dominance difficult to evolve. |
No dominance evolution. | Decrease in kcati increases dominance and fitness. Dual-effect selection. Dominance evolution through decrease in kcati. |
 |
Increase in kcati increases dominance. Frequency-sensitive dominance evolution through increase in kcati. |
No dominance evolution. | Decrease in kcati increases dominance. Frequency-sensitive dominance evolution through decrease in kcati. |
| ∂αiJ > 0 | Increase in kcati increases dominance and fitness. Dual-effect selection. Dominance evolution through increase in kcati. |
No dominance evolution. | Decrease in kcati increases dominance but decreases fitness. Dominance difficult to evolve. |
The signs of ∂αi J and ∂αi∂Ei J will depend on the kinetic constants and enzyme concentrations and cannot be determined by examining the algebraic form of their respective equations. We opted for a Monte Carlo approach to determine the distribution of values for ∂αi J and ∂αi∂Ei J. For our Monte Carlo procedure we used a random sampling of the 12-dimensional variable space composed by E × K × sin × q (see appendix B for methodology and sampling range).
Four-locus model of dominance modification:
Starting with the two-enzyme model delineated in the previous section, we develop a simple genetic model, in which allele changes affect the underlying properties of the enzyme kinetics. Kinetic changes subsequently translate to changes in the flux phenotype. The purpose of the model is to investigate the effects of mutations that change either enzyme concentrations or kcat values.
The genetic model used is a four-locus model underlying the two-enzyme pathway. Different genotypes map to a set of enzyme properties, which we refer to as the “kinetic phenotype.” The four loci and their effects are as follows:
enz1: Total concentration of enzyme 1 ([E1]).
enz2: Total concentration of enzyme 2 ([E2]).
cat1: Catalytic turnover rate for enzyme 1 (kcat1).
cat2: Catalytic turnover rate for enzyme 2 (kcat2).
Four-locus, two-allele case:
Most of our discussions center around a simple case in which the loci are modeled as diploid with two possible allelomorphs. In keeping with the literature on dominance, alleles that are associated with high fitness (e.g., high [Ei] or high kcati) are labeled as wild type. Wild-type alleles are denoted as enz1wt, enz2wt, cat1wt, and cat2wt. The mutant counterparts are enz1mut, enz2mut, cat1mut, and cat2mut. Mutations in kcati are simulated by changes in αi as defined in Equation 15. The flux phenotype is then computed using the kinetic model of the pathway formulated in the system of equations in (8).
For the underlying genetics, our model assumes that mutations in the enz loci act additively with respect to their effect on enzyme concentration. For example if [E1] = x μm in the enz1wt/enz1wt homozygote, then [E1] = 1/2x μm in the enz1wt/enz1mut heterozygote and [E1] = 0 μm in the enz1mut/enz1mut homozygote. Meanwhile, the low kcat phenotype is assumed to be recessive with respect to the high kcat phenotype. This was done to simplify the model by reducing the number of kinetic phenotypes. Given that dominance is assessed with respect to the effect of mutations at the enz loci, the assumption of nonadditivity at the cat loci does not affect our conclusions. According to this model, there are 128 possible genotypes and 36 kinetic phenotypes. In principle, different kinetic phenotypes can lead to the same flux phenotype.
Four-locus, continuum of alleles case:
As an extension of the two-allele case, we studied evolutionary dynamics under a continuum of alleles scenario. For each locus, the effect of a random mutation was simulated by multiplication of the corresponding kinetic value by a coefficient β, where β is randomly picked using a normal probability distribution with mean one and a standard deviation of 1/2. For mutations affecting a cat locus, β is multiplied by the corresponding αi value. For enz mutations, β is multiplied by the corresponding Ei value. This model allows for an indeterminate number of allele substitutions during selection. The rules for computing the flux phenotype were the same as the four-locus, two-allele case.
Population genetics of dominance evolution:
The genetic model delineated in the previous section can serve as the basis to explore the population genetics of dominance evolution. This will allow us to investigate some of the conditions under which frequency-sensitive or -insensitive evolution of dominance can occur.
Measure of dominance:
To quantify dominance levels we used a measure previously used by Wright (1934a) and Kacser and Burns (1981). Let J(enz x wt/enz x wt) denote flux pertaining to a wild-type homozygote at a locus x (where x is 1 or 2). Similarly, the mutant heterozygote and homozygote fluxes are denoted by J(enz x wt/enz x mut) and J(enz x mut/enz x mut), respectively. For any enz locus x, let Dx denote the dominance of the wild-type flux with respect to an enz x mut allele substitution, where
 |
16 |
In the case of complete additivity, Dx = 0.5. If dominance of the wild type evolves with respect to the effect of enz x mut substitutions, then Dx → 0. Conversely, if the wild type becomes recessive, then Dx → 1.
Population genetic model of a four-locus, two-allele scenario:
The physiological phenotype we consider is the steady-state flux through a pathway. We examine a scenario in which an increase in flux through the pathway increases fitness. This scenario is inspired by the first three steps of the metabolism of lactose, which includes diffusion of lactose into the periplasmic space, active transport by β-galactoside permease, and hydrolysis by β-galactosidase. This pathway has been studied in Escherichia coli as a model system for metabolic evolution (Dykhuizen et al. 1987; Dean 1989). We use a generalized representation of such a two-enzyme pathway scenario in a diploid setting. Nonetheless, although we specifically study a diploid case involving dominance, our conclusions are equally applicable to the problem of robustness modification in haploid organisms.
Fitness in our model is evaluated as a function of genotype and environment. For any given case study, the highest flux possible by any combination of alleles for a given environment is denoted as Jmax, where
 |
17 |
Assuming a linear relation between fitness and flux, we can define the maximum fitness Wmax as
 |
18 |
where φ is a parameter designating the fitness impact of flux. Similarly for any flux J, let fitness W be defined as W = 1 + φJ. The relative fitness ω is given by
 |
19 |
Given that 0 ≤ ω ≤ 1, natural selection in nonoverlapping generations can be simulated using a genetic algorithm with stochastic selection, where the probability of a given individual to be chosen as a parent for a mating depends on ω.
For simulations of population dynamics, the population size N was held constant at 250 individuals. For reproduction, each mating gives rise to one new genotype. The mating process includes mutation at each locus, recombination between linkage groups, and chromosomal assortment. Mutation rates μ were set at μ = 1 × 10⁻⁴ per locus per generation. Recombination rates r between linkage groups were set at r = 0.5 per generation. For such simulations fitness impact was set at φ = 1. The initial conditions for each trial were set at 249 individuals of genotype enz1mut/enz1mut, enz2mut/enz2mut, cat1mut/cat1mut, cat2mut/cat2mut and one individual of genotype enz1wt/enz1mut, enz2wt/enz2mut, cat1mut/cat1mut, cat2mut/cat2mut. The populations were seeded as such to reduce simulation wait time for the appearance of the enz1wt and enz2wt alleles. Without the enz alleles, there would be no flux (J = 0), and the cat alleles would have no phenotypic effects. Hence, without any wild-type enz alleles, the dynamics at the cat loci would be solely due to drift, which is not the focus of this study.
In principle, the low starting frequency of the wild-type enz alleles allows for the catwt alleles to display their heterozygote rescue effect. However, this occurs rarely in our simulations given that the wild-type cat alleles go to fixation very quickly. Furthermore, due to the relatively low mutation rates, the rescue effects will be rare after the fixation of the catwt alleles. As such, the simulations are set up to illustrate the effectiveness of selection due to the direct effects of the catwt alleles. Each simulation trial was stopped either when the frequency of the kinetic phenotype “high E1, high E2, high kcat1, high kcat2” had surpassed 95% or when 10,000 generations had passed.
Approximation of a continuum of alleles scenario:
To study a continuum of alleles scenario, we further simplified the population dynamics. Rather than explicitly consider mutation rates and the number of accrued generations, we considered sequences of mutation events. Each mutation event consists of randomly choosing one of the four loci. Subsequently the corresponding kcati or Ei value is changed in accordance with our mutation rules (see Four-locus model of dominance modification). For each new mutant, we approximate the probability of fixation of the new mutant by using a simplified solution to the Kolmogorov backward equation (Crow and Kimura 1970). If one assumes a large population (N → ∞) and an ideal population structure (Ne = N), then the probability of fixation u of a new mutant is given by
 |
20 |
where s is the selective advantage of the new mutant. We evaluated the selective advantage as
 |
21 |
where J(x) denotes the flux associated with a genotype x. To further simplify the model, it was assumed that growth and hence fitness are directly proportional to flux J (i.e., φ → ∞). This corresponds to models of microbial growth in chemostats with only one type of carbon source. It was also assumed that new mutations do not occur concurrently.
The continuum of alleles model presented here is not geared toward addressing issues pertaining to mutation rates, population size, recombination, and the contribution of frequency-sensitive selection. The model relies only on the direct fitness effects and allows us to investigate the evolution of intermediates in dominance, as opposed to the binary possibilities studied in the two-allele scenario.
RESULTS
Dominance modification by mutations affecting kcat:
For the two-enzyme pathway modeled here, a Monte Carlo sampling approach allows us to assess the local effects of kcat mutations on flux (∂αi J) and local robustness properties (∂αi∂Ei J). Since we are sampling in a 12-dimensional space, the initial objective is to estimate the statistical tendencies of mutational effects, particularly, whether ∂αi J and ∂αi∂Ei J tend to be positive or negative. This information allows us to assess the likelihood of dominance evolution as illustrated by the expectations outlined in Table 1.
For the input conditions considered in our model, where the input sin is held constant and the end product s3 is removed, all increases in kcat have a positive or neutral effect on flux (shown in Figure 1). Thus, we observed only the scenarios outlined in the last two rows of Table 1.
Figure 1.—

Cumulative frequency distribution of ∂αiJ/J values for enzymes 1 and 2. Positive values for ∂αi J indicate that flux increases when a mutation increases the kcati of a given enzyme i.
The distribution of ∂αi∂Ei J values is more complicated than the distribution of ∂αi J values. Both positive and negative values are found for ∂αi∂Ei J. The question is how often and under what conditions does ∂αi∂Ei J exhibit a negative value, whereupon dominance would be easy to evolve. The difficulty results because we are dealing with a 12-dimensional space, even though we have only a two-enzyme system. Given the complications associated with a high-dimensional space, we found two criteria that are helpful for understanding the ∂αi∂Ei J distributions.
Given that ∂αi J ≥ 0 for all the cases we sampled, we can scale the second derivative to the first derivative ∂αi J without affecting the sign. For any enzyme i, let
 |
22 |
The implications of the λi values can be determined from Equation 22 and the qualitative expectations are delineated in Table 1. If λi > 0 then increases in kcati will lead to increased fragility of pathway flux with respect to decreases in the concentration of enzyme i. Conversely, data points where λi < 0 indicate cases where increases in kcati will lead to increased robustness and hence dominance with respect to decreases in the concentration of enzyme i. Figures 2A and 3A show the λi distributions for both enzymes 1 and 2, respectively. Both distributions are bimodal. Our main concern is to determine whether there are trends associated with λi being positive or negative. To aid us in this objective, we used two chemical concepts.
Figure 2.—

Distributions of the effects of kcat1 mutations on robustness properties of enzyme 1. The four quadrants represent different kinetic regimes. A positive λi value indicates a tendency toward increased sensitivity. A negative λi value indicates increased robustness.
Figure 3.—

Distributions of the effects of kcat2 mutations on robustness properties of enzyme 2. The four quadrants represent different kinetic regimes. A positive λi value indicates a tendency toward increased sensitivity. A negative λi value indicates increased robustness.
An exergonic pathway is one for which the net change in free energy is negative, whereby ΔG(pathway) < 0 and hence Keq(pathway) > 1. Exergonic pathways are generally associated with catabolism. Conversely, for endergonic pathways ΔG(pathway) > 0 and hence Keq(pathway) < 1. Endergonic pathways are generally associated with anabolism. For our two-enzyme system, the equilibrium constant of a pathway is given by
 |
23 |
Meanwhile, the saturation level of an enzyme i can be given by a measure Sati, with
 |
24 |
Since J is a dependent variable given by the function g, the Sati value for each enzyme i can vary depending on the values of E, K, sin, and q. However, the situation is simplified when comparing the saturation levels of two enzymes. Given that
 |
25 |
the ratio of saturation levels between two enzymes is simply given by the ratio of their Vmax values. Figures 2, B–E, and 3, B–E, show the parsing of the λi distributions according to whether a given pathway is exergonic (catabolic) or endergonic (anabolic) and whether Sat1 is greater or less than Sat2.
For the exergonic cases, there is a clear division of the distributions into two peaks. For any two enzymes i and j, the value of λi is predominantly negative when Sati < Satj. Conversely λi is mostly positive when Sati > Satj. The latter observations can be deduced from Figures 2, B and C, and 3, B and C, and the corresponding cumulative distributions (not shown). In an exergonic pathway, when Sat1 < Sat2, more than 85% of increments in kcat1 lead to λ1 < 0 and hence increases in phenotypic robustness against variation at the enz1 locus. Meanwhile, when Sat1 < Sat2, more than 60% of increments in kcat2 lead to λ2 > 0 and hence increases in phenotypic fragility against variation at the enz2 locus. Similarly, when Sat2 < Sat1, more than 90% of increments in kcat2 lead to λ2 < 0 and hence increases in robustness against enz2 variation. Also, for Sat2 < Sat1, ∼70% of kcat1 increments lead to λ1 > 0 and hence increases in fragility against enz1 variation. These results indicate that dominance can—but need not—increase as a by-product of mutations that lead to higher kcat and flux values.
Mechanics of dominance modification by mutations affecting kcat:
The results from the Monte Carlo samplings indicate that there are kinetic regimes in which increases in kcat can increase dominance at a given locus. We first address the issue of why saturation values are a good indicator for the likelihood of mutations to increase dominance. As an example, Figure 4 shows the effects of finite changes in kcat1 values on flux in an exergonic pathway (see appendix B for kinetic values). This figure illustrates two important generic features of the effects of kcat mutations in exergonic pathways. First, for any given concentration of E1, increases in kcat1 lead to increases in flux. This is consistent with the Monte Carlo data presented in Figure 1. Second, as kcat1 increases, there is also an increase in the width of the plateau region associated with robustness. Whether a given transition from cat1mut to cat1wt will lead to dominance will depend on whether the flux associated with the cat1wt strain ends in a plateau region or not. For example, in Figure 4, a mutation from point A* to A leads to an increase in fragility and hence recessivity. Meanwhile a mutation from point B* to B leads to an increase in robustness, and hence dominance.
Figure 4.—

Effects of finite changes in kcat1 on flux J in an exergonic pathway. Point A lies in a region where Sat1 > Sat2. A mutation from A* to A leads to increased sensitivity to δE1. Point B lies in a region where Sat1 < Sat2. A mutation from B* to B leads to increased robustness with respect to δE1. For enzyme 2, the values are fixed at E2 = 10 μm and  . i,
. i,  ; ii,
; ii,  ; iii,
  ; iv,
; iv,  ; v,
; v,  ,
,  .
.
The relationship between Sat1 and Sat2 plays a key role in determining dominance modification effects. If the cat1wt strain ends up in a region where Sat1 < Sat2, it increases the likelihood that enzyme 2 is nearing saturation. If enzyme 2 nears saturation, increases in E1 will have no effect on flux and hence result in a plateau effect. Conversely in a region where Sat1 > Sat2, it is more likely that enzyme 1 is nearing saturation, in which case decreases in E1 lead to a steep decline in flux. The relation between saturation and dominance is also apparent from the Monte Carlo results. Figure 5 shows the correlation between saturation values for the two enzymes and the tendencies for robustness modification. For any enzyme i, as Sati approaches one, the proportion of cases where λi is negative approaches zero. Meanwhile, for the other enzyme j ≠ i, the proportion of cases where λi is negative approaches one as Satj approaches one. This explains why the saturation ratios of the two enzymes are a good indicator of how the λi values will behave. Nonetheless, note that for the problem of dominance modification what is important is the saturation regime in which the new mutant ends up. As such, the saturation ratios existent before the mutation and the associated λi values can give only a local expectation of robustness modification. Hence the information given by the saturation ratios serves primarily as a first-order expectation for dominance modification. Ultimately, the extent of dominance modification will depend on the actual value of δkcati, which represents the cat i mut to cat i wt mutation.
Figure 5.—

Saturation values for the two enzymes and the tendencies for robustness modification. (A) Frequency of cases with λ1 < 0. (B) Frequency of cases with λ2 < 0. Lighter areas indicate regions where a high proportion of increases in kcati lead to an increase in robustness with respect to δEi.
The reason why saturation serves as a good criterion for parsing the data in the exergonic case but not in the endergonic case has to do with the likelihood of saturation. In exergonic cases, there are extensive regions where an enzyme can reach high saturation values. However, in the endergonic case, from a thermodynamic perspective the tendency of the reaction is to go in the opposite direction. Hence saturation levels for the enzymes are very low and the enzymes are generally very far from saturation. Consequently the ratio of saturation levels in the forward direction becomes less informative in the endergonic case.
On the basis of the local λi values, an apparent conflict arises from the fact that for any two enzymes i and j, an increase in kcati may lead to robustness to mutations at one enz locus while an increase in kcatj may lead to fragility with respect to mutations at the other enz locus. This can disappear when we consider the effects of finite mutations. Finite mutations that change robustness levels also change saturation levels. This is essentially a manifestation of epistasis (Figure 6 shows an example). Starting from a point on the flux surface, as illustrated in Figure 6A, a mutation can increase robustness to either enz1 or enz2 mutations (Figure 6, B or C, respectively). However, in either case, the enzyme i (with respect to which robustness has increased) is also the one that is now unsaturated. Consequently, further increases in kcati do not have a large effect on flux and do not have a high selection coefficient. However, the other enzyme j is in a saturated regime and increases in kcatj will have a larger effect on flux. Consequently an increase in kcatj is more likely to be selected. After an increase in kcatj, both enzymes fall into an unsaturated regime (the diffusion step being now the limiting step). At this stage, the system exhibits robustness to changes in the concentration of either enzyme (Figure 6D).
Figure 6.—
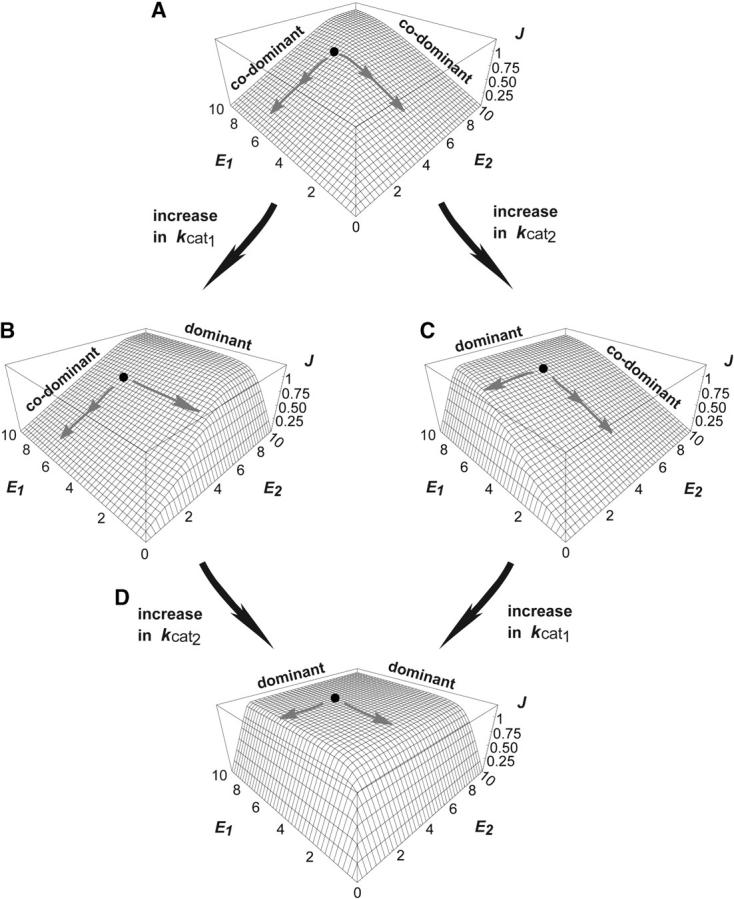
Alternative trajectories for attaining robustness with respect to changes at both the enz1 and enz2 loci.
Evolutionary dynamics in the four-locus, two-allele scenario:
The results in the previous two sections show that increases in kcat can increase flux and robustness at the same time. In a selection regime where increases in flux have a positive fitness effect, these results support the argument that dominance can evolve in metabolic pathways through dual-effect selection. The dynamics at the level of the population can import a new set of nonlinearities (frequency sensitivity) that affect the course of dominance evolution. A comprehensive study of the population dynamics is beyond the scope of this work and we shall limit ourselves to a proof of principle. The main intent is to show how the underlying properties of a biochemical system can lead to a situation in which frequency-insensitive selection can proceed regardless of the frequency-sensitive aspects of dominance evolution.
In our simulations of the two-allele scenario, we found that dominance did evolve via selection and fixation of the high-kcat alleles as expected. But more to the point was the fact that the high-kcat alleles were being selected primarily for their direct fitness effects rather than their dominance modification effects. The evolutionary scenario corresponded to a case where D1 evolved from 0.33 to 0.010 and D2 from 0.30 to 0.00046. We examined four different linkage scenarios. These were: (a) no recombination; (b) enz1 and enz2 loci linked, cat1 and cat2 loci linked; (c) enz1 and cat1 loci linked, enz2 and cat2 loci linked; and (d) free recombination.
Due to the stochastic nature of the simulations, there was some variation in the sequence of selective sweeps between simulation runs. Nonetheless, for our particular case study, the most recurrent sequence of selective sweeps was the same in all linkage scenarios. First the high-E1, high-E2, low-kcat1, low-kcat2 kinetic phenotype sweeps through the population. Then, if the cat1wt allele is present, it sweeps through the population and the high-E1, high-E2, high-kcat1, low-kcat2 phenotype goes toward fixation. Subsequently, the cat2wt allele sweeps through the population and the high-E1, high-E2, high-kcat1, high-kcat2 phenotype approaches fixation. Figure 7 shows simulation results for two sample scenarios. The reason for the order of the selective sweeps is the epistatic interdependence of mutational effects. In the first place, the metabolic pathway could not function unless the concentrations of both enzymes 1 and 2 are nonzero. Hence the cat1wt and cat2wt alleles could not sweep through the population unless the enz1wt and enz2wt are already in place. The alternative would be for the cat1wt and cat2wt alleles to be already present in the population due to drift. Once enz1wt and enz2wt have been fixed, the cat1wt allele has a higher chance of sweeping into the population. This is because a cat1wt substitution in an enz1wt/enz1wt, enz2wt/enz2wt, cat1mut/cat1mut, cat2mut/cat2mut genotype has a higher fitness effect than a cat2wt substitution in the same genotype. Due to epistasis, the magnitude of fitness effects for the two enzymes is interdependent. In general, the cat1wt and cat2wt ordering will depend on the kinetics of each particular case study in question.
Figure 7.—

Comparison of fixation-approach times for different phenotypes in the two-allele scenario. Each line represents pooled data from 32 trials. Fixation approach was scored when respective phenotype frequencies surpassed 0.95. Each labeled dot represents the median number of generations at which half of the trials had first gone above a frequency of 95% for the given kinetic phenotype. (A) Full linkage. (B) Free recombination. i, high E1, high E2, low kcat1, low kcat2; ii, high E1, high E2, high kcat1, low kcat2; iii, high E1, high E2, low kcat1, high kcat2; iv, high E1, high E2, high kcat1, high kcat2.
For all linkage scenarios, heterozygosity at the enz1 and enz2 loci remained relatively low (as one would expect from the mutation rate), indicating that neither the cat1wt nor the cat2wt allele could be significantly selected due to their modifying effects. Figure 8A shows the full linkage case as an example. The majority of the increases in the high-kcat1 phenotype occurred when the frequency of the enz1wt/enz1mut heterozygote was low. In contrast, Figure 8B shows that increases in the high-kcat1 phenotype (due to increases in the frequency of the cat1wt allele) occur irrespective of the frequency of the enz1wt/enz1wt, enz2wt/enz2wt, cat1mut/cat1mut, cat2mut/cat2mut homozygote. More than 90% of the increases in the high-kcat1 phenotype occurred when the frequency of the enz1wt/enz1mut heterozygote was <1%. Similarly, in the case with full recombination, >80% of the increases in the high-kcat1 phenotype occurred when the frequency of the enz1wt/enz1mut heterozygote was <1% (not shown). The results from the other cases we examined fell between those of full linkage and full recombination. In all cases dominance evolved as an incidental side effect of selection for alleles that have direct fitness effects.
Figure 8.—
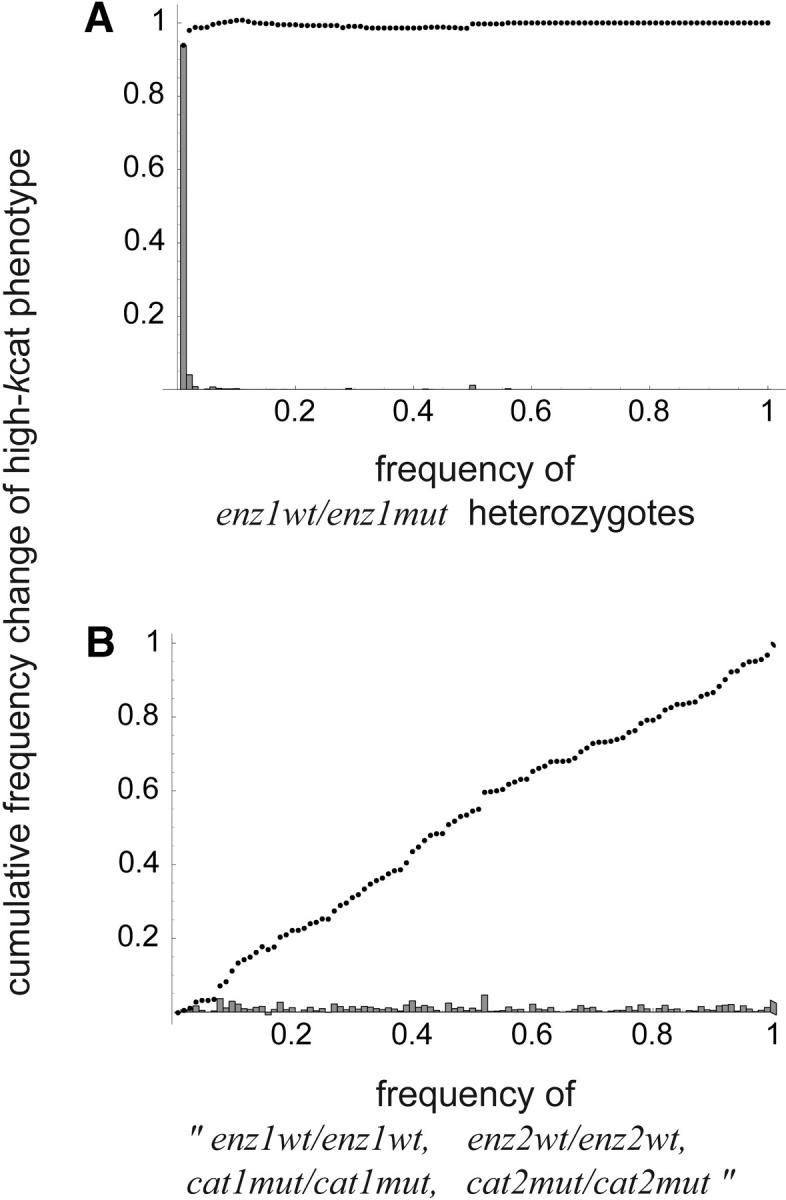
Selection for the high-kcat1 kinetic phenotype in the two-allele scenario with full linkage. Dots show cumulative frequency. Bars show frequency in each bin of width 0.01. (A) Most of the increases in the high-kcat1 phenotype occur when the frequency of the enz1wt/enz1mut heterozygote is <1%. (B) The likelihood of increases in the frequency of the high-kcat1 phenotype is not affected by the frequency of the enz1wt/enz1wt, enz2wt/enz2wt, cat1mut/cat1mut, cat2mut/cat2mut genotype.
Evolution of dominance in a continuum of alleles scenario:
Figure 9 shows simulation results from the continuum of alleles scenario. Figure 9A shows the increase of average flux as a result of selection. Figure 9, B and C, shows the evolution of dominance of the wild type with respect to null mutations at the enz loci. At low fluxes, Di values for both enz loci were near 0.5, signifying the lack of dominance effects (codominance). With the accumulation of advantageous mutations, Di values at both enz loci decreased, signaling increased dominance of wild-type flux with respect to mutations at either locus. Under the conditions we studied, mutations at the cat1 and enz1 loci had a larger effect on flux than equivalent mutations at the cat2 and enz2 loci. Consequently D1 values decreased faster than D2 values. The higher variance in  2 reflects the slower evolution at the cat2 and enz2 loci. Figure 9, D and E, shows the evolution of saturation levels, which reflects the trends in the evolution of dominance shown in Figure 9, B and C, respectively.
Figure 9.—

Evolutionary trajectories from 500 simulation trials of a continuum of alleles scenario. Horizontal axis m denotes number of mutations. Solid lines denote mean values and shaded areas denote standard deviations. (A) Evolution of the flux phenotype J (in millimolar per second). (B and C) Evolution of dominance with respect to mutations at the enz1 and enz2 loci (low Di values signify dominance of the wild type). (D and E) Evolution of saturation values.
Our results support the notion that dominance relations in a metabolic system can evolve from a state exhibiting a lack of dominance (codominance at both loci) to a state where wild-type flux is dominant with respect to mutations at both loci. These results also indicate that evolution of dominance in metabolic pathways is dependent on the evolution of saturation levels.
DISCUSSION
Overview of results and implications:
The results presented here lead to the hypothesis that if we assume the rules of saturable Michaelis-Menten enzyme kinetics, then dominance can evolve in simple metabolic pathways. Furthermore, our model supports the hypothesis that dominance modifiers in metabolism do not have to be pure modifiers and can have their own direct fitness effects. Our results support a hypothesis that Wright (1929a)(b, 1934a, 1977) and Haldane (1930) proposed very early in the debate on the evolution of dominance. Nonetheless, due partly to results from metabolic control analysis (Kacser and Burns 1981), the possibility of dual-effect alleles was not further pursued. Under simplified assumptions, results from MCA indicated that dominance of the wild type could not be concurrently modified with respect to mutations at all loci. Accordingly, if one accepts the precept that dominance is inherent and that it could not be significantly modified, then one would not need to consider dual-effect alleles.
The generality of the Kacser and Burns (1981) theory of dominance has been previously put into question by other work (Cornish-Bowden 1987; Savageau and Sorribas 1989; Savageau 1992; Grossniklaus et al. 1996; Omholt et al. 2000; Gilchrist and Nijhout 2001; Veitia 2003). The general conclusions from these earlier works are consistent with the results we present here and in Bagheri-Chaichian et al. (2003). On the basis of biochemical kinetics, our simple model suggests that dominance effects can be easily modified. Furthermore, our results indicate that dominance is likely to evolve as a side effect of selection for dual-effect alleles. Such alleles have direct fitness effects in addition to modifying effects. The role of dual-effect selection is to decrease the dependency of dominance evolution on the frequency of heterozygotes or mutation rates. Such frequency insensitivity makes it significantly easier for dominance to evolve.
The model presented in this article indicates that increased selection for higher flux can lead to increased dominance. This is consistent with the observations made by Charlesworth (1979), who questioned Fisher's model by citing empirical evidence indicating that mutants with a large deleterious effect are more likely to be recessive. The latter pattern was not predicted by Fisher's model. However, this pattern is consistent with our model and the original ideas of Haldane and Wright on the notion that selection can lead to a factor of safety against mutations (Haldane 1930, 1939; Wright 1934a,b, 1977). The strength of our conclusions would be further bolstered if they are also shown to be consistent with respect to some of the classical experimental results from bacteria. When reinterpreted, the original works on the evolution of selective neutrality in bacteria (Dykhuizen and Hartl 1980; Hartl et al. 1985; Dykhuizen et al. 1987; Dean 1989) are likely to be congruent with our results. Due to technical reasons, it is much easier to determine enzyme activity rather than enzyme concentration in cells. Hence the experimental plots of fitness in these studies were calculated with respect to enzyme activities. However, enzyme activity is dependent on both kcat and enzyme concentration E. The first impression from these fitness surfaces is that mutants must be simply moving around on a single flux surface. A common interpretation has been that this gives support to the Kacser and Burns (1981) theory. However, if such experiments were to be repeated such that enzyme concentrations and kcat could be measured or manipulated, we predict a series of flux (or fitness) surfaces similar to the ones in Figure 4. Furthermore, we hypothesize that regardless of pathway length, there are no inherent constraints on the number of enzymes that can exhibit sensitivity to a reduction in enzyme concentration. Deviations from this prediction are more likely to be due to physiological function or network structure rather than to the inherent constraints of biochemistry.
For dominance modification to be possible, a system has to allow for epistasis. In the present case, epistasis is a natural consequence of the ability to change enzyme saturation levels. Saturation allows for parts of the system to be buffered from each other. In the metabolic case, decreasing the concentration of an enzyme that is far from saturation does not greatly affect flux, provided that after the change in concentration the enzyme has not entered a saturation regime. Increasing the kcat of such an enzyme can increase robustness. This is because increases in kcat will move the enzyme farther away from saturation. Meanwhile, an enzyme that is in or near a saturation regime has a greater effect on flux. Increases in the kcat of such an enzyme can increase sensitivity as long as the new mutant is still in a saturation regime. However, sufficiently increasing the kcat of such an enzyme to a point where it is far from saturation will lead to robustness. In sum, by changing saturation levels, one can modulate how flux effects in the pathway are distributed. This amounts to robustness modification and thereby dominance modification.
The behavior of larger metabolic pathways needs to be investigated. For a sequential pathway with any number of enzymes n, the sum of control coefficients for finite changes of any magnitude can be as high as n. For finite changes, the sum of control coefficients would be 1 if and only if flux is a linear function of enzyme concentrations (Bagheri-Chaichian et al. 2003). This means that with the possibility of saturation there are no a priori constraints that limit the pathway to be always robust. Robustness will depend on the number of enzymes that are far from saturation. Another way to represent this problem is to compare the distribution of the Vmax values in the pathway with respect to the steady-state flux J. If the Vmax values are closely clustered near the steady-state flux, then the pathway would not be robust to mutations that decrease enzyme concentration. The original argument by Cornish-Bowden (1987) was made with such a scenario in mind. However, note that Vmax values do not necessarily have to be placed in a sequential descending order as illustrated by Cornish-Bowden (1987). The latter scenario was the basis on which Kacser (1987) argued that such a configuration (and hence pathway sensitivity) would be unlikely. In fact, the operative criterion should be the distribution of Vmax values and their proximity to J. The combinatorics of such a distribution are not as restrictive as a precise ordering of Vmax values. Furthermore, given that Vmax values depend on enzyme concentration and kcat, it is unlikely that the distribution of Vmax values would be independent of the physiological function of the pathway (see also Salvador and Savageau 2003). This, in turn, means that the distribution of saturation values will not be independent of the evolutionary history of the pathway.
On the strengths and weaknesses of the Kacser and Burns model:
At a time when most approaches on the topic of dominance were based on population genetic scenarios, Kacser and Burns provided us with a mechanistic theory that could explain dominance in metabolism. The vacuum that this theory filled is evident from the tremendous influence that it has had on the biological community. Articles relevant to robustness regularly cite the Kacser and Burns (1981) work. In fact, this was arguably the most successful crossover from the MCA community into the general biological community. The appeal of the theory is that it provides a starting point for considering issues relating to robustness in molecular systems. Naturally, the question that comes to mind is that if it is true that the theory is not valid in relation to dominance, then why is it commonly used? The answer has to do with the circumstances in which the underlying components of the theory hold. If selection brings a population toward a regime where most enzymes are far from saturation, then dominance would be prevalent. The error is in assuming that being far from saturation is an inherent property of metabolism. The fact is that such a state of affairs is not independent of evolution, or gene regulation, or the function of the pathway in question. Empirical observations that confirm that metabolic pathways or phenotypes are robust (see Orr 1991 for a frequently cited example) do not resolve the matter. The question is whether system robustness can be modified. If the answer to the latter question is affirmative, then the next question is why an evolved system is in a robust regime.
As a credit to their stimulating approach, Kacser and Burns considered the key issues relevant to this topic. They considered the issue of modifiers and epistasis and on the basis of their theory concluded that there were no pure modifiers. In their view, all enzymes in a pathway were potential modifiers. This is in agreement with our work. They also state that their model is an approximation based on the assumption of no saturation. Given these initial agreements, we are left with a question. Why are our conclusions different from theirs when it comes to the evolution of dominance, especially given that there have been several thoughtful follow-up works on the relevant implications and variations of the original theory (Kacser and Beeby 1984; Keightley and Kacser 1987; Reder 1988; Keightley 1989, 1996b; Kacser et al. 1990; Sauro and Kacser 1990, 1996b)? We think that the main difference stems from an excessive reliance on the flux summation theorem as a general concept. Undue reliance on the summation theorem has led to the expectation that phenotypic fragility with respect to mutations at one locus is necessarily compensated by robustness to mutations at other loci. We found no evidence for the generality of such a constraint.
For any homogeneous system, the continuous version of the summation theorem is valid (Giersch 1988). This can include homogeneous systems that account for saturation. The error is in assuming that the continuous version is a good approximation of the finite case. In effect, given that mutations have finite effects on enzyme concentrations, the continuous version of the summation theorem is the wrong formulation for addressing the issue of phenotypic robustness (Bagheri-Chaichian et al. 2003). In fact, assuming the finite version of the summation theorem immediately implies the absence of epistasis. Haldane and Wright postulated that an increase in biochemical reaction rates could lead to a “factor of safety” against underlying perturbations (Haldane 1930, 1939; Wright 1934a,b, 1977). In considering the latter possibility, Kacser and Burns (1981)(p. 664) conclude that “the summation property eliminates the necessity of postulating selection to bring enzymes into such position.” Their confidence in the generality of the summation theorem is strong enough for them to dismiss the necessity of an evolutionary explanation. They suggest that “In fact, if mutant recessivity were not general, it would throw considerable doubt on the whole of enzymology and the study of intermediary metabolism.” With regard to the latter assertion, we deem that the general applicability of the summation theorem has been overextended. We do not disagree with the assertion that metabolism can place constraints on the relation between genotype and phenotype. However, in our opinion the interaction of natural selection with these constraints cannot be dismissed.
Several studies have used versions of the Kacser and Burns (1973)(1981) equations of flux to address important evolutionary questions (Keightley and Kacser 1987; Dykhuizen et al. 1987; Dean 1989; Keightley 1989; Clark 1991; Szathmary 1993). These studies have been instrumental in pinpointing tractable means by which the underlying biochemistry could be linked to quantitative genetics and evolution. The conceptual commonality between these works is the idea that biochemistry can be used as a mechanistic representation of the genotype-phenotype map. In this way, some of the ambiguities of population-genetic models with regard to the relation between genotype and phenotype can be avoided. As such, these works serve as a convincing proof of principle and have informed our own approach to the problem of dominance evolution. Nonetheless, with one exception (Keightley and Kacser 1987), the accepted convention has been to assume that all enzymes are far from saturation. This can be justified if it is assumed that the concentration of the input substrate into the system is low. However, without the possiblity of saturation, an important biological source of epistasis is eliminated.
On the matter of gene dosage levels, Hurst and Randerson (2000) have proposed that it is important to consider the fitness costs of enzyme production. Our results indicate that the consideration of costs may be particularly relevant, because increases in enzyme concentration imply an immediate use of resources, while an increase in kcat does not necessarily imply such a cost. In this regard, it is noteworthy that from a mathematical perspective both changes in kcati and Ei can result in dominance modification. It is only due to the biological differences between what these values represent and the traditional framework of this debate that we have concentrated on the effects of kcat as the modifier.
We should note that there is an asymmetry with regard to the robustness effects of enzyme saturation. For pathways with simple saturation kinetics, one needs only a single enzyme near saturation to render flux robust with respect to increases in the concentration of all other enzymes. This holds regardless of how large the increases are. Conversely, with respect to decreases in enzyme concentration, any enzyme can enter a saturation regime and affect flux. The latter argument holds irrespective of the number of enzymes in the pathway. The consequences of the type of epistasis caused by this asymmetry deserve further attention, especially in larger pathways. This asymmetry is likely to play a role in the order of allele selection. The order of selective sweeps shown in Figure 7 is a simple example (see Kondrashov and Kondrashov 2001 for a different example). The issue of this assymetry is further important given that part of the Kacser and Burns (1981) position on dominance hinges on the assumption that most enzymes are unlikely to be within reach of saturation (Kacser 1987; Porteous 1996). We think that the latter argument suffers from three weaknesses. One is that its veracity is dependent on the magnitude of the reduction in enzyme concentration. A second is that the degree of saturation is dependent on the input sin into the system, which can depend on the environment. But more importantly, it assumes that enzyme activities are sampled uniformly from a high-dimensional space of parameter values. This ignores the dependence of enzyme concentrations and kcat values on the evolutionary trajectory through which they have reached particular values. For example, consider the situation we outlined above, whereupon most increases in activity cannot have a large fitness effect if some other enzyme in the pathway is saturated. It follows that enzyme activities cannot be selected to be higher unless there is some correlation between their values. Under such a situation, enzyme activities within a pathway will exhibit a certain degree of correlation due to a codependent cycle of allele selection at several loci. Of course, this also depends on the strength of selection and the nature of the gene regulatory network in question.
Despite our present focus on the relation between saturation and epistasis, we should note that for more complicated types of enzyme kinetics additional factors can lead to nonlinear effects and epistasis. In a detailed pair of follow-up works, Kacser et al. (1990) and Sauro and Kacser (1990) address some of these issues. The latter work is highly interesting, and we think that it may provide avenues for reconciling the MCA approach with an evolutionary perspective. In the first, Kacser et al. (1990) address the effects of what they term as “non-additivity.” In the classical Michaelis-Menten scheme, for any enzyme i, the rate of the isolated enzyme vi is proportional to enzyme concentration Ei. Hence δvi/vi = δEi/Ei. As an alternative, Kacser et al. (1990) study situations in which δvi/vi ≠ δEi/Ei. The point of interest here is to note that the latter proposition is equivalent to saying that ∂2Eivi ≠ 0. In population genetics, if vi were to be the phenotype, the term ∂2Eivi would be referred to as the dominance term (Rice 2002). In the second work, Sauro and Kacser (1990) investigate the effects of “non-independence.” Specifically, they study situations involving enzyme-enzyme complexes. In this case, a rate vi driven by an enzyme Ei is affected by the concentration of another enzyme Ej. This is in essence a consideration of epistasis with respect to vi. It will take some effort to understand how epistasis or dominance with respect to the vi terms translates into a relationship with respect to the flux phenotype J. Interestingly, in both cases they find that  . Clearly, this may be of relevance to the issue of dominance and the Kacser and Burns (1981) theory. Unfortunately the issue of dominance is not discussed in these articles. They do reformulate a summation theorem with elasticity coefficients serving as correction terms. But the effect of such a treatment has not been clarified with respect to the issue of dominance. Nonetheless, there is a general recognition that for nonideal pathways modified versions of the original summation theorem have to be applied. Examples are the physical channeling of metabolites, enzyme-enzyme association, and spatial heterogeneity (Kholodenko and Westerhoff 1995; Kholodenko et al. 1998; Peletier et al. 2003).
The interesting aspect of the relevant conceptual history is that, with the passage of time, the distinction between the views of Wright and Haldane and those of Kacser and Burns has been at times blurred. However, there are crucial differences. Wright and Haldane clearly had no problem with the concept that dominance could be modified or that it could evolve (Wright 1929a,b, 1934a, 1977; Haldane 1930, 1939, 1956). Their objection was only to the specifics of Fisher's population genetic argument. In fact, as early as 1927, in a series of experiments on guinea pig coat color, Wright had observed dominance modification effects in what he determined to be a seven-locus system (Wright 1927). Haldane and Wright proposed that an increase in biochemical reaction rates could lead to a factor of safety. Hence the main commonality of viewpoint between Haldane and Wright on the one hand and Kacser and Burns on the other is the idea that biochemistry is the proximal cause for dominance. However, there is no logical congruence between the two parties on the evolutionary origin of dominance. The position advocated by Kacser and Burns was that evolution has nothing to do with dominance, other than the fact that evolution has led to the existence of organisms with an enzyme-catalyzed metabolism. The core of this argument is that by their very nature multienzyme systems are insensitive with respect to changes in enzyme concentrations (Kacser and Burns 1973, 1981; Kacser 1987, 1991, 1995; Keightley 1996a; Porteous 1996). We maintain that this assertion should be subject to inquiry.
Predictions:
This work does not question the fact that flux rates can exhibit a plateau effect with respect to increases in enzyme concentrations. However, we question the prevalent view that due to inherent constraints of the biochemistry most enzyme concentrations have to be situated deep into the insensitive region of this plateau. We further maintain that for any given set of enzyme concentrations the curvature of the plateau effect can be modified. A system can be driven between regimes where flux is sensitive to a reduction in the concentration of any enzyme and regimes where flux is robust to all such reductions. The location of a system within this spectrum can be modulated by both enzyme concentrations and kcat values. This in turn depends on physiological function and evolutionary history.
With regard to evolution and natural history, the results presented in this work point toward some testable predictions. If selection for higher flux can lead to higher kcat or higher enzyme concentrations, the expectation would be that pathways that have undergone more selection for increased flux should exhibit enzymes that are far from saturation. Furthermore, the wild-type phenotype for such pathways should exhibit dominance. For example, pathways that are essential for the growth rate of the organism should exhibit more dominance. Meanwhile, for phenotypes associated with pathways whose reaction rates are less consequential for growth or survival, one would expect less dominance. Furthermore, a particular phenotype may exhibit more dominance the longer it has been subject to selection. Such predictions should be more reliable for exergonic pathways, where the inverse relationship between saturation and dominance is more straightforward. Given that low saturation is more likely for pathways with a majority of endergonic steps (i.e., anabolism), it is possible that in the endergonic case the manifestation of dominance is less dependent on selection.
From the experimental perspective, the results in this work, in addition to previous analytical results (Bagheri-Chaichian et al. 2003), leave us with a simple hypothesis. In a sequential pathway, there are no a priori constraints that limit the number of enzymes that can affect flux due to a reduction in their concentration. Mutations affecting kcat or enzyme concentrations can modify saturation levels and the sensitivity of a metabolic phenotype to changes in the concentration of any number of relevant enzymes. This in turn can lead to the modification and evolution of dominance with respect to the effects of mutations that affect flux.
Acknowledgments
The criticisms of S. Otto as editor and an anonymous reviewer were highly constructive. M. Girvan's advice greatly improved this work. Discussions with W. Fontana, E. Jen, D. Krakauer, D. Varn, P. Bagheri, L. Bagheri, and countless members of the Wagner lab have been invaluable. The encouragement and support of M. Achtman and members of his group at Max Planck Institute for Infection Biology are highly appreciated. This work was financially supported by Yale University, Santa Fe Institute, and Max Planck Institute for Molecular Genetics.
APPENDIX A:
STEADY-STATE SOLUTION FOR FLUX J
To calculate the steady-state flux J, we require a solution to the systems of equations in (8) and (9) when the derivatives of the intermediate substrates are set to zero. Given the stoichiometry of the pathway under consideration, we know that the flux through the system has to equal the net influx rate of the outside substrate sin into the system. Hence,
 |
A1 |
Substituting (A1) into (8) and combining the result with (9) we are left with a system of eight equations:
 |
A2 |
 |
A3 |
 |
A4 |
 |
A5 |
 |
A6 |
 |
A7 |
 |
A8 |
 |
A9 |
Equation 10 is derived by combining Equations A2, A3, and A8. Equations A4, A5, A8, and A9 lead to Equation 11. Finally, Equation 12 is derived by combining Equations A6, A7, and A9. The simultaneous equations represented in Equations 10–12 combine to yield three analytical solutions for J. Each solution is a twelfth-order polynomial in E, K, sin, and q. Due to their length, the solutions are not presented here. We designate these solutions as the functions g1, g2, and g3, where for each alternative solution gi we have
 |
A10 |
For any given set of variables E, K, sin, and q, we found one solution g* ∈ {g1, g2, g3} that corresponds to positive real values for intermediate substrate concentrations and flux. The other two solutions render either complex or negative numbers for the values of intermediate substrate concentrations or flux. There is no a priori criterion that tells us which solution will yield the physically realistic solution. Consequently, for any set of variables E, K, sin, and q, all three solutions have to be evaluated to find the physically realistic solution for J (see appendix B for implementation). For algebraic derivations and numerical evaluations we used Mathematica 4 (Wolfram Research 1999).
APPENDIX B
Monte Carlo sampling of the effects of kcat variation:
The derivatives ∂αi J and ∂αi∂Ei J are twelfth-order polynomials. The analytical treatment of these polynomials would be difficult, given that proving the nonnegativity of a polynomial is NP-hard (not solvable in polynomial time) when the order of the polynomial is >3. Thereby we used a Monte Carlo sampling approach. To survey the values of ∂αi J and ∂αi∂Ei J, we sampled 3 × 10⁴ data points (1.5 × 10⁴ for each enzyme i). Each data point p represents a random sampling in the 12-dimensional space composed of E × K × sin × q. For any variable E* ∈ {E1, E2}, a number x was sampled uniformly from the real interval 0 ≤ x ≤ 0.1, such that E* = x mm. The resultant values of E* are a good representative of ranges found in E. coli and yeast (Albe et al. 1990). Nonetheless, enzyme concentrations in these organisms can sometimes be higher than the upper bound we used here (Albe et al. 1990). For any variable k* ∈ kcat1, kd2, kcat2, an exponent x was sampled uniformly from the real interval 0 ≤ x ≤ 5, such that k* = 10xsec−1. For any variable k* ∈ ka1, krev1, ka2, krev2, an exponent x was sampled uniformly from the real interval 0 ≤ x ≤ 6, such that k* = 10x mm−1 sec−1. Empirical values for kcati and krevi in wild-type enzymes can typically range between 103 and 106 mm−1 sec−1 (Monasterio 2001). Given our interest in the evolution of catalysis, we opted to include mutants with lower catalytic constants. We chose 106 as the upper bound and allowed the lower bound to be at 100 to allow for enzymes that have not been optimized. For ka1 and kdi, empirical values for wild-type enzymes can range between 101 and 105 sec−1 (Monasterio 2001). We chose the range 100–105 sec−1. Our sampling regime in K yields the interval 10−11 ≤ keqi ≤ 1011 for the equilibrium constant of each reaction associated with an enzyme i. For the variable q, an exponent x was sampled uniformly from the real interval −1 ≤ x ≤ 5, such that q = 10x sec−1. In general as q → 10−1, the diffusion barrier becomes a significant limiting factor on maximal flux. Conversely, as q → 105 the effect of the diffusion barrier on maximal flux becomes insignificant. For the input variable sin, a number x was sampled uniformly from the real interval 0 ≤ x ≤ 10, such that sin = x mm. The interval used for sin falls within ranges used by experimentalists for carbohydrate concentrations in nutrient media (Dean 1989).
Evaluation of analytical solutions:
For any given p ∈ {E × K × sin × q} we had to determine the solution g* ∈ {g1, g2, g3} that corresponds to positive real values for intermediate substrate concentrations and flux. We first evaluated the three analytical solutions g1, g2, and g3 to obtain the three possible values for J. We then implemented a Newton-Raphson-type numerical solving routine on Equations A2–A9, through which we determined the steady-state solutions of J and the state variables e1, e2, es1, es2, s1, s2, and s3. We compared the numerically derived physical solution of J with the three analytically derived ones. Thereby we could determine which of the analytical solutions from the set {g1, g2, g3} gave the physically realistic solution. The use of the numerical procedure for identifying the physically realistic analytical solution had two advantages. First, it allowed us to avoid having to independently evaluate three analytical solutions for each of the variables e1, e2, es1, es2, s1, s2, and s3 (i.e., 21 evaluations). Second, it served as a confirmation of the analytical solution of J.
Given the analytical version of the physical solution g* and the substitutions in equation set (15), we could subsequently evaluate the values of ∂αi J and ∂αi∂Ei J using the appropriate derivatives of g*. Note that since the polynomials given by the latter solution are very long, the complex-valued part of the physical solution does not completely vanish unless the numerical precision for such evaluations is high. For evaluations of the analytical expressions for J, ∂αi J, and ∂αi∂Ei J we used a precision of 32 digits. For evaluations of the numerical approximations of J we used a precision of 48 digits. Data points for which J < 10−8 were thrown out due to precision problems they posed for the numerical routine.
Particular case studies and population dynamics:
For the particular examples presented in Figures 4 and 6, and the two-allele evolutionary scenarios, the wild-type kinetic parameters used were  , and
, and  . The diffusion constant used was q = 1.5 × 101 sec−1. For each enzyme Keq = 70. The environmental input sin was set at 0.75 mm.
In the simulations of the two-allele scenario, high enzyme concentrations were set at 10 μm and intermediate enzyme concentrations were set at 5 μm. High-kcat = 7 × 10² sec−1. Low-kcat = 0.2 × high-kcat. The values of krevi were scaled accordingly to keep Keq constant.
For the continuum of alleles scenario, the starting kinetic conditions were set as in the particular examples for Figures 4 and 6, except that kcati and krevi values were reduced 10-fold (i.e., α1 = α2 = 0.1). Starting enzyme concentrations were set at 1 μm.
References
- Acerenza, L., 2000. Design of large metabolic responses, constraints and sensitivity analysis. J. Theor. Biol. 207: 265–282. [DOI] [PubMed] [Google Scholar]
- Albe, K., M. Butler and B. Wright, 1990. Cellular concentrations of enzymes and their substrates. J. Theor. Biol. 143: 163–195. [DOI] [PubMed] [Google Scholar]
- Ancel, L. W., and W. Fontana, 2000. Plasticity, evolvability and modularity in RNA. J. Exp. Zool. (Mol. Dev. Evol.) 288: 242–283. [DOI] [PubMed] [Google Scholar]
- Bagheri-Chaichian, H., J. Hermisson, J. R. Vaisnys and G. P. Wagner, 2003. Effects of epistasis on phenotypic robustness in metabolic pathways. Math. Biosci. 184: 27–51. [DOI] [PubMed] [Google Scholar]
- Bergman, A., and M. L. Siegal, 2003. Evolutionary capacitance as a general feature of complex gene networks. Nature 424: 549–552. [DOI] [PubMed] [Google Scholar]
- Bodmer, W. F., and P. A. Parsons, 1962. Linkage and recombination in evolution. Adv. Genet. 11: 1–100. [Google Scholar]
- Bourguet, D., 1999. The evolution of dominance. Heredity 83: 1–4. [DOI] [PubMed] [Google Scholar]
- Bourguet, D., and M. Raymond, 1998. The molecular basis of dominance relationships: the case of some recent adaptive genes. J. Evol. Biol. 11: 103–122. [Google Scholar]
- Bourguet, D., M. Prout and M. Raymond, 1996. Dominance of insecticide resistance presents a plastic response. Genetics 143: 407–416. [DOI] [PMC free article] [PubMed] [Google Scholar]
- Bourguet, D., T. Lenormand, T. Guillemaud, V. Marcel, D. Fournier and M. Raymond, 1997. Variation of dominance of newly arisen adaptive genes. Genetics 147: 1225–1234. [DOI] [PMC free article] [PubMed] [Google Scholar]
- Bridges, C., 1913. Non-disjunction of sex chromosome of Drosophila. J. Exp. Zool. 15: 587–606. [Google Scholar]
- Bürger, R., 1983. a On the evolution of dominance modifiers. I. A nonlinear analysis. J. Theor. Biol. 101: 585–598. [DOI] [PubMed] [Google Scholar]
- Bürger, R., 1983. b Dynamics of the classical genetic model for the evolution of dominance. Math. Biosci. 67: 125–143. [Google Scholar]
- Bürger, R., 1983. c Nonlinear analysis of some models for the evolution of dominance. J. Math. Biol. 16: 269–280. [Google Scholar]
- Charlesworth, B., 1979. Evidence against Fisher's theory of dominance. Nature 278: 848–849. [Google Scholar]
- Charlesworth, D., and B. Charlesworth, 1975. Theoretical genetics of Batesian mimicry iii. The evolution of dominance. J. Theor. Biol. 55: 325–337. [DOI] [PubMed] [Google Scholar]
- Clark, A. G., 1991. Mutation selection balance and metabolic control theory. Genetics 129: 909–923. [DOI] [PMC free article] [PubMed] [Google Scholar]
- Clarke, C. A., and P. O'Donald, 1964. Frequency dependent selection. Heredity 19: 201–206. [Google Scholar]
- Clarke, C. A., and P. M. Sheppard, 1960. a The evolution of dominance under disruptive selection. Heredity 14: 73–87. [Google Scholar]
- Clarke, C. A., and P. M. Sheppard, 1960. b The evolution of mimicry in the butterfly Papilio dardanus. Heredity 14: 163–173. [Google Scholar]
- Cornish-Bowden, A., 1987. Dominance is not inevitable. J. Theor. Biol. 125: 333–338. [DOI] [PubMed] [Google Scholar]
- Cornish-Bowden, A., 1989. Metabolic control theory and biochemical systems theory: different objectives, different assumptions, different results. J. Theor. Biol. 136: 365–377. [DOI] [PubMed] [Google Scholar]
- Crow, J. F., and M. Kimura, 1970 An Introduction to Population Genetic Theory. Harper & Row, New York.
- de Visser, J. A. G. M., J. Hermisson, G. P. Wagner, L. A. Meyers, H. Bagheri-Chaichian et al., 2003. Perspective: evolution and detection of genetic robustness. Evolution 57: 1959–1972. [DOI] [PubMed] [Google Scholar]
- Dean, A. M., 1989. Selection and neutrality in lactose operons of Escherichia coli. Genetics 123: 441–454. [DOI] [PMC free article] [PubMed] [Google Scholar]
- Dunn, R. B., and A. S. Fraser, 1958. Selection for an invariant character—vibrissae number—in the house mouse. Nature 181: 1018–1019. [DOI] [PubMed] [Google Scholar]
- Dykhuizen, D., and D. L. Hartl, 1980. Selective neutrality of 6PGD allozymes in E. coli and the effects of genetic background. Genetics 96: 801–817. [DOI] [PMC free article] [PubMed] [Google Scholar]
- Dykhuizen, D., A. Dean and D. L. Hartl, 1987. Metabolic flux and fitness. Genetics 115: 25–31. [DOI] [PMC free article] [PubMed] [Google Scholar]
- Eshel, I., and C. Matessi, 1998. Canalization, genetic assimilation and preadaptation: a quantitative genetic model. Genetics 149: 2119–2133. [DOI] [PMC free article] [PubMed] [Google Scholar]
- Ewens, W. J., 1966. Linkage and the evolution of dominance. Heredity 21: 363–370. [DOI] [PubMed] [Google Scholar]
- Fares, M., M. Ruiz-Gonzalez, A. Moya and S. Elena, 2002. Groel buffers against deleterious mutations. Nature 417: 398. [DOI] [PubMed] [Google Scholar]
- Feldman, M. W., and S. Karlin, 1971. The evolution of dominance: a direct approach through the theory of linkage and selection. Theor. Popul. Biol. 2: 482–492. [DOI] [PubMed] [Google Scholar]
- Fell, D., 1997 Understanding the Control of Metabolism. Portland Press, London.
- Fell, D. A., 1992. Metabolic control analysis: a survey of its theoretical and experimental aspects. Biochem. J. 286: 313–330. [DOI] [PMC free article] [PubMed] [Google Scholar]
- Fisher, R. A., 1927. On some objections to mimmicry theory; statistical and genetic. Trans. R. Ent. Soc. Lond. 75: 269–278. [Google Scholar]
- Fisher, R. A., 1928. a The possible modification of the response of the wild type to recurrent mutations. Am. Nat. 62: 115–126. [Google Scholar]
- Fisher, R. A., 1928. b Two further notes on the origin of dominance. Am. Nat. 62: 571–574. [Google Scholar]
- Fisher, R. A., 1929. The evolution of dominance; reply to Professor Sewall Wright. Am. Nat. 63: 553–556. [Google Scholar]
- Fisher, R. A., 1931. The evolution of dominance. Biol. Rev. 6: 345–368. [Google Scholar]
- Fisher, R. A., 1934. Professor Wright on the theory of dominance. Am. Nat. 68: 370–374. [Google Scholar]
- Fisher, R. A., 1958 The Genetical Theory of Natural Selection. Dover, New York.
- Fisher, R. A., and E. B. Ford, 1926. Variability of species. Nature 118: 515–516. [Google Scholar]
- Forsdyke, D. R., 1994. The heat-shock response and the molecular basis of genetic dominance. J. Theor. Biol. 167: 1–5. [DOI] [PubMed] [Google Scholar]
- Gavrilets, S., and A. Hastings, 1994. A quantitative-genetic model for selection on developmental noise. Evolution 48: 1478–1486. [DOI] [PubMed] [Google Scholar]
- Gibson, G., and G. P. Wagner, 2000. Canalization in evolutionary theory: a stabilizing theory. BioEssays 22: 372–380. [DOI] [PubMed] [Google Scholar]
- Giersch, C., 1988. Control analysis of metabolic networks. Eur. J. Biochem. 174: 509–513. [DOI] [PubMed] [Google Scholar]
- Gilchrist, M. A., and H. Nijhout, 2001. Nonlinear developmental processes as sources of dominance. Genetics 159: 423–432. [DOI] [PMC free article] [PubMed] [Google Scholar]
- Grossniklaus, U., M. Madhusudhan and V. Nanjundiah, 1996. Nonlinear enzyme kinetics can lead to high metabolic flux control coefficients: implications for the evolution of dominance. J. Theor. Biol. 182: 299–302. [DOI] [PubMed] [Google Scholar]
- Haldane, J. B. S., 1930. A note on Fisher's theory of the origin of dominance and a correlation between dominance and linkage. Am. Nat. 64: 87–90. [Google Scholar]
- Haldane, J. B. S., 1939. The theory of the evolution of dominance. Am. Nat. 37: 365–374. [Google Scholar]
- Haldane, J. B. S., 1956. The theory of selection for melanism in Lepidoptera. Proc. R. Soc. Lond. Ser. B 145: 303–306. [DOI] [PubMed] [Google Scholar]
- Hansen, T. F., and G. P. Wagner, 2001. Modeling genetic architecture: a multilinear theory of gene interaction. Theor. Popul. Biol. 59: 61–86. [DOI] [PubMed] [Google Scholar]
- Hartl, D. L., and C. H. Taubes, 1996. Compensatory nearly neutral mutations: selection against adaptation. J. Theor. Biol. 182: 303–309. [DOI] [PubMed] [Google Scholar]
- Hartl, D. L., D. Dykhuizen and A. M. Dean, 1985. Limits of adaptation: the evolution of selective neutrality. Genetics 111: 655–674. [DOI] [PMC free article] [PubMed] [Google Scholar]
- Hartman, J. L. t., B. Garvik and L. Hartwell, 2001. Principles for the buffering of genetic variation. Science 291: 1001–1004. [DOI] [PubMed] [Google Scholar]
- Hartwell, L., 2004. Robust interactions. Science 303: 774–775. [DOI] [PubMed] [Google Scholar]
- Heinrich, R., and T. A. Rapoport, 1974. A linear steady-state treatment of enzymatic chains. General properties, control and effector strength. Eur. J. Biochem. 42: 89–95. [DOI] [PubMed] [Google Scholar]
- Heinrich, R., and S. Schuster, 1996 The Regulation of Cellular Systems. Chapman & Hall, New York.
- Hofer, T., and R. Heinrich, 1993. A second order approach to metabolic control analysis. J. Theor. Biol. 164: 85–102. [DOI] [PubMed] [Google Scholar]
- Hurst, L. D., and J. P. Randerson, 2000. Dosage, deletions and dominance: simple models of the evolution of gene expression. J. Theor. Biol. 205: 641–647. [DOI] [PubMed] [Google Scholar]
- Jennings, H. S., 1917. Modifying factors and multiple allele morphs in relation to the results of selection. Am. Nat. 52: 301–306. [Google Scholar]
- Kacser, H., 1987. Dominance not inevitable but very likely. J. Theor. Biol. 126: 505–506. [DOI] [PubMed] [Google Scholar]
- Kacser, H., 1991. A superior theory? J. Theor. Biol. 149: 141–144. [DOI] [PubMed] [Google Scholar]
- Kacser, H., 1995. Recent developments in metabolic control analysis. Biochem. Soc. Trans. 23: 387–391. [DOI] [PubMed] [Google Scholar]
- Kacser, H., and L. Acarenza, 1993. A universal method for achieving increases in metabolite production. Eur. J. Biochem. 216: 361–367. [DOI] [PubMed] [Google Scholar]
- Kacser, H., and R. Beeby, 1984. Evolution of catalytic proteins or on the origin of enzyme species by means of natural selection. J. Mol. Evol. 20: 38–51. [DOI] [PubMed] [Google Scholar]
- Kacser, H., and J. A. Burns, 1973. The control of flux. Symp. Soc. Exp. Biol. 27: 65–104. [PubMed] [Google Scholar]
- Kacser, H., and J. A. Burns, 1981. The molecular basis of dominance. Genetics 97: 639–666. [DOI] [PMC free article] [PubMed] [Google Scholar]
- Kacser, H., H. M. Sauro and L. Acarenza, 1990. Enzyme-enzyme interactions and control analysis. 1. The case of additivity: monomer oligomer associations. Eur. J. Biochem. 187: 481–491. [DOI] [PubMed] [Google Scholar]
- Kacser, H., J. A. Burns and D. Fell, 1995. The control of flux: 21 years on. The control of flux. Biochem. Soc. Trans. 23: 341–366. [DOI] [PubMed] [Google Scholar]
- Keightley, P. D., 1989. Models of quantitative variation of flux in metabolic pathways. Genetics 121: 869–876. [DOI] [PMC free article] [PubMed] [Google Scholar]
- Keightley, P. D., 1996. a A metabolic basis for dominance and recessivity. Genetics 143: 621–625. [DOI] [PMC free article] [PubMed] [Google Scholar]
- Keightley, P. D., 1996. b Metabolic models of selection response. J. Theor. Biol. 182: 311–316. [DOI] [PubMed] [Google Scholar]
- Keightley, P. D., and H. Kacser, 1987. Dominance, pleiotropy and metabolic structure. Genetics 117: 319–329. [DOI] [PMC free article] [PubMed] [Google Scholar]
- Kholodenko, B., and H. Westerhoff, 1995. The macroworld versus the microworld of biochemical regulation and control. Trends Biochem. Sci. 20: 52–54. [DOI] [PubMed] [Google Scholar]
- Kholodenko, B., D. Molenaar, S. Schuster, R. Heinrich and H. Westerhoff, 1995. Defining control coefficients in non-ideal metabolic pathways. Biophys. Chem. 56: 215–226. [DOI] [PubMed] [Google Scholar]
- Kholodenko, B., J. Rohwer, M. Cascante and H. Westerhoff, 1998. Subtleties in control by metabolic channelling and enzyme organization. Mol. Cell. Biochem. 184: 311–320. [PubMed] [Google Scholar]
- Kondrashov, F. A., and A. S. Kondrashov, 2001. Multidimensional epistasis and the disadvantage of sex. Proc. Natl. Acad. Sci. USA 98: 12089–12092. [DOI] [PMC free article] [PubMed] [Google Scholar]
- Lancefield, D. E., 1918. An autosomal bristle modifier affecting a sex-linked character. Am. Nat. 52: 462–464. [Google Scholar]
- Mayo, O., and R. Burger, 1997. Evolution of dominance: A theory whose time has passed? Biol. Rev. 72: 97–110. [Google Scholar]
- Meiklejohn, C., and D. Hartl, 2002. A single mode of canalization. TREE 17: 468–473. [Google Scholar]
- Monasterio, O., 2001. Rate constants determined by nuclear magnetic resonance. Methods 24: 97–103. [DOI] [PubMed] [Google Scholar]
- Morgan, T. H., C. B. Bridges and A. H. Sturtevant, 1925. The genetics of Drosophila. Bibliogr. Genet. II: 1–262. [Google Scholar]
- Muller, H. J., 1932 Further studies on the nature of mutations, pp. 213–255 in Proceedings of the Sixth International Congress of Genetics. International Congress of Genetics, Ithaca, NY.
- Nijhout, H. F., 2002. The nature of robustness in development. BioEssays 24: 553–563. [DOI] [PubMed] [Google Scholar]
- Nijhout, H. F., and S. M. Paulsen, 1997. Developmental models and polygenic characters. Am. Nat. 149: 394–405. [Google Scholar]
- Niven, J. E., 2004. Channelling evolution. PLoS Biol. 2: 22–24. [DOI] [PMC free article] [PubMed] [Google Scholar]
- O'Donald, P., and J. A. Barrett, 1973. Evolution of dominance in polymorphic Batesian mimmicry. Theor. Popul. Biol. 4: 173–192. [Google Scholar]
- Omholt, S., E. Plahte, L. Oyehaug and K. Xiang, 2000. Gene regulatory networks generating the the phenomena of additivity, dominance and epistasis. Genetics 155: 969–980. [DOI] [PMC free article] [PubMed] [Google Scholar]
- Orr, H. A., 1991. A test of Fisher's theory of dominance. Proc. Natl. Acad. Sci. USA 88: 11413–11415. [DOI] [PMC free article] [PubMed] [Google Scholar]
- Otto, S., and D. Bourguet, 1999. Balanced polymorphism and the evolution of dominance. Am. Nat. 153: 561–574. [DOI] [PubMed] [Google Scholar]
- Papp, B., C. Pal and L. Hurst, 2003. Dosage sensitivity and the evolution of gene families in yeast. Nature 424: 194–197. [DOI] [PubMed] [Google Scholar]
- Parsons, P. A., and W. F. Bodmer, 1961. The evolution of overdominance: natural selection and heterozygote advantage. Nature 190: 7–12. [DOI] [PubMed] [Google Scholar]
- Peletier, M. A., H. V. Westerhoff and B. N. Kholodenko, 2003. Control of spatially heterogeneous and time-varying cellular reaction networks: a new summation law. J. Theor. Biol. 225: 477–487. [DOI] [PubMed] [Google Scholar]
- Plunkett, C. R., 1933. A contribution to the theory of dominance. Am. Nat. 67: 84–85. [Google Scholar]
- Porteous, J. W., 1996. Dominance—one hundred and fifteen years after Mendel's paper. J. Theor. Biol. 182: 223–232. [DOI] [PubMed] [Google Scholar]
- Reder, C., 1988. Metabolic control theory: a structural approach. J. Theor. Biol. 135: 175–201. [DOI] [PubMed] [Google Scholar]
- Rendel, J. M., 1967 Canalization and Gene Control. Academic Press, New York.
- Rice, S. H., 1998. The evolution of canalization and the breaking of von baer's laws: modelling the evolution of development with epistasis. Evolution 52: 647–656. [DOI] [PubMed] [Google Scholar]
- Rice, S. H., 2000 The evolution of developmental interactions, pp. 82–98 in Epistasis and the Evolutionary Process, edited by J. B. Wolf, E. D. Brodie and M. J. Wade. Oxford University Press, New York.
- Rice, S. H., 2002. A general population genetic theory for the evolution of developmental interactions. Proc. Natl. Acad. Sci. USA 99: 15518–15523. [DOI] [PMC free article] [PubMed] [Google Scholar]
- Rutheford, S., and S. Lindquist, 1998. Hsp90 as a capacitor of morphological evolution. Nature 396: 336–342. [DOI] [PubMed] [Google Scholar]
- Salvador, A., and M. A. Savageau, 2003. Quantitative evolutionary design of glucose 6-phosphate dehydrogenase expression in human erythrocytes. Proc. Natl. Acad. Sci. USA 100: 14463–14468. [DOI] [PMC free article] [PubMed] [Google Scholar]
- Sauro, H. M., and H. Kacser, 1990. Enzyme-enzyme interactions and control analysis. 2. The case of non-independence: heterologous associations. Eur. J. Biochem. 187: 493–500. [DOI] [PubMed] [Google Scholar]
- Savageau, M. A., 1992. Dominance according to metabolic control analysis: Major achievement or house of cards? J. Theor. Biol. 154: 131–136. [DOI] [PubMed] [Google Scholar]
- Savageau, M. A., and A. Sorribas, 1989. Constraints among molecular and systemic properties: implications for physiological genetics. J. Theor. Biol. 141: 93–115. [DOI] [PubMed] [Google Scholar]
- Scharloo, W., 1991. Canalization: genetic and developmental aspects. Annu. Rev. Ecol. Syst. 22: 65–93. [Google Scholar]
- Schmalhausen, I. I., 1949 Factors of Evolution: The Theory of Stabilizing Selection. University of Chicago Press, Chicago.
- Schuster, S., and R. Heinrich, 1992. The definitions of metabolic control analysis revisited. Biosystems 27: 1–15. [DOI] [PubMed] [Google Scholar]
- Sheppard, P. M., and E. B. Ford, 1966. Natural selection and the evolution of dominance. Heredity 21: 139–147. [DOI] [PubMed] [Google Scholar]
- Siegal, M. L., and A. Bergman, 2002. Waddington's canalization revisited: developmental stability and evolution. Proc. Natl. Acad. Sci. USA 99: 10528–10532. [DOI] [PMC free article] [PubMed] [Google Scholar]
- Small, R., and H. Kacser, 1993. a Responses of metabolic systems to large changes in enzyme activities and effectors. 1. The linear treatment of unbranched chains. Eur. J. Biochem. 213: 613–624. [DOI] [PubMed] [Google Scholar]
- Small, R., and H. Kacser, 1993. b Responses of metabolic systems to large changes in enzyme activities and effectors. 2. The linear treatment of branched pathways and metabolite concentrations. Assessment of the general non-linear case. Eur. J. Biochem. 213: 625–640. [DOI] [PubMed] [Google Scholar]
- Sole, R., and B. Goodwin, 2000 Signs of Life. Basic Books, New York.
- Sondhi, K. C., 1960. Selection for a character with a bounded distribution of phenotypes in Drosophila subobscura. Nature 57: 193–221. [Google Scholar]
- Stearns, S. C., 2002. Progress on canalization. Proc. Natl. Acad. Sci. USA 99: 10229–10239. [DOI] [PMC free article] [PubMed] [Google Scholar]
- Stearns, S. C., 2003. Safeguards and spurs. Nature 424: 501–504. [DOI] [PubMed] [Google Scholar]
- Stearns, S. C., and T. J. Kawecki, 1994. Fitness sensitivity and the canalization of life history traits. Evolution 48: 1438–1450. [DOI] [PubMed] [Google Scholar]
- Stearns, S. C., M. Kaiser and T. J. Kawecki, 1995. The differential canalization of fitness components against environmental perturbations in Drosophila melanogaster. J. Evol. Biol. 8: 539–557. [Google Scholar]
- Sved, J., and O. Mayo, 1970 Mathematical Topics in Quantitative Genetics, pp. 289–316. Springer-Verlag, Berlin.
- Szathmary, E., 1993. Do deleterious mutations act synergistically? Metabolic control theory provides a partial answer. Genetics 133: 127–132. [DOI] [PMC free article] [PubMed] [Google Scholar]
- Thomas, S., and D. A. Fell, 1996. Design of metabolic control for large flux changes. J. Theor. Biol. 182: 285–298. [DOI] [PubMed] [Google Scholar]
- Timofeeff-Ressovsky, N. W., 1927. Studies on the phenotypic manifestation of hereditary factors. I. On the phenotypic manifestation of the genovariation radius incompletus in Drosophila funebris. Genetics 12: 128–198. [DOI] [PMC free article] [PubMed] [Google Scholar]
- Tower, W. L., 1910. The determination of dominance and the modification of behavior in alternative (Mendelian) inheritance, by conditions surrounding or incident upon the germ cells at fertilization. Biol. Bull. 18: 285–352. [Google Scholar]
- True, J. R., 2003. Insect melanism: the molecules matter. TREE 18: 640–647. [Google Scholar]
- Turelli, M., and H. A. Orr, 1995. The dominance theory of Haldane's rule. Genetics 140: 389–402. [DOI] [PMC free article] [PubMed] [Google Scholar]
- Veitia, R. A., 2003. Nonlinear effects in macromolecular assembly and dosage sensitivity. J. Theor. Biol. 220: 19–25. [DOI] [PubMed] [Google Scholar]
- Waddington, C. H., 1942. Canalization of development and the inheritance of acquired characters. Nature 150: 563–565. [Google Scholar]
- Wagner, A., 1996. Does evolutionary plasticity evolve? Evolution 50: 1008–1023. [DOI] [PubMed] [Google Scholar]
- Wagner, G. P., 1981. Feedback selection and the evolution of modifiers. Acta Biotheor. 30: 79–102. [DOI] [PubMed] [Google Scholar]
- Wagner, G. P., and R. Burger, 1985. A non-equilibrium approach to the evolution of genetic systems. J. Theor. Biol. 113: 475–500. [DOI] [PubMed] [Google Scholar]
- Wagner, G. P., G. Booth and H. Bagheri-Chaichian, 1997. A population genetic theory of canalization. Evolution 51: 329–347. [DOI] [PubMed] [Google Scholar]
- Watt, W. B., 1994. Allozymes in evolutionary genetics: Self imposed burden or extraordinary tool? Genetics 136: 11–16. [DOI] [PMC free article] [PubMed] [Google Scholar]
- Wolfram Research, 1999 Mathematica Version 4. Wolfram Research, Champaign, IL.
- Wright, S., 1927. The effects in combination of the major color-factors of guinea pig. Genetics 12: 530–569. [DOI] [PMC free article] [PubMed] [Google Scholar]
- Wright, S., 1929. a Fisher's theory of dominance. Am. Nat. 63: 274–279. [Google Scholar]
- Wright, S., 1929. b The evolution of dominance: comment on Dr. Fisher's reply. Am. Nat. 63: 556–561. [Google Scholar]
- Wright, S., 1934. a Physiological and evolutionary theories of dominance. Am. Nat. 68: 25–53. [Google Scholar]
- Wright, S., 1934. b Professor Fisher on the theory of dominance. Am. Nat. 68: 562–565. [Google Scholar]
- Wright, S., 1977 Evolution and the Genetics of Populations, Vol. 3. University of Chicago Press, Chicago.