Abstract
Many bacterial diseases of plants depend on the interaction of type III effector genes of the pathogen and disease-susceptibility genes of the host. The host susceptibility genes are largely unknown. Here, we show that expression of the rice gene Os8N3, a member of the MtN3 gene family from plants and animals, is elevated upon infection by Xanthomonas oryzae pv. oryzae strain PXO99A and depends on the type III effector gene pthXo1. Os8N3 resides near xa13, and PXO99A failed to induce Os8N3 in rice lines with xa13. Silencing of Os8N3 by inhibitory RNA produced plants that were resistant to infection by strain PXO99A yet remained susceptible to other strains of the pathogen. The effector gene avrXa7 from strain PXO86 enabled PXO99A compatibility on either xa13- or Os8N3-silenced plants. The findings indicate that Os8N3 is a host susceptibility gene for bacterial blight targeted by the type III effector PthXo1. The results support the hypothesis that X. oryzae pv. oryzae commandeers the regulation of otherwise developmentally regulated host genes to induce a state of disease susceptibility. Furthermore, the results support a model in which the pathogen induces disease susceptibility in a gene-for-gene manner.
Keywords: avrXa7, Oryza sativa, pthXo1, xa13, Xanthomonas
Avirulence genes and their cognate host R genes, contribute to the basis of the so-called gene-for-gene model of host–pathogen incompatibility, and many avirulence and R gene pairs have been characterized, along with attempts to explain the associated signaling pathways for resistance (1). The outcome of host–pathogen interactions is also controlled by compatibility factors, which consist of virulence factors in the pathogen and susceptibility factors of the host. In plant pathogenic bacteria, important contributions to compatibility are provided by the type III secretion system (TTSS), which functions in the secretion and injection of substrate proteins (type III effectors) into eukaryotic host cells (2, 3). Type III effectors of plant pathogens presumably function similarly to effectors of animal pathogens and target various host-susceptibility factors (4, 5). In contrast to the effectors of the animal pathogens and R genes of plants, however, few host-susceptibility targets of type III effectors from plant bacterial pathogens have been identified.
Bacterial blight of rice is a vascular disease caused by Xanthomonas oryzae pv. oryzae, which spreads systemically through the xylem tissue, and is an important disease throughout many regions of rice production. A functioning TTSS is essential for the pathogenicity of X. oryzae pv. oryzae, and members of the avrBs3/pthA gene family of TTSS substrate effectors are essential for the ability of X. oryzae pv. oryzae to cause disease (6, 7). avrBs3/pthA products have characteristics of nuclear transcription activation factors and are referred to here as transcription activator-like (TAL) effectors (8). TAL effectors constitute a large family of closely related proteins, are individually distinguishable by the nature and number of direct repeats within a central repetitive region, and contribute to virulence in a variety of other important disease complexes of citrus, cotton, and cassava (9).
TAL effectors are secreted through the TTSS and targeted to host nuclei, a process that is mediated by the conserved N-terminal and C-terminal regions, respectively (10, 11). Each effector also has a C-terminal transcription activation-like domain, which is required in all cases for virulence activity and for avirulence activity (the ability to elicit a gene-specific resistance reaction in the host) in many cases (11–14). The TAL effector AvrBs3 is associated with the induction of host genes in pepper when introduced ectopically (15). The role of the pepper genes in host susceptibility is unknown. AvrXa27, a TAL effector from X. oryzae pv. oryzae PXO99A, is associated with the specific induction of the R gene Xa27 (16). AvrXa27 is an elicitor of resistance and is not known to be involved in strain virulence.
We hypothesized that Xa27 is a plant adaptation to mimic the activity of the TAL effectors as virulence factors and that X. oryzae pv. oryzae virulence depended on the induction of one or more key host genes (16). To examine the hypothesis, we used whole-genome-based microarray of rice genes to identify genes that are possibly up-regulated after challenge by bacteria. Here, we present the identification of a host gene that is differentially expressed during disease and a potential target of a type III TAL effector of X. oryzae pv. oryzae.
Results
Os8N3 Is Induced in a TAL Effector-Dependent Manner.
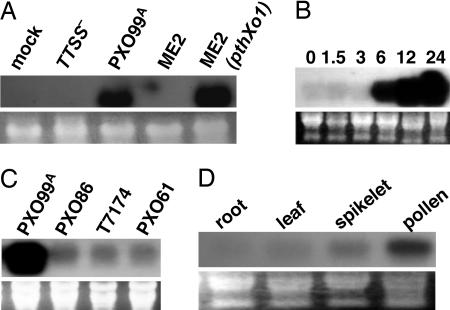
Microarray hybridization analysis with RNA from infected rice leaves was conducted by using the Affymetrix full genome arrays of rice (www.affymetrix.com/products/arrays/specific/rice.affx). RNA was isolated from two sets of rice leaves 24 h after inoculation with two strains of X. oryzae pv. oryza. One strain was the fully virulent strain PXO99A. The second strain was the mutant PXO99AME2 (hereafter ME2), which has a mutation in the TAL effector gene pthXo1 and is severely reduced in virulence (7). The gene Os8N3 was induced 103-fold higher after inoculation with strain PXO99A relative to the value for ME2 and represented the target sequence from the array with the highest fold increase (see Data Sets 1 and 2 and Table 1, which are published as supporting information on the PNAS web site). The increase in Os8N3 expression was corroborated by Northern hybridization analysis using a 598-bp gene-specific probe for Os8N3 derived from a unique nucleotide sequence in the 3′ region of the Os8N3 cDNA. The probe sequences are provided in Table 2, which is published as supporting information on the PNAS web site. Os8N3 was not induced by inoculation of rice plants with water, or the TTSS-deficient strain PXO99AME7 (6), or the pthXo1mutant ME2, and reintroduction of pthXo1 to ME2 restored Os8N3 induction (Fig. 1A). Os8N3 is induced within 6 h after inoculation (Fig. 1B), and expression increased only upon challenge with PXO99A and not with several additional strains of the pathogen (Fig. 1C). Although expressed at low levels in leaves and roots in unchallenged plants, Os8N3 is expressed at higher levels in developing spikelets and pollen, indicating that Os8N3 is developmentally regulated (Fig. 1D).
Fig. 1.
Northern hybridization analysis of Os8N3 expression. (A) Os8N3 is induced in a TAL effector-dependent manner upon infection. Rice leaves were inoculated with water (mock), type III secretion mutant PXO99AME7 (TTSS−), wild-type parent (PXO99A), pthXo1− (ME2), and ME2 with pthXo1 (ME2/pthXo1) reintroduced on pZWpthXo1 in pHM1, as indicated above each lane. Total RNA was extracted 24 h after inoculation and probed with a 32P-labeled gene-specific 3′ probe of Os8N3. (B) Os8N3 is induced within 6 h after bacterial infection. Rice leaves were inoculated with PXO99A, and RNA was extracted at the indicated time points (in hours). Filter was probed as in A. (C) Expression of Os8N3 is not elevated after infection of rice leaves with other strains of the pathogen. Rice leaves were inoculated with strains of X. oryzae pv. oryzae as indicated above each lane, and RNA was extracted 24 h after inoculation. Filter was probed as in A. (D) Os8N3 is expressed in developing inflorescence. Total RNA was extracted from the uninoculated plant tissues, as indicated above each lane. Filter was probed as in A. Total RNA loading is shown below the lanes (tlRNA) for each blot.
Os8N3 Is a Member of a Gene Family.
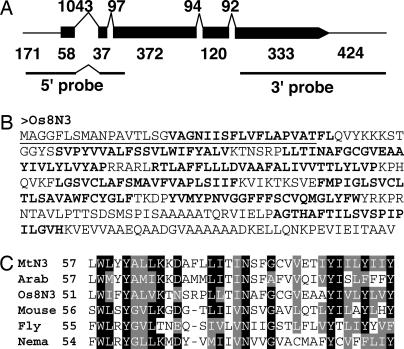
The Os8N3 coding region starts at position 26,721,365 on chromosome 8 of the rice cultivar Nipponbare [National Center for Biotechnology Information (NCBI) accession no. AP008214] and is represented by a 1,516-bp full-length cDNA clone (NCBI accession no. AK070510) (Fig. 2A). The predicated protein consists of 307 amino acid residues and eight membrane-spanning domains (Fig. 2B). Os8N3 is named after MtN3, a differentially expressed gene in the root nodules of Medicago truncatula (17). Additional related genes are found in nematodes, insects, and animals, although the biochemical functions of the proteins are unknown (Fig. 2C). The rice genome contains ≈17 genes encoding related proteins scattered throughout the genome, although none cross hybridize with the 5′ and 3′ gene-specific probes used in this study. Alignments of portions of the four closest relatives of Os8N3 are provided in Fig. 8 and 9, which are published as supporting information on the PNAS web site.
Fig. 2.
Os8N3 is a member of the MtN3 family. (A) Os8N3 is expressed as a 1.6-kb messenger RNA. Os8N3 is shown as represented by the full-length cDNA AK070510. Exons are represented by the solid black bars, and introns are indicated above the bars. Numbers indicate the number of base pairs of nucleotides. The first and last numbers for exons indicate the predicted 5′ and 3′ untranslated regions, respectively. 5′ and 3′ probes used throughout the study for hybridization (see Results) are indicated below the diagram. (B) Os8N3 product is predicted to encode a 307-aa integral membrane protein. The underlined region is a predicted uncleaved leader peptide. Eight predicted transmembrane regions are in bold. (C) Alignment of representative related proteins of the MtN3 family. Sequences were aligned by using clustalw (38) and displayed by using boxshade (www.ch.embnet.org/software/BOX_form.html). Protein sequence files: Medicago truncatula nodulin protein CAA69976 (MtN3), Arabidopsis MtN3-like protein AAL47380 (Arab); recombination activating gene 1 gene activation protein AAH14292 (Mouse), Drosophila melanogaster saliva protein AAD03390 (Fly), and Caenorhabditis elegans protein AAC02609 (Nema).
Os8N3 Is Not Inducible in Plants Homozygous for the R Gene xa13.
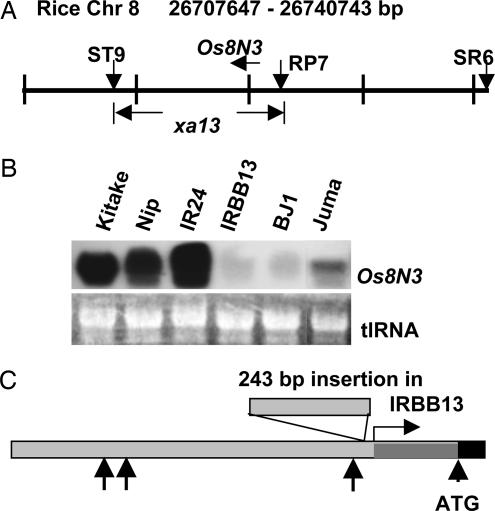
Os8N3 is located in the region of bacterial blight-resistance gene xa13, which was recently mapped to within a 14-kb region on chromosome 8, and PXO99A is one of the few strains that is incompatible with xa13 (18, 19) (Fig. 3A). The ability of PXO99A to induce Os8N3 expression in plants containing xa13 was therefore tested. Rice cultivars BJ1 and Juma, which are traditional cultivar sources for xa13, and IRBB13, which is a xa13-containing near-isogenic line derived from the recurrent susceptible parent lines IR24 and BJ1, all failed to show increased levels of Os8N3 expression after inoculation with PXO99A (Fig. 3B). Sequence analysis of the promoter regions from IR24 and IRBB13 revealed sequence polymorphisms that might account for the differences in responsiveness to PXO99A. The most conspicuous difference is the presence of a 243-bp insertion of repetitive sequences near the TATA box of Os8N3 in IRBB13 (Fig. 3C). The sequences of the Os8N3 promoter regions from IRBB13 and IR24 are provided in Fig. 10, which is published as supporting information on the PNAS web site.
Fig. 3.
Os8N3 is not induced in xa13 plants. (A) Os8N3 is located on rice chromosome 8 in the region of the recessive resistance gene xa13. xa13 has been mapped to within a 14-kb region between two sequence-tagged markers, ST9 and RP7 (19). The position of Os8N3 within the interval is indicated by the horizontal arrow above the map. (B) Os8N3 is not induced in rice cultivars homozygous for xa13. Leaf RNA was isolated from the indicated rice cultivars 24 h after challenge with PXO99A and probed with the 3′ probe for Os8N3. (C) Sequence polymophisms are present between IR24 and IRBB13 in the Os8N3 promoter. The Os8N3 promoter is shown, including 60 bp of coding sequence. The start of transcription is shown by the horizontal arrow, and the start of the coding sequence is indicated by “ATG.” A 243-bp insertion of DNA found in the IRBB13 sequence is indicated by the box on the promoter region. Other arrows indicate one to three nucleotide insertions present in either IRBB13 or IR24 in comparison with each sequence.
Os8N3-Silenced Plants Are Incompatible with PXO99A.
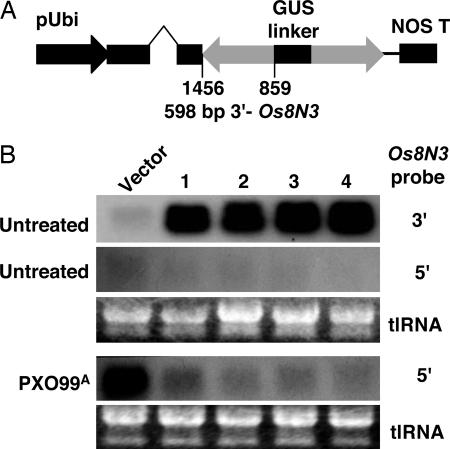
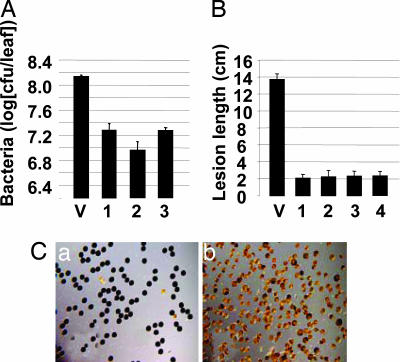
If expression of Os8N3 is required for susceptibility, loss or reduction of Os8N3 expression in susceptible plants because of interfering RNA (iRNA) as mediated by double-stranded RNA was predicted to result in plants that are resistant to PXO99A infection. Fifty-four plants from 14 independent transgenic rice lines were generated by using a short segment of the 3′ region of Os8N3 expressed in a manner to create a hairpin RNA (Fig. 4A). The plants were assayed for Os8N3 hairpin RNA expression by using the 598-bp gene-specific 3′ region (see Fig. 2A, 3′ probe). Hybridization with the 3′ probe revealed those plants expressing the silencing construct at high levels but could not distinguish the transgene RNA from the Os8N3 endogenous RNA. The 292-bp gene-specific 5′ probe, whose sequences are not present in the iRNA construct, was used to determine the expression level of the full Os8N3 before and after challenge by PXO99A (see Fig. 2A, 5′ probe). Control plants, containing only vector sequences, showed high levels of Os8N3 induction (Fig. 4B, vector), whereas four plants that expressed high levels of the iRNA construct (Fig. 4B, plants 1–4, 3′ probe) had little or no Os8N3 induction after bacterial challenge (Fig. 4B, plants 1–4, 5′ probe). We hereafter refer to the four plants as Os8N3-silenced plants. The susceptibility of the transgenic plants was measured on the basis of bacterial populations and lesion length in comparison with control plants. Control plants supported typical disease symptoms, whereas silenced plants had lower bacterial leaf populations (Fig. 5A) and shorter leaf lesions (Fig. 5B) in comparison with control plants. The normal expression pattern of Os8N3 was also disrupted in silenced plants, and low expression was observed in spikelets and pollen (data not shown). The silenced plants had low fertility, and most pollen grains were defective, as indicated by their starch content, or lack thereof, in comparison with normal pollen grains (Fig. 5C, a and b, respectively). However, the leaves were normal in appearance and visibly affected only in susceptibility.
Fig. 4.
Silencing of Os8N3 expression by using iRNA. (A) Schematic of silencing vector for inhibition of Os8N3 mRNA. A 598-bp fragment from the 3′ region of Os8N3 (see Fig. 2A, 3′ probe) was cloned in two orientations in pANDA with a fragment of the uidA gene as an internal linker (GUS linker) behind the maize Ubi1 promoter. (B) Northern analysis of Os8N3-silenced rice plants. RNA was isolated from leaves of control plants containing only transformation vector sequences (Vector) and four independent transformed plants expressing the dsRNA sequence as indicated by the 3′ probe (Top, untreated, lanes 1–4). Expression was then analyzed with a 5′ probe to determine the level of expression for the endogenous Os8N3 before (Middle, untreated) and after challenge by strain PXO99A (Bottom, PXO99A).
Fig. 5.
Virulence assay on Os8N3-silenced plants. (A) Silenced plants have reduced bacterial populations. Bacterial populations at 8 days were measured from 10 plants of the control plant line with vector-only sequences (V) and three silenced plant lines (columns 1–3). Bacterial populations were measured as cell-forming units (cfu) per leaf. (B) Silenced plants display reduced lesion lengths. Lesion measurements in cm were taken at 8 days after inoculation from 10 leaves of the control line (V) and 10 leaves of each of four silenced lines (columns 1–4). (C) Os8N3-silenced plants have low pollen viability. Low pollen viability was assessed by the presence of starch (which stains dark blue) accumulation in pollen. Mature pollen grains from control plant (Ca) and silenced plant (Cb) were stained with 1% I-KI solution.
avrXa7 Enables PXO99A Compatibility on IRBB13 and Os8N3-Silenced Plants.
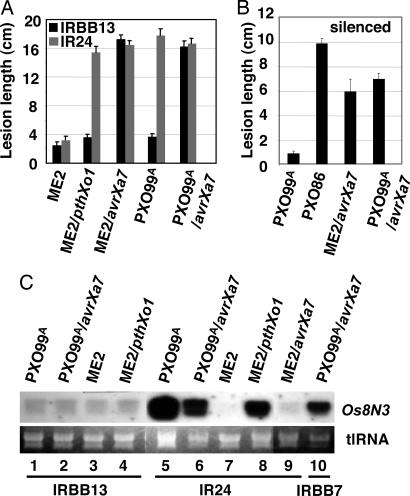
The reduced ability of PXO99A to incite disease on IRBB13 and Os8N3-silenced plants indicated that the strain depends on Os8N3 induction for compatibility. Strain PXO86 did not induce Os8N3 in normal plants, yet the strain is compatible with most rice cultivars, including IRBB13 (18). The TAL effector gene avrXa7 is a major contributor to the virulence of strain PXO86 (14, 20). We therefore transferred avrXa7 to strains ME2 and PXO99A and compared their abilities to cause disease on IRBB13 and the near-isogenic susceptible parent line IR24. ME2 was weakly virulent on both IRBB13 and IR24 (Fig. 6A, ME2). Virulence on IR24 was restored to ME2 by the reintroduction of pthXo1 but not IRBB13 (Fig. 6A, ME2/pthXo1). Virulence was restored to ME2 on both IRBB13 and IR24 by the introduction of avrXa7 (Fig. 6A, ME2/avrXa7). PXO99A behaves similarly to ME2 on IRBB13 and is virulent on IR24 (Fig. 6A, PXO99A). The addition of avrXa7 to PXO99A also restored virulence on IRBB13 (Fig. 6A, PXO99A/avrXa7). ME2 (data not shown) and PXO99A are also not virulent on Os8N3-silenced plants (Fig. 6B), whereas PXO86 caused disease on Os8N3-silenced plants (Fig. 6B, PXO99A and PXO86, respectively). The introduction of avrXa7 to ME2 or PXO99A restored virulence to both strains on the silenced plants (Fig. 6B, ME2/avrXa7 and PXO99A/avrXa7, respectively).
Fig. 6.
Strain-specific susceptibility mediated by Os8N3 and PthXo1. (A) avrXa7 enables PXO99A compatibility on IRBB13. Leaves of 60-day-old IRBB13 plants containing xa13 and the near-isogenic parent IR24 were inoculated with the bacterial strain as indicated below each column. The average lesion length for 10 plants after 16 days was determined. (B) avrXa7 enables PXO99A compatibility on Os8N3-silenced plants. Leaves of 40-day-old Os8N3-silenced plants were inoculated with the bacterial strain as indicated below each column. The average lesion length for six plants was determined after 8 days. (C) avrXa7 does not direct elevated expression of Os8N3 in IRBB13 or IR24. IRBB13 and IR24 plants were inoculated with the strain indicated above each lane. Total RNA was extracted at 24 h after inoculation and analyzed with the 3′ probe of Os8N3 (as in Fig. 1A). Total RNA loading is shown below the blots (tlRNA). Lanes are numbered for reference in the text. Plant variety is indicated below the lane numbers.
Northern analysis of infected IRBB13 plants indicated that PXO99A (avrXa7), despite the ability to incite disease, failed to induce Os8N3 (Fig. 6C, lane 2). PXO99A (avrXa7) maintained the ability to induce Os8N3 in the susceptible variety IR24 (Fig. 6C, lane 6). Induction of Os8N3 in IR24 was affected only by the presence or absence of pthXo1, because ME2 and ME2 (avrXa7) both failed to induce Os8N3 (Fig. 6C, lanes 7 and 9). Reintroduction of pthXo1 into ME2 restored Os8N3 induction (Fig. 6C, lane 8). PXO99A (avrXa7), as shown in previous work, triggers a Xa7-mediated resistance reaction in IRBB7 (21). The induction of Os8N3 also occurs in plants undergoing a Xa7-mediated resistance reaction, indicating that expression of Os8N3 does not suppress a dominant R gene reaction due to Xa7 (Fig. 6C, lane 10). The resistance profile of both xa13-containing and Os8N3-silenced plants, therefore, is narrow, and the alternative virulence factor avrXa7 can bestow virulence to the incompatible strain regardless of the presence or absence of pthXo1.
xa13 Confers an Atypical Resistance Response to PXO99A.
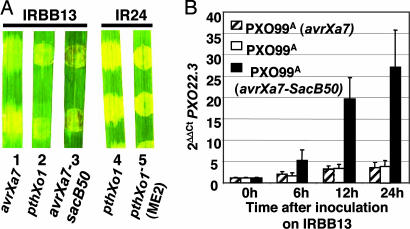
The resistance of IRBB13 to PXO99A also does not have the typical phenotype of a hypersensitive resistance (HR) reaction in rice. The compatible reaction on IRBB13, as evidenced by PXO99A (avrXa7), presents itself as clearing of the infected area in which the lesion begins to spread out from the immediately infected region (Fig. 7A, leaf 1) and is similar to the compatible reaction of PXO99A on the susceptible line IR24 (Fig. 7A, leaf 4). In contrast, PXO99A without avrXa7 caused reduced clearing on IRBB13 with no browning (Fig. 7A, leaf 2). The reaction of PXO99A is most similar in appearance to the phenotype of ME2 on IR24 (Fig. 7A, leaf 5). In contrast, a typical HR reaction, here due to the avirulence gene avrXa7-sacB50 (22) that occurs on IRBB13 (and IR24, data not shown), is characterized by the collapse and browning of the infected tissue (Fig. 7A, leaf 3). The defense gene POX22.3 encodes a peroxidase and is strongly induced specifically during resistance reactions in rice (23, 24). PXO22.3 expression in IRBB13 was measured by quantitative RT-PCR and POX22.3-specific primers in a time course experiment after inoculation with PXO99A and compared with PXO22.3 expression in IRBB13 after inoculation with the compatible strain PXO99A (avrXa7) and the incompatible strain PXO99A (avrXa7-sacB50). Levels of PXO22.3 began to rise within 6 h of inoculation and continued to rise through the 24-h period after inoculation with PXO99A (avrXa7-sacB50) (Fig. 7B). PXO22.3 expression remained relatively low in IRBB13 during the same time period in both the susceptible reaction to PXO99A (avrXa7) and the incompatible reaction with PXO99A (Fig. 7B).
Fig. 7.
PXO99A incites an atypical resistance reaction on IRBB13. (A) PX099A does not elicit a typical hypersensitive reaction on leaves of IRBB13. Each leaf was inoculated with PXO99A containing the gene indicated below the leaf. The number below each leaf photograph is included for reference in the text. The HR (brown tissue in the region of inoculation of leaf 3) is due to the presence of a dominant R gene present in IRBB13 and the avirulence gene avrXa7-sacB50. The avirulence gene was derived from a deletion analysis of avrXa7 and directs the elicitation of an HR in IR24 and related near-isogenic lines such as IRBB13 (22). The leaves were photographed 4 days after inoculation. (B) Rice peroxidase gene POX22.3 is not induced during challenge of IRBB13 with PXO99A. Three sets of IRBB13 plants were inoculated as in A with PXO99A (avrXa7), PXO99A, and PXO99A (avrXa7-SacB50), and total RNA was isolated at 0, 6, 12, and 24 h after inoculation. cDNA prepared from the samples was subjected to quantitative RT-PCR using POX22.3-specific primers. Gene-specific primers for the rice gene OsTFIIAγ5 were used for control.
Discussion
We used a comparison of host gene expression after inoculation of rice plants with PXO99A and the pthXo1 mutant to identify genes that are differentially expressed in the presence of pthXo1. Os8N3 emerged from the analysis as the gene with the greatest relative change in expression after the inoculations. Os8N3 expression was nearly 5-fold greater than the next-nearest candidate gene, which encoded a dehydrin-related protein and may be related to desiccation of the infected tissue. The location of Os8N3 within the region of a previously mapped recessive resistance gene, xa13, added to the evidence that Os8N3 may have a critical role in compatibility. Although not demonstrated here, we believe it is likely that Os8N3 and xa13 are allelic. Plants deficient in bacterial-mediated Os8N3 induction, by either engineered disruption of Os8N3 transcription or natural genetic variation (xa13), were not susceptible to infection by strain PXO99A, which depends on the major TAL effector gene pthXo1 for full virulence. At the same time, both silenced and xa13-containing plants were not generally resistant to bacterial infection. Infectivity by strain PXO86, for example, was unaffected by either silencing or xa13, and PXO86 did not cause Os8N3 induction in normal or xa13-containing plants. PXO86, in turn, depends for virulence on the TAL effector avrXa7, which was originally identified as the cognate avirulence gene to the R gene Xa7. The effect of avrXa7 is dominant over pthXo1 in the sense that PXO99A with pthXo1 and avrXa7 is also compatible on IRBB13 and the silenced plants.
We conclude that these observations are consistent with the hypothesis that Os8N3 is a host gene for strain-specific susceptibility to bacterial blight disease of rice. We feel compelled to consider the gene as a susceptibility factor, as opposed to a resistance reaction, based on the following features: (i) The lack of compatibility of PXO99A can be overcome by the addition of a virulence factor, in this case avrXa7, and not, as typically occurs with resistance reactions, by the loss of an avirulence gene. (ii) Loss of compatibility is due to the loss of a virulence gene in the pathogen. (iii) The loss of compatibility resulted from the loss of a host function, as inferred from the loss of expression of the Os8N3 product regardless of whether the loss was due to silencing or the xa13 configuration. (iv) The phenotypic response of IRBB13 has the appearance of a weak compatibility reaction and not the typical HR associated with R gene-specific avirulence gene products. Here, we used a previously discovered variant of avrXa7 (avrXa7-sacB50) that elicits resistance in IR24 and derived near-isogenic lines to compare the PXO99A reaction to a typical HR on rice (22). Gene-profiling experiments with xa13 have also noted atypical defense gene expression profiles in IRBB13 plants after challenge with incompatible bacteria (25). Here, we demonstrated that the defense-related peroxidase gene PXO22.3 was not elevated in IRBB13 after challenge with PXO99A.
Elevated expression of Os8N3 was strictly correlated with the presence of pthXo1 in the pathogen. Whether Os8N3 is a direct target of the TAL effector PthXo1 is unknown, because the mode of action of TAL effectors in general is unknown. PthXo1 may act directly at the Os8N3 promoter, binding to an as-yet-unidentified sequence motif. TAL effectors are predicted to form dimers, a common feature of promoter-specific transcription factors and, in at least one case, have been shown to have double-stranded-DNA-binding activity (14, 26). Alternatively, TAL effectors may interact with specific host transcription factors, which, in turn, affect the expression of host genes. Regardless of the exact mode of action, the different effectors appear to be associated with the induction of specific host genes. PthXo1 is the second TAL effector to be associated with the elevated expression of a host gene that has known consequences for the outcome of the host–pathogen interaction. Xa27 is a dominant resistance gene whose expression is specifically elevated in the presence of the TAL effector AvrXa27 (16).
We postulated that the loss is related to sequence polymorphism in the Os8N3 promoter and, in fact, simulated the effect of xa13 by perturbation of Os8N3 expression after bacterial challenge by iRNA. We predicted that, upon induction of Os8N3 in plants expressing the hairpin construct, the gene would be subject to gene-specific silencing (27). Indeed, the results from probing the leaf RNA content with a 3′ probe, which assessed the level of hairpin RNA expression, and a 5′ probe, which assessed the progression of the silencing to the complete mRNA, indicated that Os8N3 mRNA could not accumulate to appreciable levels after challenge by bacteria. Nonetheless, the possibility of the progressive silencing reaching more conserved regions of some of the other related genes raises the possibility that the lack of susceptibility is due to the silencing of another family member. This possibility is not consistent with the lack of Os8N3 expression in IRBB13, nor is it consistent with the results of silencing in the OsRac gene family (28). In the study of OsRac, silencing of individual members of the family by using a unique 3′ region did not lead to transitive silencing of the other gene members unless a gene-specific region was included in the iRNA construct (28).
The discovery of Os8N3, which encodes a predicted integral membrane protein, provides a window through which to address a variety of issues in host susceptibility to disease. The biochemical functions of the MtN3 family members are unknown. The mammalian member Rga (recombination-activating gene 1 gene activation) is expressed in neurons and immune system cells and is associated with cell-surface presentation of an ion-channel protein called TRPV2 (29, 30). Os8N3 product may function similarly and involve ion-channel recruitment, which, in turn, may alter signal transduction or regulate molecular trafficking across the cell membrane. In any event, Os8N3 appears also to have a developmental role in inflorescence development. Loss of expression affects pollen development and may have deleterious effects in other floral tissues. Otherwise, the outward appearances of the leaves and roots are normal. Changes in expression of NEC1, which encodes another member of the MtN3 family in petunia, have been associated with changes in phloem development and anther maturation (31, 32). Bacterial-stimulated Os8N3 expression could possibly alter the source–sink relationships of the infected tissue, resulting in enhanced nutritional conditions.
Strains of X. oryzae pv. oryzae have multiple copies of genes for TAL effectors, and alternate genes function in avirulence and virulence (7, 21). Addition of an alternate virulence factor, in this case, the TAL effector AvrXa7 from X. oryzae pv. oryzae strain PXO86, resulted in compatibility between PXO99A and both Os8N3-silenced and IRBB13 plants without concomitant induction of Os8N3. AvrXa7 presumably targets an alternate host factor that facilitates bacterial growth and disease, possibly another gene encoding a related MtN3 family member. The number of alternate TAL effectors is unknown. In an analysis of six strains, four alternate genes, which we refer to as major TAL effector genes, were identified based on the sequence relatedness. Each of these genes could replace pthXo1 in PXO99A with full restoration of virulence (7). Thus, in addition to avrXa7, pthXo2 or pthXo3 may also induce host susceptibility by alternate strategies, and more major TAL genes may yet be discovered. The discovery that AvrXa7 and PthXo1 exploit different features of the host serves to emphasize that the outcomes of host–pathogen interactions are the result of gene-for-gene interactions of pathogen virulence factors and host susceptibility genes (33).
Materials and Methods
Plant Material, Plasmids, and Bacterial Strains.
The seeds of rice varieties Nipponbare (accession no. PI 514663), BJ1 (PI221109), and Juma (PI 574797) were provided by the U.S. Department of Agriculture–Agricultural Research Service National Small Grains Collection. IR24 and IRBB13 seeds were obtained from the International Rice Research Institute (courtesy of Nollie Vera Cruz). All rice plants were grown in growth chambers with temperature of 28°C, relative humidity of 85%, and photoperiod of 12 h. The plasmids and bacterial strains used in this study are listed in Table 3, which is published as supporting information on the PNAS web site.
Microarray Analysis.
Leaves of 14-day-old rice (cv. Nipponbare) were inoculated with bacterial suspensions with optical density of 0.5 at 600 nm (≈5 × 10⁷ cell-forming units per ml) by using a needleless syringe. Total RNA was extracted 24 h after inoculation by using TRI Reagent (Ambion) following the manufacturer’s instruction. Five micrograms of total RNA of each sample was used for synthesis of cDNA and biotin-labeled cRNA according to the manufacturer’s manual by using the One-Cycle Eukaryotic Target Labeling kit (Affymetrix). The processed cRNA was used for hybridization to the GeneChip Rice Genome Array (Affymetrix) on the Affymetrix GeneChip instrument system at Kansas State University.
Northern Blot and Quantitative RT-PCR Analyses.
The rice leaves were inoculated, and total RNA was extracted as described above at the time points indicated in the text. Fifteen micrograms of total RNA for each sample were subjected to electrophoresis in 1% agarose gels. The RNA was transferred to Hybond N+ (Amersham Pharmacia) and hybridized with specific probe at 65°C in hybridization buffer [5 × SSC, 0.5% SDS, 20 mM Na2HPO4/NaH2PO4 (pH 6.5), 5 mM EDTA, and 10 mM Tris·HCl]. The 32P-labeled probes were prepared by using the Rediprime II Random Prime Labeling kit (Amersham Pharmacia) according to the manufacturer’s instruction. The 5′ and 3′ probes were prepared from cDNA by using primers listed in Table 4, which is published as supporting information on the PNAS web site. Quantitative real-time PCR was performed on RNA extracted from leaves inoculated with bacteria as indicated in the text. One microgram of total RNA was subjected to DNase I (Invitrogen) treatment and first-strand cDNA synthesis by using the iScript cDNA Synthesis kit (Bio-Rad). cDNA derived from 0.025 μg of total RNA was used for each real-time PCR, which was performed on iCycler iQ (Bio-Rad) using iQ SYBR green Supermix (Bio-Rad). The gene-specific primer sequences are provided in Table 4. The average threshold cycle (Ct) was used to determine the fold change of gene expression. As an internal control, OsTFIIAγ5 was used. The 2−ΔΔCt method was used for relative quantification (34).
Construction of Os8N3 Gene-Silencing Vector.
A 598-bp fragment, corresponding to 859 to 1,457 nucleotides of full-length cDNA sequence of Os8N3 (accession no. AK070510), was PCR amplified from a cDNA pool synthesized from mRNA extracted from leaves of rice (cv. Nipponbare) by using 3′ probe primers provided above. The product was cloned into pCR 2.1-TOPO (Invitrogen) and sequenced. The fragment was excised with BamHI and XhoI and cloned into Gateway vector pENTRTM4 for LR recombinase reaction with pANDA (35) according to the manufacturer’s instruction (Invitrogen). The RNA interference vector was electroporated into Agrobacterium tumefaciens strain EHA105.
PCR, Cloning, and Sequencing of Promoter Regions of Os8N3.
Four pairs of specific primers (listed in Table 4) were used to amplify the promoter regions of Os8N3. PCRs were performed by using the Accuprime kit (Invitrogen). The products were cloned into pCR 2.1-TOPO (Invitrogen) and sequenced.
Stable Rice Transformation.
Cali initiated from immature embryos of rice (cv. Kitake) were transformed by using Agrobacterium as described (36). Multiple plantlets were regenerated from individual transgenic lines, and the primary transgenic plants were used for analyses.
Virulence Assay.
The fully expanded leaves were inoculated by leaf-tip clipping with scissors contaminated with bacterial suspensions of optical density of 0.25 at 600 nm (≈2.5 × 10⁷ cell-forming units per ml) as described (37). Symptoms were scored by measuring lesion length. Significance between treatments was assessed on the basis of a P value of <0.05 by using the Tukey test for analysis after ANOVA. Bacterial growth in rice leaves was measured by harvesting 10 leaves for each treatment after leaf-clip inoculation. The leaves were ground with a mortar and pestle in sterile water. The solution was diluted serially and spread on trypticase soy agar plates with appropriate antibiotics. The mean number of colonies in three plates of the proper dilution (10–100 colonies) was calculated.
Supplementary Material
Acknowledgments
We thank Dr. Jianfa Bai for assistance with the microarray hybridization, Dr. Nollie Vera Cruz for rice seeds, Dr. Ko Shimamoto (Nara Institute of Science and Technology, Nara, Japan) for pANDA vector, Dr. Scot Hulbert for support, and Mr. Adam Call and Ms. Miranda Leathers for technical assistance. This work was supported by funds from the Kansas Agriculture Experiment Station (KAES) and U.S. Department of Agriculture Cooperative State Research, Education, and Extension Service National Research Initiative Award 2000-02698. This manuscript is publication number 06-328-J of the KAES.
Abbreviations
- HR
hypersensitive resistance
- iRNA
interfering RNA
- TAL
transcription activator-like
- TTSS
type III secretion system.
Footnotes
Conflict of interest statement: No conflicts declared.
References
- 1.Belkhadir Y., Subramaniam R., Dangl J. L. Curr. Opin. Plant Biol. 2004;7:391–399. doi: 10.1016/j.pbi.2004.05.009. [DOI] [PubMed] [Google Scholar]
- 2.Blocker A., Komoriya K., Aizawa S. I. Proc. Natl. Acad. Sci. USA. 2003;100:3027–3030. doi: 10.1073/pnas.0535335100. [DOI] [PMC free article] [PubMed] [Google Scholar]
- 3.He S. Y., Nomura K., Whittam T. S. Biochim. Biophys. Acta. 2004;1694:181–206. doi: 10.1016/j.bbamcr.2004.03.011. [DOI] [PubMed] [Google Scholar]
- 4.Mota L. J., Cornelis G. R. Ann. Med. 2005;37:234–249. doi: 10.1080/07853890510037329. [DOI] [PubMed] [Google Scholar]
- 5.Mudgett M. B. Annu. Rev. Plant Biol. 2005;56:509–531. doi: 10.1146/annurev.arplant.56.032604.144218. [DOI] [PubMed] [Google Scholar]
- 6.Zhu W., Magbanua M. M., White F. F. J. Bacteriol. 2000;182:1844–1853. doi: 10.1128/jb.182.7.1844-1853.2000. [DOI] [PMC free article] [PubMed] [Google Scholar]
- 7.Yang B., White F. F. Mol. Plant–Microbe Interact. 2004;17:1192–1200. doi: 10.1094/MPMI.2004.17.11.1192. [DOI] [PubMed] [Google Scholar]
- 8.White F. F., Yang B., Johnson L. B. Curr. Opin. Plant Biol. 2000;3:291–298. doi: 10.1016/s1369-5266(00)00082-0. [DOI] [PubMed] [Google Scholar]
- 9.Schornack S., Meyer A., Romer P., Jordan T., Lahaye T. J. Plant Physiol. 2006;163:256–272. doi: 10.1016/j.jplph.2005.12.001. [DOI] [PubMed] [Google Scholar]
- 10.Szurek B., Rossier O., Hause G., Bonas U. Mol. Microbiol. 2002;46:13–23. doi: 10.1046/j.1365-2958.2002.03139.x. [DOI] [PubMed] [Google Scholar]
- 11.Szurek B., Marois E., Bonas U., Van Den A. G. Plant J. 2001;26:523–534. doi: 10.1046/j.0960-7412.2001.01046.x. [DOI] [PubMed] [Google Scholar]
- 12.Zhu W., Yang B., Chittoor J. M., Johnson L. B., White F. F. Mol. Plant–Microbe Interact. 1998;11:824–832. doi: 10.1094/MPMI.1998.11.8.824. [DOI] [PubMed] [Google Scholar]
- 13.Zhu W., Yang B., Wills N., Johnson L. B., White F. F. Plant Cell. 1999;11:1665–1674. doi: 10.1105/tpc.11.9.1665. [DOI] [PMC free article] [PubMed] [Google Scholar]
- 14.Yang B., Zhu W., Johnson L. B., White F. F. Proc. Natl. Acad. Sci. USA. 2000;97:9807–9812. doi: 10.1073/pnas.170286897. [DOI] [PMC free article] [PubMed] [Google Scholar]
- 15.Marois E., van den Ackerveken G., Bonas U. Mol. Plant–Microbe Interact. 2002;15:637–646. doi: 10.1094/MPMI.2002.15.7.637. [DOI] [PubMed] [Google Scholar]
- 16.Gu K., Yang B., Tian D., Wu L., Wang D., Sreekala C., Yang F., Chu Z., Wang G. L., White F. F., et al. Nature. 2005;435:1122–1125. doi: 10.1038/nature03630. [DOI] [PubMed] [Google Scholar]
- 17.Gamas P., Niebel F. C., Lescure N., Cullimore J. Mol. Plant–Microbe Interact. 1996;9:233–242. doi: 10.1094/mpmi-9-0233. [DOI] [PubMed] [Google Scholar]
- 18.Ogawa T., Lin R., Tabien E., Khush G. S. Rice Genet. Newsletter. 1987;4:98–100. [Google Scholar]
- 19.Chu Z., Fu B., Yang H., Xu C., Li Z., Sanchez A., Park Y. J., Bennetzen J. L., Zhang Q., Wang S. Theor. Appl. Genet. 2006;112:455–461. doi: 10.1007/s00122-005-0145-6. [DOI] [PubMed] [Google Scholar]
- 20.Bai J., Choi S. H., Ponciano G., Leung H., Leach J. E. Mol. Plant–Microbe Interact. 2000;13:1322–1329. doi: 10.1094/MPMI.2000.13.12.1322. [DOI] [PubMed] [Google Scholar]
- 21.Hopkins C. M., White F. F., Choi S., Guo A., Leach J. E. Mol. Plant–Microbe Interact. 1992;5:451–459. doi: 10.1094/mpmi-5-451. [DOI] [PubMed] [Google Scholar]
- 22.Yang B., Sugio A., White F. F. Mol. Plant–Microbe Interact. 2005;18:142–149. doi: 10.1094/MPMI-18-0142. [DOI] [PubMed] [Google Scholar]
- 23.Chittoor J. M., Leach J. E., White F. F. Mol. Plant–Microbe Interact. 1997;10:861–871. doi: 10.1094/MPMI.1997.10.7.861. [DOI] [PubMed] [Google Scholar]
- 24.Sugio A., Yang B., White F. F. Mol. Plant–Microbe Interact. 2005;18:546–554. doi: 10.1094/MPMI-18-0546. [DOI] [PubMed] [Google Scholar]
- 25.Chu Z., Ouyang Y., Zhang J., Yang H., Wang S. Mol. Genet. Genom. 2004;271:111–120. doi: 10.1007/s00438-003-0964-6. [DOI] [PubMed] [Google Scholar]
- 26.Gurlebeck D., Szurek B., Bonas U. Plant J. 2005;42:175–187. doi: 10.1111/j.1365-313X.2005.02370.x. [DOI] [PubMed] [Google Scholar]
- 27.Chi J. T., Chang H. Y., Wang N. N., Chang D. S., Dunphy N., Brown P. O. Proc. Natl. Acad. Sci. USA. 2003;100:6343–6346. doi: 10.1073/pnas.1037853100. [DOI] [PMC free article] [PubMed] [Google Scholar]
- 28.Miki D., Itoh R., Shimamoto K. Plant Physiol. 2005;138:1903–1913. doi: 10.1104/pp.105.063933. [DOI] [PMC free article] [PubMed] [Google Scholar]
- 29.Barnhill J. C., Stokes A. J., Koblan-Huberson M., Shimoda L. M., Muraguchi A., Adra C. N., Turner H. J. Cell. Biochem. 2004;91:808–820. doi: 10.1002/jcb.10775. [DOI] [PubMed] [Google Scholar]
- 30.Stokes A. J., Wakano C., Del Carmen K. A., Koblan-Huberson M., Turner H. J. Cell. Biochem. 2005;94:669–683. doi: 10.1002/jcb.20331. [DOI] [PubMed] [Google Scholar]
- 31.Ge Y. X., Angenent G. C., Wittich P. E., Peters J., Franken J., Busscher M., Zhang L. M., Dahlhaus E., Kater M. M., Wullems G. J., et al. Plant J. 2000;24:725–734. doi: 10.1046/j.1365-313x.2000.00926.x. [DOI] [PubMed] [Google Scholar]
- 32.Ge Y. X., Angenent G. C., Dahlhaus E., Franken J., Peters J., Wullems G. J., Creemers-Molenaar J. Mol. Genet. Genom. 2001;265:414–423. doi: 10.1007/s004380100449. [DOI] [PubMed] [Google Scholar]
- 33.Flor H. H. Annu. Rev. Phytopathol. 1971;9:275–296. [Google Scholar]
- 34.Livak K. J., Schmittgen T. D. Methods. 2001;25:402–408. doi: 10.1006/meth.2001.1262. [DOI] [PubMed] [Google Scholar]
- 35.Miki D., Shimamoto K. Plant Cell Physiol. 2004;45:490–495. doi: 10.1093/pcp/pch048. [DOI] [PubMed] [Google Scholar]
- 36.Hiei Y., Komari T., Kubo T. Plant Mol. Biol. 1997;35:205–218. [PubMed] [Google Scholar]
- 37.Kauffman H. E., Reddy A. P. K., Hsiek S. P. V., Marca S. D. Plant Dis. Rep. 1973;57:537–541. [Google Scholar]
- 38.Thompson J. D., Higginsand D. G., Gibson T. J. Nucleic Acids Res. 1994;22:4673–4680. doi: 10.1093/nar/22.22.4673. [DOI] [PMC free article] [PubMed] [Google Scholar]
Associated Data
This section collects any data citations, data availability statements, or supplementary materials included in this article.


