Abstract
Songbirds have one of the most accessible neural systems for the study of brain mechanisms of behavior. However, neuroethological studies in songbirds have been limited by the lack of high-throughput molecular resources and gene-manipulation tools. To overcome these limitations, we constructed 21 regular, normalized, and subtracted full-length cDNA libraries from brains of zebra finches in 57 developmental and behavioral conditions in an attempt to clone as much of the brain transcriptome as possible. From these libraries, ≈14,000 transcripts were isolated, representing an estimated 4,738 genes. With the cDNAs, we created a hierarchically organized transcriptome database and a large-scale songbird brain cDNA microarray. We used the arrays to reveal a set of 33 genes that are regulated in forebrain vocal nuclei by singing behavior. These genes clustered into four anatomical and six temporal expression patterns. Their functions spanned a large range of cellular and molecular categories, from signal transduction, trafficking, and structural, to synaptically released molecules. With the full-length cDNAs and a lentiviral vector system, we were able to overexpress, in vocal nuclei, proteins of representative singing-regulated genes in the absence of singing. This publicly accessible resource http://songbirdtranscriptome.net can now be used to study molecular neuroethological mechanisms of behavior.
Oscine songbirds learn their songs by imitating those of adults. Their song behavior is readily quantified and is controlled by a system of discreet brain vocal nuclei (Fig. 8, which is published as supporting information on the PNAS web site) (1, 2). For these reasons, birdsong has been an ideal model for investigating causative, developmental, functional, and evolutionary aspects of a complex, learned behavior, the four fundamentals of ethology (3). These fundamentals are difficult to study at a molecular level in songbirds because of the lack of high-throughput molecular and gene-manipulation tools for studying songbirds. Song production is associated with a rapid immediate early gene-expression response in vocal nuclei (4), where only three genes (egr-1 or ZENK, c-fos, and BDNF) up-regulated by singing had been identified when we began this project (4–6); two others (UCHL1 and Arc) were recently reported (7, 8). Of these, full-length songbird cDNA clones are available only for UCHL1. Full-length cDNAs contain the protein coding sequence (cds) and 5′ and 3′ UTRs of a gene, and the cds is necessary to generate functional proteins for overexpression experiments. Such experiments help determine a gene's molecular function and its role in a behavioral process. In addition, full-length cDNAs allow for cross-species hybridization (Fig. 9, which is published as supporting information on the PNAS web site), and identification of conserved sequences among species. To overcome these limitations, we produced a high-throughput molecular resource that was focused, from start to finish, on cloning full-length cDNAs expressed in the brain from a variety of developmental and behavioral conditions. The resource includes an annotated database, cDNA microarrays, and a gene-manipulation approach. We used this resource to identify a dynamic cascade of genes up- and down-regulated in brain vocal nuclei by singing behavior. The genes include some activity-dependent transcription factors and many late-response housekeeping molecules. Their functions and differential patterns suggest that large gene regulatory networks for basic brain processes are recruited as a result of behavioral performance. Figs. 10–21, Tables 1–6, and Appendix, which are published as supporting information on the PNAS web site, all cited below, show additional information.
Results
Brain Transcriptome Libraries.
We used brains of 60 zebra finches in 57 different developmental, pathological, and behavioral states (Table 1) to create 21 cDNA libraries: 6 normalized, 4 abundant, 5 subtracted, and 6 regular (Table 2; definitions are in Glossary in Appendix). The 6 normalized libraries were made from a silent male, undirected singing males, directed singing males, embryonic males and females, 50 juvenile and adult animals in different behavioral states, and animals undergoing rapid vocal learning (Fig. 10 and Table 2). Subtracted libraries were focused on enriching for genes related to vocal learning and singing. For each library, the first-strand reactions were made with primers that contain unique 3′ sequence IDs for each animal (Table 1). In all, we estimate that our libraries contain ≈4.21 million independent cDNA clones (based on the number of Escherichia coli transformants). We picked 18,048 clones from normalized and subtracted libraries for sequencing of ≈0.9 kb from the 5′ and/or 3′ ends. Of these, 13,694 (76%) had successful reactions of overall high base call quality (average phred probability score ≥20; Table 3). After removing bacterial, mammalian, and chimera contaminants (Appendix section 3.6.1), of the remaining 13,665 cDNAs, 42% were from normalized and 58% from subtracted libraries.
Representation of Full-Length Protein Coding Sequences.
Clones ranged in size from 0.5 to >6 kb (Fig. 11). To assess the proportion that are potentially full length, we used a secondary measure, putative translated protein cds. We could not analyze the proportion of 5′ and 3′ UTRs that are full length, because this analysis requires making cap analysis of gene expression libraries and having genomic sequences. We analyzed cds with 70–100% identity to known full-length cds of other species, a conservative selection criterion. Of the 13,665 cDNAs, 11,633 met this criterion and of these, 10,986 (94%) had a cds with an initiation methionine and upstream 5′ UTR (and downstream 3′ UTR when the 3′ UTR sequence reaction was available). Thus, the randomly picked clones from the libraries contained a majority of cDNAs with full-length cds.
Brain Transcriptome Database and Representation.
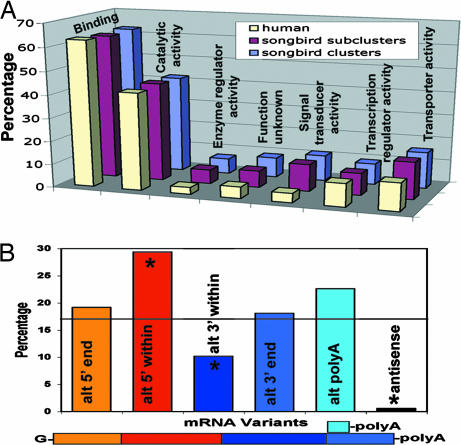
With the sequenced cDNAs, we created a hierarchically organized transcriptome database http://songbirdtranscriptome.net (Fig. 12) from sequence reads, individual cDNAs, and subclusters of nearly identical cDNAs to clusters of variant cDNAs. Machine-automated, followed by human-curated annotations organized the 13,665 cDNAs into 6,147 subclusters representing relatively unique transcripts. The 6,147 subclusters were further grouped into 4,738 clusters (containing transcript variants when present), presumably representing unique genes. We estimate that these clusters may represent ≈20% of the genes (protein coding and noncoding) of the avian genome, based on the calculation that the chicken genome contains ≈23,517 genes (23,000 protein coding and 517 noncoding) (9). These clusters may further represent ≈40% of the genes expressed in the brain, based on the calculation that ≈50% of the genes in the genome are predicted to be expressed in the songbird brain (10). Of the 4,738 clusters, ≈80% and ≈60% are similar at >70% identity to chicken and human cDNAs, respectively (Fig. 13). Ontology analysis revealed a molecular representation of gene families similar to humans (Fig. 1A), with protein binding and catalytic activity as the most abundant. Variant subclusters within clusters consisted of a higher-than-expected apparent alternative splicing within the 5′ ends (Fig. 1B), some of which affected cds (data not shown). Most variations (≈60%) were at the cDNA ends, including alternative polyadenylation. Antisense RNA was the smallest group of variants. Most cDNAs had a high GC content, average 71%, in the first 100 bp of the 5′ end relative to an average of 50.5% across the cDNAs (P < 0.0001, paired t test, two-tailed; calculated for only fully sequenced clones). Thus, songbird mRNAs may have an important feature described for mammalian mRNAs: high GC content in the 5′ UTR to control mRNA folding into secondary structure, which in turn modulates translation into protein (11).
Fig. 1.
Molecular functions and variant analysis. (A) Distribution of putative molecular functions for 1,924 clusters and 2,449 subclusters of zebra finch brain cDNAs that received gene ontology annotations (www.geneontology.org) compared with 27,048 human genes. Genes can be represented in more than one category because of multiple molecular functions, and thus, categories add up to >100%. Human values were obtained from ref. 24. (B) mRNA variant analysis. Percentage represents the proportion of a specific variant type relative to the total number of variants from 100 randomly selected cDNA clusters containing 256 subclusters and 668 clones. ∗, P < 0.01 from chance distribution (horizontal line; t test across variant types in n = 10 bins of 10 clusters each). Because not all clones have full sequence coverage, the absolute distribution may change when such sequences are present. Colors denote mRNA subdomains quantified. alt, Alternative.
Behaviorally Regulated Genes.
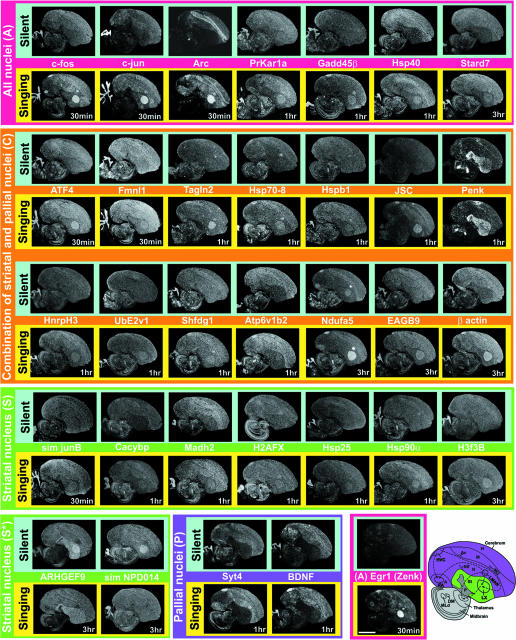
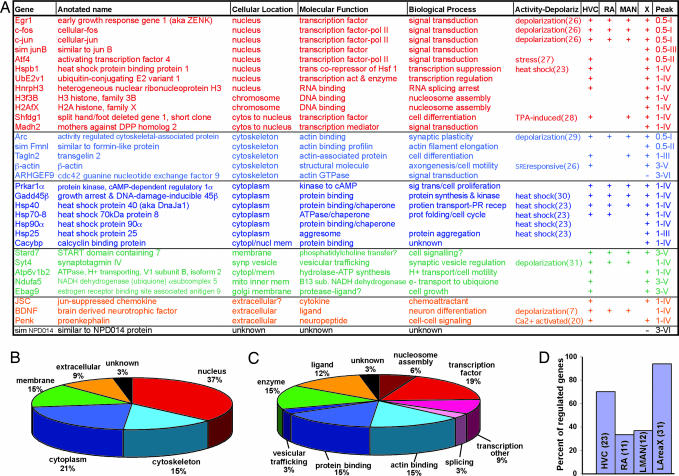
For a proof-of-principle use of this resource, we performed an experiment to identify singing-regulated genes. We constructed an 18,000 spotted cDNA microarray using all clones isolated (Appendix section 3.7). We then excised four song nuclei [high vocal center (HVC), robust nucleus of the arcopallium (RA), lateral magnocellular nucleus of the anterior nidopallium (LMAN), and AreaX] from brain sections of silent and singing (1 h) birds, generated fluorescently tagged probes, and hybridized them to the microarrays in 3 or 4 replicate experiments per vocal nucleus (Fig. 14A and Table 4). We verified that egr-1 and c-fos mRNA were regulated by singing (4, 5), and they showed 2- to 30-fold increases, depending on vocal nucleus, array replicate, and spotted DNA concentration (Fig. 14 C and D). Using these cDNAs as a standard, we identified others that showed a >1.8-fold difference in at least two or three of three or four replicates, respectively, in multiple vocal nuclei in some cases and, when available, across multiple clones with identical sequence annotations (Appendix section 3.7); 150 genes met this criterion (not including egr-1 and c-fos). Of these, we selected 41 for in situ verification and found that 4 (≈10%) were false positive (Table 5), because they showed no differences in vocal nuclei across groups or birds; 6 (13%) showed differences in vocal nuclei across individual birds but not across groups (Table 5 and Fig. 15); and 31 (≈76%) showed verified increased (29 genes) or decreased (2 genes) expression in vocal nuclei of singing birds (Figs. 2 and 3A). Most (78%) of the singing-regulated genes had not been previously described as being driven by singing or behavior. Four were previously found to be heat-shock sensitive, and another six were found to be neural-activity induced (Fig. 3A), indicating their possible classification as immediate early genes.
Fig. 2.
In situ hybridizations of singing-regulated genes. Shown are inverse images of autoradiographs; white is mRNA expression. Images are ordered from top to bottom according to four overall expression patterns and from left to right in temporal order of peak expression. Some genes (egr-1, c-fos, c-jun, and Arc) were induced by singing in the smaller vocal nuclei (NIf, Av, and MO), but we could not reliably assess this for all genes. Egr-1 is shown to the left of the brain diagram (Bottom Right) for anatomical reference. A, arcopallium; Av, avalanche; DM, dorsal medial nucleus; LX, lateral AreaX of the striatum; LMO, oval nucleus of the mesopallium; N, nidopallium; NIf, interfacial nucleus of the nidopallium; P, pallidum; RA robust nucleus of the arcopallium; St, striatum. (Scale bar, 2 mm.)
Fig. 3.
Summary of in situ-verified singing-regulated genes. (A) Table of inferred cellular location, molecular function, and biological process based on ontology definitions of homologous genes in other species. The list is organized according to cellular location (nucleus-to-extracellular space), proportion of vocal nuclei, peak time (0.5–3 h), and temporal patterns (types I–VI) of expression. Sim, similar to, at 60–74% protein identity (Appendix section 3.6.6). (B and C) Pie-chart quantifications of cellular location (B) and molecular function (C). (D) Percentage of the 33 genes regulated by singing in each vocal nucleus. The numbers of genes regulated are in parentheses.
The functions of all 33 singing-regulated genes (including egr-1 and c-fos) spanned a range of categories: signal transduction proteins (egr-1, c-fos, c-jun, sim junB, Atf4, Hspb1, UbE2v1, HnrpH3, Shfdg1, and Madh2), chromosome scaffold proteins (H3f3B and H2AfX), actin-interacting cytoskeletal proteins (Arc, sim Fmnl, Tagln2, ARHGEF9, and β-actin), a Ca2+-regulating protein (Cacyb), cytoplasmic proteins with enzymatic (Prkar1a, Atp6v1b2, and Ndufa5), protein kinase (Gadd45β), folding (Hsp70-8), binding, and transporting functions (Hsp40, Hsp90α, and Hsp25), and membrane (Stard7, Syt4, and Ebag9) and synaptically released proteins (JSC, BDNF, and Penk; Fig. 3 A–C). Analysis of the 3′ unique IDs revealed that many (10 of 12 with n ≥ 6 clones in the database) were more represented in subtracted libraries (Table 6). Although not all were from singing vs. nonsinging subtracted libraries, this analysis demonstrates that subtraction generally enriched for singing-regulated genes.
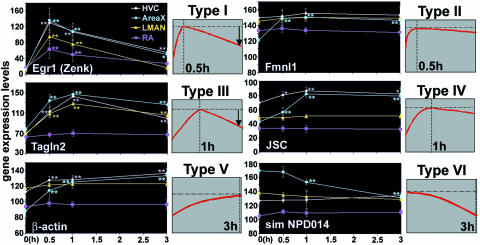
The 33 genes can be grouped into four anatomical expression categories (Fig. 2): those regulated in (i) all (Fig. 2A) major pallial vocal nuclei (HVC, RA, and MAN) and the striatal vocal nucleus (AreaX); (ii) a combination (Fig. 2C) of 1 or 2 pallial and the striatal vocal nucleus; (iii) pallial (P) vocal nuclei only; and (iv) the striatal (S) vocal nucleus only. AreaX had the highest percentage (94%) of genes regulated by singing (Fig. 3D). Time-course analyses (Appendix section 3.8) further grouped all genes into six statistically different temporal patterns (examples in Fig. 4; all genes in Fig. 16): type I, those up-regulated with peak expression within 0.5 h, followed by decreased expression as singing continues [these were mainly the transcription factors expressed in all vocal nuclei (Fig. 3A)]; type II, those also up-regulated with peak expression within 0.5 h but followed by steady expression as singing continues [these were a transcription factor (Atf4) and a putative actin-associated protein (sim Fmnl) in a subset of vocal nuclei]; type III), those up-regulated like type I but with peak expression at 1 h, followed by decreased expression as singing continues [these were a putative transcription factor (sim junB), an actin-associated protein (Tagln2), and a chaperone (Hsp25) in a subset of vocal nuclei]; type IV, those up-regulated like type II but with peak expression in 1 h, followed by steady expression as singing continues [this was the largest group, consisting of nuclear, cytoplasmic, cytoskeletal, and synaptically released proteins in all or a subset of vocal nuclei]; type V, those up-regulated with peak expression near or beyond 3 h (the latest time measured) [these included structural (β-actin, H3f3B), enzyme (Ndufa5), and signaling (Stard7, Ebag9) proteins in a subset of vocal nuclei]; and type VI, those down-regulated within 1–3 h [these were an actin GTPase (ARHGEF9) and a protein of unknown function (sim NPD014 protein) in AreaX].
Fig. 4.
Examples of the six types of temporal expression patterns. The large graphs show the average mRNA-expression time course in four song nuclei. Bars represent SEM. The small graphs show schematics. Vertical line, time of measured peak expression; horizontal line, peak expression level. Criteria for including a gene as singing-regulated were that it had to have a significant difference at one or more time points relative to silent controls (0 h; ANOVA by post hoc probable least-squares difference test; ∗, P < 0.05; ∗∗, P < 0.01; n = 4 each time point, n = 5 at 0.5 h). Criteria for placing genes in a temporal category were that the gene had to have or not have significant differences in expression among the 0.5-, 1-, or 3-h time points (ANOVA, P < 0.05; specific values not shown).
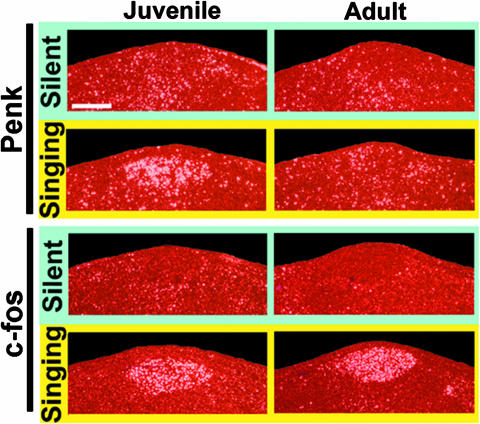
Further analysis of the 3′ unique IDs revealed that several of the 33 genes were represented at higher levels in the subtracted juvenile rapid vocal learning library (#0064; Table 6 and Appendix section 2.3). We tested this possibility and found that Penk was regulated at higher levels in juvenile relative to adult HVC after 30 min of singing (Fig. 5). We did not find juvenile–adult differences with c-fos, and it was not enriched in the subtracted juvenile libraries (Table 6). These results suggest that subtraction may have also been effective at isolating developmental differences.
Fig. 5.
Singing-driven (0.5 h) Penk and c-fos mRNA expression in juvenile (PH44-48) and adult (>PH180) HVC. Shown are adjacent emulsion-dipped sections under dark-field microscopy from representative juvenile and adult animals; white silver grains, mRNA expression; red, Nissl stain; the orientation is the same as that in Fig. 2. (Scale bar, 200 μm.) Quantitative analyses (pixel density of digitized images) of birds (n = 3 juveniles; n = 3 adults) that produced comparable amounts of song (range 260.2–314.7 s) showed no significant difference between juvenile and adults for singing duration (P = 0.332) or c-fos expression (P = 0.215) but a significant difference for Penk expression (P = 0.02; ANOVA by Fisher's probable least-squares difference post hoc test).
Protein Expression.
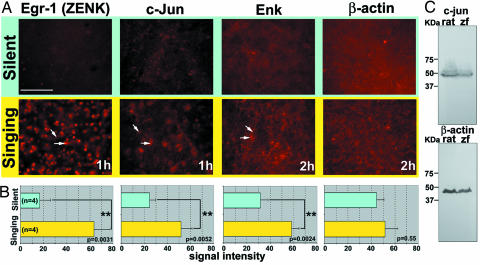
To determine whether singing-induced mRNA expression is propagated to the protein level, we used the predicted amino acid sequences of select clones to identify antibodies made against homologous amino acids in mammals (Appendix section 3.9) and reacted them to zebra finch brain sections. Egr-1 protein, a positive control (12), was highly up-regulated in cell nuclei of AreaX by singing (Fig. 6). C-jun protein was also up-regulated, but in larger cells, and enkephalin protein up-regulated in neuronal processes of AreaX. We did not find detectable up-regulation of β-actin at the 1- to 2-h time points tested, indicating that either the mRNA change did not affect overall protein levels or that changes in protein levels occur at a later time point. When including prior findings of c-fos and BDNF (5, 6), five of six genes tested show singing up-regulation at the protein levels, with the protein products designated to different parts of a cell.
Fig. 6.
Protein expression. (A) AreaX of silent and singing birds. Red, Cy3 label. Straight and angled arrows indicate induced protein expression in a cell nucleus in and out of the plane of focus for egr-1 and c-jun and in the cytoplasm and attached neuronal process for ENK, respectively. (Scale bar, 200 μm.) The orientation is the same as that in Fig. 2. (B) Quantitation of pixel intensity in a 2 × 150 μm area by using Photoshop (Adobe Systems, Mountain View, CA) tools. Cell count was not used because we needed a comparable measure across all proteins, and ENK and β-actin are expressed in processes, making individual cell identity difficult (ANOVA by Fisher's probable least-squares difference post hoc test; n = 4 silent and 4 singing birds). (C) Western blots. Antibodies recognize similar protein products in whole brain of finches and rats. Western blot for ENK is shown in Fig. 17, and Western blot for ZENK is shown in ref. 12.
Gene Manipulation.
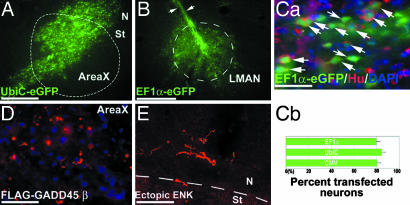
To test whether our full-length cDNAs would express proteins in vivo, we performed an experiment with lentiviral vectors (Fig. 17A) known to integrate into genomic DNA and express eGFP in mammalian neurons in vivo (13) and recently in transgenic quails (14). The lentivirus constructs transfected zebra finch neurons and glial cells in vivo at a titer of 1 × 10⁶ to 1 × 10⁷ pfu/μl and expressed eGFP from the mammalian UbiC, EF1-α, and CMV promoters (Fig. 7A–Ca). There was relatively little quantitative difference among viral vector variants for percentage of neurons transfected (Fig. 7Cb). There was consistent and stable eGFP expression from day 3 to at least 3 months after transfection (Figs. 7 A and B and 17 C–E). Each injection was able to spread the virus in an ≈1-mm2 area. We custom-designed 5′-FLAG-tag primers to PCR amplify the coding region of Gadd45β and Penk from the zebra finch full-length clones, which were then ligated into the UbiC promoter-lentivirus, replacing eGFP. After injection into zebra finch vocal nuclei or adjacent regions, these constructs expressed the mRNA and protein products of the injected Gadd45β and Penk cDNAs, as well as the FLAG tag for Gadd45β, without the need to induce them by singing (Figs. 7 D and E and 17B). Synthesis of the ectopically expressed zebra finch genes also lasted at least 1 month (Fig. 17C), the longest period tested.
Fig. 7.
Lentiviral overexpression of full-length cDNAs in zebra finch brain. (A and B) Ectopic expression of full-length eGFP in AreaX and LMAN, respectively, driven by the mammalian UBiC and EF1α promoters. Arrows indicate the injection track. (Ca) Triple label for eGFP (green), Hu (neuronal cytoplasm, red), and DAPI (all cell nuclei, blue). Flat back arrows indicate eGFP in neurons (Hu+); angled back arrows indicate eGFP in glia. (Cb) Quantification of eGFP/Hu double-labeled neurons in 3 × 100-μm areas within 100 μm of the injection site in AreaX expressed from various promoters (n = 3 animals each, 1–2 months). (D) Lentiviral UbiC promoter expression of recombinant zebra finch Gadd45β tagged with FLAG (red) in AreaX, without the bird singing. (E) Lentiviral UbiC promoter expression of recombinant zebra finch ENK (red) in processes of nidopallium neurons above the striatum (St), where ENK is normally not expressed. ENK was detected with a Met-enkephalin antibody, because the FLAG tag was cleaved off during processing of Penk to ENK (Fig. 17B). Transfection after 1 month is shown in A, transfection after 3 months is shown in B and Ca, and transfection after 1 week is shown in D and E. [Scale bars, 500 μm (A); 100 μm (B, Ca, D, and E).]
Discussion
We constructed a high-throughput resource, an approach that includes cDNAs with full-length cds, a hierarchically organized and annotated database, microarrays, and a gene-manipulation tool for molecular investigations in songbirds. Relative to our preliminary (15) and other recent efforts (7, 16), an important feature is that we ensured an array that contains cDNAs representing transcripts from multiple animal states and that there is a mostly full-length collection of these cDNAs. Once a cDNA of interest was identified, the full-length cds of the cDNA allowed us to perform overexpression experiments. They also allowed cross-species array hybridization with other songbird species (Fig. 18).
Using this resource, we identified and characterized 33 singing-regulated genes, the largest collection of genes regulated by a natural behavior that we are aware of. We estimate that >100 genes may be regulated within several hours of singing, assuming we assayed up to ≈40% of the genes expressed in the brain and characterized only ≈1/3 of the potential candidates on the arrays. As proposed for egr-1 (4), the regulation of these genes is presumably driven by the neural activity that is associated with the motor act of singing. However, their varied anatomical profiles underscore the idea that neural activity cannot be the sole regulator of their expression (2), because different genes are expressed in different song nuclei combinations and with differing basal levels. Such anatomical differentiation has been missed when activity-dependent genes were studied in cell culture, where often an underlying assumption is that such genes will be regulated in a similar manner in neurons regardless of brain location.
Their anatomical and temporal patterns suggest that motor-driven gene regulation is a dynamic cascade, where interacting patterns of changing events occur in time. This cascade appears to begin with transcription factors in all vocal nuclei, followed by syntheses of subsets of multiple molecule types (regulatory, structural, enzymatic, ligand, and transport) in different vocal nuclei over at least six different temporal domains. Most of the later appearing mRNA products are present at high levels in vocal nuclei before singing starts, and many of them are considered housekeeping genes, such as β-actin, actin-associated proteins, and protein-folding and chaperone molecules. Their presence in vocal nuclei before singing starts suggests that many of the genes play roles in cellular maintenance in the absence of behavioral performance. This supposition is consistent with one hypothesis on the role of singing-regulated gene expression (4), namely, that it is a possible mechanism for replacing protein products that deteriorate during behavioral performance so that future production of the behavior can occur.
Our results further suggest that each vocal nucleus has unique but overlapping signal-transduction pathways that are activated during singing behavior. The majority of the genes identified were regulated by singing in AreaX; the exceptions were synaptotagmin IV and BDNF, which were very low throughout the striatum. Many were also regulated in HVC, but RA and LMAN had much fewer, even when the expression levels before singing were appreciably high. This distribution is intriguing in that AreaX and LMAN are minimally required for stable song in adults, whereas HVC and RA are required for producing learned song (1, 17). Furthermore, AreaX is the only nucleus so far where we found genes down-regulated by singing; one of these (ARHGEF9) is a GTPase that acts as a molecular switch to regulate actin cytoskeleton formation during cell signaling (18). Perhaps, relative to the pallium, the striatum has a higher proportion of signal-transduction pathways activated by behavioral performance. We caution, however, that AreaX is also the largest vocal nucleus, allowing more material to be obtained from it in brain dissections, and this may have allowed us to identify more genes in the microarrays. Because the in situ hybridization results, which do not discriminate across vocal nuclei, still showed that AreaX had the highest number of regulated genes, either this hypothesis is true, or other song nuclei have other genes not regulated in AreaX that we missed on the arrays. In regard to the former idea, it is intriguing that proenkephalin is regulated by singing in AreaX and HVC. Enkephalin, the mature processed molecule, is a peptide neurotransmitter that binds to opioid receptors and has been proposed to dampen excessive activation of striatal neurons by dopamine (19). AreaX, followed by HVC, is the vocal nucleus with the highest dopamine levels (20), and dopamine is released into AreaX by singing (21). This idea of dampening excessive activation is consistent with the finding that 5 of the 33 singing-regulated genes are heat-shock proteins, which are involved in neuroprotection (22). In conclusion, the above hypotheses can now be tested with the identified cDNAs, where experimental manipulations can be conducted to place the genes in a network.
Methods
Fig. 19 shows our research outline. Detailed protocols are described in Appendix section 3, which includes description of the cloning vector pFLC-I (Fig. 20), modifications to the RIKEN 5′-cap-trapper methods (23) for cDNA cloning, improvements on harvesting full-length clones in bacteria (Fig. 21), improvements to PCR amplifying and sequencing clones, and modifications of lentiviral procedures (13) to acutely express cDNAs in intact songbird brain.
Supplementary Material
Acknowledgments
We thank S. Baumwell and M. McElroy for assistance; D. Sambandan for isolation of clones; S. Lin, R. Wang, and P. Agarwal for database design and analysis; K. Johnson for administrative assistance; R. Mooney (Duke University) for a deafened animal; L. Katz and M. Klein (Duke University) for the CMV-lentivirus plasmid; and P. Osten (Max Planck Institute) for the UbiC-lentivirus plasmids. This work was supported by grants from the Whitehall, Klingenstein, and Packard Foundations; the National Science Foundation Waterman award; the Human Fronteir Science Program; National Institutes of Health (NIH) Grant R01DC7218; and NIH pioneer awards (to E.D.J.), a Uehara Fellowship (to K.W.), and RIKEN and Japanese Ministry of Education awards (to Y.H.). Production of microarrays was supported by the NIH Neurosciences Microarray Consortium.
Abbreviations
- cds
protein coding sequence
- HVC
high vocal center
- LMAN
lateral magnocellular nucleus of the anterior nidopallium
- RA
robust nucleus of the arcopallium.
Note Added in Proof.
An independent recent report (31) supports the regulation of Syt IV by singing.
Footnotes
The authors declare no conflict of interest.
Data deposition: The sequences reported in this paper have been deposited in the GenBank database (accession nos. DV570610–DV584230 for ESTs and DQ213062–DQ217370 for fully sequenced clones). The DNA microarray data reported in this paper have been deposited in the Gene Expression Omnibus (GEO) database, www.ncbi.nlm.nih.gov/geo (accession no. GPL3621). Arrays are available through the Neuroscience Microarray Consortium (http://arrayconsortium.tgen.org).
References
- 1.Nottebohm F, Stokes TM, Leonard CM. J Comp Neurol. 1976;165:457–486. doi: 10.1002/cne.901650405. [DOI] [PubMed] [Google Scholar]
- 2.Jarvis ED. Ann NY Acad Sci. 2004;1016:749–777. doi: 10.1196/annals.1298.038. [DOI] [PMC free article] [PubMed] [Google Scholar]
- 3.Tinbergen N. Z Tierpsychol. 1963;20:410–433. [Google Scholar]
- 4.Jarvis ED, Nottebohm F. Proc Natl Acad Sci USA. 1997;94:4097–4102. doi: 10.1073/pnas.94.8.4097. [DOI] [PMC free article] [PubMed] [Google Scholar]
- 5.Kimpo RR, Doupe AJ. Neuron. 1997;18:315–325. doi: 10.1016/s0896-6273(00)80271-8. [DOI] [PubMed] [Google Scholar]
- 6.Li XC, Jarvis ED, Alvarez-Borda B, Lim DA, Nottebohm F. Proc Natl Acad Sci USA. 2000;97:8584–8589. doi: 10.1073/pnas.140222497. [DOI] [PMC free article] [PubMed] [Google Scholar]
- 7.Lombardino AJ, Li XC, Hertel M, Nottebohm F. Proc Natl Acad Sci USA. 2005;102:8036–8041. doi: 10.1073/pnas.0503239102. [DOI] [PMC free article] [PubMed] [Google Scholar]
- 8.Velho TA, Pinaud R, Rodrigues PV, Mello CV. Eur J Neurosci. 2005;22:1667–1678. doi: 10.1111/j.1460-9568.2005.04369.x. [DOI] [PubMed] [Google Scholar]
- 9.Hillier LW, Miller W, Birney E, Warren W, Hardison RC, Ponting CP, Bork P, Burt DW, Groenen MA, Delany ME, et al. Nature. 2004;432:695–716. [Google Scholar]
- 10.Clayton DF, Huecas M. Brain Res Mol Brain Res. 1990;7:23–30. doi: 10.1016/0169-328x(90)90069-p. [DOI] [PubMed] [Google Scholar]
- 11.Pickering BM, Willis AE. Semin Cell Dev Biol. 2005;16:39–47. doi: 10.1016/j.semcdb.2004.11.006. [DOI] [PubMed] [Google Scholar]
- 12.Mello CV, Ribeiro S. J Comp Neurol. 1998;393:426–438. doi: 10.1002/(sici)1096-9861(19980420)393:4<426::aid-cne3>3.0.co;2-2. [DOI] [PubMed] [Google Scholar]
- 13.Lois C, Hong EJ, Pease S, Brown EJ, Baltimore D. Science. 2002;295:868–872. doi: 10.1126/science.1067081. [DOI] [PubMed] [Google Scholar]
- 14.Scott BB, Lois C. Proc Natl Acad Sci USA. 2005;102:16443–16447. doi: 10.1073/pnas.0508437102. [DOI] [PMC free article] [PubMed] [Google Scholar]
- 15.Jarvis ED, Smith VA, Wada K, Rivas MV, McElroy M, Smulders TV, Carninci P, Hayashizaki Y, Dietrich F, Wu X, et al. J Comp Physiol A. 2002;188:961–980. doi: 10.1007/s00359-002-0358-y. [DOI] [PMC free article] [PubMed] [Google Scholar]
- 16.Wade J, Peabody C, Coussens P, Tempelman RJ, Clayton DF, Liu L, Arnold AP, Agate R. J Neurosci Methods. 2004;138:199–206. doi: 10.1016/j.jneumeth.2004.04.007. [DOI] [PubMed] [Google Scholar]
- 17.Kao MH, Doupe AJ, Brainard MS. Nature. 2005;433:638–643. doi: 10.1038/nature03127. [DOI] [PubMed] [Google Scholar]
- 18.Hakoshima T, Shimizu T, Maesaki R. J Biochem (Tokyo) 2003;134:327–331. doi: 10.1093/jb/mvg149. [DOI] [PubMed] [Google Scholar]
- 19.Steiner H, Gerfen CR. Exp Brain Res. 1998;123:60–76. doi: 10.1007/s002210050545. [DOI] [PubMed] [Google Scholar]
- 20.Harding CF, Barclay SR, Waterman SA. J Neurobiol. 1998;34:329–346. [PubMed] [Google Scholar]
- 21.Sasaki A, Sotnikova TD, Gainetdinov RR, Jarvis ED. J Neurosci. 2006;26:39010–39014. doi: 10.1523/JNEUROSCI.1335-06.2006. [DOI] [PMC free article] [PubMed] [Google Scholar]
- 22.Yenari MA. Adv Exp Med Biol. 2002;513:281–299. doi: 10.1007/978-1-4615-0123-7_10. [DOI] [PubMed] [Google Scholar]
- 23.Carninci P. In: DNA Microarrays: A Molecular Cloning Manual. Bowtell D, Sambrook J, editors. Cold Spring Harbor, NY: Cold Spring Harbor Lab Press; 2003. pp. 647–670. [Google Scholar]
- 24.Waterston RH, Lindblad-Toh K, Birney E, Rogers J, Abril JF, Agarwal P, Agarwala R, Ainscough R, Alexandersson M, An P, et al. Nature. 2002;420:520–562. doi: 10.1038/nature01262. [DOI] [PubMed] [Google Scholar]
- 25.Sheng M, Greenberg ME. Neuron. 1990;4:477–485. doi: 10.1016/0896-6273(90)90106-p. [DOI] [PubMed] [Google Scholar]
- 26.Blais JD, Filipenko V, Bi M, Harding HP, Ron D, Koumenis C, Wouters BG, Bell JC. Mol Cell Biol. 2004;24:7469–7482. doi: 10.1128/MCB.24.17.7469-7482.2004. [DOI] [PMC free article] [PubMed] [Google Scholar]
- 27.Wei SJ, Trempus CS, Cannon RE, Bortner CD, Tennant RW. J Biol Chem. 2003;278:1758–1768. doi: 10.1074/jbc.M206328200. [DOI] [PubMed] [Google Scholar]
- 28.Lyford GL, Yamagata K, Kaufmann WE, Barnes CA, Sanders LK, Copeland NG, Gilbert DJ, Jenkins NA, Lanahan AA, Worley PF. Neuron. 1995;14:433–445. doi: 10.1016/0896-6273(95)90299-6. [DOI] [PubMed] [Google Scholar]
- 29.Thyss R, Virolle V, Imbert V, Peyron JF, Aberdam D, Virolle T. EMBO J. 2005;24:128–137. doi: 10.1038/sj.emboj.7600501. [DOI] [PMC free article] [PubMed] [Google Scholar]
- 30.Vician L, Lim IK, Ferguson G, Tocco G, Baudry M, Herschman HR. Proc Natl Acad Sci USA. 1995;92:2164–2168. doi: 10.1073/pnas.92.6.2164. [DOI] [PMC free article] [PubMed] [Google Scholar]
- 31.Poopatanapong A, Tiramitsu I, Byun JS, Vician LJ, Herschman HR, White SA. Neurobiology. doi: 10.1002/neu.20329. in press. [DOI] [PMC free article] [PubMed] [Google Scholar]
Associated Data
This section collects any data citations, data availability statements, or supplementary materials included in this article.


