Abstract
We report a molecular platform for dual-function fluorescence/MRI sensing of mobile zinc. Zinc-selective binding units were strategically attached to a water-soluble porphyrin template. The synthetic strategy for achieving the designed target ligand is flexible and convenient, and the key intermediates can be applied as general building blocks for the construction of other metal sensors based on a similar mechanism. The metal-free form, (DPA-C2)2-TPPS3 (1), where DPA is dipicolylamine and TPPS3 is 5-phenyl-10,15,20-tris(4-sulfonatophenyl)porphine, is an excellent fluorescent sensor for zinc. It has certain superior physical properties compared with earlier-generation zinc sensors including emission in the red and near-IR regions [λem = 645 nm (s) and 715 nm (m)], with a large Stokes shift of >230 nm. The fluorescence intensity of 1 increases by >10-fold upon zinc binding. The fluorescence “turn-on” is highly selective for zinc versus other divalent metal ions and is relatively pH-insensitive within the biologically relevant pH window. The manganese derivative, [(DPA-C2)2-TPPS3Mn(III)] (2), switches the function of the molecule to generate an MRI contrast agent. In the presence of zinc, the relaxivity of 2 in aqueous solution is significantly altered, which makes it a promising zinc MRI sensor. Both metal-free and Mn(III)-inserted forms are efficiently taken up by live cells, and the intracellular zinc can be imaged by either fluorescence or MR, respectively. We anticipate that in vivo applications of the probes will facilitate a deeper understanding of the physiological roles of zinc and allow detection of abnormal zinc homeostasis for pathological diagnoses.
Keywords: multifunctional imaging, MRI contrast agent, fluorescence dye, cell permeability
Zinc is a ubiquitous and indispensable element in the human body and the second most abundant d-block metal after iron (1, 2). Although most forms of biological zinc are tightly bound and serve as essential structural and catalytic components of metalloprotein scaffolds (3), mobile zinc pools are present in certain mammalian organs, including the brain (4), retina (5), pancreas (6), and prostate (7). The static and kinetic equilibria of these “mobile” zinc pools are under strict regulation for maintenance of their physiological roles (8, 9). Disruptions of zinc homeostasis have been implicated in a number of health disorders (10) such as Alzheimer's disease (11), diabetes, (12) and certain cancers (13). The detailed molecular mechanisms of intracellular Zn2+ accumulation, trafficking, and function are still under debate, however, partially because of a lack of suitable methods for zinc detection in living biological systems. In particular, noninvasive imaging methods for zinc detection in intact live animals, including humans, are nonexistent. Because Zn2+ has a spectroscopically silent d10 electronic configuration, the early techniques for visualization of biological zinc relied largely on invasive histochemical procedures, including use of the colorimetric indicator dithizone (14) and autometallography by Timm's staining (15). Both methods have facilitated the discovery of mobile zinc pools, but they involve irreversible precipitation of zinc complexes and are therefore restricted to use in postmortem samples (16). Recently, fluorescent zinc sensors have received attention, because they can selectively and reversibly detect zinc in live cells or even tissue slices to provide static and kinetic information with high spatial and temporal resolution (17). By rational design, we and others have devised a series of fluorescent zinc sensors that are bright and highly selective and respond rapidly to Zn2+ (17–21) with tunable emission wavelengths (22), zinc affinity (23, 24), cell permeability (25), and subcellular localization (26). Ratiometric zinc sensors, which allow quantification of intracellular zinc concentration, have also been developed (22, 27). Nevertheless, fluorescence imaging suffers from photobleaching and high backgrounds caused by light scattering. Additionally, as with other optical methods, this technique has limited penetration depth and lateral range, making it unsuitable for global analysis of relatively large and opaque specimens, such as live animals (28).
By comparison, MRI can noninvasively penetrate deep into an intact, opaque object to provide interior 3D information, although its spatial resolution is relatively low compared with that of fluorescence imaging (28). Because of the complementary nature of these two techniques, their concurrent application offers a potentially powerful approach for integration of molecular and cellular information about complex biological signaling networks at a systems level. Such integration is particularly valuable for studying zinc(II), a metal ion involved in numerous molecular processes globally, within an intact and complex whole body, rather than within an isolated in vitro system. Our goals, therefore, are to incorporate dual fluorescent and MRI signaling properties into derivatives of the same molecular platform and exploit the principles of such dual-functional molecules for zinc(II) imaging in cells and animals.
As one of the most commonly used clinical diagnostic imaging modalities today, MRI is based on a NMR signal arising predominantly from the protons of water molecules (29). The sensitivity of MRI can be improved by applying contrast agents (CAs), which have mainly been sought among the paramagnetic metal ions because they can influence the NMR relaxation rates of the proton, enhancing the signal in most cases (29). Factors that determine the relaxivity of a CA include electron spin properties, water molecule accessibility, and time scales for molecular motion (30). Adjustment of these three factors offers the possibility to relate certain chemical or physical events to a change in MRI signal intensity, thereby facilitating the design of “smart” CAs for MRI (31). Most of the pioneering work on MRI T1 sensors, including one for zinc (32), have been based on Gd3+ complexes, which are rarely cell-permeable (33). Moreover, free Gd3+ ion can dissociate from a complex with toxic consequences (29) and Zn2+ ion can catalyze this dissociation (34). A PARACEST zinc MRI sensor based on a Eu3+-DOTA scaffold is structurally similar to Gd3+ CAs (35) and therefore shares the same limitations. An MRI sensor for Ca2+ ion that takes advantage of the high sensitivity of iron oxide nanoparticles as T2 CAs was recently reported, but its cell membrane impermeability was one of the major hurdles limiting in vivo application (36).
In the present study, we began with a water-soluble Mn(III)-porphyrin as a molecular scaffold for several reasons. Manga nese(III) porphyrins are efficient and stable MRI CAs (37). In addition, the metal-free or closed-shell metal-inserted porphyrins are fluorescent with unique photophysical properties (38). Finally, these units are cell-permeable both in their metalated and apo forms, with well documented pharmacokinetic properties (39). Here, we describe the synthesis of a water-soluble porphyrin platform bearing selective zinc binding units in both metal-free and Mn(III)-inserted forms. The former serves as a fluorescent zinc sensor, whereas the latter switches the function to that of an MRI zinc sensor. We also demonstrate in a proof-of-principle study that this system can operate as a dual-functional zinc sensor in both solution and mammalian cells.
Results and Discussion
Design and Synthesis.
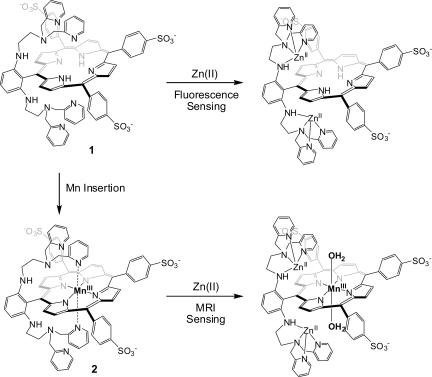
As illustrated in Fig. 1, our construct has dipicolylamine (DPA) groups as selective Zn2+-binding units attached in close proximity to both faces of a porphyrin. When zinc(II) is bound to the metal-free form of the porphyrin (1), the fluorescence of the complex increases because of interruption of photo-induced electron transfer, a strategy that has been successfully implemented by us and others for fluorescence Zn2+ sensing (17). Insertion of manganese into the porphyrin core of 1 affords 2, which was designed to switch the function to MRI zinc(II) sensing. In the absence of Zn2+ ion, the axial coordination sites of 2 were anticipated to be occupied intramolecularly by pyridine groups, blocking water access to the Mn(III) center. In the presence of zinc(II), all of the pyridine units will bind zinc(II), opening the axial sites on Mn(III) in 2 for coordination of water molecules, a process expected to provide zinc-induced enhancement of relaxivity. A related strategy for MRI sensing of Ca2+ ion has been described (40).
Fig. 1.
Design of molecules for dual-function zinc(II) sensing by fluorescence and MRI.
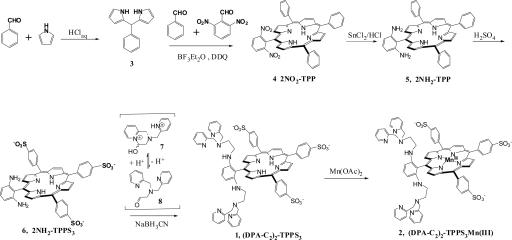
Standard porphyrin synthetic procedures were applied to construct the target molecules (Fig. 2) (41). The synthetic strategy is flexible and can generally be applied to access related MRI sensors for other metal ion targets. With the use of a modified literature procedure (42), we synthesized the 5-phenyldipyrromethane precursor (3) from an aqueous HCl solution and purified it by recrystallization from toluene. Our modification avoided the use of a large excess of pyrrole and laborious workup procedures including column chromatography and sublimation steps (43). It has the potential to be applied in the large-scale synthesis of similar dipyrromethane derivatives, which are common precursors in porphyrin synthesis. The condensation of 3 with benzaldehyde and 2,6-dinitrobenzaldehyde in the presence of BF3·Et2O as a catalyst, followed by in situ oxidation with 2,3-dichloro-5,6-dicyano-1,4-benzoquinone (DDQ), afforded the desired dinitrotetraphenylporphyrin (2NO2-TPP, 4) in 11.5% yield. The reduction of 2NO2-TPP by stannous chloride in aqueous HCl solution gave 2NH2-TPP (5) in excellent yield (85.5%), which was then allowed to react with concentrated H2SO4 at 80°C (44). Under these conditions, we achieved highly selective sulfonation only at the para-positions of the three phenyl rings having no attached amino group. The water-soluble product, 2NH2-TPPS3 (6) [where TPPS3 is 5-phenyl-10,15,20-tris(4-sulfonatophenyl)porphine], was purified by reverse-phase column chromatography (RP-18). The zinc-binding units were then installed to give 1 by reductive amination of 6 in the presence of compound 7, which converts to its ring-opened aldehyde form 8 upon raising the pH (Fig. 2). Manganese(III) ion was inserted into the porphyrin core by reaction of 1 with manganous acetate in hot N,N-dimethylformamide solution to afford (DPA-C2)2-TPPS3Mn(III) (2). The reaction was easily followed by UV-visible spectroscopy as a decrease in absorption at 421 nm and an increase at 467 nm. After purification by RP-18 column chromatography, the final product had no X-band EPR signal, indicating that Mn2+ was efficiently removed without binding to the DPA units. The 2NH2–TPPS3 complex is itself a useful building block to which other metal-binding units can be readily attached.
Fig. 2.
Synthesis of (DPA-C2)2-TPPS3 (1) and (DPA-C2)2-TPPS3 Mn(III) (2).
(DPA-C2)2-TPPS3 (1) as a Fluorescent Zinc(II) Sensor.
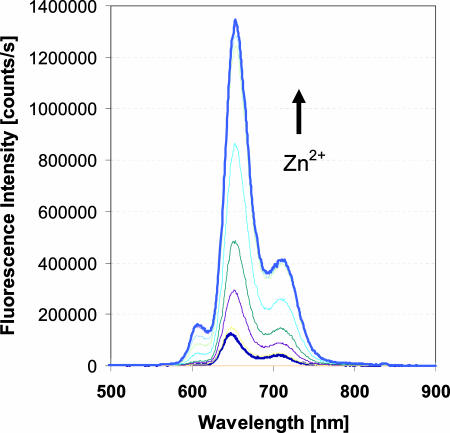
The spectroscopic properties of (DPA-C2)2-TPPS3 (1) were evaluated in buffered neutral aqueous solution (50 mM Hepes/100 mM KCl, pH 7.0). In the absorption spectrum, 1 exhibits a Soret band centered at 416 nm with a high extinction coefficient (ε = 250,700 M−1·cm−1). Upon excitation at this wavelength, two emission bands in the far red (648 nm, strong) and near-IR (715 nm, medium) regions were observed [supporting information (SI) Fig. 8]. The large Stokes shift (≈230 nm) of 1 is a great advantage for fluorescence imaging, because a small Stokes shift can cause self-quenching and measurement error due to noise from the excitation and scattered light. Moreover, because 1 emits at relatively long wavelengths, interference caused by absorption and autofluorescence by biomolecules is reduced, potentially facilitating imaging at deeper penetration depths in tissues. Only very recently have two near-IR zinc fluorescence sensors, based on the heptamethine cyanine chromophores, been reported (45, 46). One showed solvent-dependent photophysical properties that are disadventageous for zinc sensing in aqueous media. Specifically, the emission wavelength was blue-shifted, and Stokes shift became smaller when the solvent was changed from acetonitrile to water (45). The other sensor is not based on a fluorescence turn-on mechanism and has no proven biological applicability (46). The fluorescence of 1 is relatively dim in the absence of zinc. The measured quantum yield is 0.004 (TPPS4 as reference) for a 5 μM solution of 1 in 50 mM Hepes buffer (pH 7.0), 100 mM KCl. Upon the addition of zinc(II) chloride to this solution, the fluorescence intensity increased significantly. In the zinc-saturated form, the quantum yield was measured to be 0.046, >10 times greater than that of the zinc-free form (Fig. 3). A nonlinear least–squares fit of the zinc fluorescence titration data returned a Kd value of 12 nM for the formation of a 1:1 complex between 1 and zinc. As shown for ZP1 and its derivatives, which also contain two zinc-binding sites, the second zinc-binding event is fluorescence-insensitive (47).
Fig. 3.
Fluorescence spectroscopic response of 5 μM 1 to stepwise addition of Zn2+. Spectra were acquired in 50 mM Hepes/100 mM KCl at pH 7.0. Excitation was provided at 418 nm. Appropriate aliquots of a ZnCl2 stock solution in pure water were added to achieve the total zinc concentration [Zn2+]t. The spectra shown are for [Zn2+]t of 0, 1, 2.5, 3.5, 5 (saturation point), 7.5, 10, and 20 μM.
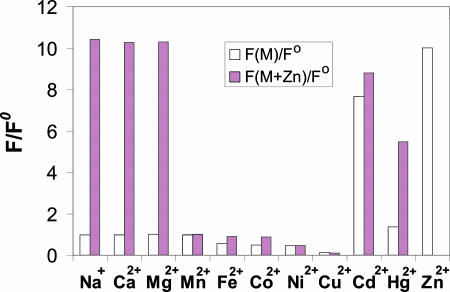
As described for fluorescent zinc sensors containing DPA as the key metal-binding unit (17, 47), the fluorescence turn-on of 1 is selective for Zn2+ over many other monovalent and divalent metal ions (Fig. 4). Even large excesses of Na+, K+, Ca2+, and Mg2+, the most biologically relevant, potentially competing, mobile metal ions, barely perturb the fluorescence of the zinc-free and zinc-bound forms of 1. Various divalent first-row transition metal ions, including Mn2+, Fe2+, Co2+, Ni2+, and Cu2+, quench the fluorescence. Although Cd2+ and Hg2+ can turn on the fluorescence of 1 to a certain degree, neither is significantly abundant in typical biological samples. Fluorescence turn-on by protonation has been a common problem for fluorescent zinc(II) sensors, because protonation diminishes the sensitivity to zinc by increasing the background signal intensity. Compared with the other DPA-based zinc sensors, the fluorescence response of 1 is much less pH-sensitive within the biologically relevant window. A fluorescence increase of less than a factor of two occurs when the solution acidity increases (pH 10.1 to pH 4.5; SI Fig. 9).
Fig. 4.
Fluorescence spectroscopic responses of 1 to various metal ions. Bars represent the ratio of fluorescence intensities before and after the addition of the corresponding metal ions. Metal ions were supplied as chloride salts except for Fe(II) and Cu(II), which were added as (NH4)2Fe(SO4)2·6H2O and CuSO4·5H2O, respectively. All spectra were acquired in 50 mM Hepes/100 mM KCl at pH 7.0. Open bars represent the addition of an excess of the appropriate metal ion (100 μM) to a 5-μM solution of 1. Filled bars represent the subsequent addition of 100 μM Zn2+ to the solution. Excitation was provided at 418 nm.
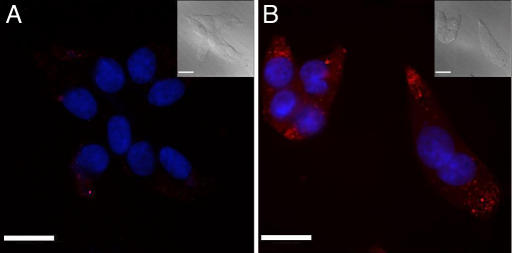
Because 1 is membrane-permeable in all cell lines tested to date, it can be used in intracellular imaging of zinc by fluorescence microscopy. To use the same cell line for demonstration of both fluorescence and MR imaging, we selected HEK-293. Suspension cultures of HEK-293 enabled production of a sizeable cell pellet suitable for MRI and could alternatively be plated as an adherent monolayer for fluorescence imaging studies. The latter monolayer cultures were subcultured five times after the initial plating, grown to 70% confluence on glass cover slips and treated with 1 for fluorescence imaging. The cytotoxicity of 1 was evaluated in these adherent HEK-293 cells by incubating them with 5 μM 1 for 24 h. These cells were healthy as compared with control, untreated cells according to cell counting and viability analysis using trypan blue. Fixed cells were investigated by fluorescence imaging using a customized optical filter, which was especially designed to match the unusual excitation and emission profiles of 1. The cell nuclei were costained with the blue fluorescent dye Hoechst 33258 (0.4 μM). The treated cells showed faint red fluorescence from 1; a significant increase in the red fluorescence intensity occurred upon the addition of Zn2+ (40 μM) carried by the ionophore pyrithione (2-mercaptopyridine-N-oxide), as shown in Fig. 5B, indicating that 1 is taken up by the cell and the intracellular Zn2+ can be detected by fluorescence turn-on of 1. Thus, 1 is a valuable zinc fluorescence sensor and can be applied for intracellular zinc imaging.
Fig. 5.
Fluorescence imaging of intracellular zinc in fixed HEK-293 cells labeled with 1, shown in red, using a customized optical filter (exciter: D425/50; emitter: E600lp; beamsplitter: 460dcxr). The cell nucleus was stained with Hoechst 33258, shown in blue. The HEK-293 cells were incubated with 5 μM 1 for 24 h before fixing. (A) Cells without addition of exogenous zinc. (B) Cells incubated with 40 μM Zn2+ carried by the ionophore pyrithione (1:1) for 10 min before fixing. (Insets) The corresponding bright-field images. (Scale bars: 25 μm.)
(DPA-C2)2-TPPS3Mn(III) (2) as Zinc MRI Sensor.
Insertion of a paramagnetic manganese(III) ion into the porphyrin core of 1 renders the resulting (DPA-C2)2- TPPS3Mn(III) complex (2) an MRI CA. The properties of 2 were investigated by using a spin echo pulse sequence to collect images at several echo times (TEs) in parallel. In some experiments, the repetition times (TRs) were varied so that both T1 and T2 could be evaluated. Multiwell plates were used for sample preparation, which allowed several conditions to be investigated in parallel. The well studied MRI T1 agent, Mn-TPPS4, which contains a similar porphyrin platform as 2 but lacks a zinc-binding unit, was chosen as a reference compound.
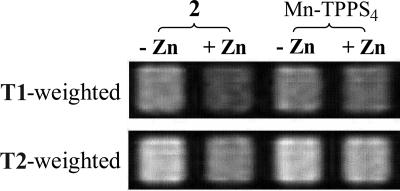
The zinc-dependent MR relaxivity of 2 was first investigated in buffered solutions. An increase in relaxivity for both T1- and T2-weighted images was anticipated according to our original design as depicted in Fig. 1. Unexpectedly, addition of 1 mM ZnCl2 to a 200 μM solution of 2 dissolved in 25 mM Pipes buffer at pH 7 slowed down the T1 relaxation. As illustrated in Fig. 6Upper, the well containing zinc is less bright (lower signal intensity) than the well without zinc in the T1-weighted images. By comparison, almost no change occurs upon addition of zinc to the reference solution of Mn-TPPS4. The T1 values of zinc-free and zinc-saturated solutions were determined at various concentrations of 2, from which T1 relaxivity (R1) values could be deduced. The R1 of the zinc-free form of 2 is 8.7 mM−1·s−1, which decreases to 6.65 mM−1·s−1 upon formation of the zinc complex. Further studies revealed that the zinc-induced relaxivity change is affected by pH (SI Fig. 10) and ionic strength. The zinc-induced T1 contrast is more significant at pH 7 than at pH 6 or 8 and is significantly diminished at high ionic strength (100 mM KCl). Instead of a T1 relaxation change at high ionic strength, a zinc-induced enhancement of T2 relaxation was observed. As shown in the T2-weighted image of Fig. 6, the solution with zinc showed a lower signal intensity than that of the zinc-free sample and, as expected, the reference Mn-TPPS4 displayed no zinc-induced T2 change. Notably, unlike the T1 effect, an increase in the T2 relaxation rate reduced the MR signal intensity. The zinc-induced T2 enhancement depends on the total concentration of 2 (SI Fig. 10).
Fig. 6.
Zn2+-induced relaxation rate change in buffered solution as measured by MRI. Solutions of 2 or Mn-TPPS4 in 25 mM Pipes buffer at pH 7.0 were arrayed in microtiter plates. A spin echo pulse sequence was used to acquire an MRI image. From left to right: 2 without zinc, 2 with 1 mM Zn2+, Mn-TPPS4 without zinc, and Mn-TPPS4 with 1 mM Zn2+. (Upper) T1-weighted image (TR = 175 ms; TE = 10 ms), 200 μM CAs. (Lower) T2-weighted image (TR = 2,000 ms; TE = 240 ms), 500 μM CAs with 100 mM KCl. The solutions containing 2 show that the presence of zinc lowers the MR signal intensity in both the T1- and T2-weighted images. These results indicate a decrease in the T1 relaxation rate and an increase in the T2 relaxation rate, respectively, under the described conditions. By comparison, the MR signal for Mn-TPPS4 is relatively zinc-independent.
Despite the unexpected zinc-induced relaxivity change, compound 2 can serve as an MRI sensor for zinc in solution. These results encouraged us to study 2 for cellular MR imaging. After a 24-h incubation of HEK-293 cells with 100 μM 2, the cell density was similar to that of untreated control cells, indicating that 2 has little cytoxicity. Centrifugation and washing with PBS yielded a dark-green cell pellet, a color typical of manganese porphyrins. This result indicates that 2 either accumulated intracellularly or became associated with the cell membrane. By comparison, the control cell pellet was pale white (SI Fig. 11). To confirm the membrane permeability and further investigate the subcellular localization of 2, the cells were lysed, and nuclear and cytosolic fractions were extracted and analyzed by atomic absorption spectroscopy (AAS). The results indicated that 2 is cell membrane-permeable and preferentially localizes in the nuclear fractions (5.62 mg Mn/liter), rather than in the cytosol (0.78 mg Mn/liter). By contrast, no Mn AAS signal was observed in the control cells.
To investigate zinc-induced relaxivity changes in 2 inside cells, MR images were recorded and compared for cell pellets with and without exogenously introduced zinc. The HEK-293 cell suspension was divided equally into two flasks after a 24-h treatment with 100 μM 2. A 200-μM portion of zinc pyrithione was then added to one of the samples and incubated for an additional 10 min. As in the solution studies, comparisons were made by using Mn-TPPS4 as a reference compound. In addition, an untreated cell sample was prepared as a control. The cell suspensions were pelleted by centrifugation, washed, and transferred into a multiwell plate for MRI analysis.
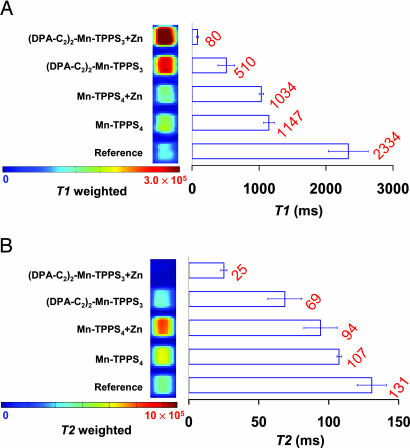
As shown in Fig. 7A Left, cells incubated with 2 or Mn-TPPS4, either with or without zinc, exhibited, to differing degrees, increased MR signal intensities compared with that of the untreated control cell samples in the T1-weighted image (TR = 100 ms; TE = 10 ms). The increased MR signal intensity in the treated samples indicates that both CAs are taken up by the cells. From the relative increase in signal intensities, we conclude that 2 has greater cell membrane permeability than Mn-TPPS4. Comparing the two cell samples that had been incubated with 2, we observed a significantly greater MR signal intensity in the T1-weighted image for cells treated with exogenous zinc than for untreated cells. Consequently, the determined T1 value for the former sample (T1 = 80 ms) is significantly shorter than that of the zinc-free sample (T1 = 510 ms). By comparison, there is no obvious difference between the two Mn-TPPS4-treated cell samples in the presence or absence of zinc (T1 = 1.0 and 1.1 s, respectively). The T1 is represented as a bar at the right side of the adjacent corresponding sample in Fig. 7A (same for the T2 value in Fig. 7B). By increasing the TE from 100 to 2,000 ms, and the TR from 10 to 120 ms, a T2-weighted MRI image was obtained for the same sample. As shown in Fig. 7B Right, for both cell pellets treated with 2, the sample containing exogenous zinc showed a significantly lower signal intensity than the untreated sample, indicating a zinc-induced enhancement of the T2 effect. To further demonstrate this T2 effect, a series of images were recorded with fixed TR (100 ms) and variable TE, from 10 to 80 ms in 10-ms increments (SI Fig. 12). The signal intensity rapidly decreased as TE increased, indicating a strong T2 effect. The T2 value determined from the zinc-treated samples is 25.0 ms, which is significantly shorter than the T2 of the nonzinc-treated samples (69 ms). For Mn-TPPS4 samples, the zinc-induced T2 effect is insignificant (T2 = 107 ms without zinc, 94 ms with zinc).
Fig. 7.
Imaging the intracellular zinc in HEK-293 cells and the measurement of zinc-induced T1 and T2 changes by MRI. HEK-293 cells were incubated with the components as designated to the left. A portion of 2 or Mn-TPPS4 was added to the cell medium to a concentration of 100 μM and allowed to incubate with the HEK-293 cells for 24 h. Subsequently, 200 μM Zn2+ as the pyrithione complex (1:1) was added where indicated, followed by an additional 10-min incubation. The cells were then pelleted, washed with PBS, and arrayed in microtiter plates before imaging. A spin echo pulse sequence was used to acquire MRI images. T1 and T2 were determined by a series of MR images with varied TR or TE, respectively, and represented by bars adjacent to the right side of the corresponding samples. The values reported (red) are the average from three separate experiments with standard deviations as indicated by the horizontal bars. (A) For cells treated with 2, the presence of exogenously added zinc caused a significant increase of MR signal intensity in the T1-weighted image (TR 100 ms; TE 10 ms) and a dramatic decrease of T1 value. (B) In the T2-weighted image (TR 2,000 ms; TE 120 ms), zinc caused a decrease in signal intensity and T2. By comparison, the MR signals intensities and derived T1 and T2 values for cells treated with Mn-TPPS4 are zinc-insensitive.
These results demonstrate that 2 is the first cell-permeable MRI sensor for detecting intracellular zinc in both T1- and T2-weighted images. The observed enhancement in relaxivity with added zinc in cells is what we expected from our initial design. The results observed in the solution study, namely, a zinc-induced decrease of the T1 effect and an increase of the T2 effect, suggest that multiple mechanisms may occur. The robust intracellular zinc effect clearly demonstrates that 2 is a valuable MRI zinc sensor, worthy of further in vivo investigation.
Materials and Methods
Synthetic Materials and Methods.
Synthetic details and compound characterization are provided in SI Text.
Spectroscopic Materials and Methods.
Millipore water was used to prepare all aqueous solutions. All spectroscopic measurements were performed in buffered solutions containing 50 mM of the buffering species and 100 mM KCl adjusted to the desired pH. A glass electrode (Orion, Boston, MA), calibrated before each use, was used to determine solution pH. Solutions of Zn2+ were prepared from 100 mM stocks of ZnCl2 in water. Absorption spectra were recorded on a 8453A diode array spectrophotometer (Hewlett–Packard, Palo Alto, CA) or a Cary 50 Bio UV-visible spectrophotometer (Varian, Palo Alto, CA), and fluorescence spectra were obtained with a Quanta Master 4 L-format scanning spectrofluorimeter (Photon Technology International, Lawrenceville, NJ) equipped with an LPS-220B 75-W xenon lamp and power supply, an A-1010B lamp housing with integrated igniter, a switchable 814 photon-counting/analog photomultiplier detection unit, and a MD-5020 motor driver. Samples for absorption and emission measurements were held in 1 × 1-cm quartz cuvettes (3.5 ml volume; Starna, Atascadero, CA). The experiments for measuring quantum yields, apparent dissociation constants (Kd), and metal ion selectivities were performed as described (47). Quantum yields were determined by reference to TPPS4 [0.16 in pH 7 aqueous solution (38)].
Cell Culture.
Suspension-adapted HEK-293 cells (Free-Style 293-F cell line; Invitrogen, Carlsbad, CA) were grown in 125-ml shaker flasks containing FreeStyle 293 Expression Medium (Invitrogen). Cultures were maintained at >90% viability on a shaker plate (Titer Plate Shaker; Lab-Line Instruments, Melrose Park, NJ) moving at 125 rpm in a 37°C incubator with 8% CO2 and subculturing at a 1:10 ratio upon reaching a density of 2 × 10⁶ cells per ml. Cell density and viability were evaluated with a hemocytometer using 0.4% trypan blue staining. Cell pellets for MRI were prepared in 6-ml suspension cultures, to which either 2 or Mn-TPPS4 was added to a final concentration of 100 μM and incubated for 24 h. Where appropriate, zinc carried by the ionophore pyrithione (1:1 ratio of zinc/pyrithione) was subsequently added to 200 μM, followed by incubation for an additional 10 min. Cell suspensions were pelleted three times (10 min, 500 × g) and washed with PBS, and the resulting loose pellet was inserted into microtiter plates for imaging. Slides of cells growing in adherent monolayers were prepared by plating the suspension-adapted HEK-293 cells in 25-cm2 flasks containing DMEM (Invitrogen) with 10% FBS (HyClone, Logan, UT). After subculturing five times, cells were grown to 70% confluence on poly-d-lysine-coated glass cover slips and incubated with 5 μM of 1 for 24 h. Cells were then either incubated with 40 μM zinc carried by pyrithione (1:1 ratio) for 10 min, fixed in 4% paraformaldehyde, washed with PBS, and stained with Hoechst 33258 (0.4 μM, 10 min incubation in PBS), or directly fixed, stained with Hoechst dye, and imaged.
Fluorescence Microscopy.
The cell fluorescence imaging experiments were performed with an Axiovert 200M inverted epifluorescence microscope (Zeiss, Thornwood, NY) equipped with an EM-CCD digital camera C9100 (Hamamatsu Hamamatsu City, Japan) and a MS200 XY Piezo Z stage (Applied Scientific Instruments, Eugene, OR). An X-Cite 120 metal-halide lamp (EXFO, Quebec, Canada) was used as the light source. The fluorescence images were obtained by using a ×63 oil immersion objective lenses and a customized optical filter (exciter: D425/50; emitter: E600lp; beamsplitter: 460dcxr; Chroma Technology, Rockingham, VT). The microscope was operated with Volocity software (Improvision, Lexington, MA).
Manganese Atomic Absorption Spectroscopy.
Cell monolayers were grown in 75-cm2 plates to 70% confluence and treated with 100 μM of either 2 or Mn-TPPS4, followed by incubation for 24 h. All fractionation steps were performed at 4°C. After twice pelleting by centrifugation (500 × g) and washing with PBS, cells were lysed in a low-salt buffer and incubated on ice for 15 min. After centrifugation (420 × g, 5 min) the pellet was resuspended in two packed-cell volumes of lysis buffer with 20 strokes of a 27-gauge syringe needle. After centrifugation (11,000 × g, 20 min), the supernatant was retained (cytosolic fraction), and the nuclei were lysed in 0.42 M salt with 10 strokes of a 17-gauge syringe needle. After centrifugation (20,000 × g, 5 min), the supernatant was obtained as the nuclear fraction.
Manganese atomic absorption spectroscopic analyses of samples were performed on an Aanalyst 300 instrument equipped with an HGA-800 graphite furnace (PerkinElmer, Wellesley, MA). Pyrolysis was performed at 1,400°C for 30 s, and atomization was performed at 2,200°C for 5 s.
MRI.
Samples prepared as described above were arrayed into microtiter plates and placed in a 40-cm-bore Avance 4.7 T MRI scanner (Bruker, Billerica, MA). Unused wells were filled with PBS, and imaging was performed on a 2-mm slice through the sample. A spin echo pulse sequence with multiecho acquisition was used. The TR was fixed for every acquisition, and the TE was in defined increments. For example, for TR = 100 ms, TE varied from 10 to 80 ms, with a 10-ms increment. To adjust further the weight between T1 and T2, various TRs were applied and the TE increment was changed accordingly, if necessary. Data matrices of 512 × 128 points were acquired and zero-filled to 256 points in the second (phase encoding) dimension. Images were reconstructed and analyzed by using custom routines running in Matlab (Mathworks, Natick, MA).
Supplementary Material
Acknowledgments
This work was supported by National Institute of General Medical Sciences Grant GM65519. X.-a.Z. was supported by postdoctoral fellowships from the Swiss National Science Foundation and the Roche Research Foundation.
Abbreviations
- CA
contrast agent
- DPA
dipicolylamine
- TR
repetition time
- TE
echo time
- TPPS3
5-phenyl-10,15,20-tris(4-sulfonatophenyl)porphine.
Footnotes
The authors declare no conflict of interest.
This article is a PNAS Direct Submission.
This article contains supporting information online at www.pnas.org/cgi/content/full/0702393104/DC1.
References
- 1.Lippard SJ, Berg JM. Principles of Bioinorganic Chemistry. Mill Valley, CA: University Science Books; 1994. [Google Scholar]
- 2.Vallee BL, Falchuk KH. Physiol Rev. 1993;73:79–118. doi: 10.1152/physrev.1993.73.1.79. [DOI] [PubMed] [Google Scholar]
- 3.Auld DS. BioMetals. 2001;14:271–313. doi: 10.1023/a:1012976615056. [DOI] [PubMed] [Google Scholar]
- 4.Frederickson CJ, Suh SW, Silva D, Frederickson CJ, Thompson RB. J Nutr. 2000;130:1471S–1483S. doi: 10.1093/jn/130.5.1471S. [DOI] [PubMed] [Google Scholar]
- 5.Ugarte M, Osborne NN. Prog Neurobiol. 2001;64:219–249. doi: 10.1016/s0301-0082(00)00057-5. [DOI] [PubMed] [Google Scholar]
- 6.Taylor CG. BioMetals. 2005;18:305–312. doi: 10.1007/s10534-005-3686-x. [DOI] [PubMed] [Google Scholar]
- 7.Costello LC, Franklin RB, Feng P, Tan M, Bagasra O. Cancer Causes Control. 2005;16:901–915. doi: 10.1007/s10552-005-2367-y. [DOI] [PubMed] [Google Scholar]
- 8.Outten CE, O'Halloran TV. Science. 2001;292:2488–2492. doi: 10.1126/science.1060331. [DOI] [PubMed] [Google Scholar]
- 9.King JC, Shames DM, Woodhouse LR. J Nutr. 2000;130:1360S–1366S. doi: 10.1093/jn/130.5.1360S. [DOI] [PubMed] [Google Scholar]
- 10.Hambidge M. J Nutr. 2000;130:1344S–1349S. doi: 10.1093/jn/130.5.1344S. [DOI] [PubMed] [Google Scholar]
- 11.Smith JL, Xiong S, Markesbery WR, Lovell MA. Neuroscience. 2006;140:879–888. doi: 10.1016/j.neuroscience.2006.02.049. [DOI] [PubMed] [Google Scholar]
- 12.Chausmer AB. J Am Coll Nutr. 1998;17:109–115. doi: 10.1080/07315724.1998.10718735. [DOI] [PubMed] [Google Scholar]
- 13.Ho E. J Nutr Biochem. 2004;15:572–578. doi: 10.1016/j.jnutbio.2004.07.005. [DOI] [PubMed] [Google Scholar]
- 14.Wolff H. Biochem Z. 1954;325:267–279. [PubMed] [Google Scholar]
- 15.López-García C, Varea E, Palop JJ, Nacher J, Ramirez C, Ponsoda X, Molowny A. Microsc Res Tech. 2002;56:318–331. doi: 10.1002/jemt.10037. [DOI] [PubMed] [Google Scholar]
- 16.Frederickson C. Sci STKE. 2003 doi: 10.1126/stke.2003.182.pe18. [DOI] [PubMed] [Google Scholar]
- 17.Chang CJ, Lippard SJ. In: Neurodegenerative Diseases and Metal Ions. Sigel A, Sigel H, Sigel RKO, editors. Vol 1. Chichester, UK: Wiley; 2006. pp. 321–370. [Google Scholar]
- 18.Jiang P, Guo Z. Coord Chem Rev. 2004;248:205–229. [Google Scholar]
- 19.Kikuchi K, Komatsu K, Nagano T. Curr Opin Chem Biol. 2004;8:182–191. doi: 10.1016/j.cbpa.2004.02.007. [DOI] [PubMed] [Google Scholar]
- 20.Kimura E, Aoki S. BioMetals. 2001;14:191–204. doi: 10.1023/a:1012942511574. [DOI] [PubMed] [Google Scholar]
- 21.Thompson RB. Curr Opin Chem Biol. 2005;9:526–532. doi: 10.1016/j.cbpa.2005.08.020. [DOI] [PubMed] [Google Scholar]
- 22.Chang CJ, Jaworski J, Nolan EM, Sheng M, Lippard SJ. Proc Natl Acad Sci USA. 2004;101:1129–1134. doi: 10.1073/pnas.0308079100. [DOI] [PMC free article] [PubMed] [Google Scholar]
- 23.Goldsmith CR, Lippard SJ. Inorg Chem. 2006;45:555–561. doi: 10.1021/ic051113s. [DOI] [PubMed] [Google Scholar]
- 24.Nolan EM, Jaworski J, Racine ME, Sheng M, Lippard SJ. Inorg Chem. 2006;45:9748–9757. doi: 10.1021/ic061137e. [DOI] [PMC free article] [PubMed] [Google Scholar]
- 25.Woodroofe CC, Masalha R, Barnes KR, Frederickson CJ, Lippard SJ. Chem Biol. 2004;11:1659–1666. doi: 10.1016/j.chembiol.2004.09.013. [DOI] [PubMed] [Google Scholar]
- 26.Nolan EM, Ryu JW, Jaworski J, Feazell RP, Sheng M, Lippard SJ. J Am Chem Soc. 2006;128:15517–15528. doi: 10.1021/ja065759a. [DOI] [PMC free article] [PubMed] [Google Scholar]
- 27.Henary MM, Wu Y, Fahrni CJ. Chem-Eur J. 2004;10:3015–3025. doi: 10.1002/chem.200305299. [DOI] [PubMed] [Google Scholar]
- 28.Tsien RY. Nat Rev Mol Cell Biol. 2003;4:SS16–SS21. [PubMed] [Google Scholar]
- 29.Lauffer RB. Chem Rev. 1987;87:901–927. [Google Scholar]
- 30.Tóth É, Helm L, Merbach AE. In: Topics in Current Chemistry. Krause W, Balzani V, Houk KN, Kessler H, Lehn J-M, Ley SV, Meijere A-d, Schreiber SL, Thiem J, Trost BM, et al., editors. Vol 221. New York: Springer; 2002. pp. 61–101. [Google Scholar]
- 31.Jasanoff A. Trends Neurosci. 2005;28:120–126. doi: 10.1016/j.tins.2004.12.007. [DOI] [PubMed] [Google Scholar]
- 32.Hanaoka K, Kikuchi K, Urano Y, Narazaki M, Yokawa T, Sakamoto S, Yamaguchi K, Nagano T. Chem Biol. 2002;9:1027–1032. doi: 10.1016/s1074-5521(02)00216-8. [DOI] [PubMed] [Google Scholar]
- 33.Allen MJ, MacRenaris KW, Venkatasubramanian PN, Meade TJ. Chem Biol. 2004;11:301–307. doi: 10.1016/j.chembiol.2004.03.003. [DOI] [PubMed] [Google Scholar]
- 34.Sarka L, Burai L, Brücher E. Chem-Eur J. 2000;6:719–724. doi: 10.1002/(sici)1521-3765(20000218)6:4<719::aid-chem719>3.0.co;2-2. [DOI] [PubMed] [Google Scholar]
- 35.Trokowski R, Ren J, Kalman FK, Sherry AD. Angew Chem Int Ed. 2005;44:6920–6923. doi: 10.1002/anie.200502173. [DOI] [PubMed] [Google Scholar]
- 36.Atanasijevic T, Shusteff M, Fam P, Jasanoff A. Proc Natl Acad Sci USA. 2006;103:14707–14712. doi: 10.1073/pnas.0606749103. [DOI] [PMC free article] [PubMed] [Google Scholar]
- 37.Schwert DD, Davies JA, Richardson N. In: Topics in Current Chemistry. Krause W, Balzani V, Houk KN, Kessler H, Lehn J-M, Ley SV, Meijere A-d, Schreiber SL, Thiem J, Trost BM, et al., editors. Vol 221. New York: Springer; 2002. pp. 165–199. [Google Scholar]
- 38.Kalyanasundaram K. Photochemistry of Polypyridine and Porphyrin Complexes. San Diego: Academic; 1992. [Google Scholar]
- 39.Berg K, Selbo PK, Weyergang A, Dietze A, Prasmickaite L, Bonsted A, Engesaeter BØ, Angell-Petersen E, Warloe T, Frandsen N, Høgset A. J Microsc. 2005;218:133–147. doi: 10.1111/j.1365-2818.2005.01471.x. [DOI] [PubMed] [Google Scholar]
- 40.Li W-h, Fraser SE, Meade TJ. J Am Chem Soc. 1999;121:1413–1414. [Google Scholar]
- 41.Lindsey JS. In: Porphyrin Handbook. Kadish KM, Smith KM, Guilard R, editors. Vol 1. San Diego: Academic; 2000. pp. 45–118. [Google Scholar]
- 42.Král V, Vašek P, Dolenský B. Collect Czech Chem Commun. 2004;69:1126–1136. [Google Scholar]
- 43.Boyle RW, Bruckner C, Posakony J, James BR, Dolphin D. Org Synth. 1999;76:287–293. [Google Scholar]
- 44.Kruper WJ, Jr, Chamberlin TA, Kochanny M. J Org Chem. 1989;54:2753–2756. [Google Scholar]
- 45.Tang B, Huang H, Xu K, Tong L, Yang G, Liu X, An L. Chem Commun. 2006:3609–3611. doi: 10.1039/b606809j. [DOI] [PubMed] [Google Scholar]
- 46.Kiyose K, Kojima H, Urano Y, Nagano T. J Am Chem Soc. 2006;128:6548–6549. doi: 10.1021/ja060399c. [DOI] [PubMed] [Google Scholar]
- 47.Burdette SC, Walkup GK, Spingler B, Tsien RY, Lippard SJ. J Am Chem Soc. 2001;123:7831–7841. doi: 10.1021/ja010059l. [DOI] [PubMed] [Google Scholar]
Associated Data
This section collects any data citations, data availability statements, or supplementary materials included in this article.


