

Abstract
The COOH-terminal S9–S10 tail domain of large conductance Ca2+-activated K+ (BK) channels is a major determinant of Ca2+ sensitivity (Schreiber, M., A. Wei, A. Yuan, J. Gaut, M. Saito, and L. Salkoff. 1999. Nat. Neurosci. 2:416–421). To investigate whether the tail domain also modulates Ca2+-independent properties of BK channels, we explored the functional differences between the BK channel mSlo1 and another member of the Slo family, mSlo3 (Schreiber, M., A. Yuan, and L. Salkoff. 1998. J. Biol. Chem. 273:3509–3516). Compared with mSlo1 channels, mSlo3 channels showed little Ca2+ sensitivity, and the mean open time, burst duration, gaps between bursts, and single-channel conductance of mSlo3 channels were only 32, 22, 41, and 37% of that for mSlo1 channels, respectively. To examine which channel properties arise from the tail domain, we coexpressed the core of mSlo1 with either the tail domain of mSlo1 or the tail domain of mSlo3 channels, and studied the single-channel currents. Replacing the mSlo1 tail with the mSlo3 tail resulted in the following: increased open probability in the absence of Ca2+; reduced the Ca2+ sensitivity greatly by allowing only partial activation by Ca2+ and by reducing the Hill coefficient for Ca2+ activation; decreased the voltage dependence ∼28%; decreased the mean open time two- to threefold; decreased the mean burst duration three- to ninefold; decreased the single-channel conductance ∼14%; decreased the K d for block by TEAi ∼30%; did not change the minimal numbers of three to four open and five to seven closed states entered during gating; and did not change the major features of the dependency between adjacent interval durations. These observations support a modular construction of the BK channel in which the tail domain modulates the gating kinetics and conductance properties of the voltage-dependent core domain, in addition to determining most of the high affinity Ca2+ sensitivity.
Keywords: Ca2+-activated K+ channel, maxi K+ channel, TEA, MWC model, gating kinetics
INTRODUCTION
Large-conductance Ca2+-activated potassium channels (BK channels) are activated by both intracellular Ca2+ and membrane depolarization. Consequently, BK channels can provide a direct link between Ca2+-dependent cellular processes and membrane excitability (for reviews see McManus 1991; Latorre 1994; Conley 1996; Kaczorowski et al. 1996). Through this process, BK channels modulate neurotransmitter release (Robitaille et al. 1993), secretion in both endocrine and exocrine cells (Petersen and Maruyama 1984), smooth muscle contraction (Nelson et al. 1995), and the electrical tuning of cochlear hair cells (Hudspeth and Lewis 1988; Wu et al. 1995).
The cloning of BK channels has paved the way toward approaching an understanding of the molecular mechanism of activation. The cDNAs encoding the pore-forming α subunit were first obtained from Drosophila (dSlo; Atkinson et al. 1991; Adelman et al. 1992) and later from additional species including mouse (mSlo1; Butler et al. 1993; Pallanck and Ganetzky 1994), chick (cSlo; Jiang et al. 1997; Navaratnam et al. 1997; Rosenblatt et al. 1997), and human (hSlo; Dworetzky et al. 1994; Pallanck and Ganetzky 1994; Tseng-Crank et al. 1994; McCobb et al. 1995). Alignment of the predicted primary sequences as well as structure–function studies have shown that the BK channel α subunit can be divided into two domains: (1) a core domain and (2) a COOH-terminal tail domain (Wei et al. 1994). The core domain (hydrophobic segments S0–S8) includes six putative transmembrane segments (S1–S6) similar to the pore-forming subunits in the S4 superfamily of voltage-gated K+ channels (such as Shaker). As in the S4 superfamily, the S4 segment in BK channels has been shown to play a major role in sensing voltage (Diaz et al. 1998; Cui and Aldrich 2000). The additional transmembrane segment (S0) is required for modulation by the β subunit (Wallner et al. 1996). The COOH-terminal tail domain (S9–S10) is intracellular (Meera et al. 1997) and plays a key role in sensing Ca2+ (Wei et al. 1994; Schreiber and Salkoff 1997; Schreiber et al. 1998, Schreiber et al. 1999). Two separate regions of the tail domain appear to be critical for Ca2+ sensing: the calcium bowl located between S9 and S10, which includes a string of aspartate residues, and a region which is adjacent to the calcium bowl and includes S10 (Schreiber and Salkoff 1997; Schreiber et al. 1999). Consistent with these findings, a recent study of the dSlo channel has demonstrated Ca2+ binding activity using a COOH-terminal fragment that includes both Ca2+-sensing regions (Bian et al. 2001), and a bacterially expressed protein encompassing site 6 of mSlo, which includes the calcium bowl, could directly bind Ca2+ (Braun and Sy 2001).
The purpose of our present study is to further define the functional role of the COOH-terminal tail domain. Its role as the primary Ca2+ sensor requires that there be an interaction between the core and tail domains so that Ca2+ binding can regulate channel gating (Schreiber et al. 1999). Such an interaction suggests that the tail domain also may modulate other channel properties that are typically associated with the core domain. To explore this possibility, we examined the effect of the tail domain on the bursting kinetics, the voltage dependence, the single-channel conductance, and the sensitivity to block by internal TEA. We took advantage of the functional differences between the BK channel mSlo1 and another recently identified member of the Slo family of K+ channels, mSlo3, which is a pH-sensitive K+ channel from mammalian spermatocytes (Schreiber et al. 1998). Compared with mSlo1, mSlo3 is Ca2+-insensitive, has a briefer mean open time, and a lower single-channel conductance.
Previous experiments have shown that the separate core (S0–S8) and tail (S9–S10) domains of BK channels expressed by themselves do not form functional channels (Wei et al. 1994; Meera et al. 1997), but when coexpressed, they assemble to form functional channels with properties like the wild-type channels (Wei et al. 1994; Meera et al. 1997). Schreiber et al. 1999 have shown that coexpression of the mSlo1 core with the mSlo3 tail yields macroscopic currents that are voltage-activated and Ca2+-insensitive, which is consistent with the mSlo1 tail domain as the major Ca2+ sensor. To determine what other functional properties are contributed by the tail domain, we used single-channel recording to study wild-type mSlo1 and wild-type mSlo3 channels and also channels expressed from the mSlo1 core domain together with either the mSlo1 tail domain (mSlo1 tail channels) or the mSlo3 tail domain (mSlo3 tail channels).
Consistent with the findings of Schreiber et al. 1999, we found that replacing the mSlo1 tail with the mSlo3 tail resulted in a drastic reduction in Ca2+ sensitivity as well as an increase in open probability in the absence of Ca2+. In addition, compared with channels with mSlo1 tails, we found that channels with mSlo3 tails showed decreases in the voltage dependence, mean open time, number of openings per burst, burst duration, and single-channel conductance, as well as an increase in sensitivity to block by internal TEA. These results suggest that, in addition to playing a key role in sensing Ca2+, the COOH-terminal tail domain of the BK channel also modulates the gating and conductance properties of the channel. In addition, we found that the removal of the major Ca2+ binding site from mSlo1 BK channels through the replacement of the mSlo1 tail with the mSlo3 tail did not change the minimal estimates of three to four open and five to seven kinetic states entered during gating. This observation is consistent with the large multitiered state models that have been proposed for the gating of BK channels (Rothberg and Magleby 1999, Rothberg and Magleby 2000; Cui and Aldrich 2000), where a tetrameric voltage-dependent gating mechanism is modulated by Ca2+ binding, and argues against simpler models, such as the Monod-Wyman-Changeux (MWC) model (Monod et al. 1965).
Portions of this work were previously published in abstract form (Moss and Magleby 2000).
MATERIALS AND METHODS
Expression of Cloned Channels in Xenopus Oocytes
Constructs encoding wild-type mSlo1 and mSlo3 channels, as well as the separate mSlo1 core domain, and the separate mSlo1 and mSlo3 tail domains were a gift from Dr. Lawrence Salkoff and Dr. Matthew Schreiber (Washington University School of Medicine, St. Louis, MO). Details on the constructs can be found in Schreiber et al. 1999. Capped cRNAs were transcribed in vitro using the mMessage mMachine kit (Ambion) and resuspended in nuclease-free water at a final concentration of ∼1 μg/μl. The mSlo1 core cRNA was then mixed 1:1 (vol/vol) with either the mSlo1 tail or mSlo3 tail cRNA. Because the cRNA encoding the core domain is about two to three times longer than the cRNA encoding either tail domain, the tail domain cRNA was in about two- to threefold molar excess over the core domain cRNA.
Xenopus laevis oocytes were separated enzymatically using collagenase as previously described (Dahl 1992) and microinjected with 40–50 nl of cRNA encoding mSlo1 core and mSlo1 tail (∼1–5 ng of each cRNA; total of ∼2–10 ng/oocyte) or mSlo1 core and mSlo3 tail (∼5–25 ng of each cRNA; total of ∼10–50 ng/oocyte). We found that the mSlo3 tail channels typically did not express as well as the mSlo1 tail channels, and, therefore, required microinjection of a larger amount of cRNA. In experiments examining the properties of wild-type channels, oocytes were microinjected with 0.8 ng for wild-type mSlo1or 40–70 ng for wild-type mSlo3. Coinjection of mSlo3 core domains with mSlo1 tail domains does not produce functional channels (Schreiber et al. 1999), so this combination was not studied.
Although we have not demonstrated directly that all channels studied were comprised of both core and tail domains, several lines of evidence suggest that this was the case. First, no functional BK channels were detected in patches from oocytes injected with only mSlo1 core cRNA (∼75 ng/oocyte). This observation is consistent with results of Wei et al. 1994 showing that the mSlo1 core alone produced no detectable currents, as assayed by both whole-cell and single-channel recordings. Second, Meera et al. 1997 found that expression of the core domain or the tail domain by themselves do not form functional channels, so that the functional channels that we observed must include both core and tail domains. Third, since the tail domain forms a freely diffusible cytoplasmic protein (Meera et al. 1997), if the tails dissociated during the experiment, then the tail would be expected to diffuse away from excised patches, and channel activity would be expected to cease. The observed numbers of active channels in a patch seldom changed during an experiment, suggesting that dissociation and diffusion did not occur. Fourth, Wei et al. 1994 found that channels resulting from coinjection of separate mSlo1 cores and mSlo1 tails produced channels that were essentially indistinguishable from their full-length counterparts, and we found (see results) similar bursting kinetics for channels expressed in these two different ways. Similar kinetics of channels expressed from full-length subunits and from separate cores and tails suggests that the mSlo1 cores and tails assembled to form channels with function (and presumably structure) similar to the wild-type channels. These observations argue against the possibility that the separate cores and tails were functionally altered by proteases or that fewer than four tail domains associate with each mSlo1 channel. Finally, channels coexpressed from mSlo1 core domains and mSlo3 tail domains (mSlo3 tail channels) exhibited markedly different bursting kinetics from channels coexpressed from mSlo1 core domains and mSlo1 tail domains (mSlo1 tail channels), suggesting that the mSlo1 core and the mSlo3 tail also assembled to form functional channels. Although we cannot establish that every mSlo1 tail channel and every mSlo3 tail channel that we studied contained four tail domains, the above observations and the excess injection of the cRNA for the tail domains would suggest four tail domains per channel.
Single-channel Recording
Currents were recorded from wild-type mSlo1, wild-type mSlo3, mSlo1 tail, and mSlo3 tail channels expressed separately in Xenopus oocytes 2–4 d after injection using the inside-out configuration of the patch-clamp technique (Hamill et al. 1981). To reduce noise, patch pipettes were coated with Sigmacote (Sigma-Aldrich), and only the very tip of the recording electrode was placed in solution. Currents were recorded with an Axopatch 200B amplifier (Axon Instruments, Inc.). Unless otherwise indicated, experiments were performed on patches containing a single channel, determined by extended recordings at high levels of Ca2+ or depolarized potentials expected to readily activate the channels. Xenopus oocytes can express very low levels of endogenous BK channels (Krause et al. 1996). Consequently, we cannot exclude that we might have recorded from such channels. However, we have not yet observed BK channels in patches pulled from uninjected oocytes, or in oocytes with only the core domain injected, and the channels we did record from had properties that would be expected for the various combinations of the core and tail domains. Experiments were performed at room temperature (21–24°C).
In all experiments, the extracellular solution contained 150 mM KCl, 5 mM TES [N-Tris(hydroxymethyl)methyl-2-aminoethane sulfonic acid] pH buffer and 100 μM GdCl3 to block endogenous mechanosensitive channels (Yang and Sachs 1989). The intracellular solution contained 150 mM KCl and 1 mM EGTA to buffer the Ca2+, 5 mM TES, and either no added Ca2+ or sufficient CaCl2 to achieve the indicated levels of free Ca2+. The free Ca2+ was estimated by calibration against previous experiments (Nimigean and Magleby 1999) so that direct comparisons of results could be made. Unless otherwise indicated, solutions were adjusted to pH 7.0. For experiments with no added Ca2+ and 1 mM EGTA, the estimated free Ca2+ was <10−8 M. These solutions will be referred to as 0 Ca2+ solutions, as Ca2+ at this low concentration has little, if any, effect on channel gating (Meera et al. 1996; Nimigean and Magleby 2000). For some experiments comparing burst kinetics between wild-type mSlo1 and wild-type mSlo3 channels, the bath solution was adjusted to pH 7.4 to increase the level of activity of the pH-dependent wild-type mSlo3 channels. For the experiments with TEA, the internal TEA concentration (TEAi) was increased while the concentration of KCl was maintained at 150 mM, as described in Blatz and Magleby 1984.
Analysis of Single-channel Recordings
In experiments measuring specific kinetic parameters that are highly sensitive to differences in filtering (such as mean open time and the mean number of openings per burst), current records were low-pass filtered with a 4-pole Bessel filter to give a final effective filtering of 7–8 kHz (−3 dB). In experiments in which the parameters of interest were relatively insensitive to the level of filtering (such as single-channel conductance and open probability [PO]), current records were low-pass filtered to give a final effective filtering of 3–8 kHz. Single-channel currents were first recorded on a digital data recorder (DC-37 kHz), and after additional filtering (as described in this paragraph) were sampled by computer at a rate of 200 kHz.
The methods used to measure interval durations with half-amplitude threshold analysis and to use stability plots to identify data with stable channel activity for analysis and also to exclude data during mode shifts have been described previously (McManus and Magleby 1988; McManus and Magleby 1991; Silberberg et al. 1996; Moss et al. 1999). For wild-type mSlo1 channels and for mSlo1 tail channels, the most common mode observed was the normal mode, which typically accounts for ∼96% of the detected intervals in BK channels from cultured rat skeletal muscle (McManus and Magleby 1988). In addition to the normal mode activity, wild-type mSlo1 channels, mSlo1 tail channels, and mSlo3 tail channels could enter a Ca2+-dependent low activity mode and also Ca2+-independent isolated long shut intervals (Rothberg et al. 1996). Both of these modes were removed before analysis. For wild-type mSlo3 channels, only one apparent mode was observed. In some experiments, the wild-type mSlo3 channels showed a decrease in channel activity (rundown) over several minutes, as described by Schreiber et al. 1998. These experiments were excluded from analysis. For some patches, the channels exhibited unstable gating kinetics over time, termed wanderlust kinetics by Silberberg et al. 1996, which could encompass a wide range of PO and various types of kinetic activity, including gating in different apparent modes (see discussion). Wanderlust kinetics was observed for both wild-type and chimeric channels, so it was not necessarily associated with chimeric channels. Patches with wanderlust kinetics were excluded from analysis.
The methods used to log-bin the intervals into one dimensional (1-D) dwell-time distributions, fit the distributions with sums of exponentials using maximum likelihood fitting techniques, and determine the number of significant exponential components with the likelihood ratio test have been described previously (McManus and Magleby 1988, McManus and Magleby 1991; Colquhoun and Sigworth 1995). Dwell-time distributions are plotted with the Sigworth and Sine 1987 transformation, which plots the square root of the number of intervals per bin without correcting for the logarithmic increase in bin width with time. With this transform, the peaks in the plots fall at the time constants of the major exponential components.
The method of defining a critical gap (closed interval) to define bursts is detailed in Magleby and Pallotta 1983a. In brief, the 1-D distributions of closed interval durations were first fitted with, typically, the sum of five or six exponential components. The closed intervals from the one to two exponential components with the longest time constants were then defined as gaps between bursts. There was usually a difference of one to three orders of magnitude in the time constants separating the components generating gaps between bursts from those generating closed intervals within bursts, so that the designation of the components was clear. A critical time was then defined to separate closed intervals that were gaps between bursts from those that were gaps within bursts, so that the numbers of misclassified closed intervals would cancel out.
For all mSlo1 tail channels and mSlo3 tail channels, burst analysis was performed on data from patches containing a single channel in which the PO < 0.75, as it became increasingly difficult to define gaps between bursts as PO increased above this value. For mSlo1 and mSlo3 wild-type channels, burst analysis was performed on single-channel patches and also on some multichannel patches when the channel activity was sufficiently low so that only one channel was open at a time. In these patches, the open probability was calculated by dividing the total open time by the total record length, and then by the number of channels in the patch. The mean durations of the gaps between bursts were estimated in multichannel patches by determining the mean gap between bursts as if the data were from a single channel, and then multiplying the mean durations of the gaps by the numbers of channels in the patch. There was no need to correct estimates of the mean burst duration, mean open time, or mean number of openings per burst, since only one channel was open at any given time during a burst.
Two dimensional (2-D) dwell-time distributions were generated as detailed in Rothberg and Magleby 1998a and plotted by extending the Sigworth and Sine 1987 transformation to two dwell-time distributions. Briefly, every open interval and its following (adjacent) closed interval were binned as well as every closed interval and its following (adjacent) open interval, with the logs of the open and closed interval durations of each pair locating the bin on the y- and x-axes, respectively.
Dependency plots were constructed from the 2-D dwell-time distributions as described in Magleby and Song 1992. The dependency for each bin of open-closed interval pairs with mean durations to and tc is:
 |
1 |
where N obs(to,tc) is the observed number of interval pairs in bin (to,tc), and N ind(to,tc) is the calculated number of interval pairs in bin (to,tc) if adjacent open and closed intervals pair independently (at random). The expected number of interval pairs in bin (to,tc) for independent pairing is:
 |
2 |
where P(to) is the probability of an open interval falling in the row of bins with a mean open duration of to, and P(tc) is the probability of a closed interval falling in the column of bins with a mean closed duration of tc. P(to) is given by the number of open intervals in row to divided by the total number of open intervals, and P(tc) is given by the number of closed intervals in column tc divided by the total number of closed intervals.
Single-channel current amplitudes were obtained by plotting histograms of the number of observations versus current amplitude and then measuring the distance between the peaks, which represents the closed and open current levels, and also by visually fitting cursor lines to closed and open single-channel current levels in displayed current records. Similar results were obtained using both methods.
For the TEA experiments, the concentrations of TEAi that reduced the single-channel current amplitude by 50% (K d) at membrane potentials ranging from +30 to +90 mV were estimated from fits of a Langmuir function to plots of percent current versus TEAi. The fraction of current remaining, 1 − y, is:
 |
3 |
K d values at 0 mV were estimated using the Woodhull 1973 equation, where the ratio of the single-channel conductance in the absence (go) and presence (gB) of blocker at the intracellular side of the channel is given by:
 |
4 |
where z, Bi, K d (0 mV) are the blocker valence, concentration, and zero-voltage dissociation constant, respectively, and d is the fraction of voltage drop at the blocking site measured from the intracellular side of the membrane (Coronado and Miller 1982; Blatz and Magleby 1984). When is linearized by taking the natural log of each side, the slope of a plot of ln[(gO/gB) − 1] versus membrane potential equals zdF/RT. Thus, d = slope(RT/Fz), and K d (0 mV) = Bi/exp(y-intercept).
Statistics
Results are presented as the mean ± SEM. Unless otherwise indicated, differences among group means were tested for significance using the t test.
RESULTS
Fig. 1 presents a schematic diagram of the wild-type and chimeric channels studied in this paper to investigate the contribution of the tail domain of BK channels to the gating and conductance properties of the channel. The proposed membrane topology of the Slo family of channels consists of seven transmembrane segments S0–S6 plus a pore (P)-forming region, together with four hydrophobic intracellular regions S7–S10 (Meera et al. 1997; Schreiber et al. 1998, Schreiber et al. 1999). The calcium bowl in the tail of mSlo1, a highly Ca2+-sensitive BK channel cloned from mouse brain, has eight negative charges and has been implicated in the sensing of Ca2+ (Schreiber and Salkoff 1997; Schreiber et al. 1999). In contrast, the region of the calcium bowl in the tail of mSlo3, a Ca2+-insensitive channel from spermatocytes, contains only two negative charges and provides little, if any, Ca2+ sensitivity (Schreiber et al. 1999). Wild-type mSlo1 and mSlo3 channels can be divided into separate core (S0–S8) and tail (S9–S10) regions by removal of a section of the unconserved linker between S8 and S9 (Wei et al. 1994; Schreiber et al. 1999). The core regions of these two different Slo channels have ∼56% identity and the tail regions have ∼38% identity. As detailed in Fig. 1, our paper studies wild-type mSlo1, wild-type mSlo3, a chimera expressed from the core of mSlo1 plus the tail of mSlo1 (mSlo1 tail channels), and a chimera expressed from the core of mSlo1 plus the tail of mSlo3 (mSlo3 tail channels). Functional channels are not expressed from the core of mSlo3 and the tail of mSlo1 (Schreiber et al. 1999).
Figure 1.

Schematic diagram of wild-type mSlo1 channels, wild-type mSlo3 channels, mSlo1 tail channels and mSlo3 tail channels. The position of the calcium bowl in the mSlo1 tail is indicated. The proposed membrane topology of the four studied channels is shown in the top diagram and the components of the various channels is indicated in the schematic diagrams below. The mSlo1 tail channels are expressed from mSlo1 core domains (S0–S8) and mSlo1 tail domains (S9–S10). The mSlo3 tail channels are expressed from mSlo1core domains and mSlo3 tail domains. The mSlo3 core domain (residues 35–641) shares 56% identity with the mSlo1 core domain. The mSlo3 tail domain (residues 686–1136) shares 39% identity with the mSlo1 tail domain (Schreiber et al. 1998). A linker region with little identity is found between S8 and S9. Compared with the mSlo1 tail, the mSlo3 tail has six fewer negatively charged residues in the calcium bowl region. (Adapted from Schreiber et al. 1999.)
Comparison of Kinetic Properties between Wild-type mSlo1 and Wild-type mSlo3
Fig. 2 presents single-channel currents recorded from mSlo1 and mSlo3. In later sections of this paper, we study a chimera made from the core domain (S0–S8) of mSlo1 and the tail domain (S9–S10) of mSlo3 to examine the contribution of the tail domain to the gating. To interpret the chimeric data, it is first necessary to know how the properties of the two wild-type channel types differ. Some of the differences have already been characterized by Schreiber et al. 1998. They found that mSlo3 channels are Ca2+-insensitive in contrast to the high characteristic Ca2+ sensitivity of mSlo1 and all other BK channels. They also found that the voltage sensitivity of mSlo3 channels (∼16 mV/e-fold change in PO) was similar to the voltage sensitivity of mSlo1 (Butler et al. 1993; Cui et al. 1997), and that the conductance of mSlo3 channels (∼106 pS) was considerably less than that of mSlo1 channels (∼270 pS; Butler et al. 1993). In addition, they observed that mSlo3 channels have very brief open times, suggesting that the gating kinetics of mSlo3 also differ from mSlo1.
Figure 2.
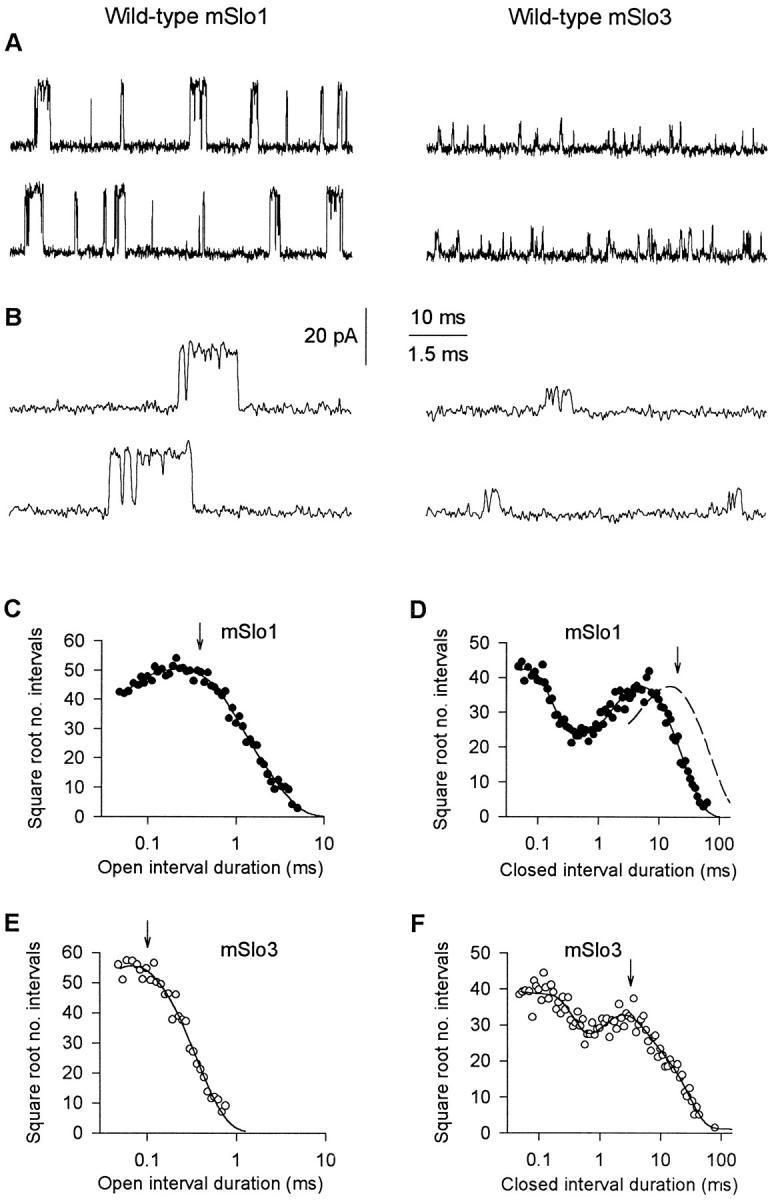
Wild-type mSlo1 channels and wild-type mSlo3 channels have different single-channel kinetics. (A) Single-channel current recordings from wild-type mSlo1 and wild-type mSlo3. Upward (outward) currents indicate channel opening. The mSlo1 patch contained three channels, with a mean PO = 0.040. The mSlo3 patch contained a single channel with a PO = 0.047. Ca2+ i = 0 μM, pH 7.4. Membrane potential = +80 mV. Currents were low-pass filtered at 8 kHz. (B) Representative bursts of openings from A on a faster time base. (C–F) Open and closed 1-D dwell-time distributions for mSlo1 (C and D) and mSlo3 (E and F). The distributions have been scaled to contain the same number of intervals (100,000) to facilitate comparison. The dashed line in D indicates the duration of gaps between bursts after correcting for the number of channels in the patch (materials and methods). The arrows indicate the mean open times and mean durations of the gaps between bursts. The continuous lines are fits with sums of exponential components with the following time constants and areas. (C, open) 0.07 ms, 0.26; 0.28 ms, 0.54; 0.73 ms, 0.20. (D, closed) 0.06 ms, 0.46; 0.21 ms, 0.09; 3.30 ms, 0.17; 7.22 ms, 0.28. (E, open) 0.04 ms, 0.34; 0.10 ms, 0.66. (F, closed) 0.02 ms, 0.25; 0.14 ms, 0.38; 1.93 ms, 0.23; 7.58 ms, 0.14.
To characterize the difference in gating kinetics between mSlo3 and mSlo1, an experimental condition was found that gave similar PO's for the two channels so that the kinetics could be compared. Comparison at similar PO's is necessary, as the mean open times and burst duration of BK channels such as mSlo1 change with PO (Magleby and Pallotta 1983a,Magleby and Pallotta 1983b; Nimigean and Magleby 1999, Nimigean and Magleby 2000). As shown in Fig. 2 A for single-channel currents obtained at ∼0 μM Ca2+ i and +80 mV, mSlo3 (PO ∼ 0.05) had much briefer open times, shorter burst durations, and a lower single-channel conductance than mSlo1 (PO ∼ 0.04). These differences are readily apparent in Fig. 2 B, which shows the currents on a faster time base.
To quantify the difference in bursting kinetics between these two channel types, we measured mean burst duration, mean open time, mean number of openings per burst, and the mean duration of the gaps (closed intervals) between bursts. Bursts were identified by using 1-D closed dwell-time distributions to define a critical gap. Closed intervals longer than the critical gap were then taken as gaps between bursts (materials and methods). Fig. 2 (D and F) presents the 1-D closed dwell-time distributions for the channels presented in Fig. 2A and Fig. B. The arrows indicate the mean gap durations. The dashed line in Fig. 2 D indicates the distribution of effective gap durations after correcting for the three channels in the patch (materials and methods). For these two experiments, the mean burst duration of mSlo3 (0.42 ms) was approximately sevenfold briefer than that of mSlo1 (2.8 ms). The briefer burst duration of the mSlo3 channel was largely due to the approximately sixfold decrease in mean open time of 0.55 ms for mSlo1 to 0.09 ms for mSlo3. The difference in mean open times can be seen by comparing the open dwell-time distributions in Fig. 2 (C and E), where the mean open times are indicated by arrows. In spite of the briefer burst duration for mSlo3, the PO's for the two channels were similar because the mean gap duration for mSlo3 (4.2 ms) was approximately sixfold briefer than the mean gap duration for mSlo1 (24.2 ms).
Burst parameters from experiments such as those shown in Fig. 2 were obtained from a total of five patches with mSlo1 (PO range: 0.01–0.04) and five patches with mSlo3 (PO range: 0.01–0.05). Results are summarized in Fig. 3. Mean burst duration, mean open time, and the mean duration of gaps between bursts were ∼4-fold, ∼3-fold, and ∼2.3-fold less, respectively, for mSlo3 than for mSlo1. There was no significant difference in the mean numbers of openings per burst. In these same experiments, the single-channel conductance was 100 ± 4 pS for mSlo3 and 271 ± 4 pS for mSlo1, which is consistent with values reported previously for these channels (Butler et al. 1993; Schreiber et al. 1998). The remainder of this paper will examine to what extent the tail domain of the channels contributes to the functional differences between mSlo1 and mSlo3.
Figure 3.

Bursting kinetics for wild-type mSlo1 channels differ from wild-type mSlo3 channels at comparable PO's. (A–D) Plots of the indicated mean bursting parameters for each channel type. Compared with mSlo1 channels, mSlo3 channels showed a briefer mean burst duration (P < 0.01), a briefer mean open time (P < 0.001), and a briefer mean gap duration between bursts (P < 0.02), while showing no significant difference in the mean number of openings per burst (P = 0.5). Error bars represent SEM. Data were obtained from five patches containing mSlo1 channels and five patches containing mSlo3 channels. Mean PO: mSlo1 = 0.030 ± 0.005 (range: 0.014–0.040); mSlo3 = 0.030 ± 0.009 (range: 0.011–0.055). All data were obtained at a Ca2+ i of 0 μM and a membrane potential of +80 mV.
Replacing the mSlo1 Tail with the mSlo3 Tail Greatly Decreases Ca2+ Sensitivity and Increases Open Probability in the Absence of Ca2+
To examine the effect of replacing the mSlo1 tail with the mSlo3 tail on the Ca2+ sensitivity of PO and on the basal activity in the absence of Ca2+ i, single-channel currents were recorded from channels comprised of the mSlo1 core domain and either the mSlo1 tail domain (mSlo1 tail channels) or the mSlo3 tail domain (mSlo3 tail channels), as diagramed in Fig. 1. Fig. 4 A presents currents recorded at +30 mV with 0, 8.7, and 67 μM Ca2+ i from a single mSlo1 tail channel and from a single mSlo3 tail channel. Three observations are immediately apparent from these current records: (1) the level of activity in 0 Ca2+ i was higher for the mSlo3 tail channel than for the mSlo1 tail channel; (2) the effect of Ca2+ i on increasing PO (Ca2+ sensitivity) was far less for the mSlo3 tail channel than for the mSlo1 tail channel; and (3) the high Ca2+ i (67 μM) only drove the PO of the mSlo3 tail channel to ∼0.2 compared with almost complete activation for the mSlo1 tail channel.
Figure 4.

Replacing the mSlo1 tail with the mSlo3 tail greatly decreases Ca2+ sensitivity and increases activity in the absence of Ca2+. (A) Single-channel currents recorded from a single mSlo1 tail channel and a single mSlo3 tail channel at different Ca2+ i. Membrane potential: +30 mV. Currents were low-pass filtered at 8 kHz. (B and C) Plots of PO versus Ca2+ i for four mSlo1 tail channels (B) and seven mSlo3 tail channels (C). The lines are fits of the Hill equation, with the mean values of the parameters given in the text. The mSlo1 tail and mSlo3 tail channels in A are represented by closed and open triangles, respectively, in B and C.
To examine further this marked difference in Ca2+ sensitivity, PO was plotted against Ca2+ i for four mSlo1 tail channels in Fig. 4 B and seven mSlo3 tail channels in Fig. 4 C (+30 mV). Unlike the mSlo1 tail channels that all had a very low PO in the absence of Ca2+ i (0.0005 ± 0.0003), four of the mSlo3 tail channels showed a relatively high level of activity in the absence of Ca2+ i, with PO's ranging from 0.14 to 0.34, and three showed lower PO's, ranging from 0.0001 to 0.01. (The reason for the wide range in activity for mSlo3 tail channels in the absence of Ca2+ i is not known, but a wide range of activity was observed in two separate series of experiments, and will be addressed in the discussion.) Also, unlike the mSlo1 tail channels, which had PO's approaching 0.96 at 67 μM Ca2+ i, the mSlo3 tail channels were not fully activated at +30 mV, even with 1,000 μM Ca2+ i, where the mean PO was 0.43 ± 0.08. This lack of maximal activation is not because mSlo3 tail channels have reached some type of inherent limit, as depolarization of mSlo3 tail channels can drive them to high levels of activity (see Fig. 6).
Figure 6.

Replacing the mSlo1 tail with the mSlo3 tail decreases the voltage dependence. (A) Single-channel recordings from patches containing a single mSlo1 tail channel and a single mSlo3 tail channel at the indicated membrane potentials. The records were low-pass filtered at 3 kHz. (B and C) Plots of PO versus membrane potential for five mSlo1 tail channels (B) and five mSlo3 tail channels (C). The lines are fits of the Boltzmann equation, with the mean values of the parameters given in the text. For ease of comparison, the dotted lines in B plot the fits to the mSlo3 tail channels in C. The mSlo1 tail channels were studied in 0 μM (closed circle, closed diamond), 8.7 μM (closed inverted triangle and closed square) and 25.6 μM (closed triangle) Ca2+ i. The mSlo3 tail channels were studied in 0 μM (open triangle, open square, and open circle), 8.7 μM (open diamond), and 15.2 μM (open hexagon) Ca2+ i. The records shown in A are represented by inverted closed triangles in B for the mSlo1 tail channel and by upright open triangles in C for the mSlo3 tail channel.
All four mSlo1 tail channels showed a steep increase in PO with increasing Ca2+ i (Fig. 4 B). The mean Hill coefficient was 3.2 ± 0.2 (range: 2.9–3.5) and the mean Ca2+ i required to achieve a PO of 0.5 (K d) was 11.8 ± 1.5 μM (range: 8.3–14.2). These results are within the range of previous observations for wild-type mSlo1 (Butler et al. 1993; Cui et al. 1997; Nimigean and Magleby 1999).
In contrast to the high Ca2+ sensitivity of the mSlo1 tail channels, the mSlo3 tail channels showed a much smaller increase in PO with increasing Ca2+ i. Accurate estimates of the Hill coefficients could not be obtained for the mSlo3 tail channel because, except for one channel that appeared to reach a maximum PO, it was unclear whether maximum activation was reached for the other channels, even with 1,000 μM Ca2+ i. Higher concentrations than this were not examined because of the possibility of effects of Ca2+ i on low affinity Mg2+ sites (Golowasch et al. 1986; Solaro et al. 1995; Shi and Cui 2001). Consequently, estimates of the upper limits of the Hill coefficients for mSlo3 tail channels were obtained by setting the maximum level of PO to the maximum level of PO typically observed in these experiments (0.5), and estimates for the lower limit were obtained by setting the maximum level of PO to 0.96, the highest channel activity typically observed under any conditions. The upper limit on the estimated mean Hill coefficient for the mSlo3 tail channels was 1.3 ± 0.5 (range: 0.7–2.0), and the lower limit was 0.55 ± 0.2 (range: 0.05–1.4). These estimates were ∼20–45% of those for the mSlo1 tail channels, and only apply over a limited range of PO. The K ds for the mSlo3 tail channels were 13, 34, 140, 340, 500, 700, and 9,200 μM when the maximum PO was set to 0.5, and were 440, 740, 1,200, 1,500, 24,000, and 29,000 μM when the maximum PO was set to 0.96. The wide variability in the estimated K ds indicates that some unknown factor is not under control, but in any case, the K ds for mSlo3 tail channels are typically considerably greater than for mSlo1 tail channels.
Since the activity of wild-type mSlo3 channels is pH-dependent, the question arises whether the small effects of Ca2+ i might be due to a small but systematic change in the pH of the solutions below the resolution of the pH electrode. This is unlikely to be the case, as the mSlo3 tail channels showed little pH sensitivity in preliminary experiments in which the pH was changed from 6.5 to 8.0 (unpublished data), and Schreiber et al. 1999 found that mSlo3 tail channels were not sensitive to pH in the range of 7.0–8.0 in terms of changes in gmax or the voltage for half activation.
Replacing the mSlo1 Tail with the mSlo3 Tail Decreases the Ca2+ Dependence of Both Mean Open and Mean Closed Times
To gain insight into the mechanism of the difference in Ca2+ sensitivity between mSlo1 tail channels and mSlo3 tail channels, mean open and closed interval durations were measured and plotted versus Ca2+ i for the same channels presented in Fig. 4. Increasing Ca2+ i from 0 to 67 μM increased the mean open time of mSlo1 tail channels approximately eightfold (Fig. 5 A), with little or no increase in the mean open time of mSlo3 tail channels (Fig. 5 B). Over the same range of Ca2+ i, the mean closed time of mSlo1 tail channels decreased ∼2,300-fold (Fig. 5 C), compared with an ∼14-fold decrease in the mean closed time of mSlo3 tail channels (Fig. 5 D). Thus, the greatly decreased Ca2+ sensitivity of mSlo3 tail channels reflects a greatly decreased Ca2+ dependence of both mean open time and mean closed time.
Figure 5.

Replacing the mSlo1 tail with the mSlo3 tail decreases the Ca2+ sensitivity of both mean open and mean closed times. Mean open time and mean closed time versus Ca2+ i for four mSlo1 tail channels (A and C) and four mSlo3 tail channels (B and D). Symbols correspond to those in Fig. 4. Membrane potential: +30 mV. Currents were low-pass filtered at 8 kHz.
Replacing the mSlo1 Tail with the mSlo3 Tail Decreases the Voltage Dependence
To examine whether replacing the tail of mSlo1 with the tail of mSlo3 altered the voltage dependence of mSlo1, currents were recorded from a single mSlo1 tail channel and a single mSlo3 tail channel at +20, +50, and +80 mV. As shown in Fig. 6 A, both channels had a low activity at +20 mV (PO ∼ 0.04), which then increased dramatically with depolarization, with a suggestion that the increase for the mSlo3 tail channel was less than for the mSlo1 tail channel. To examine the voltage dependence further, we plotted PO versus membrane potential for five mSlo1 tail channels in Fig. 6 B and five mSlo3 tail channels in Fig. 6 C. The mSlo1 tail channels were studied in 0 μM (Fig. 6, closed circle and closed diamond), 8.7 μM (Fig. 6, closed inverted triangle and closed square), and 25.6 μM (closed triangle) Ca2+ i. The mSlo3 tail channels were studied in 0 μM (open triangle, open square, and open circle), 8.7 μM (open diamond), and 15.2 μM (open hexagon) Ca2+ i. For these particular experiments with mSlo1, the data obtained from different channels at the same Ca2+ i essentially overlap. For mSlo3 channels, there were no consistent relationship between Po and Ca2+ i.
The lines are Boltzmann fits to the data. Only three of the five fits are readily apparent in Fig. 6 C because of the overlap of fitted curves. To facilitate comparison between the channels, the Boltzmann fits to the mSlo3 tail channels in Fig. 6 C are plotted in Fig. 6 B as dotted lines on the plots from the mSlo1 tail channels. A shallower slope for the mSlo3 tail channels is seen, indicating a decreased voltage dependence for the mSlo3 tail channels (17.3 ± 0.9 mV per e-fold change in PO; range: 15.8–19.5 mV) compared with the mSlo1 tail channels (12.3 ± 0.3 mV; range: 11.7–13.4 mV), and this difference was significant (P < 0.001). The estimated effective gating charge (in units of electronic charge, e o) for mSlo3 tail channels was 1.49 ± 0.06 (range: 1.31–1.62), and for mSlo1 tail channels was 2.08 ± 0.05 (range: 1.91–2.18). Both these estimates are within the ranges of values reported for wild-type mSlo1 and also other wild-type BK channels (Butler et al. 1993; Cui et al. 1997; Stefani et al. 1997; Rothberg and Magleby 2000).
Replacing the mSlo1 Tail with the mSlo3 Tail Decreases Burst Duration
The single-channel currents in Fig. 4 and Fig. 6 suggest that, in addition to decreasing both Ca2+ sensitivity and voltage dependence, replacing the tails of mSlo1 channels with the tails of mSlo3 channels may also decrease burst duration. To examine this possibility, we compared mSlo1 tail channels and mSlo3 tail channels at similar PO's, to control for the fact that the burst duration of mSlo1 channels increases with PO, independent of whether the channels are activated by Ca2+ i or depolarization (Nimigean and Magleby 1999, Nimigean and Magleby 2000). As shown in Fig. 7 (A and B), which presents single-channel current records from a single mSlo1 tail channel and a single mSlo3 tail channel on two different time bases, the mSlo3 tail channel does appear to have briefer duration bursts, even though the PO's of the two channels are similar (PO's of 0.30 and 0.34, for mSlo1 tail and mSlo3 tail, respectively).
Figure 7.
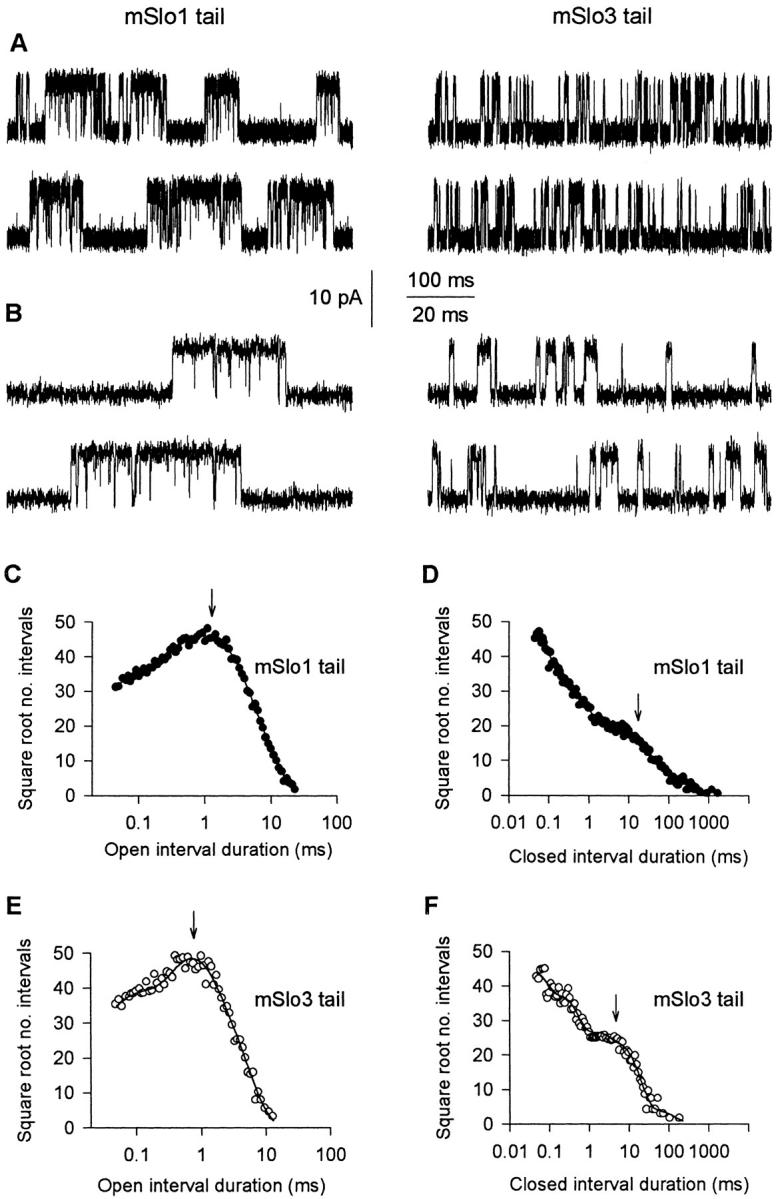
Replacing the mSlo1 tail with the mSlo3 tail decreases burst duration. (A) Single-channel current recordings from patches containing a single mSlo1 tail channel and a single mSlo3 tail channel. For the mSlo1 tail channel, Ca2+ i = 15.2 μM and PO = 0.30. For the mSlo3 tail channel, Ca2+ i = 0 μM and PO = 0.34. Membrane potential: +30 mV. Both recordings were low-pass filtered at 8 kHz. (B) Representative bursts of openings from A on a faster time base. (C–F) Open and closed 1-D dwell-time distributions for the mSlo1 tail channel (C and D) and mSlo3 tail channel (E and F) shown in A and B. The distributions have been scaled to contain the same number of intervals (100,000) to facilitate comparison. The arrows indicate the mean open times and the mean durations of the gaps between bursts. The time constants and areas of the exponential components are as follows. (C, open) 0.05 ms, 0.16; 0.27 ms, 0.20; 1.08 ms, 0.39; 2.57 ms, 0.25. (D, closed) 0.03 ms, 0.44; 0.11 ms, 0.21; 0.35 ms, 0.15; 1.17 ms, 0.08; 6.15 ms, 0.08; 22.94 ms, 0.04. (E, open) 0.06 ms, 0.23; 0.56 ms, 0.45; 1.49 ms, 0.32. (F, closed) 0.03 ms, 0.40; 0.19 ms, 0.32; 1.10 ms, 0.13; 5.74 ms, 0.15.
To quantify the difference in bursting kinetics between these two channels, we measured several burst parameters including mean burst duration, mean open time, mean number of openings per burst, and mean duration of the gaps (closed intervals) separating bursts. As in the burst analysis of the wild-type channels, bursts were identified by using 1-D closed dwell-time distributions to define a critical gap to separate bursts. Fig. 7 (D and F) presents the 1-D closed dwell-time distributions, and the arrows indicate the mean gap durations. Burst analysis of the single-channel currents indicated that replacing the mSlo1 tail with the mSlo3 tail decreased burst duration 3.4-fold, from 8.6 ms for the mSlo1 tail channel to 2.5 ms for the mSlo3 tail channel. The decreased burst duration of the mSlo3 tail channel was largely due to a decrease in the mean number of openings per burst, from 6.1 for the mSlo1 tail channel to 2.9 for the mSlo3 tail channel, as well as a decrease in mean open time, from 1.2 ms for the mSlo1 tail channel to 0.79 ms for the mSlo3 tail channel. This 34% decrease in mean open time can be seen by comparing the 1-D open dwell-time distributions in Fig. 7 (C and E), where the arrows indicate mean open time. For the same PO, replacing the mSlo1 tail with the mSlo3 tail also decreased the mean duration of gaps between bursts fourfold, from 17.4 to 4.3 ms (Fig. 7D and Fig. F, arrows).
To characterize the differences in bursting kinetics between mSlo1 tail channels and mSlo3 tail channels over a range of PO, bursting parameters were measured and plotted against PO for 10 datasets from three mSlo1 tail channels and 10 datasets from three mSlo3 tail channels (membrane potential: +30 mV; 0–67 μM Ca2+ i). As shown in Fig. 8 A, the mean burst duration of mSlo3 tail channels was three- to ninefold briefer than that of mSlo1 tail channels over the range of PO examined (0.0005–0.75). The briefer burst duration was associated with a two- to threefold decrease in mean open time (Fig. 8 B) and a decrease in the mean number of openings per burst (Fig. 8 C). In addition, the gaps between bursts for the mSlo3 tail channels were four- to fivefold briefer than those for mSlo1 tail channels (Fig. 8 D). Thus, replacing the mSlo1 tail with the mSlo3 tail resulted in a consistent and pronounced modulation of bursting kinetics over an ∼1,500-fold range of PO.
Figure 8.

Bursting kinetics for mSlo1 tail channels differ from mSlo3 tail channels at the same PO. (A–D) Plots of indicated bursting parameters versus PO. Compared with mSlo1 tail channels, mSlo3 tail channels showed a briefer mean burst duration (A), a briefer mean open time (B), a decrease in the mean number of openings per burst (C), and briefer durations of gaps between bursts (D). For both mSlo1 tail channels and mSlo3 tail channels, each plot contains estimates from 10 datasets from three different channels. Membrane potential: +30 mV. All recordings were low-pass filtered at 8 kHz. Each symbol type plots data from a different channel. The channels shown in Fig. 7 (A and B) are represented by a closed square for the mSlo1 tail channel and an open triangle for the mSlo3 tail channel. For comparison, each plot includes the mean burst parameters for the wild-type mSlo1 channels (closed circle with crosshair) and wild-type mSlo3 channels (open circle with crosshair) from Fig. 3.
If the tail domain of the Slo family of channels modulates the bursting kinetics, then it might be expected that transferring the tail of mSlo3 to mSlo1 would also transfer the bursting kinetic properties of mSlo3. To test this hypothesis, the parameters defining the bursting kinetics of wild-type mSlo1 and wild-type mSlo3 channels are plotted on Fig. 8 (large circles containing a plus sign) for comparison to the kinetics of mSlo1 tail channels and mSlo3 tail channels. In general, replacing the tail of mSlo1 with the tail of mSlo3 transferred the bursting kinetic properties of wild-type mSlo3 channels.
Replacing the mSlo1 Tail with the mSlo3 Tail Does Not Change the Number of Detected Kinetic States Entered during Gating
BK channel gating has been well-described by schemes in which the channel enters multiple kinetically distinct open and closed states (McManus and Magleby 1991; Wu et al. 1995; Cui et al. 1997; Horrigan et al. 1999; Rothberg and Magleby 1999, Rothberg and Magleby 2000; Cui and Aldrich 2000). Thus, it is possible that the difference in bursting kinetics between mSlo1 tail channels and mSlo3 tail channels may reflect a difference in the number of states each channel enters during gating. The minimum number of open and closed states can be estimated from the number of significant exponential components required to describe dwell-time distributions of open and closed intervals (Colquhoun and Hawkes 1995). Therefore, we estimated the number of significant exponential components required to fit open and closed 1-D dwell-time distributions for both mSlo1 tail channels and mSlo3 tail channels.
Fig. 9 (A and B) plots estimates of the number of significant exponential components (number of detected states) required to describe the open (A) and closed (B) 1-D dwell-time distributions for 15 datasets from five patches, each containing a single mSlo1 tail channel, and for 15 datasets from five patches, each containing a single mSlo3 tail channel. Multiple datasets were obtained from each channel by obtaining data at different Ca2+ i. The estimates are plotted against the number of intervals analyzed, since the ability to resolve exponential components increases with increasing numbers of intervals (McManus and Magleby 1988).
Figure 9.

Replacing the mSlo1 tail with the mSlo3 tail does not change the number of detected kinetic states entered during gating. Estimates of the number of detected open (A) and closed (B) states entered during gating plotted against the number of intervals analyzed. Estimates plot the number of significant exponential components required to describe the 1-D dwell-time distributions. For each channel type, the 15 estimates of the open states and 15 estimates of the closed states are from fitting 15 different datasets from five different single-channel patches. Multiple datasets were obtained from each channel by obtaining data at different Ca2+ i, which ranged from 0 to 67 μM. Membrane potential: +30 mV. All recordings were low-pass filtered at 8 kHz.
Estimates of the minimum number of open states ranged from two to four for both types of channels. The mean number of detected open states for mSlo1 tail channels (2.9 ± 0.2) was not significantly different (P < 0.05, Mann-Whitney test) from the mean number of detected open states for mSlo3 tail channels (2.9 ± 0.2). Estimates of the number of detected closed states ranged from four to eight for mSlo1 tail channels and from three to seven for mSlo3 tail channels. The mean number of detected closed states for mSlo1 tail channels (5.6 ± 0.3) was not significantly different (P < 0.05, Mann-Whitney test) from the mean number of detected closed states for mSlo3 tail channels (5.1 ± 0.3). Thus, each channel type typically entered a minimum of three or more open and five to six closed kinetic states during normal activity.
These results suggest that the pronounced difference in bursting kinetics between mSlo1 tail channels and mSlo3 tail channels does not reflect a major difference in the number of detected kinetic states entered during gating. However, we cannot rule out the possibility that mSlo1 tail channels and mSlo3 tail channels do differ in the number of kinetic states entered during gating and that these differences were not detected due to overlapping time constants and/or small areas of some of the exponential components.
mSlo1 Tail Channels and mSlo3 Tail Channels Have Similar Kinetic Structures
Replacing the mSlo1 tail with the mSlo3 tail resulted in a pronounced change in bursting kinetics. Such differences in kinetics could arise from a fundamental change in the gating mechanism or a change in the transition rates among states. The observation that the numbers of detected states did not change would argue against a fundamental change in the gating mechanism, but this is not clear. One way to help distinguish between these two possibilities is to examine the effective connections (transition pathways) among the various open and closed states. 2-D dwell-time distributions, which plot the relative number of occurrences (frequency) various pairs of adjacent open and closed intervals of specified durations are observed in the single-channel record, contain correlation information that can help define these connections (Fredkin et al. 1985; Keller et al. 1990; Magleby and Song 1992).
Fig. 10 (A and C) presents the 2-D dwell-time distributions for the mSlo1 tail channel and the mSlo3 tail channel, whose single-channel currents were shown in Fig. 7. The y- and x-axes plot the log of the durations of adjacent open and closed intervals, respectively, and the z axis plots the square root of the number of observations per bin. To facilitate comparison, the PO's were similar for both channel types (0.30 and 0.34). The general shapes of the plots were similar, but with differences in the relative frequency of the various interval pairs. For example, for both channel types, the components of interval pairs that occurred most frequently were long open intervals adjacent to brief closed intervals (Fig. 10A and Fig. C, position 3). These interval pairs typically give rise to openings separated by brief closings within bursts. A major difference in the two plots is that the mSlo3 tail channel shows a higher frequency of brief open intervals adjacent to brief closed intervals (Fig. 10 C, arrow). These interval pairs would contribute to the briefer mean open time and briefer burst duration of mSlo3 tail channels. Also notice that the long closed intervals of the mSlo3 tail channel are shifted toward briefer durations (positions 2 and 4). This shift reflects the briefer duration of gaps between bursts for mSlo3 tail channels. Fig. 10 (E and G) presents 2-D dwell-time distributions for another pair of channels studied at a lower PO (0.19 and 0.14), where the relative frequency of brief open intervals is much greater for the mSlo3 tail channel than for the mSlo1 tail channel (arrow and position 2). Thus, as would be expected from their differences in bursting kinetics, mSlo1 tail channels and mSlo3 tail channels have differences in the relative frequencies of interval pairs.
Figure 10.
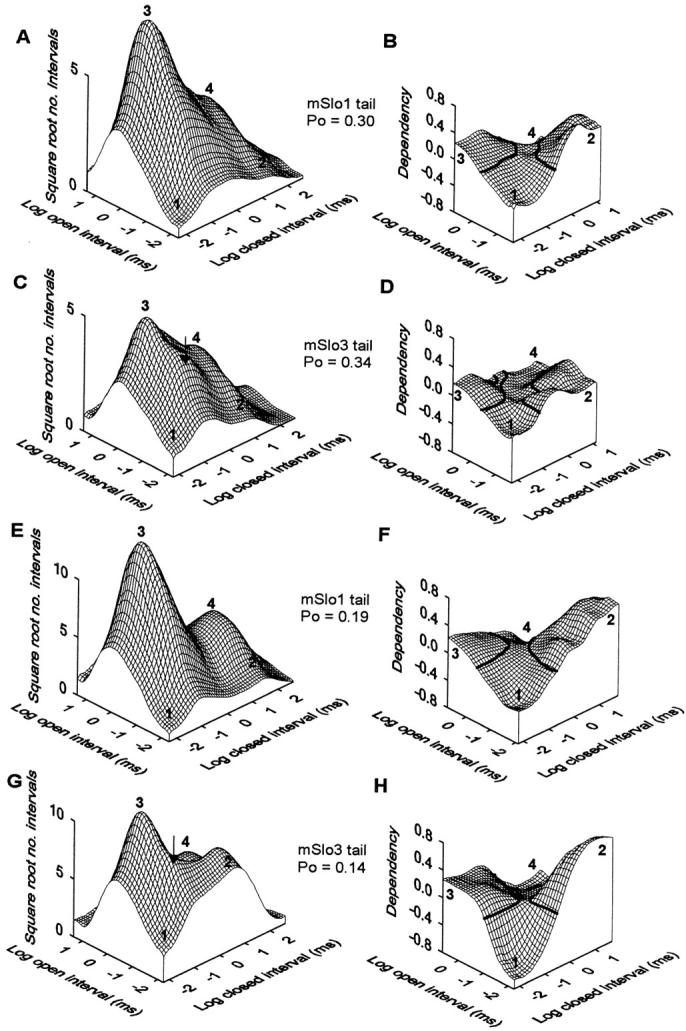
A comparison of 2-D dwell-time distributions and dependency plots obtained for mSlo1 tail channels and mSlo3 tail channels at similar PO's indicates that the two channel types have distinct kinetics, yet similar kinetic structures. Compare A with C and E with G to see differences in the 2-D dwell-time distributions between mSlo1 tail channels and mSlo3 tail channels at comparable PO's. The arrows in C and G indicate the higher occurrence of brief open intervals adjacent to brief closed intervals observed in mSlo3 tail channels. Compare B with D and F with H to see the similar saddle shape of the dependency plots between mSlo1 tail channels and mSlo3 tail channels. The heavy lines in the dependency plots indicate a dependency of zero. A–D present the 2-D dwell-time distributions and dependency plots for the mSlo1 tail channel and the mSlo3 tail channel shown in Fig. 7.
In addition to providing a profile of the relative frequencies of interval pairs, the 2-D dwell-time distributions also contain correlation information which gives information about the connections between different open and closed states (and compound states) of different mean lifetimes (Magleby and Song 1992). This information is not obvious from visual inspection of the 2-D dwell-time distributions, because the relative heights of individual peaks indicate the relative frequency of occurrence of interval pairs of various durations, and not whether any given interval pair is in excess or deficit over what would be expected from independent (random) pairing of the intervals.
Dependency plots provide a means to display this correlation information (Magleby and Song 1992). A dependency plot presents the fractional difference between the observed number of adjacent open and closed intervals of indicated durations and the hypothetical number that would be observed if all of the open and closed intervals paired independently ( and ). For example, dependencies of +0.5 or −0.5 would indicate 50% more or 50% fewer observed interval pairs, respectively, than expected for independent pairing of open and closed intervals. A positive dependency for an interval pair suggests the presence of effective transition pathways between the open and closed kinetic states (and compound states) that give rise to that pair. Conversely, a negative dependency for a given interval pair suggests a deficit of effective transition pathways between the open and closed kinetic states (and compound states) that give rise to that pair (Magleby and Song 1992; Rothberg et al. 1997; Rothberg and Magleby 1998b). Thus, dependency plots reveal the kinetic structure of a channel.
Fig. 10B and Fig. D and Fig. F and Fig. H, presents dependency plots derived from the 2-D dwell-time distributions in Fig. 10A and Fig. C, and Fig. E and Fig. G, respectively. Although mSlo1 tail channels and mSlo3 tail channels differ kinetically, a comparison of the four dependency plots suggests that these channels have similar kinetic structures, since the plots for both channel types have the characteristic saddle shape that is typical of dependency plots for BK channels (Rothberg and Magleby 1998a, Rothberg and Magleby 1999). Within the general saddle shape, there is variability in the dependency plots among the channels, but this variability is within the range typically observed for BK channels (Rothberg and Magleby 1998a, Rothberg and Magleby 1999). This variation is considerably less than might be expected for marked differences in the underlying gating mechanism (Magleby and Song 1992).
The saddle shape in the dependency plots arises from excesses and deficits of specific interval pairs. In particular, plots from both mSlo1 tail channels and mSlo3 tail channels show a deficit of brief open intervals adjacent to brief closed intervals (position 1), an excess of brief open intervals adjacent to long closed intervals (position 2), a deficit of long open intervals adjacent to long closed intervals (position 4), and an excess of long open intervals adjacent to brief closed intervals (position 3).
Such a saddle-shaped dependency plot indicates that for each channel type, there is a general inverse relationship between the durations of open and closed states and compound states. That is, brief open states (or compound states in each comparison) tend to be adjacent to long closed states, and long open states tend to be adjacent to brief closed states. Thus, the data suggest that the effective connections among the various open and closed states (kinetic structure) are similar between mSlo1 tail channels and mslo3 tail channels, consistent with the idea that the difference in bursting kinetics arises from differences in the transition rates among states rather than from differences in the fundamental gating mechanisms.
Replacing the mSlo1 Tail with the mSlo3 Tail Decreases the Single-channel Conductance
In addition to modulating gating properties, replacing the mSlo1 tail with the mSlo3 tail decreased single-channel conductance. Fig. 11 (A and B) presents single-channel currents recorded from a mSlo1 tail channel and a mSlo3 tail channel at a membrane potential of +70 mV at two different time bases. The dashed lines denote the maximum current amplitude observed for each channel. The mSlo1 tail channel had a maximum amplitude of ∼20.9 pA, compared with ∼17.3 pA for the mSlo3 tail channel.
Figure 11.

Replacing the mSlo1 tail with the mSlo3 tail decreases single-channel conductance. (A) Single-channel current recordings from a single mSlo1 tail channel and a single mSlo3 tail channel. The dashed lines indicate the maximum current amplitude observed for each channel type. Membrane potential: +70 mV. Records were low-pass filtered at 5 kHz. (B) Representative bursts from A on a faster time base. (C) Plots of single-channel current amplitude versus membrane potential for the channels shown in A and B. The slope conductances were 285 pS for the mSlo1 tail channel and 243 pS for the mSlo3 tail channel. (D) Histograms of slope conductance measurements from 20 patches containing mSlo1 tail channels and 24 patches containing mSlo3 tail channels. For each plot, the superimposed line represents the fit of a Gaussian function to the histogram, yielding mean slope conductances of 276 ± 4 pS and 238 ± 4 pS for the mSlo1 tail channels and mSlo3 tail channels, respectively.
To estimate the slope conductances of these two channels, we plotted single-channel current amplitude versus membrane potential. As shown in Fig. 11 C, the difference in current amplitude was observed over a wide range of voltages, with no obvious rectification for either channel. The single-channel conductances were ∼285 pS for the mSlo1 tail channel and ∼243 pS for the mSlo3 tail channel.
Estimates of slope conductances from plots such as those shown in Fig. 11 C for 20 patches with mSlo1 tail channels and 24 patches with mSlo3 tail channels are presented as histograms in Fig. 11 D. A clear shift toward lower conductances for mSlo3 tail channels was observed. The superimposed lines are fits of Gaussian functions to the distributions, yielding mean slope conductances of 276 ± 4 pS for the mSlo1 tail channels and 238 ± 4 pS for the mSlo3 tail channels. Thus, replacing the mSlo1 tail with the mSlo3 tail results in a 14% reduction in single-channel conductance (P < 0.001).
Replacing the mSlo1 Tail with the mSlo3 Tail Increases the Sensitivity to Block by Internal TEA
The lower single-channel conductance observed when the mSlo1 tail is replaced with the mSlo3 tail suggests that the mSlo3 tail alters channel structure or charge distributions in a way that reduces the movement of K+ through the pore. TEA, which can reduce single-channel conductance of K+ channels, has been a useful tool for exploring the vestibules of K+ channels (Armstrong and Hille 1972; Yellen et al. 1991; Choi et al. 1991; Taglialatela et al. 1993; Slesinger et al. 1993). Therefore, to gain some insight into the change in structure, we compared sensitivity to block by internal TEA when the mSlo1 tail was replaced by the mSlo3 tail.
Fig. 12 A presents current recordings from an mSlo1 tail channel and an mSlo3 tail channel with internal TEA concentrations (TEAi) of 0, 10 and 50 mM (+70 mV), showing that TEA reduced the single-channel current amplitude for each channel type. The reduction in current is referred to as a fast block, as discrete blocking events are not observed. Fig. 12 (B and C) plots single-channel current amplitude against membrane potential for the mSlo1 tail channel and mSlo3 tail channel shown in Fig. 12 A. For both channel types, TEA reduced single-channel current amplitude at all potentials examined. The block was voltage-dependent, becoming greater at more positive potentials. Comparison of the degree of block at positive potentials between the two plots suggests that the mSlo3 tail channels are more sensitive to block by internal TEA. For example, at +100 mV, 10 mM TEA reduced the amplitude of currents from the mSlo1 tail channel by ∼5% compared with a 20% reduction for the mSlo3 tail channel.
Figure 12.

Replacing the mSlo1 tail with the mSlo3 tail increases sensitivity to block by internal TEA. (A) Single-channel current recordings from patches containing a single mSlo1 tail channel and a single mSlo3 tail channel at the indicated concentrations of internal TEA (TEAi). Membrane potential: +70 mV. Recordings were low-pass filtered at 5 kHz. (B and C) Plots of single-channel current amplitude versus membrane potential at the indicated TEAi for the mSlo1 tail channel (B) and mSlo3 tail channel (C) shown in A. (D) Plot of single-channel current amplitude as a percent maximum current versus TEAi for the channels shown in A–C, but at a membrane potential of +90 mV. The solid lines are fits of a Langmuir function () which yielded K d values (indicated by dotted lines) of 77 mM and 55 mM for the mSlo1 tail channel and mSlo3 tail channel, respectively. K d values at 0 mV were estimated using the Woodhull 1973 equation (). The inset in D plots ln[(gO/gB) − 1] against membrane potential, where gO and gB represent the single-channel conductance in the absence and presence of 100 mM TEA, respectively. Analysis of the y-intercepts yielded K d values of 207 and 137 mM at 0 mV for the mSlo1 tail channel and mSlo3 tail channel, respectively. (E) Mean K d (±SEM) values plotted against membrane potential for mSlo1 tail channels (two experiments) and mSlo3 tail channels (three experiments). The lines are regression fits to show the trend in the data.
To further characterize this apparent difference in TEA sensitivity, we examined dose–response relationships for each channel type. Fig. 12 D plots the current versus TEAi for the two channels shown in Fig. 12 (A–C). The solid lines are fits of a Langmuir function (), which yielded K d values of 77 and 55 mM for the mSlo1 tail channel and mSlo3 tail channel, respectively. The dotted lines in Fig. 12 D show graphically that the K d for each channel type corresponds to the TEAi that reduces single-channel current amplitude to 50% of the control value. K d values were also estimated for data obtained at +30, +50, and +70 mV using the same method, and at 0 mV using the Woodhull 1973 equation (). The inset in Fig. 12 D plots ln[(gO/gB) − 1] against membrane potential, where gO and gB represent the single-channel conductance in the absence and presence of 100 mM TEA, respectively. Analysis of the y-intercepts yielded K d values at 0 mV of 207 and 137 mM for the mSlo1 tail channel and mSlo3 tail channel, respectively. Estimates of K d values are summarized in Fig. 12 E, which plots mean K d versus membrane potential for mSlo1 tail channels (two experiments) and mSlo3 tail channels (three experiments). The K d values for the mSlo3 tail channels were significantly lower than those for the mSlo1 tail channels at each membrane potential examined (P < 0.05). For each channel type, the K d decreased as the potential became more positive, consistent with voltage-dependent block.
The Woodhull 1973 equation can also be used to estimate the fraction of voltage drop at the blocking site measured from the intracellular side of the membrane. Analysis of the slopes in experiments like that shown in the inset to Fig. 12 D suggests that the mean distances of the effective blocking site across the membrane potential from the intracellular surface were 34 ± 2% for mSlo1 tail channels and 30 ± 2% for mslo3 tail channels, indicating no significant difference (P = 0.14).
DISCUSSION
In this study, we have shown that replacing the COOH-terminal tail domain region (S9–S10) of mSlo1 channels with the corresponding tail domain of mSlo3 channels conferred many of the properties of wild-type mSlo3 channels to the chimeric channels comprised of the mSlo1 core domains and mSlo3 tail domains. Compared with channels expressed from mSlo1 cores and mSlo1 tails (mSlo1 tail channels), the channels expressed from mSlo1 cores and mSlo3 tails (mSlo3 tail channels) were much less Ca2+ sensitive, had a higher open probability in the absence of Ca2+, were less voltage-dependent, had briefer mean open times, briefer burst durations, a lower single-channel conductance, and an increased sensitivity to block by internal TEA. These observations suggest that the tail domains (S9-S10) of BK channels modulate the kinetic, conductance, and activation properties of the channel. This modification could involve both direct and indirect actions of the tail domain.
Variability among Channels
One difficulty with single-channel studies, is that there can be considerable variability in the PO and kinetics among channels of the same apparent type under constant experimental conditions. The variability can be divided into two types: (1) variability in the PO and/or kinetics over time for individual channels; and (2) stability in the PO and kinetics over time for individual channels, but differences in the PO and/or kinetics among separate channels of the same apparent type. The first type of variability has been termed wanderlust kinetics (Silberberg et al. 1996), and is controlled for in our study by analyzing those single-channel patches in which stability plots indicated relative stability of the single-channel data over time. The second type of variability, that among channels of the same type, is also often present in single-channel studies. McManus and Magleby 1991 found, for native BK channels in cultured rat skeletal muscle, that there was a wide range of PO among channels under the same experimental conditions. Since the channels were native, it cannot be excluded that the differences in PO arose from different splice variants (Lagrutta et al. 1994). Differences in phosphorylation and the redox state of the channels might also lead to differences in activity among channels (Wang et al. 1999; Tang et al. 2001). Hence, variability in single-channel data can be observed whether the subunits are full-length or whether they are formed from separate cores and tails, as in this study.
The second type of variability, that among channels of the same type, is compensated for in our study by presenting separate plots of data from a number of single-channel patches so that the range of variability among channels is apparent. The mean and the SEM of the kinetic parameters determined from the individual channels are also presented to give the average response. Although the variability in the PO and kinetics among mSlo3 tail channels under constant experimental conditions could be considerable, this variability does not alter the conclusions of our study, because the kinetics of the mSlo1 tail and mSlo3 tail channels are so characteristically different.
The S9–S10 Tail Domain of mSlo1 Is a Major Determinant of Ca2+ Sensitivity
Replacing the mSlo1 tail with the mSlo3 tail converted the channel from a highly sensitive Ca2+- activated channel (Fig. 4 B) to a channel that was only weakly modulated by Ca2+ over a narrow range of PO (Fig. 4 C). These observations are consistent with those of Schreiber et al. 1999, in which coexpression of the mSlo1 core and the mSlo3 tail yielded macroscopic currents that were Ca2+-insensitive. The weak modulation of mSlo3 tail channels observed in our experiments with single-channel recording might be more difficult to detect in macroscopic currents.
Schreiber and Salkoff 1997 have suggested that BK channels contain two separable Ca2+ binding sites: a primary site, termed the calcium bowl located in the tail domain between S9 and S10, and a secondary site. The suggestion of a secondary site is based on their observations that mutations of the Ca2+ bowl alter Ca2+ sensitivity but not Cd2+ sensitivity. The secondary site is sensitive to both Ca2+ and Cd2+, whereas the calcium bowl is sensitive only to Ca2+. Consistent with these observations, preliminary experiments indicate that mSlo3 tail channels can be modulated by Cd2+ i unpublished data), suggesting that channels without a functional calcium bowl can still be activated by Cd2+ i. Oberhauser et al. 1988 previously have shown that Cd2+ i can modulate the activity of Ca2+ i on BK channels, suggesting a divalent binding site in addition to the Ca2+ binding site. Alternatively, the secondary site may be located in the core domain. Studies using site-directed mutagenesis (Krause et al. 1996; Braun and Sy 2001) as well as comparisons of Ca2+ sensitivity between BK channel splice variants (Lagrutta et al. 1994; Rosenblatt et al. 1997; Hanaoka et al. 1999) have suggested that the core domain may also contribute to Ca2+ sensitivity. Additional support for a secondary site are the observations of Solaro et al. 1995 that cytoplasmic Mg2+ modulates Ca2+-dependent activation of mSlo1 by binding to a low affinity site on the channel core, and the observations of Shi and Cui 2001 that Mg2+ can increase BK channel activity under experimental conditions (1 mM Ca2+ i), where the primary Ca2+ binding sites would be saturated with Ca2+ (Rothberg and Magleby 1999). In the absence of Mg2+, the separate Mg2+ site may act as a secondary Ca2+ binding site. Our observations that Ca2+ can modulate the channel (albeit weakly) when the calcium bowl is removed (by substituting the mSlo3 tail for the mSlo1 tail) can be explained by the presence of a secondary Ca2+ binding site on the core domain of the channel.
However, it cannot be excluded that some of the residual effects of Ca2+ and Cd2+ observed with mSlo3 tail channels may arise from the region of the mSlo3 tail replacing the calcium bowl, as this region still contains two negative charges (compared with the eight negative charges in the calcium bowl) that would be available to coordinate divalent cation binding, with negative charges located elsewhere in the channel. However, this possibility seems unlikely since wild-type mSlo3 channels show little Ca2+ sensitivity (Schreiber et al. 1998).
Replacing the mSlo1 tail with the mSlo3 tail reduced the Hill coefficient from ∼3.2 to <40% of this value, and limited the Ca2+-dependent change in PO to a small fraction of the range of Po accessible by varying voltage. A reduced Hill coefficient could arise from a decreased number of Ca2+ binding sites or from a decreased efficacy of action of Ca2+. Since BK channels are tetramers (Shen et al. 1994), there would be a Ca2+ binding site associated with the calcium bowl on the tail of each of the four α subunits of mSlo1, for a total of four primary sites, plus perhaps four additional secondary binding sites. The simplest explanation for the reduced Hill coefficient of the mSlo3 tail channels is that the number of effective Ca2+ binding sites is reduced due to the absence of calcium bowls in the mSlo3 tails, and that the remaining Ca2+ binding sites are less effective in activating the channel.
In addition to decreasing the Hill coefficient, replacing the mSlo1 tail with the mSlo3 tail increased the PO in 0 μM Ca2+ i (+30 mV) from ∼0.0005 for mSlo1 tail channels to, on average, ∼0.15 for mSlo3 tail channels. Although the average PO of mSlo3 tail channels was orders of magnitude greater than for mSlo1 tail channels under these experimental conditions, there was a wide range in the PO among mSlo3 tail channels under these conditions, ranging from 0.0001 to 0.34. Although a number of factors could lead to differences in PO among channels (as discussed on p. 727), an additional explanation for this variability among mSlo3 tail channels is that different numbers of mSlo3 tails may have been associated with the cores. Although excess cRNA for the mSlo3 tails, when compared with that for the core, was injected into the oocytes to reduce this possibility (materials and methods), it cannot be excluded that different numbers of mSlo3 tails may have associated with some of the mSlo3 tail channels. Since functional channels cannot form from cores alone (Wei et al. 1994; Meera et al. 1997), then all of the channels we studied must have had one or more tails. Whether functional mSlo3 tail channels formed with fewer than four tails in our experiments is not known, but if so, then this uncertainty would appear to have little effect on our conclusions, as the mSlo3 tail channels that we studied were characteristically different from the mSlo1 tail channels, and the kinetic data from the different mSlo3 tail channels appeared consistent when normalized to PO (Fig. 8).
Our observations that the activity of mSlo3 can be considerable in 0 μM Ca2+ i at voltages (+30 mV) where the activity of mSlo1 tail channels is very low, is consistent with the results of Schreiber et al. 1999, who found that macroscopic currents from oocytes expressing mSlo3 tail channels were readily activated over a range of voltages in 0 μM Ca2+ that would have little effect on mSlo1 tail channels. Schreiber et al. 1999 have proposed that the tail domain of the BK channel interacts with the core domain in a manner that inhibits channel opening, and that Ca2+ activates BK channels by relieving this inhibition. In terms of their hypothesis, the higher residual activity with 0 μM Ca2+ i for mSlo3 tail channels compared with mSlo1 tail channels, would reflect the weaker inhibition (due to evolutionary divergence) of mSlo3 tails on the mSlo1 core compared with that of mSlo1 tails. However, our additional observation that three of the seven mSlo3 tail channels examined had little activity under experimental conditions where mSlo1 channels would be active, are inconsistent with the inhibition hypothesis, unless there is some additional unknown factor for these particular mSlo3 channels that inhibited their activity.
Replacing the Tail of mSlo1 with the Tail of mSlo3 Reduces the Voltage Sensitivity
The decreased voltage dependence of mSlo3 tail channels was indicated by a ∼28% reduction in the estimates of the effective gating charge determined from Boltzmann fits. However, mSlo1 tail channels and mSlo3 tail channels have an identical S4 transmembrane segment, which is thought to be the primary voltage sensor (Diaz et al. 1998). Recently, it has been suggested that a change in membrane potential causes a rotation of the S4 segment, such that the positively charged residues are exposed to an internal aqueous crevice at hyperpolarized potentials and to an external aqueous crevice at depolarized potentials (Bezanilla 2000; http://pb010.anes.ucla.edu). Thus, one possible explanation for our results is that the S4 segment of mSlo3 tail channels rotates through a smaller angle, or that the position of the crevices have changed, so that the effective transfer of charge across the electric field of the membrane with the rotation of S4 is less for mSlo3 tail channels compared with mSlo1 tail channels. This could arise from either a direct or indirect (allosteric) interaction between the tail domain and the core domain. Other intracellular parts of the channel can also influence voltage sensitivity. Mutations in the S4-S5 linker can reduce voltage sensitivity (Cui and Aldrich 2000), and comparisons of voltage dependence between BK channel splice variants suggest that regions of the core domain of the channel located intracellularly influence voltage sensitivity (Rosenblatt et al. 1997; for review see Yellen 1998). Thus, the tail domain, which is located intracellularly, may act by direct interactions with intracellular parts of the core.
Replacing the Tail of mSlo1 with the Tail of mSlo3 Transfers the Bursting Properties of mSlo3
Replacing the mSlo1 tail with the mSlo3 tail resulted in a pronounced change in bursting kinetics, including decreases in mean burst duration, mean open time, mean number of openings per burst, and the mean duration of gaps between bursts (Fig. 8). These are the changes that would be expected, based on the differences in properties between wild-type mSlo1 and wild-type mSlo3 (Fig. 2 and Fig. 3), provided that the tail of Slo channels contributes to the bursting kinetics. Our observations together with previous observations (Lagrutta et al. 1994; Wei et al. 1994) suggest that the kinetic properties of gating are determined by both the core and the tail.
Two lines of evidence suggest that the transfer of bursting kinetics with the transfer of the tail does not arise from fundamental changes in the gating kinetics, but rather more subtle changes in the transitions rates among the states involved in the gating. First, we found no significant difference in the number of detected open or closed states after replacement of the mSlo1 tail with the mSlo3 tail (Fig. 9). Second, whereas the relative magnitudes of the various components of the dependency plots could be quite different for the two channel types, the characteristic saddle shape of the dependency plots (Rothberg and Magleby 1998a), which reflects the effective connections among states, was still present after replacing the mSlo1 tail with the mSlo3 tail (Fig. 10). If the transfer of the tail resulted in effectively establishing new transitions pathways or new states, then such changes might be expected to change the basic shape of the dependency plots (Magleby and Song 1992).
The transfer of bursting kinetics by replacing the mSlo1 tail with the mSlo3 tail could arise because the tail directly contributes to the gating machinery, or alternatively, because the tail serves to modulate the gating machinery in the core of the channel. The proposal of Schreiber et al. 1999 that the tail of the channel represents an evolutionary recent addition of a Ca2+-dependent domain to an ancestral voltage-sensitive potassium channel, would suggest that the tail acts by modulating the gating machinery in the core. Further support for a modulatory function comes from our observations (unpublished data) that in some of the patches that were rejected from analysis because they displayed wanderlust kinetics, mSlo3 tail channels could occasionally gate in a mode with kinetics that appeared similar to the normal mode activity observed in mSlo1 tail channels and wild-type mSlo1 channels, and that mSlo1 tail channels and wild-type mSlo1 channels could occasionally gate in a mode with kinetics that appeared similar to the dominant type of activity observed in mSlo3 tail channels and wild-type mSlo3 channels. Although the kinetics were too variable in these discarded experiments to perform in depth analysis, these observations suggest that some channels can gate in both mSlo1 type and mSlo3 type modes, independent of the type of tail, and for mSlo1, independent of whether the channel was expressed from a full-length clone or from separate cores and tails. On this basis, the apparent transfer of the gating kinetics with the tail may arise, not because the gating kinetics are intrinsic to the tail, but because the tail selects for and stabilizes one of the modes of gating activity intrinsic to the core. Although this conclusion is speculative for mSlo1 channels, Wang et al. 2000 have shown for nicotinic receptor channels that the ɛ subunit stabilizes the gating kinetics of the channel, limiting the number of kinetic modes that are available for gating.
For mSlol channels, replacing the incorrect mSlo3 tail with the correct mSlo1 tail increases mean burst duration, the mean number of openings per burst, the mean open time, and the mean gap duration for data compared at the same PO over a wide range of PO (Fig. 8). Interestingly, the addition of the auxiliary β1 subunit to mSlo1 channels increases all these parameters even further (compare Fig. 8 with Fig. 6 in Nimigean and Magleby 1999). Such a progressive shift in the bursting parameters, first by restoring the correct tail and then by adding the β1 subunit, suggests that the fundamental energy barriers (transition rates) that are changed by replacing the mSlo3 tail with the mSlo1 tail may be changed even further by the addition of the β1 subunit. A discussion of possible mechanisms underlying such changes in bursting kinetics is presented in Nimigean and Magleby 1999, Nimigean and Magleby 2000, and the background for the β1 subunit may be found in McManus et al. 1995.
Why Doesn't the Elimination of the Calcium Bowl Decrease the Number of States Detected during Gating?
Since Ca2+ activates BK channels, it would be expected that the binding of each additional Ca2+ to the channel would further change its properties, creating an additional state. If the calcium bowl contributes a major Ca2+ binding site to each of the four tails, as proposed (Wei et al. 1994; Schreiber and Salkoff 1997, Schreiber et al. 1999), then eliminating the four Ca2+ bowls might be expected to reduce the numbers of kinetic states entered during gating. Yet, we found no reduction in the numbers of detected kinetic states during gating when the mSlo1 tails with active calcium bowls were replaced with mSlo3 tails with absent calcium bowls (Fig. 9). How is this possible?
This question can be addressed in terms of kinetic models that describe the gating of BK channels. In these discrete state Markov models, the voltage sensor in each of the four subunits of the channel can enter two conformations, and each subunit can bind a Ca2+, leading to two-tiered 50-state allosteric models for the gating (Rothberg and Magleby 1999, Rothberg and Magleby 2000; Cui and Aldrich 2000; and implicated in other studies Horrigan et al. 1999; Nimigean and Magleby 2000; Talukder and Aldrich 2000). The 50-state models have 25 closed states on the upper tier and 25 open states on the lower tier. With 0 Ca2+ i or with all the Ca2+ binding sites removed, the gating in these 50-state models would be confined to the five closed and five open states without any bound Ca2+. Hence, the prediction of the 50-state model is that the numbers of states detected during gating of wild-type mSlo1 channels in 0 Ca2+ i should be the same as the numbers of states detected during gating of modified BK channels in which all the Ca2+ binding sites have been removed, and should not exceed five open and five closed states in either case, or six open and six closed states if conformational changes in diagonal and adjacent subunits yield channels with different properties.
For a first approximation, this is found to be the case. For analysis of 1-D distributions with >500 intervals, wild-type mSlo1 channels gated among two to three detected open and three to five detected closed states in 0 Ca2+ i (Fig. 7, open symbols, in Nimigean and Magleby 2000; and Fig. 4 in Talukder and Aldrich 2000), and mSlo3 tail channels without calcium bowls gated among two to three detected open and three to seven detected closed states for data collected over a range of Ca2+ i (Fig. 9). The data for the mSlo1 channels in 0 Ca2+ i is consistent with the predictions of the 50-state model, as the effective numbers of states detected or entered can be less than the total number available. The detection of six closed states in a few datasets and seven closed states in one dataset for mSlo3 tail channels is greater than the maximum of five closed states typically observed and predicted by the 50-state models for channels without any Ca2+ binding sites.
This greater than predicted number of closed states could arise for channels with absent calcium bowls for several reasons: first, mSlo3 tail channels do display a weak Ca2+ dependence, so they retain some secondary Ca2+ binding sites that could contribute additional states; and, second, the 50-state models are too simple and, thus, under predict the numbers of states the channel can gate in. Some observations suggest that the 50-state models may need an additional tier of flicker closed states (Rothberg and Magleby 1999, Rothberg and Magleby 2000). If this is the case, then the channel could gate in up to 15 states without any bound Ca2+ i. Thus, our observations of mSlo3 tail channels typically gating in at least 3–4 open and 5–7 closed states does not exclude that the calcium bowl is a major Ca2+ binding site. In fact, gating in multiple open and closed states without a calcium bowl is just what is predicted by models for the gating of BK channels. It should also be noted that our observation of multiple open and closed states in the absence of calcium binding sites rejects simple models for gating, such as the MWC model (Monod et al. 1965), which predicts one open and one closed state under such conditions (Nimigean and Magleby 2000; Talukder and Aldrich 2000)
An apparent paradox concerning the 50-state models is not the numbers of states observed in the absence of the calcium bowl, but why so few of the potential 50 (or more) states are detected in the presence of Ca2+ i for channels with functional calcium bowls. The maximum numbers of detected states for BK channels are typically three to four open and five to seven closed states (Fig. 9, mSlo1 tail channels; McManus and Magleby 1988). An explanation is that each dwell-time distribution used to estimate the numbers of kinetic states must be obtained under a single set of experimental conditions (one voltage and one Ca2+ i) to maintain the stability of the gating. Consequently, the effective number of states entered during data collection for any dwell-time distribution is limited because the fixed experimental conditions limit the effective sojourns to only a subset of the total states (Rothberg and Magleby 1999, Rothberg and Magleby 2000). Furthermore, analysis with 50-state models shows that even for the subset of states that are entered for fixed experimental conditions, many of the exponential components generated by these states have overlapping time constants and small areas, so that only a small fraction of the total number of potential exponential components would be detected. Consequently, dwell-time distributions predicted by the 50-state models are consistent with the limited numbers of exponential components observed in the experimental data (Magleby and Rothberg 2001).
Replacing the Tail of mSlo1 with the Tail of mSlo3 Decreases Single-channel Conductance and Facilitates the Fast Block by Internal TEA
Two observations in our study suggests that the tail domain of BK channels influences the structure of the conducting pore of the channel. Replacing the mSlo1 tail with the mSlo3 tail both reduced the single-channel conductance 14% (Fig. 11), and also facilitated the fast block of the channel by internal TEA, decreasing the apparent K d for TEA binding by ∼30% without changing the apparent electrical distance into the field at which the binding occurs (Fig. 12).
The tail domain of the channel could alter the conducting pore directly if it contributes to the intracellular part of the pore, or it could alter the access to the pore. Perhaps the tail domain is involved in forming structures at the inner part of the pore in a manner similar to the cytoplasmic β subunit-T1 assembly in voltage-dependent K+ channels (Gulbis et al. 2000). Alternatively, the tail domain of the channel could alter the conducting pore indirectly through allosteric interactions with the core domain of the channel, which by analogy to other K+ channels (Doyle et al. 1998) includes the selectivity filter and inner and outer vestibules of the pore. If the tail domain alters the apparent K d for TEA binding by altering the structure at the TEA binding site, then an allosteric interaction of the tail with the core would most likely be required, as the intracellular accessed TEA binding site is located deep within the pore (Yellen et al. 1991; Doyle et al. 1998). Alterations in the apparent K d may not require direct changes at the TEA binding site. In the Shaker K+ channel, mutation in the S4–S5 loop can alter the K d for block by internal TEA (Slesinger et al. 1993).
It is also possible that the differences in conductance and TEA block when the mSlo3 tail replaces the mSlo1 tail may be associated with differences in the gating. Perhaps the movement of the gate is restricted for mSlo3 tail channels so that the channels do not open fully, but open to a subconductance level with a conductance 14% less than the fully open mSlo1 tail channels. For Drk1 channels, openings to subconductance levels may arise from partially activated channels in which some, but not all, subunits have undergone the conformational changes required for wild-type channel opening (Chapman et al. 1997). Perhaps a similar partial activation occurs in mSlo3 tail channels.
Modular Construction of BK Channels
Long before it was known that the structure of the core domain of BK channels is similar to the structure of the superfamily of voltage-dependent K+ channels (introduction), Hille 1984 pointed out that even with a fixed level of Ca2+ i, BK channels show an intrinsic voltage sensitivity and behave somewhat like what would be expected for delayed rectifier K+ channels. The opening rate of BK channels increases with depolarization, and the closing rate decreases, just the properties postulated in the Hodgkin-Huxley model to explain the voltage dependence of the potassium conductance. Hille's association of BK channels with delayed rectifiers was insightful. Although Ca2+ i is strictly required for BK channels to have functional activity under physiological conditions where the channels are readily activated by micromolar Ca2+ i and modulated by voltage, large negative voltages can reduce channel activity to negligible levels in the presence of Ca2+ i and large positive voltages can fully activate the channels in the absence of Ca2+ i, suggesting an underlying voltage activated channel that is modulated by Ca2+ i (Meera et al. 1996; Cui et al. 1997; Stefani et al. 1997; Diaz et al. 1998; Rothberg and Magleby 2000; Cui and Aldrich 2000).
Consistent with this idea, Schreiber et al. 1999 have suggested that BK channels may have evolved from an ancestral voltage-sensitive channel represented by the core domain, with the tail representing the more recent addition of a calcium-dependent modulatory domain. Our observations that removing the major Ca2+ i binding sites of the channel by replacing the mSlo1 tail with the mSlo3 tail had little effect on the numbers of states detected during gating, while greatly decreasing the Ca2+ sensitivity, open times, burst duration, single-channel conductance, voltage dependence, and increasing sensitivity to block by TEAi, support the concept of a modular construction of the BK channel, in which a core domain with ancestry to a voltage-dependent channel is modulated by a tail domain. Further support for the modular construction of the Slo family of channels is the observation that the mSlo1 core and mSlo1 tail domains expressed separately assemble to form channels indistinguishable from the wild-type channel (Wei et al. 1994; Meera et al. 1997), and that Slo2, another member of the Slo family of K+ channels, which is regulated by both Ca2+ and Cl−, has replaced the net positive charge of the calcium bowl region with net negative charge to form a chloride bowl (Yuan et al. 2000).
Acknowledgments
We thank Dr. Lawrence Salkoff and Dr. Matthew Schreiber for providing the cDNAs encoding wild-type mSlo1, wild-type mSlo3, the mSlo1 core, the mSlo1 tail, and the mSlo3 tail. We thank Xiang Qian for contributing some experiments for the paper.
This work was supported in part by National Institutes of Health grant AR32805 and a grant from the Muscular Dystrophy Association to K.L. Magleby.
Footnotes
The present address of Dr. Moss is Department of Biological Sciences, Purdue University, West Lafayette, IN 47907.
Abbreviations used in this paper: 2-D, two dimensional; BK channel, large-conductance Ca2+-activated K+ channel; MWC, Monod-Wyman-Changeux; PO, open probability.
References
- Adelman J.P., Shen K.Z., Kavanaugh M.P., Warren R.A., Wu Y.N., Lagrutta A., Bond C.T., North R.A. Calcium-activated potassium channels expressed from cloned complementary DNAs. Neuron. 1992;9:209–216. doi: 10.1016/0896-6273(92)90160-f. [DOI] [PubMed] [Google Scholar]
- Atkinson N.S., Robertson G.A., Ganetzky B. A component of calcium-activated potassium channels encoded by the Drosophila slo locus. Science. 1991;253:551–555. doi: 10.1126/science.1857984. [DOI] [PubMed] [Google Scholar]
- Armstrong C.M., Hille B. The inner quaternary ammonium ion receptor in potassium channels of the node of Ranvier. J. Gen. Physiol. 1972;59:388–400. doi: 10.1085/jgp.59.4.388. [DOI] [PMC free article] [PubMed] [Google Scholar]
- Bezanilla F. The voltage sensor in voltage-dependent ion channels. Physiol. Rev. 2000;80:R555–R592. doi: 10.1152/physrev.2000.80.2.555. [DOI] [PubMed] [Google Scholar]
- Bian S., Favre I., Moczydlowski E. Ca2+-binding activity of a COOH-terminal fragment of the Drosophila BK channel involved in Ca2+-dependent activation. Proc. Natl. Acad Sci. USA. 2001;98:4776–4781. doi: 10.1073/pnas.081072398. [DOI] [PMC free article] [PubMed] [Google Scholar]
- Blatz A.L., Magleby K.L. Ion conductance and selectivity of single calcium-activated potassium channels in cultured rat muscle. J. Gen. Physiol. 1984;84:1–23. doi: 10.1085/jgp.84.1.1. [DOI] [PMC free article] [PubMed] [Google Scholar]
- Braun A.F., Sy L. Contribution of potential EF hand motifs to the calcium-dependent gating of a mouse brain large conductance, calcium-sensitive K+ channel. J. Physiol. 2001;533:681–695. doi: 10.1111/j.1469-7793.2001.00681.x. [DOI] [PMC free article] [PubMed] [Google Scholar]
- Butler A., Tsunoda S., McCobb D.P., Wei A., Salkoff L. mSlo, a complex mouse gene encoding “maxi” calcium-activated potassium channels. Science. 1993;261:221–224. doi: 10.1126/science.7687074. [DOI] [PubMed] [Google Scholar]
- Chapman M.L., VanDongen H.M., VanDongen A.M. Activation-dependent subconductance levels in the drk1 K channel suggest a subunit basis for ion permeation and gating. Biophys. J. 1997;72:708–719. doi: 10.1016/s0006-3495(97)78707-1. [DOI] [PMC free article] [PubMed] [Google Scholar]
- Choi K.L., Aldrich R.W., Yellen G. Tetraethylammonium blockade distinguishes two inactivation mechanisms in voltage-activated K+ channels. Proc. Natl. Acad. Sci. USA. 1991;88:5092–5095. doi: 10.1073/pnas.88.12.5092. [DOI] [PMC free article] [PubMed] [Google Scholar]
- Colquhoun D., Hawkes A.G. The principles of the stochastic interpretation of ion-channel mechanisms. In: Sakmann B., Neher E., editors. Single-Channel Recording. Plenum Press; New York: 1995. pp. 397–482. [Google Scholar]
- Colquhoun D., Sigworth F.J. Fitting and statistical analysis of single-channel records. In: Sakmann B., Neher E., editors. Single-Channel Recording. Plenum Press; New York: 1995. pp. 483–587. [Google Scholar]
- Conley, E.C. 1996. The Ion Channel Facts Book II. Academic Press, San Diego, CA. 778 pp.
- Coronado R., Miller C. Conduction and block by organic cations in a K+-selective channel from sarcoplasmic reticulum incorporated into planar phospholipid bilayers. J. Gen. Physiol. 1982;79:529–547. doi: 10.1085/jgp.79.4.529. [DOI] [PMC free article] [PubMed] [Google Scholar]
- Cui J., Aldrich R.W. Allosteric linkage between voltage and Ca2+-dependent activation of BK-type mslo1 K+ channels. Biochemistry. 2000;39:15612–15619. doi: 10.1021/bi001509+. [DOI] [PubMed] [Google Scholar]
- Cui J., Cox D.H., Aldrich R.W. Intrinsic voltage dependence and Ca2+ regulation of mslo large conductance Ca-activated K+ channels. J. Gen. Physiol. 1997;109:647–673. doi: 10.1085/jgp.109.5.647. [DOI] [PMC free article] [PubMed] [Google Scholar]
- Dahl G. The oocyte cell-cell channel assay for functional analysis of gap junction proteins. In: Stevenson B., Paul D., Gallin W., editors. Cell-Cell InteractionsA Practical Approach. Oxford University Press; London/New York: 1992. pp. 143–165. [Google Scholar]
- Diaz L., Meera P.J., Amigo E., Stefani E., Alvarez O., Toro L., Latorre R. Role of the S4 segment in a voltage-dependent calcium-sensitive potassium (hSlo) channel. J. Biol. Chem. 1998;273:32430–32436. doi: 10.1074/jbc.273.49.32430. [DOI] [PubMed] [Google Scholar]
- Doyle D.A., Morais Cabral J., Pfuetzner R.A., Kuo A., Gulbis J.M., Cohen S.L., Chait B.T., MacKinnon R. The structure of the potassium channelmolecular basis of K+ conduction and selectivity. Science. 1998;280:69–77. doi: 10.1126/science.280.5360.69. [DOI] [PubMed] [Google Scholar]
- Dworetzky S.I., Trojnacki J.T., Gribkoff V.K. Cloning and expression of a human large-conductance calcium-activated potassium channel. Brain Res. Mol. Brain Res. 1994;27:189–193. doi: 10.1016/0169-328x(94)90203-8. [DOI] [PubMed] [Google Scholar]
- Fredkin, D.R., M. Montal, and J.A. Rice. 1985. Identification of aggregated Markovian models: application to the nicotinic acetylcholine receptor. Proc. Berkeley Conf. in Honor of Jerzy Neyman and Jack Kiefer. 269–289.
- Golowasch J., Kirkwood A., Miller C. Allosteric effects of Mg2+ on the gating of Ca2+-activated K+ channels from mammalian skeletal muscle. J. Exp. Biol. 1986;124:5–13. doi: 10.1242/jeb.124.1.5. [DOI] [PubMed] [Google Scholar]
- Gulbis J.M., Zhou M., Mann S., MacKinnon R. Structure of the cytoplasmic β subunit-T1 assembly of voltage-dependent K+ channels. Science. 2000;289:123–127. doi: 10.1126/science.289.5476.123. [DOI] [PubMed] [Google Scholar]
- Hamill O.P., Marty A., Neher E., Sakmann B., Sigworth F.J. Improved patch clamp techniques for high-resolution current recording from cells and cell-free membrane patches. Pflügers Archiv. 1981;391:85–100. doi: 10.1007/BF00656997. [DOI] [PubMed] [Google Scholar]
- Hanaoka K., Wright J.M., Cheglakov I.B., Morita T., Guggino W.B. A 59 amino acid insertion increases Ca2+ sensitivity of rbslo1, a Ca2+-activated K+ channel in renal epithelia. J. Membr. Biol. 1999;172:193–201. doi: 10.1007/s002329900596. [DOI] [PubMed] [Google Scholar]
- Hille B. Ionic Channels of Excitable Membranes 1984. Sinauer Associates, Inc; Sunderland, MA: pp. 426 pp [Google Scholar]
- Horrigan F.T., Cui J., Aldrich R.W. Allosteric voltage gating of potassium channels I. mSlo ionic currents in the absence of Ca2+ . J. Gen. Physiol. 1999;114:277–304. doi: 10.1085/jgp.114.2.277. [DOI] [PMC free article] [PubMed] [Google Scholar]
- Hudspeth A.J., Lewis R.S. Kinetic analysis of voltage- and ion-dependent conductances in saccular hair cells of the bull-frog, Rana catesbeiana. J. Physiol. 1988;400:237–274. doi: 10.1113/jphysiol.1988.sp017119. [DOI] [PMC free article] [PubMed] [Google Scholar]
- Jiang G.J., Zidanic M., Michaels R.L., Michael T.H., Griguer C., Fuchs P.A. Cslo encodes calcium-activated potassium channels in the chick's cochlea. Proc. R. Soc. Lond. B. Biol. Sci. 1997;264:731–737. doi: 10.1098/rspb.1997.0104. [DOI] [PMC free article] [PubMed] [Google Scholar]
- Kaczorowski G.J., Knaus H.G., Leonard R.J., McManus O.B., Garcia M.L. High-conductance calcium-activated potassium channelsstructure, pharmacology, and function. J. Bioenerg. Biomembr. 1996;28:255–267. doi: 10.1007/BF02110699. [DOI] [PubMed] [Google Scholar]
- Keller B.U., Montal M.S., Hortshorne R.P., Montal M. Two-dimensional probability density analysis of single channel currents from reconstituted acetylcholine receptors and sodium channels. Arch. Biochem. Biophys. 1990;276:47–54. doi: 10.1016/0003-9861(90)90008-m. [DOI] [PubMed] [Google Scholar]
- Krause J.D., Foster C.D., Reinhart P.H. Xenopus laevis oocytes contain endogenous large conductance Ca2+-activated K+ channels. Neuropharmacology. 1996;35:1017–1022. doi: 10.1016/0028-3908(96)00134-7. [DOI] [PubMed] [Google Scholar]
- Lagrutta A., Shen K.R.A., North R.A., Adelman J.P. Functional differences among alternatively spliced variants of slowpoke, a Drosophila calcium-activated potassium channel. J. Biol. Chem. 1994;269:20347–20351. [PubMed] [Google Scholar]
- Latorre R. Molecular workings of large conductance (maxi) Ca2+-activated K+ channels. In: Peracchia C., editor. Handbook of Membrane ChannelsMolecular and Cellular Physiology. Academic Press; New York: 1994. pp. 79–102. [Google Scholar]
- Magleby K.L., Pallotta B.S. Calcium dependence of open and shut interval distributions from calcium-activated potassium channels in cultured rat muscle J. Physiol. 344 1983. 585 604a [DOI] [PMC free article] [PubMed] [Google Scholar]
- Magleby K.L., Pallotta B.S. Burst kinetics of single calcium-activated potassium channels in cultured rat muscle J. Physiol. 344 1983. 605 623b [DOI] [PMC free article] [PubMed] [Google Scholar]
- Magleby K.L., Song L. Dependency plots suggest the kinetic structure of ion channels. Proc. R. Soc. Lond. B. Biol. Sci. 1992;249:133–142. doi: 10.1098/rspb.1992.0095. [DOI] [PubMed] [Google Scholar]
- Magleby K.L., Rothberg B.S. Cooperative allosteric gating for voltage and Ca2+-activation of large conductance Ca2+-activated K+ (BK) channels Biophys. J. 80 2001. 222A(Abstr.) [Google Scholar]
- McCobb D.P., Fowler N.L., Featherstone T., Lingle C.J., Saito M., Krause J.E., Salkoff L. A human calcium-activated potassium channel gene expressed in vascular smooth muscle. Am. J. Physiol. 1995;269:H767–H777. doi: 10.1152/ajpheart.1995.269.3.H767. [DOI] [PubMed] [Google Scholar]
- McManus O.B. Calcium-activated potassium channelsregulation by calcium. J. Bioenerg. Biomembr. 1991;23:537–560. doi: 10.1007/BF00785810. [DOI] [PubMed] [Google Scholar]
- McManus O.B., Magleby K.L. Kinetic states and modes of single large-conductance calcium-activated potassium channels in cultured rat skeletal muscle. J. Physiol. 1988;402:79–120. doi: 10.1113/jphysiol.1988.sp017195. [DOI] [PMC free article] [PubMed] [Google Scholar]
- McManus O.B., Magleby K.L. Accounting for the Ca2+-dependent kinetics of single large-conductance Ca2+-activated K+ channels in rat skeletal muscle. J. Physiol. 1991;443:739–777. doi: 10.1113/jphysiol.1991.sp018861. [DOI] [PMC free article] [PubMed] [Google Scholar]
- McManus O.B., Helms L.M., Pallanck L., Ganetzky B., Swanson R., Leonard R.J. Functional role of the β subunit of high conductance calcium-activated potassium channels. Neuron. 1995;14:645–650. doi: 10.1016/0896-6273(95)90321-6. [DOI] [PubMed] [Google Scholar]
- Meera P., Wallner M., Jiang Z., Toro L. A calcium switch for the functional coupling between α (hslo) and β subunits (KV,Ca β) of maxi K channels. FEBS Lett. 1996;382:84–88. doi: 10.1016/0014-5793(96)00151-2. [DOI] [PubMed] [Google Scholar]
- Meera P., Wallner M., Song M., Toro L. Large conductance voltage- and calcium-dependent K+ channel, a distinct member of voltage-dependent ion channels with seven N-terminal transmembrane segments (S0-S6), an extracellular N terminus, and an intracellular (S9-S10) C terminus. Proc. Natl. Acad. Sci. USA. 1997;94:14066–14071. doi: 10.1073/pnas.94.25.14066. [DOI] [PMC free article] [PubMed] [Google Scholar]
- Monod J., Wyman J., Changeux J.-P. On the nature of allosteric transitionsa plausible model. J. Mol. Biol. 1965;12:88–118. doi: 10.1016/s0022-2836(65)80285-6. [DOI] [PubMed] [Google Scholar]
- Moss B.L., Magleby K.L. BK channel carboxyl terminal tail domain can modulate gating properties and conductance Biophys. J. 78 2000. 92A(Abstr [Google Scholar]
- Moss B.L., Silberberg S.D., Nimigean C.M., Magleby K.L. Ca2+-dependent gating mechanisms for dSlo, a large-conductance Ca2+-activated K+ (BK) channel. Biophys. J. 1999;76:3099–3117. doi: 10.1016/S0006-3495(99)77462-X. [DOI] [PMC free article] [PubMed] [Google Scholar]
- Nelson M.T., Cheng H., Rubart M., Santana L.F., Bonev A.D., Knot H.J., Lederer W.J. Relaxation of arterial smooth muscle by calcium sparks. Science. 1995;270:633–637. doi: 10.1126/science.270.5236.633. [DOI] [PubMed] [Google Scholar]
- Nimigean C.M., Magleby K.L. The β subunit increases the Ca2+ sensitivity of large conductance Ca2+-activated potassium channels by retaining the gating in the bursting states. J. Gen. Physiol. 1999;113:425–439. doi: 10.1085/jgp.113.3.425. [DOI] [PMC free article] [PubMed] [Google Scholar]
- Nimigean C.M., Magleby K.L. Functional coupling of the β1 subunit to the large conductance Ca2+-activated K+ channel in the absence of Ca2+increased Ca2+ sensitivity from a Ca2+-independent mechanism. J. Gen. Physiol. 2000;115:719–734. doi: 10.1085/jgp.115.6.719. [DOI] [PMC free article] [PubMed] [Google Scholar]
- Oberhauser A., Alvarez O., Latorre R. Activation by divalent cations of a Ca2+-activated K+ channel from skeletal muscle membrane. J. Gen. Physiol. 1988;92:67–86. doi: 10.1085/jgp.92.1.67. [DOI] [PMC free article] [PubMed] [Google Scholar]
- Pallanck L., Ganetzky B. Cloning and characterization of human and mouse homologs of the Drosophila calcium-activated potassium channel gene, slowpoke . Hum. Mol. Genet. 1994;3:1239–1243. doi: 10.1093/hmg/3.8.1239. [DOI] [PubMed] [Google Scholar]
- Petersen O.H., Maruyama Y. Calcium-activated potassium channels and their role in secretion. Nature. 1984;307:693–696. doi: 10.1038/307693a0. [DOI] [PubMed] [Google Scholar]
- Robitaille R., Garcia M.L., Kaczorowski G.J., Charlton M.P. Functional colocalization of calcium and calcium-gated potassium channels in control of transmitter release. Neuron. 1993;11:645–655. doi: 10.1016/0896-6273(93)90076-4. [DOI] [PubMed] [Google Scholar]
- Rosenblatt K.P., Sun Z.P., Heller S., Hudspeth A.J. Distribution of Ca2+-activated K+ channel isoforms along the tonotopic gradient of the chicken's cochlea. Neuron. 1997;19:1061–1075. doi: 10.1016/s0896-6273(00)80397-9. [DOI] [PubMed] [Google Scholar]
- Rothberg B.S., Magleby K.L. Kinetic structure of large-conductance Ca2+-activated K+ channels suggests that the gating includes transitions through intermediate or secondary statesA mechanism for flickers J. Gen. Physiol. 111 1998. 751 780a [DOI] [PMC free article] [PubMed] [Google Scholar]
- Rothberg B.S., Magleby K.L. Investigating single-channel gating mechanisms through analysis of two-dimensional distributions Methods Enzymol. 293 1998. 437 456b [DOI] [PubMed] [Google Scholar]
- Rothberg B.S., Magleby K.L. Gating kinetics of single-large-conductance Ca2+-activated K+ channels in high Ca2+ suggest a two-tiered allosteric gating mechanism. J. Gen. Physiol. 1999;114:95–124. doi: 10.1085/jgp.114.1.93. [DOI] [PMC free article] [PubMed] [Google Scholar]
- Rothberg B.S., Magleby K.L. Voltage and Ca2+ activation of single large-conductance Ca2+-activated channels described by a two tier allosteric gating mechanism. J. Gen. Physiol. 2000;116:75–99. doi: 10.1085/jgp.116.1.75. [DOI] [PMC free article] [PubMed] [Google Scholar]
- Rothberg B.S., Bello R.A., Song L., Magleby K.L. High Ca2+ concentrations induce a low activity mode and reveal Ca2+-independent long shut intervals in BK channels from rat muscle. J. Physiol. 1996;493:673–689. doi: 10.1113/jphysiol.1996.sp021414. [DOI] [PMC free article] [PubMed] [Google Scholar]
- Rothberg B.S., Bello R.A., Magleby K.L. Two-dimensional components and hidden dependencies provide insight into ion channel gating mechanisms. Biophys. J. 1997;72:2524–2544. doi: 10.1016/S0006-3495(97)78897-0. [DOI] [PMC free article] [PubMed] [Google Scholar]
- Schreiber M., Salkoff L. A novel calcium-sensing domain in the BK channel. Biophys. J. 1997;73:1355–1363. doi: 10.1016/S0006-3495(97)78168-2. [DOI] [PMC free article] [PubMed] [Google Scholar]
- Schreiber M., Wei A., Yuan A., Gaut J., Saito M., Salkoff L. Slo3, a novel pH-sensitive K+ channel from mammalian spermatocytes. J. Biol. Chem. 1998;273:3509–3516. doi: 10.1074/jbc.273.6.3509. [DOI] [PubMed] [Google Scholar]
- Schreiber M., Yuan A., Salkoff L. Transplantable sites confer calcium sensitivity to BK channels. Nat. Neurosci. 1999;2:416–421. doi: 10.1038/8077. [DOI] [PubMed] [Google Scholar]
- Shen K.-Z., Lagrutta A., Davies N.W., Standen N.B., Adelman J.P., North R.A. Tetraethylammonium block of slowpoke calcium-activated potassium channels expressed in Xenopus oocytesevidence for tetrameric channel formation. Pflügers Arch. 1994;426:440–445. doi: 10.1007/BF00388308. [DOI] [PubMed] [Google Scholar]
- Shi J., Cui J. Intracellular Mg2+ enhances the function of BK-type Ca2+ activated K+ channels Biophys. J. 80 2001. 221A(Abstr.) [Google Scholar]
- Sigworth F.J., Sine S.M. Data transformations for improved display and fitting of single-channel dwell time histograms. Biophys. J. 1987;52:1047–1054. doi: 10.1016/S0006-3495(87)83298-8. [DOI] [PMC free article] [PubMed] [Google Scholar]
- Silberberg S.D., Lagrutta A., Adelman J.P., Magleby K.L. Wanderlust kinetics and variable Ca2+-sensitivity of dSlo, a large conductance Ca2+-activated K+ channel, expressed in oocytes. Biophys. J. 1996;70:2640–2651. doi: 10.1016/S0006-3495(96)79833-8. [DOI] [PMC free article] [PubMed] [Google Scholar]
- Slesinger P.A., Jan Y.N., Jan L.Y. The S4-S5 loop contributes to the ion-selective pore of potassium channels. Neuron. 1993;11:739–749. doi: 10.1016/0896-6273(93)90083-4. [DOI] [PubMed] [Google Scholar]
- Solaro C., Nelson C., Wei A., Salkoff L., Lingle C. Cytoplasmic Mg2+ modulates Ca2+-dependent activation of mSlo by binding to a low affinity site on the channel core Biophys. J. 68 1995. A30(Abstr.) [Google Scholar]
- Stefani E., Ottolia M., Noceti F., Olcese R., Wallner M., Latorre R., Toro L. Voltage-controlled gating in a large conductance Ca2+-sensitive K+ channel (hslo) Proc. Natl. Acad. Sci. USA. 1997;94:5427–5431. doi: 10.1073/pnas.94.10.5427. [DOI] [PMC free article] [PubMed] [Google Scholar]
- Taglialatela M., Drewe J.A., Kirsch G.E., De Biasi M., Hartmann H.A., Brown A.M. Regulation of K+/Rb+ selectivity and internal TEA blockade by mutations at a single site in K+ pores. Pflügers Arch. 1993;423:104–112. doi: 10.1007/BF00374967. [DOI] [PubMed] [Google Scholar]
- Talukder G., Aldrich R.W. Complex voltage-dependent behavior of single unliganded calcium-sensitive potassium channels. Biophys. J. 2000;78:761–772. doi: 10.1016/S0006-3495(00)76634-3. [DOI] [PMC free article] [PubMed] [Google Scholar]
- Tang X.D., Daggett H., Hanner M., Garcia M.L., McManus O.B., Brot N., Weissbach H., Heinemann S.H. Oxidative regulation of large conductance calcium-activated potassium channels. J. Gen. Physiol. 2001;117:253–274. doi: 10.1085/jgp.117.3.253. [DOI] [PMC free article] [PubMed] [Google Scholar]
- Tseng-Crank J., Foster C.D., Krause J.D., Mertz R., Godinot N., DiChiara T.J., Reinhart P.H. Cloning, expression, and distribution of functionally distinct Ca2+-activated K+ channel isoforms from human brain. Neuron. 1994;13:1315–1330. doi: 10.1016/0896-6273(94)90418-9. [DOI] [PubMed] [Google Scholar]
- Wallner M., Meera P., Toro L. Determinant for β-subunit regulation in high-conductance voltage-activated and Ca2+-sensitive K+ channelsan additional transmembrane region at the N terminus. Proc. Natl. Acad. Sci. USA. 1996;93:14922–14927. doi: 10.1073/pnas.93.25.14922. [DOI] [PMC free article] [PubMed] [Google Scholar]
- Wang H.L., Ohno K., Milone M., Brengman J.M., Evoli A., Batocchi A.P., Middleton L.T., Christodoulou K., Engel A.G., Sine S.M. Fundamental gating mechanism of nicotinic receptor channel revealed by mutation causing a congenital myasthenic syndrome. J. Gen. Physiol. 2000;116:449–462. doi: 10.1085/jgp.116.3.449. [DOI] [PMC free article] [PubMed] [Google Scholar]
- Wang J., Zhou Y., Wen H., Levitan I.B. Simultaneous binding of two protein kinases to a calcium-dependent potassium channel. J. Neurosci. 1999;19:R1–R7. doi: 10.1523/JNEUROSCI.19-10-j0005.1999. [DOI] [PMC free article] [PubMed] [Google Scholar]
- Wei A., Solaro C., Lingle C., Salkoff L. Calcium sensitivity of BK-type KCa channels determined by a separable domain. Neuron. 1994;13:671–681. doi: 10.1016/0896-6273(94)90034-5. [DOI] [PubMed] [Google Scholar]
- Woodhull A.M. Ionic blockage of sodium channels in nerve. J. Gen. Physiol. 1973;61:687–708. doi: 10.1085/jgp.61.6.687. [DOI] [PMC free article] [PubMed] [Google Scholar]
- Wu Y.C., Art J.J., Goodman M.B., Fettiplace R. A kinetic description of the calcium-activated potassium channel and its application to electrical tuning of hair cells. Prog. Biophys. Mol. Biol. 1995;63:131–158. doi: 10.1016/0079-6107(95)00002-5. [DOI] [PubMed] [Google Scholar]
- Yang X.-C., Sachs F. Block of stretch-activated ion channels in Xenopus oocytes by gadolinium and calcium ions. Science. 1989;243:1068–1071. doi: 10.1126/science.2466333. [DOI] [PubMed] [Google Scholar]
- Yellen G. The moving parts of voltage-gated ion channels. Q. Rev. Biophys. 1998;31:239–295. doi: 10.1017/s0033583598003448. [DOI] [PubMed] [Google Scholar]
- Yellen G., Jurman M.E., Abramson T., MacKinnon R. Mutations affecting internal TEA blockade identify the probable pore-forming region of a K+ channel. Science. 1991;251:939–942. doi: 10.1126/science.2000494. [DOI] [PubMed] [Google Scholar]
- Yuan A., Dourado M., Butler A., Walton N., Wei A., Salkoff L. SLO-2, a K+ channel with an unusual Cl− dependence. Nat. Neurosci. 2000;3:771–779. doi: 10.1038/77670. [DOI] [PubMed] [Google Scholar]