Abstract
A full structural description of transition state ensembles in protein folding includes the specificity of the ordered residues composing the folding nucleus as well as spatial density. To our knowledge, the spatial properties of the folding nucleus and interface of specific nuclei have yet to receive significant attention. We analyze folding routes predicted by a variational model in terms of a generalized formalism of the capillarity scaling theory that assumes the volume of the folded core of the nucleus grows with chain length as Vf ≈ N3ν. For 27 two-state proteins studied, the scaling exponent ν ranges from 0.2 to 0.45 with an average of 0.33. This average value corresponds to packing of rigid objects, although generally the effective monomer size in the folded core is larger than the corresponding volume per particle in the native-state ensemble. That is, on average, the folded core of the nucleus is found to be relatively diffuse. We also study the growth of the folding nucleus and interface along the folding route in terms of the density or packing fraction. The evolution of the folded core and interface regions can be classified into three patterns of growth depending on how the growth of the folded core is balanced by changes in density of the interface. Finally, we quantify the diffuse versus polarized structure of the critical nucleus through direct calculation of the packing fraction of the folded core and interface regions. Our results support the general picture of describing protein folding as the capillarity-like growth of folding nuclei.
Keywords: diffuse, folding mechanism, interface, nucleation, polarized
The modern theory of protein folding describes the mechanism for folding as an entropic bottleneck arising from the decreasing number of accessible pathways available to a protein as it becomes ordered (1, 2). The collection of partially ordered conformations describing this bottleneck region is known as the transition state ensemble or critical folding nucleus (3). The structure of the transition state ensemble is commonly described through the degree of native-like order of specific residues because this is the kind of structural information that can be directly inferred from site-directed mutagenesis folding experiments. Nevertheless, a complete description of the protein folding mechanism also includes the spatial properties such as size or density of the transition state ensemble. Indeed, shortly after characterizing the transition state ensemble of CI2, Fersht (4) proposed a spatial description of the critical nucleus that supported the kinetic data. The critical nucleus envisioned in this nucleation-condensation mechanism can be thought of as an expanded, partially ordered version of the native state ensemble with concomitant long-range tertiary and local secondary structure. Although diffuse nuclei appear to be the general rule, some nuclei are less diffuse than others (5). Polarized nuclei have highly structured residues that are spatially clustered in the native structure, with the rest of the residues having little definite order (6–9). Such nuclei are similar to the capillarity approximation in homogeneous nucleation, where a stable phase droplet is separated from the metastable phase by a sharp interface. Several theoretical studies have appealed to this analogy to describe the mechanism for folding (10–14). Wolynes (14) describes a nucleus with capillarity-like order in which the interface surrounding a relatively folded core is broadened by wetting of partially ordered residues. In this picture, folding can be described as a wave of order moving across the protein as the edge of the nucleus expands to ultimately consume the entire molecule (14, 15)
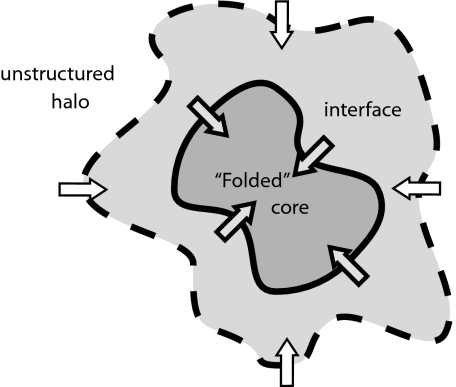
The extended partially ordered interface of a capillarity-like ordered nucleus separates space into three regions: a folded core, a partially ordered interface region, and unfolded halo (see Fig. 1). Growth of the nucleus is controlled by fluxes of residues passing through two moving surfaces: One surface separates the folded core and interface, and the other surface separates the interface region and the unfolded halo. As the protein folds, the folded core grows by incorporating residues from the interface region, whereas the evolution of the interfacial region is determined by the net flux of residues entering the interface.
Fig. 1.
Illustration of folding nucleus: folded core, interfacial region, and unfolded halo. Growth of the nucleus can be characterized by fluxes entering the folded core and interfacial regions.
Our analysis is based on folding routes calculated for 28 two-state proteins from a cooperative variational model described in ref. 16. We note this model includes neutral cooperativity due to repulsive excluded volume interactions. This form of cooperativity has been shown to broaden the range of barrier heights, allowing direct comparison between calculated and measured folding rates (16). Although this cooperativity tends to sharpen the interface between folded and unfolded regions, the interface from this model is not so sharp that each residue is either completely folded or completely unfolded, as assumed in some other analytic models (17–19). In fact, an unbiased analysis of the spatial properties of the folding nucleus fundamentally depends the model's ability to describe partial order.
The capillarity approximation of folding nuclei is based on classical nucleation theory of first order phase transition kinetics (17, 11). Within the capillarity approximation, the free energy of a nucleus with volume Vf and surface area Af can be written as a sum of two terms
where Δf denotes the bulk free energy difference per unit volume between the unfolded and folded ensembles, and γ is the surface tension between the folded and unfolded regions.
A folded core with native-like density has a volume per monomer independent of its size. Relaxing this assumption, we take the number of residues in the folded core, Nf, to scale with its volume, Vf, according to
Here, ν is the scaling exponent associated with the length scale of the folded core R ≈ b0 Nfν, and b3 is a geometry-dependent elementary volume proportional to the monomer volume, b03. The free energy of a folded nucleus with Nf residues then has the form: (14)
At the folding transition temperature, Tf, finite size depression of the surface energy suggests that γ ≈ ΔfbNν, where N is the number of monomers in the protein. The maximum of the free energy occurs at Nf† = (2/3)1/νN, with an associated free-energy barrier that scales as ΔF† ≈ N2ν. If we assume that the folded core has native-like packing, ν = 1/3, and b3 is the native-like volume per monomer, so that Nf† = (2/3)3N, and ΔF† ≈ N2/3 (13, 14).
Simulations and alternative theoretical considerations also suggest that barrier height (logarithm of the folding time) scales sublinearly on chain length, ΔF† ≈ Np, with 0 ≤ p ≤ 1 (13, 14, 20, 21). Direct analysis of folding rate data to determine the scaling exponent p encounters the difficulty that the range of N is too small to distinguish between different values of p (22–26). So, although it may be reasonable to expect that the scaling of the barrier height with chain length is universal for sufficiently large proteins, the size of typical two-state proteins (≈100 aa) may well be too small to be governed by this generic behavior. In this case, both specificity and size of these smaller proteins should generally determine the properties of the critical nuclei. In this article, we assume that Eq. 2 is valid to describe the growth of the nucleus in all of the two-state proteins, but the exponent ν and volume b3 are allowed to be protein-specific.
Results
Characterizing the Folded Core and the Interface.
In the variational model considered in this article, partially ordered configurations are described by a variational Hamiltonian, ℋ0, corresponding to a stiff polymer chain inhomogeneously constrained to the native structure. Because this model is described in detail in ref. 13, we focus here on how to define folded core, interface, and unfolded regions along the calculated folding route. This is not as straightforward as one might expect because the concept directly couples specificity of the nucleus with the spatial density.
We characterize the degree of structure of each residue by the extent of localization about the native structure {rN}, ρi = 〈exp(−αN(ri − riN)2〉0, with αN = 0.1. Here, the subscript denotes the average with respect to the Boltzmann weight with ℋ0. Denoting the native density at the globule and native state by ρi(G) and ρi(N), respectively, we consider the normalized density
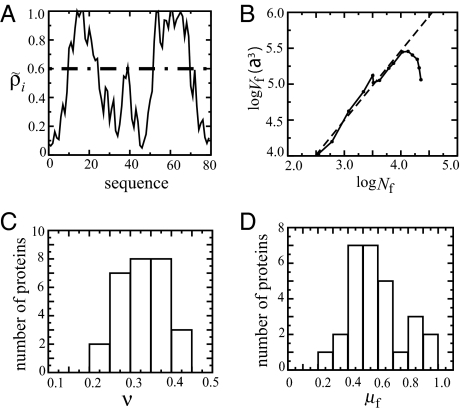
as a set of order parameters characterizing the folding of each residue. Progress along the folding route can be monitored by the global structural parameter Q = 1/NΣ ρ̃i. We use the normalized native densities to define a fiducial set of folded residues, {F}, with ρ̃i > 0.6, as shown in Fig. 2A. Next, we define the spatial region of the folded core through the relative contribution of the density of the folded residues in {F}, nf(r) = Σ{F} 〈δ(r − ri)〉0, to the total density, n(r) = Σi=1N〈δ(r − ri)〉0. The spatial extent of the folded core and interfacial regions in this analysis is determined by an indicator function
where 0 ≤ ñ(r) ≤ 1. We define the folded core region, 𝒱f, as the points {rf} for which the density of the fiducial folded residues contributes at least 50% to the total density (ñ(r) ≥ 0.5). The number of residues in this folded core region can be found by numerically integrating the density over the core region, Nf = ∫𝒱fn(r)dr. The volume of the core region is given by Vf = ∫𝒱fdr.
Fig. 2.
Scaling of the folded core with number of monomers. A and B correspond to λ−repressor (1lmb). (A) Residues with native density ρ̃i > 0.6 (indicated by the dashed line) define a fiducial set of folded residues. (B) Linear fit of log Vf vs. log Nf (dashed line) gives the exponent of Vf ≈ Nf3ν. In this example, the fitting equation is y = 5.6 + 0.97x, so that ν = 0.32, and b3 = 5.6a3; a = 3.8 Å is the average distance between the α carbons. (C) Histogram of scaling exponent ν for 28 proteins. (D) Histogram of the packing fraction of the folded core of the critical nucleus at Tf.
Similarly, the interfacial region, 𝒱int, is defined as the points {rint} for which 0.1 ≤ ñ(rint) < 0.5. The number of interfacial residues and volume of the interface is given by Nint = ∫𝒱intn(r)dr, and Vint = ∫𝒱intdr, respectively.
The number of residues and the volume can be used to define a mean packing fraction of the folded core and partially ordered interface by
respectively. Here, v0 is the calculated volume per particle of the native structure at the folding transition temperature, Tf. The growth of the nucleus can be characterized by the way the packing fractions μf and μint change along the folding route.
Growth of Folding Nucleus Along the Folding Route.
As illustrated in Fig. 2 A and B), the changes in Nf and Vf along a folding route can be fit to Eq. 2 to give an estimate of the scaling exponent ν for each protein. Fig. 2C shows the distribution of predicted ν from the folding routes obtained from the variational model for 28 two-state proteins discussed in ref. 13. The predicted scaling exponent ν ranges between 0.2 and 0.4, with an average of ν = 0.33. The mean exponent is very close to the scaling associated with close-packed rigid objects, ν = 1/3. For comparison, recent detailed statistical models indicate that the scaling exponent for the unfolded state of a protein is about ν = 0.59 (27), whereas a wide variety of protein folded structures suggest that proteins with <300 aa have compact folded structures (ν = 0.3), and larger proteins are less dense (ν = 0.4) (28).
The mean packing fraction of the core scales with the number of monomers as:
For the close packing value ν = 1/3, μf is independent of the number of monomers. When ν > 1/3, the core becomes less compact as monomers are added to the core. This is the familiar scaling from loosely packed or fractal objects. When ν < 1/3, the core density increases as more monomers are incorporated into the core. This can be understood as the consolidation of structure in the folded core as folding progresses.
Although the spatial structure of the critical folding nucleus (transition-state ensemble), is discussed in more detail below, it is instructive to consider the value of the mean packing fraction of the core here. Fig. 2D shows the distribution of packing fractions of the folded core evaluated at the maximum free-energy barrier between folded and unfolded states at Tf. The packing fraction has a wide range, from 0.2 to 1.0. Although some of the transition-state nuclei have compact cores, the average packing fraction is only 0.59. This means that although the growth of a typical folded core corresponds to rigidly packed objects, a typical transition state ensemble has a folded core with twice the volume as the volume of same number of monomers in the native-state conformation (b3 ≈ 2v0). That is, the monomers composing the nucleus are typically much less localized than in the native state.
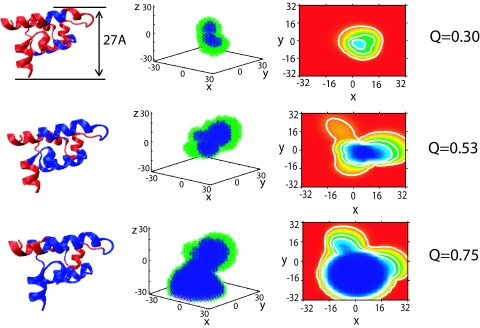
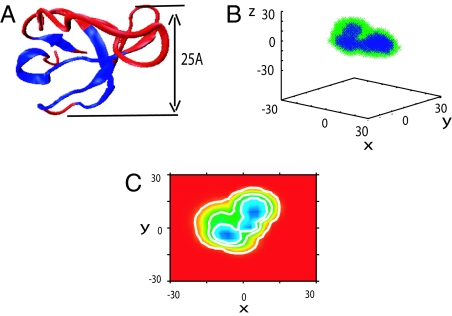
Fig. 3 shows a representative example of the growth of the folded core and the interface region. Early in the folding, the folded nucleus is small and compact, surrounded by a partially folded interface. This small nucleus is partially ordered, occupying about twice the volume of the corresponding residues in the native state. Structural fluctuations giving nuclei corresponding to Q < Q† are unstable with respect to the unfolded state due to relatively large surface free-energy cost associated with small nuclei, whereas structural fluctuations with Q > Q† tends to evolve to the folded state. As the nucleus grows, the volume of the nucleus evolves as interfacial regions are incorporated into the core, whereas unfolded residues become part of the partially ordered interface.
Fig. 3.
Illustration of growth of folding nucleus and interface along the folding route (increasing Q for the λ-repressor protein (1lmb). Column 1 shows the three-dimensional folded structure with the fiducial set of folded residues colored blue and the unfolded residues colored red. In column 2, the folded core (colored blue) is surrounded by the interfacial region (colored green). Column 3 is a projection of the indicator function ñ(r) that defines the folded and interfacial regions in space. The values correspond to maxzñ(x,y,z), ranging from 1 (blue) to 0 (red) in steps of 0.01. Contour lines correspond to 0.1, 0.5, 0.7. Column 4 gives the corresponding Q value for each row. The critical nucleus corresponds to Q = 0.53. The units for three plots are in angstroms. This protein belongs to pattern C (balanced growth). The three-dimensional structure was produced by VMD (29).
Growth Patterns of the Nucleus.
The structural growth of the folding nucleus can be understood as the competition between growth of the folded core and the evolution of the interface. The flux of residues entering core through the interface region controls the growth of the core, and the net flux of residues entering interface region from the unfolded halo controls the growth of the interface (see Fig. 1). The evolution of the nucleus along the folding route can be monitored through changes in the number of residues, volume, and packing fraction as a function the global order parameter Q. The scaling relation given in Eq. 2, for example, is a parametric equation of Vf(Q) and Nf(Q). As noted below in Eq. 8, the density of the folded core can increase, decrease, or stay the same as residues are incorporated into the core depending on the value of the scaling exponent ν. Here, we consider evolution of both the folded core and the interface between folded and unfolded regions along the folding route to describe the growth of the nucleus. In particular, we focus on the changes in the packing fraction μf(Q) and μint(Q) along the folding route. That is, we consider the signs of
to identify different modes of growth. From the two-state proteins used in this study, we can identify three distinct scenarios as illustrated in Fig. 4. [Similar plots for all of the protein studies are given in supporting information (SI) Figs. S1–S5 and SI Text.]
Fig. 4.
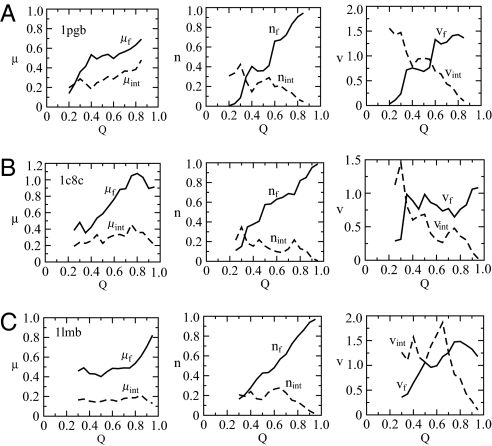
Examples of three folding patterns. Patterns A–C correspond to (A–C), respectively. Column 1 shows the mean packing fraction in folded core (μf, solid line) and interface region (μint, dashed line) as function of Q; column 2 shows the number of particles in the folded core (normalized by the chain length, nf, solid line), and interface region (nint, dashed line) as a function of Q; column 3 shows the volume of folded core (normalized by the volume at native state, vf, solid line) and interface region (vint, dashed line) as a function of Q.
Pattern A (consolidation of core and interface).
As shown in Fig. 4A, proteins described by this growth pattern have μ̇f (Q) > 0 and μ̇int (Q) > 0. For these proteins, the number of folded residues increases faster than volume increases so that the folded core region becomes increasingly more tightly packed along folding route. The consolidation of the core is closely related to the evolution of the interface region, shown as dashed lines in Fig. 4. The growth of the interface region determined by the density is similar, although this time, both the number of residues and their occupying volume are decreasing along the folding route. Both the core and interface become more compact until the interface is almost completely depleted near the folded configuration.
Pattern B (consolidation of the core only).
As shown in Fig. 4B, proteins described by this growth pattern have μ̇f (Q) > 0 and μ̇int(Q) ≈ 0. This means that the folded core consolidates along the folding route as in pattern A, but the interface region evolves with relatively constant density. In the illustration shown in Fig. 4B, the Nint and Vint remain relatively constant throughout much of the growth. Then the interface can be seen as a channel transferring residues from the unfolded halo to the folded core with no net flux of residues through the interfacial surface. For some other proteins in this class, a decrease in the number of interfacial residues is balanced by a proportional decrease in the interfacial volume (see Figs. S1–S5 and SI Text).
Pattern C (balanced growth).
As shown in Fig. 4C, proteins described by this growth pattern have μ̇f (Q) ≈ 0 and μ̇int (Q) ≈ 0. For this set of proteins, the cores do not consolidate until the end of folding. Rather, the evolution of the number of residues and the volume keeps the density of both regions relatively constant. (The same comments about balanced evolution of the interface relevant to pattern B apply here as well.)
Of the 27 proteins studied, three proteins are difficult to classify by this scheme (see Figs. S1–S5 and SI Text). The packing fractions of folded cores for these proteins show clearly sharp variations between low and high values. Some of the ruggedness of these curves is due to the rigid cutoff values defining the fiducial set of folded and interface residues as well as the three spatial regions of the nucleus. Whether this accounts for the anomalous calculated behavior for these three anomalous proteins is not yet clear. The growth mode of the nucleus for the 27 proteins considered in this article (1pgb16 is too small to have a compact folded core) can be roughly classified as follows: pattern A: 1pgb, 1a0n, 1pks, 1pin, 1psf, 1shg, 2ptl; pattern B: 1c8c, 1coa, 1enh, 1fkb, 1hdn, 1vii, 1wit, 2pdd; pattern C: 1aps, 1csp, 1fnf9, 1imq, 1mef, 1o6x, 1srl, 1ten, 1lmb; Exceptions: 1div, 1urn, 2abd.
Polarized Versus Diffuse Critical Nucleus.
A folding mechanism is typically characterized by the structure of the critical nucleus. The spatial structure of the transition state ensemble, inferred from φ-value analysis, has often been qualitatively summarized as either diffuse or polarized (30). Intermediate φ-values spread across a large portion of the protein sequence indicate a diffuse nucleus. In contrast, polarized transition states are inferred when only one part of the structure has relatively high φ-values and the rest of the residues have low φ-values. In addition to a bimodal distribution of φ-values, the ordered residues in a polarized transition-state ensemble are located in one region in the native configuration. Polarized and diffuse critical nuclei are sometimes called localized and delocalized transition-state ensembles, respectively (31). Of course, the critical nucleus of a given protein is expected to have structural properties somewhere between the two ideal limits. The second row of Fig. 3 gives an example a diffuse critical nucleus (1lmb). For comparison, Fig. 5 shows the corresponding plots for a protein with a polarized critical nucleus (1srl). Comparing Figs. 3 and 5, it is clear that the interface of 1lmb is much broader than the interface region of 1srl. Furthermore, the folded core of 1lmb is much more diffuse than the folded core of 1srl.
Fig. 5.
An example of a polarized critical nucleus (Q = 0.45) for Src-SH3 (1srl). Plots A–C correspond to the middle row of the diffuse nucleus shown in Fig. 3.
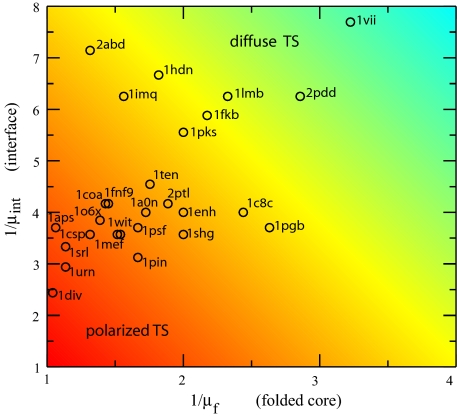
Characterizing a capillarity-like ordered nucleus as either diffuse or polarized is a statement of the sharpness of the interface as well as the compactness of the core. For convenience, we monitor both regions by the normalized volume per monomer (inverse packing fraction): 1/μf and 1/μint. The results for the two-state proteins considered in this work are shown in Fig. 6. Nuclei with small values of 1/μf and 1/μint are more polarized, possessing relatively compact cores and sharp interfaces (similar to those envisioned in the strict capillarity approximation). Diffuse nuclei, on the other hand, have extended regions of partial order that correspond to larger values of 1/μf and/or 1/μint. We note that relatively polarized nuclei can have cores that are still loosely packed compared with the native-state density (e.g., 1pgb). Furthermore, relatively diffuse nuclei can have tightly packed cores but extended interfaces (e.g., 2abd, 1imq, 1fkb). Our analysis suggests polarized critical nuclei consistent with classification inferred by experimental φ-value analysis [such as 1csp (9), 1srl (7), 1shg (6), 1pin (8), 2ptl (32), and 1pgb (33)]. Our model also is consistent with several proteins classified as having diffuse critical nuclei [such as 1lmb (34), 2abd (35), 1imq (36), and 1fkb (37)]. This favorable comparison for a wide variety of proteins is a reassuring assessment of the model. At the same time, we realize that this comparison is necessarily qualitative and subjective.
Fig. 6.
Inverse packing fraction of the interface and folded core. for 27 two-state proteins. The gradual change in color shows the continuous change from polarized nuclei (red) to diffuse nuclei (cyan).
With this caveat in mind, there are several proteins for which the model appears at odds with the characterization of the critical nucleus inferred from φ-values [such as CI2 (4), 1aps (38), U1A (39), and 1pgb (33)]. In these exceptional cases, φ-value distributions indicate that the critical nucleus is rather diffuse, but our model predicts more polarized nuclei. This tendency may indicate that the model is too cooperative for these proteins, because high cooperativity is expected to have sharp interfaces and more polarized transition-state ensembles.
Discussion
In this article, we directly characterize folding in terms of the capillarity-like growth of the folding nucleus. The nature of the partially folded interfacial region between the folded core and unfolded halo is the central focus of characterizing the growth modes of the nucleus. We find that the growth of the nucleus can be classified into three different patterns: the core and interface both condense along the folding route (pattern A); the core condenses at the expense of the interfacial region (pattern B); and the growth of the core is balanced by the monomers entering the interfacial region from the unfolded halo (pattern C). The picture of the core as close packing of rigid monomers appears to be valid on average, although the size of the effective monomers is larger than one would expect for a native-like, compact core. This analysis clarifies that diffuse nuclei inferred by the distribution of intermediate φ-values, for example, can arise from either a diffuse folded core, a broad interfacial region, or both. The predictions from our calculations can be tested from the analysis of the evolution of φ-values as a function of the movement of the transition state ensemble (β†) pioneered by Oliveberg and coworkers (39, 40). The variational model considered here includes a uniform “neutral,” excluded volume type cooperativity developed to account of general trends in the absolute folding rates of two-state proteins (13). The exceptional qualitative discrepancies of the polarized versus diffuse characterization of the critical nucleus (such as CI2, 1aps, 1pgb, and U1A) permit an opportunity to assess the form and strength of the cooperativity of this model. The spatial density of the critical nucleus can be used as an independent criterion to check the value of the cooperativity obtained by simultaneously fitting φ-values and barrier height by the parameterization of the cooperativity for each protein. There are some indications that one should consider variations in the strength of the cooperativity for different proteins (although, admittedly, this is very closely tied to the specific form of the cooperativity in the model). For example, Ejtehadi and Plotkin (41) recently found that the strength of cooperativity from three-body interactions can be tuned for each protein to bring simulations of φ-values into better agreement with experimental measurement. The generally good qualitative agreement between our calculations and experimental inferences about the spatial extent of folding nuclei suggest that tuning the excluded volume strength for each protein would not greatly improve the results presented here for the majority of the proteins studied.
Supplementary Material
Acknowledgments.
This work was supported in part by a grant from the Ohio Board of Regents Research Challenge program.
Footnotes
The authors declare no conflict of interest.
This article is a PNAS Direct Submission.
This article contains supporting information online at www.pnas.org/cgi/content/full/0711527105/DCSupplemental.
References
- 1.Leopold PE, Montal M, Onuchic JN. Protein folding funnels: A kinetic approach to the sequence–structure relationship. Proc Natl Acad Sci USA. 1992;89:8721–8725. doi: 10.1073/pnas.89.18.8721. [DOI] [PMC free article] [PubMed] [Google Scholar]
- 2.Bryngelson JD, Onuchic JN, Socci ND, Wolynes PG. Funnels, pathways and the energy landscape of protein folding: A synthesis. Proteins Struct Funct Genet. 1995;21:167–195. doi: 10.1002/prot.340210302. [DOI] [PubMed] [Google Scholar]
- 3.Onuchic JN, Wolynes PG, Luthey-Schulten Z, Socci ND. Toward an outline of the topography of a realistic protein folding funnel. Proc Natl Acad Sci USA. 1995;92:3626–3630. doi: 10.1073/pnas.92.8.3626. [DOI] [PMC free article] [PubMed] [Google Scholar]
- 4.Itzhaki LS, Otzen DE, Fersht AR. The structure of the transition state for folding of chymotrypsin inhibitor 2 analyzed by protein engineering methods: Evidence for a nucleation–condensation mechanism for protein folding. J Mol Biol. 1995;254:260–288. doi: 10.1006/jmbi.1995.0616. [DOI] [PubMed] [Google Scholar]
- 5.Alm E, Morozov AV, Kortemme T, Baker D. Simple physical models connect theory and experiment in protein folding kinetics. J Mol Biol. 2002;322:463–476. doi: 10.1016/s0022-2836(02)00706-4. [DOI] [PubMed] [Google Scholar]
- 6.Martinez JC, Serrano L. The folding transition state between sh3 domain is conformationally restricted and evolutionarily conserved. Nat Struct Biol. 1999;6:1010–1016. doi: 10.1038/14896. [DOI] [PubMed] [Google Scholar]
- 7.Riddle DS, et al. Experiment and theory highlight role of native state topology in sh3 folding. Nat Struct Biol. 1999;6:1016–1024. doi: 10.1038/14901. [DOI] [PubMed] [Google Scholar]
- 8.Jager M, Nguyen H, Crane JC, Kelly JW, Gruebele M. The folding mechanism of a beta-sheet: The ww domain. J Mol Biol. 2001;311:373–393. doi: 10.1006/jmbi.2001.4873. [DOI] [PubMed] [Google Scholar]
- 9.Garcia-Mira MM, Bochringer D, Schmid FX. The folding transition state of the cold shock proteins is strongly polarized. J Mol Biol. 2004;339:555–569. doi: 10.1016/j.jmb.2004.04.011. [DOI] [PubMed] [Google Scholar]
- 10.Bryngelson JD, Wolynes PG. A simple statistical field theory of heterpolymer collapse with applications to protein folding. Biopolymers. 1990;30:177–188. [Google Scholar]
- 11.Guo Z, Thirumalai D. Kinetics of protein folding: Nucleation mechanism, time scales, and pathways. Biopolmers. 1995;36:83–102. [Google Scholar]
- 12.Abkevich VI, Gutin AM, Shakhnovich EI. Specific nucleus as the transition state for protein folding: Evidence from the lattice model. 1994;33:10026–10036. doi: 10.1021/bi00199a029. [DOI] [PubMed] [Google Scholar]
- 13.Finkelstein AV, Badretdinov AY. Rate of protein folding near the point of thermodynamic equilibrium between the coil and the most stable chain fold. Fold Des. 1997;2:115–121. doi: 10.1016/s1359-0278(97)00016-3. [DOI] [PubMed] [Google Scholar]
- 14.Wolynes PG. Folding funnels and energy landscapes of larger proteins within the capillarity approximation. Proc Natl Acad Sci USA. 1997;94:6170–6175. doi: 10.1073/pnas.94.12.6170. [DOI] [PMC free article] [PubMed] [Google Scholar]
- 15.Oliveberg M, Wolynes PG. The experimental survey of protein-folding energy landscapes. Q Rev Biophys. 2005;38:245–288. doi: 10.1017/S0033583506004185. [DOI] [PubMed] [Google Scholar]
- 16.Qi X, Portman JJ. Excluded volume, local structural cooperativity, and the polymer physics of protein folding rates. Proc Natl Acad Sci USA. 2007;104:10841–10846. doi: 10.1073/pnas.0609321104. [DOI] [PMC free article] [PubMed] [Google Scholar]
- 17.Galzitskaya OV, Finkelstein AV. A theoretical search for folding/unfolding nuclei in three-dimensional protein structures. Proc Natl Acad Sci USA. 1999;96:112999–113004. doi: 10.1073/pnas.96.20.11299. [DOI] [PMC free article] [PubMed] [Google Scholar]
- 18.Alm E, Baker D. Prediction of protein-folding mechanisms from free-energy landscapes derived from native structures. Proc Natl Acad Sci USA. 1999;96:11305–11310. doi: 10.1073/pnas.96.20.11305. [DOI] [PMC free article] [PubMed] [Google Scholar]
- 19.Muñoz V, Eaton WA. A simple model for calculating the kinetics of protein folding from three-dimensional structures. Proc Natl Acad Sci USA. 1999;96:11311–11316. doi: 10.1073/pnas.96.20.11311. [DOI] [PMC free article] [PubMed] [Google Scholar]
- 20.Thirumalai D. From minimal models to real proteins: Time scales for protein folding kinetics. J Phys I. 1995;5:1457–1467. [Google Scholar]
- 21.Koga N, Takada S. Role of native topology and chain length in protein folding. J Mol Biol. 2001;313:171–180. doi: 10.1006/jmbi.2001.5037. [DOI] [PubMed] [Google Scholar]
- 22.Ivankov D, et al. Contact order revised: Influence of protein size on the folding rate. Protein Sci. 2003;12:2057–2062. doi: 10.1110/ps.0302503. [DOI] [PMC free article] [PubMed] [Google Scholar]
- 23.Galzitskaya OV, Garbuzynskiy SO, Ivankov DN, Finkelstein AV. Chain length is the main determinant of the folding rate for proteins with three-state folding kinetics. Proteins Struct Funct Genet. 2003;51:162–166. doi: 10.1002/prot.10343. [DOI] [PubMed] [Google Scholar]
- 24.Ivankov DN, Finkelstein AV. Prediction of protein folding rates from the amino acid sequence-predicted secondary structure. Proc Natl Acad Sci USA. 2004;101:8942–8944. doi: 10.1073/pnas.0402659101. [DOI] [PMC free article] [PubMed] [Google Scholar]
- 25.Li MS, Klimov DK, Thirumalai D. Thermal denaturation and folding rates of single domain proteins: Size matters. Polymer. 2004;45:573–579. [Google Scholar]
- 26.Naganathan AN, Muñoz V. Scaling of folding times with protein size. J Am Chem Soc. 2005;127:480–481. doi: 10.1021/ja044449u. [DOI] [PubMed] [Google Scholar]
- 27.Jha AK, Colubri A, Freed KF, Sosnick TR. Statistical coil model of the unfolded state: Resolving the reconciliation problem. Proc Natl Acad Sci USA. 2005;102:13099–13104. doi: 10.1073/pnas.0506078102. [DOI] [PMC free article] [PubMed] [Google Scholar]
- 28.Xu X, Leitner D. Anomalous diffusion of vibrational energy in proteins. J Chem Phys. 2003;119:12673–12679. [Google Scholar]
- 29.Humphrey W, Dalke A, Schulten K. VMD: Visual molecular dynamics. J Mol Graphics. 1996;14:33–38. doi: 10.1016/0263-7855(96)00018-5. [DOI] [PubMed] [Google Scholar]
- 30.Grantcharova V, Alm E, Baker D, Horwich AL. Mechanism of protein folding. Curr Opin Struct Biol. 2001;11:70–82. doi: 10.1016/s0959-440x(00)00176-7. [DOI] [PubMed] [Google Scholar]
- 31.Geierhaas CD, Best RB, Paci E, Vendruscolo M, Clarke J. Structural comparison of the two alternative transition states for folding of ti i27. Biophys J. 2006;91:263–275. doi: 10.1529/biophysj.105.077057. [DOI] [PMC free article] [PubMed] [Google Scholar]
- 32.Kim DE, Fisher C, Baker D. A breakdown of symmetry in the folding transition state of protein l. J Mol Biol. 2000;298:971–984. doi: 10.1006/jmbi.2000.3701. [DOI] [PubMed] [Google Scholar]
- 33.McCallister EL, Alm E, Baker D. Critical role of beta-hairpin formation in protein g folding. Nat Struct Biol. 2000;7:669–673. doi: 10.1038/77971. [DOI] [PubMed] [Google Scholar]
- 34.Burton RE, Huang GS, Daugherty MA, Calderone TL, Oas TG. The energy landscape of a fast-folding protein mapped by Ala–Gly substitutions. Nat Struct Biol. 1997;4:305–310. doi: 10.1038/nsb0497-305. [DOI] [PubMed] [Google Scholar]
- 35.Kragelund BB, et al. The formation of a native-like structure containing eight conserved hydrophobic residues is rate limiting in two-state protein folding of acbp. Nat Struct Biol. 1999;6:594–601. doi: 10.1038/9384. [DOI] [PubMed] [Google Scholar]
- 36.Friel CT, Capaldi AP, Radford SE. Structural analysis of the rate-limiting transition states in the folding of im7 and im9: Similarities and differences in the folding of homologous proteins. J Mol Biol. 2003;326:293–305. doi: 10.1016/s0022-2836(02)01249-4. [DOI] [PubMed] [Google Scholar]
- 37.Fulton KF, Main ER, Daggett V, Jackson SE. Mapping the interaction present in the transition state for unfolding/folding of fkbp12. J Mol Biol. 1999;291:445–461. doi: 10.1006/jmbi.1999.2942. [DOI] [PubMed] [Google Scholar]
- 38.Chiti F, et al. Mutational analysis of acylphosphatase suggests the importance of topology and contact order in protein folding. Nat Struct Biol. 1999;6:1005–1009. doi: 10.1038/14890. [DOI] [PubMed] [Google Scholar]
- 39.Ternstrom T, Mayor U, Akke M, Oliveberg M. From snapshot to movie: φ Analysis of protein folding transition states taken one step further. Proc Natl Acad Sci USA. 1999;96:14854–14859. doi: 10.1073/pnas.96.26.14854. [DOI] [PMC free article] [PubMed] [Google Scholar]
- 40.Shen T, Hofmann CP, Oliveberg M, Wolynes PG. Scanning malleable transition state ensembles: Comparing theory and experiment for folding protein u1a. Biochemistry. 2005;44:6433–6439. doi: 10.1021/bi0500170. [DOI] [PubMed] [Google Scholar]
- 41.Ejtehadi MR, Avall SP, Plotkin SS. Three-body interactions improve the prediction of rate and mechanism in protein folding models. Proc Natl Acad Sci USA. 2004;101:15088–15093. doi: 10.1073/pnas.0403486101. [DOI] [PMC free article] [PubMed] [Google Scholar]
Associated Data
This section collects any data citations, data availability statements, or supplementary materials included in this article.


