

Abstract
Human ether-à-go-go–related gene (hERG) channels mediate cardiac repolarization and bind drugs that can cause acquired long QT syndrome and life-threatening arrhythmias. Drugs bind in the vestibule formed by the S6 transmembrane domain, which also contains the activation gate that traps drugs in the vestibule and contributes to their efficacy of block. Although drug-binding residues have been identified, we know little about the roles of specific S6 residues in gating. We introduced cysteine mutations into the hERG channel S6 domain and measured mutational effects on the steady-state distribution and kinetics of transitions between the closed and open states. Energy-minimized molecular models based on the crystal structures of rKv1.2 (open state) and MlotiK1 and KcsA (closed state) provided structural contexts for evaluating mutant residues. The majority of mutations slowed deactivation, shifted conductance voltage curves to more negative potentials, or conferred a constitutive conductance over voltages that normally cause the channel to close. At the most intracellular extreme of the S6 region, Q664, Y667, and S668 were especially sensitive and together formed a ringed domain that occludes the pore in the closed state model. In contrast, mutation of S660, more than a full helical turn away and corresponding by alignment to a critical Shaker gate residue (V478), had little effect on gating. Multiple substitutions of chemically distinct amino acids at the adjacent V659 suggested that, upon closing, the native V659 side chain moves into a hydrophobic pocket but likely does not form the occluding gate itself. Overall, the study indicated that S6 mutagenesis disrupts the energetics primarily of channel closing and identified several residues critical for this process in the native channel.
INTRODUCTION
The human ether-à-go-go–related gene (hERG, or KCNH2) encodes channel subunits underlying cardiac IKr, a repolarizing current in the heart (Sanguinetti et al., 1995; Trudeau et al., 1995; Jones et al., 2004). Disruption of IKr by mutations in hERG or by drug block can cause long QT syndrome, a condition associated with increased cardiac excitability, torsades de pointes arrhythmias, and sudden death (Curran et al., 1995; Trudeau et al., 1995; Snyders and Chaudhary, 1996; Hancox et al., 2008). A staggering 50–70% of all lead compounds block hERG channels and are generally dropped from further development, severely limiting the introduction of new drugs into the pipeline for many therapeutic targets (Finlayson et al., 2004; Shah, 2005).
Compounds that block hERG enter the pore from the cytosol through the open activation gate (Snyders and Chaudhary, 1996; Zhou et al., 1998). Residue F656 (see Fig. 1 A, blue) in the S6 transmembrane domain is critical for drug block, as mutagenesis at this site reduces the block by several compounds by several orders of magnitude (Lees-Miller et al., 2000; Mitcheson et al., 2000a, 2000b). An S4-S5 linker mutation that allows reactivation of current at hyperpolarized voltages alleviates hERG block, indicating that drugs are trapped in the vestibule by a gate that regulates the permeant path (Mitcheson et al., 2000b). Determining the structural and functional details of S6 will be important in understanding why hERG channels are blocked with high affinity by such a wide range of drugs.
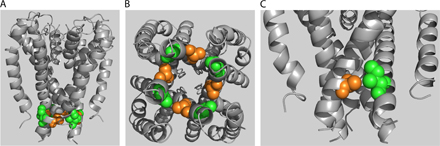
Figure 1.

Topology and alignment of hERG and related channels. (A) Energy-minimized models of hERG in membrane cross section in the closed (left) and open (right) states based on crystal structures of MlotiK1 and rKv1.2 (see text). The S4-S5 linker in shadow and S5 and S6 in gray ribbons from two of the four subunits are shown. S6 residues highlighted are, top-to-bottom: F656 (blue), V659 (red), S660 (yellow; aligns with V478 in Shaker), Q664 (green), Y667 (orange), and S668 (purple). (B) Schematic of one hERG subunit. α-helical transmembrane domains S1 through S6 along with the pore helix are represented as cylinders. S6 domains from each of the four subunits form the ion conduction pathway. The region of mutagenic scan of S6 is bracketed. CNBD, cyclic nucleotide binding domain; PAS, per-arnt-sim domain. (C) Alignment of hERG, MlotiK1, and KcsA used in homology modeling. Selectivity filter and region of mutagenic scan in hERG is boxed, as is rKv1.2 residue analogous to Shaker residue V478, corresponding to the region of the activation gate (Liu et al., 1997; Kitaguchi et al., 2004).
The S6 region of Shaker family K channels has been well-characterized (Liu et al., 1997; del Camino and Yellen, 2001; Hackos et al., 2002; Rich et al., 2002; Kitaguchi et al., 2004; del Camino et al., 2005). Only cysteines introduced at V478 or closer to the selectivity filter show strong state dependence of modification with methanethiosulfonate-modifying reagents, suggesting that V478 resides at the intracellular limit of the gate (Liu et al., 1997). Substitution to tryptophan at this site stabilizes the closed state, as if forming a hydrophobic seal (Kitaguchi et al., 2004).
To explore the roles of specific S6 positions in gating hERG channels, we introduced cysteine residues, which are typically well tolerated, and assayed effects on the equilibrium between the closed and open states and on the kinetics of current activation and deactivation. We created energy-minimized models based on primary sequence alignments with rKv1.2 for the open state (Long et al., 2005a, 2005b) and MlotiK1 for the closed state, the first closed-state model incorporating the S4-S5 linker (Clayton et al., 2008). In general, the predominant mutant phenotypes were a disruption of deactivation, reflecting the importance of this region in mediating channel closure. Moreover, the observed functional perturbations and molecular modeling suggest differences in structure of the Shaker and hERG closing gate, consistent with a larger hERG vestibule. This work was presented previously in abstract form (Wynia et al., 2007).
MATERIALS AND METHODS
Construction of Point Mutations
S6 substitutions were generated in a hERG background containing a mutation (S620T) that abolishes inactivation without altering the kinetics of activation or deactivation (Herzberg et al., 1998; Viloria et al., 2000; Ficker et al., 2001; Gomez-Varela et al., 2002). In this way transitions between the closed and open states can be observed without obfuscation by the overlapping transitions into and out of the inactivated state. We constructed point mutations using an overlapping PCR primer method (Innis, 1990), digesting the amplified fragments with appropriate enzymes and ligating them into the pGH19 vector backbone. All mutations were confirmed by automated sequencing (University of Wisconsin-Madison Biotechnology Center).
RNA Synthesis and Injection and Preparation of Oocytes
All cDNA templates for RNA production were linearized with NotI, and cRNA was transcribed in vitro (mMessage mMachine; Ambion). cRNAs were purified using either a Sephadex G-50 purification column (Sigma-Aldrich) or standard phenol/cholorform extraction followed by precipitation with 1 vol of 7.5 M ammonium acetate and 2 vol of 100% ethanol. cRNA was then solubilized in purified RNase-free water.
Oocytes were removed from anesthetized Xenopus laevis frogs according to animal protocols approved by the University of Wisconsin-Madison. Follicular membranes were removed with 0.5 mg/ml collagenase IA treatment (Sigma-Aldrich) and manually as needed. Defolliculated oocytes were injected with 40 nl of appropriately diluted cRNA to give an outward current of 2–10 μA. After injection, oocytes were cultured at 18°C in storage solution (96 mM NaCl, 2 mM KCl, 1 mM MgCl2, 1.8 mM CaCl2, 5 mM HEPES, pH 7.4, supplemented with 50 μg/ml gentamicin [Invitrogen]) and either 2.5 mM sodium pyruvate or 1 mg/ml bovine serum albumin.
Current Recordings and Data Analysis
We recorded currents using two-electrode voltage clamp (OC-725C; Warner Instruments) and either pClamp version 6.0.4.11 or 8.02 (MDS Analytical Technologies). Data were digitized at 2 or 4 kHz without filtering. The resistance of the electrodes ranged from 0.5 to 2.0 MΩ in 2 M KCl. The recording solution contained 5 mM KCl, 93 mM N-methyl-glucamine, 1 mM MgCl2, 0.3 mM CaCl2, 5 mM HEPES, pH 7.4, for normal recordings. In toxin experiments, we used 20 mM of extracellular KCl to evoke greater current levels at −80 mV, allowing for more accurate measurements of the differences in constitutive conduction before and after toxin application (see below for details). All recordings were performed at room temperature (∼25°C) and held at −80 mV between recordings.
pClamp 8.02 and Origin version 7.5 (Microcal Software, Inc.) were used for fitting data traces, analyzing data, and generating graphs. Data fits were accepted if the correlation coefficient was >0.98. Data are shown as mean ± SEM. Significance levels for multiple comparisons were determined using ANOVA followed by Dunnett's method. A p-value of <0.05 was considered significant.
We obtained steady-state conductance–voltage relations using a pulse protocol with 1-s voltage steps to a range of voltages from −100 to 70 mV in 10-mV increments. Tail currents were measured during a subsequent step to −105 mV and normalized to the maximum tail current obtained at 70 mV, yielding normalized conductance values (G/Gmax). G/Gmax was then plotted as a function of the preceding voltage step. The resulting relation was fit with a Boltzmann function of the form:
 |
where G is conductance, z is effective charge, V1/2 is the voltage of half-activation, and R, T, and F have their usual meanings.
Some mutants were best fit by an empirical double Boltzmann function:
 |
where A1 is the fraction of current in the more hyperpolarized voltage range, z1 and z2 are the effective charge, and V1 and V2 are the voltages of half-activation. Data fits were accepted if the R2 value was >0.98.
Because of the lack of inactivation in the S620T background in the voltage ranges tested, activation time constants (τ's) were measured directly from outward currents by performing a single exponential Chebyshev fit to the rising phase of the activating current, ignoring initial sigmoidicity.
Fast and slow deactivation τ's were derived from a double exponential Chebyshev fit to the deactivating current using:
 |
The double exponential fit needed for fitting tail currents reflects a complex gating process, likely including multiple closed states. Because the relative weights of fast and slow deactivation τ's differed between the mutants tested, we calculated a weighted, average time constant of the fast and slow components of deactivation based on the amplitude of each component.
Constitutively Conducting Mutants
To confirm that the constitutive conduction phenotype observed in V659C, Q664C, Y667C, and S668C was due to hERG current and not passive leak or conduction through other ion channels, we identified batches of oocytes with low intrinsic leak in control and uninjected cells to perform recordings. Within these batches, we performed experiments using Centruroides noxius Erg-specific toxin (CnErg-1) to abolish current. Before toxin application, we measured holding current at −80 mV in normal bath solution (5 mM K+) and in high K solution (20 mM K+) to increase the amplitude of the holding current. Lyophilized peptide toxin CnErg-1 (Alomone) was dissolved into bath solution at a concentration of 2 μM and stored at −20°C until use. Toxin aliquots were thawed on ice and applied to 20 mM [K] bath solution for a final concentration of ∼100 nM, which is expected to abolish ∼90% of hERG current (Pardo-Lopez et al., 2002a, 2002b). We again measured holding current at −80 mV after sufficient time for diffusion of the toxin in bath solution. Baseline constitutive conductance measured in these experiments exceeds that measured in other experiments because in this case oocytes were not discarded for high “leak” levels, i.e., steady-state conductance in excess.
Computer Homology Modeling
Computer homology models of the hERG channel were constructed based on available ion channel crystal structures representing the closed and open channel states (Doyle et al., 1998; Long et al., 2005a, 2005b; Clayton et al., 2008). Crystal structure coordinates for MlotiK1 (Protein Data Bank [PDB] ID 3BEH) and rKv1.2 (PDB ID 2A79) were obtained from the PDB and used as starting models. Residues were mutated manually in the SYBYL molecular modeling program (Tripos Corp.) according to the following alignments. The conserved P region/selectivity filter (Heginbotham et al., 1992) was used as a starting point for model construction.
For the open state model, rKv1.2 residue 293 was aligned with hERG residue 515. The sequence continues linearly in the C-terminal direction until reaching hERG residue 582. We omitted hERG residues 583 through 610, as this corresponds to a “turret” unique to hERG (Jiang et al., 2005), so as to maintain alignment of the highly conserved pore regions downstream. After the turret, rKv1.2 residue 360 is aligned with hERG residue 611, and the sequence continues linearly to the end of the model.
For the closed-state MlotiK1 model, MlotiK1 residue 94 corresponds to hERG residue 515. Again, the turret was deleted from the sequence. hERG residue 611 then aligns with MlotiK1 residue 161 and continues linearly to the end of the modeled region.
After mutation in SYBYL, we manually torsioned side chains to relieve clashes with the backbone fixed. We added all hydrogens and Gasteiger-Hückel charges and performed energy minimization using the Tripos force field in SYBYL, first using the Simplex minimization, followed by the Powell conjugate gradient method (Powell, 1977) for 100 cycles. At this point, the model was visually inspected for side chain clashes. If none was seen, further energy minimization was performed using the Powell conjugate gradient method until either the gradient change reached 0.05 kcal/Å·mol or 10,000 iterations were complete. A final visual check of the energy-minimized model verified that no major conformational distortions were present. All figures were generated in PyMol (DeLano Scientific).
A model based on the Streptomyces lividans potassium channel (KcsA; PDB ID 1BL8) coordinates was also constructed and found to be in close agreement with the MlotiK1 model (see Supplemental Materials and methods and Figs. S1–S4, available at http://www.jgp.org/cgi/content/full/jgp.200810083/DC1).
Online Supplemental Material
Supplemental material includes six figures, several PDB files, one table, and a document detailing methods for the construction of the KcsA-based homology model. Figs. S1–S4 show views of the KcsA-based homology model of the closed state for comparison with the MlotiK1-based homology models shown in the paper. Specifically, Fig. S1 illustrates the native side chain locations of constitutively conducting mutants (compare with Fig. 2). Fig. S2 shows the location of the native V659 side chain (compare with Fig. 4). Fig. S3 shows locations of native A661 and I663 side chains (compare with Fig. 5). Fig. S4 displays the locations of the native G657 and N658 side chains. Fig. S5 shows deactivating tail currents for S6 mutants in wild-type background, demonstrating similar phenotypes to those in the S620T background. Table S1 presents the average deactivation time constants derived from a bi-exponential fit for these mutants. Fig. S6 demonstrates reduction of constitutive conductance in V659 after CnErg-1 application. PDB files containing the coordinates for each of the homology models (based on KcsA, rKv1.2, and MlotiK1) are included. The online supplemental material is available at http://www.jgp.org/cgi/content/full/jgp.200810083/DC1.
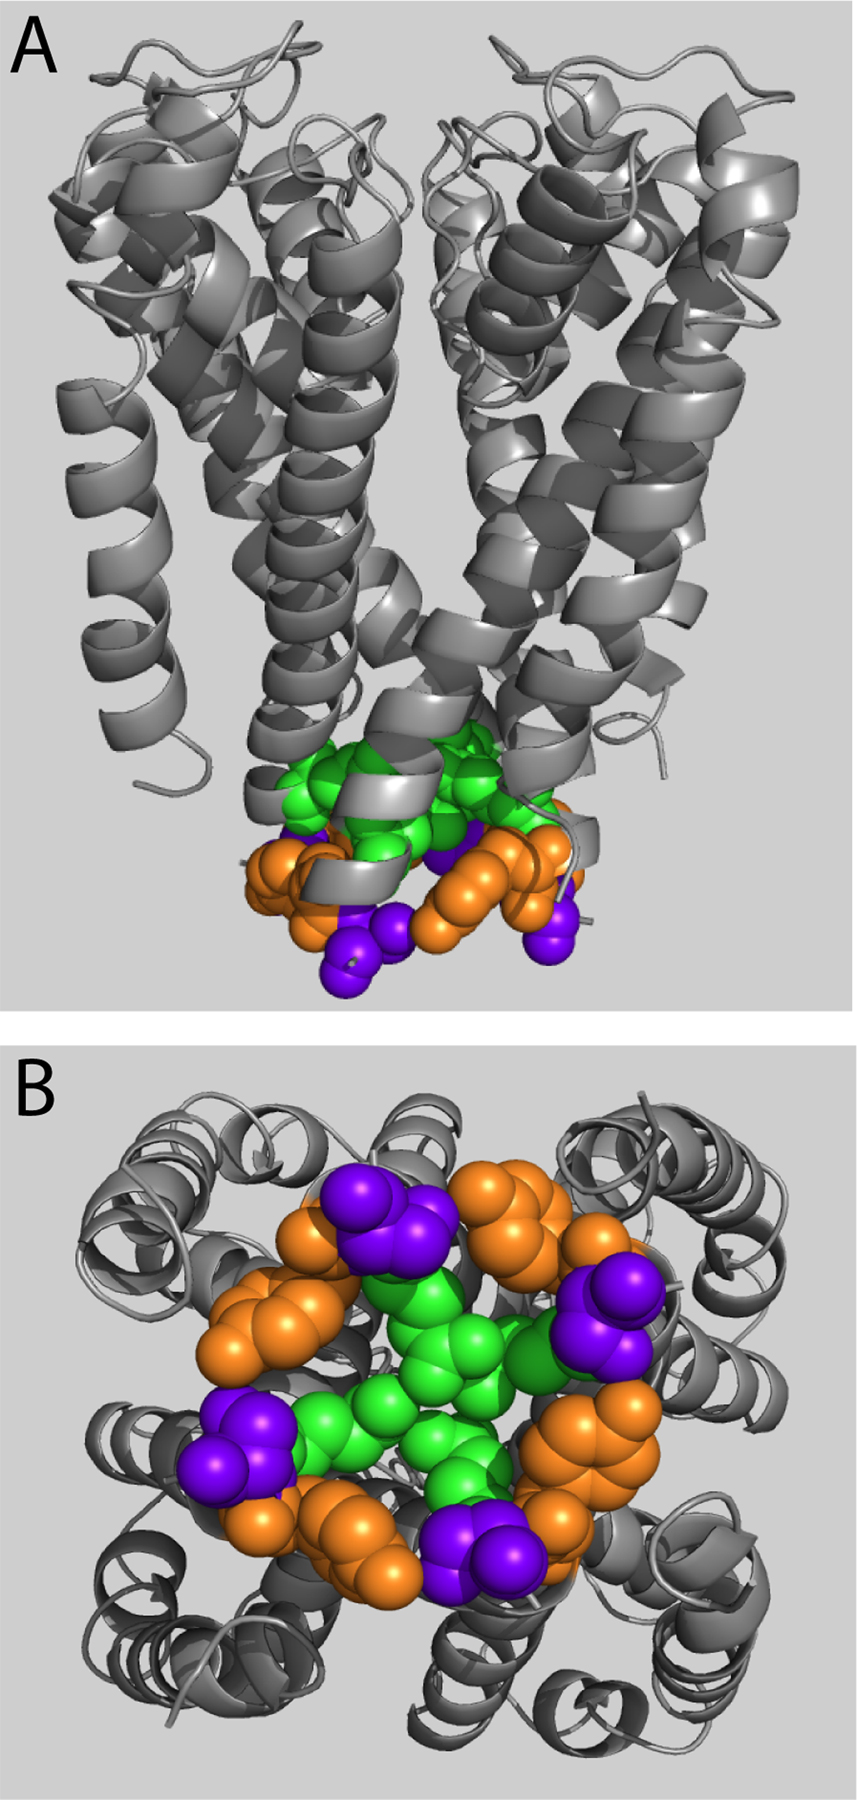
Figure 2.

Constitutively conducting S6 mutants. (A) Conductance–voltage relations for constitutively conducting S6 mutants Q664C, Y667C, and S668C illustrate steady-state current at negative potentials where the channels are normally closed (n = 3–10). Tail currents were normalized as described in Materials and methods to produce G/Gmax. Points are means ± SEM. (B) Scaled tail currents evoked at −100 mV after a step to +60 mV show constitutively conducting mutant channels deactivate more slowly than control channels. Dotted line indicates zero current level. (C) Average deactivation time constant (see Materials and methods) as a function of voltage for constitutive conductors. (D–G) Homology modeling of constitutively conducting mutants reveals a domain of clustered amino acid side chains. Backbone α-helix is represented as gray ribbon; native side chains of affected residues are represented as space-filled spheres, with Q664 in green, Y667 in orange, and S668 in purple. S1–S4 domains have been omitted from the model views for clarity. (D) Model of hERG based on rKv1.2 (open state) in membrane cross-sectional view. (E) Model of hERG based on MlotiK1 (closed state) in membrane cross-sectional view. (F) Model of hERG based on Kv1.2 (open state) viewed from the cytosol. (G) Model of hERG based on MlotiK1 (closed state) viewed from the cytosol. (H) Amplitude of slow and fast time constants of deactivation for constitutively conducting mutants. (I) Application of CnErg-1 reduces the level of hERG constitutive conductance in Q664C, Y667C, and S668C.
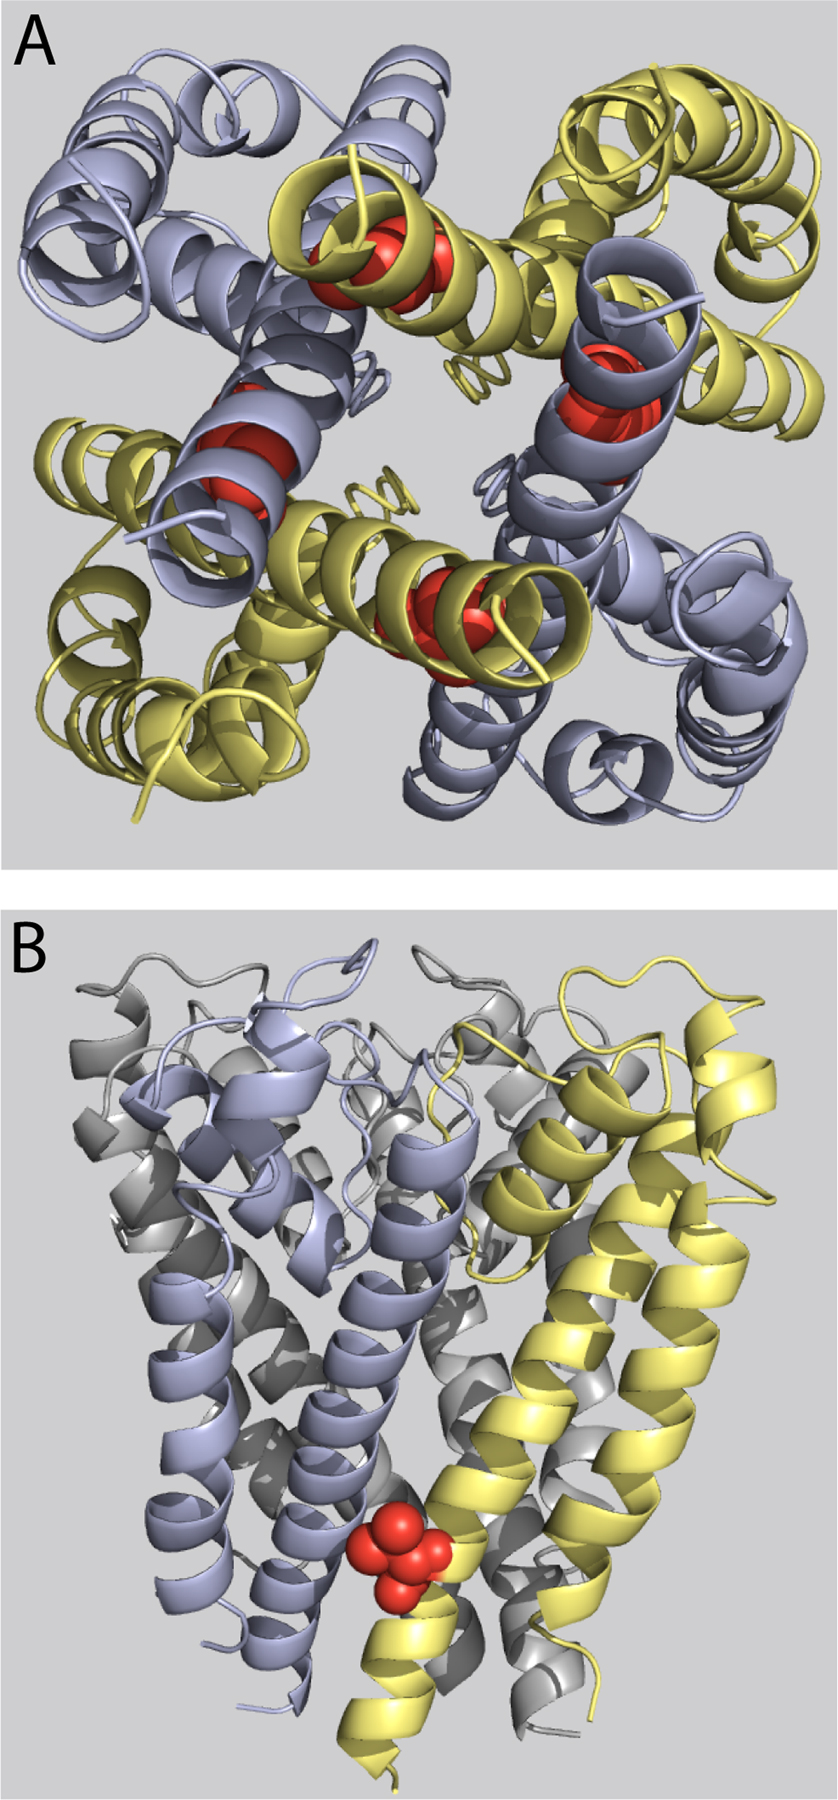
Figure 4.

Homology modeling of native V659 side chain orientation in closed and open states. (A) View from the cytoplasm of the open state homology model, illustrating V659 at the intersection of adjacent S6 domains and near the bundle crossing. The native V659 side chain is represented as red space–filled spheres, whereas the backbone α-helix is represented as either light blue or tan ribbon. For clarity, the S1–S4 domains are not shown. (B) View from the cytoplasm of the closed state homology model, with the V659 side chain near S6 domain and the S4-S5 linker. (C) Close-up view of the pocket surrounding the V659 side chain in the open state, tilted forward relative to views in A and B ∼45° about the S4-S5 linker. (D) Close-up view of the pocket surrounding the V659 side chain in the closed state.
Figure 5.

A661C and I663C primarily affect activation time course. (A) Conductance versus voltage relations for A661C and I663C. (B) Current traces of slowly activating mutant channels A661C and I663C. Traces were evoked by a depolarizing pulse to +40 mV from a holding potential of −80 mV. Dashed line indicates zero current level. (C) Time constants of activation over the range of voltages tested. Activation traces as in B were fit with a single exponential function, ignoring initial sigmoidicity so as to capture the kinetics of the final closed to open transition. n = 8–10 for each data point. The activation time constant is voltage dependent and slower over the range of voltages. (D) Cross-sectional membrane view showing A661 (orange) and I663 (green) side chains based on the closed-state MlotiK1 homology model. (E) View from the cytoplasm of the closed-state MlotiK1 homology model, illustrating the proximity of A661 and I663 side chains from neighboring subunits. (F) Close-up view shows A661 and I663 side chain interaction in the closed state. (G) Cross-sectional membrane view of A661 and I663 in the open-state rKv1.2 homology model. (H) View of A661 and I663 from the cytoplasm in the open state. (I) Close-up view of A661 and I663 in open state.
RESULTS
We used cysteine mutagenesis to identify important gating residues within the hERG S6 domain. 15 residues, S654 through S668, were selected because they encompass and extend beyond a region homologous to residues critical for activation gating in Shaker-related channels (Fig. 1, B and C) (Liu et al., 1997; Kitaguchi et al., 2004). All 15 cysteine mutants, expressed in an inactivation-removed background (see Materials and methods), formed functional channels as determined by two-electrode voltage clamp of currents expressed in Xenopus oocytes. In general, the lower S6 region was highly sensitive to cysteine mutagenesis as indicated by perturbation of gating (Tables I–IV). 10 of the 15 mutants were biased toward the open state as demonstrated by slowed deactivation, negatively shifted voltages of half-maximal activation (V1/2), or the presence of a “standing conductance” reflecting significant open-state occupancy at negative potentials. Four mutants were also examined in a wild-type background and exhibited effects on deactivation consistent with their inactivation-removed counterparts (Fig. S5 and Table S1, which are available at http://www.jgp.org/cgi/content/full/jgp.200810083/DC1).
TABLE I.
Deactivation Values at −100 mV
| Channel | τfast (ms) | τslow (ms) | τaverage (ms) | n |
|---|---|---|---|---|
| Ctrl | 64.3 ± 3.1 | 254.7 ± 10.3 | 123.9 ± 6.1 | 9 |
| S654C | 84.4 ± 5.2a | 486.5 ± 38.9b | 285.5 ± 41.4b | 6 |
| I655C | 139.4 ± 4.9b | 734.5 ± 22.8b | 504.8 ± 21.8b | 10 |
| F656C | 71.8 ± 14.1 | 259.4 ± 60.1 | 107.2 ± 7.1 | 3 |
| G657C | 14.8 ± 1.3b | 104.5 ± 12.9b | 40.5 ± 4.3b | 6 |
| N658C | 5.5 ± 0.03b | 51.1 ± 2.9a | 11.7 ± 1.5b | 5 |
| V659C | 113.6 ± 6.4b | 1,084.9 ± 40.7b | 798.6 ± 62.9b | 5 |
| S660C | 49.3 ± 3.6a | 142.7 ± 8.7b | 107.9 ± 2.5b | 3 |
| A661C | 91.1 ± 6.5a | 321.9 ± 24.7b | 188.1 ± 15.3b | 6 |
| I662C | 92.9 ± 2.7a | 506.2 ± 75.1b | 400.4 ± 70.2b | 6 |
| I663C | 112.3 ± 5.4b | 394.9 ± 15.5b | 258.9 ± 13.7b | 9 |
| Q664C | 106.6 ± 8.2b | 1,044.4 ± 67.2b | 764.9 ± 69.2b | 6 |
| R665C | 81.8 ± 16.8 | 319.7 ± 71.8b | 147.3 ± 16.8 | 4 |
| L666C | 71.8 ± 13.1 | 147.2 ± 4.7b | 99.4 ± 8.0a | 6 |
| Y667C | 138.7 ± 7.7b | 802.9 ± 56.5b | 627.03 ± 67.6b | 8 |
| S668C | 197.9 ± 25.5b | 1,809.7 ± 118.2b | 1,489.3 ± 85.6a | 13 |
Values reported were obtained by double exponential fits to deactivating current traces (see Materials and methods). Values are ± SEM.
P < 0.05.
P < 0.001.
TABLE II.
Parameters from Fits to V659 Mutant Recordings
| Channel | Average Deactivation τ at −100 mV |
V1/2 | ΔV1/2 | z | Δz | n |
|---|---|---|---|---|---|---|
| Ctrl | 123.9 ± 6.1 | −30.3 ± 0.9 | n/a | 2.4 ± 0.2 | n/a | 3–11 |
| V659A | 850.9 ± 83.3a | −30.8 ± 19.4 | +0.5 | 0.38 ± 0.08a | −2.03 | 4 |
| V659C | 765.6 ± 53.4a | −23.8 ± 1.9b | +6.5 | 1.11 ± 0.1b | −1.30 | 3 |
| V659F | 891.1 ± 62.5a | −14.7 ± 3.2b | +15.4 | 1.13 ± 0.17b | −1.27 | 3 |
| V659Ic | 489.8 ± 81.7a | −36.6 ± 0.3 | −6.3 | 2.65 ± 0.07b | +0.25 | 3 |
| V659T | 1,110.6 ± 235.1a | −2.3 ± 4.7a | +28.0 | 0.85 ± 0.14b | −1.56 | 3 |
Values are ± SEM.
P < 0.001.
P < 0.05.
Fit with an empirical double Boltzmann function. Values corresponding to the first function are reported.
TABLE III.
Activation Values
| Channel | τ+20 | n | τ+40 | n | τ+60 | n |
|---|---|---|---|---|---|---|
| Ctrl | 95.6 ± 6.2 | 8 | 62.5 ± 3.7 | 8 | 49.9 ± 2.9 | 8 |
| S654C | 82.7 ± 2.7 | 7 | 52.9 ± 1.2a | 6 | 46.9 ± 2.9 | 6 |
| I655C | 91.4 ± 1.9 | 11 | 61.1 ± 1.9 | 11 | 46.8 ± 2.1 | 11 |
| F656C | 110.5 ± 10.2 | 4 | 71.4 ± 6.6 | 4 | 65.6 ± 4.9a | 4 |
| G657C | 30.4 ± 1.2b | 13 | 24.7 ± 0.96b | 13 | 22.4 ± 0.72b | 13 |
| N658C | 46.29 ± 1.8b | 5 | 35.1 ± 2.0a | 5 | 28.8 ± 1.8b | 5 |
| V659C | 84.6 ± 4.7 | 3 | 58.8 ± 3.4 | 3 | 50.6 ± 4.9 | 3 |
| S660C | 104.2 ± 4.7 | 5 | 69.9 ± 3.4 | 5 | 54.0 ± 2.5 | 5 |
| A661C | 299.2 ± 7.6b | 10 | 169.1 ± 5.4b | 10 | 114.8 ± 4.2b | 10 |
| I662C | 41.2 ± 0.9b | 12 | 29.3 ± 0.5b | 12 | 22.6 ± 0.4b | 12 |
| I663C | 277.7 ± 8.5b | 10 | 159.8 ± 4.6b | 10 | 110.5 ± 2.3b | 10 |
| Q664C | 117.3 ± 13.0 | 7 | 68.2 ± 6.5 | 7 | 54.8 ± 4.2 | 8 |
| R665C | 66.9 ± 4.6a | 6 | 40.7 ± 2.9b | 6 | 32.3 ± 4.3a | 5 |
| L666C | 94.1 ± 3.2 | 17 | 57.9 ± 1.8 | 17 | 42.4 ± 1.2a | 17 |
| Y667C | 113.4 ± 4.5b | 14 | 70.6 ± 2.4 | 14 | 54.3 ± 2.4 | 14 |
| S688C | 68.2 ± 2.9b | 17 | 43.8 ± 2.3b | 17 | 34.6 ± 2.0b | 17 |
Values are derived from single exponential functions fit to activating current traces (see Materials and methods). Values are ± SEM.
P < 0.05.
P < 0.001.
TABLE IV.
Parameters from Boltzmann Fits to G-V Relations
| Channel | V1/2 | ΔV1/2 | z | Δz | n |
|---|---|---|---|---|---|
| Ctrl | −30.3 ± 0.9 | n/a | 2.4 ± 0.2 | n/a | 3–11 |
| S654C | −33.3 ± 0.6a | −2.0 | 2.3 ± 0.12 | −0.11 | 7 |
| I655C | −30.9 ± 0.9 | −0.6 | 1.82 ± 0.11a | −0.59 | 11–12 |
| F656C | −28.0 ± 0.6 | +2.3 | 1.99 ± 0.09 | −0.41 | 5 |
| G657Cb | −67.6 ± 0.5c | −37.3 | 2.70 ± 0.24 | −0.30 | 5 |
| N658C | −3.38 ± 0.9c | +26.9 | 1.58 ± 0.09a | −0.83 | 3 |
| V659C | −23.8 ± 1.9a | +6.5 | 1.11 ± 0.10a | −1.30 | 3 |
| S660C | −27.6 ± 1.0 | +2.7 | 1.99 ± 0.15 | −0.41 | 4 |
| A661C | −8.6 ± 0.5c | +21.7 | 1.97 ± 0.07a | −0.43 | 7 |
| I662C | −44.5 ± 1.5c | −14.2 | 1.70 ± 0.15a | −0.71 | 11 |
| I663C | −7.7 ± 0.6c | +22.6 | 1.94 ± 0.08a | −0.46 | 9 |
| Q664C | −22.8 ± 0.5a | +7.5 | 2.38 ± 0.11 | −0.02 | 3–6 |
| R665Cb | −30.5 ± 0.4 | −0.20 | 2.9 ± 0.16a | +0.07 | 4 |
| L666C | −32.2 ± 0.8 | −1.9 | 2.46 ± 0.16 | +0.05 | 3–11 |
| Y667C | −36.9 ± 0.4a | −6.6 | 2.47 ± 0.08 | +0.06 | 3 |
| S668Cb | −44.4 ± 1.7c | −14.1 | 2.93 ± 0.58 | +0.53 | 15 |
Values are derived from Boltzmann fits to steady-state activation data (see Materials and methods). Values are ± SEM.
P < 0.05.
Fit with an empirical double Boltzmann function (see Materials and methods). Values corresponding to the first function are reported.
P < 0.001.
S6 Mutations Conferring Constitutive Conductance
Among the most striking phenotypes were observed with the Q664C, Y667C, and S668C mutants, which exhibited a standing conductance at negative potentials in G-V curves generated by normalized, extrapolated tail currents after 1-s pulses to a range of voltages (Fig. 2 A; see Materials and methods). This conductance was attributed to hERG channels, as opposed to leak, based on its sensitivity to the ERG-specific toxin CnErg-1 (see below). In each case, the S6 domain remained closely coupled with the voltage sensor as the G-V curves exhibited steep voltage dependence. Activation rates were relatively unchanged (Table III), but deactivation time constants increased up to 10-fold, reflecting much slower closing rates compared with control (Fig. 2, B and C, and Table I). Thus, although the activation gate remains coupled to the movement of gating charge, these mutants allow conduction at negative voltages.
To evaluate the physical relationships of the corresponding native residues, we generated energy-minimized models based on crystal structures for rKv1.2 for the open state (Long et al., 2005a, 2005b) and MlotiK1 for the closed state (Clayton et al., 2008). Q664, Y667, and S668 side chains are positioned intracellularly with respect to the S4-S5 linker in both the open and closed states, placing them below the “bundle crossing” defined by rKv1.2 structure (Fig. 2, D and E, respectively; compare with Fig. 1 A). In the open state, the three residues are in close proximity within each subunit, radiating outward from the pore axis (Fig. 2, D and F). In the closed state, Y667 and S668 from adjacent subunits are in contact, forming a ring from which the Q664 side chains extend toward the pore axis and come into close apposition (Fig. 2, E and G). The positions of these residues in a closed-state model based on the KcsA crystal structure are nearly indistinguishable, lending credence to our model (see Online supplemental material). Together with similarities in the cysteine mutant phenotypes, the modeling results suggest that Q664, Y667, and S668 form a functional microdomain involved in channel gating.
Despite the similarities in deactivation and predicted physical proximity, we did observe differences among the constitutive conductors. The mutants showed differences in the values for fast and slow deactivation time constants and the relative amplitudes for each component (Table I and Fig. 2 H). In this regard, Q664C and Y667C were quantitatively more alike than either was to S668C, which was the most extreme. However, the midpoint of the Boltzmann fit for Q664C was shifted by 7.5 mV relative to control, whereas the V1/2's for Y667C and S668C were shifted in the opposite direction, by −7 and −14 mV, respectively (Table IV). Thus, there are differences in the mutant phenotypes, but these may reflect differences in tolerance for the cysteine mutation rather than an indication of functional differences among the native residues. Alternatively, the mutations may have different effects on transitions in the gating pathway, the resolution of which will require more detailed kinetic measurements and modeling.
To confirm that constitutive conductance was attributable to the expressed hERG channels, rather than general oocyte membrane leak, we applied the Erg-specific toxin CnErg-1 to mutant channels. For these measurements, we increased extracellular [K+] to 20 mM to evoke greater holding current levels, allowing for more accurate measurements of the differences in constitutive conductance before and after toxin application. Application of ∼100 nM CnErg-1 reduced constitutive conductance in Q664C, Y667C, and S668C channels (Fig. 2 I). The range of conductances was greater in this experiment because data points were not excluded for high “leak” as they were for the G-V curves in Fig. 2 A. These measurements show a range of standing conductances at −80 mV in the order S668C > Y667C > Q664C > control.
V659 Defines a Functionally Unique S6 Position
A distinct but equally dramatic phenotype was observed for mutations at V659. The V659C G-V relationship exhibited a marked reduction in slope and less pronounced saturation at the voltage extremes (Fig. 3 A, red). Like Q664, Y667, and S668, V659C also exhibited a constitutive conductance that was abolished by CnErg-1 application (Fig. S6, which is available at http://www.jgp.org/cgi/content/full/jgp.200810083/DC1). The V659C mutation had little effect on the activation time constant (Table III), but slowed deactivation dramatically (Fig. 3, B and C).
Figure 3.

V659 couples voltage sensing and gating. (A) Conductance–voltage relation for V659C mutant fit with a Boltzmann equation reveals constitutive conductance over negative potentials and shallower slope (z). (B) Scaled V659C tail currents evoked at −100 mV after a pulse to +60 mV show dramatically slowed deactivation. Dotted line indicates zero current level. (C) Plot of time constants obtained from fits to deactivating currents on a log scale plotted as a function of voltage for V659C. (D) Steady-state current versus voltage relations for a variety of substitutions made at V659. Mutations to A, F, or T were fit with a standard Boltzmann function and show constitutive conductance and shallower slope. V659I shows an intermediate phenotype that was fit with a double Boltzmann equation (see Materials and methods). n = 3–5 for each data point. (E) Scaled V659 mutant tail currents evoked at −100 mV after pulses to +60 mV. (F) Average deactivation time constants on a log scale versus voltage for V659 mutants. n = 3–5 for each data point. (G) Deactivation time constants versus side chain volume for V659 mutants. Amino acids with side chains significantly larger or smaller than the native valine show slowed deactivation. Nonfunctional mutants (V659D, V659K, V659N, and V659P) are included as open triangles above the line at the top of the y axis at appropriate side chain volume. Side chain volume obtained from Zamyatnin (1972). (H) Deactivation time constant versus hydrophobicity of side chains substituted at V659. Nonfunctional mutants (V659D, V659K, V659N, and V659P) are included as open triangles at the top of the y axis at the x axis location of appropriate hydrophobicity. Hydrophobicity scale adapted from Black and Mould (1991).
V659 is located just short of one full helical turn to the intracellular side of F656, a key drug-binding residue (Lees-Miller et al., 2000; Mitcheson et al., 2000a). V659 maps one residue upstream from Shaker V478, which is a critical constituent of the gate (Liu et al., 1997; Kitaguchi et al., 2004). Interestingly, mutagenesis of S660, which is precisely in register with V478 based on our alignment, had little effect on hERG gating (Fig. 1, A and C, and Tables I–IV). Because of its proximity to the gate in Shaker-related channels, we performed more extensive mutagenesis together with modeling to determine whether V659 might contribute to the gate. Substituents were chosen because they encompass a wide range of amino acid physical properties, with variations in side chain size, polarity, charge, and hydrophobicity. With the exception of the conservative isoleucine substitution, all other functional mutations at V659 caused a shallow G-V slope much like V659C (Fig. 3 D and Table II). These mutants also exhibited slow deactivation and constitutive conductance (Fig. 3, D–F, and Table II). A plot of average deactivation time constant as a function of side chain hydrophobicity (Black and Mould, 1991) or volume (Zamyatnin, 1972) shows this site has little tolerance for perturbation, with isoleucine conferring an approximately fivefold slowing and the other mutants an ∼10-fold slowing of deactivation (Fig. 3, G and H). No currents were observed with substitution of the polar asparagine, the charged aspartic acid or lysine, or the helix-breaking proline; it is unknown whether these mutants assemble and traffic to the surface. We conclude that closing the hERG channel involves a highly constrained movement of the V659 side chain into a hydrophobic space of defined size.
To model the position of the native V659 side chain in the open and closed states, we mapped V659 in energy-minimized models based on crystal structures of rKv1.2 and MlotiK1, respectively. In neither state does the V659 side chain extend into the pore where it could obstruct ion flow (Fig. 4, A and B). In cross-sectional views, V659 is situated just above the S4-S5 linker (Fig. 4, C and D, red sphere, inset). In a close-up view of the open-state model, the V659 side chain lies in a pocket formed by the S5 and S6 domains and S4-S5 linker of the same subunit (blue), and the S6 domain of the adjacent subunit (Fig. 4 C, tan). In the closed state, V659 is packed more tightly among these domains, which nearly bury the side chain (Fig. 4 D). This tight pocket comprises L550 in S5 and Y542 in the S4-S5 linker on the same subunit, and L650 in S6 from the neighboring subunit. The models do not favor a role for V659 as a pore-occluding gating element, but they are consistent with the functional data, reflecting conformational changes in which the V659 side chain moves upon closing into a constrained, hydrophobic pocket formed by S6, S5, and the S4-S5 linker.
Mutations Affecting Both Activation and Deactivation
Interspersed between sites involved in deactivation are residues that affect both activation and deactivation. A661C and I663C exhibit indistinguishable phenotypes, slowing activation by twofold and shifting the G-V relationship by ∼22 mV (Fig. 5, A–C, and Tables III and IV). The increase in sigmoidicity at the beginning of activation traces suggests that mutation at these sites affects a rate-limiting step in the activation pathway. Deactivation is also affected, but to a lesser extent (Table I). On the S6 α helix, A661 and I663 from neighboring subunits interact in the closed state model (Fig. 5, D–F). In the open state, there is no apparent interaction, nor is there any interaction with other residues in common (Fig. 5, G–I). Perhaps the closed-state interaction of the native A661 and I663 promotes activation, such that its disruption causes a slowing of channel opening.
Adjacent residues G657C and N658C exhibited distinct G-V characteristics but similar kinetic phenotypes. The G-V curve was positively shifted for N658C and required a double Boltzmann fit for G657C (Fig. 6 A and Table IV). Both showed an increase in apparent rate of activation (Fig. 6, B and C, and Table III) and deactivation (Fig. 6, D and E, and Table I). The similar phenotypes exhibited by these cysteine mutants likely relate more to their linkage as adjacent residues because there are no obvious common side chain interactions in the molecular models (Fig. 6, F–I). Like V659, these residues correspond to the region critical for gating in Shaker channels (Fig. 1 C), and the phenotypes indicate that mutations on all sides of the helix in this region have considerable impact on gating.
Figure 6.

G657C and N658C affect both activation and deactivation. (A) Conductance versus voltage relations for G657C and N658C. An empirical double Boltzmann relation was required to fit the curve for G657C (See Materials and methods). (B) Exemplar G657C and N658C currents evoked at +40 mV from a holding potential of −80 mV. (C) Voltage dependence of G657C and N658C activation time constants. (D) Exemplar deactivation traces at −100 mV after a pulse to +40 mV. (E) Average deactivation time constants versus voltage. (F) Closed-state homology model of the closed state shows G657 (blue) and N658 (red) located next to each other in the vestibule. (G) A view from the cytoplasm shows the side chains' proximity to one another. (H) Open-state homology model cross-sectional membrane view shows G657 and N658 at the level of the S4-S5 linker. (I) View of G657 and N658 from the cytoplasm in the closed state.
Mutations with Minor Effects on Gating
Among the mutant channels tested, S654C, F656C, S660C, R665C, and L666C showed only minor changes in steady-state and kinetic measurements (Tables I, III, and IV). In both open- and closed-state models, the native side chains at these locations populated all sides of the S6 helix and traversed the length of the mutated region, above and below the predicted bundle crossing and position of the S4-S5 linker. Little effect on the opening or closing transition was observed for the cysteine mutation at F656, a key drug-binding residue (Lees-Miller et al., 2000), consistent with this side chain residing relatively unconstrained in the channel vestibule. Cysteine mutagenesis of the charged R665, implicated in electrostatic interactions with the S4-S5 linker of a hERG-EAG chimera (Tristani-Firouzi et al., 2002), caused changes that are statistically significant but minor relative to other perturbations in the region.
Summary of Kinetic and Steady-state Phenotypes
In general, deactivation was more sensitive than activation to S6 cysteine mutagenesis. As summarized in Fig. 7, deactivation was slowed by more than 10-fold over control (Fig. 7 A and Table I), compared with less than twofold change in activation (Fig. 7 B and Table III). In all but two mutants with large perturbations, deactivation was slowed. The exceptions were N658C and G657C, the latter exhibiting properties consistent with those previously reported for G657A (Hardman et al., 2007). Differences in deactivation between the cysteine mutants and control at nearly every position were statistically significant (Table I). Steady-state conductance voltage curves showed a concomitant shift for some of the mutants (Fig. 7 C and Table IV), but overall there was a lack of correspondence between kinetic changes and V1/2, not unexpected from a channel with gating between more than two states (see Discussion).
Figure 7.

Summary of kinetics and equilibrium measurements. (A) Fold change from control for average deactivation time constants measured at −100 mV. Mutants are aligned vertically with residues at the top of the graph representing those closest to the selectivity filter, and residues at the bottom representing those closest to the intracellular face of the pore. (B) Fold change from control for activation time constants measured at +40 mV. Mutants are represented vertically as in A. (C) Change in V1/2 compared with control. *, P < 0.05.
DISCUSSION
We analyzed hERG S6 mutants for effects on gating and evaluated electrophysiological data in the context of energy-minimized models based on crystal structures of rKv1.2 and MlotiK1. In general, channel closing was more sensitive than opening to perturbation with respect to both the numbers of S6 residues affected and the magnitude of the effects. Perturbation of residues on all sides of the S6 helix altered gating, but residues at two sites, termed “microdomains,” emerged as critical for normal transitions between the closed and open states. Cysteine mutation of one microdomain defined by Q664C, Y667C, and S668C showed normal voltage sensitivity and in the closed-state molecular model formed a ring from which the Q664 side chain of each subunit protrudes to occlude the pore. The ring formed by these side chains is more than two full helical turns intracellular to the predicted bundle crossing in S6 and site of the gate in Shaker-related Kv channels. Mutations at V659, near the bundle crossing, also elicited a constitutive conductance at negative potentials and slowed deactivation, but were unique in dramatically reducing the slope of the G-V relation.
The result that deactivation is much more sensitive than activation, together with the observed shifts in V1/2 of the G-V relations, indicate that the majority of lower S6 mutations confer an increased energy requirement on closing. Mutations could slow deactivation without changing activation by stabilizing the open state, or by elevating the energy barrier between the open and most proximal closed state as long as this barrier is not rate limiting for the forward transitions between closed states in the activation pathway. In some cases, mutations slowed deactivation and shifted V1/2 in a negative direction, consistent with a stabilization of the open state. In others, a similar slowing of deactivation was accompanied by positive V1/2 shifts. Even when the direction of the shift was consistent, the magnitude of the shift in voltage dependence for the deactivation kinetics was often much greater than that for the steady-state G-V relation, reflecting complexities in gating transitions not decipherable from our macroscopic current measurements.
Neither S660 nor V659 seems likely to contribute to the occluding gate in hERG channels, despite their proximity by alignment with gate residues in Shaker. However, V659 is crucial for gating. V659 was remarkably sensitive to perturbation by a range of residues with different hydropathy profiles and sizes, such that closing is easily disrupted by substitutions that are either too large or too small. Molecular modeling is consistent with the functional data, showing this side chain buried in a hydrophobic pocket in the closed state. The pocket is formed by residues from S6, S5, and the S4-S5 linker, which communicates movements of the S4 voltage sensor to the channel gate (Lu et al., 2002; Long et al., 2005b; Ferrer et al., 2006). In light of the potential contact between V659 and the S4-S5 linker, the reduced slope of the G-V curve with a wide range of V659 substitutions suggests that the coupling between the voltage sensor and the activation gate may be diminished in these mutants. Previous studies in Kv channels have shown that selectively affecting the equilibrium between two states in the multistate activation pathway can change the G-V slope (Schoppa et al., 1992). Yifrach and MacKinnon (2002) demonstrate how such alterations specifically at the step of the final concerted opening can result in changes in slope. Differences in slope need not be accompanied by changes in activation rate if that rate is determined by the energy barrier of a transition earlier in the activation pathway. Whether V659 mediates interactions between the S4-S5 linker and the S6 region critical for activation gating will require further study.
How the channel closes may be quite different for hERG compared with other voltage-gated potassium channels studied to date. This may not be surprising given that the hERG primary sequence lacks the proline that creates the “kink” in the Shaker S6 gate region (del Camino et al., 2000; Mitcheson et al., 2000b) and thus may have significant structural differences. Cysteine mutations along S6 at more intracellular positions, Q664, Y667, and S668, elicited a constitutive conductance. If Q664, a polar amino acid, occludes the pore as the model suggests, it would form a steric barrier rather than a hydrophobic seal as observed for Kv channels (Sukhareva et al., 2003; Kitaguchi et al., 2004). Mutations at this site evoking constitutive conductance may cause the channel to reopen at negative potentials or increase the conductance (leakiness) of the closed state (Soler-Llavina et al., 2003). We do not know whether the 20–30% standing conductance reflects a stable open probability because oocytes with >30% leak were excluded in those experiments. Indeed, many more oocytes expressing constitutive conductors compared with control were discarded owing to excessive leakiness. All three residues are well below (intracellular to) the predicted bundle crossing and position at which the S4-S5 linker is expected to encircle the S5 and S6 helices (compare with Fig. 1 A) (Long et al., 2005a, 2005b). At this position, collectively they are within one amino acid residue of the region homologous to the C-linker of the HCN channel, which links cyclic nucleotide binding to the activation gate (Flynn and Zagotta, 2003) and forms a larger “gating ring” below the hydrophobic core of the channel (Johnson and Zagotta, 2005). Mutations at these residues in hERG could perturb a link between its activation gate and a region homologous to the cyclic nucleotide-binding domain, the role of which remains uncertain in hERG channels. Alternatively, Q664, Y667, and S668 may form the actual gate at more than a full helical turn beyond that predicted for Shaker channels (compare with Fig. 1 A). Such a model is consistent with speculation of a larger hERG vestibule accommodating a wide range of compounds and thus contributing to acquired long QT syndrome.
Supplementary Material
Acknowledgments
We thank Drs. Meyer Jackson and Cynthia Czajkowski for critically reading the manuscript. We thank Drs. Brian Smith, Andrew Harris, Baron Chanda, Mathew Jones, and members of the Robertson laboratory for helpful discussions, and Erin McCarthy for technical assistance.
This work was supported by the National Institutes of Health grant HL081780 (to G.A. Robertson), an American Heart Association pre-doctoral fellowship (to S.L. Wynia-Smith), and the UW-Madison Program in Translational Cardiovascular Science (T32 HL07936).
Edward N. Pugh Jr. served as editor.
A.L. Gillian-Daniel's present address is Dept. of Biochemistry, University of Wisconsin-Madison, Madison, WI 53706.
Abbreviations used in this paper: CnErg-1, Centruroides noxius Erg-specific toxin; hERG, human ether-à-go-go–related gene; KcsA, Streptomyces lividans potassium channel; PDB, Protein Data Bank.
References
- Black, S.D., and D.R. Mould. 1991. Development of hydrophobicity parameters to analyze proteins which bear post- or cotranslational modifications. Anal. Biochem. 193:72–82. [DOI] [PubMed] [Google Scholar]
- Clayton, G.M., S. Altieri, L. Heginbotham, V.M. Unger, and J.H. Morais-Cabral. 2008. Structure of the transmembrane regions of a bacterial cyclic nucleotide-regulated channel. Proc. Natl. Acad. Sci. USA. 105:1511–1515. [DOI] [PMC free article] [PubMed] [Google Scholar]
- Curran, M.E., I. Splawski, K.W. Timothy, G.M. Vincent, E.D. Green, and M.T. Keating. 1995. A molecular basis for cardiac arrhythmia: HERG mutations cause long QT syndrome. Cell. 80:795–803. [DOI] [PubMed] [Google Scholar]
- del Camino, D., and G. Yellen. 2001. Tight steric closure at the intracellular activation gate of a voltage-gated K(+) channel. Neuron. 32:649–656. [DOI] [PubMed] [Google Scholar]
- del Camino, D., M. Holmgren, Y. Liu, and G. Yellen. 2000. Blocker protection in the pore of a voltage-gated K+ channel and its structural implications. Nature. 403:321–325. [DOI] [PubMed] [Google Scholar]
- del Camino, D., M. Kanevsky, and G. Yellen. 2005. Status of the intracellular gate in the activated-not-open state of shaker K+ channels. J. Gen. Physiol. 126:419–428. [DOI] [PMC free article] [PubMed] [Google Scholar]
- Doyle, D.A., J. Morais Cabral, R.A. Pfuetzner, A. Kuo, J.M. Gulbis, S.L. Cohen, B.T. Chait, and R. MacKinnon. 1998. The structure of the potassium channel: molecular basis of K+ conduction and selectivity. Science. 280:69–77. [DOI] [PubMed] [Google Scholar]
- Ferrer, T., J. Rupp, D.R. Piper, and M. Tristani-Firouzi. 2006. The S4-S5 linker directly couples voltage sensor movement to the activation gate in the human ether-a'-go-go-related gene (hERG) K+ channel. J. Biol. Chem. 281:12858–12864. [DOI] [PubMed] [Google Scholar]
- Ficker, E., W. Jarolimek, and A.M. Brown. 2001. Molecular determinants of inactivation and dofetilide block in ether a-go-go (EAG) channels and EAG-related K(+) channels. Mol. Pharmacol. 60:1343–1348. [DOI] [PubMed] [Google Scholar]
- Finlayson, K., H.J. Witchel, J. McCulloch, and J. Sharkey. 2004. Acquired QT interval prolongation and HERG: implications for drug discovery and development. Eur. J. Pharmacol. 500:129–142. [DOI] [PubMed] [Google Scholar]
- Flynn, G.E., and W.N. Zagotta. 2003. A cysteine scan of the inner vestibule of cyclic nucleotide-gated channels reveals architecture and rearrangement of the pore. J. Gen. Physiol. 121:563–582. [DOI] [PMC free article] [PubMed] [Google Scholar]
- Gomez-Varela, D., P. de la Pena, J. Garcia, T. Giraldez, and F. Barros. 2002. Influence of amino-terminal structures on kinetic transitions between several closed and open states in human erg K+ channels. J. Membr. Biol. 187:117–133. [DOI] [PubMed] [Google Scholar]
- Hackos, D.H., T.H. Chang, and K.J. Swartz. 2002. Scanning the intracellular S6 activation gate in the shaker K+ channel. J. Gen. Physiol. 119:521–532. [DOI] [PMC free article] [PubMed] [Google Scholar]
- Hancox, J.C., M.J. McPate, A. El Harchi, and Y.H. Zhang. 2008. The hERG potassium channel and hERG screening for drug-induced torsades de pointes. Pharmacol. Ther. 119:118–132. [DOI] [PubMed] [Google Scholar]
- Hardman, R.M., P.J. Stansfeld, S. Dalibalta, M.J. Sutcliffe, and J.S. Mitcheson. 2007. Activation gating of hERG potassium channels: S6 glycines are not required as gating hinges. J. Biol. Chem. 282:31972–31981. [DOI] [PubMed] [Google Scholar]
- Heginbotham, L., T. Abramson, and R. MacKinnon. 1992. A functional connection between the pores of distantly related ion channels as revealed by mutant K+ channels. Science. 258:1152–1155. [DOI] [PubMed] [Google Scholar]
- Herzberg, I.M., M.C. Trudeau, and G.A. Robertson. 1998. Transfer of rapid inactivation and sensitivity to the class III antiarrhythmic drug E-4031 from HERG to M-eag channels. J. Physiol. 511:3–14. [DOI] [PMC free article] [PubMed] [Google Scholar]
- Innis, M.A. 1990. PCR Protocols: A Guide to Methods and Applications. Academic Press, San Diego. 482 pp.
- Jiang, M., M. Zhang, I.V. Maslennikov, J. Liu, D.M. Wu, Y.V. Korolkova, A.S. Arseniev, E.V. Grishin, and G.N. Tseng. 2005. Dynamic conformational changes of extracellular S5-P linkers in the hERG channel. J. Physiol. 569:75–89. [DOI] [PMC free article] [PubMed] [Google Scholar]
- Johnson, J.P. Jr., and W.N. Zagotta. 2005. The carboxyl-terminal region of cyclic nucleotide-modulated channels is a gating ring, not a permeation path. Proc. Natl. Acad. Sci. USA. 102:2742–2747. [DOI] [PMC free article] [PubMed] [Google Scholar]
- Jones, E.M., E.C. Roti Roti, J. Wang, S.A. Delfosse, and G.A. Robertson. 2004. Cardiac IKr channels minimally comprise hERG 1a and 1b subunits. J. Biol. Chem. 279:44690–44694. [DOI] [PubMed] [Google Scholar]
- Kitaguchi, T., M. Sukhareva, and K.J. Swartz. 2004. Stabilizing the closed S6 gate in the Shaker Kv channel through modification of a hydrophobic seal. J. Gen. Physiol. 124:319–332. [DOI] [PMC free article] [PubMed] [Google Scholar]
- Lees-Miller, J.P., Y. Duan, G.Q. Teng, and H.J. Duff. 2000. Molecular determinant of high-affinity dofetilide binding to HERG1 expressed in Xenopus oocytes: involvement of S6 sites. Mol. Pharmacol. 57:367–374. [PubMed] [Google Scholar]
- Liu, Y., M. Holmgren, M.E. Jurman, and G. Yellen. 1997. Gated access to the pore of a voltage-dependent K+ channel. Neuron. 19:175–184. [DOI] [PubMed] [Google Scholar]
- Long, S.B., E.B. Campbell, and R. Mackinnon. 2005. a. Crystal structure of a mammalian voltage-dependent Shaker family K+ channel. Science. 309:897–903. [DOI] [PubMed] [Google Scholar]
- Long, S.B., E.B. Campbell, and R. Mackinnon. 2005. b. Voltage sensor of Kv1.2: structural basis of electromechanical coupling. Science. 309:903–908. [DOI] [PubMed] [Google Scholar]
- Lu, Z., A.M. Klem, and Y. Ramu. 2002. Coupling between voltage sensors and activation gate in voltage-gated K+ channels. J. Gen. Physiol. 120:663–676. [DOI] [PMC free article] [PubMed] [Google Scholar]
- Mitcheson, J.S., J. Chen, M. Lin, C. Culberson, and M.C. Sanguinetti. 2000. a. A structural basis for drug-induced long QT syndrome. Proc. Natl. Acad. Sci. USA. 97:12329–12333. [DOI] [PMC free article] [PubMed] [Google Scholar]
- Mitcheson, J.S., J. Chen, and M.C. Sanguinetti. 2000. b. Trapping of a methanesulfonanilide by closure of the HERG potassium channel activation gate. J. Gen. Physiol. 115:229–240. [DOI] [PMC free article] [PubMed] [Google Scholar]
- Pardo-Lopez, L., J. Garcia-Valdes, G.B. Gurrola, G.A. Robertson, and L.D. Possani. 2002. a. Mapping the receptor site for ergtoxin, a specific blocker of ERG channels. FEBS Lett. 510:45–49. [DOI] [PubMed] [Google Scholar]
- Pardo-Lopez, L., M. Zhang, J. Liu, M. Jiang, L.D. Possani, and G.N. Tseng. 2002. b. Mapping the binding site of a human ether-a-go-go-related gene-specific peptide toxin (ErgTx) to the channel's outer vestibule. J. Biol. Chem. 277:16403–16411. [DOI] [PubMed] [Google Scholar]
- Powell, M. 1977. Restart procedures for the conjugate gradient method. Math. Program. 12:241–254. [Google Scholar]
- Rich, T.C., S.W. Yeola, M.M. Tamkun, and D.J. Snyders. 2002. Mutations throughout the S6 region of the hKv1.5 channel alter the stability of the activation gate. Am. J. Physiol. Cell Physiol. 282:C161–C171. [DOI] [PubMed] [Google Scholar]
- Sanguinetti, M.C., C. Jiang, M.E. Curran, and M.T. Keating. 1995. A mechanistic link between an inherited and an acquired cardiac arrhythmia: HERG encodes the IKr potassium channel. Cell. 81:299–307. [DOI] [PubMed] [Google Scholar]
- Schoppa, N.E., K. McCormack, M.A. Tanouye, and F.J. Sigworth. 1992. The size of gating charge in wild-type and mutant Shaker potassium channels. Science. 255:1712–1715. [DOI] [PubMed] [Google Scholar]
- Shah, R.R. 2005. Drugs, QTc interval prolongation and final ICH E14 guideline: an important milestone with challenges ahead. Drug Saf. 28:1009–1028. [DOI] [PubMed] [Google Scholar]
- Snyders, D.J., and A. Chaudhary. 1996. High affinity open channel block by dofetilide of HERG expressed in a human cell line. Mol. Pharmacol. 49:949–955. [PubMed] [Google Scholar]
- Soler-Llavina, G.J., M. Holmgren, and K.J. Swartz. 2003. Defining the conductance of the closed state in a voltage-gated K+ channel. Neuron. 38:61–67. [DOI] [PubMed] [Google Scholar]
- Sukhareva, M., D.H. Hackos, and K.J. Swartz. 2003. Constitutive activation of the Shaker Kv channel. J. Gen. Physiol. 122:541–556. [DOI] [PMC free article] [PubMed] [Google Scholar]
- Tristani-Firouzi, M., J. Chen, and M.C. Sanguinetti. 2002. Interactions between S4-S5 linker and S6 transmembrane domain modulate gating of HERG K+ channels. J. Biol. Chem. 277:18994–19000. [DOI] [PubMed] [Google Scholar]
- Trudeau, M.C., J.W. Warmke, B. Ganetzky, and G.A. Robertson. 1995. HERG, a human inward rectifier in the voltage-gated potassium channel family. Science. 269:92–95. [DOI] [PubMed] [Google Scholar]
- Viloria, C.G., F. Barros, T. Giraldez, D. Gomez-Varela, and P. de la Pena. 2000. Differential effects of amino-terminal distal and proximal domains in the regulation of human erg K(+) channel gating. Biophys. J. 79:231–246. [DOI] [PMC free article] [PubMed] [Google Scholar]
- Wynia, S., A. Gillian-Daniel, and G.A. Robertson. 2007. Biophysical Characterization of the hERG Activation Gate Region. Biophysical Society Annual Meeting. Baltimore, MD.
- Yifrach, O., and R. MacKinnon. 2002. Energetics of pore opening in a voltage-gated K(+) channel. Cell. 111:231–239. [DOI] [PubMed] [Google Scholar]
- Zamyatnin, A.A. 1972. Protein volume in solution. Prog. Biophys. Mol. Biol. 24:107–123. [DOI] [PubMed] [Google Scholar]
- Zhou, Z., Q. Gong, B. Ye, Z. Fan, J.C. Makielski, G.A. Robertson, and C.T. January. 1998. Properties of HERG channels stably expressed in HEK 293 cells studied at physiological temperature. Biophys. J. 74:230–241. [DOI] [PMC free article] [PubMed] [Google Scholar]
Associated Data
This section collects any data citations, data availability statements, or supplementary materials included in this article.